Medicaid Eligibility Levels for Older Adults and People with Disabilities (Non-MAGI) in 2026

Authors: Alice Burns, Abby Sachar, and Molly O’Malley Watts
Published: Apr 30, 2026

Introduction

In 2026, states will begin implementing provisions from the 2025 reconciliation law that made historic reductions in federal Medicaid funding. Medicaid changes are expected to increase the number of people without health insurance by 7.5 million in 2034. While not a direct focus of many changes in the new law, changes in the law could have implications for older adults and people with disabilities who comprise 1 in 5 Medicaid enrollees but over half of Medicaid spending on account of higher per-person costs. Within this group, there are multiple eligibility pathways, most of which are optional for states to cover, and all of which have more complex eligibility requirements than coverage for other enrollees. (Other enrollees such as children, pregnant women, and people covered under the Affordable Care Act are eligible based on Modified Adjusted Gross Income (MAGI). Eligibility based on being ages 65 and older or having a disability is sometimes referred to as “non-MAGI” eligibility.) Changes in the law may pressure states to restrict optional Medicaid eligibility or benefits or reduce provider payment rates.

KFF’s Survey of Medicaid Financial Eligibility for Older Adults & People with Disabilities conducted in March 2026 by KFF and Watts Health Policy Consulting, provides a baseline of Medicaid eligibility ahead of potential changes to the Medicaid program stemming from the 2025 reconciliation law. Overall, 50 states including the District of Columbia (hereafter referred to as a state) responded to the survey, though response rates to specific questions varied. Florida was the only state that did not respond. Responses were supplemented with publicly available data and information from KFF’s past surveys when available, and state-level data are included in the Appendix Tables. Key takeaways include:

  • States are generally required to provide Medicaid to people who receive Supplemental Security Income (SSI) and Medicare beneficiaries with limited income and savings. Eighteen states have increased the income or savings limits for Medicare beneficiaries beyond the federal minimums.
  • Any optional pathway: All states also offer coverage through one or more optional eligibility pathways to people who have disabilities or are ages 65 and older who have limited financial resources.
  • Optional income-related pathway: All states except Alabama extend eligibility to low-income adults with disabilities or people ages 65 and older who have income above the SSI limits (Figure 1) (Appendix Table 1).
    • The most common income-based optional eligibility group is the Medicaid Buy-In for adults with disabilities who want to work, which is offered by 47 states.
  • Optional LTC-related pathway: All states except for Montana offer optional coverage to people who use long-term care, people who tend to have much higher average spending than other Medicaid enrollees. New Hampshire added a new eligibility pathway for people using home care in the last year.
    • Between 2025 and 2026, there were few changes in states’ eligibility requirements for people who use long-term care, although 13 states increased the personal needs allowance for people using institutional care in 2025, with Washington reporting the largest increase (from $42 to $109).
All States Have Optional Pathways for Medicaid Eligibility as of March 2026 (Bar Chart)

What are the two required eligibility pathways for older adults and people with disabilities?

States are only required to cover two eligibility groups for older adults and people with disabilities in Medicaid, both of which require people to demonstrate having limited income and savings. Federal statutes generally require states to enroll people who receive Supplemental Security Income (SSI) in Medicaid and to enroll eligible Medicare beneficiaries in the Medicare Savings Programs:

  • SSI is a disability program that provides monthly income to people who are unable to work on account of a disability and who have limited income ($994 per month in 2026 for an individual) and financial resources below federal limits ($2,000 for an individual).
  • The Medicare Savings Programs provide Medicaid coverage of Medicare premiums and in most cases, cost sharing to Medicare beneficiaries who have limited income ($1,816 per month in 2026 for an individual) and financial resources below federal limits ($9,950 for an individual in 2026). People who are eligible for the Medicare Savings Programs, but not full Medicaid, receive help only with Medicare costs, and not full Medicaid benefits.

States may choose to expand eligibility for the Medicare Savings Programs beyond federally-required minimum levels. As was the case in 2025, 33 states use federal eligibility criteria for the Medicare Savings Programs, and the remaining 18 states expanded eligibility beyond those limits (Appendix Table 2).

In 2021, California passed legislation to increase and then eliminate entirely all asset tests for its Medicaid program, including the Medicare Savings Programs, starting January 2024. However, to address a state budget deficit, California reinstated an asset test for all non-MAGI enrollees starting January 1, 2026. The asset limits are $130,000 for an individual and $195,000 for a couple (or $65,000 for each additional family member, up to a maximum of ten people), well above the federally required minimum levels.

Which states offer optional Medicaid eligibility for low-income older adults and people with disabilities?

All states except for Alabama offer optional Medicaid eligibility for low-income older adults and people with disabilities. There are four types of optional Medicaid eligibility pathways based on income for people with disabilities which include:

  • Medicaid buy-in programs for working adults are available in 47 states in 2026, allowing working people with disabilities to “buy into” Medicaid by paying a premium when their earned income exceeds eligibility limits but falls below a percentage of the federal poverty level (FPL).
    • In 2026, the median income limit was 250% of FPL ($3,325 per month in 2026) and median asset limit was $10,000 for an individual and $15,000 for a couple (Appendix Table 3).
    • Although the median asset limits didn’t change much between 2025 and 2026, several states reported significant increases in their asset limits. Asset limits for individuals increased from $10,000 to $20,000 in Connecticut, from $10,000 to $25,000 in Louisiana, and from $13,000 to $24,000 for couples in Iowa.
    • Almost two-thirds of states (30) have an age limit for these buy-in programs, typically ages 16-64.
    • Most states (33 of 46 responding) reported premiums for buy-in enrollees. Premiums vary with family income and the median premium started at $25 per month for families with an income of 150% FPL.
  • Medically needy coverage is available in 34 states in 2026, allowing people to qualify for Medicaid if their income or assets are higher than permitted under another pathway but below the medically needy limit after accounting for their health care expenses.
    • Most income limits are low—usually below 50% of FPL and many states limit enrollees’ assets to $2,000 (Appendix Table 4).
    • Unlike income limits for other eligibility pathways, medically needy limits are generally established as a dollar amount. The median income limit increased from $511 in 2025 to $563 in 2026. In a departure from that norm, Kansas updated its medically needy income limit to align with SSI ($994 per month in 2026), which means that income limit will update annually moving forward.
  • Poverty level coverage is available in 28 states, allowing low-income older adults and people with disabilities to qualify for Medicaid when their income exceeds the SSI limits. States with this type of coverage generally establish income eligibility as a percentage of the SSI benefit rate or federal poverty level ($1,330 per month for an individual in 2026). Among the states that have expanded eligibility above SSI levels:
    • 8 states have eligibility above SSI but below FPL,
    • 18 states have eligibility at FPL, and
    • 2 states have eligibility above FPL (Appendix Table 5).
  • Coverage through the Family Opportunity Act, available in 9 states, allows families with incomes up to 300% of FPL to purchase Medicaid for their children under age 19 (Appendix Table 3). Parents who are eligible for coverage through an employer are required to pay premiums for private coverage too as a condition of Medicaid eligibility. In such cases, Medicaid covers the services children with disabilities need which are often not covered by private coverage.
    • In 2026, the median income limit was about 272% of FPL ($3,619 per month) and 7 states had no limit on assets.
    • Family Opportunity Act coverage is another type of “buy in,” with 5 states charging premiums in 2026. Premiums vary with family income and the median premium started at $20 per month for families with an income of 151% FPL.

Although the optional income-based eligibility pathways are not tied to SSI receipt, all states report using the Social Security Administration (SSA) definition of disability to determine eligibility. The SSA defines disability for adults as the inability to engage in any “substantial gainful activity” because of one or more medically determinable physical or mental disabilities that are either expected to result in death or have lasted or are expected to last for a continuous period of at least 12 months. Substantial gainful activity describes a level of work that involves doing significant physical or mental activities or a combination of both. Because disability is defined as an inability to work, few people who qualify for Medicaid through disability-related pathways are able to maintain employment. This is a key reason for low employment in the Medicaid Buy-In programs despite widespread state adoption. For children to qualify as disabled, they must be under 18 and have one or more physical or mental impairments which result in marked and severe functional limitations and the impairment must have lasted or be expected to last for at least 12 months or be expected to result in death.

The challenges associated with meeting the SSA definition of disability are one reason why many people with disabilities may qualify for Medicaid through MAGI eligibility groups. SSA disability determinations may take months, if not years, which is one reason that most Medicaid enrollees with disabilities qualify for Medicaid through a pathway that is not linked to receiving SSI.

Which states offer optional Medicaid eligibility for people who use long-term care?

All states except for Montana offer optional Medicaid eligibility for people who use long-term care. Recognizing the high costs of long-term care, eligibility for people who use long-term care is almost always 300% of the SSI limit ($2,982 per month per individual in 2026), and most states limit enrollees’ assets to $2,000 per person (Appendix Table 6). The pathways include:

  • Katie Beckett coverage is available in 43 states, allowing children under 20 with significant disabilities who require an institutional level of care to receive Medicaid while living at home. Only the child’s income and assets are considered for eligibility purposes, which allows some children of higher-income families to qualify. Like Family Opportunity Act coverage, children with Katie Beckett coverage may also have private health insurance, and 5 states charge families premiums for Medicaid.
  • The special income rule allows states to extend Medicaid eligibility to people who require an institutional level of care and live in institutions or in home and community settings.  Both pathways are available in 41 states, and an additional state, Massachusetts, offers coverage only for people using home care.
    • States define an institutional level of care differently from one another, and in some cases, use different definitions for institutional settings and home and community settings. Most states that responded to both questions referenced institutional levels of need for recipients of home and community care even if they did not use an identical definition for both programs.  

Most Medicaid enrollees who qualify because of long-term care are subject to limits on their home equity and must contribute to the cost of their care each month. In 2026, federal rules specified that limits on home equity must be between $752,000 and $1,130,000, and most states set the 2026 limit at $752,000 (Appendix Table 7). In all states, there are circumstances in which the home is exempt from limits, and other circumstances in which the home is counted as an asset when determining eligibility. California is the only state that does not have a home equity limit. The 2025 reconciliation law reduced the maximum home equity limit to $1 million regardless of inflation starting January 1, 2028. At that time, home equity limits will decrease in the 11 states that currently use the federal maximum and be reinstated in California. Once eligible for Medicaid, enrollees who use long-term care must generally contribute nearly all monthly income to the cost of their care except for a small “personal needs allowance.” In 2026, the median personal needs allowance is $70 for institutional care and $2,982 for home care. Those limits were similar to the limits in 2025, although 13 states increased the personal needs allowance for institutional care in 2026, with Washington reporting the largest increase (from $42 to $109).

How have states simplified application and renewal processes for non-MAGI enrollees?

One source of the 2025 reconciliation law’s Medicaid cuts is a 10-year moratorium on implementation or enforcement of certain provisions in two rules finalized by the Biden administration that would have reduced administrative burdens to make it easier for people to enroll in and maintain Medicaid and CHIP coverage. Many of those changes were intended to streamline Medicaid eligibility and renewal processes for non-MAGI enrollees. Some of the provisions in the rules were excluded from the delay, including those that have already taken effect. While the law prohibits the Secretary of the Department of Health and Human Services (HHS) from implementing or enforcing provisions subject to the delay until October 1, 2034, it does not prohibit states from implementing the changes. In some cases, states have already made the changes required by the rules, either in anticipation of implementation of the new requirements or as part of other efforts to streamline or simplify processes. It is unknown whether states will maintain the changes now that federal requirements have been delayed or whether additional states will adopt similar changes before the requirements take effect.

The law pauses implementation of provisions that align application and renewal policies for individuals eligible through MAGI and non-MAGI pathways. The Affordable Care Act (ACA) created consistent, streamlined application and renewal policies for individuals who qualify for Medicaid based on modified adjusted gross income (MAGI), but those policies were not extended to people eligible for Medicaid through non-MAGI pathways. Provisions of the delayed rule would require states to extend some of the streamlined MAGI procedures to non-MAGI processes. These include eliminating in-person interviews as part of eligibility determinations, requiring states to renew coverage no more frequently than every 12 months, requiring that non-MAGI applications and forms be accepted through the same modalities as MAGI applications and forms, and requiring states to send pre-populated renewal forms to non-MAGI enrollees whose ongoing eligibility cannot be confirmed through available data sources.

Many of the application renewal policies for non-MAGI eligibility pathways have already been implemented by nearly all states despite the pause in the federal rule (Figure 2). All responding states align at least some renewal policies for non-MAGI populations with those for most MAGI populations (Appendix Table 8). The most widely adopted changes include renewing eligibility only once every 12 months (all responding states), no longer requiring in-person interviews (all responding states), and providing enrollees with at least 30 days to sign and return required paperwork for renewals (all responding states except for Minnesota). The least widely adopted changes include providing a reconsideration period of at least 90 days after a procedural disenrollment (all responding states except for Alaska, New Mexico, and Washington) and using pre-populated renewal forms (37 states).

Most States Have Aligned Non-MAGI Renewal Policies with MAGI Renewal Policies as of March 2026 (Stacked Bars)

The law delays several provisions that facilitate enrollment in the Medicare Savings Programs, but those changes have already been implemented by over half of states (Figure 3). Specifically, the delayed rule aimed to facilitate enrollment into the Medicare Savings Programs using information from the Medicare Part D Low-Income Subsidy (LIS) data and encourage states to use the Medicare Part D LIS definitions of financial eligibility. The Medicare Part D Low-Income Subsidy (LIS) is a program that helps Medicare beneficiaries pay for prescription drugs. A larger number of Medicare beneficiaries are enrolled in the Medicare Part D LIS than in the Medicare Savings Programs. Fewer states responded to these survey questions than is the case for other survey questions, and several states reported that they did not know the answer to questions about aligning definitions of financial resources. Even so, most responding states reported using the LIS data to enroll people into the Medicare Savings Programs without a separate application, and over half of states reported using the same definitions of specific types of financial resources (Appendix Table 9). The District of Columbia noted it was in the process of implementing LIS data to initiate Medicare Savings Program applications, but the 2025 budget reconciliation law halted those efforts.

Over Half of Responding States Reported Some Alignment between Applications for the Medicare Savings Programs (MSP) and for Medicare’s Part D Low-Income Subsidy Program (LIS) as of March 2026 (Stacked Bars)

This work was supported in part by Arnold Ventures. KFF maintains full editorial control over all of its policy analysis, polling, and journalism activities.

Appendix

Table 1: Adoption of Key Eligibility Pathways  

State Adoption of Key Medicaid Eligibility Pathways Based on Old Age or Disability as of March 2026 (Table)

Table 2: Medicare Savings Programs

Eligibility for Medicare Savings Programs as of March 2026 (Table)

Table 3: Medicaid Buy-In and Family Opportunity Act

Medicaid Eligibility for Buy-In Programs for Working People with Disabilities and the Family Opportunity Act as of March 2026 (Table)

Table 4: Medically Needy Coverage

Medicaid Eligibility for Medically Needy Populations as of March 2026 (Table)

Table 5: SSI and Poverty-Level Coverage

Medicaid Eligibility for SSI Enrollees and Optional Older Adults & People with Disabilities Up To 100% FPL as of March 2026 (Table)

Table 6: Special Income Rule and Katie Beckett

Medicaid Eligibility for Katie Beckett Children with Significant Disabilities and Special Income Rule as of March 2026 (Table)

Table 7: Home Equity and Personal Needs Allowances

State Home Equity Disregards for LTC Eligibility and Personal Needs Allowances as of March 2026 (Table)

Table 8: Alignment with MAGI Renewal Policies

Adoption of Procedures to Align Renewal Policies for Most Non-MAGI Populations with Renewal Policies for MAGI Populations as of March 2026 (Table)

Table 9: Alignment of MSP Applications to Medicare Part D

Alignment Between Applications for Medicare Savings Programs (MSP) and Applications for Medicare’s Part D Low-Income Subsidy Program (LIS) as of March 2026 (Table)

A Closer Look at Rural Nursing Homes

Published: Apr 29, 2026

As of July 2025, about 1.2 million people live in nursing facilities (referred to as nursing homes) and about one in five are in a nursing home in a rural area. This is similar to the share of the total U.S. population that lives in rural areas (20%) and slightly lower than the share of all adults 65 or older living in rural areas (24%). Nursing homes provide medical and personal care services for older adults and younger people with disabilities.Rural populations are older than urban populations and rural residents have a higher level of disability than their urban counterparts. The older demographic and higher rates of disability among rural populations contribute to a greater need for nursing homes and other long-term care services in rural communities. 

Medicaid is the primary payer for nursing home care in the US. The 2025 reconciliation law, signed into law on July 4th, 2025, is projected to reduce federal Medicaid spending by $911 billion over ten years, according to the Congressional Budget Office, resulting in an estimated reduction of $137 billion in federal Medicaid spending in rural areas, according to KFF analysis. The law also includes $50 billion in funding for a new “rural health transformation program”, though these funds are unlikely to offset the Medicaid cuts to rural areas and few states have included proposals for nursing homes in rural areas in their applications. The reconciliation law also delayed implementation of a Biden-era rule intended to help address long-standing concerns about staffing shortages and the quality of care in nursing homes until 2034. A Texas judge overturned key requirements from the rule in April 2025; and the Trump Administration rescinded the rule in December 2025. Some of the changes to Medicaid financing could also have implications for nursing homes.

This analysis compares the characteristics of nursing homes in rural areas with those in urban areas. This brief uses data from Nursing Home Compare, a publicly available dataset that provides a snapshot of information on quality of care in each nursing home. This analysis categorizes nursing homes as remote rural, rural adjacent to metro areas (or “other rural”), and urban based on 2024 Urban Influence Codes from the USDA. See methods for more information on how rural categories were calculated. State-level data are also available on State Health Facts, KFF’s data repository with downloadable health indicators. Key takeaways from the analysis include:

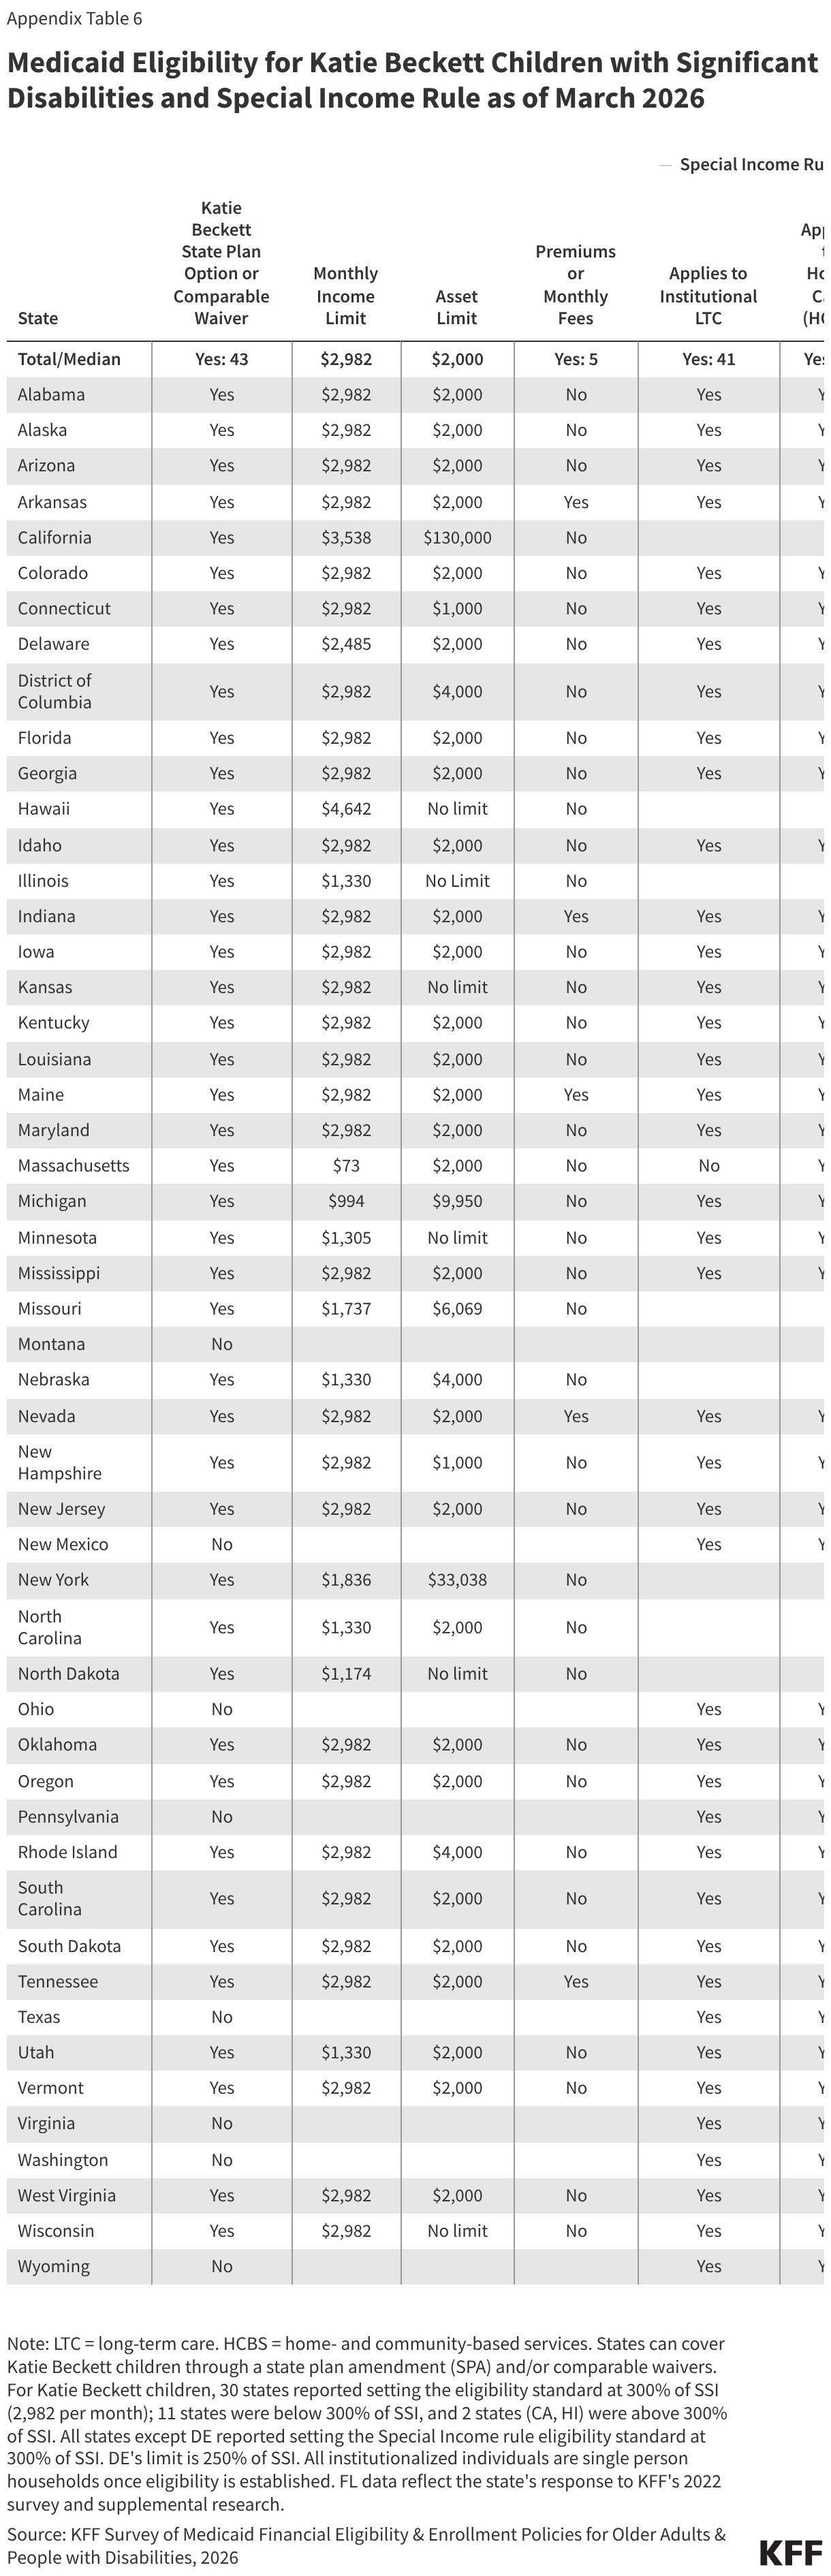
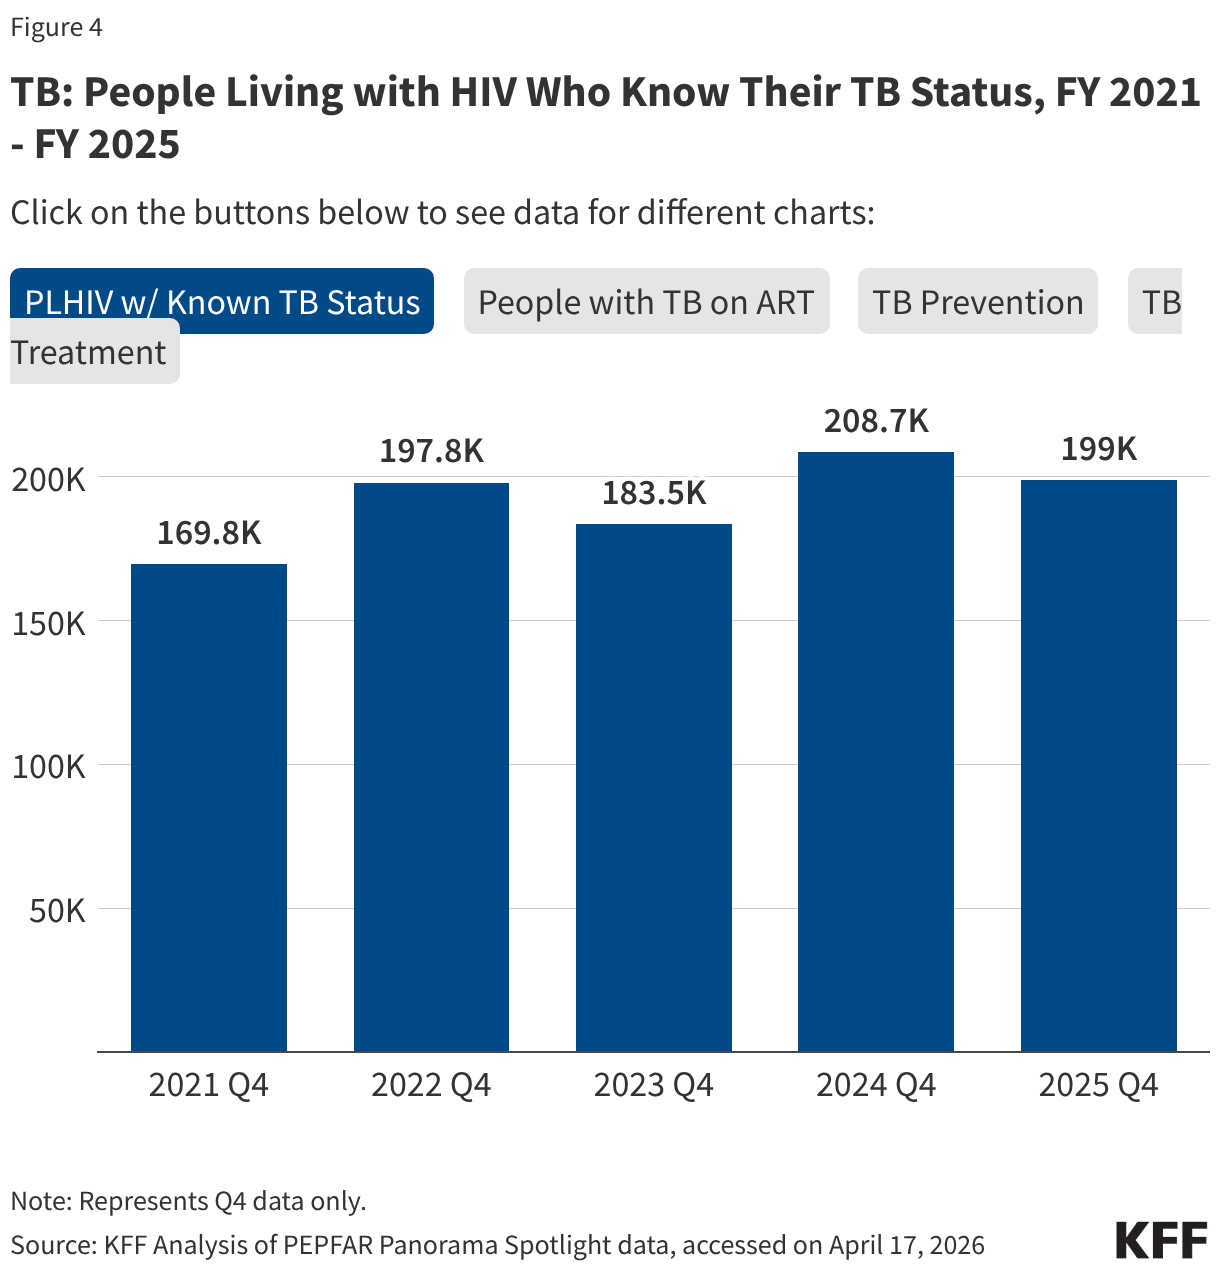
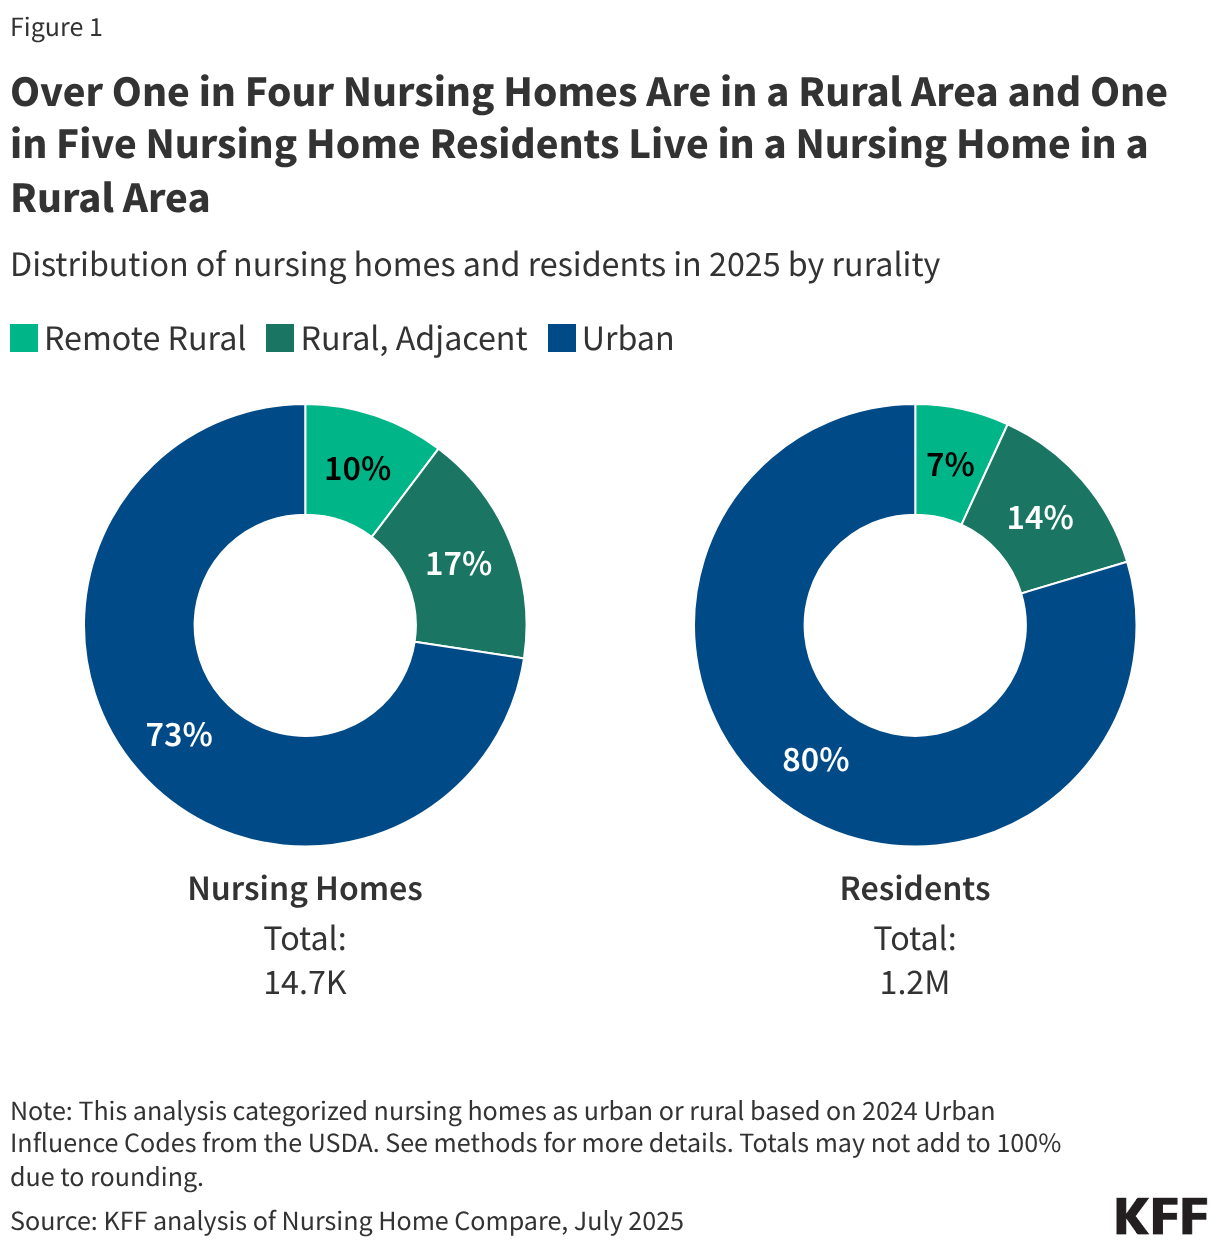
  • Over one in four (27%) Medicaid and/or Medicare certified nursing facilities (referred to as nursing homes) are in a rural area and one in five (20%) residents live in a nursing home in a rural area (Figure 1). To be certified to serve Medicare or Medicaid patients, nursing homes are inspected regularly by state survey agencies in accordance with the Centers for Medicare & Medicaid Services (CMS) guidance.
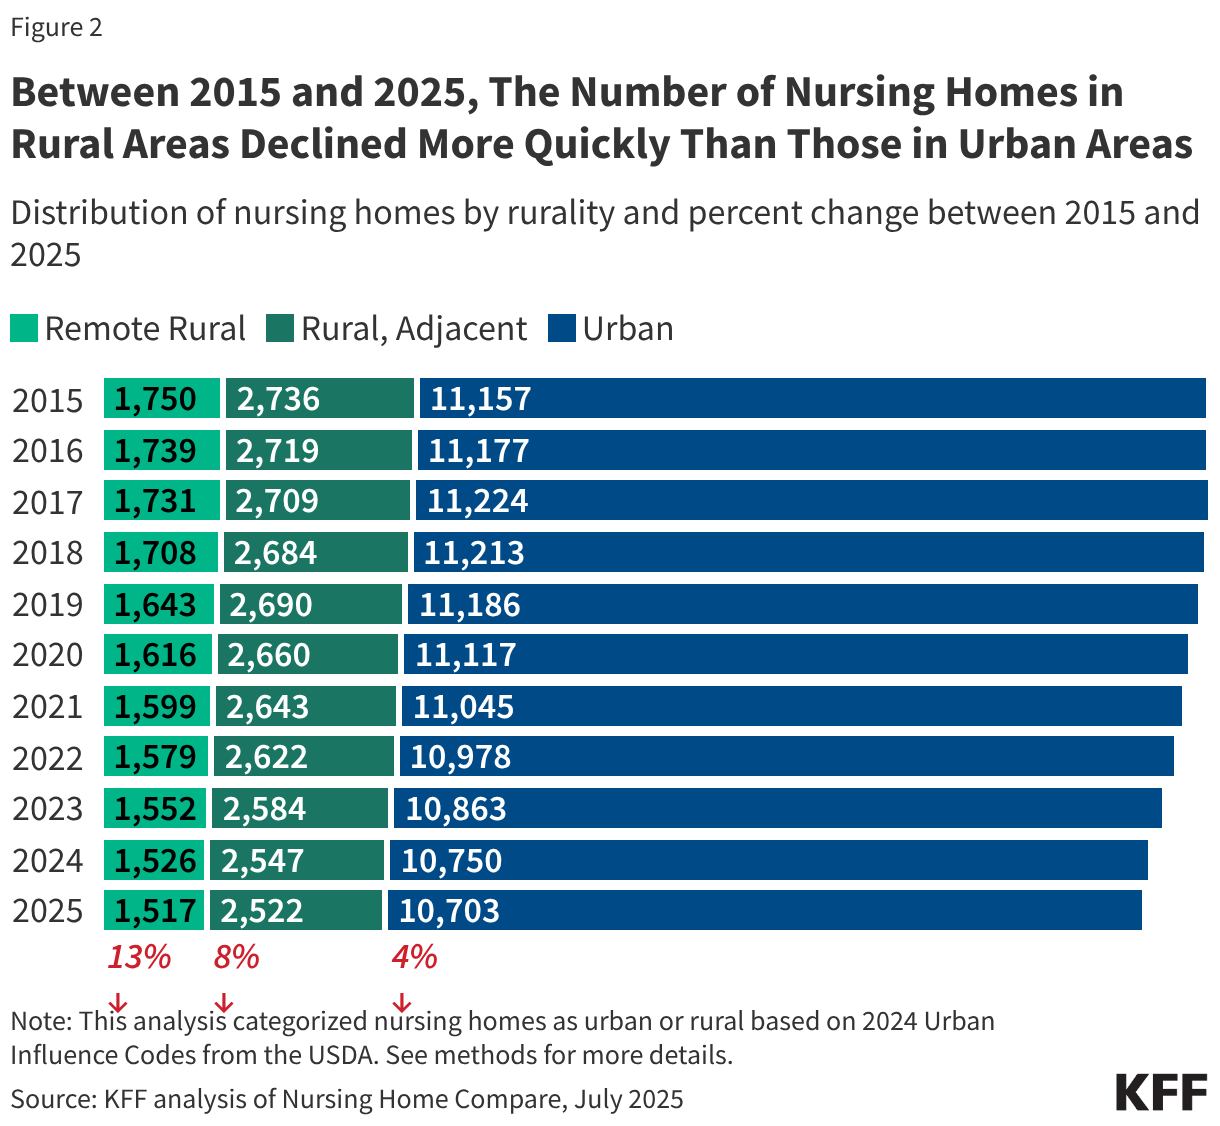
  • Between 2015 and 2025, the number of nursing homes in rural areas decreased faster than nursing homes in urban areas (Figure 2).
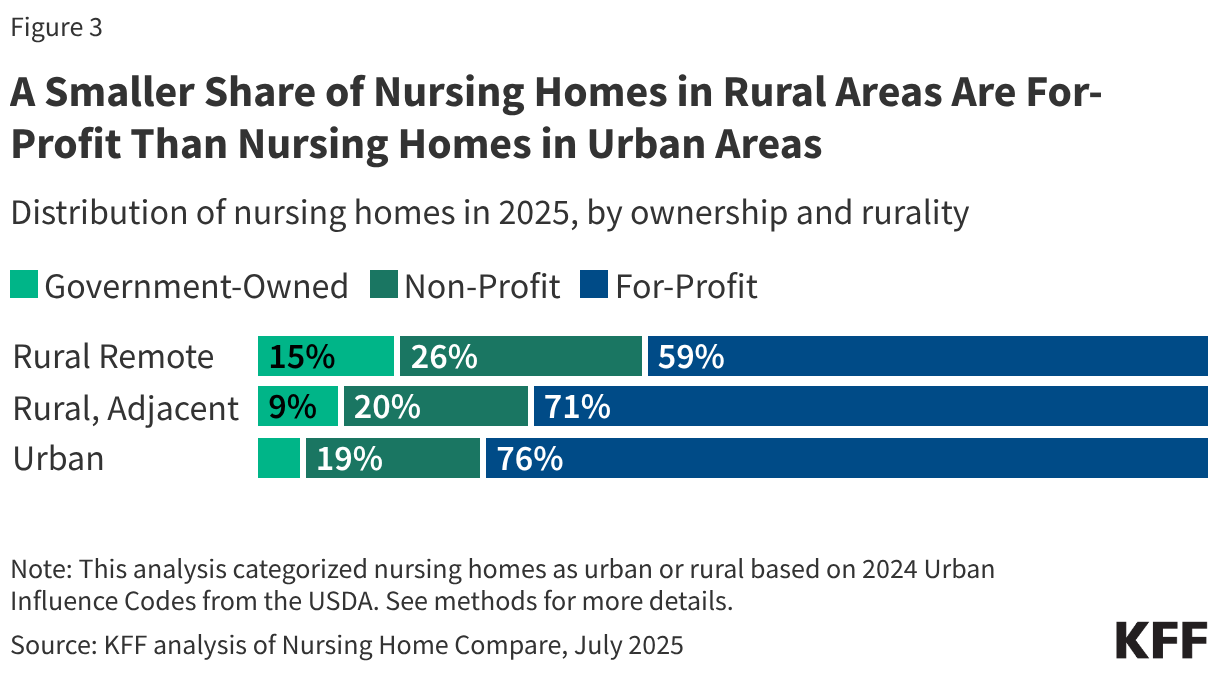
  • A smaller share of nursing homes in rural areas are for-profit when compared to nursing homes in urban areas (Figure 3).
  • Nursing homes in rural areas and nursing homes in urban areas have similar staffing levels and similar rates of deficiencies that cause actual harm or immediate jeopardy to residents.

Over one in four nursing homes are in a rural area and one in five residents live in a nursing home in a rural area (Figure 1). There are about 4,000 nursing homes in rural areas that are home to over 250,000 nursing home residents. These nursing homes account for about 27% of all nursing homes, with 10% in remote rural areas and 17% in rural areas adjacent to urban areas (or “other rural”). While over one-quarter of nursing homes are in rural areas, a smaller share of residents (20%) lives in these nursing homes because the average nursing home in a rural area is smaller than the average nursing home in an urban area (85 beds vs. 115 beds, data not shown). About 7% of nursing home residents live in nursing homes in remote rural areas and the other 14% live in nursing homes in other rural areas (totals do not add to 20% due to rounding). In eight states, at least half of nursing home residents live in nursing homes in rural areas (VT, WY, SD, MS, MT, IA, NE, and ND).

Over One in Four Nursing Homes Are in a Rural Area and One in Five Nursing Home Residents Live in a Nursing Home in a Rural Area (Small multiple donut chart)

Between 2015 and 2025, the number of nursing homes in rural areas declined more quickly than those in urban areas (Figure 2). Between 2015 and 2025, the total number of nursing homes in the US dropped by 6%, from 15,643 to 14,742. Half of the decline occurred in rural areas (447 out of 901 nursing homes). The number of nursing homes in remote rural areas decreased the fastest (13% decline) when compared to nursing homes in other rural areas (8% decline) or urban areas (4% decline). These declines reflect the net number of nursing homes, which accounts for closures and openings.

During this time, the number of residents declined even more quickly. There was a 19% decline in nursing home residents living in remote rural areas; a 12% decline among those living in other rural areas; and an 8% decline among those living in urban areas. It is not clear what contributed to the decline in nursing homes and residents, but Medicaid as a whole has been providing home care to more people and spending on home care has increased more quickly than spending on institutional care.

Between 2015 and 2025, The Number of Nursing Homes in Rural Areas Declined More Quickly Than Those in Urban Areas (Stacked Bars)

A smaller share of nursing homes in rural areas are for-profit than nursing homes in urban areas (Figure 3). A smaller share of nursing homes in remote rural areas are for-profit (59%) than those in other rural areas (71%) or urban areas (76%). Additionally, a larger share of nursing homes in remote rural areas are non-profit (26%) than those in other rural areas (20%) or urban areas (19%). Similarly, a larger share of nursing homes in remote rural areas are government-owned (15%) than those in other rural areas (9%) or urban areas (5%).

A Smaller Share of Nursing Homes in Rural Areas Are For-Profit Than Nursing Homes in Urban Areas (Stacked Bars)

In many other ways, nursing homes in rural areas are similar to nursing homes in urban areas.

  • Nursing homes in rural areas and nursing homes in urban areas have relatively similar payer distributions. Nursing homes in rural areas report that 66% of residents have Medicaid as their primary payer and nursing homes in urban areas report that 63% of residents have Medicaid as their primary payer. Similarly, 10% of residents in nursing homes in rural areas have Medicare as their primary payer and 15% of those living in nursing homes in urban areas have Medicare as their primary payer. (Medicare does not generally cover long-term care services but does cover up to 100 days of skilled nursing facility care following a qualifying hospital stay.) Nursing homes in rural areas report that 24% of their residents have another primary payer (such as private insurance or out-of-pocket) and nursing homes in urban areas report that 23% of residents have another primary payer.
  • Similarly, nursing homes in rural areas and nursing homes in urban areas report similar shares of nursing homes with deficiencies that cause actual harm or immediate jeopardy to residents (27% vs. 29%).
  • Staffing levels in nursing homes in rural areas and nursing homes in urban areas are similar as well: 58% of nursing homes in rural areas and 64% of nursing homes in urban areas report an average of at least 3.5 total nursing hours per resident per day. This is consistent with prior research that found that similar shares of nursing homes in rural areas (20%) and nursing homes in urban areas (18%) would have met the requirements in the now-rescinded Biden-era staffing rule intended to help address long-standing concerns about staffing shortages and the quality of care in nursing homes.

Methods

Nursing Home Compare: Nursing Home Compare is a publicly available dataset that provides a snapshot of information on quality of care and key characteristics for approximately 14,900 Medicare and/or Medicaid-certified nursing homes.The data in this analysis is from July 2025.

Defining Rurality in Nursing Home Compare: Nursing homes in urban areas are defined as those in a metropolitan area, while nursing homes in rural areas are defined as those in nonmetropolitan areas. A metropolitan area is a county or group of counties that contains at least one urban area with a population of 50,000 or more people. Nonmetropolitan areas include micropolitan areas—which are counties or groups of counties that contain at least one urban area with a population of at least 10,000 but less than 50,000—and noncore areas (areas that are neither metropolitan nor micropolitan). This brief also breaks rural areas into those that are adjacent to metropolitan areas (defined as “other rural” in this brief) and those that are not adjacent to metropolitan counties (defined as “remote rural” areas in this brief).

This analysis categorized counties and county equivalents based on 2024 Urban Influence Codes from the USDA, as follows:

Urban

  • 1: Large metro (in a metro area with at least 1 million residents)
  • 4: Small metro (in a metro area with fewer than 1 million residents)

Rural, adjacent to a metro area (“other rural”)

  • 2: Micropolitan, adjacent to a large metro area
  • 3: Noncore, adjacent to a large metro area
  • 5: Micropolitan, adjacent to a small metro area
  • 6: Noncore, adjacent to a small metro area

Rural, not adjacent to a metro area (“rural remote”)

  • 7: Micropolitan, not adjacent to a metro area
  • 8: Noncore, not adjacent to a metro area and contains a town of at least 5,000 residents
  • 9: Noncore, not adjacent to a metro area and does not contain a town of at least 5,000 residents

Deficiencies in Nursing Homes: Health care deficiencies in nursing homes are evaluated on two elements:

  1. The scope of the deficiency (such as whether the deficiency was isolated to one person or was widespread across the nursing home)
  2. The severity of the deficiency (such as whether an individual suffered actual harm or immediate jeopardy)

Deficiencies are assigned a Scope/Severity score ranging from letters A through L, with each letter corresponding to a unique combination of scope and severity. This analysis looks at only at deficiencies that cause actual harm or immediate jeopardy, which corresponds with values G through L. The Centers for Medicare and Medicaid Services defines "actual harm" as a "deficiency that results in a negative outcome that has negatively affected the resident's ability to achieve the individual's highest functional status. "Immediate jeopardy" is defined as a deficiency that "has caused (or is likely to cause) serious injury, harm, impairment, or death to a resident receiving care in the nursing home." CMS’ definition of “serious” deficiencies varies slightly from the definition in this analysis. CMS excludes deficiencies with score “G” and includes deficiencies with score “F” for certain deficiencies that represent a “substandard quality of care.”

This work was supported in part by The John A. Hartford Foundation. KFF maintains full editorial control over all of its policy analysis, polling, and journalism activities.

News Release

Poll: The Cost of Health Care Remains at the Top of the Public’s List of Economic Concerns, Even as Concerns About Gas Prices Climb

Majorities Say Health Costs Will Influence Their Vote and Voters Favor Democrats on the Issue, with Republicans Holding an Advantage on Addressing Fraud and Abuse

Published: Apr 29, 2026

Health care costs continue to top the public’s list of economic anxieties, even as fuel prices and economic uncertainty rose following the start of the Iran war, a new KFF Health Tracking poll finds. Nearly two-thirds (64%) of U.S. adults are worried about being able to afford health care costs, including three in ten who say they are “very worried.” The same share (64%) are worried about gasoline or other transportation costs, up from about half (52%) in January.

Underscoring these concerns, nearly half of insured adults (46%) say that lowering out-of-pocket costs is their most-wanted change to their health insurance. Additionally, majorities of voters say health care costs will have a “major impact” on their decision to vote (55%) and which party’s candidate they support (61%).

While the poll finds that voters trust Democrats more than Republicans to address both health care costs (37% vs. 26%) and prescription drug costs (33% vs. 26%), voters are more likely to trust Republicans on the issue of fraud and waste in government health care programs (34% vs. 26%)—an issue on which the Trump administration has been particularly engaged.

Poll Finding

KFF Health Tracking Poll: Health Care Costs and the Midterms

Published: Apr 29, 2026

Findings

Key Takeaways

  • Health costs continue to top the public’s list of affordability worries, even as concerns about gas prices have risen in recent weeks. Nearly two-thirds (64%) of adults are worried about being able to afford health care costs, on par with the share who now worry about gas and transportation costs (64%) and outranking other economic concerns. In January 2026, prior to the start of the U.S. conflict with Iran, gasoline and transportation costs ranked at the bottom of household financial worries. Now, gas prices share the top spot with health care costs as the biggest financial worry adults face for themselves and their families.
  • Lowering out-of-pocket costs ranks as the most important change insured adults say they would like to see from their health insurance. When given a list of possible changes that could be made to their health insurance, half (46%) of insured adults choose lowering their out-of-pocket costs as most important, more than twice the share who cite eliminating prior authorization (22%). Fewer say other possible changes such as getting more value for what they spend (13%) and having more choice in providers (12%) would be most important to them.
  • Health costs also loom large in the upcoming midterm elections. About nine in ten voters say the issue will influence their decision to vote and who to vote for in the 2026 midterm elections, with majorities saying it will have a “major impact” on both areas (55% and 61%). While majorities of voters across partisans say health care costs will impact their vote in November, the issue is more salient among Democratic and independent voters. About seven in ten Democratic voters (72%) and nearly two-thirds of independent voters (63%) say health care costs will impact which party’s candidate they would support in the election, compared to about half of Republican voters (47%) who say the same.
  • While both political parties have made recent announcements about their own plans to bring down health costs, the latest polling shows the Democrats currently have the edge among voters. Voters give the Trump administration low approval ratings on its handling of the cost of health care and are more likely to trust the Democratic Party (37%) over the Republican Party (26%) on addressing this issue. Fewer than half of voters approve of the administration’s handling of cost of health care (33%) and the cost of prescription drugs (41%).
  • The Republican Party holds an advantage on addressing fraud and waste in government health care programs, which has been a key messaging strategy during the second Trump administration. One-third of voters say they trust Republicans on this issue compared to a quarter who say they trust Democrats. Notably, on most issues asked about, sizable shares of voters say they trust neither party.

Health Care Costs Are a Top Concern for the Public and Voters

Health care costs remain a primary economic concern for the public and voters’ top health concern heading into the 2026 midterm elections. The latest KFF Health Tracking Poll finds health care costs remain at the top of the list of what the public worries about being able to afford for themselves and their family, now tied with gasoline and transportation costs amid rising fuel prices. Nearly two-thirds of the public (64%) say they are at least somewhat worried about affording health care costs including the cost of health insurance and out-of-pocket costs such as for office visits and prescription drugs. This includes three in ten adults overall (30%) and voters (30%) who say they are “very worried” about paying for health care. A similar share of adults is “very worried” about affording gas and transportation costs (29%), up from about one in six (17%) in January. This comes as the national average for gasoline has risen to over $4 per gallon, up roughly 38% since the conflict with Iran began. About one in five adults say they are “very worried” about affording food and groceries (23%), rent or mortgage (21%) or monthly utilities (21%).

Stacked bar chart showing the public's levels of worry when it comes to affording living necessities. Shown among total adults.

Even among adults with health insurance coverage, lowering health care costs is a top concern. When asked about possible changes that could be made to their health insurance, about half of insured adults say “paying less out-of-pocket for health care” (46%) is most important, more than twice the share who choose “eliminating prior authorization” (22%), an area that previous KFF polls have identified as the most significant pain point for health care consumers aside from costs. Fewer insured adults say getting more value out of their care (13%) or having more choice of which health care providers they can see (12%) are the most important changes they’d like to see.

Bar chart showing the most important priority of insured adults when it comes to possible changes that could be made to their health insurance.

Voters’ Approval of the Trump Administration and Party Preference on Health Care Issues

With about six months to go before the midterm elections, most voters disapprove of how the Trump administration is handling issues related to health care costs. One-third of voters (33%) approve of the administration’s handling of the cost of health care while two-thirds (67%) say they disapprove – including 45% who say they “strongly disapprove.” Several months after the unveiling of TrumpRx, about four in ten voters (41%) approve of the administration’s handling of prescription drug costs. Following a recent announcement by the Trump administration of increased efforts to crack down on health care fraud, about four in ten voters (42%) say they approve of the way the administration is handling fraud and waste in government health programs, while a majority (58%) say they disapprove.

Stacked bar chart showing scale of approval of the way the Trump administration is handling areas of health and health policy. Results shown among total registered voters.

Unsurprisingly, voters are split along partisan lines with the Trump administration receiving high approval ratings from Republicans overall, and most Democrats disapproving of the administration. Among independent voters, about a third say they approve of the Trump administration’s handling of fraud and waste in government health programs (33%) and its handling of the cost of prescription drugs (32%). Fewer independents (25%) say they approve of the administration’s handling of the cost of health care.

Notably, while two-thirds of Republican voters approve of the administration’s handling of health care costs (67%), there is some nuance within the Republican coalition. Among the two-thirds of Republicans and Republican-leaning voters who identify as MAGA supporters, about eight in ten (79%) approve of the administration’s handling of health care costs. However, Republican voters who do not support the MAGA movement are less approving of the administration with just over one-third (36%) of non-MAGA Republicans approving of the administration’s actions on health costs while 64% disapprove. Additionally, non-MAGA Republicans and Republican-leaning independents are much less likely than their MAGA counterparts to say they approve of the Trump administration's handling of the cost of prescription drugs (53% vs. 90%) and their handling of fraud and waste in government health programs (58% vs. 93%).

Split bar chart showing share of adults who say they approve of the way the Trump administration is handling areas of health and health policy. Results shown by party identification and by voters who support the Make America Healthy Again (MAHA) movement.

As voters evaluate congressional candidates ahead of the midterm elections, the Democratic Party has an edge over the Republican Party when it comes to addressing the cost of health care, while the Republican Party has the edge on addressing fraud and waste in government health care programs. Democrats have a double-digit advantage over Republicans when it comes to who voters trust to address the cost of health care (37% vs. 26%) and continue to hold a narrow edge among voters when it comes to addressing the cost of prescription drugs (33% vs. 26%).

Voters are more likely to trust the Republican Party (34%) than the Democratic Party (26%) when it comes to addressing fraud and waste in government health care programs, an area the Trump administration has focused heavily on recently. About one-third (33%) say they trust neither party to handle this issue.

Stacked bar chart showing which political party, the Democrats or the Republicans, the public trusts to do a better job in areas of health and health policy. Results shown among total registered voters.

Among independent voters, the Democratic Party has a double-digit advantage over the Republican Party when it comes to addressing the cost of health care (29% vs. 16%), while the Republican Party holds the advantage when it comes to addressing fraud and waste in government health care programs (25% vs. 13%). Yet notably, at least half of independent voters say they trust neither party to address each of these issues.

Stacked bar chart showing which political party, the Democrats or the Republicans, the public trusts to do a better job in areas of health and health policy. Results shown among total independent registered voters.

In addition to ranking as a top economic concern for the public, majorities of voters say health care costs will have a “major impact” on their decision to vote (55%) and which party’s candidate they would support (61%) in the upcoming midterms. The issue of health costs is more salient for Democratic voters compared to Republicans. More than six in ten Democratic voters say the cost of health care will have a major impact on their decision to vote (64%) and which party’s candidate they support (72%). About half of Republican voters say the issue of health costs will majorly impact whether they vote (48%) and what candidate they will support (47%). About half of independent voters say the cost of health care will majorly impact their decision to vote (52%) and six in ten say this issue will majorly impact the party’s candidate they support (63%).

Stacked bar chart showing the shares of adults who say the cost of health care will have a major impact, minor impact, or no impact at all on their decision to vote or which party's candidate they would support in the 2026 midterm elections. Shown among total voters and by party identification.

Methodology

This KFF Health Tracking Poll was designed and analyzed by public opinion researchers at KFF. The survey was conducted April 14 – April 19, 2026, online and by telephone among a nationally representative sample of 1,343 U.S. adults in English (n=1,251) and in Spanish (n=92). The sample includes 1,023 adults (n=81 in Spanish) reached through the SSRS Opinion Panel either online (n=999) or over the phone (n=24). The SSRS Opinion Panel is a nationally representative probability-based panel where panel members are recruited randomly in one of two ways: (a) Through invitations mailed to respondents randomly sampled from an Address-Based Sample (ABS) provided by Marketing Systems Groups (MSG) through the U.S. Postal Service’s Computerized Delivery Sequence (CDS); (b) from a dual-frame random digit dial (RDD) sample provided by MSG. For the online panel component, invitations were sent to panel members by email followed by up to three reminder emails.

Another 320 (n=11 in Spanish) adults were reached through random digit dial telephone sample of prepaid cell phone numbers obtained through MSG. Phone numbers used for the prepaid cell phone component were randomly generated from a cell phone sampling frame with disproportionate stratification aimed at reaching Hispanic and non-Hispanic Black respondents. Stratification was based on incidence of the race/ethnicity groups within each frame. Among this prepaid cell phone component, 140 were interviewed by phone and 180 were invited to the web survey via short message service (SMS).

Respondents in the prepaid cell phone sample who were interviewed by phone received a $15 incentive via a check received by mail or an electronic gift card incentive. Respondents in the prepaid cell phone sample reached via SMS received a $10 electronic gift card incentive. SSRS Opinion Panel respondents received a $5 electronic gift card incentive (some harder-to-reach groups received a $10 electronic gift card). In order to ensure data quality, cases were removed if they failed two or more quality checks: (1) attention check questions in the online version of the questionnaire, (2) had over 30% item non-response, or (3) had a length less than one quarter of the mean length by mode. Based on this criterion, no cases were removed.

The combined cell phone and panel samples were weighted to match the sample’s demographics to the national U.S. adult population using data from the Census Bureau’s 2024 Current Population Survey (CPS), September 2023 Volunteering and Civic Life Supplement data from the CPS, and the 2025 KFF Benchmarking Survey with ABS and prepaid cell phone samples. The demographic variables included in weighting for the general population sample are gender, age, education, race/ethnicity, region, civic engagement, frequency of internet use and political party identification. The weights account for differences in the probability of selection for each sample type (prepaid cell phone and panel). This includes adjustment for the sample design and geographic stratification of the cell phone sample, within household probability of selection, and the design of the panel-recruitment procedure.

The margin of sampling error including the design effect for the full sample is plus or minus 3 percentage points. Numbers of respondents and margins of sampling error for key subgroups are shown in the table below. For results based on other subgroups, the margin of sampling error may be higher. Sample sizes and margins of sampling error for other subgroups are available on request. Sampling error is only one of many potential sources of error and there may be other unmeasured error in this or any other public opinion poll. KFF public opinion and survey research is a charter member of the Transparency Initiative of the American Association for Public Opinion Research.

GroupN (unweighted)M.O.S.E.
Total1,343± 3 percentage points
   
Registered voters1,107± 4 percentage points
   
Party ID  
Democrats420± 6 percentage points
Independents450± 6 percentage points
Republicans372± 6 percentage points


House Appropriations Committee Releases FY 2027 National Security, Department of State and Related Programs (NSRP) Appropriations Bill

Published: Apr 28, 2026

Note: This resource was originally published on April 27, 2026 and has been updated to reflect additional information.

The House Appropriations Committee released its Fiscal Year 2027 appropriations bill on April 22, 2026 and accompanying report on April 27, 2026. The bill and report include discretionary funding for U.S. global health programs at the State Department as follows:

  • Global Health Programs (GHP) account: The main account that supports global health programs totals $8.9 billion in the bill, $532 million below the FY 2026 amount ($9.4 billion) and $3.8 billion above the President’s FY 2027 budget request ($5.1 billion). The bill provides two envelopes of funding: 1) President’s Emergency Plan for AIDS Relief (PEPFAR) and Global Fund to Fight AIDS, Tuberculosis and Malaria (Global Fund), which includes funding historically provided to the State Department, and 2) other global health activities, which includes funding historically provided to USAID.
    • PEPFAR/Global Fund: The bill provides $5.53 billion to PEPFAR, which includes:
      • Bilateral HIV: The bill provides $4.28 billion for bilateral HIV programs, $350 million (-8%) below the FY 2026 enacted level ($4.63 billion).1 Bilateral HIV is the only area that decreased among those where specific amounts are provided compared to the FY 2026 enacted level (the FY 2027 President’s budget request did not provide a specific amount to bilateral HIV or other program areas, as it proposed to “eliminate disease-specific accounts.” See the KFF summary of the FY 2027 President’s budget request here).
      • Global Fund: The bill specifies that the U.S. contribution for the Global Fund “shall be” $1.25 billion, flat compared to the FY 2026 enacted level (the FY 2027 request did not specify an amount for the Global Fund).
    • Other global health activities: The bill also provides $3.35 billion for other global health activities, including HIV, TB, malaria, MCH, polio, nutrition, family planning and reproductive health (FP/RH), NTDs, and global health security through the GHP account (see the table for details). The explanatory report accompanying the bill provides specific funding amounts to all program areas except for FP/RH (see below) and global health security. After accounting for the amounts specified in the report, $957.6 million in unspecified funding remains. It is possible that this amount could be provided to FP/RH, global health security, or other activities.
      • Family Planning and Reproductive Health (FP/RH): The bill states that “not more than” $461 million “may be made available” for FP/RH. If the full $461 million is provided for FP/RH, this would represent a $114 million (-20%) decline compared to the FY 2026 enacted level of “not less than” $575 million from all bilateral accounts (the FY 2027 request eliminated funding for FP/RH).
      • Global Health Security (GHS): The bill and report did not provide a specific amount for GHS programs. It is possible that some or all of the remaining $957.6 million in unspecified GHP account funding may be provided for GHS activities. In FY 2026, $615.6 million was provided for GHS (the FY 2027 request did not provide a specific amount for GHS).
      • All other program areas: Funding for all other specified global health program areas is flat compared to the FY 2026 enacted amount (the FY 2027 request did not provide specific amounts to these program areas).
  • Eliminated funding: The bill eliminates funding for the United Nations Population Fund (UNFPA),World Health Organization (WHO), and Pan American Health Organization (PAHO) (see the KFF UNFPA Funding and Kemp-Kasten explainer here and the KFF WHO fact sheet here).
  • Policy Provisions:
    • Period of availability: All funding under the GHP account is for 3 years (until September 30, 2029), with the exception of Gavi, which is for 1 year (until September 30, 3027). Historically, funding has been available for 5 years for PEPFAR and the Global Fund funding provided to State and for 2 years for other funding.
    • Promoting Human Flourishing in Foreign Assistance (PHFFA): The bill codifies all three rules of the PHFFA policy (see the KFF Mexico City Policy explainer here).

See other budget summaries and the KFF budget tracker for details on historical annual appropriations for global health programs.

KFF Analysis of Global Health Funding in the FY 2027 House NSRP Appropriations Bill & Explanatory Statement (Table)

  1. Almost all of the decrease is from the amount ($330 million) that used to be appropriated to the U.S. Agency for International Development (USAID). ↩︎

The Business of Health with Chip Kahn

Health Care’s AI Disruption, Ready or Not 

April 28, 2026

Video

Audio

About this Episode


Episode 1, AI Series: The AI revolution is already here — but what does it mean for patients, clinicians, and health care industry leaders? Eric Larsen, veteran health care strategist and longtime advisor to CEOs across the industry, joins Chip for a discussion about why the U.S. health care industry is uniquely exposed to AI-driven disruption and the implications for patients, clinicians, and the health care workforce. Listen to Eric’s take on “the most consequential technology humanity’s ever developed.” 

The Host


Headshot photo of Chip Kahn wearing a navy blue suit with a red tie, red pendant on lapel, and glasses.

Sr. Visiting Fellow

Charles N. Kahn III is a senior visiting fellow at KFF. He is also a visiting senior fellow at the American Enterprise Institute and a nonresident senior scholar at the University of Southern California’s Schaeffer Center for Health Policy & Economics. He serves as co-chair of the international Future of Health collaborative.

Guest


President,
TowerBrook 
Advisors 

Eric Jon Larsen serves as President, TowerBrook Advisors, and as a member of the healthcare leadership team of TowerBrook Capital Partners. Eric is a leading national healthcare strategist, author and advisor to CEOs and boards of directors of healthcare companies globally. 

Transcript


AI Usage Disclosure: This transcript was created with assistance from AI tools. It was reviewed and edited by KFF Staff.

Eric Larsen: I think U.S. health care has the greatest susceptibility to disruption from this technology. More than any other industrial vertical. It’s 18.3% of the U.S. GDP. It’s the single most labor-intensive sector in the U.S. economy. And when I think about Gen-AI in its first deployment, it’s about one thing. It’s about brute force, productivity augmentation and the systematic substitution of technology for labor.

Chip Kahn: Last week in our opening episode, Drew Altman and I talked about why KFF is launching the business of health and why we believe the policy world needs a clearer window into how health care delivery and financing actually work. This week we begin our first series on artificial intelligence in health care. Over the next many months, we’re going to take what may be an unprecedented deep dive into AI and health care. AI is not simply another technology being added to the toolkit. It is what economists call a general-purpose technology, a class of breakthrough on the level of the printing press, the steam engine and the Internet. Health care, as the largest industry at roughly $5 trillion and 18% of the GDP, is uniquely exposed to this disruption and I believe may be uniquely unprepared for it. Over the coming months, this series will examine what AI is doing to clinical practice, hospital operations, clinical performance and patient safety measurement, patient experience, payment reform, regulatory structure and delivery models here and internationally. Our guests are the people deploying this technology, managing its consequences and designing policy around it. But first we need the roadmap. We need to understand the wider landscape, the scale of what AI is changing, why health care is at once a fertile field for it and yet vulnerable to its unintended consequences. Who will make the critical decisions, and which philosophy will govern how this technology enters the most consequential industry in our economy.

That is why our first guest is Eric Larsen. Eric is president of TowerBrook Advisors and a member of a health care leadership team at TowerBrook Capital Partners. He spent 25 years at the advisory board, the last five as president advising health systems and payer CEOs on strategy, then co-led strategic health system partnerships at UnitedHealthcare Group after Optum’s acquisition of the advisory board. Over the past several years, Eric has focused intensely on AI’s impact on health care, producing a 127-page monograph through the Tower Brook Healthcare Institute: The Gen-AI Juggernaut. U.S. Health care is not prepared that laid out the case for why health care has the greatest surface area exposure to generative AI disruption of any industry in the economy. And he is now at work on a second volume that deepens the analysis. A year later, he combines deep institutional knowledge of how the largest health systems and payers operate with the investment perspective of someone evaluating which technologies create real value. There is no better person to open this series.

Chip Kahn: Erik Larson, welcome to KFF’s Business of Health. This is the first time we’re rolling.

Eric Larsen: I love it. We’re in a real studio and everything. This is awesome.

Chip Kahn: So, let’s get going on the big issue of the day.

Eric Larsen: Yes.

Chip Kahn: Everybody’s talking about AI.   Many are talking about AI in health care. What is it? What is generative AI and how is it different from, I mean, artificial intelligence has been around.

Eric Larsen: Artificial intelligence as a coined term existed since like 1956. There’s this famous Dartmouth retreat where some of the real preeminent intellects of the age got together for two months at Dartmouth College for the summer and they sort of conceptualized this idea of artificial intelligence. And then over that 70-plus year period, it’s just gone through so many different iterations. I mean, there have been two or three really kind of punctuated AI winters where the academic research sort of decelerated, where the funding dried up. But in answer to your question directly, Chip, I mean generative AI is categorically different and unique. And it’s basically in the name. It’s generative. It’s not a classification system or where you kind of ontologize data and you can pull insights from it. It’s really about generating new speech or imagery or video or genetic or molecular predictive models. So the key to understanding it, it’s basically a, for the first time where you can take all of these synthesized ingested inputs and create something that’s combinatorial, something that is potentially new. And we’ll get into the nuances of that, you know, because there are some people still kind of deprecating of it and they’re like, hey, this thing is, you know, a stochastic parrot. It’s an autoregressive model that predicts the next word. I think this is actually a speciation event. I think we’ve created a new non biological intelligence. I think this is the most consequential technology humanity’s ever developed. But when you get to core definitions, it’s a real, it’s a distinction between sort of a classification system and a generative system, something new.

Chip Kahn: So, I guess it’s been called a general purpose technology. That puts it at the level of the printing press and fire and other things. What does that mean?

Eric Larsen: Yeah, I mean look, this is a little bit of a Rorschach test, right? Like some people look at it and they’re like, hey, this is incremental. I look at this and I would put it in the pantheon of those kinds of technologies that you’re talking about. GPT is general purpose technologies. And you know, academics have different definitions of what a GPT is, but essentially it’s one of these like society and civilization and shaping technologies. And I think there have been probably 20 to 25 of these over the last 4,500 years of human civilization. And you can, it’s sort of an arbitrary definition of when does human civilization start? For our purposes, I’ll say it started with the advent of writing, which is about 4,500 years ago. And since then you can see this progression of technologies that really changed how humans live. And it’s, you know, agriculture and animal husbandry and the wheel. And you mentioned the printing press and then you sort of had them punctuate every couple centuries. But then you saw at the eve of the 18th century this absolute sort of Cambrian explosion of advancement. Starting with the Industrial revolution in the 1760s, with the steam engine. Three industrial revolutions. First was mechanization, second was electrification, and the third was computerization. And we’ll get into this, but I think we’re entering the fourth and most significant which is agentification. But these technologies, everything from the steam engine to Arkwright’s mill to railroads, to chemical development to electricity to the internal combustion engine, to the transistor, to the microprocessor to the mainframe computer, to the PC, like there’s just been a real telescoping. And you know, I am a techno optimist, right? I love technology, I revere technology. I think technology has marked the upward flourishing of humanity, certainly in a material sense. I’m a little agnostic on a metaphysical or a spiritual sense. But you know, think about at the beginning of the 18th century, the average lifespan was 25 years. Ninety percent of humanity lived in abject poverty. There were 800 million humans on the earth. Right? Fast forward 250 years and three industrial revolutions later, lifespan is now 76 to 80 years. We’ve seen the flourishing of democracy and sanitation and literacy and safety and mobility. And you’ve seen just a real upward surge of material well being. And so, I’m a techno optimist now. There are obviously negative externalities with technology. One of my favorite quotes is, with the invention of the ship came the invention of the shipwreck, right? And technology is intrinsically neutral. And if you believe as I do, that AI in its current incarnation and its emerging capabilities, is the most civilizationally consequential technology we’ve ever seen. With that kind of power, you know, you can engineer a cancer cure, you can engineer a pathogen of incredible lethality, right? So, you asked about these GPTs, these general purpose technologies, and it’s sort of curious in like a cosmic significance way that this AI is also called a GPT generative pre-trained transformer. And you know, I just think there’s sort of a cosmic, cosmically interesting sort of like coincidence there. but I’ll stop the monologue by, Chip, gen AI is fundamentally a multiplication of intelligence. And if you think about what’s defined the supremacy of our species, what allowed us to for better, for worse, to subjugate nature? What’s the hierarchy of humans? It’s based on two things. It’s based on our intelligence and our sociability, right? So, what’s defined the supremacy of our species is this sort of collective intelligence. We are fundamentally tool makers. We create tools. Now some primates, you know, will use a stick to, you know, pull out an ant from the ant hill, but those are so primitive and you know, and we’ve had, we’ve had tools since the Paleolithic age, right? But this tool is so consequential because we’ve created a synthetic intelligence that in many quantifiable and measurable ways supersedes our biological intelligence. Right, there’s, and we can talk about this if it’s interesting, but I think there are some really fascinating characteristics that are emergent in this intelligence that have massive implications for society, economy, our culture, et cetera. But that’s kind of my unasked for 4,500 years of civilization in five minutes.

Chip Kahn: Well, that’s a lot to take in and I want to get to health care. But before we get to health care, this transformation you’re describing, the one thing you didn’t say when you gave your list a second ago, was the individual. How is this going to affect, and I’ll be parochial, the individual American and change their lives?

Eric Larsen: I think it’s going to change all of our lives in super profound and frankly unimaginable ways. If you are creating a synthetic intelligence, intelligence is responsible for every civilizational advance we’ve had. And if there’s more of it. If it’s a multiplication of it, well, in every way that we define progress, there should be an acceleration. And given the potency of the raw tool, there’s also a deep risk that folks could use it for malicious purposes. There’s also a risk that I don’t know if we’re going to get into. Geoffrey Hinton, who won the Nobel prize for physics last year and is one of the godfathers of AI, sort of soberly observed. There’s not a single example in evolutionary or biological history of a less intelligent creature controlling a more intelligent creature. So, there’s the merely catastrophic problems of disinformation and misinformation and deepfakes and election manipulation and bioengineering pathogens. You know, those are pretty consequential. But then there’s the really catastrophic issues of if we really do lose control of this tool. And you know, we’re already seeing the tools manifest some, some pretty disconcerting personality traits, scheming, deception. As we talk about this, it’s important to be cognizant that this is unmapped territory. But for the average American, it is really hard to predict. You know, there are those that believe this is going to be very augmentative, right? It’s going to support our productivity, it’s going to make us more valuable in our work. There are those that believe it’s going to be substitutive, that you’re going to see massive technological unemployment. I tend to be in the latter category on that. I think we’re going to see massive disruption, especially in health care labor, which I presume we’ll get into. But, you know, you ask a really important question. If this is as consequential as I think it is, then the appropriate question is, what is it not going to touch? You know, I think it’s going to expand longevity. I think it’s going to change, our nature of mobility with a lot of, you know, anything that moves will be autonomous. Cars are going to be autonomous, you, planes are going to be autonomous. I think it’s going to revolutionize how we approach biology and designing molecules in biologics. I think it’s going to revolutionize the very definition of a GDP. Elon just recently came out and said we’re going to 10x the global GDP in the next decade. We’re going to go from 127 trillion to 1.2 quadrillion in a decade, which is kind of an abstraction. Right? But we’re already starting to see a pretty material uptick in GDP growth. I mean, there are those who believe that we’re going to have a five handle or a six handle on GDP growth this year. And economists like Larry Summers have been predicting this great decoupling between productivity growth and labor. So, we’re already starting to see a little bit of a decoupling where you’re getting 3.5% Q3 GDP growth and basically stagnant employment growth. And so the implications are so far reaching we almost need to sort of decompose the topic set. I mean, we’ll talk about merely health care and the 20% of the GDP…

Chip Kahn: well, there is an issue about data. You’ve said that you thought at least in terms of public data, it’s sort of becoming commoditized. And then there’s all of the private data, whether it’s health care data or commercial data, that’s what’s going to make the difference because that’s what makes the world go round right now. How is that all going to be worked out with these new mechanisms? Or will it just crash through whatever was private?

Eric Larsen: It’s a great question. I mean, how did we get to this moment? What was the alchemy that created this sort of vertical growth in intelligence? And it’s really three things. It’s hardware, software and data. You know, the hardware is, is, are, the GPUs. And you know, Jensen Huang has the most valuable company in the world at $5 trillion. He’s got over $1 trillion in orders for Blackwell and Vera Rubin chips, right? So, the hardware has gone stratospheric and the software, the algorithms, right, this, the famous transformer paper in 2017 that sort of inaugurated this whole, whole thing. But there have been so many sonic booms of advancements in algorithmic capability. You know, we’ve gone from, you know, just sort of generating responses and notorious hallucinations where it was just making stuff up and to reasoning models which are very calibrated, to memory, to tool control, to now agentic capabilities and these algorithmic advancements…it is that sort of intelligence valence, it’s going up and up. But the third is the data. We took all of the data on the Internet, which is about 100 trillion tokens, right? And you know, about a third of that is duplication and SEO, you know, debris. And you know, so the models were trained on all of the data that was available on Common Crawl, right? Which is, which is all of the publicly available data. And it just so happened that, you know, when you put a lot of data and a lot of compute and pretty sophisticated software. You got this alchemy and Anthropic, which is company I very much admire, one of the founders there says, we’re not so much building these machines as we’re growing them because we really don’t understand the neurology of how they work. There’s a certain, like, discontinuity that happens when you put all these things together. And then it began simulating something that looked like human reasoning and then surpassed human reasoning. So, the data question’s really interesting because for a long time we thought we were going to hit sort of peak oil, we were going to hit peak data. And then, you know, there was going to be this sort of degradation in the models. And some of the engineers were calling it catastrophic forgetting or perplexity. And, you know, basically when models that were trained on a certain quantum of data started training their successors, you’d get almost this sort of incestuous relationship and the models would, would, would just decay. We’re not seeing that. And part of that is because the models started reasoning, right? And that, that famously happened with ChatGPT01. And this was in about September of ‘24, I think. And then toward the end of that year, you had 03, which is a real advancement. And it just so happened that when the models paused and thought, right, the fidelity of their answers went way up. I tell my kids this all the time, stop and pause. And it just so happens you get more intelligence from that. And then, not to get super esoteric, but arguably the most important words in AI in 2025 are functional verifiability. And what that means, Chip is if there’s math or coding involved, if there’s a right or wrong answer, if there’s an answer that is provable, that is automatable. I mean, software used to be if you could specify the function, you could automate it or program it. Now it’s if you can verify the function, you can automate or program it. So, one of the reasons that we’ve seen all these step function breakthroughs in coding, and we’re seeing a lot of autonomous coding and programmers becoming 10x or 100x more productive. And some of the models are saying, look, 75 or 80% or 90% of the AI coding is done by AI itself. And you get to this moment where the AIs are recursively improving themselves. And I don’t think we’re running out of data. We’re actually creating really high-quality synthetic data because the reasoning models, again where there’s math or coding and there’s verifiability, that’s actually pretty constructive, usable data to recursively improve the models. So, there are 180 zettabytes of data in the world And a third of that data is in health care by the way. And we still haven’t accessed a lot of these proprietary company-owned or enterprise owned data sets. And I think it’s going to be very valuable in customizing the models and allowing the models to be more effective. I think the data is valuable but not monetizable. I don’t think people are going to be able to sell their data. Although OpenAI and Anthropic have bought some data sources. But I think going forward, you’re going to see less monetization and more just customization around what people need their models to do.

Chip Kahn: So let’s get into health care. In a sense you’ve talked about a ball rolling down the road that’s unstoppable. and health care you’ve pointed out, is exposed, but it’s always been sort of resistant to technology driven change. What’s going to be different this time?

Eric Larsen: Well, I’ll start by saying that I think U.S. health care has the greatest susceptibility to disruption from this technology more than any other industrial vertical. And I say that for four reasons. I mean, you know, first, like let me just give you a sentence on how my mental model for health care. Health care is a juggernaut, right? It’s $5.3 trillion, it’s 18.3% of the U.S. GDP. It’s the single most labor-intensive sector in the U.S. economy. And when I think about Gen AI, you know, when you strip away the dazzling generative elements, the text to photorealistic image or the text to cinematic quality video, or the two Nobel Prizes that it got awarded last December, one in chemistry, one in physics. In its first deployment. It’s about one thing, it’s about brute force, productivity augmentation and the systematic substitution of technology for labor. And so health care has the greatest exposure to this for four reasons, starting with the labor intensity. I mean U.S. health care employs 23.8 million Americans, right? One out of every six working age working adults is employed in health care. It’s the only industrial vertical to see negative productivity growth. I mean if you look at the employment data over the last year, U.S. health care added 750,000 jobs to the U.S. labor force. You take out health care, the entire economy lost 200,000 jobs. U.S. health care is atlasing the whole labor force and therefore the economy. And so when you think about the labor intensity, and if you believe as I do, that this is largely going to be augmentative of some things in the labor force, but substitutive for a lot of other things, I think it’s going to be predominantly substitutive in health care and we can decompose that a little bit. But the first observation is that U.S. health care’s labor addiction makes it very vulnerable to this tech. The second is its past impenetrability to every tech phase shift. You know, every other industry, vertical, manufacturing, industrials, hospitality, banking, has been enjoying the productivity augmentation, and the deflationary impact of technology. You know, every tech phase shift of the past generation, Internet, mobile, social cloud, big data and analytics, enterprise SaaS, blockchain, sort of ripped through every other market and you’ve seen corresponding productivity jumps, right? Not in health care. Health care has been largely impervious to a lot of these for good reasons and for bad. I mean part of it is just the sensitivity. Like we go too fast, it can endanger people’s lives. And so I say that with a loving but critical eye. I don’t think we’ve been a bastion of technological forward leaning adoption and therefore we’ve got a lot of accumulated tech debt and a lot of accumulated productivity debt. So if the technology is going to be augmentative of productivity in other sectors, I think it’ll be substituted in health care because there’s a lot to be automated. You know, the number of doctors in the country from 1970 to today increased by about 150%. The number of health care administrators increased by about 4300%. And I’m trying to say that with no value judgment, it’s a fact. But if there are certain tasks that are amenable to automation, I think you’re going to see them in health care, even in a more pronounced way from other industries.

The third reason that I think health care has a lot of vulnerability is the data. You know, there’s about 50 zettabytes of data in health care in the world. Much of this is unstructured. And prior to this technological phase shift with natural language processing and vector enablement and companies like Palantir that can,do their ontologies around the data. And when you ontologize the data, you really create a usable framework. Well, suddenly all that data that was just sitting dormant is at least theoretically useful. And a lot of it’s still unaccessed. So that’s actually an area that I’m very excited about. The last reason is the most philosophical and that is that, you know, biology is the highest dimensional space in our world. Right. I think we’re sort of hitting an asymptote, we’re sort of stagnating in biomedical advances and scientific advances. The reason I say that is, you know, in the 1950s it took 50 years for the sum total of human medical knowledge to double. In 2019 it was 73 days. And I, working with Claude, came up with the number that it’s about every 10 to 11 days that the raw quantity of data is doubling. And you know, we could quibble on the methodology there, but let’s just suffice to say that the quantity and complexity of the data have exceeded humans comprehension.And, what is our reaction to complexity in medicine and biology? To draw smaller and smaller circles around our specializations. So, we kind of look at biology, we look at the body through a straw, we almost draw circles around body parts or organs and hyper specialize and sub specialize again. And as a result, you know, one of the negative externalities of that is this hyper balkanized U.S. health care system, right, where medicine is divided and subdivided endlessly. And you’ve got, you know, medical care here, pharmacologic care there, behavioral care all over here, SDOH over there. And as a result we just have this hyper fragmentation. And I mentioned that this is a multiplication of intelligence. Well, one of the positive externalities of that is that we are building an intelligence that can now assimilate all of these unstructured, semi structured and structured data and see patterns, see causation and correlation, have this sort of encyclopedic knowledge of the 3.3 million annual peer reviewed biomedical and scientific studies that are published every year and begin to resynthesize health care. And in fact we can talk about what I think the implications are for doctors going forward. But you know, I think after a certain point we’re not going to have primary care doctors and medical oncologists and cardiologists and gastroenterologists and nephrologists. I think we’re just going to have a universal doctor. And you know, eventually as the intelligence keeps increasing, we’re going to go from just extracting insights from data and causation and correlation. I think we’re going to go toward hypothesizing new molecules, new biologics, new care treatments and protocols. Dario Amodei, who I have great respect for, he and I did a podcast talking about this, we talk about this essay he wrote called “Machines of Love and Grace.” And in it he sort of prognosticates that we’re going to see 10 to 20 years added to human longevity in the next couple decades. And we’re finally going to eradicate some of these diseases, these complex diseases. We’ve largely eradicated infectious diseases, but the complex diseases we’ve made precious little progress on, you know, especially in neurodegenerative diseases. And you know, we’ve made a lot of incremental progress in cancer. But even still, a lot of these six figure immunooncology drugs add 57 days to life. So, I think the returns to intelligence are incredibly high, in fact asymmetrically high in biology.And, so that’s a fourth reason why I think health care is going to  have a lot of impact.

Chip Kahn: Well, if you think about health care, and obviously from what you just described, in a sense health care is a data machine. And you’ve pointed out that the average hospital generates about 50 petabytes of data annually. Let’s just look at the hospital. I mean that’s on unused data right now. What difference is that going to make? I mean, how are those four walls going to be different not too long from now with the impact of this sort of unstoppable ball going down the road?

Eric Larsen: So, the way I would categorize the impact in health care, and this will apply to the hospitals and separately to the payers, and separately to the med tech providers and to the big biopharmaceutical companies. But I would categorize it in four domains. First is administrative simplification? So that’s the trillion dollars that we spend annually on this sort of friction filled adversarial system. and I think there’s going to be monumental impact on that very soon. We’re already starting to see it. Second is in

care augmentation. Which is this notion of a medical superintelligence. It’s this sort of synthetic intelligence that is superhuman from a differential diagnostic point of view, from a care treatment and protocol point of view. I think we’re already there. I think, you know, the regulation and the policy isn’t there, but the technology is really starting to push out on the frontier. Third is in computational and synthetic biology, which is using AI to engineer biomolecules and biologics and really shrink. You know, the 10 years and the $2.6 billion for a successful molecule to go from bench to preclinical, to clinical trial files, to FDA to commercialization. And do it in one-tenth the time at one third the cost. And then there’s the consumer empowerment. I mean, ChatGPT has 930 million weekly active users. There are about 40 million users a day for health care. And so, you know, and some of that is fantastic and some of that is very troubling.Now let’s talk about hospitals for a second.Hospitals are the biggest single industrial vertical in the U.S. economy, $1.6 trillion in revenue. And it’s one of the most consolidated sectors. The top 10 health systems in the country represent $350 billion in revenue. The top 100 health systems represent $935 billion in revenue. It’s not an exaggeration to say that the U.S. health system sector is controlled by 84 men and 16 women. Those are the CEOs of the top 100 health systems. And if you think about the employment intensity for hospitals, hospitals employ 7.2 million Americans. And arguably it’s not just that intensity of employment, but there’s the multiplier effect. For every health care job, for every hospital job, the economy produces another 2.79 jobs. It’s almost a 3x step up because of all of the services around the hospital and the environmental services and the food services and the medical equipment, et cetera. And then because these are really well-paying middle-class jobs, you know, that actually empowers consumers to pay their mortgage and go to the restaurants and go to the movies. So, the implications of that are quite huge. But the average not for profit health system spends 57 cents of every dollar on salary, wages and benefits. Hospitals are the single biggest employer of doctors in the country. You know, there are 950,000 doctors in the country. 54% are employed by hospitals. So, when we talk about the 50 petabytes of data for every individual hospital, you know, there’s not a one-to-one correlation between what the data is going to do and what the impact is going to be. I think it’s a more nuanced sort of algorithm. You got a nuanced equation to think through. But, I think this is going to revolutionize hospitals, right? I think you’re going to see a lot of deinstitutionalization in the sense that this technology is permitting a lot of migration from inpatient to outpatient, outpatient to, retail, from retail to home, from home to virtual. I think you’re going to see a real resurgence of care in the home. I think you’re going to see massive advances in procedural capabilities, in diagnostic capabilities, in things that are done outside the hospital. Going back to the general purpose technology conversation we had, I think this is going to have massive ramifications for hospitals, but it’s going to begin with labor. I’ve been telling a lot of health system CEOs, embrace attrition. You will need fewer staff going forward. The average hospital attrits about 20% of its workforce every year. Most of that is voluntary. And what I’ve been telling health system CEOs is moratorium on all new hires, close out all open recs, embrace attrition, and begin to diffuse the models. We should talk about, you know, what to do.

Chip Kahn: That’s what I want to turn to next is there’s this great disruption that you’re describing that’s coming or has begun to seep in. But then there’s leadership. And you’ve talked about it being top down because the labor force there, can’t exercise this. Somebody’s got to implement it from above. What’s that all about? And I’m going to let you mention the specific number; you started into the number of people running hospitals. Who are the people that are going make the difference? And really, are they ready?

Eric Larsen: My mental model for health care and Chip, you’ve heard me say this and I’ve said it publicly. I love U.S. health care. I mean, for me, this is a consecration, right? What a gift. To be able to contribute in some small way to improving health care and people’s lives and vibrancy and health. You know, but I also think health care is unconscionably expensive. And I think we’re going to see with the diffusion of AI, I personally believe we’re going to see 5 to 700 basis points of the U.S. GDP allocated to health care decline. I think we’re going to go from 18, 19% down to 12 to 13% in the coming years. And I think predominantly it’s going to come through labor contraction. You know, it’s a $5.3 trillion sector, but $2.9 trillion of it is in labor. And one of the through lines in our discussion is I believe this is largely going to be substitutive for human labor. And by the way, you know, here we are in Washington D.C., our beloved hometown, and there’s this like Orwellian conspiracy of silence, like thou shalt not talk about job dislocation and AI and people I otherwise respect, like David Sacks, who’s the AI czar, who I have enormous regard for, you know, is sort of propagating this narrative that no, no, no, this is not going to be job displacing, you know, Jensen Huang, who I also have enormous respect for saying no, that’s actually like fear mongering or doomerism. I don’t think so. I think if you sort of decompose the tasks that are done in knowledge work, you know, OpenAI did a very, I thought, very methodologically rigorous study called GDP eval. And you know, they took the onetime, which is the database of the Bureau of Labor Statistics which you know, looks at occupations and decomposes them into tasks and workflows. This was last year; we talked about the exponentiality in the models. They just keep getting incredibly faster and better and smarter. You know, across nine professional verticals, nine industrial verticals, 44 occupations, 1,320 tasks. The number of knowledge worker workflows that could be done to equivalency or superiority by the models as judged by domain experts in each of those professions with an average of 14 years experience was about half, half. Now what I’m trying to do in working with one of the frontier labs is build a GDP eval for health care to actually decompose to the 23.8 million jobs in the BLS data and begin to do a GDP eval for health care to really understand how much is automatable, augmentable or eliminable, with the current and emerging capabilities in the tech. But just to land the plane, I think the industry is very oligopolistic. There are there are 150 CEOs in U.S. health care that guide this industry and they are incredibly altruistic. A lot of them are heart-centered kind of servant leaders. But this is a very personality dominated industry. And these are the top 100 health systems I mentioned. These are the seven publicly traded managed care company CEOs. These are the 33 Blue Cross Blue Shield CEOs that collectively underwrite 119 million Americans. It’s the 10 BioPharmace that have a 5 trillion market cap. Maybe I’ll include Judy Faulkner in there, Dr. Oz, Chris Klump, Abe Sutton, really and the folks at CMS and CMMI and HHS I have enormous regard for. I think they’re a real bunch of stars from this administration. And what I would say is that this is not going to be democratized because of the labor, the potential labor dislocation. I think this is going to have to come from the top down. You know, in a sense this isn’t just about job elimination. I want to be really clear on that. Because there’s something called the Jevons paradox, which is as a commodity becomes cheaper, you actually use more of it. Health care is quintessentially that. As health care becomes deflation, as we see a deflationary impact on health care, we’re gonna use more of it, right? It takes me 60 days to get into my primary care doctor. If I could talk to my primary care doctor once every month, I would be delighted to do so. And so, I think the challenge, Chip, is that we have this sort of institution-based health care system that is built for permanence, that is built for durability. I mean, you see all the churn in big tech and manufacturing and other industries where there isn’t a lot of permanence or durability. There’s a constant sort of creative destruction and new companies emerge and entrepreneurs dislocate slow moving incumbents. Incumbents versus insurgents. Not in health care. You know, Cleveland clinic dates from 1922. You know, Mayo Clinic dates even longer. Our most prestigious organizations have been here for a century, right? And here’s a technology that is moving faster than any other in history, colliding into these sort of like, you and I were joking before, you know, Hippocrates versus Mark Zuckerberg, right? 2,400 years. Separate them first, do no harm versus move fast and break things. Two totally orthogonal cultures. And so, you know, this sort of bleeds into what to do about this, right? But first, I think it’s about if I’m talking to CEOs and I do spend a lot of time talking to the 150 and really a lot of what I’ve been trying to do is bring I call them the AI10 and the Healthcare150 into collision together. And so, you know, health care I think has really kind of abdicated its co-development opportunity and I might even say responsibility. With every tech phase shift that we talked about, this tech is too important to sort of deputize 20-something techno solutionists in San Francisco to design health care for the United States and therefore the world. And I live in San Francisco as well as Washington D.C. and so I kind of, I almost feel like I live in two different planets, you know, traveling between the two because in San Francisco, it’s all about this techno solutionism. Technology is going to solve everything. And technology is incredibly powerful, and especially this particular one. But there’s so much accumulated wisdom and, and, you know, experience and perspective that’s embodied in the 150. And so, first of all, it’s really about colliding the two together. Second, all, it’s about, do the CEOs understand the tech and the way to best understand it is to use it. Are they using the tech every day to skills max, as Sam Altman would call it? How do you have it teach you? Now that we’re moving from generative to agentic, meaning the tools can do things for you and actually do things autonomously, do things without supervision, which is kind of terrifying in a way.

I always ask the CEOs, how much are you using this and in what ways, and how vulnerable are you being with your teams about your use cases? I’ve been telling CEOs to find their inner autocrat. It’s an intentionally disagreeable word because, you know, we have sort of a revulsion to that, to that word. But it so happens that in the installation phase of a technology, autocracy is better than messy democracy, than pluralistic Western liberal democracy, that is let a thousand flowers bloom. When we’re talking about the diffusion of a technology that has positive and negative externalities like this one, this isn’t something that you’re just going to say, hey, you know, use it if you want, or don’t if you don’t want to. You’re starting to see this outside of health care, where CEOs are becoming increasingly autocratic about this. You know, Jack Dorsey, who’s the CEO and founder of Block, just announced he’s removing 40% of the workforce because they can now augment the productivity for the remaining 60%. The CEO of Accenture just mandated that promotional qualifications are going to go to how much are you using the tool? Jensen Huang this week at GTC, which is their big, Woodstock, said, if I’m hiring an engineer, and I’ve got 43,000 employees in Nvidia, again, the most valuable company in the history of capitalism at almost a 5 trillion market capitalization. I got 43,000 employees, 38,000 are engineers. And if I’m paying $500,000 for an engineer this year, and at the end of the year, he or she comes to me and says, hey, I used $5,000 of tokens this year, Jensen said, I’m going to be furious. Tokens is the output, right? It’s a proxy for how much they’re using the tech. He’s like, for every $500,000 I’m paying for an engineer, I expect them to use $250,000 of tokens every year.

Chip Kahn: But look at a hospital, or health care in general. But in a hospital more than two thirds of the cost are workforce. Our labor, yes. So, you’re telling me that’s going to implode if they do what they ought to do?

Eric Larsen: The honest answer is none of us knows how this is going to play out. I’ll tell you, my intuition is that a lot of the administrative rules will be automated. You can do much more with less. There’s a jagged frontier of how this is going to play out. We at Towerbrook own the largest, revenue cycle management company, R1. We did a large privatization last year. A $9 billion take. Private and revenue cycle management is one of the areas where you’re going to see the technology be massively augmentative. Why? Because it shares those characteristics of functional verifiability. I mean coding is quintessentially a functionally verifiable area. The claim is either correct or not. And so our CEO, Joe Flanagan is one of the most Progressive technology minded CEOs in the industry in really in health care. And we’re starting to see massive augmentation in productivity. And to predict when a claim is going to be perfect and how do you preemptively modify it, that’s an area where you’re going to see massive improvements. The next domain is going to be areas where you’ve got codifiability or rules based, so legal, HR, et cetera. I mean the next domain is going to be anything that is decontextualized. A lot of the outsourced services, a lot of things that we’re giving overseas, those are automatable. You know, for health care, if we didn’t have so much unmet demand,. There is a fundamental supply and demand imbalance. We have 1.8 million unfilled jobs. So, I’m not suggesting we’re going to see unemployment lines in health care. What I am suggesting is that for the first time we’re going to begin to see a better equilibrium between supply and demand. And I do think you’re going to see a real stratification in performance among hospitals, those that deploy the technology and lower their SWB percentage. Right. So the not-for-profit average is 57 cents of every dollar. What is HCA’s average on salary, wage? The benefits? About 41 cents. So even pre gen-AI there was almost that 17 point differential. Right. There are spans of control possibilities. There are more horizontal, flatline, you know, managerial structures where you’ll have a lot more individual contributors and fewer middle managers. Like the current organizational structure, the hierarchical structure for our economy, including health care, dates from 1855, which was the Pennsylvania Railroad. That’s where the boxes on the org chart originated. Suddenly you’ve got the most powerful technology that we’ve ever seen. Is it really realistic to expect that our conventional traditional org structures are going to survive this? And I think about it as incumbents versus insurgents. We’re seeing this in every single industry, including health care, where this new generation of startups that are tech native, that are agentic and AI native, I almost think about it Chip, as inverted vanities. There’s a little bit of an empire building ethos in health care. I can always tell the temperament of the CEO is if you go to the landing page. How big is the picture? What pronouns does he or she use? Is it I, is it we? And how many syllables does it take to get to? How many tens of billions are in your enterprise and how many tens or hundreds of thousands of employees are there? And that’s the empire psychology. There’s an inverted psychology, an inverted vanity emerging in Silicon Valley as tiny teams or revenue per employee. So for Microsoft, I mean, is it, I actually don’t remember offhand what it is, but is it several hundred thousand dollars per employee of revenue? Same for Meta, same for Google, same for Nvidia. You know, by my count, there are about 20 startups in Silicon Valley that have fewer than 50 employees, but more than 250 million in ARR. Annual recurring revenue. And so the idea is like, can an incumbent reshape its workforce in light of the new technology faster than an insurgent can provide material value or maybe even displace some of the incumbents?

Chip Kahn: But there you’re building from the ground up. And here we’re talking about institutions. But I want to go back a little bit to the Zuckerberg quote about we’ll worry about it later, we’ll break it now, and the ethos of the Hippocratic oath that in health care we do no harm, and at the end of the day we’re talking about a touching, caring industry that all of us depend on, for our health.

Eric Larsen: Yes.

Chip Kahn: What’s the tension there with this juggernaut you’re describing. I, mean, it’s one thing on the business side, and, and we’re the business of health, so it’s all business. But at the end of the day, there’s the caring side that I argue is tied to the business side. But how is that going to be impacted in terms of the touching that’s so important in health care?

Eric Larsen: I mean, look, I’ve got a lot of cognitive dissonance on this question because on the one hand, I have reverence for the caregivers and the industry that is U.S. health care. And again, I mentioned it’s a consecration, not a vocation. I feel incredibly privileged. But on the other hand, you have to look at it with a critical eye just to be a little bit provocative. U.S. health care is amazing if you’re rich, white and urban. I remember being in the office of the CEO of Johns Hopkins a few years ago and he pointed outside his office and he said, you see that block, Eric? There is almost a 20-year lifespan difference on each side of the street. And you know, I think you can look at this from a multitude of perspectives. You can look at it as this industry is working fabulously and let’s proceed very cautiously, or you can look at it as there is a continent of things that we can do better and we ought to be optimistic and see how we can deploy this responsibly. And I think it’s somewhere in the middle where, if you believe, as Dario does, and I subscribe to his view, that we’re going to add decades to human longevity, that we’re going to have this synthetic superintelligence that’s divining and designing drugs that are going to eradicate some of the previously non eradicable diseases. And I believe, like, you know, let’s talk about behavioral for a second and the laying hands on patients. I think that it is actually going to be perceived as malpractice. What is malpractice? Malpractice is a deviation from an accepted upon standard. I think the accepted upon standard is going to be radically revised upward going forward. I mean, right now, 30% of clinical care variation is sort of the presiding state of affairs. And I’m not talking from state to state or from a system to system.

Chip Kahn: No, you’re talking about within systems.

Eric Larsen: Right. Like we sort of enshrined individual physician judgment. And again, I have enormous reverence for clinicians, but they’ve bristled against cookbook medicine and being prescriptive. And part of that is because we’ve never had an intelligence that could agglomerate all of the data and begin to say definitively this is the best practice. Deviating from this is malpractice. And so I actually think the counterfactual is going to be outside of this country. We are going to see the deployment of clinical AI happen in the GCC in the Middle East and in China in the CCP. We’re already seeing this in clinical trials as an example. I think it is going to be irresponsible as the tech evolves at the velocity with which it’s evolving that we don’t deploy. And by the way, right now you’ve got this sort of regulatory enclosure around health care and incumbents have a sort of determinative influence on how this plays out. Eventually the technology is going to break out of the box and other countries are going to deploy it and we may be reduced to reverse importation.

Chip Kahn: So we’re moving, moving towards our conclusion here. You talk about incumbents. I mean whether it’s IBM or Google or Amazon, over time, they looked at health care and said it’s exposed, we can do something about this, we have technologies to bring to bear. And how many times did Google change their health care staff? IBM just fell flat on its face. You know, Amazon, maybe the jury’s still out. Who knows if we’re going to get outside the box, which is where you were headed, I think. What’s going to happen to the incumbents? And maybe I’ll combine this with my conclusion, which is what your advice is to leaders. How do you position yourself if you’re one of those 150? I mean you describe them as needing to be tech savvy and use tech so they sort of understand it. But if they’re sitting back in the C suite, they gotta make some big decisions. What’s the direction?

Eric Larsen: Yeah, and I would say, look, I have a lot of disillusionment around big tech and health care. There have been so many false starts and so much like hyperbole about what they can and will do. And I have a lot of respect for Neil Lindsey and the team at Amazon and I think they’ve done some interesting things. But, you know, health care goes through the 150 and unless you are directly relevant, if not indispensable to the 150, you are extraneous, you are an outsider looking in you. There’s not a single example in tech history of an insurgent becoming an incumbent in health care. With the maybe exception of Epic. And that’s a, you know, that’s a 50…

Chip Kahn: Well, government came in and said, we’re going to subsidize electronic health records to an incredible extent. So, they made the market.

Eric Larsen: They were tailwinded from that. But unlike other industries where you’ve got creative destruction, right? I mean, Google originated out of the dot com burst, right? Meta originated after the dot com burst. Microsoft is one of those rare companies that’s sort of been resilient and has survived multiple tech phase shifts. Nvidia is another. I think they’re one of the. Jensen is the longest, longest serving CEO on the Fortune 500, if I’m not mistaken here. But the point is I’m not predicting that big tech is going to revolutionize health care. I think Google is going to be a fascinating player in this domain because they’ve got such an array of capabilities and they’re so multifactorial in terms of what they can do. And I also think Demis Hassabis, who’s one of the greatest, I think people in the world right now, won the Nobel Prize for chemistry, for AlphaFold. You know, wearing my venture capital hat at Thrive, we led the round into Isomorphic Labs, which is one of the most exciting companies in the world. I think Google can aspire to be very relevant in health care, but I think the frontier labs like Anthropic and OpenAI are really vying for primacy. I think ChatGPT has done some very interesting things in the consumer side. I think Dario, who’s a computational neurobiologist, has a real authentic commitment to health care. And I think Anthropic is doing some really remarkable things in partnering with enterprises. And I think Dario recognizes that the path to relevancy in health care goes through the 150. So how do you enfranchise the 150 and show that you can amplify their staff productivity and really augment them? From a clinical superintelligence point of view, we’re going into this new generative epistemology world where the scientific method of sort of hypothesizing and testing and looking for falsifiability is irrelevant. We can now just simulate billions, if not theoretically trillions of scenarios to find the right molecule or the right biologic. What Demis did with AlphaFold, which is mapping the 200 million proteins that undergird human life and how the amino, acids fold to create these proteins, I mean, it takes a single PhD five to seven years to map a single protein. And Demis did it with Alphafold and created the equivalent of saving a billion PhD years. And then he open sourced it to the world. There have been 2.4 million scientists from 200 countries around the world that have accessed this. I think AlphaFold is the greatest scientific achievement of the last 50 years. I’m unconvinced that big tech is going to be the  revolutionary here. They may be and we could talk about that, but the most important thing that we could end on is what to do. I think for the 150 it really is about becoming facile with the tech. I think it’s about sensitizing the org to how do you use this technology to augment your productivity? Now you could accuse me of a contradiction here because why would the staff augment their productivity with the tools if it’s going to lead to their obsolescence? I’m not convinced that it will. But the way I think about it is a numerator and a denominator question. So, a CEO has a choice. The denominator is our market served and the population density that we serve and inpatient versus outpatient versus home care, et cetera. It’s the entire market served, the addressable market. The numerator is the cost to serve and it’s predominantly staffing and cost of goods, etc. You can either keep your numerator the same, keep your staff the same, keep your inputs the same, but augment your denominator, go into new markets, get greater concentration of market share, or you can keep your denominator the same, serve the same market, serve the same population, but with fewer people. I think you’re going to see a real stratification of performance and I’m predicting toward the end of 26, the biggest market share shift in a generation of non contiguous health system mergers. Ones that are proficient in AI and thereby lowering their operating costs and augmenting their operating margin and going into new markets. We haven’t even talked about payers, but I think payers are entering an existential threat phase and this technology is going to rip through that industry and you’re going to see a major stratification of performance. Among the blues, among the seven publicly traded managed care companies, among some of the provider-sponsored health plans, and those that automate a lot of the SG&As, those that automate a lot of the adversarial payer provider dynamics that right now cost our industry about $600 billion per year. I think you’re going to see a real shift there. I mean the seven publicly traded managed care companies have lost over a half trillion dollars in market over the last half year. Two out of three blues plans lost money last year and you’re starting to see a real stratification among the blues. There are a couple CEOs that are just fantastic. Like Brian Pieninck down at Guidewell is very progressive and really thinking about how do I serve my enrollment base in a totally differentiated way. Kim Keck, who leads the [Blue Cross Blue Shield] Association, is incredibly thoughtful about these things. So, I have a lot of admiration for individuals among the 150 that are being very thoughtful and compassionate about this. Again, I don’t think this is about automatically reducing staff, although I think the ones that are efficient are going to grow and the ones that are not embracing this are going to contract. And I do believe there will be staff contraction there. The net winner chip is going to be the consumer. Right. I think this is going to be deflationary. There’s about $250 billion in medical debt right now. The number one cause of bankruptcy in this country is medical debt. And I think you’re going to see a real democratization of this. But for the 150 that have some agency, that have some self-determination in this moment, get really smart in the tech, begin to prepare the organizations for this, begin to think laterally about, gosh, I’ve been leading an organization in a stewardship sense, but I really need to be leading this from almost a disruptive, founder sense. You know, there’s a phrase in Silicon Valley called founder mode. Zuckerberg gets to do things that, you know, he’s got super voting shares but, but he’s a founder, right? Jensen is a founder. Elon is the quintessential founder. And they get to do things that they’ve earned the right to do.

What is the founder mode equivalent among the 150? And then how do we begin to recognize that our patients are moving much faster than the doctors? 40 million people every day are accessing ChatGPT for health. You’re going to see a stratification among the 950,000 doctors. You know, if the typical primary care panel is 1 to 20, 200, I think you’re going to see 1 to 20,000 panels. I think you’re going to see agentic doctors that are an amplification of the human doctor. You know, we didn’t talk about behavioral, but the number one use case for ChatGPT 1/10 of humanity accesses ChatGPT every week. The number one-use case is therapy and companionship. People tell the truth to a chatbot, but they’ll lie to a human. They’ll lie to their doctor to avoid stigmatization or embarrassment or judgment. You know, think about the power of that statement, of that truth. If for every medical case with a psychiatric or a behavioral comorbidity, your costs go up by 2 to 6x. Right. If you had a chatbot that is personalized to me, that knows my dietary habits, knows my exercise habits, has a theory of mind on what I’m thinking because it interacts with me constantly, couldn’t it nudge me to be adherent to my drug regiment? Couldn’t it nudge me to make a better behavioral choice or, a better nutritional choice? The answer is absolutely. And I’m incredibly optimistic about these things. I’m doubtful that our regulatory regime has the sort of elasticity to move with the tech. I mean, Pritzker, the governor of Illinois, to me, indefensibly signed a law that prohibits the use of the chatbots for therapeutic purposes. That is preposterous. And when he signed the law, he said, yeah, this is also defending jobs. And you’re, you know, one out of every three people in an industrialized country is lonely.

Chip Kahn: And we know what defending jobs does to an economy. And it doesn’t, at the end of the day, help the people you’ve tried to defend.

Eric Larsen: Not at all.

Chip Kahn: This has really been a wonderful conversation, and it’s done a lot for our podcast because we’re trying here to set a foundation for the next 19 or so episodes where we’re going to drill down on, institutions and apps and applications. And this was just a great start. And I just want to thank you. And ending as we did on the personal, in terms of how this is going to affect individuals is so important, because at the end of the day, health is all about caring. And I would argue the business of health we’re going to be looking at is really about making sure there’s caring for all Americans.

Eric Larsen: Absolutely. And I’ll close Chip, first off, with gratitude to you. I mean, I just

have such regard for what you’ve done for the industry and now continuing to do. But I’m a constitutional optimist. Right. I’m so excited about this moment. I try to be sober and look at the downsides. I try to ask some of the uncomfortable questions of myself and of our industry, you know, and there’s no hubris here. It’s quite the opposite. There’s a ton of, I feel humility to try to understand this, but I also, in the final analysis feel incredible urgency. You know, this technology is going whether we like it or not. I think with each turn of the crank in the technology, from reasoning to memory, to tool control to agentic capabilities, like we lose a little self-determination, we lose a little agency, we lose a little of our jurisdiction. And my clarion call to the 150 is, you cannot wait, you don’t have time if you want to co-create, let alone co-evolve with this. I believe there is nothing more important in the world right now than understanding this technology and trying to help shape it. And we have a very time delimited opportunity to do that now. The companies we own, where we can be autocratic, right. We are diffusing this with great speed and intentionality. And we’re going from this age of discovery to an age of implementation. And we’re going to continue with the discovery unabated. But now it’s about diffusion. And I think at the end, it’ll be improving quality, it’ll be augmenting lifespan, it’ll be massively deflationary and it’ll be very democratizing. And I think in the final analysis, it will actually help the ones that have been traditionally marginalized or disadvantaged, the socioeconomic and the demographic and the ethnic communities that aren’t part of that privileged white, urban and male class. And I feel like that is our obligation to figure this out and see if we can diffuse that not just to the United States, but then eventually to the globe.

Chip Kahn: Thank you, Eric.

Eric Larsen: Thank you, Chip.


SERIES

This weekly podcast features insightful conversations between host Chip Kahn and his guests, who discuss the business of health care, connecting the dots between the health care business, policy, and patients.

The podcast’s first series on AI in health care illuminates how AI is changing health care, and features guests who are deploying this technology, managing its consequences, and designing policy around it.

KFF Tracker: America First MOU Bilateral Global Health Agreements

Published: Apr 27, 2026

Editorial Note: Originally published on January 13, 2026, this resource will be updated as needed, most recently on April 27, 2026, to reflect additional developments.

On September 18, 2025, the U.S. government (USG) released its new America First Global Health Strategy, which details how the U.S. will engage in global health efforts moving forward. As part of this new strategy, the U.S. has announced that it will be establishing bilateral health cooperation agreements with countries that receive U.S. global health assistance. These agreements, or Memorandums of Understanding (MOUs), between the U.S. and partner countries represent five-year plans (for the period 2026-2030) outlining U.S. engagement in each country’s health efforts with the goal of “helping countries move toward more resilient and durable health systems.” Central to these plans is transitioning country programs from U.S. assistance to long-term country ownership, with a pledge from each partner country to increase its domestic health spending, or co-investment in health, over the next five years as the U.S. decreases its health assistance. The U.S. began signing these agreements in late 2025 and this process is ongoing. Implementation is slated for later this year.

This tracker provides an overview of the MOUs signed to date. Data are based on press releases issued by the State Department, U.S. embassies, and partner country Ministries of Health, as well as MOU documents (if publicly available). See Methods for more information. This tracker will be updated as agreements are signed and more data become available.

USG Global Health MOUs by Country (Table)
Signed USG Global Health MOUs by Country (Choropleth map)
Global Health MOU Funding by Country (Bar Chart)
USG Global Health MOU Co-Financing Share by Country (Stacked Bars)
USG Global Health MOU Program Areas by Country (Table)
Historical vs. Proposed 5-Year USG Global Health MOU Funding by Country (Grouped Bars)

Methods

This tracker provides information on U.S. MOU bilateral global health agreements to date. Information is sourced from publicly available U.S. Department of State, U.S. embassies, and partner country Ministries of Health press release statements and MOU texts, and will be updated as more information becomes available and when additional agreements are signed. Currently, MOU text, which contains the most detailed information of these sources, is publicly available for only a limited number of countries; for these countries, data were sourced directly from these MOU documents. For countries with available MOU documents, overall totals are based on the sum of annual amounts presented in the text. 

Program areas are captured using keyword searches; for global health security (GHS) specifically, country agreements were categorized as targeting GHS if they specifically mentioned GHS, or if they included descriptions of outbreak preparedness and response activities and containing health threats. Due to the limited nature of press release statements, this tracker may not comprehensively capture the global health program areas targeted in each country’s agreement.

Abortion in the United States Dashboard

On June 24, 2022, the Supreme Court overturned Roe v. Wade, eliminating the federal constitutional standard that had protected the right to abortion. Without any federal standard regarding abortion access, states will set their own policies to ban or protect abortion. The Abortion in the United States Dashboard is an ongoing research project tracking state abortion policies and litigation following the overturning of Roe v. Wade. Click on the buttons or scroll down to see all the content. It will be updated as new information is available.

Map of the United States showing the status of abortion bans as of March 9, 2026. 

Abortion banned in 13 states: Alabama, Arkansas, Idaho, Indiana, Kentucky, Louisiana, Mississippi, North Dakota, Oklahoma, South Dakota, Tennessee, Texas, West Virginia

Gestational limit between 6 and 12 weeks LMP in effect in 7 states: Florida (6 weeks), Georgia (6 weeks), Iowa (6 weeks), Nebraska (12 weeks), North Carolina (12 weeks), South Carolina (6 weeks), Wyoming (6 weeks).

Gestational limit between 15 and 22 weeks LMP in effect in 4 states: Kansas, Ohio, Utah and Wisconsin

Gestational limits at or near viability in 18 states: Arizona, California, Connecticut, Delaware, Hawaii, Illinois, Maine, Massachusetts, Missouri, Montana, Nevada, New Hampshire, New York, Pennsylvania, Rhode Island, Virginia, Washington

No gestational limits in 9 states and DC: Alaska, Colorado, DC, Maryland, Michigan, Minnesota, New Jersey, New Mexico, Oregon, Vermont

NEW RELEASES

KFF infographic explaining who regulates mifepristone, showing four entities and their roles: the U.S. Food and Drug Administration approves and regulates medications for safety and effectiveness; state legislatures pass laws that can restrict or protect access; courts rule on legal cases affecting regulation; and Congress can pass federal legislation influencing regulation.

Louisiana v. FDA: Access to Mifepristone Back at the Supreme Court

Women's Health Policy

This brief reviews the case now before the Supreme Court, Louisiana v. FDA, and provides an overview of the other pending litigation involving mifepristone, and the mounting tension between states seeking to protect abortion and the states banning the provision of abortion.

Abortion Coverage Limitations in Medicaid and Private Insurance Plans

Women's Health Policy

This brief reviews current federal and state policies on Medicaid and insurance coverage of abortion services in the U.S. and presents national and state estimates on the availability of abortion coverage for people enrolled in private plans, Marketplace plans, and Medicaid.

BALLOT MEASURES

KEY FACTS

Over four in ten (45%) abortions occur by six weeks of gestation, 36% are between seven and nine weeks, and 13% at 10-13 weeks. Just 7% of abortions occur after the first trimester.

The Vast Majority of Abortions in 2022 Occurred Prior to 10 Weeks of Gestation

MEDICATION Abortion


Availability of Telehealth for Medication Abortion in a Post-Dobbs United States, as of July 14, 2025

The Intersection of State and Federal Policies on Access to Medication Abortion Via Telehealth after Dobbs

This brief reviews current state and federal policies, ongoing litigation, and potential federal actions that may impact access to telehealth for medication abortion.

COVERAGE

State Policies on Abortion Coverage for Medicaid, Private Insurance, and ACA Exchange Plan Enrollees – 2026 (Choropleth map)

How State Policies Shape Access to Abortion Coverage

Several states have enacted private plan restrictions and have also banned abortion coverage from ACA Marketplace plans. Currently, there are 10 states that restrict abortion coverage in private plans and 25 that ban coverage in any Marketplace plans.

Abortion Decision Renews Questions About Employer Access to Health Information

This Policy Watch takes a look at employers ability to access abortion information when their health plan covers abortion services. With some states criminalizing entities who assist in abortions, employers and providers face legal jeopardy and existing privacy laws such as HIPAA (the Health Insurance Portability and Accountability Act) may be limited in their privacy protections.


Employer Coverage of Travel Costs for Out-of-State Abortion

This Policy Watch gives an overview of employers offering to cover travel expenses for workers who need to go out of state for an abortion in the context of increasing restrictions on abortion around the country. We discuss who is offering these benefits, the implications for workers, and some of the legal and political concerns for employers.

Coverage of Abortion in Large Employer-Sponsored Plans in 2023

This brief presents findings from the 2023 KFF Employer Health Benefits Survey on coverage of abortion services in large employer-sponsored health plans, changes employers made to abortion coverage since the 2022 Supreme Court ruling, and employers’ provision of financial assistance for travel out of state to obtain an abortion.

RACIAL & ETHNIC DISPARITIES

Pregnancy-Related Mortality (per 100,000 births) by Race and Ethnicity, 2017-2019

Pregnancy-Related Mortality (per 100,000 births) by Race and Ethnicity, 2017-2019

Native Hawaiian or Pacific Islander, American Indian or Alaskan Native and Black people are more likely to die while pregnant or within a year of the end of pregnancy compared to White people

State Abortion Policies by Race and Ethnicity Among Women Ages 18-49, 2022

State Abortion Policies by Race and Ethnicity Among Women Ages 18-49, 2022

Six in ten of Black (60%) and AIAN (59%) women ages 18-49 live in states with abortion bans or restrictions. Just over half (53%) of White women ages 18-49 live in states with bans or restrictions, while less than half of Hispanic (45%) and about three in ten Asian (28%) and NHPI (29%) women ages 18-49 live in these states

Polling

KFF Health Tracking Poll March 2024: Abortion in the 2024 Election and Beyond

This poll finds 1 in 8 voters say abortion is the most important issue to their vote. They are younger, lean Democratic, and generally want abortion to be legal in all or most cases. The poll also gauges the public’s views on abortion-related policies, including a national 16-week abortion ban and allowing abortion for pregnancy-related emergencies.


Women and Abortion in Florida

This brief provides information about abortion experiences, awareness, and attitudes of Florida women ages 18 to 49, based on findings from the 2024 KFF Women’s Health Survey, a nationally representative survey on health care issues.

Women and Abortion in Arizona

This brief provides information about abortion experiences, awareness, and attitudes of Arizona women ages 18 to 49, based on findings from the 2024 KFF Women’s Health Survey, a nationally representative survey on health care issues.

STATE PROFILES FOR WOMEN'S HEALTH

Abortion Policies by State

State gestational limits, waiting periods & ultrasound requirements, insurance coverage and medication abortion restrictions

How State Policies Shape Access to Abortion Coverage

Editorial note: Updated May 21, 2026 with new updates for Pennsylvania.

State and federal efforts to limit abortion coverage began soon after the 1973 Supreme Court’s Roe v Wade decision. In 1977, the Hyde Amendment banned federal funding for abortion, with exceptions for pregnancies that endanger the life of the woman, or result from rape or incest. Some states use their own funds to cover other medically necessary abortions for their Medicaid enrollees or have been compelled to do so by the courts. The passage of the ACA in 2010 led to renewed legislative efforts to limit abortion coverage, this time in private insurance plans. The ACA maintains the Hyde Amendment’s limits, and permits states to ban abortion coverage from Marketplace plans. Since 2010, many states have enacted private plan restrictions and also banned abortion coverage from Marketplace plans, some of which are more restrictive than the Hyde limitations. A handful of states, however, have enacted laws that require private plans to cover abortion and state funds to cover abortions for Medicaid enrollees.

The interactive map below shows the increase in states with laws restricting abortion coverage for Medicaid and private insurance enrollees in 2010 compared to the present.

State Policies on Abortion Coverage for Medicaid, Private Insurance, and ACA Exchange Plan Enrollees – 2026 (Choropleth map)

On June 24, 2022, the Supreme Court overturned Roe v. Wade, eliminating the federal constitutional standard that had protected the right to abortion. States can now set their own policies to ban or protect abortion. As of January 6, 2026, 13 states have banned abortion (Alabama, Arkansas, Idaho, Indiana, Kentucky, Louisiana, North Dakota, Mississippi, Oklahoma, South Dakota, Tennessee, Texas, and West Virginia). For more details about legal status of abortion in states, please visit our Abortion in the United States Dashboard.

Medicaid Coverage Limitations (30 states & DC) - State limits Medicaid coverage of abortion to the Hyde Amendment restrictions (only allowed in the cases of rape, incest or life endangerment).

Private Insurance Coverage Limitations (10 states) - State has a law that prohibits coverage of abortions from being included in private insurance policies sold in the state (with certain exceptions). Private insurance includes individual, small group, and large group. Some states may allow abortion coverage to be purchased as a rider.

State Marketplace Coverage Limitations (25 states) - State has a law that prohibits plans sold on state Marketplaces from covering abortion (with certain exceptions).

No Coverage Limitations (6 states) - State does not limit coverage of abortion in private insurance or the state Marketplace and the state does not ban the use of state funds (non-federal) to pay for abortion for Medicaid enrollees in circumstances outside of those allowed by the Hyde Amendment.

Requires Abortion Coverage in Private and ACA Marketplace Plans and for Medicaid Enrollees (13 states) - State requires all fully-insured group plans and individual plans to include abortion coverage and state funds to cover abortion for Medicaid enrollees. Ten of these states require no cost-sharing for abortion—Illinois and Minnesota allow cost sharing if there is cost-sharing for similar services in the plan and Delaware prohibits cost-sharing for abortions up to $750.

What We Know from the Latest PEPFAR Data: Analysis of FY 2025 Quarter 4 Results

Authors: Jennifer Kates, Anna Rouw, and Allyala Nandakumar
Published: Apr 23, 2026

Since the start of the second Trump administration, the President’s Emergency Plan for AIDS Relief (PEPFAR), the U.S. global HIV/AIDS program credited with saving 26 million lives, has undergone significant changes and disruptions as part of a  broader foreign aid review. Recent changes include: a temporary stop work order and eventual limits to what services could be continued; the cancellation of numerous PEPFAR awards; and a reorganization of U.S. global health programs, including the launch of a new “America First Global Health Strategy” which is anchored to bilateral agreements with countries, a focus on frontline commodities and services, and a shift from disease-specific programming to a more integrated approach. While modeling estimates and field surveys have provided some information about the potential impact of these changes and disruptions, there has been limited data available for such assessments. PEPFAR’s flagship data platform has historically posted financial and program level results, including from PEPFAR’s Monitoring, Evaluation, and Reporting (MER) system (MER was launched more than a decade ago). However, the data platform was temporarily removed in early 2025 and, when restored, it did not include any program data from FY 2025.   

On April 17, 2026, the State Department released Fiscal Year (FY) 2025 fourth quarter (Q4) MER data (covering the July 1 to September 30, 2025 period), providing the first program-level data made available since the changes of last year. Data for quarters 1-3 were not released, which, per the State Department, is due to data reporting and implementation challenges due to the changes. To provide a snapshot of PEPFAR results after these changes, and given this limitation, this analysis compares PEPFAR’s FY 2025 Q4 results to Q4 results from the previous four fiscal years for a subset of MER indicators. By comparing the same time period for each fiscal year, this approach helps to capture seasonal or other reporting fluctuations that could occur. However, it does not allow for an assessment of disruptions or other changes that may have occurred for the full FY 2025 period.1

While these data are limited (see box on methodology and data limitations) and provide only a snapshot view, they nevertheless provide insights into understanding how PEPFAR is performing following changes by the Trump administration. Overall, the data show that for some indicators, progress  declined in FY 2025 Q4, including support for prevention services such as pre-exposure prophylaxis (PrEP) and the DREAMS program for adolescent girls and young women, both of which were significantly scaled back by the administration. Reduced access to prevention could lead to increases in new HIV infections in the future. There was also a drop in the number of people with HIV newly enrolled on antiretroviral therapy (ART), an important measure of access. At the same time, without more complete data, there is ambiguity in some of the indicators. For example, both the number of HIV tests conducted and the number testing positive for HIV fell, which could represent an actual decline in new infections or simply a decline in access to testing. Finally, there are areas where progress has been maintained or potentially improved, including the total number of people with HIV on ART, which was stable, and an increase in the number of people living with both HIV and TB who are receiving ART. Going forward, the future of transparent PEPFAR data monitoring and reporting remains uncertain, as it’s unclear whether or not these data updates will continue to be provided given the shift in the U.S. global health strategy to country governments and from disease-specific programming to a more integrated approach.  Without such data, it will be difficult to understand the implications and outcomes of these significant changes. 

Findings

PEPFAR’s Q4 treatment results over the period were mixed. While there were some stable results, particularly for the number of people receiving ART, others dropped, such as those newly enrolled on ART.

  • The number of individuals with HIV on antiretroviral therapy (ART) remained relatively stable in FY 2025 Q4 compared to FY 2024 Q4 (20.3 million2 compared to 20.4 million) and was higher than the prior fiscal years.
  • At the same time, the number newly enrolled on ART in FY 2025 Q4 was the lowest over the period, including 16% lower than FY 2024 Q4 (389.1K compared to 463.5K). This is part of a broader decline over the past five years but one of the steepest year-to-year quarter declines.
  • Similarly, the number of pregnant women testing positive for HIV and receiving ART in FY 2025 Q4 was also the lowest over the period, including a 14% decline compared to FY 2024 Q4 (189.3K compared to 220.7K).   
  • Finally, individuals on ART with documented viral load suppression (VLS) declined in FY 2025 Q4 by 7% compared to FY 2024 Q4 (14.6 million compared to 15.8 million), but was higher than the prior fiscal years.
Treatment: Individuals on ART, FY 2021 - FY 2025 (Column Chart)

HIV testing and diagnostic results were mixed in FY 2025 Q4 compared to FY 2024 Q4, although there were fluctuations over the five-year period.

  • Both the number of individuals tested for HIV and the number testing positive fell. The number of individuals tested fell by 17% in FY 2025 Q4 compared to FY 2024 Q4 (19.6 million compared to 23.7 million), though was still higher than in prior years. The number testing positive similarly fell by 15% in FY 2025 Q4 compared to FY 2024 Q4 (380.2K compared to 449.8K), continuing a downward decline and reaching the lowest number over the period.
  • Despite these drops, the number of pregnant women attending antenatal care who know their HIV status in FY 2025 Q4 was highest over the period, including a 10% increase compared to FY 2024 Q4 (3.9 million compared to 3.6 million).
  • In addition, the number of HIV-infected infants with an HIV diagnostic sample collected within the first year increased slightly in FY 2025 Q4 compared to FY 2024 Q4 (2,272 compared to 2,225) but was lower than prior years.
Testing: Individuals Tested for HIV, FY 2021 - FY 2025 (Column Chart)

Key PEPFAR prevention results saw large declines, including for PrEP.

  • The number of individuals who newly initiated PrEP declined by 41% in FY 2025 Q4 compared to FY 2024 Q4 (388K compared to 659.4K), falling to FY 2022 levels. Access to PrEP with PEPFAR support had increased steadily in recent years, before this drop.
  • Also declining significantly was the number of adolescent girls and young women (AGYW) who completed the DREAMS package of prevention services in FY 2025 Q4 compared to FY 2024 Q4 (a drop of 86%, from 1.9 million to 253.4k), its lowest level over the period and less than a quarter of those served in the prior years analyzed. DREAMS had been a major PEPFAR initiative to address the drivers of high HIV incidence rates among AGYW, including gender-based violence, gender inequality, poverty, and inadequate access to education. These broader services are no longer being prioritized by PEPFAR.
  • Similarly, the number of children and family members served by the Orphans and Vulnerable Children (OVC) program declined significantly in FY 2025 Q4 compared to FY 2024 Q4 (1.7 million compared to 6.5 million), falling to its lowest level in the last five years, and less than a quarter of those served in Q4 of 2022.
  • PEPFAR eliminated reporting on key and priority populations (those who were marginalized or faced particular barriers to HIV services, including men who have sex with men, people in prison, displaced persons or mobile communities, and others) reached with prevention and other interventions. Reporting on voluntary medical male circumcision (VMMC) was also eliminated.
Prevention: Individuals Newly on PrEP, FY 2021 - FY 2025 (Column Chart)

PEPFAR has also provided significant support to address HIV and TB co-infection, and risk of TB among those with HIV. These results were varied.

  • The number of individuals living with HIV who know their TB status slightly declined in FY 2025 Q4 compared to FY 2024 Q4 (199k compared to 208.7k) but was higher than prior years.
  • The number of individuals living with HIV and TB who are receiving ART declined considerably in FY 2025 Q4, compared to previous fiscal years, including a 33% drop compared to FY 2024 (138.9k compared to 208.1k).
  • Similarly, the number of individuals receiving ART who initiated TB prevention therapy declined in FY 2025 Q4 (467.7k compared to 823k), reaching its lowest level over the period and continuing a declining trend. The number for FY 2025 Q4 was a third of the number in FY 2021.
  • At the same time, the number of individuals receiving ART who initiated TB treatment increased in FY 2025 Q4 compared to FY 2024 Q4, to its highest level over the period.  
TB: People Living with HIV Who Know Their TB Status, FY 2021 - FY 2025 (Column Chart)

PEPFAR has, for many years, also worked to address the elevated risk of cervical cancer among women living with HIV. While screening for cervical cancer declined, the share receiving treatment for cervical cancer held steady.

  • The number of women living with HIV and receiving ART who were screened for cervical cancer declined in FY 2025 Q4 compared to FY 2024 Q4 (806.4K compared to 1.4 million), its lowest level over the period.
  • Of the women living with HIV and receiving ART and screened positive for cervical cancer, the share receiving treatment was only slightly below the prior period (89% in FY 2025 Q4 compared to 92% in FY 2024 Q4).
Cervical Cancer: Women on ART Screened for Cervical Cancer, FY 2021 - FY 2025 (Column Chart)
Select PEPFAR Indicators, FY 2021 - FY 2025 (Table)

Methods and Data Limitations

Data represent KFF and Boston University analysis of PEPFAR monitoring, evaluation and reporting (MER) datasets from the PEPFAR Panorama Spotlight for quarter 4 of fiscal years 2021-2025, with a particular focus on changes between FY 2024 and FY 2025 (all countries that reported data in FY 2024 Q4 also reported data in FY 2025 Q4). Data were accessed on April 17, 2026.   

Reporting for several indicators included in this analysis was changed from “required” to “optional” at some point for FY 2025 (current and prior reference guides for MER reporting can be found here). These indicators include:

  • Adolescent girls and young women completing DREAMS (AGYW_PREV)
  • Children and family members served by the OVC program (OVC_SERV)
  • Individuals with TB and HIV receiving ART (TB_ART)
  • Individuals on ART who initiated TB preventive therapy (TB_PREV)
  • Women on ART screened for cervical cancer (CXCA_SCRN)
  • Percentage of women on ART who screened positive for cervical cancer receiving treatment (CXCA_TX)

Because of these reporting requirement changes, declines in the data may reflect actual declines in services, or reduced reporting since participants are no longer required to track these metrics.

Jen Kates and Anna Rouw are with KFF. Allyala Nandakumar is with Boston University.


  1. One recent analysis, submitted for publication, attempts to address some of these issues by looking at reporting continuity across facilities over time. See, Honermann B, Grimsrud A, Lankiewicz E, Sherwood J, Millett G, The impact of the United States foreign aid freeze on HIV service delivery in PEPFAR-supported countries: a facility-level analysis of 2024–2025 programme data, https://www.medrxiv.org/content/10.64898/2026.04.17.26351143v1. ↩︎
  2. The number of individuals on ART in FY 2025 Q4 in the publicly available dataset is 20.3 million. The State Department’s press release about the data cites 20.6 million people. ↩︎