Tracking Implementation of the 2025 Reconciliation Law Medicaid Work Requirements
Updated on:
The independent source for health policy research, polling, and news.
Note: The data presented below are updated monthly as new Medicaid/CHIP enrollment data become available.
The Medicaid Enrollment and Unwinding Tracker presents the most recent data on monthly Medicaid/CHIP enrollment reported by the Centers for Medicare & Medicaid Services (CMS) as part of the Performance Indicator Project as well as archived data on renewal outcomes reported by states during the unwinding of the Medicaid continuous enrollment provision. The unwinding data were pulled from state websites, where available, and from CMS.
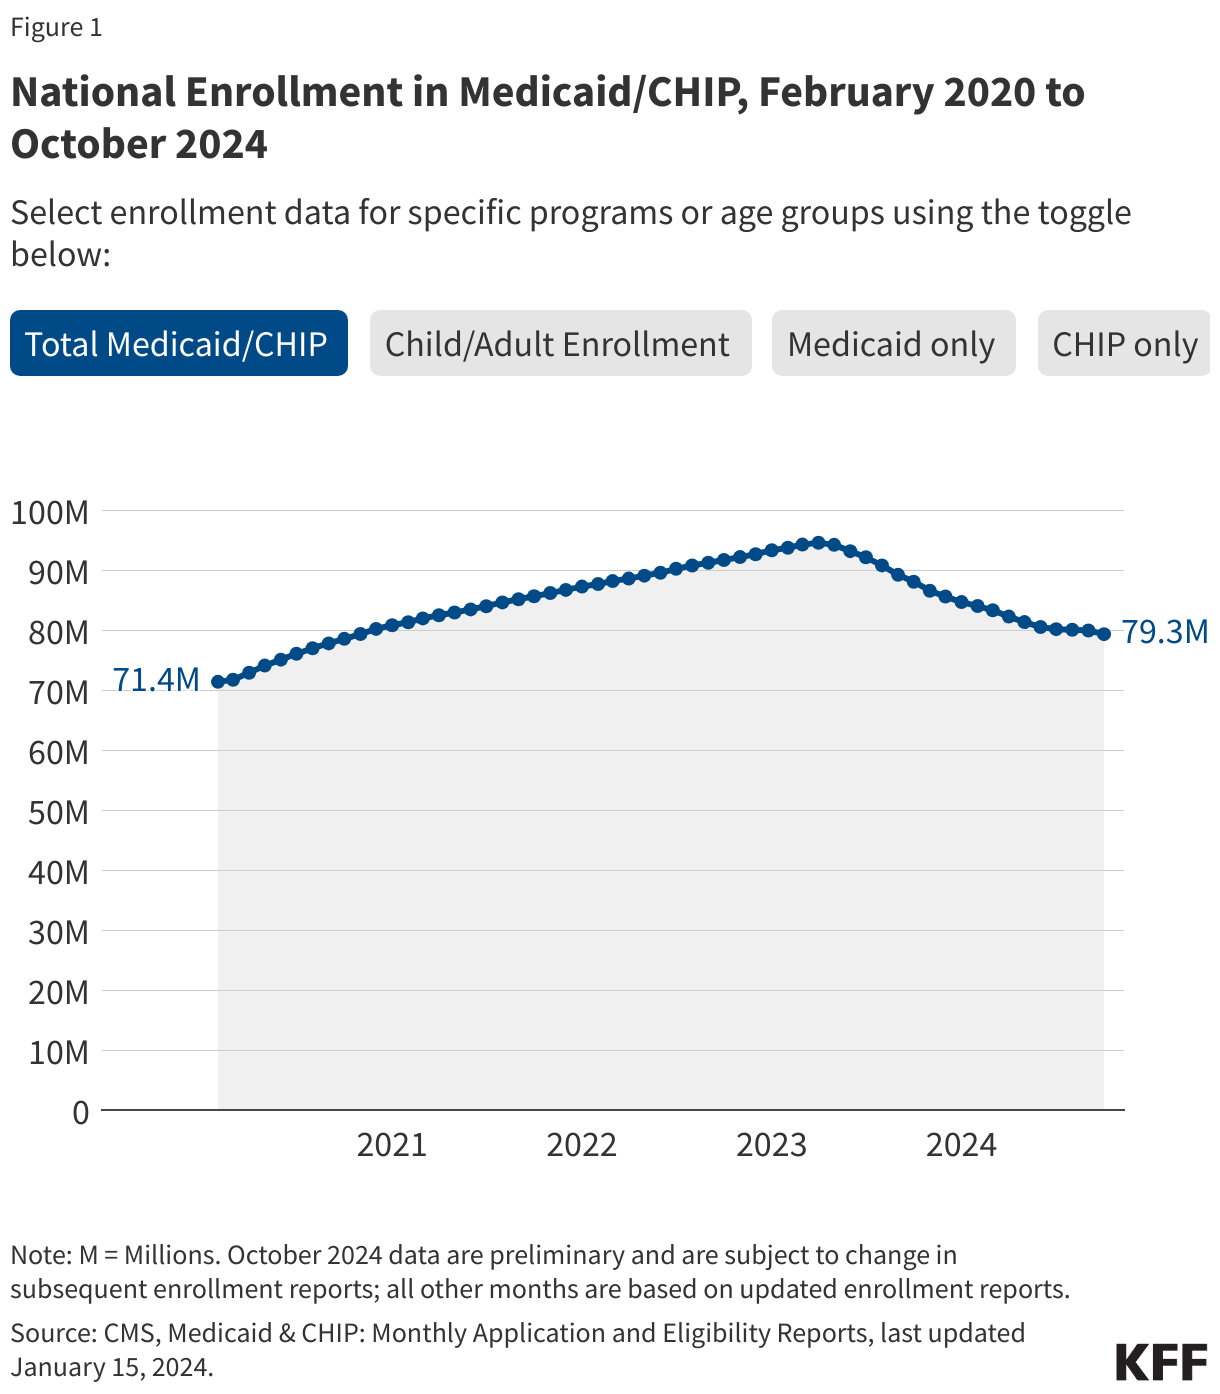
Medicaid/CHIP enrollment trends generally use February 2020 as the baseline month because it was the month prior to the start of the COVID-19 pandemic and implementation of the continuous enrollment provision. During continuous enrollment, which was in place during the three years of the pandemic, states paused Medicaid disenrollments. As a result, when the continuous enrollment provision ended in March 2023, national Medicaid/CHIP enrollment had increased to a record high of 94 million enrollees. Beginning April 1, 2023, states could resume disenrolling people after conducting renewals to verify eligibility for the program, though some states delayed the start of their unwinding periods until May, June, or July 2023. Most states took 12 months to complete unwinding renewals and nearly all states completed renewals by August 2024.
The figures below show Medicaid and CHIP enrollment from February 2020 through the most current month of available data. Some figures also include enrollment for adults and children in Medicaid/CHIP. Key enrollment trends as of February 2026 include:
Note: The data on unwinding renewal outcomes presented below were last updated on September 12, 2024; since most states have now completed the Medicaid unwinding, the information will not be updated again.
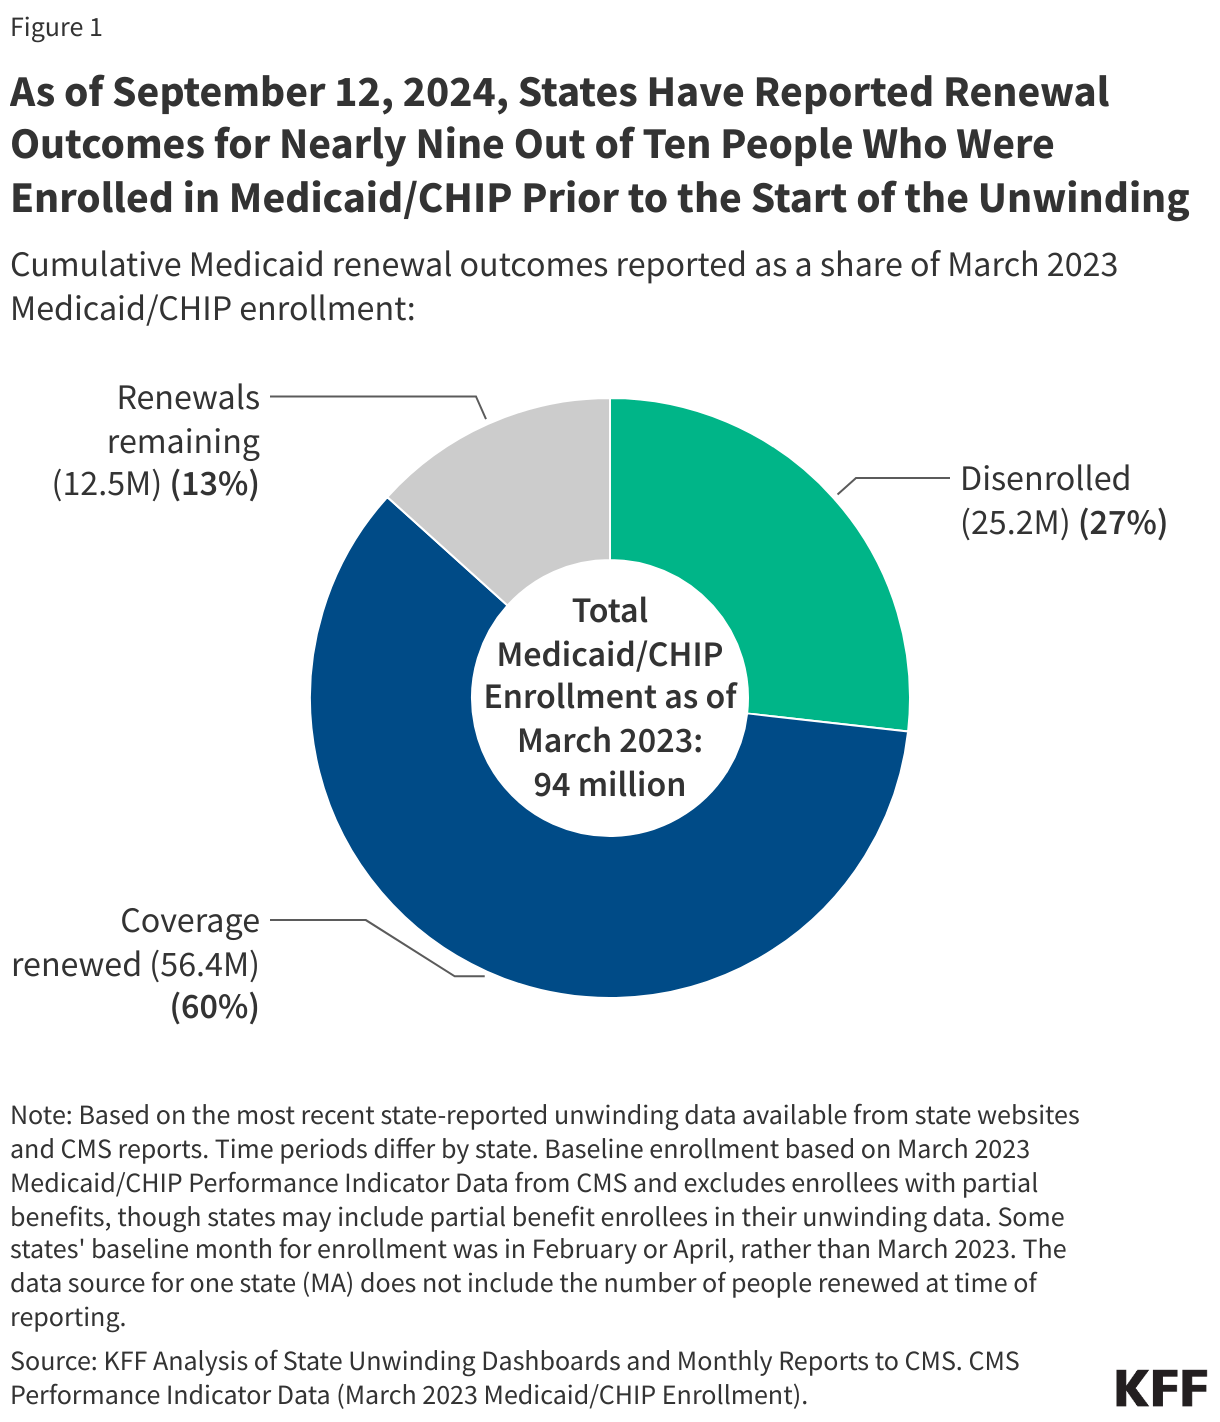
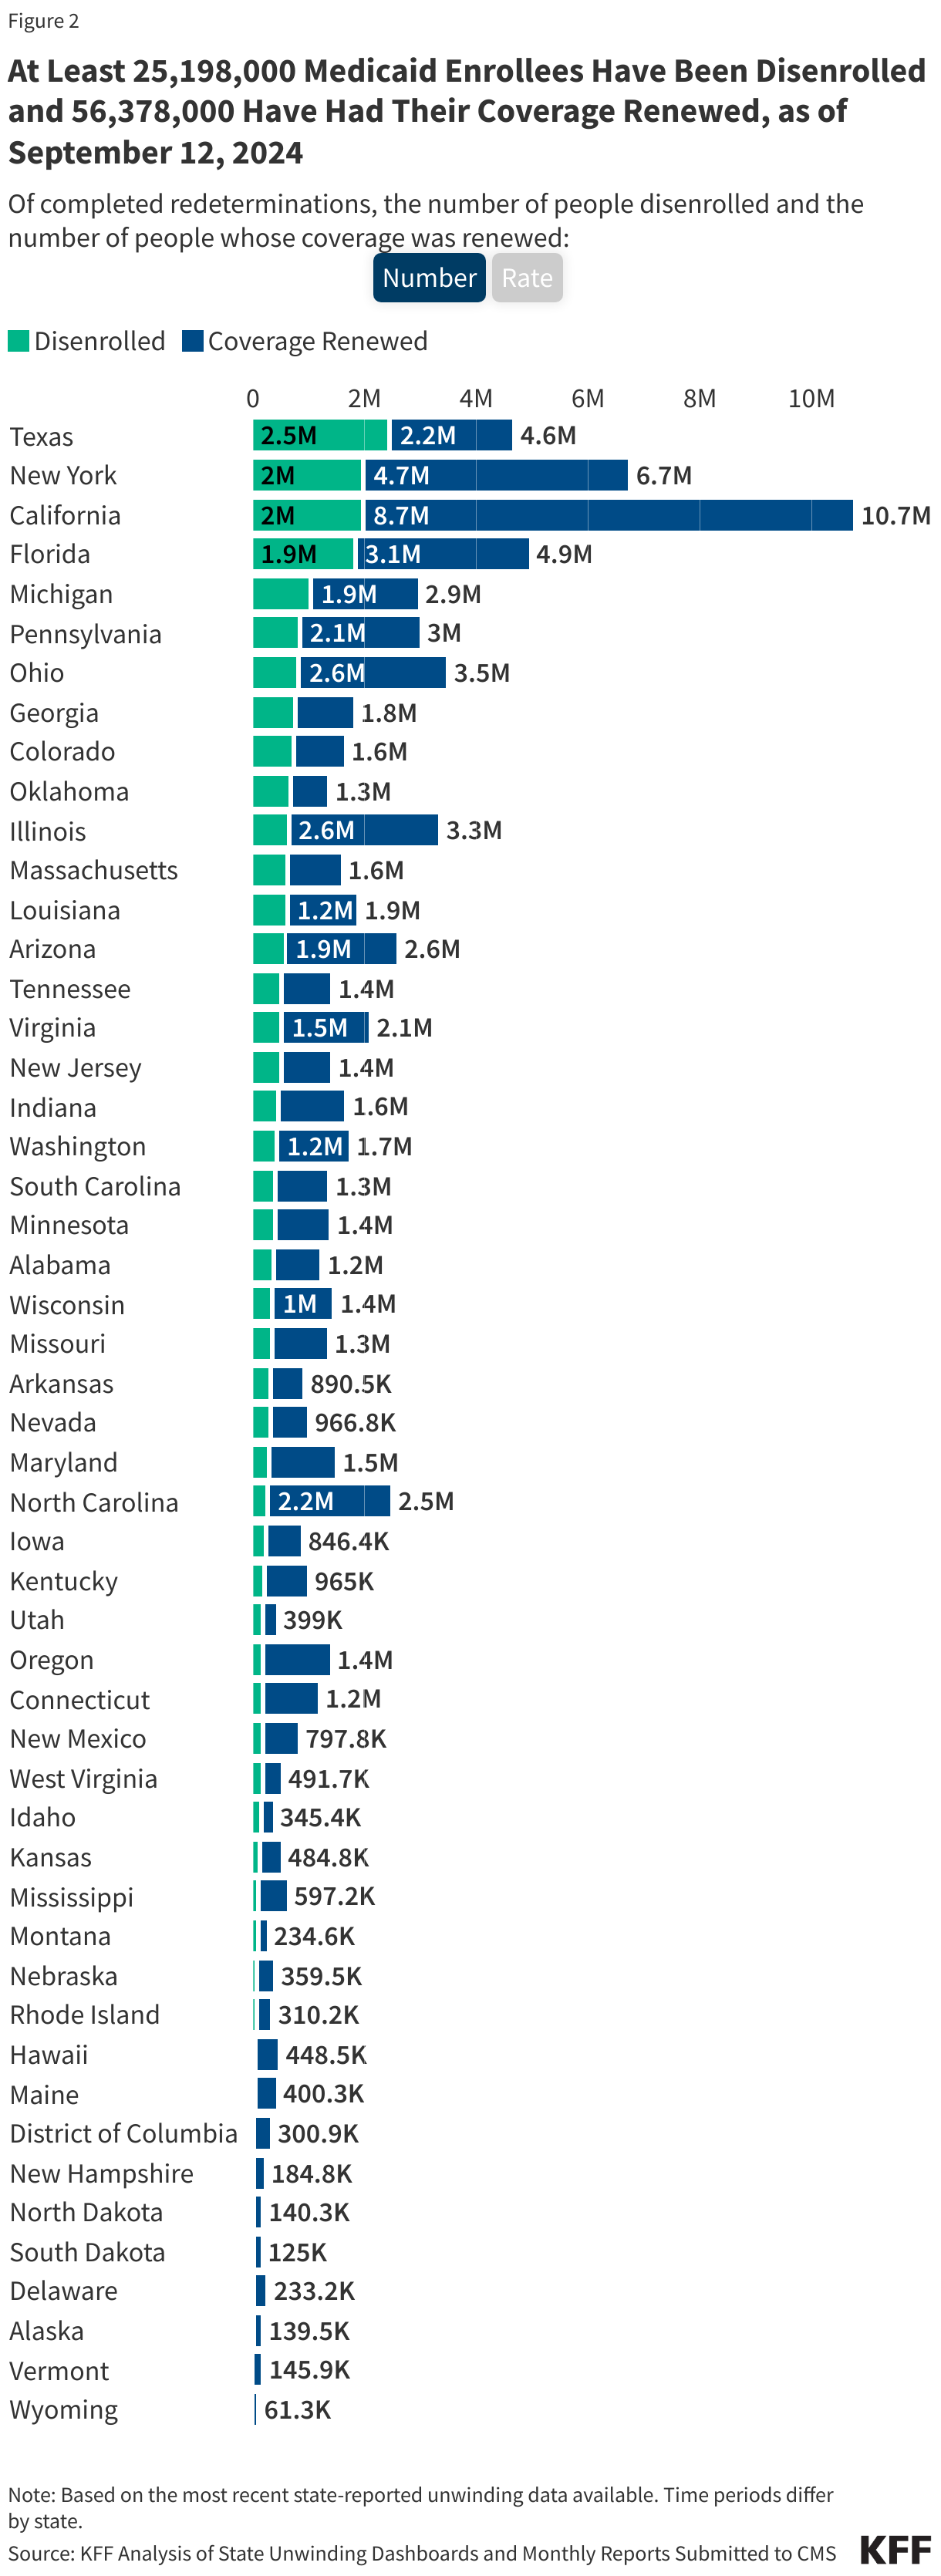
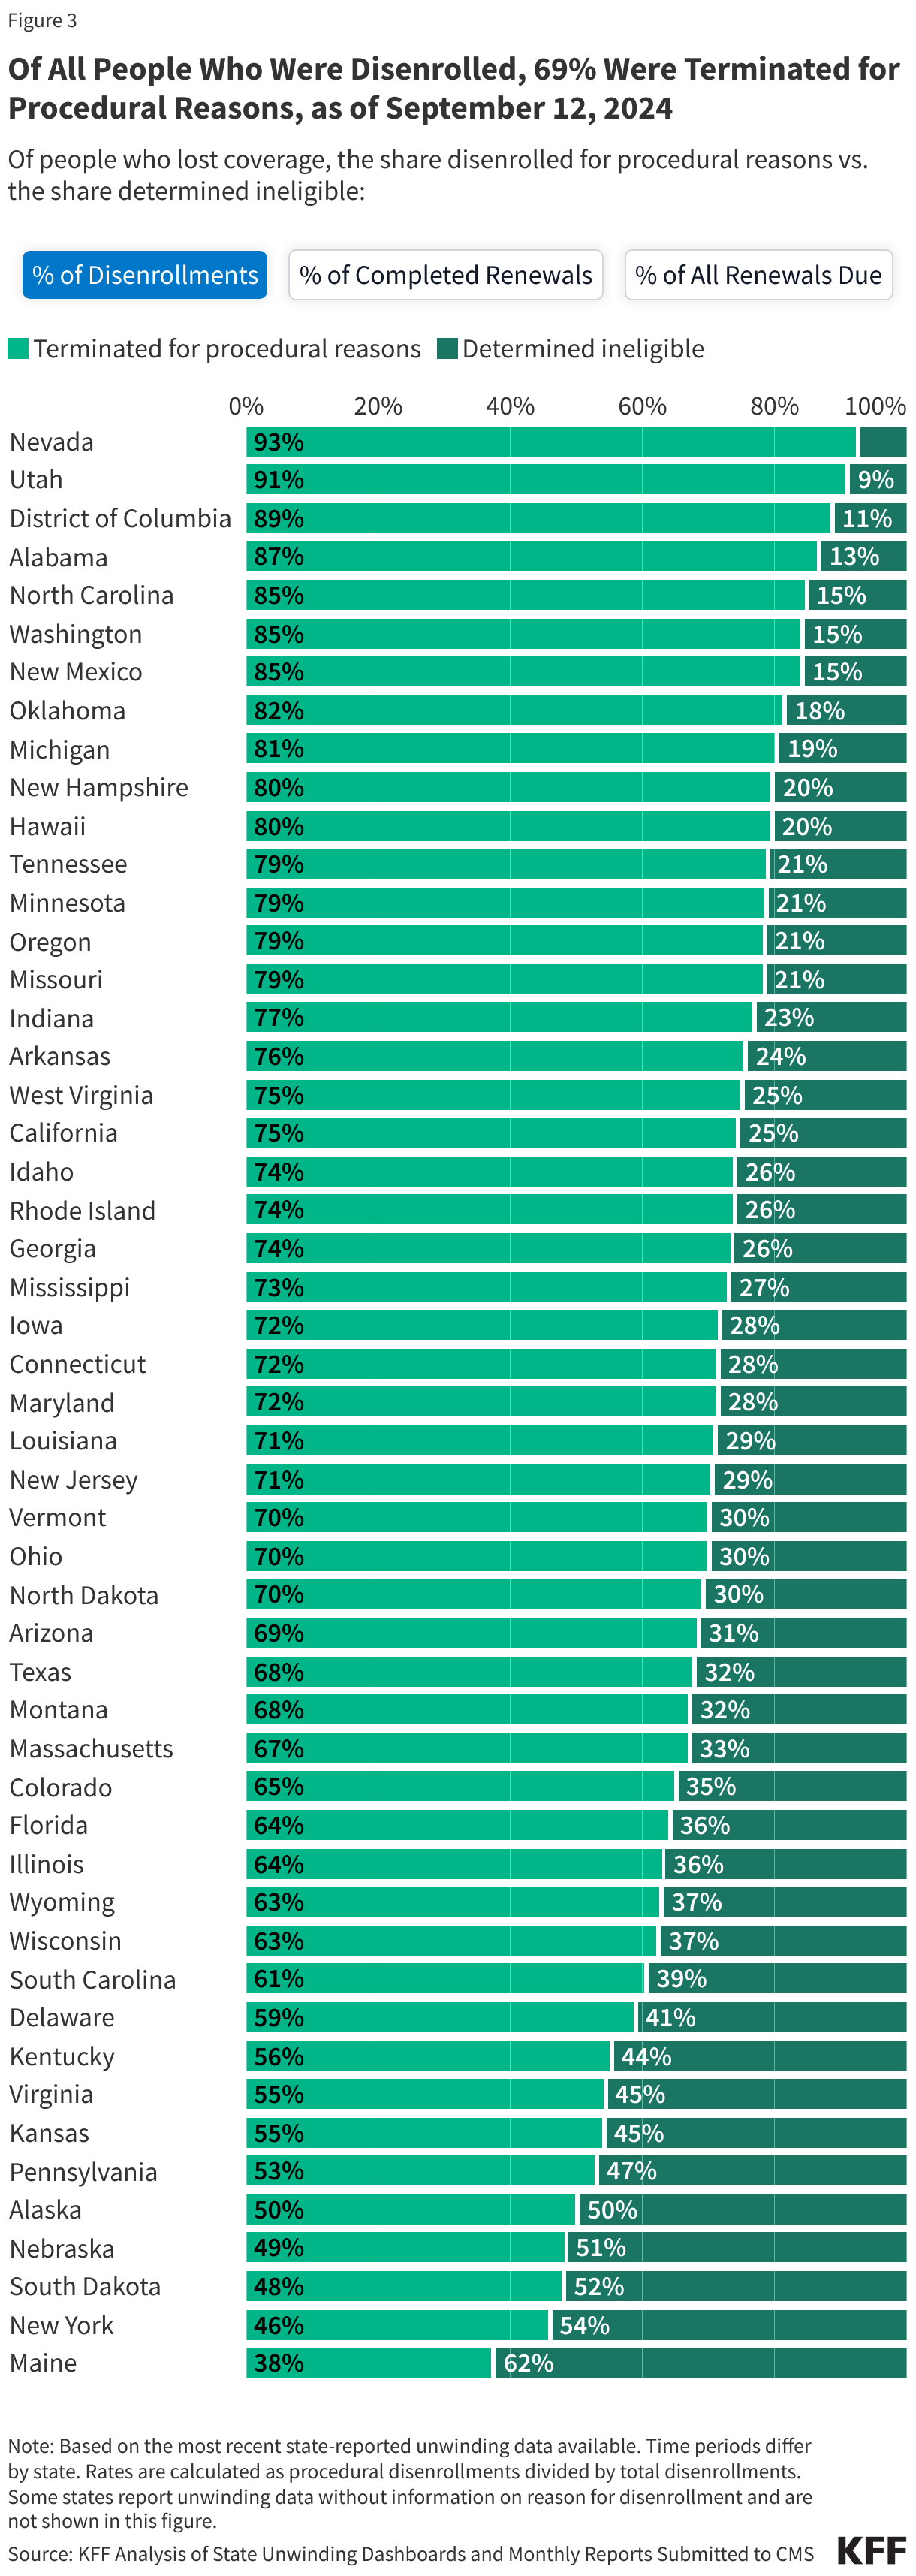
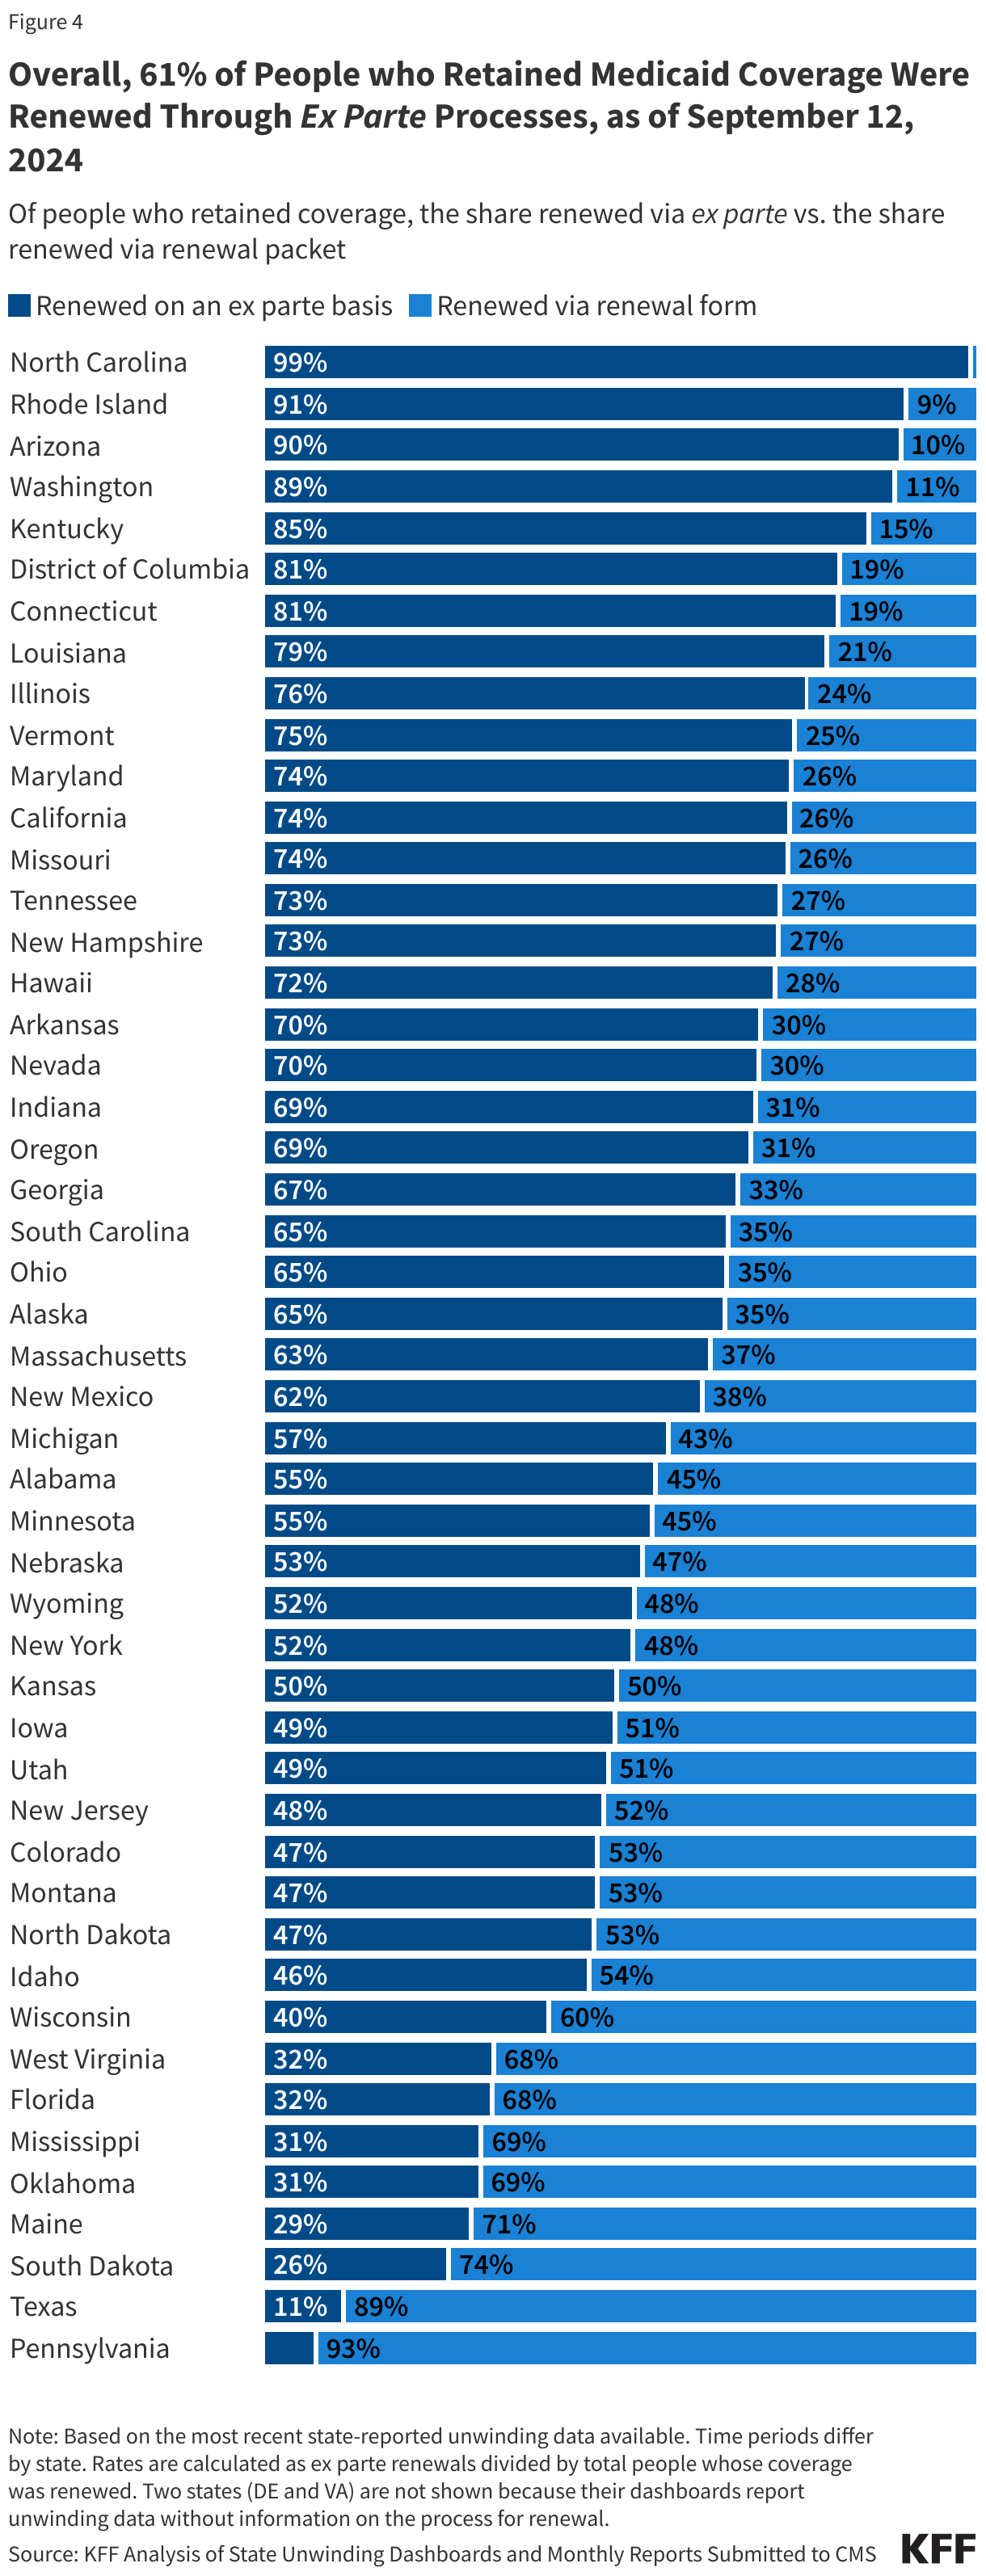
As of September 12, 2024 and with nearly complete unwinding data for most states:
The data on unwinding-related renewal outcomes presented in this section rely primarily on monthly reports that states were required to submit to the Centers for Medicare & Medicaid Services (CMS) during the unwinding period. The data also reflect updates to the monthly reports that states submit three months after the original report submission to account for the resolution of pending cases and any other changes in renewal metrics. For 13 states, data were pulled from dashboards or reports published on state websites that provide more complete information, and for a few additional states, updated monthly reports were pulled from state websites because they were more timely than what is reported on the CMS website.
To view archived data for specific states, click on the State Data - Archived tab.
(Note: The first tab in the figure below calculates procedural disenrollment rates using total disenrollments as the denominator. The second tab shows these rates using total completed renewals, which include people whose coverage was terminated as well as those whose coverage was renewed, as the denominator. And finally, the third tab calculates the rates as a share of all renewals due, which include completed renewals and pending cases.)
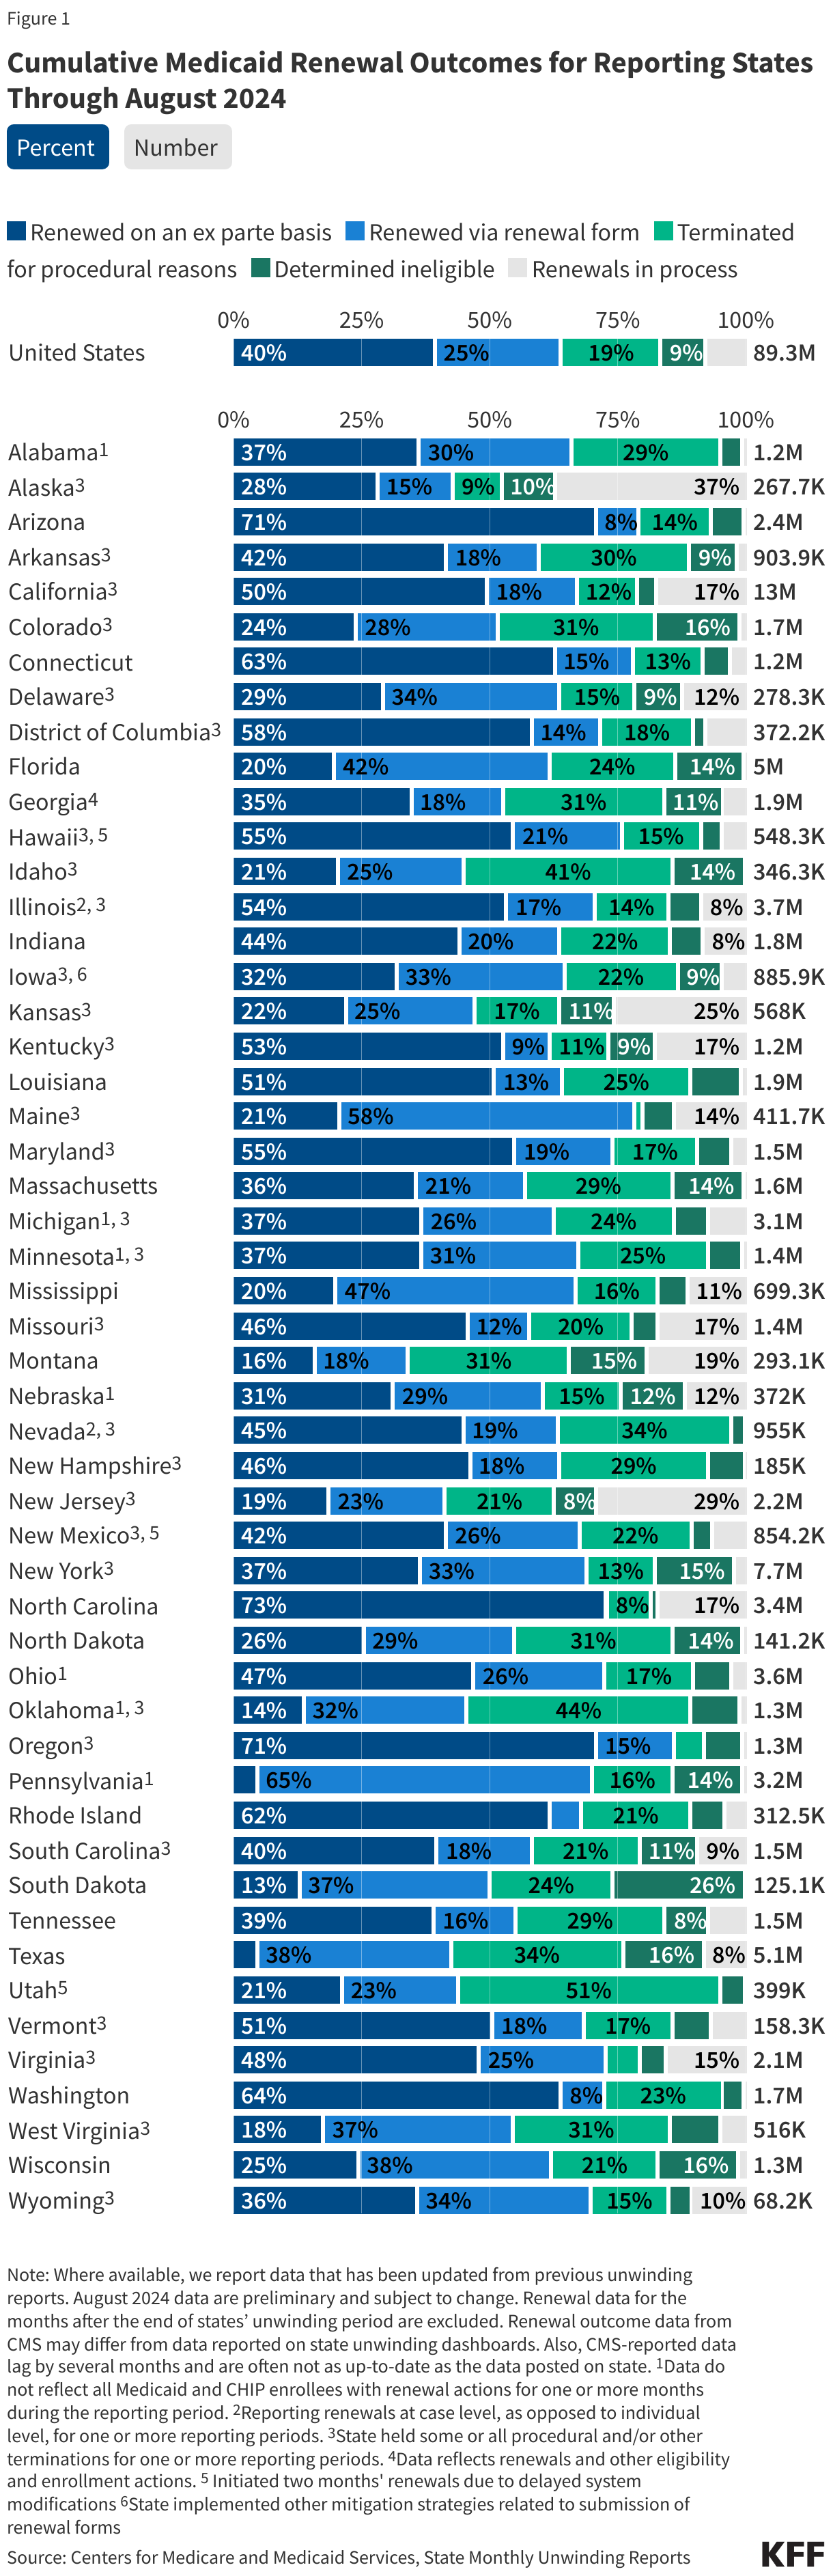
The data presented here are cumulative unwinding metrics published by CMS. These counts and percentages may differ from the above data, which present renewal metrics reported on state websites when state-reported data are more complete.
Figure 1 below shows cumulative renewal data reported by CMS during states’ unwinding periods. Renewal data for the months after the end of states’ unwinding period are excluded. The data reflect updated unwinding data reported by states three months after the original monthly reports as they become available.
For questions about this tracker, please contact KFFTracker@kff.org
Note: The state data presented below were last updated on September 12, 2024; since most states have now completed the Medicaid unwinding, the information will not be updated again.
The data presented here provide state-level data on enrollment trends and renewal outcomes during the unwinding period. Figure 1 shows total Medicaid enrollment by month starting in January 2023 and, once disenrollments resumed in a state, the cumulative percent change in Medicaid enrollment relative to the month before Medicaid disenrollments started (this baseline month will differ across states). Figure 2 shows renewal metrics for each month of a state’s unwinding period (or cumulative data for the unwinding period for some states).
For total national Medicaid enrollment, click on the Enrollment Data tab.
On April 30, 2026, North Carolina Governor Josh Stein signed legislation that includes Medicaid policy changes and closes an estimated $319 million shortfall in funding for the state’s Medicaid program for FY 2026. Many of the legislation’s Medicaid policy changes are related to implementation of the 2025 federal reconciliation law. The 2025 reconciliation law requires states to condition Medicaid eligibility for adults in the Affordable Care Act (ACA) Medicaid expansion group and enrollees in partial expansion waiver programs (Georgia and Wisconsin) on meeting work requirements starting January 1, 2027. The 2025 reconciliation law also limits states’ ability to raise the state share of Medicaid spending through provider taxes, restricts state-directed payments (SDPs) to hospitals, nursing facilities, and other providers, and increases barriers to enrolling in and renewing Medicaid coverage. As states are preparing to implement the reconciliation law provisions, many states are facing more tenuous budget situations with slowing revenue growth and broader reductions in federal funding.
This policy watch examines the current budget context in North Carolina, the state’s recently passed legislation, the state’s Medicaid Advisory Committee (MAC) meetings, and data from KFF’s Medicaid work requirements tracker to provide initial insight into how North Carolina is preparing to implement certain Medicaid provisions of the 2025 reconciliation law and how other policy changes may affect coverage and access to care. While some of the issues North Carolina is facing are unique to that state, others are likely to be faced by other states as they implement federal changes to Medicaid in the midst of other fiscal challenges.
North Carolina is facing a more tenuous fiscal climate like in other states, and state legislators have not yet enacted a comprehensive state budget for the FY 2025-27 biennium. In the past year, revenue volatility and rising costs have led to slowing state revenue growth following a period of record-breaking revenue and expenditure growth for states after the initial pandemic-induced economic downturn. In North Carolina, scheduled tax cuts have been projected to drive declines in state revenue, and debates over whether to proceed with the cuts have contributed to a budget stalemate in the legislature.
In August 2025, Governor Stein signed a stopgap funding bill that appropriated $600 million from the state general fund for Medicaid, but it left a $319 million shortfall for FY 2026 in funding for the cost of services for non-expansion (traditional) enrollees. The shortfall and budget stalemate led to rate cuts and the elimination of GLP-1 coverage, both of which were eventually restored. The Medicaid agency ceased “Healthy Opportunities Pilots” program services in FY 2026 due to a lack of appropriations. The pilots covered certain non-medical services that target social needs, including housing, nutrition, transportation, and interpersonal relationship supports to specific and limited enrollees, and evaluations of the “Healthy Opportunity Pilots” 1115 waiver showed lower costs over time and largely positive outcomes. The Medicaid agency also implemented changes to reduce administrative expenses, including reducing temporary staff and contractors, ending certain contracts, pausing quality improvement projects, and scaling back compliance and quality oversight activities. The legislation signed in April 2026 appropriated $319 million to close the shortfall for FY 2026 and made changes aimed at addressing financing pressures associated with new federal limits on provider taxes, which the state uses to help finance its Medicaid expansion and hospital state directed payment program (which increases payment rates for hospitals).
North Carolina’s new legislation includes more restrictive standards for how the state will implement work requirements than is required in current law. At a minimum, the 2025 reconciliation law requires states to look back one month immediately preceding the application month and one month between renewal periods to confirm compliance with the requirements. North Carolina’s legislation requires the state to confirm compliance for the three months preceding the application month. At renewal, the state must confirm compliance for at least three of the six months since the last determination of eligibility. The North Carolina legislation also prohibits the acceptance of self-attestation as the only evidence in verification of eligibility requirements (unless required by federal law or regulation, or pursuant to a court order). States await guidance from CMS as to whether self-attestation of medical frailty, parent/caretaker status, or other exemptions or work status can be accepted, but most states report plans to accept self-attestation if allowed.
The legislation increases the frequency of data checks to identify changes in circumstances for Medicaid enrollees from quarterly to monthly. The state will review information on earned and unearned income, employment status and changes in employment, residency status, enrollment status for other public assistance programs administered by the state and outside of the state, financial resources, incarceration status, and lottery and gambling winnings. States are required to follow up on reported changes that potentially affect eligibility and give individuals an opportunity to respond before taking adverse action. In North Carolina, when data indicates an individual is no longer eligible, enrollees only have 10 days in advance of case closure to submit documentation verifying ongoing eligibility. Increasing the frequency of periodic data checks with insufficient response times can lead to procedural disenrollments and exacerbate churn.
The Medicaid agency will be required to set Medicaid copayments at the highest allowable amounts for both traditional Medicaid enrollees and ACA expansion enrollees. Current federal rules limit cost sharing in Medicaid because of enrollees’ low income and limited ability to pay out of pocket costs. The maximum allowable cost sharing varies by type of service and enrollee income. North Carolina has set current cost sharing amounts, regardless of enrollee income, at $4 per service. Starting July 1, 2027, the legislation requires the Medicaid agency to increase current cost sharing amounts for services where the maximum allowable amount is more than $4 and to increase cost sharing for ACA expansion adults with income 100-138% FPL to up to 10% of the cost of the service, except for prescription drugs and non-emergency use of the emergency department. Beginning in October 2028, when states are required to implement mandatory cost sharing of up to $35 per service for ACA expansion adults with income between 100%-138% FPL, the state will be required to set cost sharing amounts at $35 per service, except for prescription drugs, for all non-exempt services for this group.
The legislative text implementing the changes to Medicaid eligibility for certain lawfully residing immigrants effectively ends the state’s long-standing optional Medicaid coverage for lawfully residing children and pregnant immigrants without a five-year waiting period. The law limits Medicaid coverage for immigrants to coverage that is required under federal law. However, North Carolina is one of 40 states that have taken up the option to extend Medicaid and/or CHIP coverage to children and/or pregnant adults who are lawfully residing and waive the five-year wait for these groups. The 2025 reconciliation law imposed additional eligibility restrictions for many lawfully present immigrants but allows states to maintain the option to cover lawfully residing children and pregnant adults. By limiting coverage for immigrants to only what is required by federal law, the state law effectively ends this optional coverage as of October 1, 2026. In a recent Medicaid Advisory Committee (MAC) meeting, the Medicaid agency indicated it was working with the legislature to make “corrections” and restore coverage for these populations.
The legislation requires the Medicaid agency to report certain Medicaid applicants and enrollees for whom it cannot verify citizenship or “satisfactory” immigration status to the Department of Homeland Security. These include applicants and enrollees who, after a reasonable opportunity period, have not verified satisfactory immigration status or whose final verification indicates that they do not have a satisfactory immigration status and are not lawfully present. This group would include those found ineligible based on immigration status and individuals receiving Emergency Medicaid services (where Medicaid pays hospitals for emergency care provided to ineligible immigrants who would otherwise be eligible for Medicaid based on their income).
The legislation increases intergovernmental transfers (IGTs) from public hospitals, reducing reliance on the state’s hospital taxes for financing the nonfederal share of Medicaid spending. The 2025 reconciliation law imposes significant new restrictions on states’ ability to generate Medicaid provider tax revenue, including prohibiting all states from establishing new provider taxes or from increasing existing taxes, as well as reducing existing provider taxes for states that have adopted the ACA Medicaid expansion. North Carolina uses provider taxes to help finance the nonfederal share of Medicaid spending. State law requires the nonfederal share for the expansion program to be fully funded by certain non-general fund sources, including hospital taxes and hospital IGTs, and requires the end of expansion coverage if those sources cannot fully fund the nonfederal share. The state estimates $14.3 million in one-time administrative costs for the current state fiscal year and $44.4 million in recurring annual administrative costs (including both state and county expenditures) for the expansion program to implement work requirements and six-month eligibility redeterminations that existing financing mechanisms did not account for. The increased public hospital IGTs aim to offset the financing of some of the existing costs under the state’s hospital tax, as well as to help finance the new administrative costs.
By increasing reliance on IGTs as a financing source, the state may aim to retain higher hospital SDPs under new federal provider tax limits, but new federal requirements for state directed payments are expected to require further changes. North Carolina’s Healthcare Access and Stabilization Program (HASP), a hospital SDP program launched alongside Medicaid expansion in 2023, is also financed through hospital taxes and IGTs. An earlier state report indicated the new federal provider tax limits would eliminate all or most of HASP SDPs. The state has been using HASP payments to incentivize hospitals to relieve medical debt, and as of October 2025, more than $6.5 billion in debt had been relieved for more than 2.5 million North Carolinians under the initiative.
There is significant uncertainty about how federal regulations and state legislation may affect the state’s plan for financing the nonfederal share of Medicaid spending, including for the Medicaid expansion and HASP. New proposed rules on state directed payments and forthcoming provider taxes may affect the state’s financing plans. The state’s legislation created a “trigger” to end the new funding should HASP payments fall below certain thresholds or a change in federal law or regulation result in at least a 20% decrease to IGTs.
For coverage of Medicare benefits, people face a choice between traditional Medicare and private Medicare Advantage plans. While there are many distinguishing features between these coverage types, one key benefit of Medicare Advantage is an annual cap on out-of-pocket costs for medical benefits, which traditional Medicare does not include. In 2026, the out-of-pocket limit for Medicare Advantage plans may not exceed $9,250 for in-network services and $13,900 for a combination of in-network and out-of-network services, but plans can have lower out-of-pocket limits than the maximum.
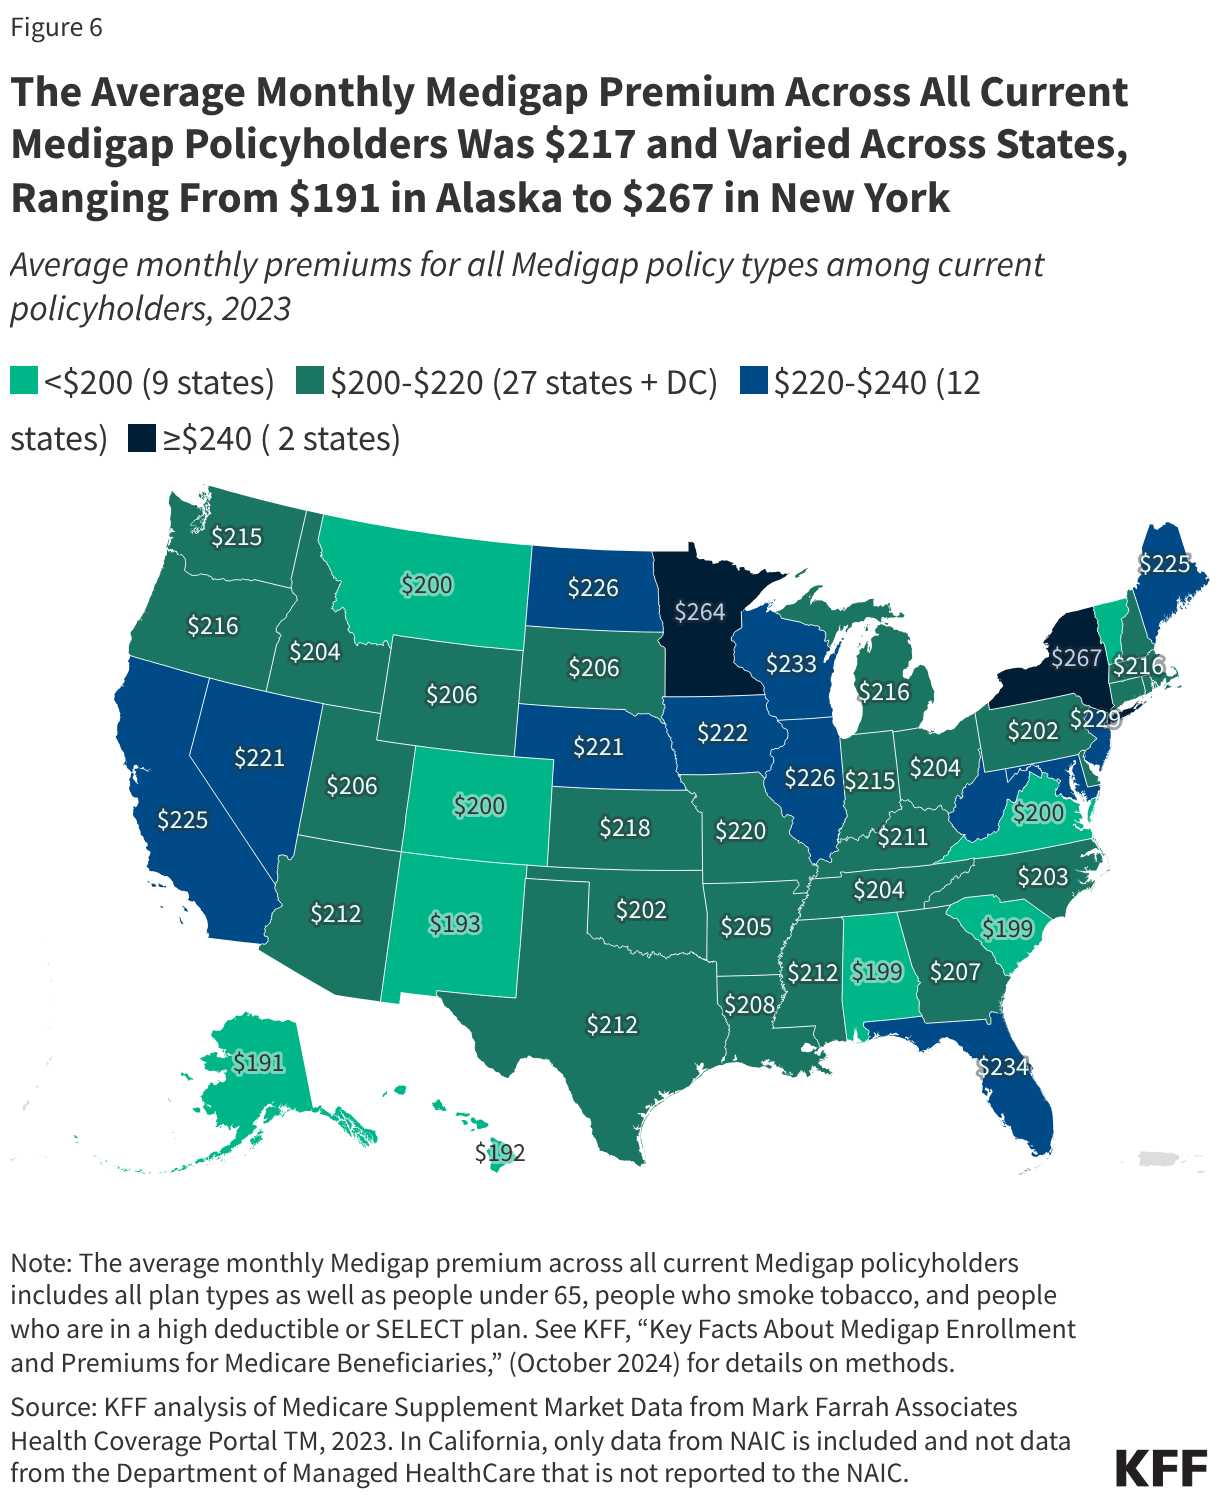
Policymakers have long considered whether to add a similar out-of-pocket cap in traditional Medicare. In 1988, Congress enacted a Medicare out-of-pocket cap, but the law was repealed one year later principally due to concerns about the financing mechanism. The Medicare Payment Advisory Commission (MedPAC) has recommended changes in traditional Medicare to give beneficiaries better protection against high out-of-pocket spending, including an out-of-pocket cap as part of a broader redesign that also includes combining Part A and Part B deductibles and simplifying cost sharing. Traditional Medicare remains the only major form of health insurance that does not include a cap on out-of-pocket spending, though most beneficiaries in traditional Medicare have additional financial protection through supplemental coverage, including Medicaid, employer- or union-sponsored retiree coverage, or a Medigap policy (which may require additional premiums).
This brief analyzes out-of-pocket limits in Medicare Advantage plans in 2026, variation by plan type, the distribution of enrollees facing different out-of-pocket limits, and trends over time. Of note, this analysis does not show the share of enrollees that reach their plan’s out-of-pocket limit in any year because spending data are not available. The analysis includes Medicare Advantage plans generally available for individual enrollment, reflecting coverage for 21.3 million Medicare beneficiaries in 2026, excluding special needs plans and employer-and union-sponsored group plans (See Methods for details).
The average out-of-pocket limit faced by Medicare Advantage enrollees in 2026 is $5,421 for in-network services and $9,825 for in-network and out-of-network services combined (Figure 1). These averages are lower than the maximum allowable out-of-pocket limits ($9,250 and $13,900, respectively).
Differences in out-of-pocket limits may reflect how Medicare Advantage plans choose to allocate rebate dollars, which are extra payments they receive from the federal government beyond the cost of providing Part A and Part B services. Plans may use rebates to reduce beneficiary cost sharing, including lowering out-of-pocket limits, but they can also use these funds for other purposes, such as offering supplemental benefits not covered by traditional Medicare, offering a rebate against the Part B premium, or lowering Part D premiums.
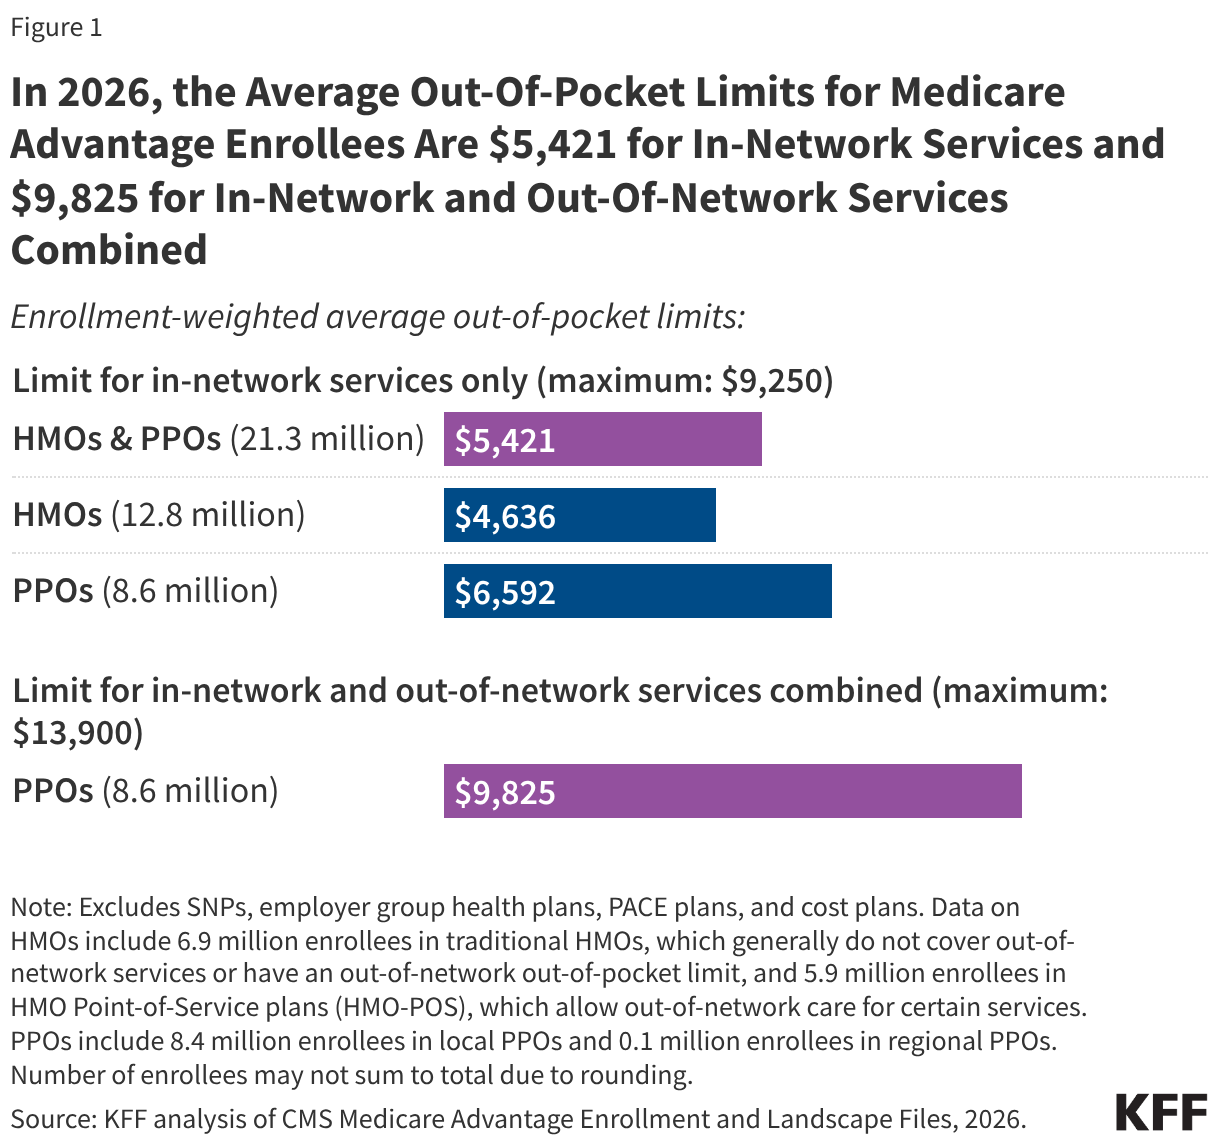
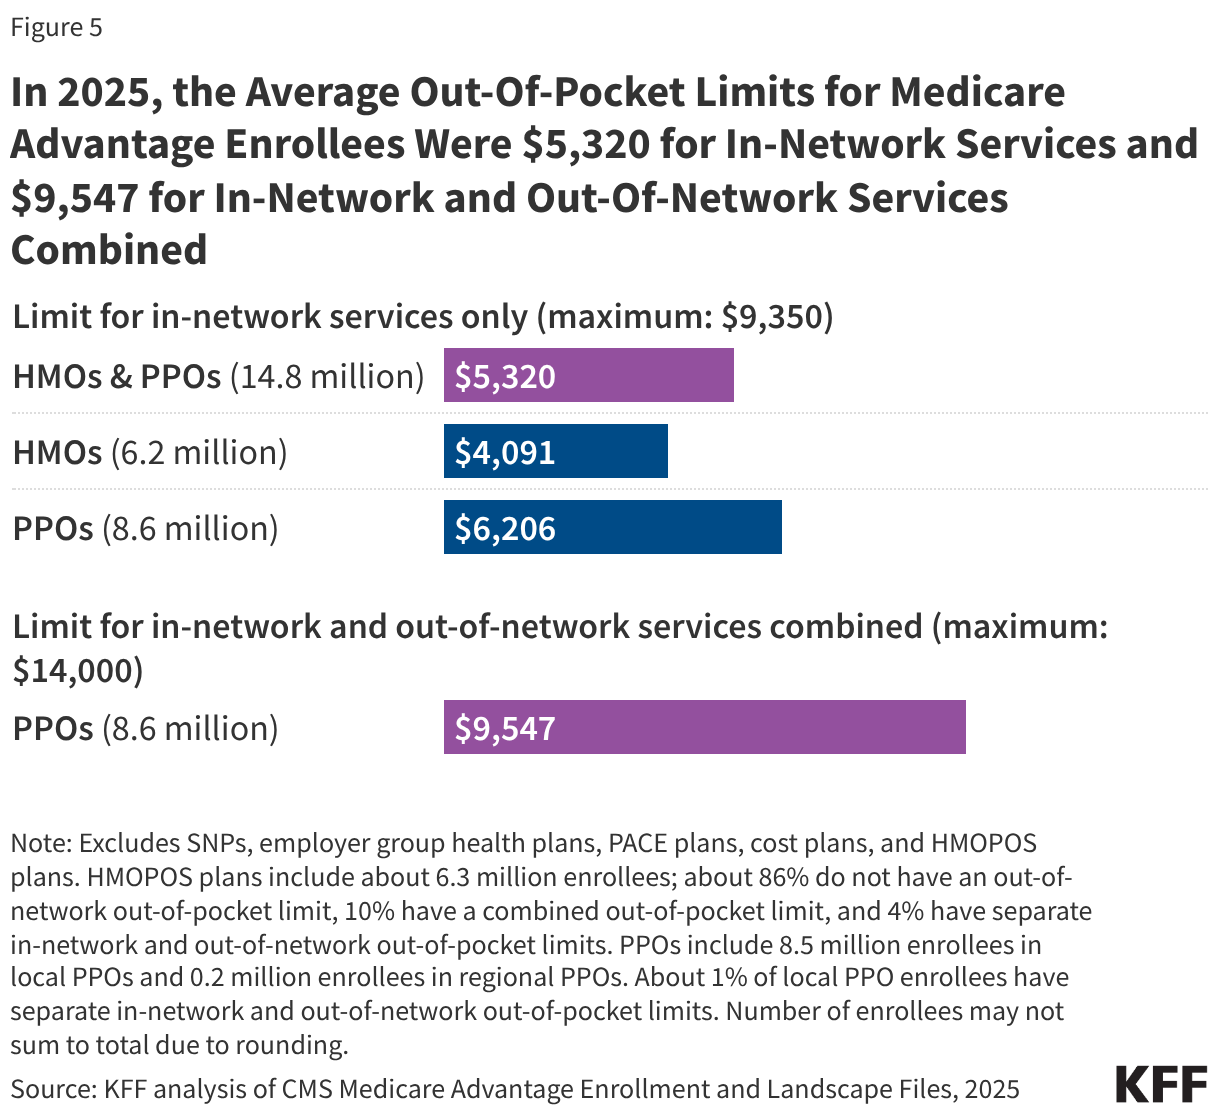
Out-of-pocket limits for in-network services vary by plan type. HMOs, which have 12.8 million Medicare Advantage enrollees in 2026, generally offer no coverage of services from out-of-network providers, but offer a lower out-of-pocket limit for in-network services than PPOs. PPOs, which have 8.6 million enrollees in 2026, cover services delivered by in-network and out-of-network providers, but require higher cost sharing for out-of-network providers. While PPO enrollees have broader access to out-of-network providers than HMO enrollees, they also face a higher out-of-pocket limit, even for in-network services. Specifically, the average enrollment-weighted out-of-pocket limit for in-network services is $6,592 for PPOs and $4,636 for HMOs.
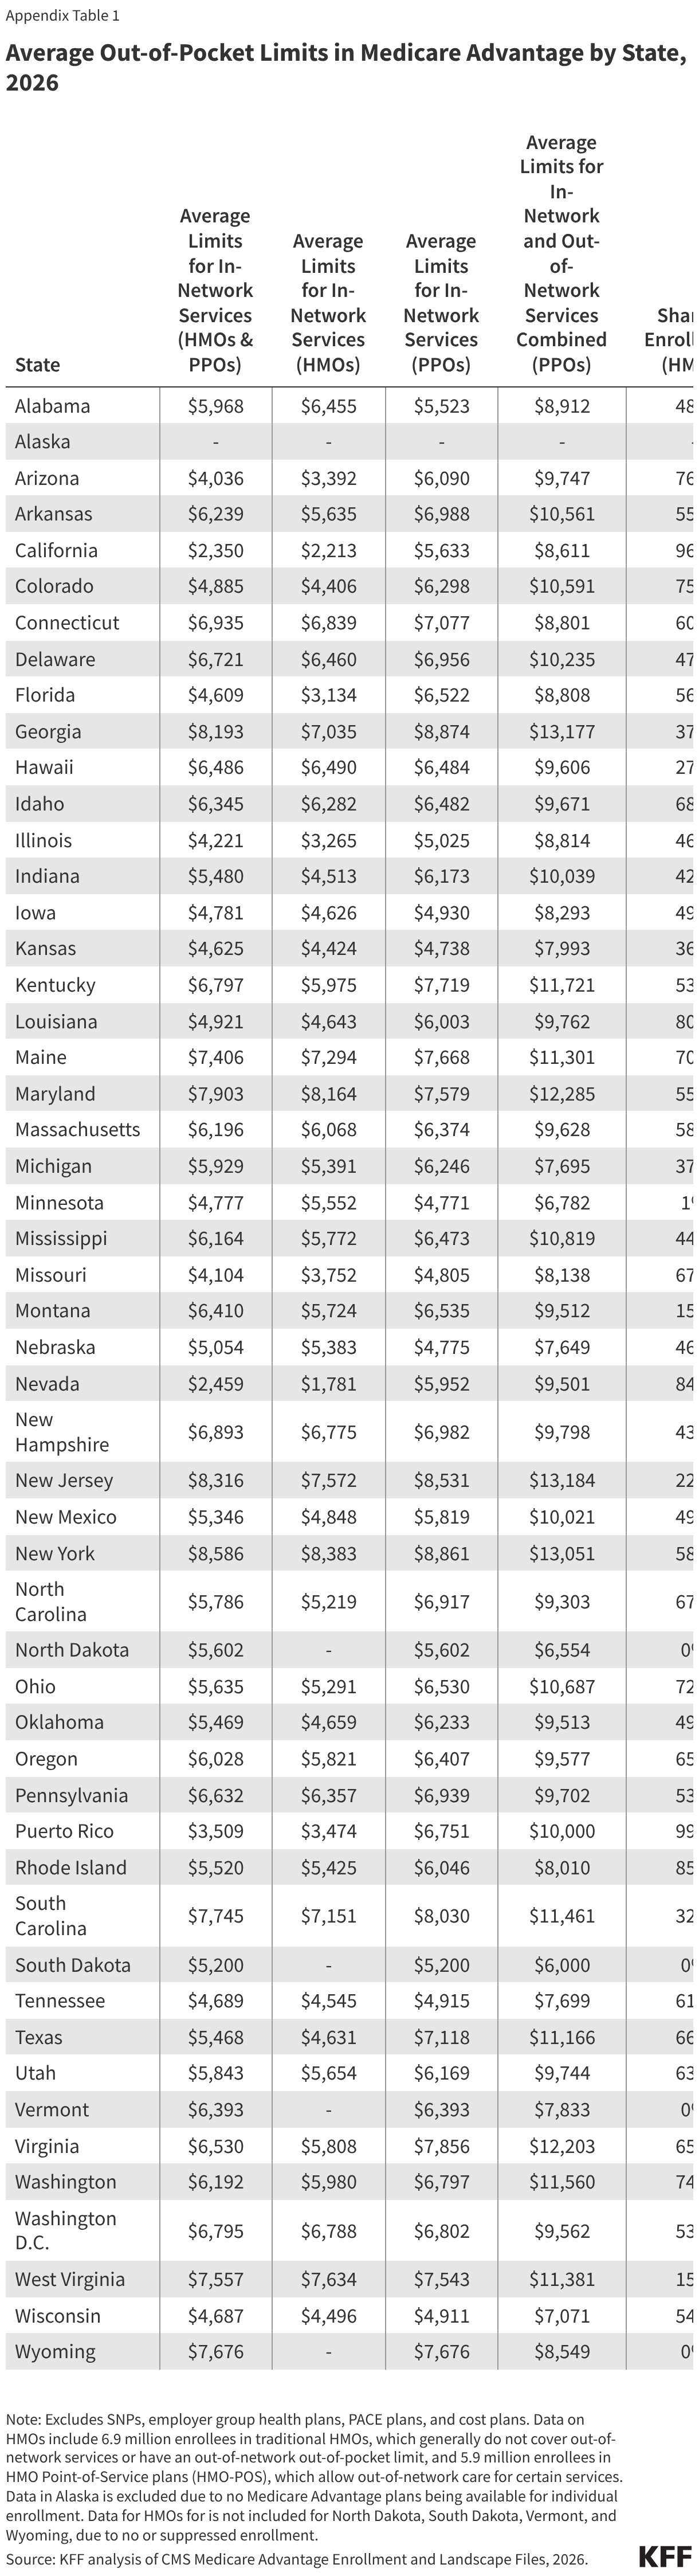
The distribution of enrollment between HMOs and PPOs, as well as the average out-of-pocket caps for in-network services by type of plan, vary across states (Appendix Table 1). Due in part to PPOs (which have higher average in-network out-of-pocket limits than HMOs) comprising a larger share of enrollment in rural areas, the average out-of-pocket cap is about $800 higher for Medicare Advantage enrollees in rural areas than in urban areas ($6,078 vs $5,291).
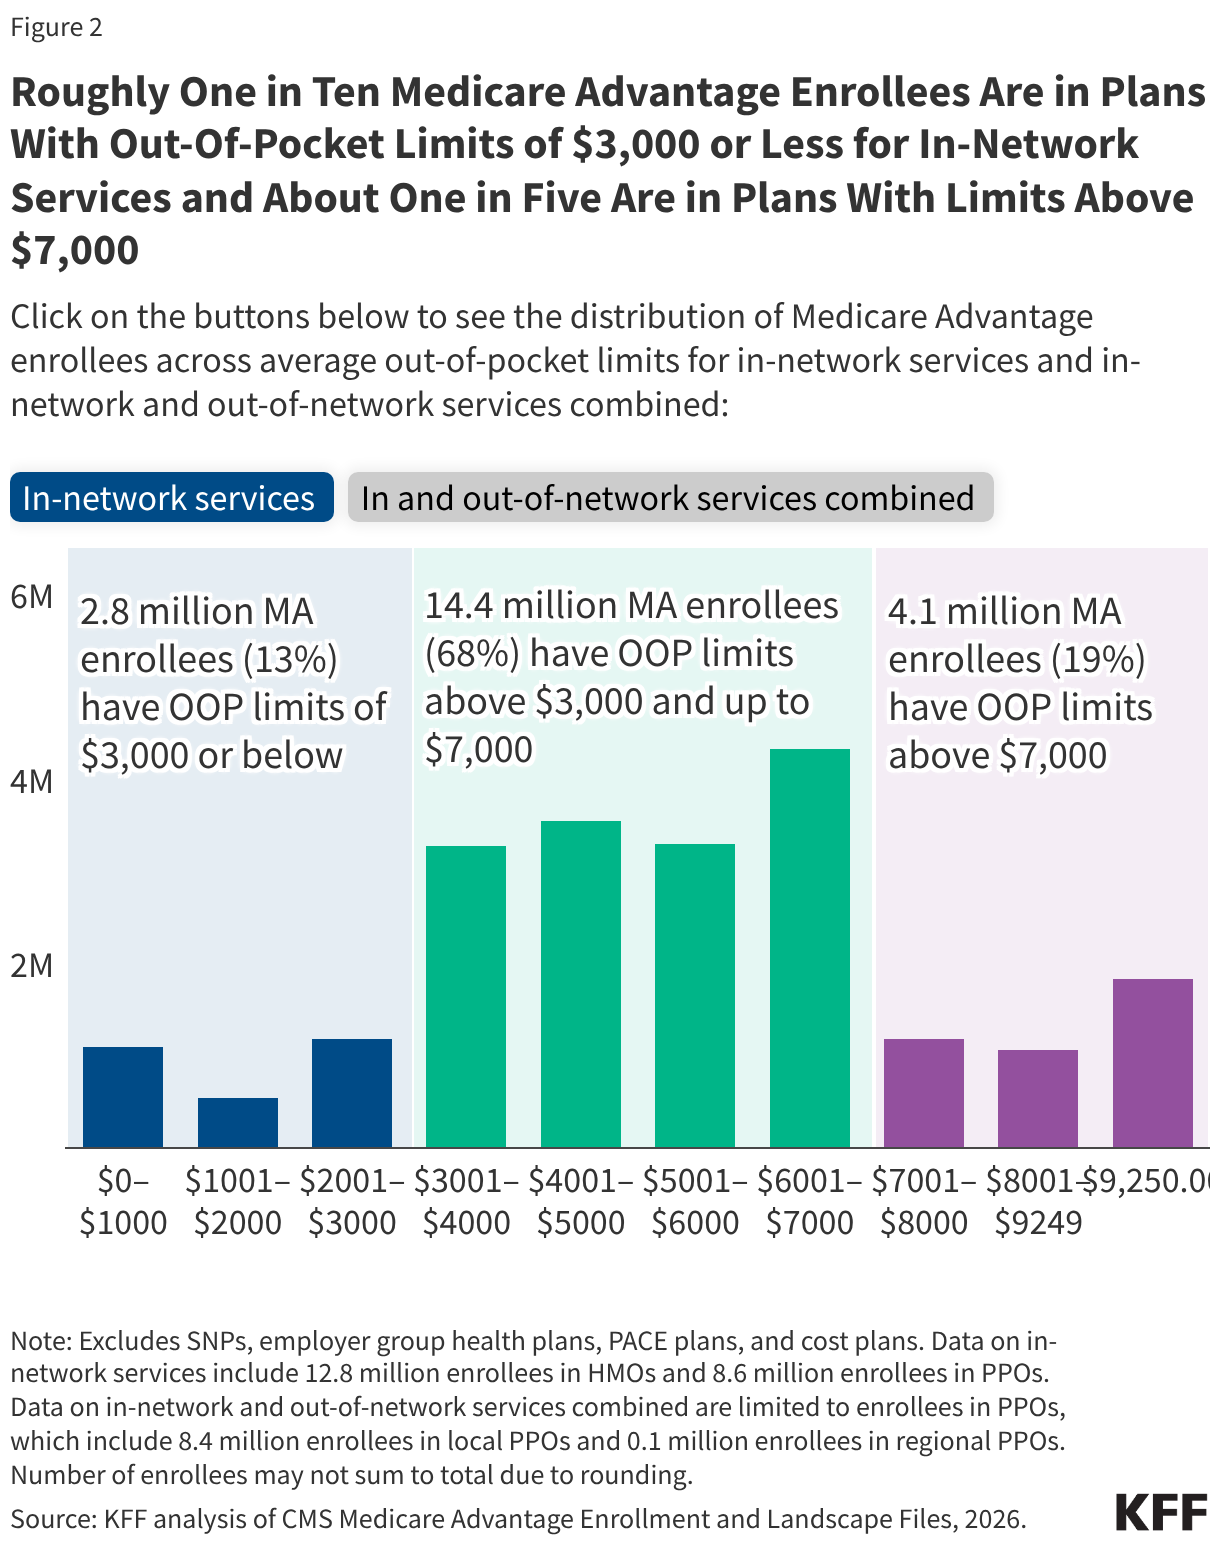
Among all Medicare Advantage enrollees in individual plans, just over one in ten (13%, 2.8 million) are in plans with out-of-pocket limits of $3,000 or less for in-network services (Figure 2). Nearly all of these enrollees (99%) are in an HMO. More than two-thirds (68%, 14.4 million) of Medicare Advantage enrollees are in plans with out-of-pocket limits above $3,000 and up to $7,000. About one in five (19%, 4.1 million) are in plans with limits above $7,000, including 1.8 million enrollees who are in a plan with the maximum in-network out-of-pocket limit of $9,250. PPOs enrollees account for the majority of these enrollees at the maximum cap (66%).
Among the 8.6 million Medicare Advantage enrollees in PPOs, about one in ten (9%) have a combined limit for in-network and out-of-network services at or below $6,000. More than two-thirds (66%; 5.7 million) of enrollees are in plans with a combined limit for in-network and out-of-network services between $6,000 and $12,000. One quarter (25%; 2.1 million) are in plans with an out-of-pocket limit for in-and out-of-network services combined above $12,000, including 1.8 million enrollees in plans with the maximum out-of-pocket limit for in-and out-of-network services combined ($13,900) (Figure 2).
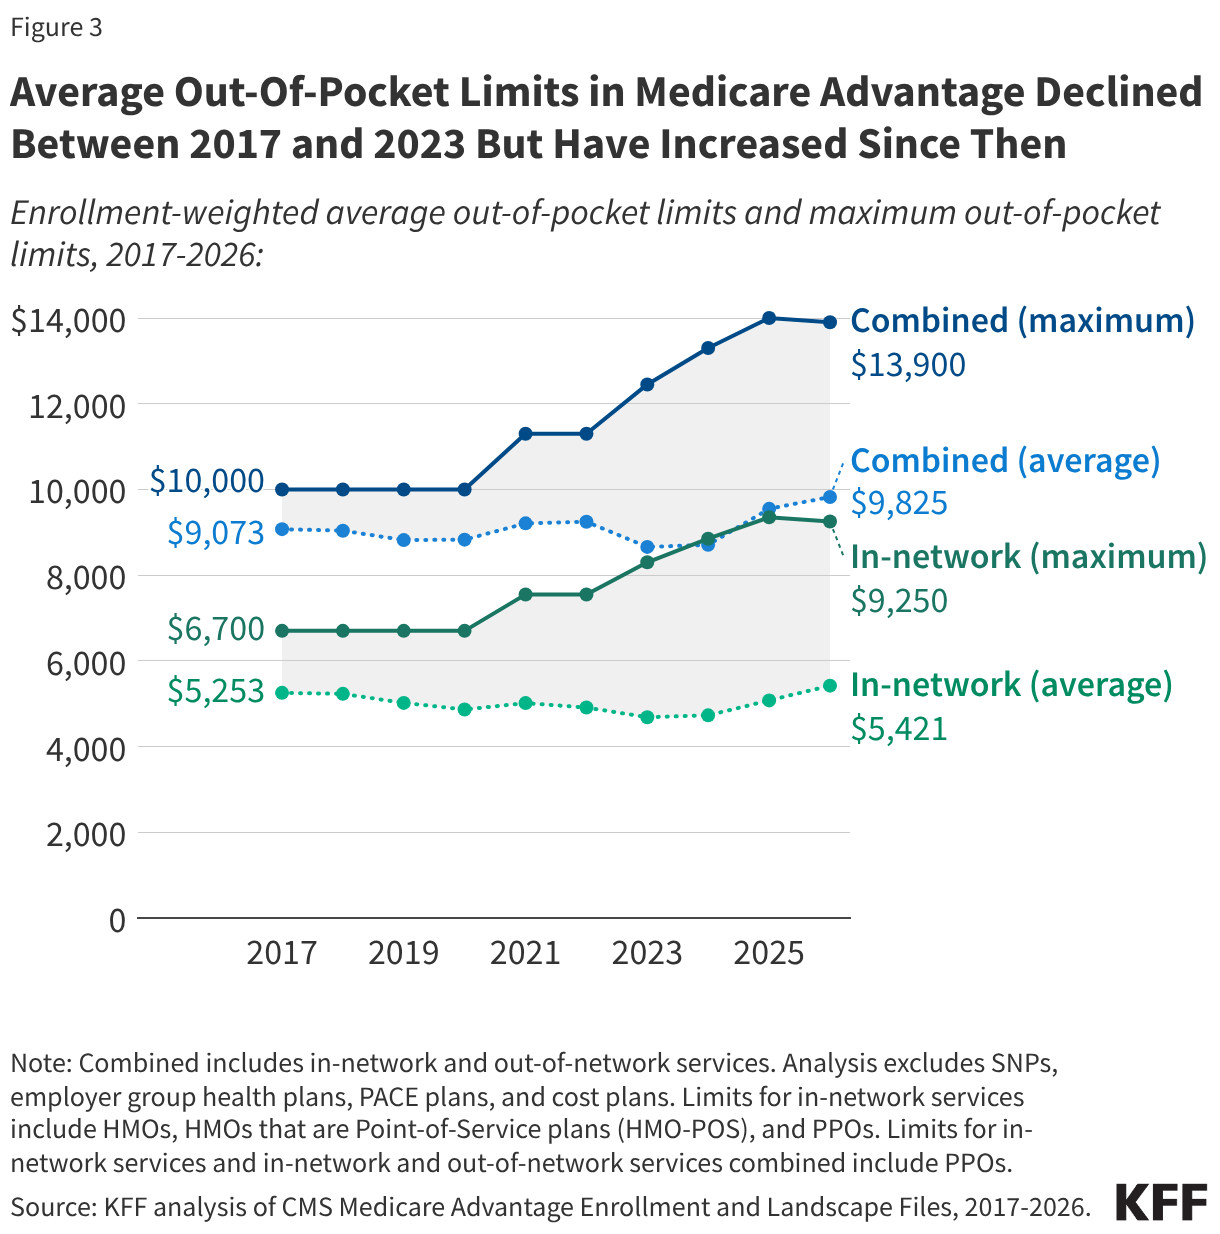
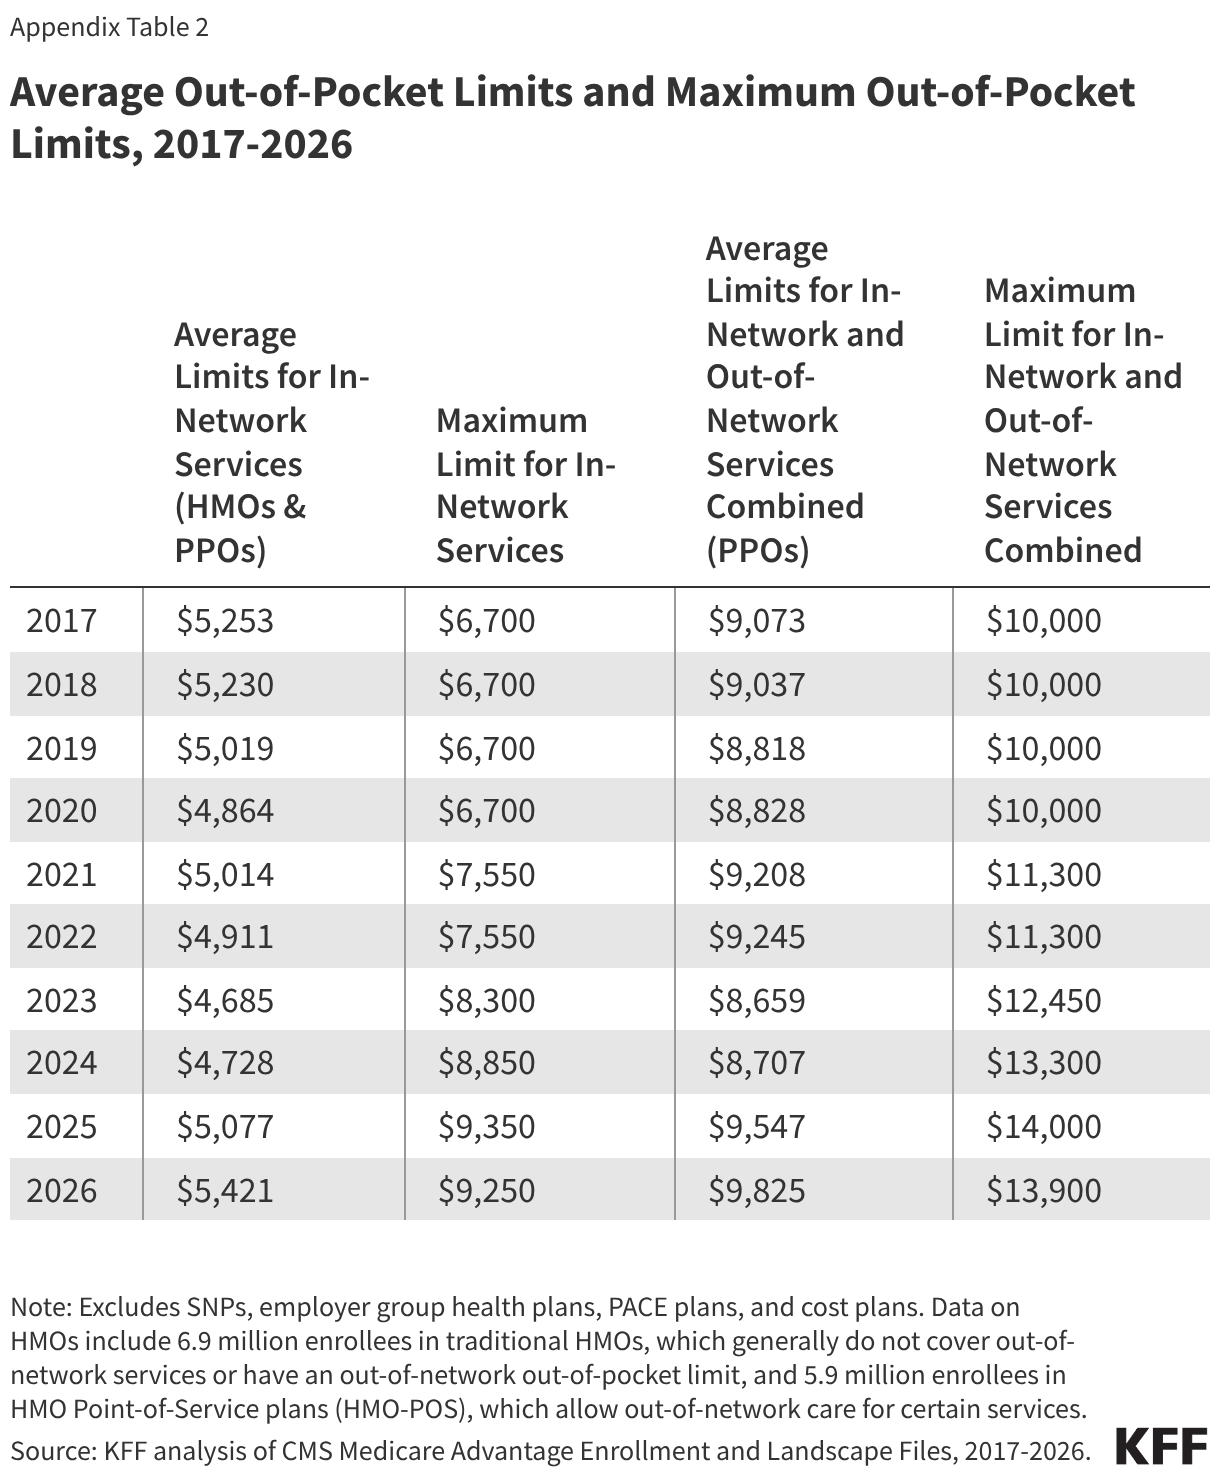
The average limit for in-network services decreased by nearly $600 from 2017 ($5,253) to 2023 ($4,685), before increasing by about $700 from 2023 to 2026 ($5,421) (Figure 3, Appendix Table 2). The average limit for in-network and out-of-network services combined has fluctuated over time but increased overall by about $750 between 2017 ($9,073) and 2026 ($9,825).
The maximum allowable out-of-pocket cap has generally increased over time, consistent with projected beneficiary out-of-pocket spending in traditional Medicare, which CMS uses to calculate maximum out-of-pocket limits in Medicare Advantage. However, the maximum cap decreased by $100 between 2025 and 2026. The average out-of-pocket limit faced by enrollees each year has always been lower than the maximum allowable limit. This gap has generally widened over time, but shrank somewhat between 2025 and 2026.
Methods
This analysis uses data from the Centers for Medicare & Medicaid Services (CMS) Medicare Advantage Enrollment, Benefit and Landscape files for 2017-2026. The analysis excludes Special Needs Plans (SNPs), employer- and union-sponsored plans, PACE plans, and cost plans. These plans serve distinct populations and some may have different enrollment requirements than Medicare Advantage plans (e.g., may be available to beneficiaries with only Part B coverage) and in some cases, may be paid differently than Medicare Advantage plans, limiting comparability with individual Medicare Advantage plans for general enrollment. These exclusions are reflected in both current data as well as data displayed trending back to 2017.
The total number of enrollees in individual Medicare Advantage plans in this brief (21.3 million) may be slightly different than the number reported in other KFF briefs because this analysis further excludes a small number of plans without an in-network out-of-pocket amount specified in the plan benefits files.
The average for PPOs in this analysis includes two types of plans: local PPOs, which cover individual or multiple counties, and regional PPOs, which cover an entire state or multiple states. The average for HMOs includes two types of plans: HMOs that primarily cover services provided by in-network providers only and therefore do not have a limit for out-of-network services, and HMOs that are Point-of-Service plans (HMO-POS), which allow out-of-network care for certain services but typically charge higher cost sharing than for in-network services.
In previous years, KFF’s analysis of average out-of-pocket limits in Medicare Advantage excluded HMO-POS because they represented a relatively small share of HMO enrollment at the time (e.g., 10% in 2017). However, HMO-POS enrollment has grown substantially and now accounts for nearly half (46%) of HMO enrollment in Medicare Advantage. As a result, these plans are included in the current analysis to better reflect the experience of a substantial share of Medicare Advantage enrollees in HMOs.
This analysis determines urban and rural analysis based on the 2024 Urban Influence Codes (UIC) published by the U.S. Department of Agriculture (USDA) Economic Research Service. See Methods of KFF, “Key Facts About Medicare Beneficiaries in Rural Areas” (June 2025) for more details. Connecticut is excluded from the analysis by rurality because of differences in FIPS codes in the CMS Medicare Advantage data and the USDA 2024 UIC.
VOLUME 47
A hantavirus outbreak linked to a Dutch cruise ship in early May was followed by false health claims that mirror patterns documented in previous outbreaks, including unsupported claims that ivermectin is an effective treatment, that the outbreak was planned in advance, and that it was caused by COVID-19 vaccines.
The Monitor also examines a new analysis of Americans’ relationship with health and wellness influencers, finding that most who get health information and advice from them express skepticism about what they hear.
False health claims tend to follow recognizable patterns across outbreaks, including distrust of official sources, promotion of unproven treatments, and accusations of hidden profit motives. The hantavirus outbreak linked to the Dutch cruise ship MV Hondius was no exception, with several familiar false narratives spreading alongside the official response from the World Health Organization (WHO) and other agencies:
Why This Matters: The narratives that accompanied the hantavirus outbreak are not new. Researchers and fact-checkers have documented nearly identical claims in response to COVID-19, mpox, and avian flu, often with the same accounts recycling framing across new outbreaks. Each cycle may make it harder for accurate health information to reach audiences before these false narratives spread.
A new Pew Research Center analysis offers a detailed look at who is producing and consuming health and wellness content on social media. Four in ten U.S. adults, and half of those under 50, say they ever get health and wellness information from social media influencers or podcasts. Yet among those audiences, trust is limited. Just one in ten say they trust all or most of what they hear from these sources, while nearly a quarter (24%) say they trust not too much or none of it. The majority, about two-thirds, say they trust some. While most (54%) say the information has helped them better understand how to be healthy, about one in eight (12%) say it has left them more confused.
Of the nearly 7,000 health and wellness influencers Pew identified on YouTube, TikTok, and Instagram, about 41% describe themselves as some kind of health care professional, a category that includes not only physicians and nurses but also chiropractors, naturopaths, and functional medicine practitioners. The remaining health and wellness influencers describe themselves as coaches, entrepreneurs, or offer little biographical information at all. Most people who get content from influencers say they come across this content passively rather than seeking it out. Certain groups, including Black, Hispanic, and Asian Americans, and those without health insurance, are more likely to turn to health influencers for information, a finding that may point to gaps in the formal health care system as a driver of influencer engagement.
The findings add context to KFF polling, which found that 55% of the public use social media to find health information or advice at least occasionally, and 14% report getting health advice regularly from social media influencers. But trust in influencers was limited in the KFF survey as well: about four in ten (39%) of those who regularly got health information or advice from influencers said those influencers were primarily motivated by serving the public interest, compared to six in ten (61%) who said they were primarily motivated by their own financial interests. As KFF President and CEO Drew Altman wrote in a “Beyond the Data” column last August, the relatively small share of people who say they regularly get health information from influencers suggests that health communicators should keep the role of influencers in perspective, at least for now.
As the 2026 midterms approach, health information and trust dynamics vary across states, shaped by local politics, demographics, and access. The Monitor will periodically examine state-specific data and trends as part of our broader tracking of the health information environment.
A survey of California residents conducted by NORC at the University of Chicago for the California Health Care Foundation (CHCF) found that 46% say they have “not much” trust in the health care system or “none at all.” But, trust varies sharply depending on who within the system is being evaluated. Nine in ten Californians say they trust nurses and more than eight in ten say they trust their personal doctor, while fewer than half (49%) trust hospital administrators and roughly a third trust health insurance companies (33%) or pharmaceutical companies (30%). The survey also found that Californians who had skipped care due to cost were significantly less likely to trust the system overall, with 35% of that group expressing at least a fair amount of trust, compared to 54% of Californians overall.
These findings are in line with past KFF polling showing that doctors and health care providers are consistently the public’s most trusted source of health information. More recently, KFF’s latest April Health Tracking Poll finds that most of the public (70%) say they trust doctors and health care providers at least “a fair amount” to act in the public’s best interest, a sentiment that is shared across partisanship.
The state of Pennsylvania has filed a lawsuit against Character.AI, alleging that its platform enabled chatbots to present themselves as licensed medical professionals and provide medical advice without proper credentials. According to the complaint, the chatbot claimed to be a psychiatrist licensed in Pennsylvania and offered mental health guidance, including discussion of diagnosis and treatment options, while using a fabricated license number. State officials argue this constitutes the unlawful practice of medicine. The company has said that its characters are fictional and accompanied by disclaimers indicating they are not real professionals, but the case raises questions about the effectiveness of such safeguards when users engage with highly personalized AI systems in vulnerable moments. The lawsuit arrives as the safety and accuracy of AI chatbots in the context of mental health is drawing increased scrutiny. KFF’s March 2026 Tracking Poll on Health Information and Trust found that about one in six adults had used AI chatbots in the past year for mental health information and advice, and a majority (58%) of those who did said they did not follow up with a mental health professional.
The American Medical Association (AMA) released a new policy framework calling for stronger legal protections against AI-generated “deepfakes” that impersonate physicians through fake videos, audio, or images. The group warned that manipulated content falsely showing doctors endorsing treatments or giving medical advice could mislead patients, damage trust in physicians, and spread unproven or harmful health information, particularly as AI-generated misinformation becomes more realistic and harder to detect, even by trained medical professionals.
The AMA’s proposal calls for explicit opt-in consent before a physician’s likeness, voice, or identity can be used in AI-generated content, mandatory labeling and digital watermarks for synthetic media, and faster takedown and enforcement mechanisms. It also calls for shared responsibility among hospitals, platforms, and AI companies for preventing impersonation. The policy reflects growing concern within medicine about how generative AI tools could be used to exploit the credibility of health professionals online.
About The Health Information and Trust Initiative: the Health Information and Trust Initiative is a KFF program aimed at tracking health misinformation in the U.S., analyzing its impact on the American people, and mobilizing media to address the problem. Our goal is to be of service to everyone working on health misinformation, strengthen efforts to counter misinformation, and build trust.

The Monitor is a report from KFF’s Health Information and Trust initiative that focuses on recent developments in health information. It’s free and published twice a month.
Sign up to receive KFF Monitor
email updates
Support for the Health Information and Trust initiative is provided by the Robert Wood Johnson Foundation (RWJF). The views expressed do not necessarily reflect the views of RWJF and KFF maintains full editorial control over all of its policy analysis, polling, and journalism activities. The data shared in the Monitor is sourced through media monitoring research conducted by KFF.
After nearly 40 years shaping the national health policy landscape and leading it through pivotal debates, KFF announced today that Dr. Drew Altman will retire from his role as Founding President and Chief Executive Officer on December 31. KFF’s Board of Trustees has appointed Larry Levitt and Dr. Mollyann Brodie as the new leadership team. Beginning in 2027, Levitt and Dr. Brodie will assume the leadership positions of CEO and President, respectively.
Since Dr. Altman founded the modern-day KFF, coming to California in 1990 to establish it from what once was the Henry J. Kaiser Family Foundation, the organization has become the nation’s leading source of health policy analysis, polling, and news. Under his leadership, KFF has evolved into a one-of-a-kind information organization, bringing together policy research, polling and survey research, and journalism, most recently through the creation of KFF Health News, the nation’s largest health policy newsroom. There is no organization in the country that has played a more pivotal role in informing policymakers, the media, and the public with data-centered analysis about U.S. health policy.
“Building KFF over the last three plus decades has been a mission for me,” said Dr. Drew Altman, Founding President and Chief Executive Officer of KFF. “My whole purpose has been to build an institution that could be a force for people and for truth in health care, and we’ve achieved that and more. Together, we have built an organization that combines policy research, polling, and news all in one, a new kind of information organization. I’m immensely proud of that legacy and KFF’s role at the highest levels of health policy. Larry and Molly each play a central role as KFF’s executive team now and have for years, and I have complete confidence in their leadership, in KFF’s remarkable staff who do our work, in our Board, and in KFF’s future.”
“With two small grandkids in Sacramento and Atlanta and another on the way, after what will be almost 37 years of very hands-on leadership since I founded KFF, and with KFF at the apex of its effectiveness, and the opportunity for a perfect transition, the clock in my head is telling me it’s time,” Dr. Altman added.
“KFF is the most trusted and respected voice in health policy, in large part because of Drew Altman and his vision and leadership. During my time in the U.S. Senate, the organization’s data and research were invaluable in shaping key health care decisions, underscoring the impact of KFF’s work, and the organization continues to play a unique and monumental role today,” said former U.S. Senator Olympia Snowe, Chair of KFF’s Board of Trustees. “Recognizing this is a pivotal moment for KFF, the Board engaged in a lengthy succession planning process, which was deliberative and thoughtful. Based on our governance considerations, the Board identified two exceptional leaders, Dr. Mollyann Brodie and Larry Levitt, who not only know this organization, but who have helped it grow and evolve into what it is today. We therefore selected Larry and Molly to serve as CEO and President, respectively. As we look to the future of KFF, Molly and Larry’s deep experience, understanding of KFF, and their unwavering commitment to its mission make them the best team to guide us into an exciting next chapter.”
Under Dr. Altman’s leadership, KFF has been a cornerstone of the nation’s health policy and health journalism landscapes—anchoring pivotal debates with rigorous, nonpartisan data analysis and reporting. Its work has informed understanding of landmark policies, including key provisions of the Affordable Care Act, Medicaid, and Medicare, and provided essential context during moments of crisis, such as the COVID-19 pandemic, when its COVID Vaccine Monitor and reporting became vital resources used around the country. Since the 1990s, KFF’s data and analyses have helped illuminate the real-world implications for people of proposals like Medicaid block grants, ensuring that policymakers and the public alike are equipped with credible, evidence-based insights.
Following the recommendation of a search committee led by Board Vice-Chair Jim Canales, KFF’s Board unanimously appointed Levitt and Dr. Brodie as incoming CEO and President, respectively. Both have served as Dr. Altman’s executive team for over a decade. Levitt, who will take over as CEO, currently serves as Executive Vice President for Health Policy, overseeing KFF’s policy analysis of programs including Medicare, Medicaid, the Affordable Care Act, women’s health, racial equity, global health, and more. Dr. Brodie currently serves as Executive Vice President and Chief Operating Officer, overseeing KFF’s operations and leading its nationally recognized Public Opinion and Survey Research Program, and recently received the American Association of Public Opinion Research’s Award for Exceptionally Distinguished Achievement for her professional accomplishments in the field. She will assume the role of President. Levitt and Dr. Brodie will both serve on the Board.
“We are grateful for Drew’s vision in establishing KFF as a leading source for independent and nonpartisan health policy information and look forward to continuing that mission,” said Dr. Molly Brodie, incoming President of KFF, and Larry Levitt, incoming Chief Executive Officer of KFF, in a joint statement. “We appreciate the vote of confidence in us by KFF’s Trustees and are excited to work together to lead an organization of immensely talented and professional staff.”
“With ongoing debates over affordability and other important health policy issues, KFF will continue to bring to the table timely and credible facts through our trusted research and journalism,” said Levitt. “We will build on the credibility KFF has established as an independent and nonpartisan source of health policy information in an increasingly polarized environment.”
“KFF will continue our laser focus on how health policies and the health care system affect real people,” said Dr. Brodie. “We are committed to leading KFF as a trusted source of information in an era of declining trust in public and private health care institutions.”
Dr. Altman will continue to work closely with Dr. Brodie and Levitt to ensure a smooth transition. He will continue in his role as President and CEO through the end of 2026, with Levitt and Dr. Brodie assuming their new leadership roles in January 2027.
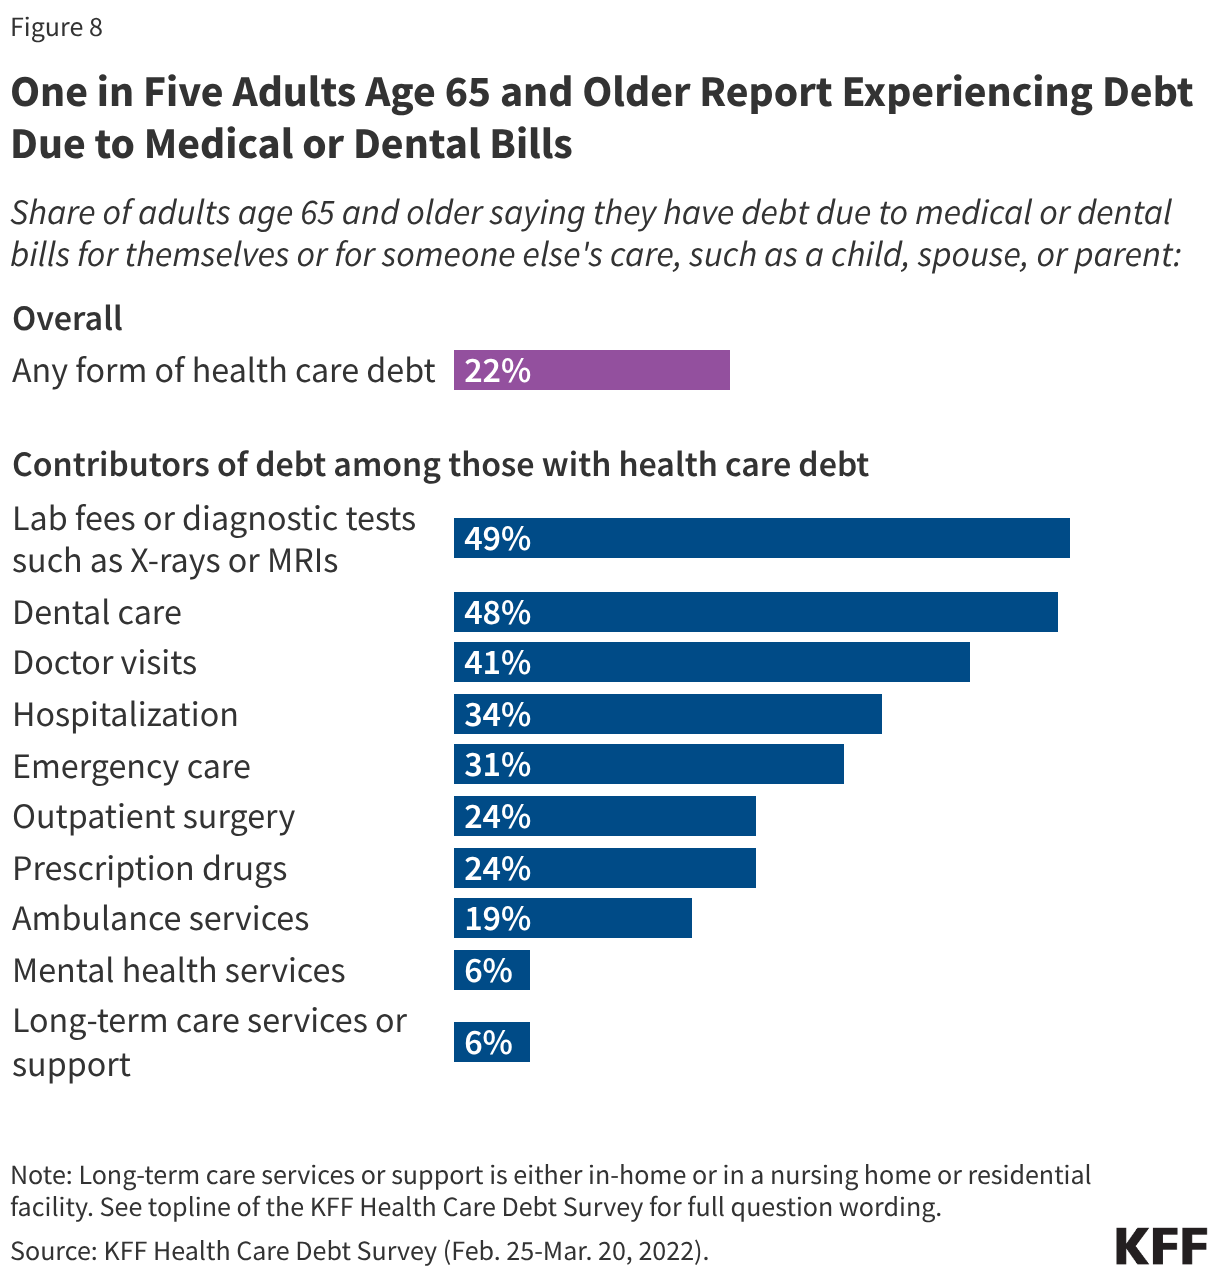
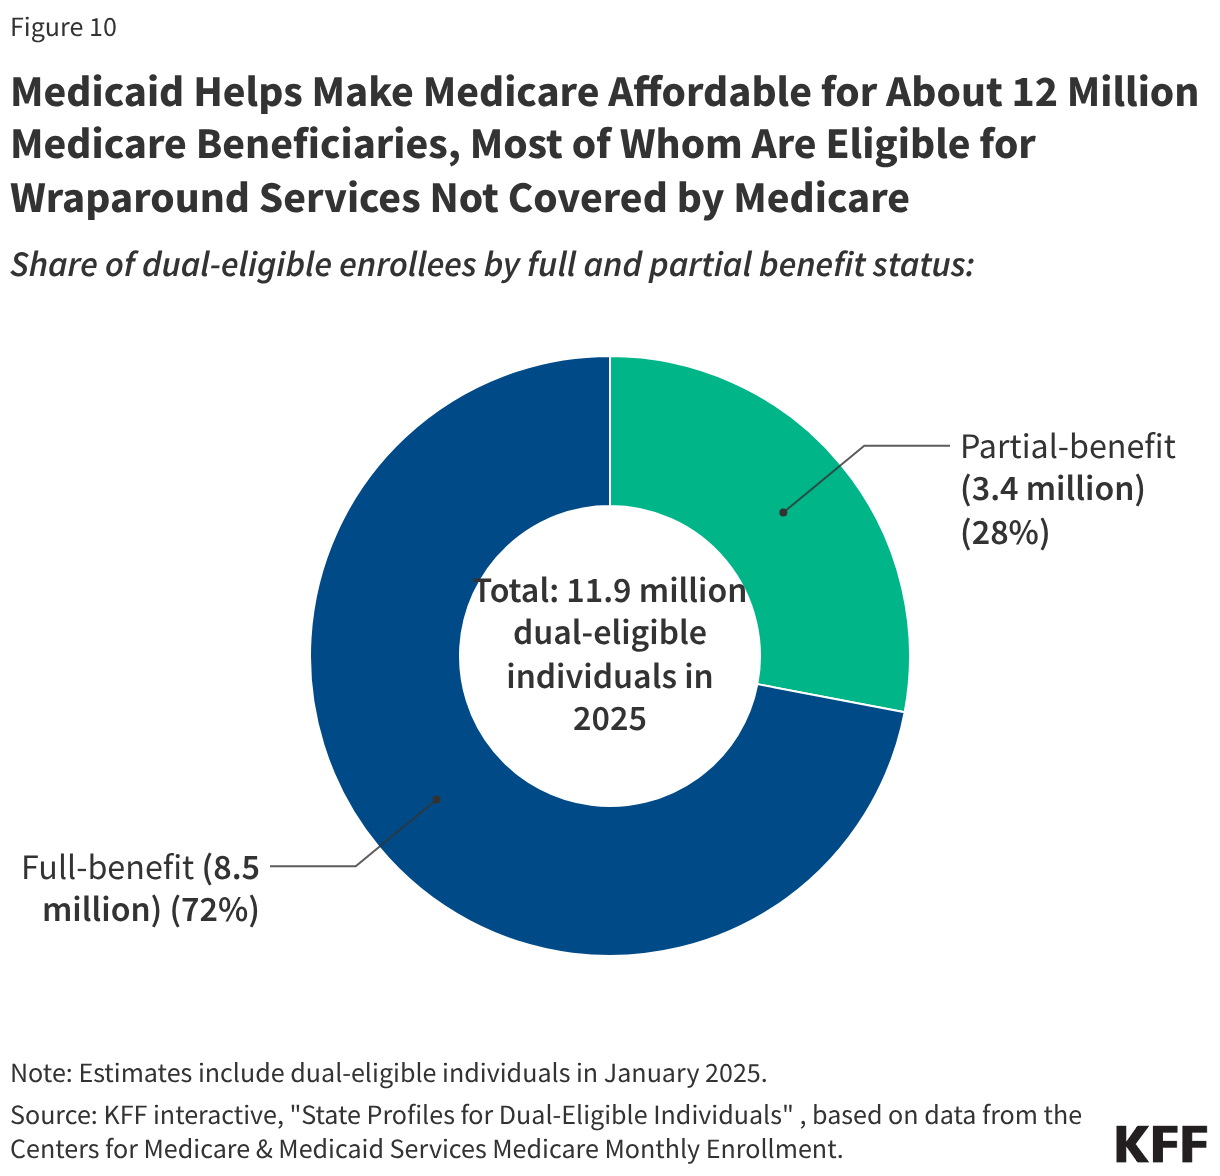
Health care costs and affordability recently topped the public’s list of economic anxieties in the U.S., according to KFF polling. Even people with insurance say they struggle to afford health care costs, including people with Medicare. While Medicare provides health insurance coverage to 70 million people age 65 or older and younger adults with long-term disabilities, having Medicare coverage does not insulate beneficiaries from health-related affordability challenges, such as not getting needed medical care due to costs or incurring medical debt. In a 2026 KFF Health Tracking Poll, half (49%) of all Medicare beneficiaries ages 65 and older say they expect their health care costs to become less affordable in the next year.
This brief presents key facts and analysis about affordability of health care costs among people with Medicare, including younger adults with long-term disabilities, drawing on data from various sources (see methods for additional information).
Methods
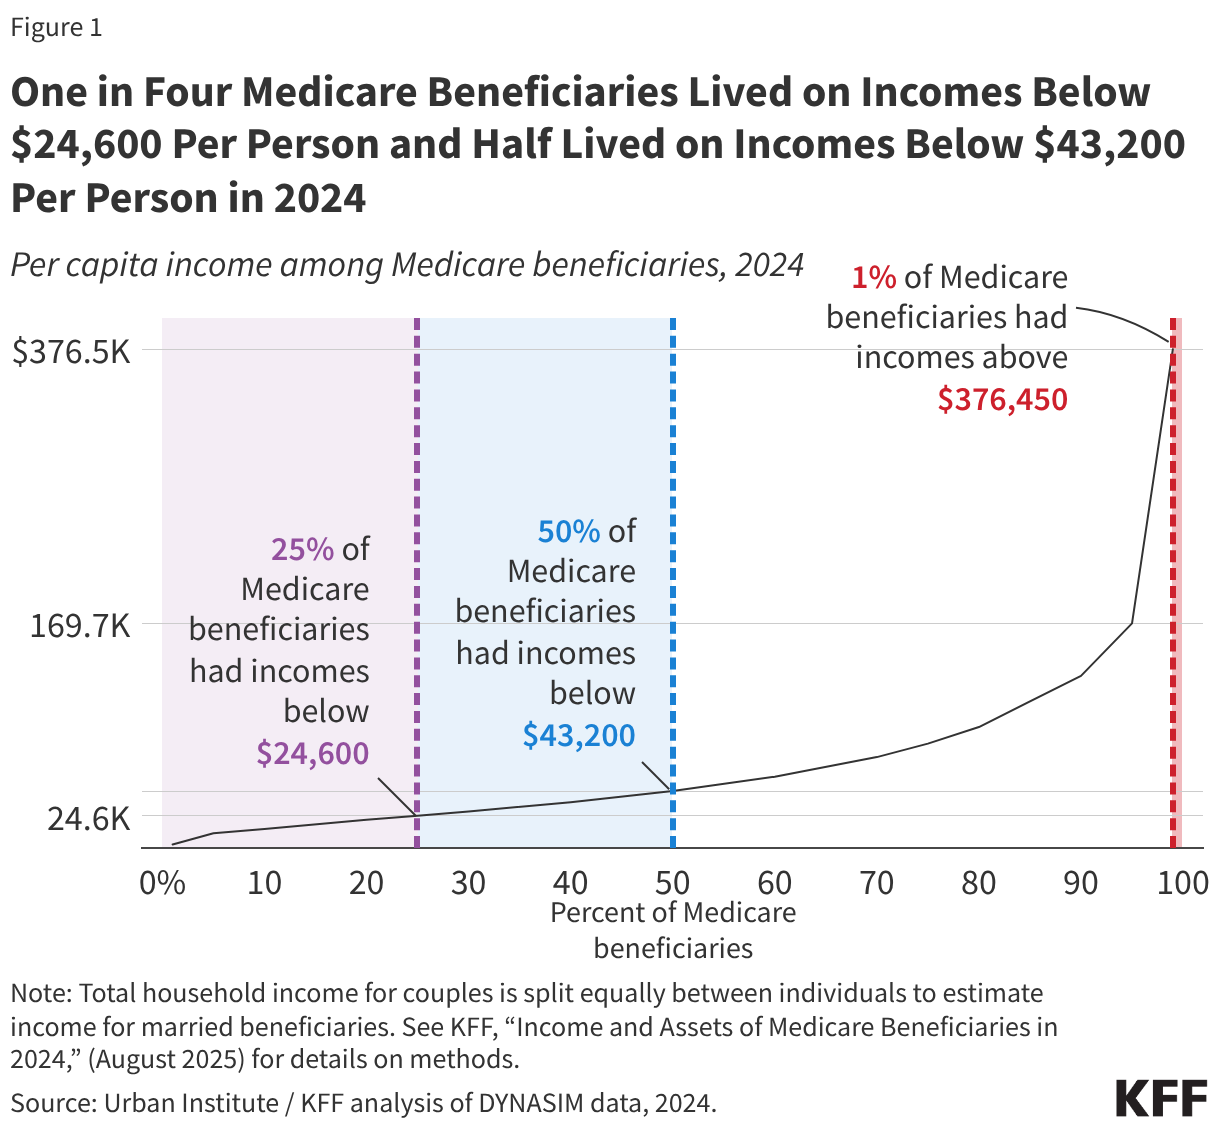
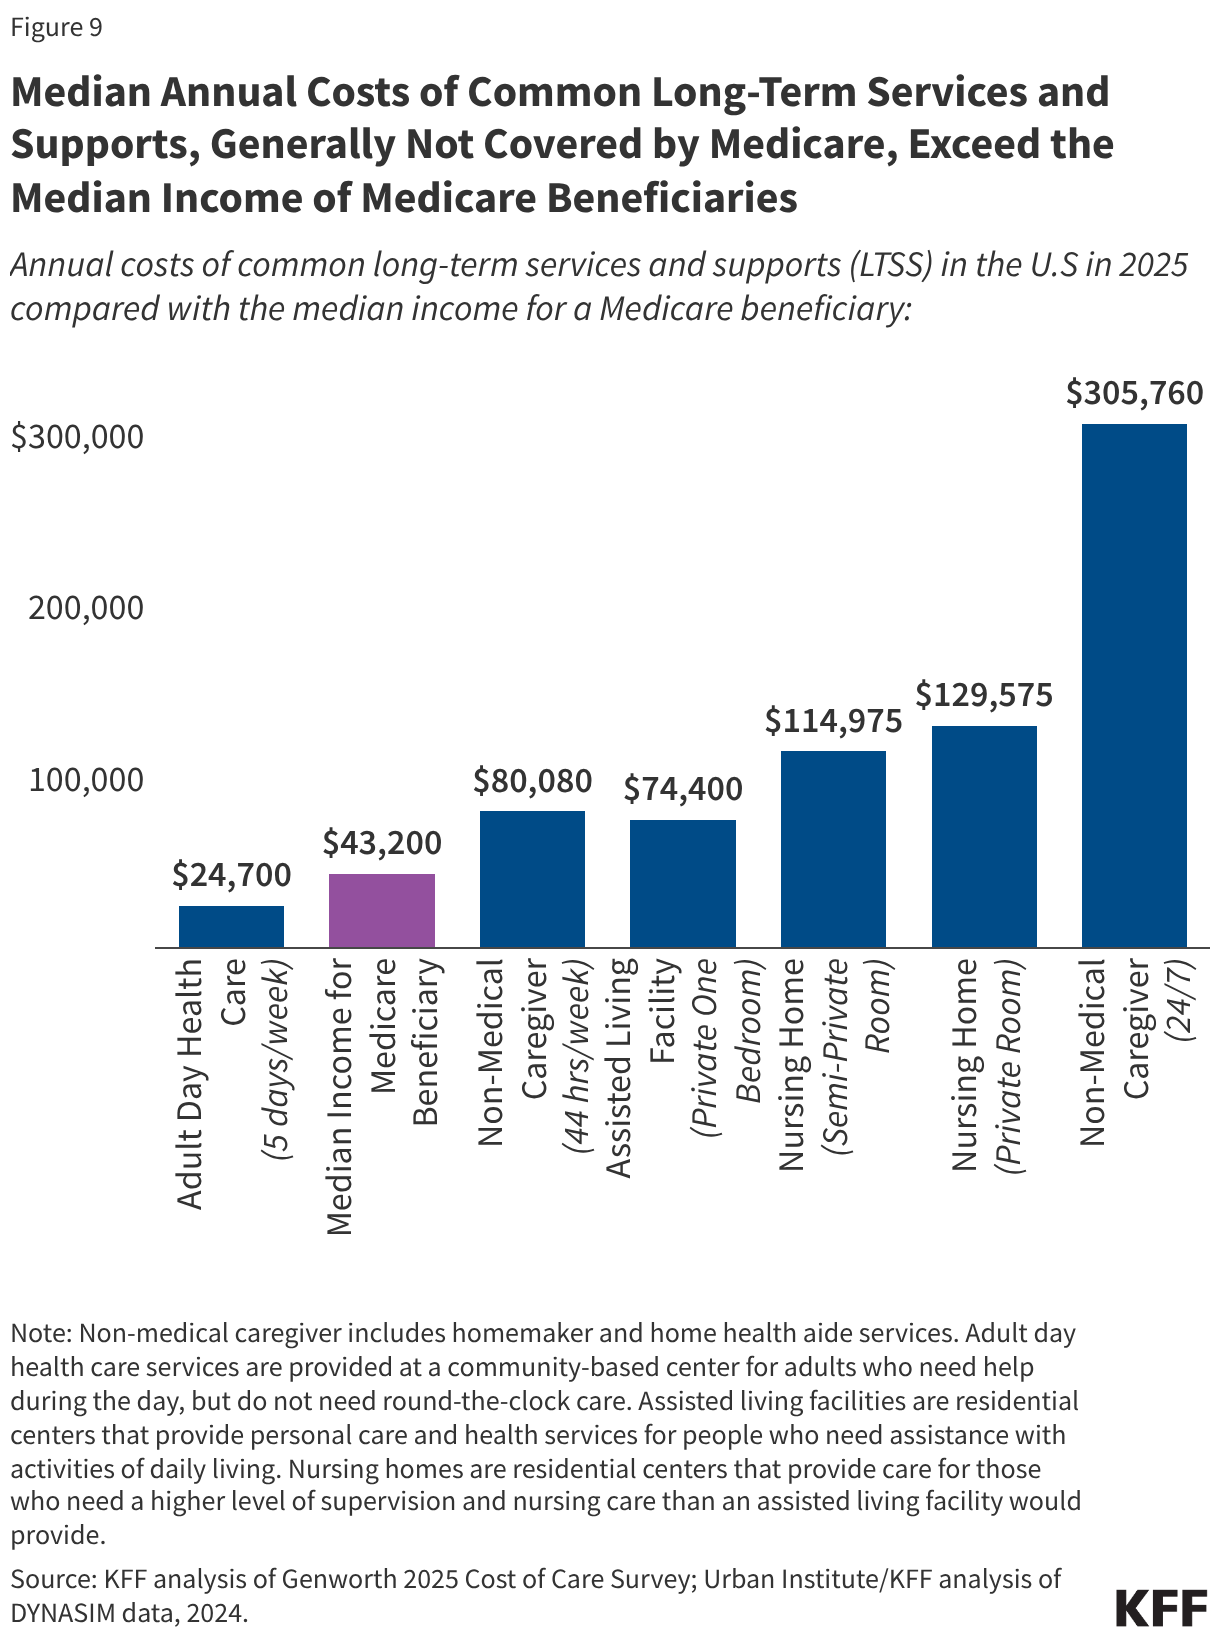
This brief draws on data from various sources. Data on income and savings of Medicare beneficiaries, including the share of beneficiaries who relied on Social Security for at 75% or 90% or more of their total per capita income and the number of Medicare beneficiaries who spent more than 10% of their annual per capita income on Part B premiums, are drawn from the Urban Institute’s Dynamic Simulation of Income Model (DYNASIM4). See Methods of KFF, “Income and Assets of Medicare Beneficiaries in 2024” (August 2025) for more details.
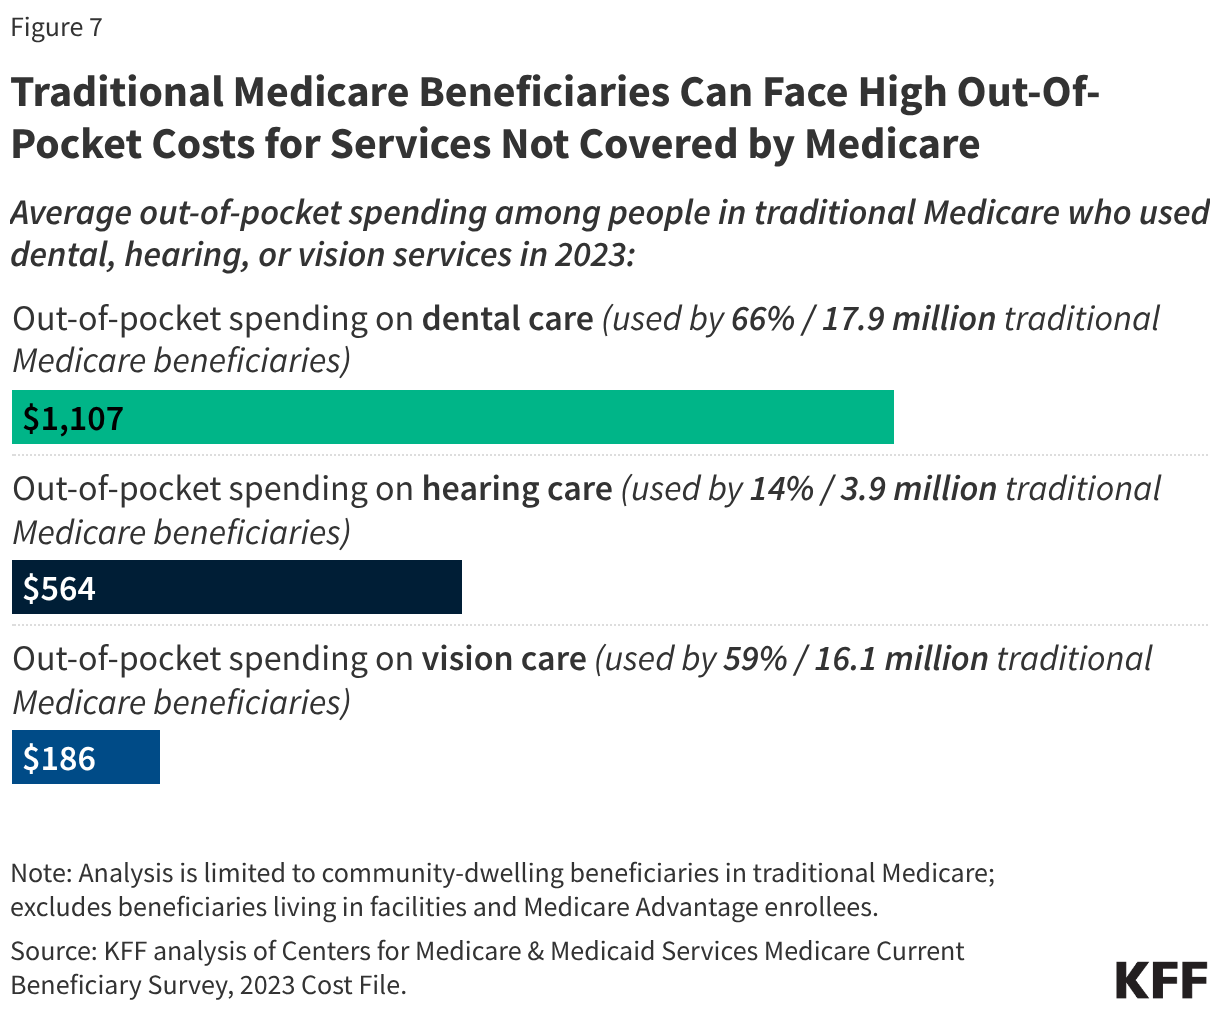
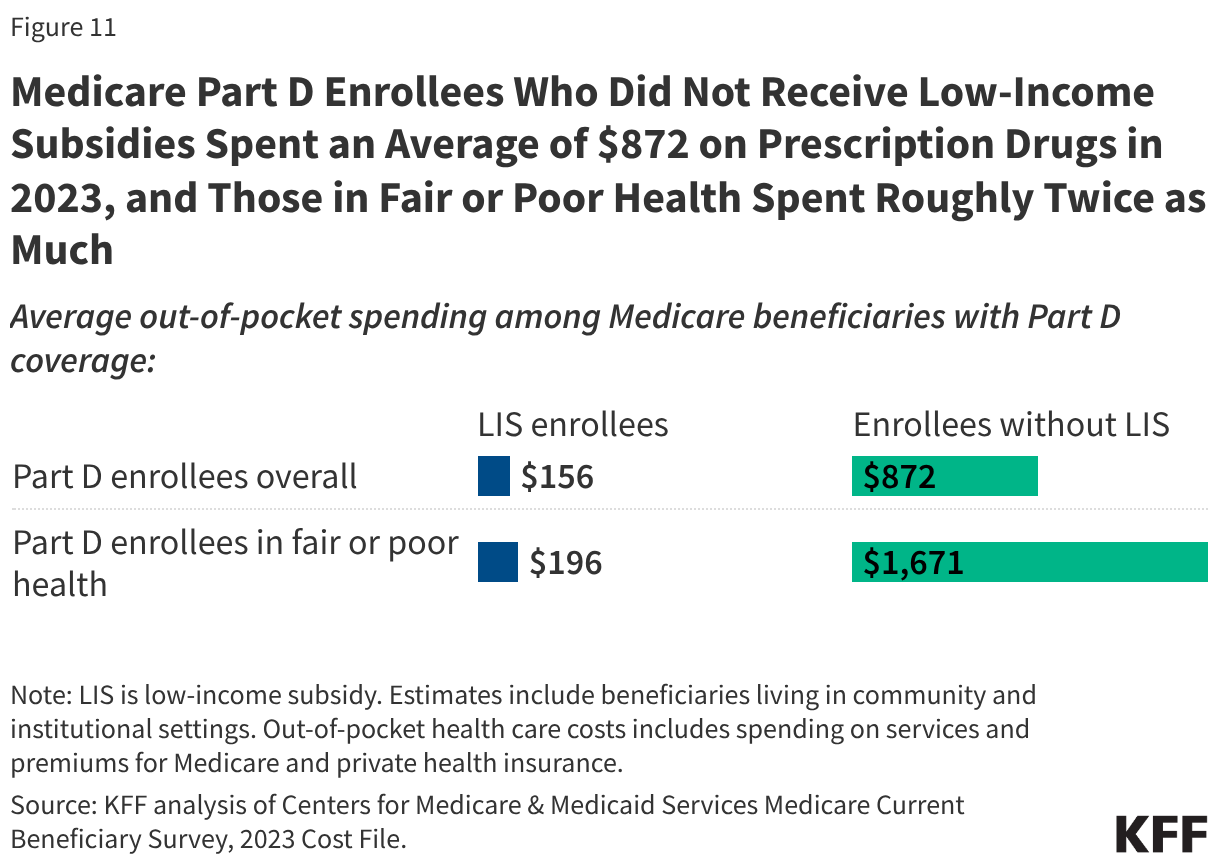
Data on out-of-pocket health care spending are from the Centers for Medicare & Medicaid Services (CMS) Medicare Current Beneficiary Survey, 2023 Cost Supplement File (the most recent year of data available). For the analysis on average out-of-pocket spending as a share of average per capita Social Security income, see the methods of KFF, “Health Costs Consume a Large Portion of Income for Millions of People with Medicare” (August 2025) for more details.
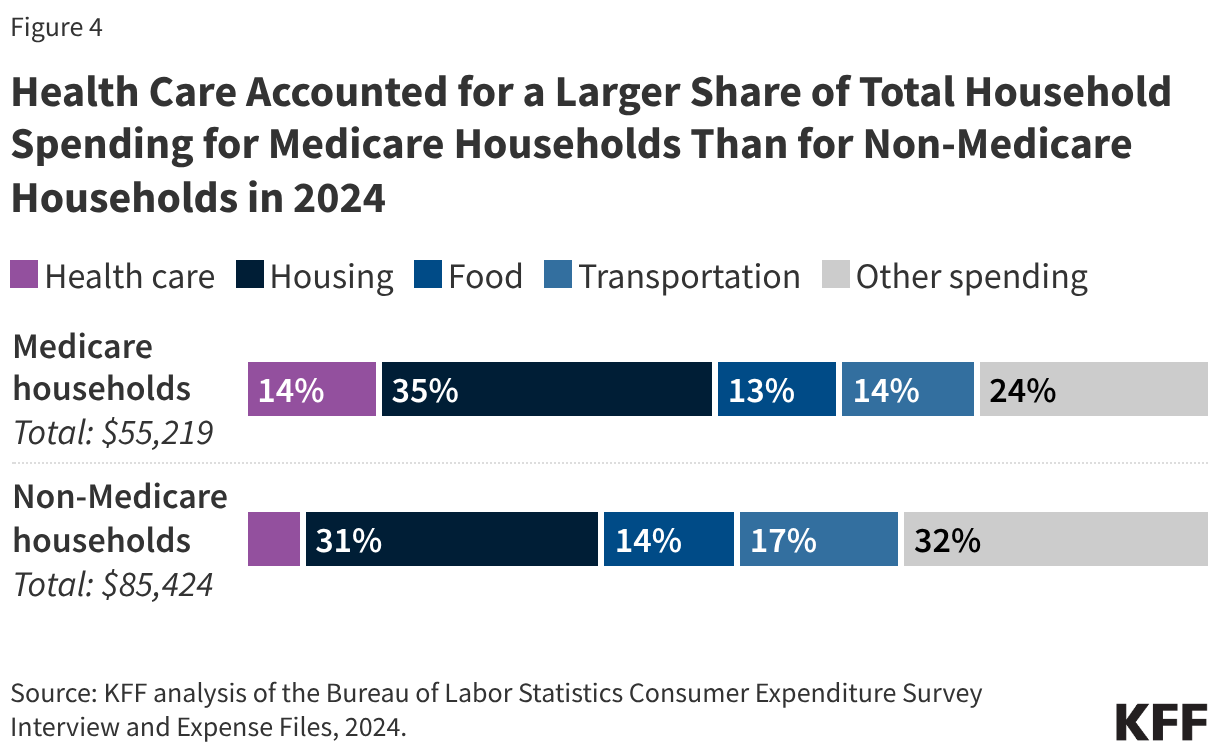
The 2024 Consumer Expenditure Survey (CE) by the Bureau of Labor Statistics is used to assess the financial burden of health care spending among households where all members are covered by Medicare (referred to as Medicare households) compared to households where no members are covered by Medicare (referred to as non-Medicare households). The CE is a survey of households (“consumer units”), excluding people residing in institutions such as long-term care facilities. The estimates presented in this analysis are averages for demographic groups of consumer units, not per capita estimates, and thus are not comparable to estimates based on other surveys that report per capita estimates, such as out-of-pocket health care spending reported in the Medicare Current Beneficiary Survey.
Estimates of Medigap premiums are based on KFF analysis of Medicare Supplement Market Data from Mark Farrah Associates Health Coverage Portal TM, 2023. See methods of KFF, “Key Facts About Medigap Enrollment and Premiums for Medicare Beneficiaries” (October 2024) for more details.
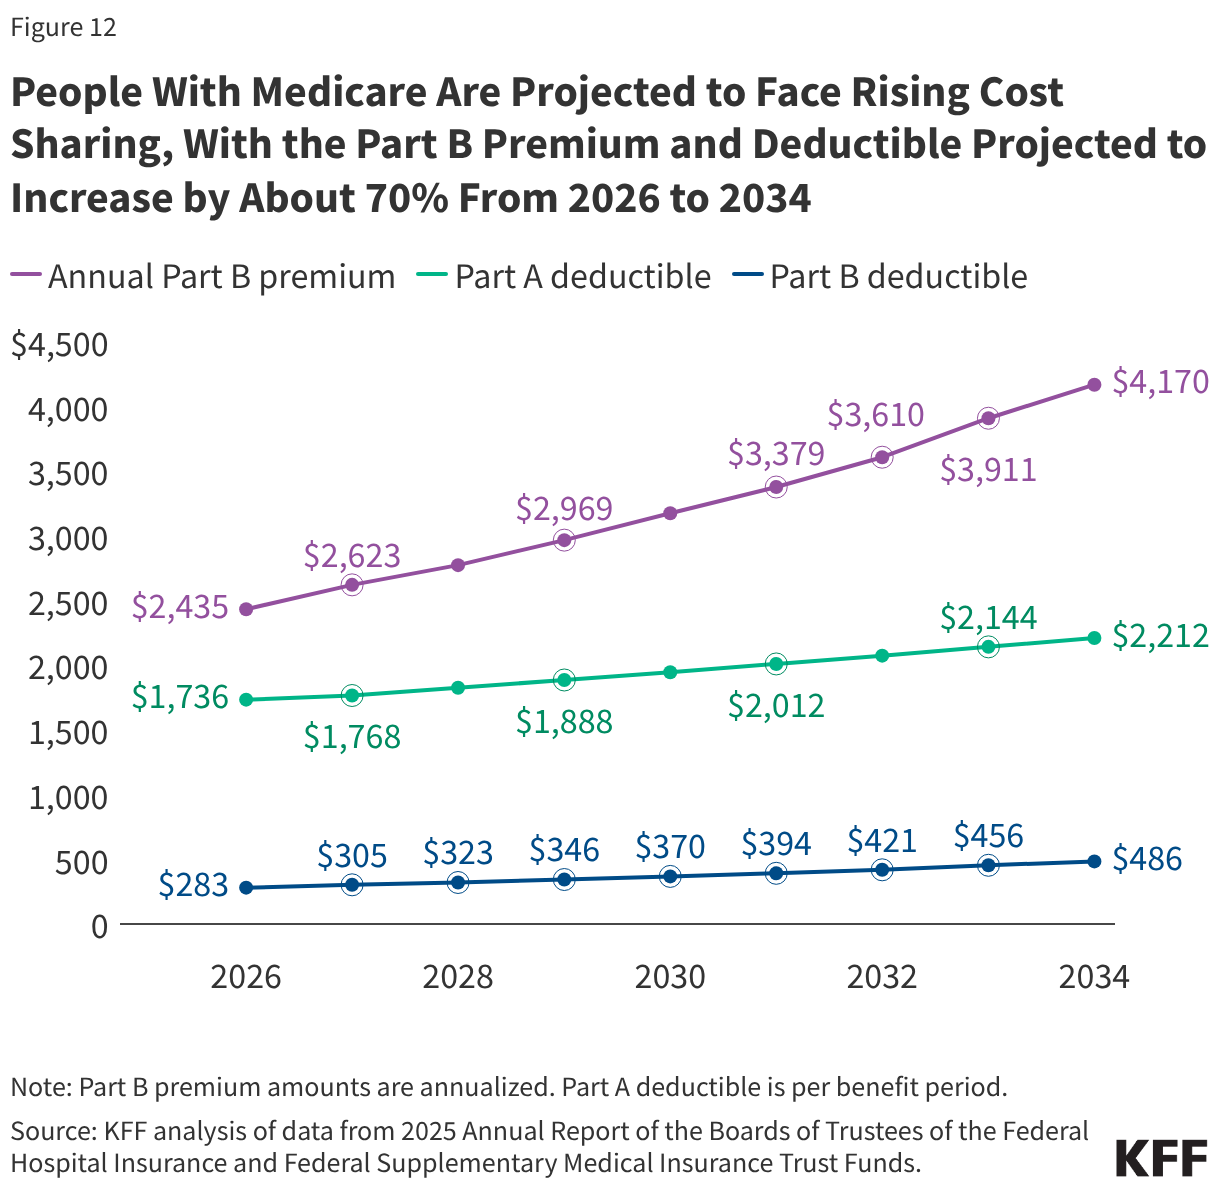
Data on annual Medicare premiums, deductibles, and other cost sharing over time are based on KFF analysis of the 2025 Annual Report of the Boards of Trustees of the Federal Hospital Insurance and Federal Supplementary Medical Insurance Trust Funds.
This work was supported in part by The John A. Hartford Foundation. KFF maintains full editorial control over all of its policy analysis, polling, and journalism activities.
The 2025 reconciliation law requires states to condition Medicaid eligibility for adults in the Affordable Care Act (ACA) Medicaid expansion group and enrollees in partial expansion waiver programs (Georgia and Wisconsin) on meeting work requirements starting January 1, 2027 or sooner at state option. The law specifies mandatory exemptions, including individuals who are “medically frail.” To ease the burden on individuals, the law directs states to use available information “where possible” to verify compliance with Medicaid work activities or exemption status, without requiring additional documentation from individuals. Given the abbreviated implementation timeline, states are moving forward with key decisions over how to implement the medical frailty exemption even as they wait for formal guidance from the Centers for Medicaid and Medicare Services (CMS), which is required to issue an interim final rule by June 1, 2026. This brief describes early state plans to operationalize the medical frailty exemption and identifies key issues that they are facing and may be answered in the forthcoming guidance.
The reconciliation law requires states to exempt from work requirements an individual who is “medically frail or otherwise has special medical needs.” The law specifies this includes individuals who are blind or disabled; have a physical, intellectual, or developmental disability that limits their ability to perform one or more activities of daily living (ADL); have a substance use disorder or a “disabling” mental disorder; and those with “serious or complex” medical conditions. This definition closely aligns with an existing federal medical frailty definition that CMS uses for states choosing to set “alternative benefit plans” that differ from the traditional Medicaid benefit package. In that context, CMS used the definition as a minimum standard for medical frailty but allows states flexibility to define medical frailty beyond the statutory and regulatory definitions. To identify individuals who are medically frail, CMS noted in the 2013 final rule that it expected states to use Medicaid claims data and encouraged them to use self-attestation and health screeners for applicants and new enrollees where the state does not have information on their current health status or historic encounter data.
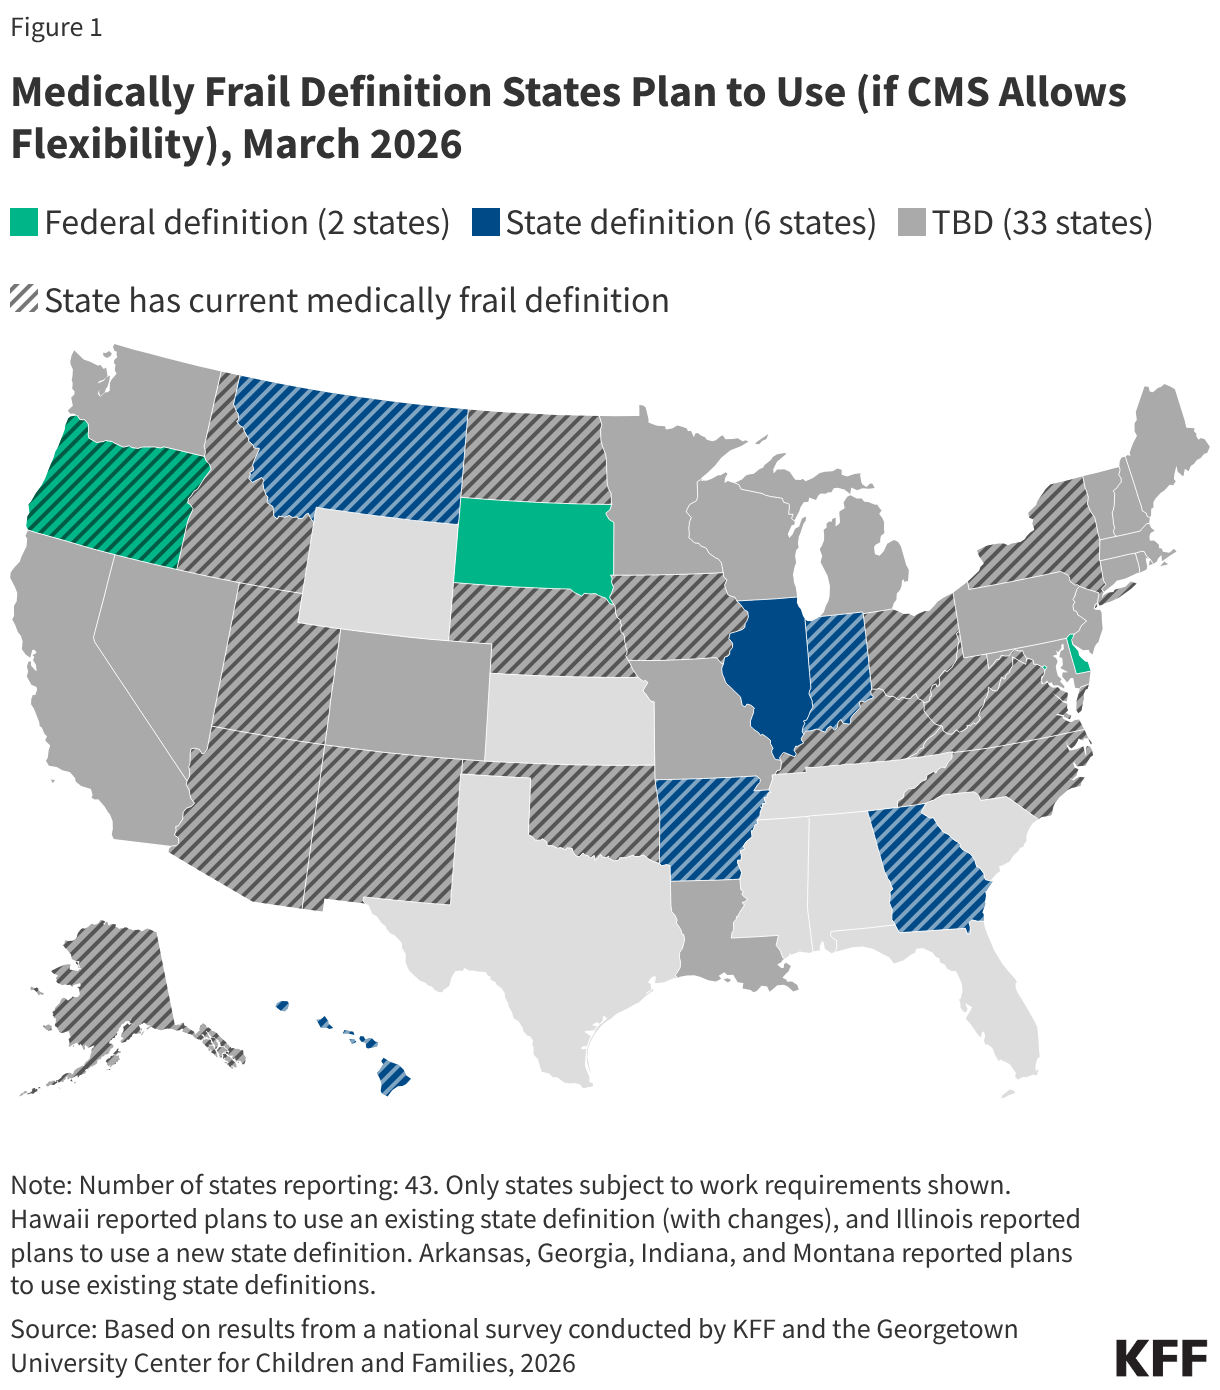
Most states have not yet finalized a medical frailty definition, likely reflecting ongoing uncertainty over how much flexibility states will have as they await June CMS guidance. In a recent KFF survey (fielded January-March 2026), about half of states (22) subject to work requirements report having a current state medical frailty definition, though it is unclear whether these definitions align with the medical frailty provisions in the reconciliation law (Figure 1). Most of these definitions were not developed with work requirements in mind and may need to be updated to reflect the new federal requirements. Thirty-three states indicated they had not yet determined what definition they plan to use at the time the survey was fielded. If states are given flexibility by CMS to define who is medically frail and exempt from work requirements, six states would prefer to use a state definition (either an existing definition or a new definition,) while four states would use a federal definition.
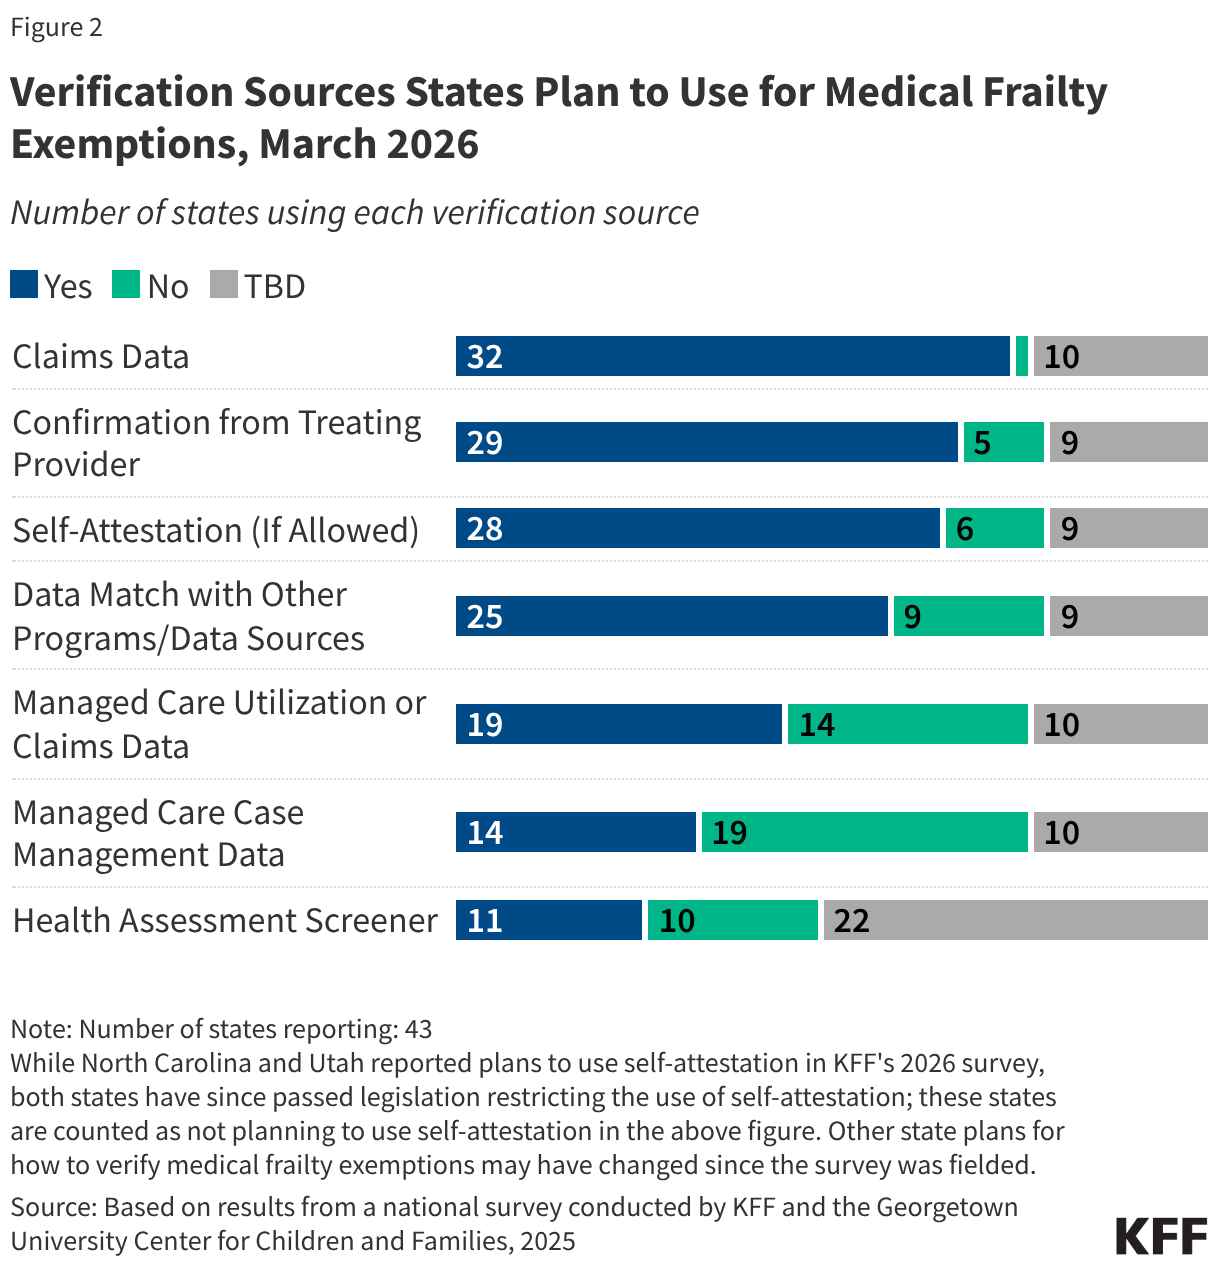
States plan to use a variety of methods to verify medical frailty status, including using data to automate the process where possible. Most states reported plans to use Medicaid claims data (32) to verify medical frailty exemption status, while Georgia indicated it would not use claims data, and the remaining ten states had not yet made a decision at the time of the survey. New applicants and recent enrollees may not have claims data on file, requiring states to use other forms of verification. All 32 states reporting plans to use claims data also reported plans to use other sources, such as data from other programs (e.g., enrollment in a behavioral health managed care plan or HCBS program), managed care utilization or claims data, and/or managed care case management data. Twenty-nine states said they will seek confirmation from a treating provider. Many states are developing health assessment screeners to collect information to identify medical exemptions, and 11 states said they will use the health screeners to verify medically frail status. Most states (30) also reported wanting to allow applicants and enrollees to self-attest to their medically frail status if verification data are not available and self-attestation is permitted by CMS. However, some states reported they do not plan to accept self-attestation (AR, HI, IN, MT) or have since passed legislation barring the use of self-attestation (NC and UT).
Nebraska, which became the first state to implement new work requirements on May 1, 2026, has released resources outlining how it will process medically frail exemptions, as well as an index of diagnosis and procedure codes. Examples of conditions covered in the thousands of codes include types of cancer, HIV, diabetes, heart disease, and certain types of mental health conditions and substance use disorders, among others. For existing enrollees, Nebraska is reviewing medical claims data prior to renewal and will auto-exempt an individual if indicated based on diagnosis/procedure codes. If Nebraska cannot determine medical frailty through claims data or other data sources, existing enrollees will need to submit a self-declaration form. Not all individuals will be able to be auto-exempted due to limitations of claims data such as:
The state also intends to use the self-declaration form to identify medically frail exemption status for new applicants. The self-declaration form requires individuals to provide a description of their health condition, the contact information of their treating provider, and a note if services were provided while enrolled in Medicaid. No additional documentation is required at this time (e.g., a note from a provider or other proof of a condition). Nebraska indicates that it plans to move from self-declaration to more automated verification methods consistent with federal guidance over time, and plans to continue to review and update the index of ICD-10, CPT, and HCPCS codes as federal direction is clarified.
Early insights from other states highlight the variety of ways states are planning to use multiple sources of information to identify medical frailty. For example:
Although states are moving forward with operationalizing the medical frailty exemption, the interim final rule that CMS is required to release by June 1, 2026, is expected to address key issues related to defining and verifying medical frailty. Because of the time required to make system changes, states have been moving forward with implementing work requirements based on informal communication and guidance CMS has shared. Any significant changes to that informal guidance could require states to change course and could have implications for states’ readiness to implement work requirements as well as the costs associated with implementation. Key issues that may be addressed in the guidance, and that states report waiting on, include:
In 2024, over 61 million adults in the U.S. experienced a mental illness and deaths due to suicide, gun violence, and drug overdose remained high. Additionally, the COVID-19 pandemic and necessary public health responses exacerbated an already existing mental health and substance use crises. At the same time, many people experience difficulties affording mental health treatment or finding providers. Among insured adults who described their mental health as fair or poor, 43% reported at least one time in the past year when they needed mental health services or medication but did not receive them; some groups – including communities of color, youth and young adults – experience greater barriers.
Many policy actions were initiated in response to these rising mental health and substance use concerns. During the first Trump administration, the SUPPORT Act – legislation that expanded access to opioid treatment and overdose prevention – was passed along with legislation that created the 988 crisis hotline. During the following Biden administration, federal policies focused on expanding coverage, improving access to care, implementing evidence-based treatments, and strengthening support for federal agencies, such as the Substance Abuse and Mental Health Administration (SAMHSA). Recent data shows that some opioid and mental health related indicators have stabilized or improved.
The second Trump administration, beginning in 2025, marked a change in federal mental health and substance use policy. The administration moved toward a heavier law-and-order approach and simultaneously narrowed the scope of federal leadership capacity in mental health and substance use services, while also continuing some treatment-focused initiatives (such as the SUPPORT Act reauthorization). Many of these policy directions are consistent with themes highlighted in President Trump’s campaign materials and are aligned with proposals in Project 2025.
This tracker lists and briefly describes key actions during President Trump’s second term, organized into the following four broad categories: Opioids (for example, signing the HALT Act); Mental Health (e.g., canceling school-based mental health grants); Federal Infrastructure/Data/Guidance (e.g., proposals to reduce and reorganize SAMHSA under another agency); and Gun Violence (e.g., rescinding community violence intervention grants). It will be updated as new changes occur. This tracker is not meant to be exhaustive; other state and federal policy changes may also affect mental health and substance use but are not captured here.
The tracker can be viewed in the order that each mental health or substance use policy action was implemented. Alternatively, the tracker can be filtered by category (Mental Health; Opioids/Substance Use Disorder; Federal Infrastructure/ Data/Guidance; and Gun Violence).


