Reading the Stars: Nursing Home Quality Star Ratings, Nationally and by State
Background
The people living in nursing homes
Nursing home quality is a serious issue, particularly in light of the vulnerability of the people who are living in them. Nursing home residents tend to have significant limitations, including functional and/or cognitive limitations and multiple chronic conditions. While Medicaid is the primary payer for over 60 percent of nursing facility residents, the vast majority of people living in nursing homes are Medicare beneficiaries.1 Some are short-stay residents and are admitted for Medicare-covered skilled nursing care following a hospitalization before returning home or continuing to stay for non-Medicare covered services in the same or different facility.2 Others are long-stay residents, often with dementia, who reside in nursing homes because they or their family are unable to care for them in their own homes. Together, Medicare and Medicaid payments account for more than half (52 percent) of all expenditures on nursing home care, including care in skilled nursing facilities, nursing homes, and continuing care retirement communities.3
Among Medicare beneficiaries who spent time in a long-term care facility or a skilled nursing facility, 81 percent are limited in their ability to perform activities of daily living, such as eating and bathing, 76 percent have cognitive or mental impairments, 55 percent are in fair/poor health and 32 percent have five or more chronic conditions, according to analysis of the 2010 Medicare Current Beneficiary Survey (Figure 1). Nearly two-thirds have incomes of less than $20,000. Women and people ages 85 and older account for a disproportionate share of nursing home residents.
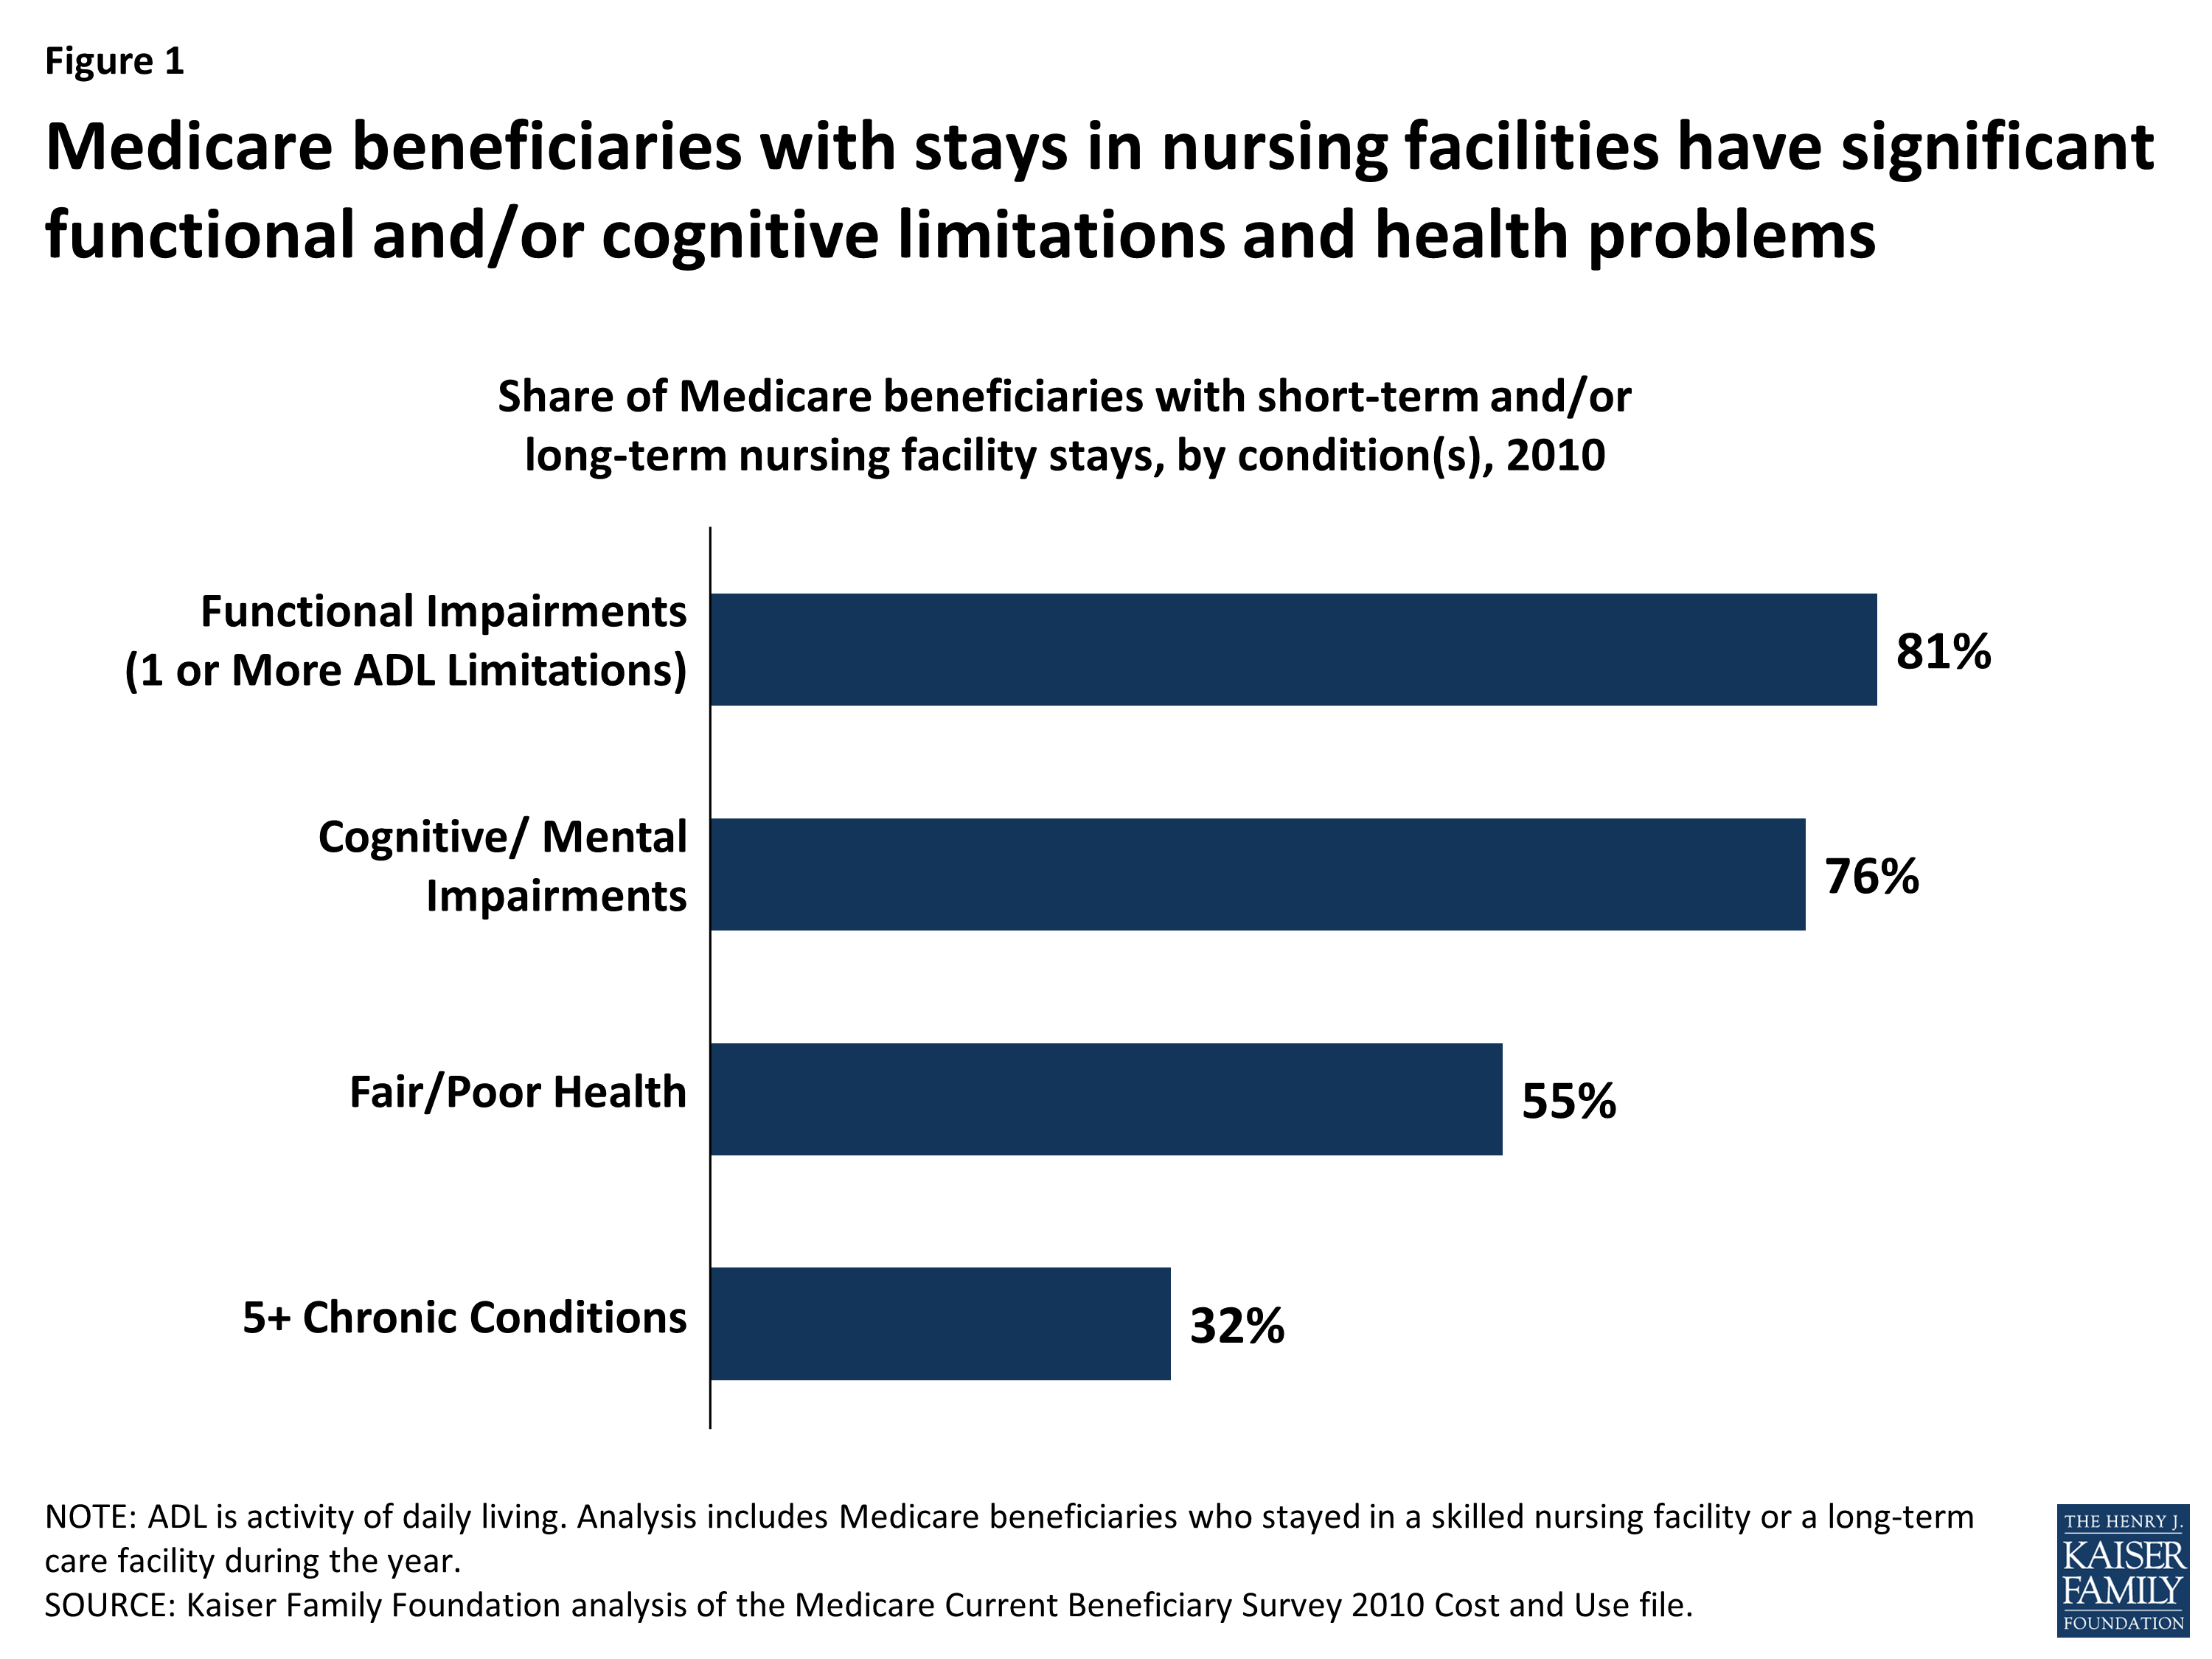
Figure 1: Medicare beneficiaries with stays in nursing facilities have significant functional and/or cognitive limitations and health problems
Nursing Home Characteristics
Nationwide, just over 15,500 nursing homes are certified to provide care to Medicare or Medicaid beneficiaries (Table 1). The vast majority (92 percent) are certified for both programs. Among these nursing homes, most (70 percent) are for-profit, about a quarter (24 percent) are non-profit and a very small share are government-owned (6 percent). On average, nursing homes have 106 beds, with 19 percent having fewer than 60 beds and almost 30 percent having more than 120. Among the nursing homes certified by Medicare or Medicaid, 10 percent are part of Continuing Care Retirement Communities (CCRCs), which typically offers housing options with a full range of assistance levels. Most nursing homes (95 percent) are freestanding facilities, while 5 percent are housed within a hospital.
| Table 1: Nursing Homes Certified by Medicare and/or Medicaid in the US, 2015 | |
| Number of Nursing Homes | 15,505 |
| Number of Nursing Home Residents | 1,366,044 |
| Characteristic | Percent of Nursing Homes |
| Certification | |
| Medicare only | 5% |
| Medicaid only | 3% |
| Medicare and Medicaid | 92% |
| Tax status | |
| For-profit | 70% |
| Non-Profit | 24% |
| Government | 6% |
| Size | |
| < 60 beds | 19% |
| 60 – 120 beds | 52% |
| > 120 beds | 29% |
| CCRC Affiliation | |
| CCRC | 10% |
| Not affiliated with CCRC | 90% |
| In-hospital Status | |
| Freestanding | 95% |
| Within a Hospital | 5% |
| NOTE: CCRC is continuing Care Retirement Community. Includes only nuring homes certified by Medicare and/or Medicaid. | |
| SOURCE: Kaiser Family Foundation analysis of Nursing Home Compare data, February 2015. | |
Recurrent Problem: Reports of Poor Quality Care in Nursing Homes
Serious concerns about the quality of care in nursing homes have been reported for decades. In 1986, an Institute of Medicine (IOM) report identified several problem areas with nursing home care, including staffing capacity, training, and supervision and made several recommendations regarding oversight and regulation to enhance nursing home standards, particularly those that received federal and state funding.4 Subsequently, Congress enacted landmark legislation in the Omnibus Budget Reconciliation Act of 1987 (OBRA 87) that, among other provisions, established new minimum requirements for nursing homes eligible to receive Medicare or Medicaid payment, and put in place added enforcement systems.5 To carry out these provisions, the federal government contracts with states to inspect nursing homes, but states may place additional conditions on nursing homes to meet state licensing requirements. For example, some states require a registered nurse (RN) to be on duty 24 hours a day for nursing homes with 100 or more residents—higher than the federal minimum standard which requires an RN on duty for at least at least 8 consecutive hours per day, 7 days per week, regardless of the number of residents in the nursing home.6
In some respects, the quality of care in nursing homes has improved since OBRA 87—such as lower use of physical restraints—but nursing home deficiencies and citations continue to be prevalent.7 Over the past decade, multiple studies, including those conducted by the Government Accountability Office (GAO) and the HHS Office of the Inspector General (OIG) have found that significant proportions of patients are in nursing homes cited with deficiencies that are serious enough to cause harm or immediate jeopardy.8 Recent media reports have also described circumstances that raise significant concerns about the quality of care in nursing homes.9
Nursing home Compare and the Five-Star Quality Rating System
To help consumers and their families find a nursing home and to encourage nursing homes to achieve higher quality through public reporting of nursing home performance, CMS launched its Nursing Home Compare website in 1998. In 2008, CMS modified the website to provide more user-friendly star ratings based on quality scores for all Medicare- and Medicaid-certified nursing homes. While the ratings provided additional means for consumers to compare nursing homes, some have criticized the heavy reliance on self-reported data.10 In February 2015, CMS modified its star rating system to begin to address some of these concerns, and is planning additional changes in the future.
The current CMS Five-Star Quality Rating System calculates an overall star rating—with one star being the lowest possible score and five being the highest—based on performance in three types of measures, each of which also has its own five-star rating. These three domains are: 1) state health inspections; 2) staffing ratios; and 3) quality measures. We summarize these domains below and briefly describe how CMS derives a score for each. For more detailed information on the methodology used to calculate individual components and overall quality measures, see Design for Nursing Home Compare Five-Star Quality Rating System: Technical Users’ Guide.11
- State Health Inspection measures are based on state health inspection reports which provide multiple types of information on nursing home deficiencies identified during annual inspections, including the number and severity of problems, revisits needed to document that deficiencies were corrected, and actions taken by nursing homes to investigate complaints. CMS weights deficiencies that cause “immediate jeopardy to resident health or safety” more heavily when determining each nursing home’s score, particularly when the infractions are widespread and not isolated incidents. Examples of these types of infractions include: failure to prevent or treat residents’ pressure ulcers (bedsores that, if infected, can lead to sepsis and pain); failure to maintain food storage in areas free of pests including rodents and roaches; environmental hazards, such as electrical fires; and failure to follow up on head injuries and fractures among residents.
—
To help control for variation among states that results from differences in state practices, such as state licensing requirements, the star ratings for State Health Inspections are based on the ranked performance of facilities within a state. That is to say, the star ratings are curved, wherein 5-star ratings are reserved for the 10 percent of nursing homes that received the highest score on the State Health Inspection measure, and 1-star ratings are reserved for the 20 percent of nursing homes that scored the lowest. The remaining 70 percent of nursing homes are evenly assigned 2, 3, and 4 stars. In every state, therefore, 20 percent of nursing homes receive a rating of 1 star.
- Staffing measures incorporate information reported by nursing homes on the ratio of nurses to residents, as measured by nurse hours per resident days. This measure adjusts for patient care needs (based on patient acuity levels) at each nursing home and includes calculations of both RN hours per resident days and total nurse hours (including additional types of nurses, such as certified nurse aids) per resident days. To receive a 5-star rating in staffing, a nursing home must have staffing levels that equate to 5 stars for both RNs and total nurses. A nursing home with fewer than 3 hours of total nursing staff per resident days and fewer than 16 minutes of RN time per resident days (both adjusted for patient care needs) would be assigned 1 star in the Staffing star rating.12
- Quality measures are calculated using the Minimum Data Set (MDS)—an assessment instrument that nursing homes use to document the function and health status of their patients. (The MDS is used for a number of purposes, including determining Medicare payment for patients receiving skilled nursing facility care). Currently, the star ratings incorporate 11 selected measures from the MDS, some of which apply to short-stay patients and the others to long-stay patients. Examples of these measures include the percent of residents with new or worsened pressure sores, the percent of residents who self-report moderate to severe pain, and the percent of residents who experienced falls with major injury. For the total quality score, each of the 11 selected measures is calculated separately to adjust for differences in prevalence, with each measure given equal weight.
- Overall star ratings are a composite of the three measure domains, with the State Health Inspection score forming the core of the Overall star rating. Several algorithms apply to the Overall star rating calculation with the general goal of preventing nursing homes from receiving high Overall star ratings if they received low ratings in one or more individual categories. For example, if a nursing home received only 1 star in its State Health Inspection measure, then its maximum Overall star rating is capped at 2 stars. Also, if a nursing home receives only 1 star in the Quality measures category, its Overall rating is reduced by 1 star.
Changes to the Star Rating System
The current Five-Star Quality Rating System, described above, incorporates methodological changes that CMS implemented in February 2015. The impetus for changing the methodology for determining star ratings stemmed from a number of factors. One consideration was the high proportion of nursing homes in the 4- and 5-star ranges. Before the new methodology was implemented, 78 percent of nursing homes scored 4 or 5 stars in the Quality measures category and 54 percent of all nursing homes had 4 or 5 stars overall.13 With relatively large shares of nursing homes in the 4-and 5-star rating group, questions arose as to consumers’ ability to assess the relative performance among nursing homes in their area. In response, CMS rebased its measurement system by increasing the number of points necessary to earn a Quality measure star rating of two or more stars and by changing the scoring method for the staffing measures. CMS also incorporated two new indicators into the Quality measures category regarding the use of antipsychotic medication (one measure for short-stay residents and one for long-stay residents) in response to multiple research studies showing the risks associated with overuse of antipsychotic medication use in nursing homes.
CMS officials anticipate making additional changes to improve the validity of the star rating system in the future. One slated change—required by provisions in the ACA—will be to incorporate staffing data collected quarterly from electronic systems used for payroll reporting, rather than rely exclusively on self-reported staffing levels. The goal of using the electronic payroll data sources is to obtain more information, with greater accuracy, on total staffing hours and staffing turnover. In 2015, CMS also instituted special unannounced, on-site inspections of a nationwide sample of nursing homes to validate self-reported quality data, in addition to the recertification surveys that are conducted at least every 15 months for every nursing home.14
Methods
This issue brief presents data based on an analysis of the Nursing Home Compare database, which is publicly available on the CMS website and updated monthly. This analysis uses data from the February 2015 release. The Nursing Home Compare database provides individual nursing home information on over 15,000 nursing homes certified by Medicare or Medicaid, such as each nursing home’s name, location, size, and number of recorded deficiencies and fines. This analysis does not include data on facilities that do not receive payment from Medicare or Medicaid, which may include many independent and assisted living facilities. The database used in this analysis provides star ratings for each nursing home in the domains described earlier in this paper (quality, staffing, and state health inspection) and a composite rating. Of these three domains, the state health inspections are the only measures that do not rely on self-reported data—data supplied by the nursing home.
This analysis also uses the 2012-2014 Current Population Survey for state-level estimates of the percent of people age 65 and older living with incomes less than 200 percent of poverty to examine the extent to which star ratings vary by the percent of seniors with low incomes living in each state. Notably, this analysis does not assess the validity or reliability of the CMS Five-Star Quality Rating System; rather it simply shows how the ratings vary nationally and by state, and by nursing home characteristics. Also, because the overall star ratings incorporate scores that are curved (assigned based on rankings, rather than raw scores) within each state—particularly the State Health Inspection measure, which is weighted more heavily—it is not entirely possible to draw comparisons between states.
Findings: National and State-Level Snapshot of Nursing Homes by Star Ratings
National Findings
- More than one-third (36 percent) of nursing homes certified by Medicare or Medicaid have overall ratings of 1 or 2 stars (Figure 2). Almost two in five nursing home residents (39 percent) live in these 1- and 2-star nursing homes. A larger share of nursing homes—45 percent—have overall ratings of 4 or 5 stars, accounting for 41 percent of all nursing home residents.
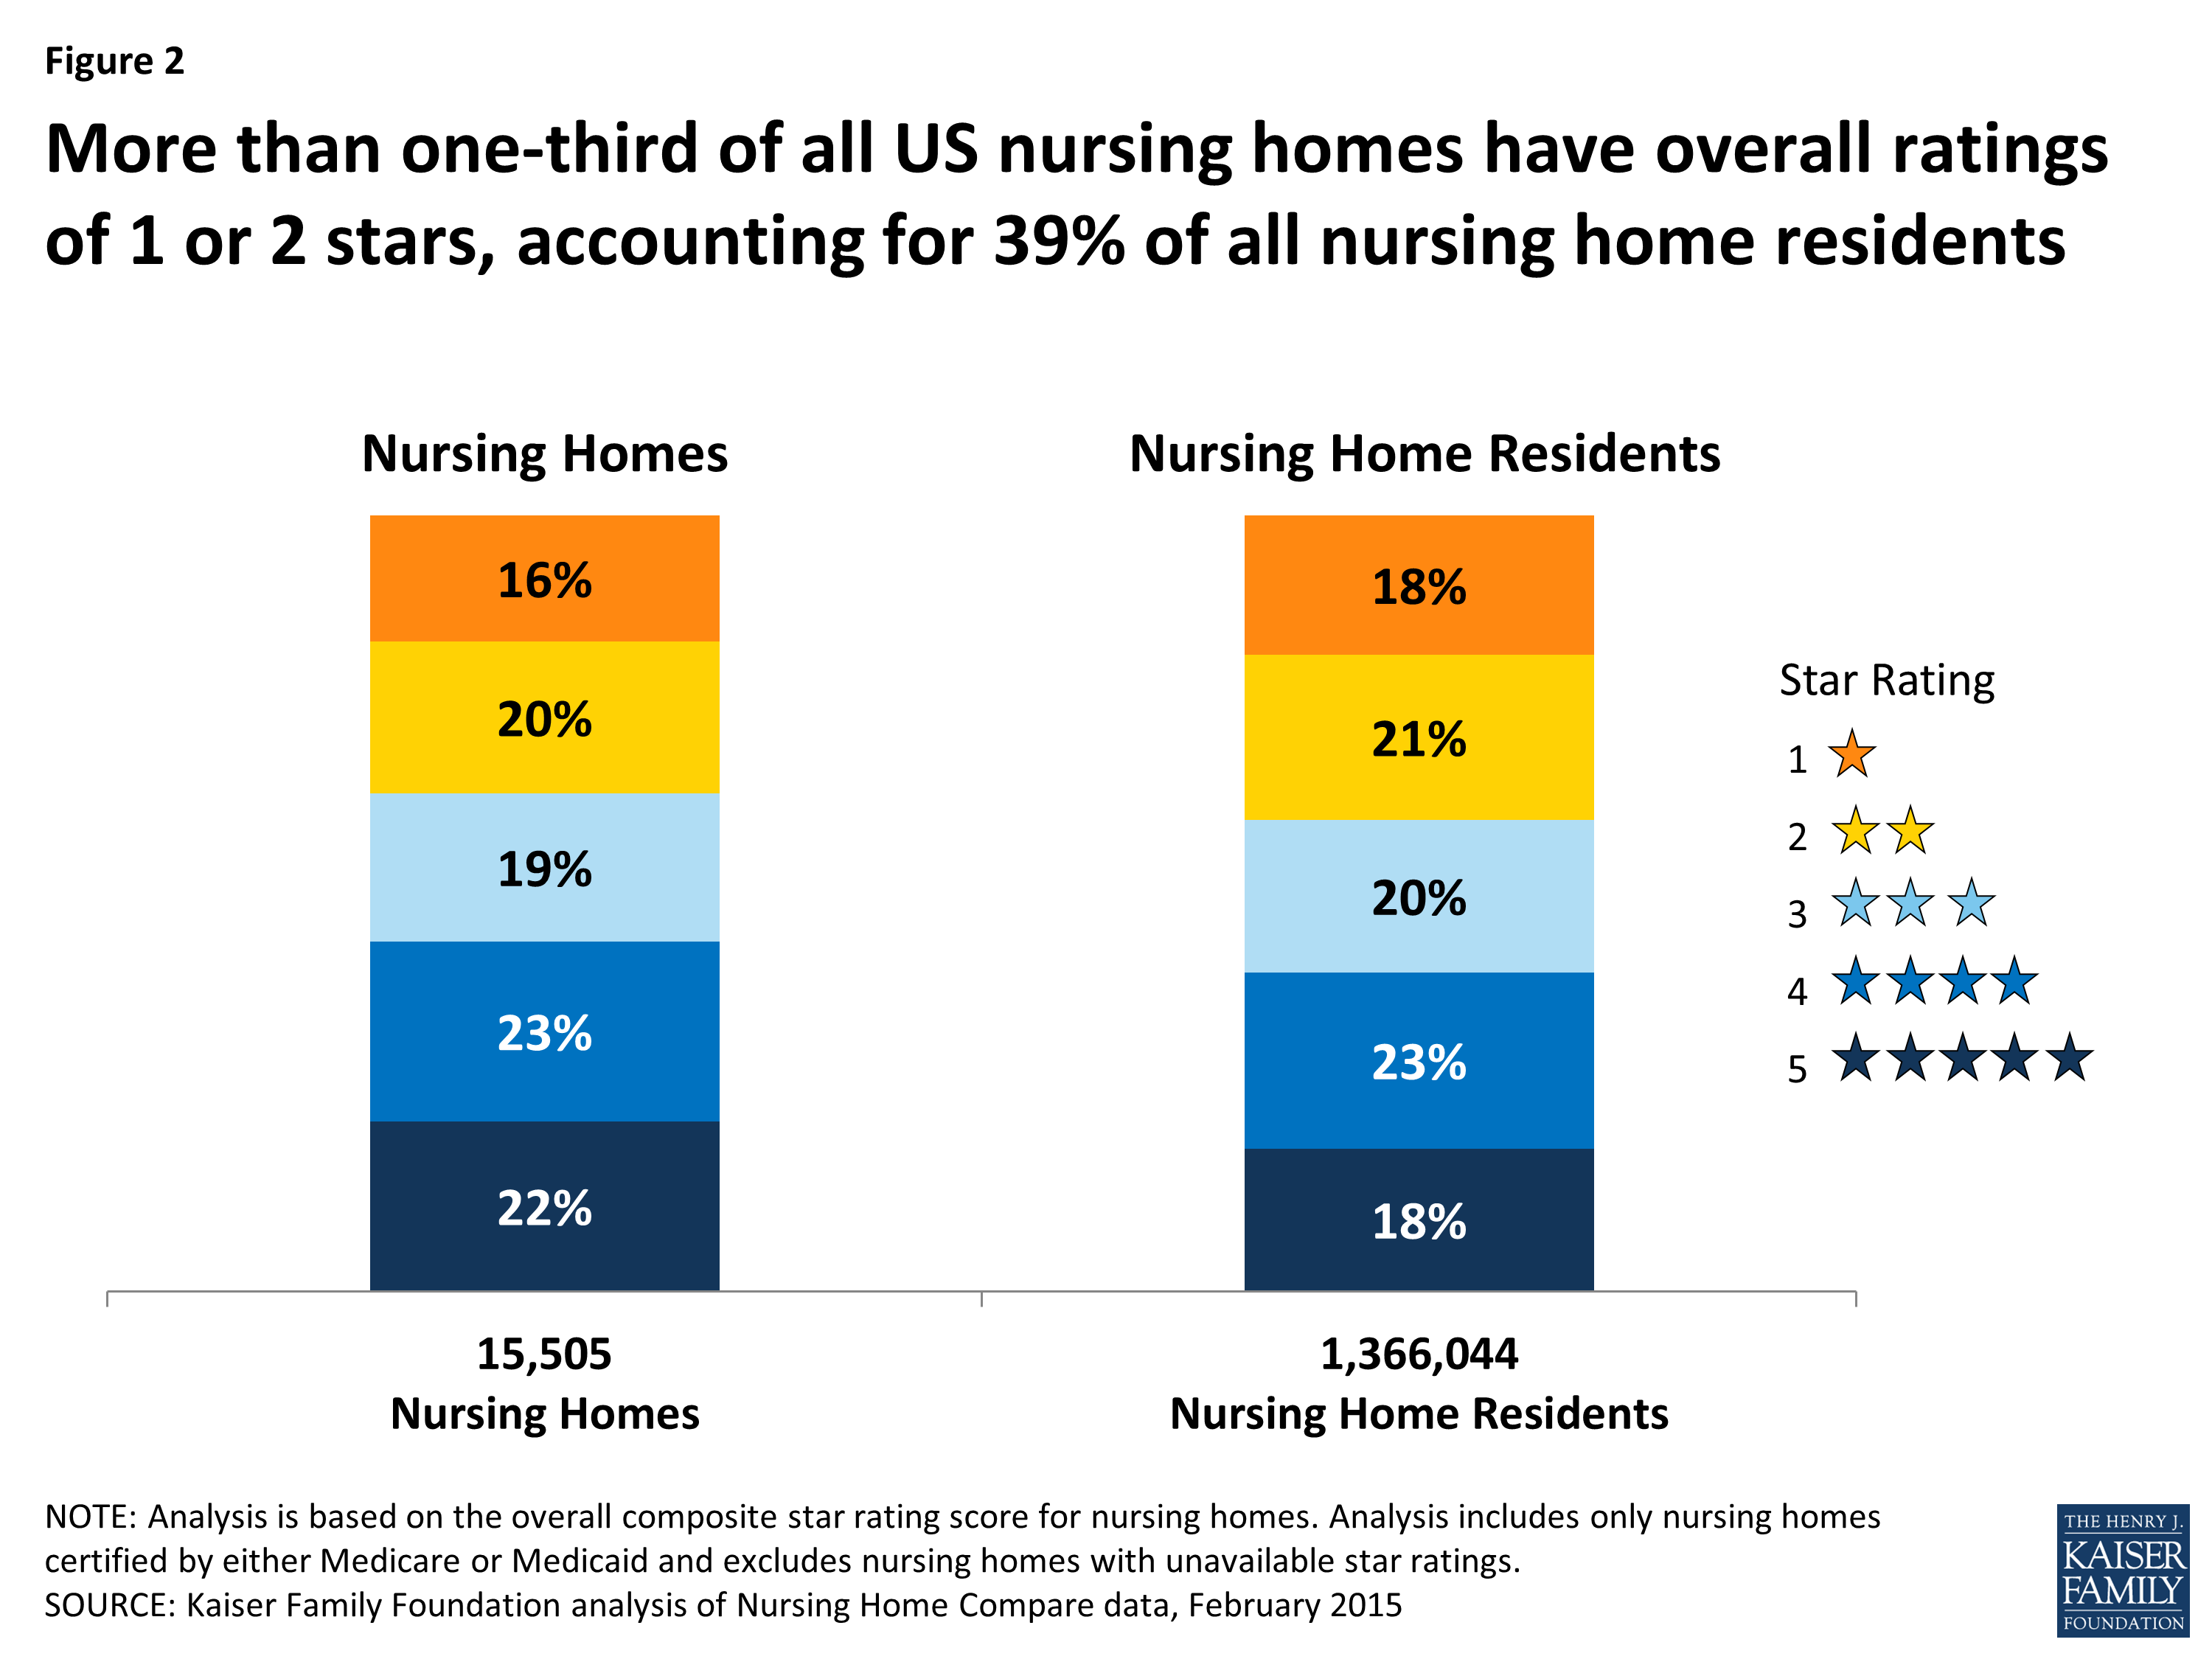
Figure 2: More than one-third of all US nursing homes have overall ratings of 1 or 2 stars, accounting for 39% of all nursing home residents
- Scores tend to be higher on measures that are reported by nursing homes (quality and staffing) than those derived from the State Health Inspection reports (Figure 3). For example, almost half (49 percent) of all nursing homes scored 4 or 5 stars in the self-reported Quality measures category and 44 percent scored 4 or 5 stars in the self-reported Staffing measures category, in contrast to 34 percent in the State Health Inspections category. Conversely, 43 percent of nursing homes had a relatively low score—1 or 2 stars—on the State Health Inspection measures, while 33 percent received 1 or 2 stars for the Quality measures and 24 percent received 1 or 2 stars on the Staffing measures. Notably, just 12 percent of nursing homes received a 5-star rating for the self-reported Staffing measures. As described earlier, the State Health Inspection measures incorporate a curve in the star ratings, which means nursing homes are assigned star ratings based on their ranked score in the state.
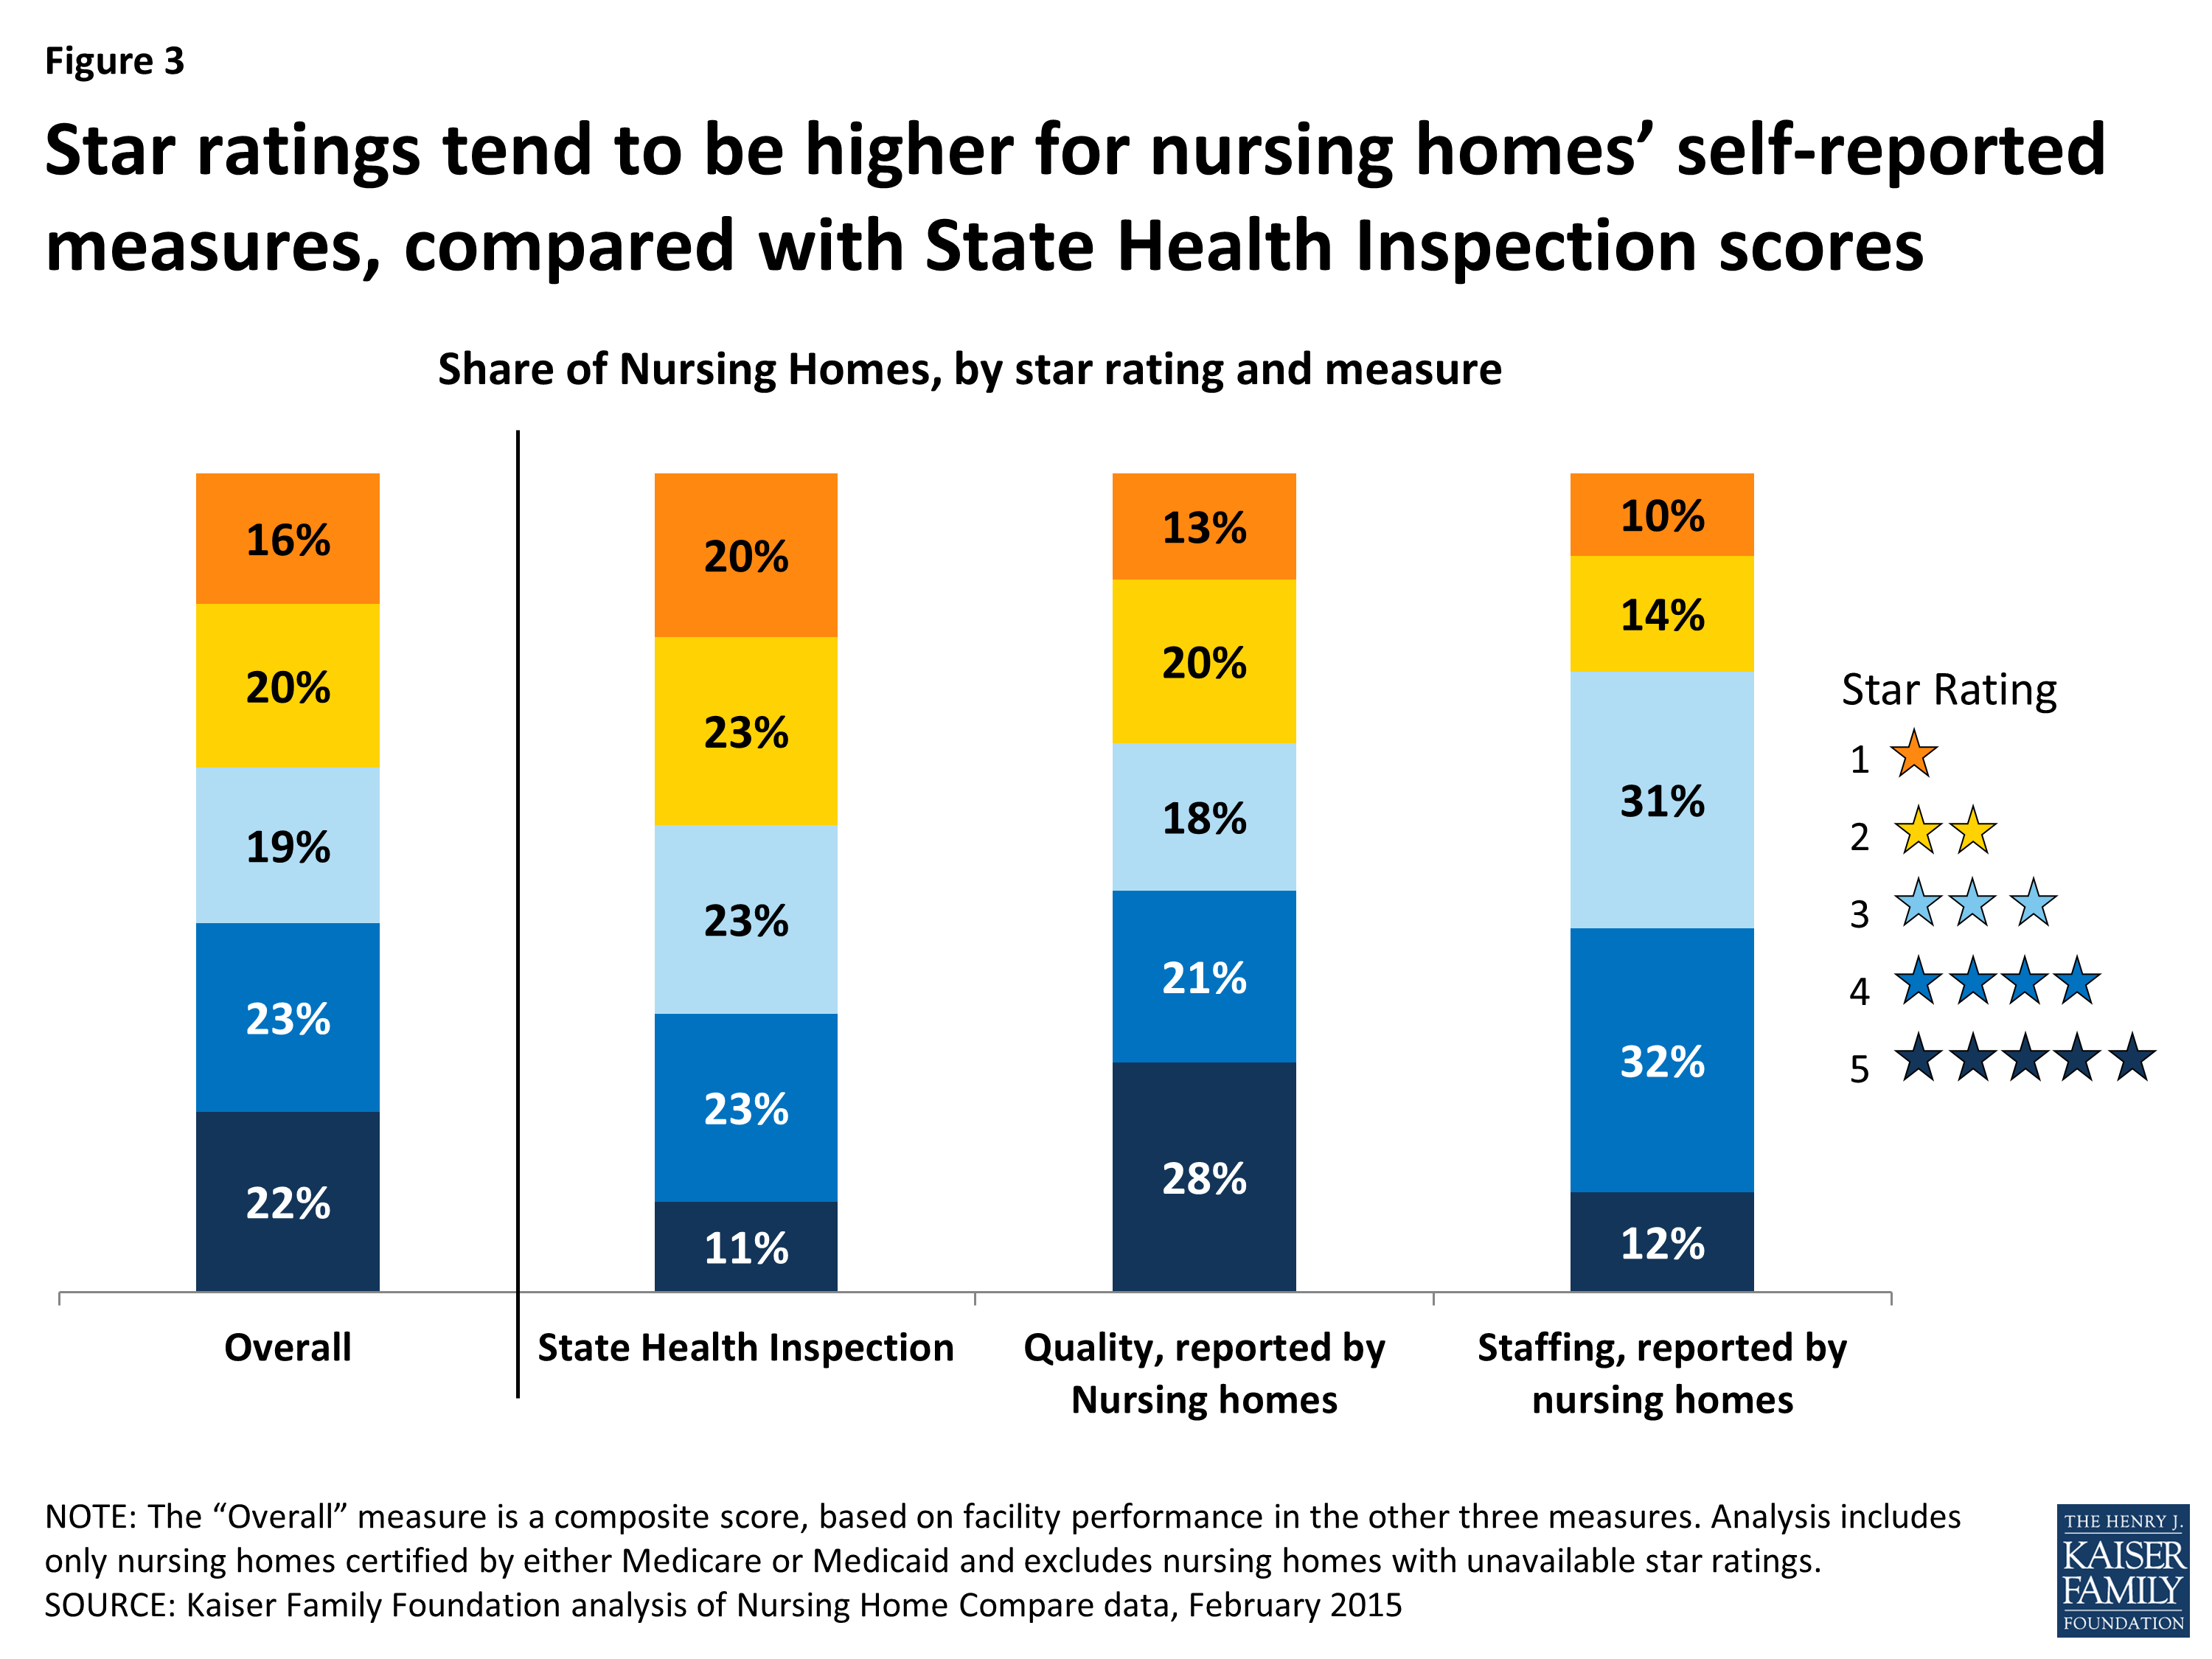
Figure 3: Star ratings tend to be higher for nursing homes’ self-reported measures, compared with State Health Inspection scores
- For-profit facilities, which comprise 70 percent of all nursing homes in the U.S., tend to have lower overall star ratings than non-profit nursing homes (Figure 4). Forty-two percent of for-profit nursing homes received a relatively low overall score (1 or 2 stars), double the rate observed among non-profit nursing homes. One in five for-profit nursing homes received only 1 star, the lowest possible rating, as compared to less than one in ten non-profit nursing homes. This finding is consistent with previous studies conducted by other researchers and GAO which have found greater numbers of deficiencies, including ones that involve actual harm or immediate jeopardy to residents, among for-profit nursing homes compared with non-profit nursing homes.15
- Non-profit nursing homes, which comprise about a quarter of all Medicare-and Medicaid-certified nursing homes, tend to have higher overall star ratings. One-third of all non-profit homes (33 percent) received the highest possible overall score with 5 stars—a substantially higher rate than among for-profit homes (18 percent). Non-profit nursing homes include both corporate and religiously affiliated entities; further analysis (not shown) reveals little differences in the overall scores between different types of non-profit nursing homes certified by Medicare and/or Medicaid.
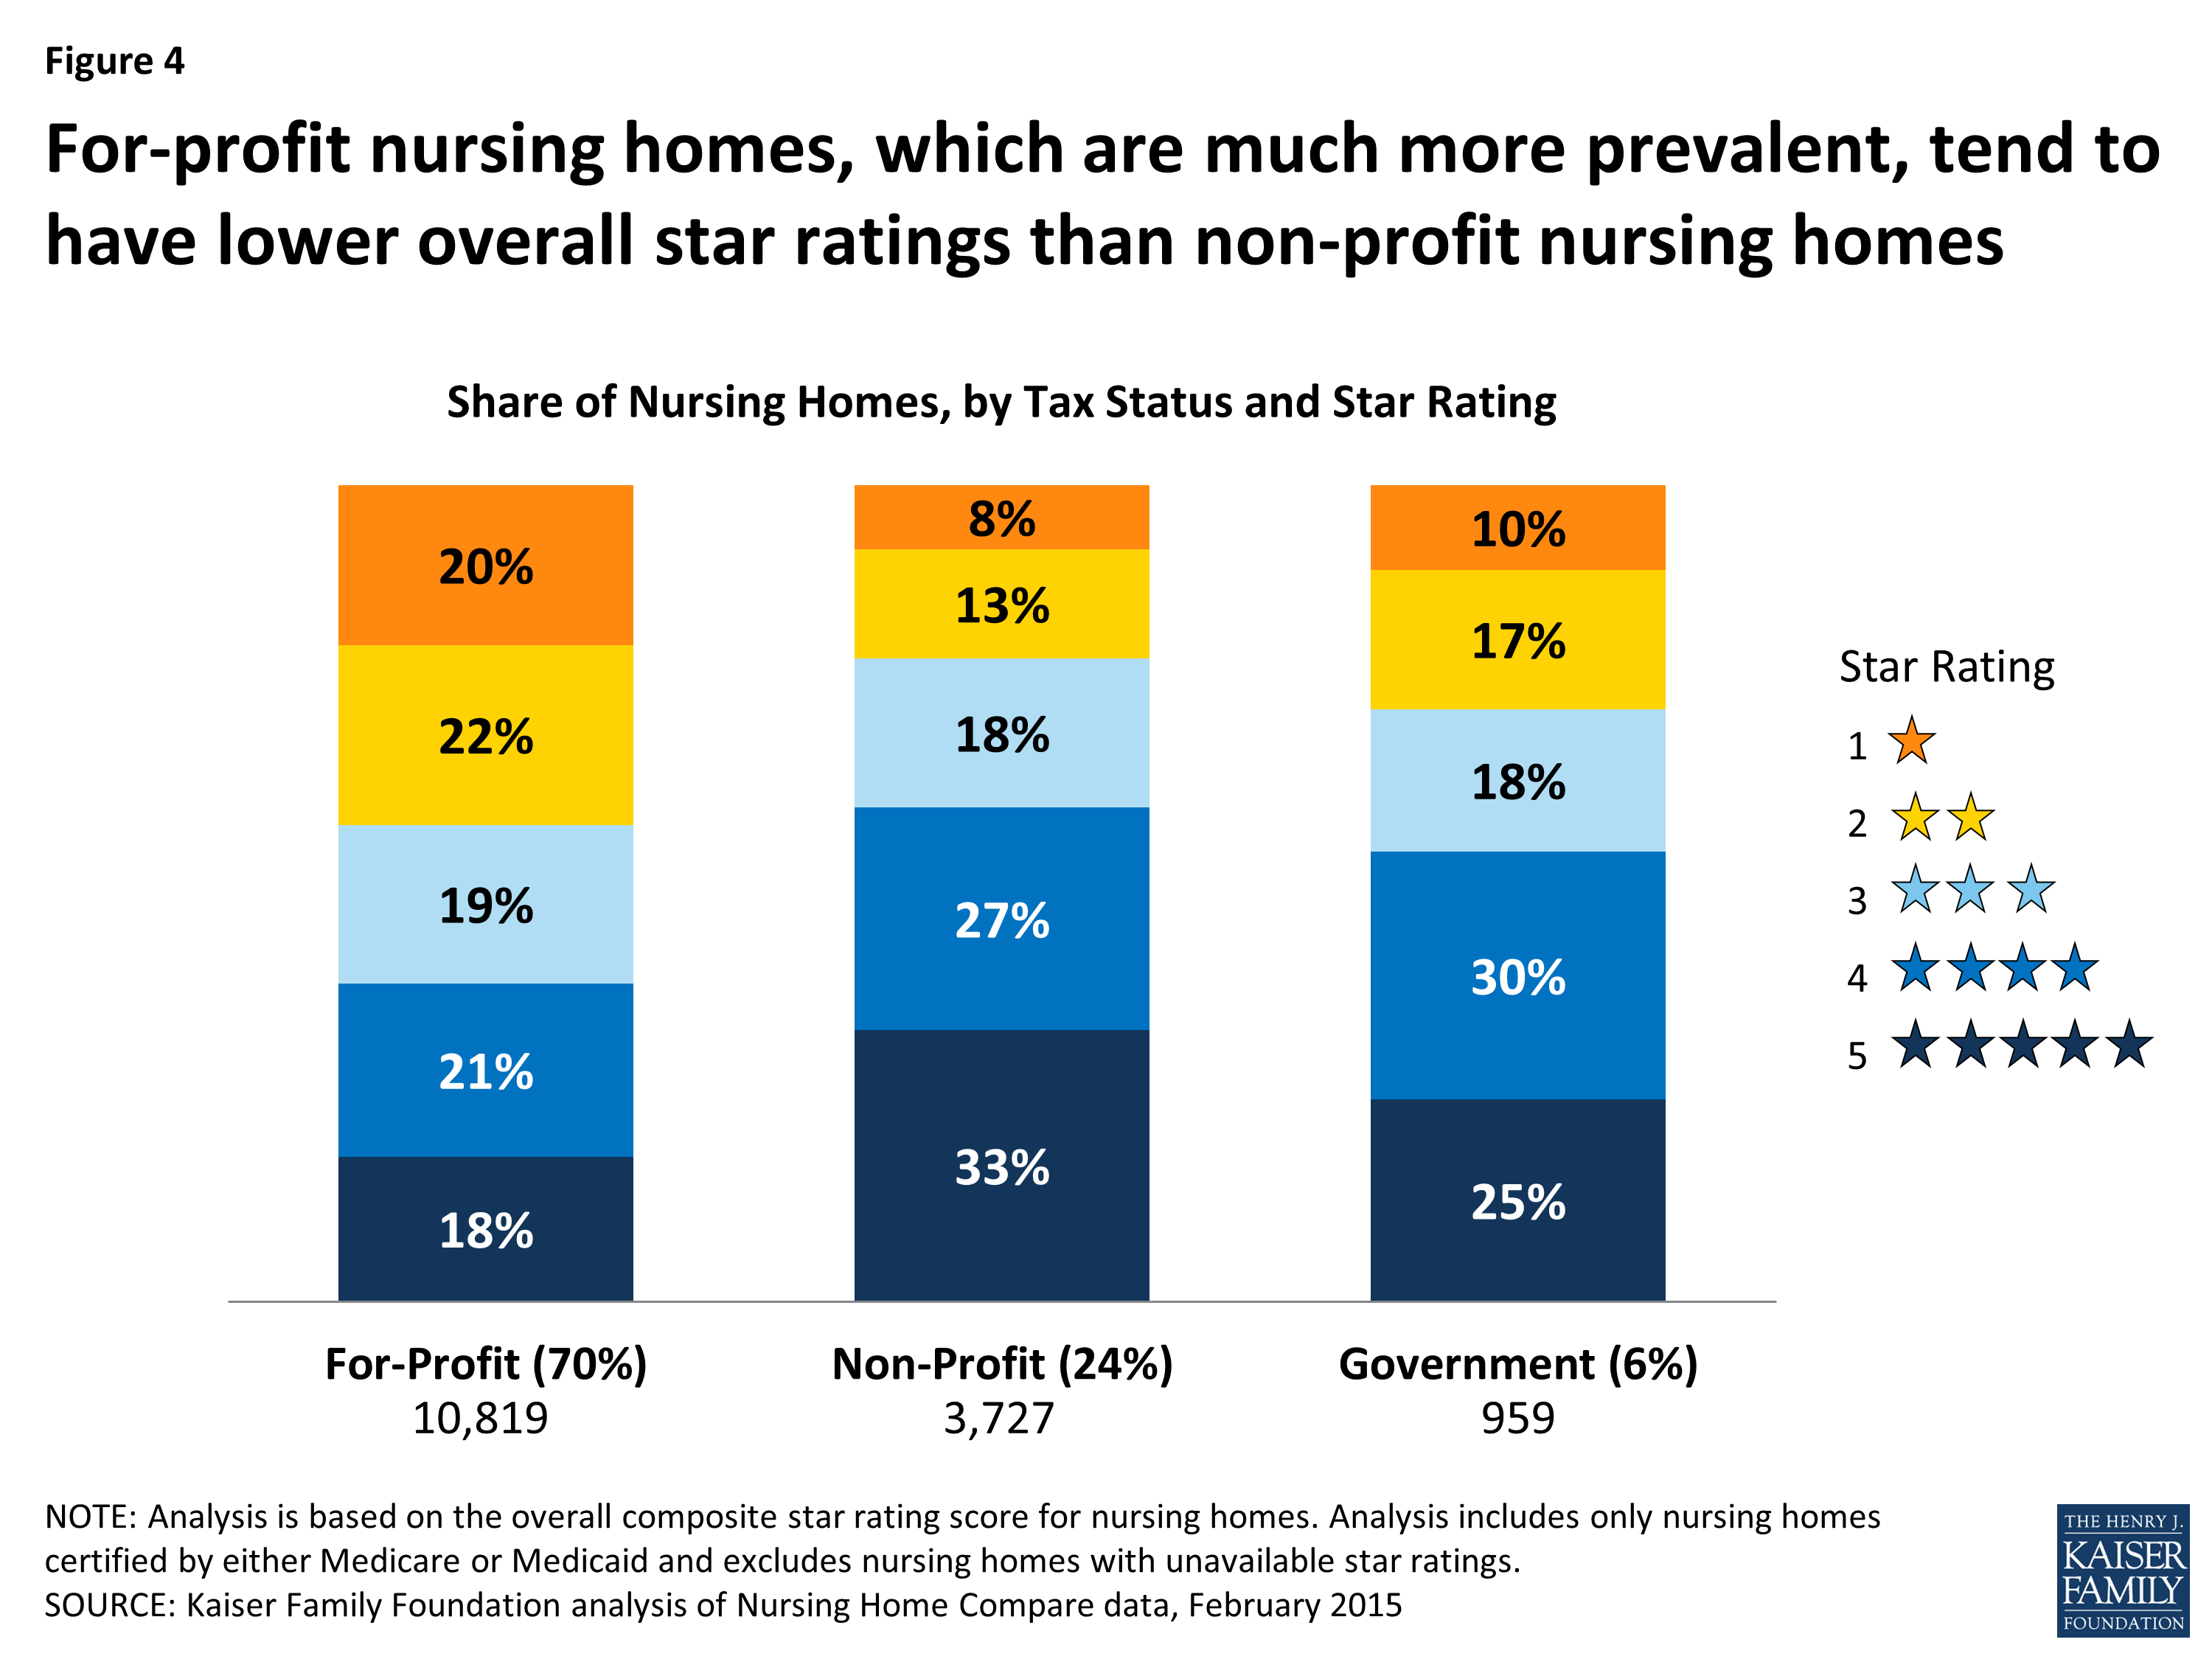
Figure 4: For-profit nursing homes, which are much more prevalent, tend to have lower overall star ratings than non-profit nursing homes
- Smaller nursing homes, with fewer beds, tend to have higher overall star ratings than larger nursing homes (Figure 5). Among nursing homes with fewer than 60 beds, 39 percent received the highest possible overall rating—5 stars—compared to 14 percent of nursing homes with more than 120 beds. GAO has also documented higher rates of deficiencies among relatively large nursing homes.16 This trend is holds true for for-profit and non-profit nursing homes (Figure 6).
- One of the factors influencing lower overall ratings among larger nursing homes with more residents could be their lower scores, on average, on staffing ratio measures. This suggests that smaller nursing homes may have more nursing staff hours per patient than larger homes. For example, in nursing homes with more than 120 beds, 14 percent received only one star on the staffing measure, compared with 4 percent among nursing homes with fewer than 60 beds (not shown).
- There are no federal minimum standards linking the size of nursing homes (by the number of beds or residents) to nurse staffing requirements.17 Regardless of size, nursing homes must have one registered nurse (RN) on duty for at least 8 consecutive hours per day, 7 days per week, and maintain 24-hour nursing coverage (either from an RN, or a licensed practical nurse (LPN)—a certification level which requires less academic training than an RN).18 Some states, however, have established minimum licensing requirements that are linked to the size of nursing homes.19
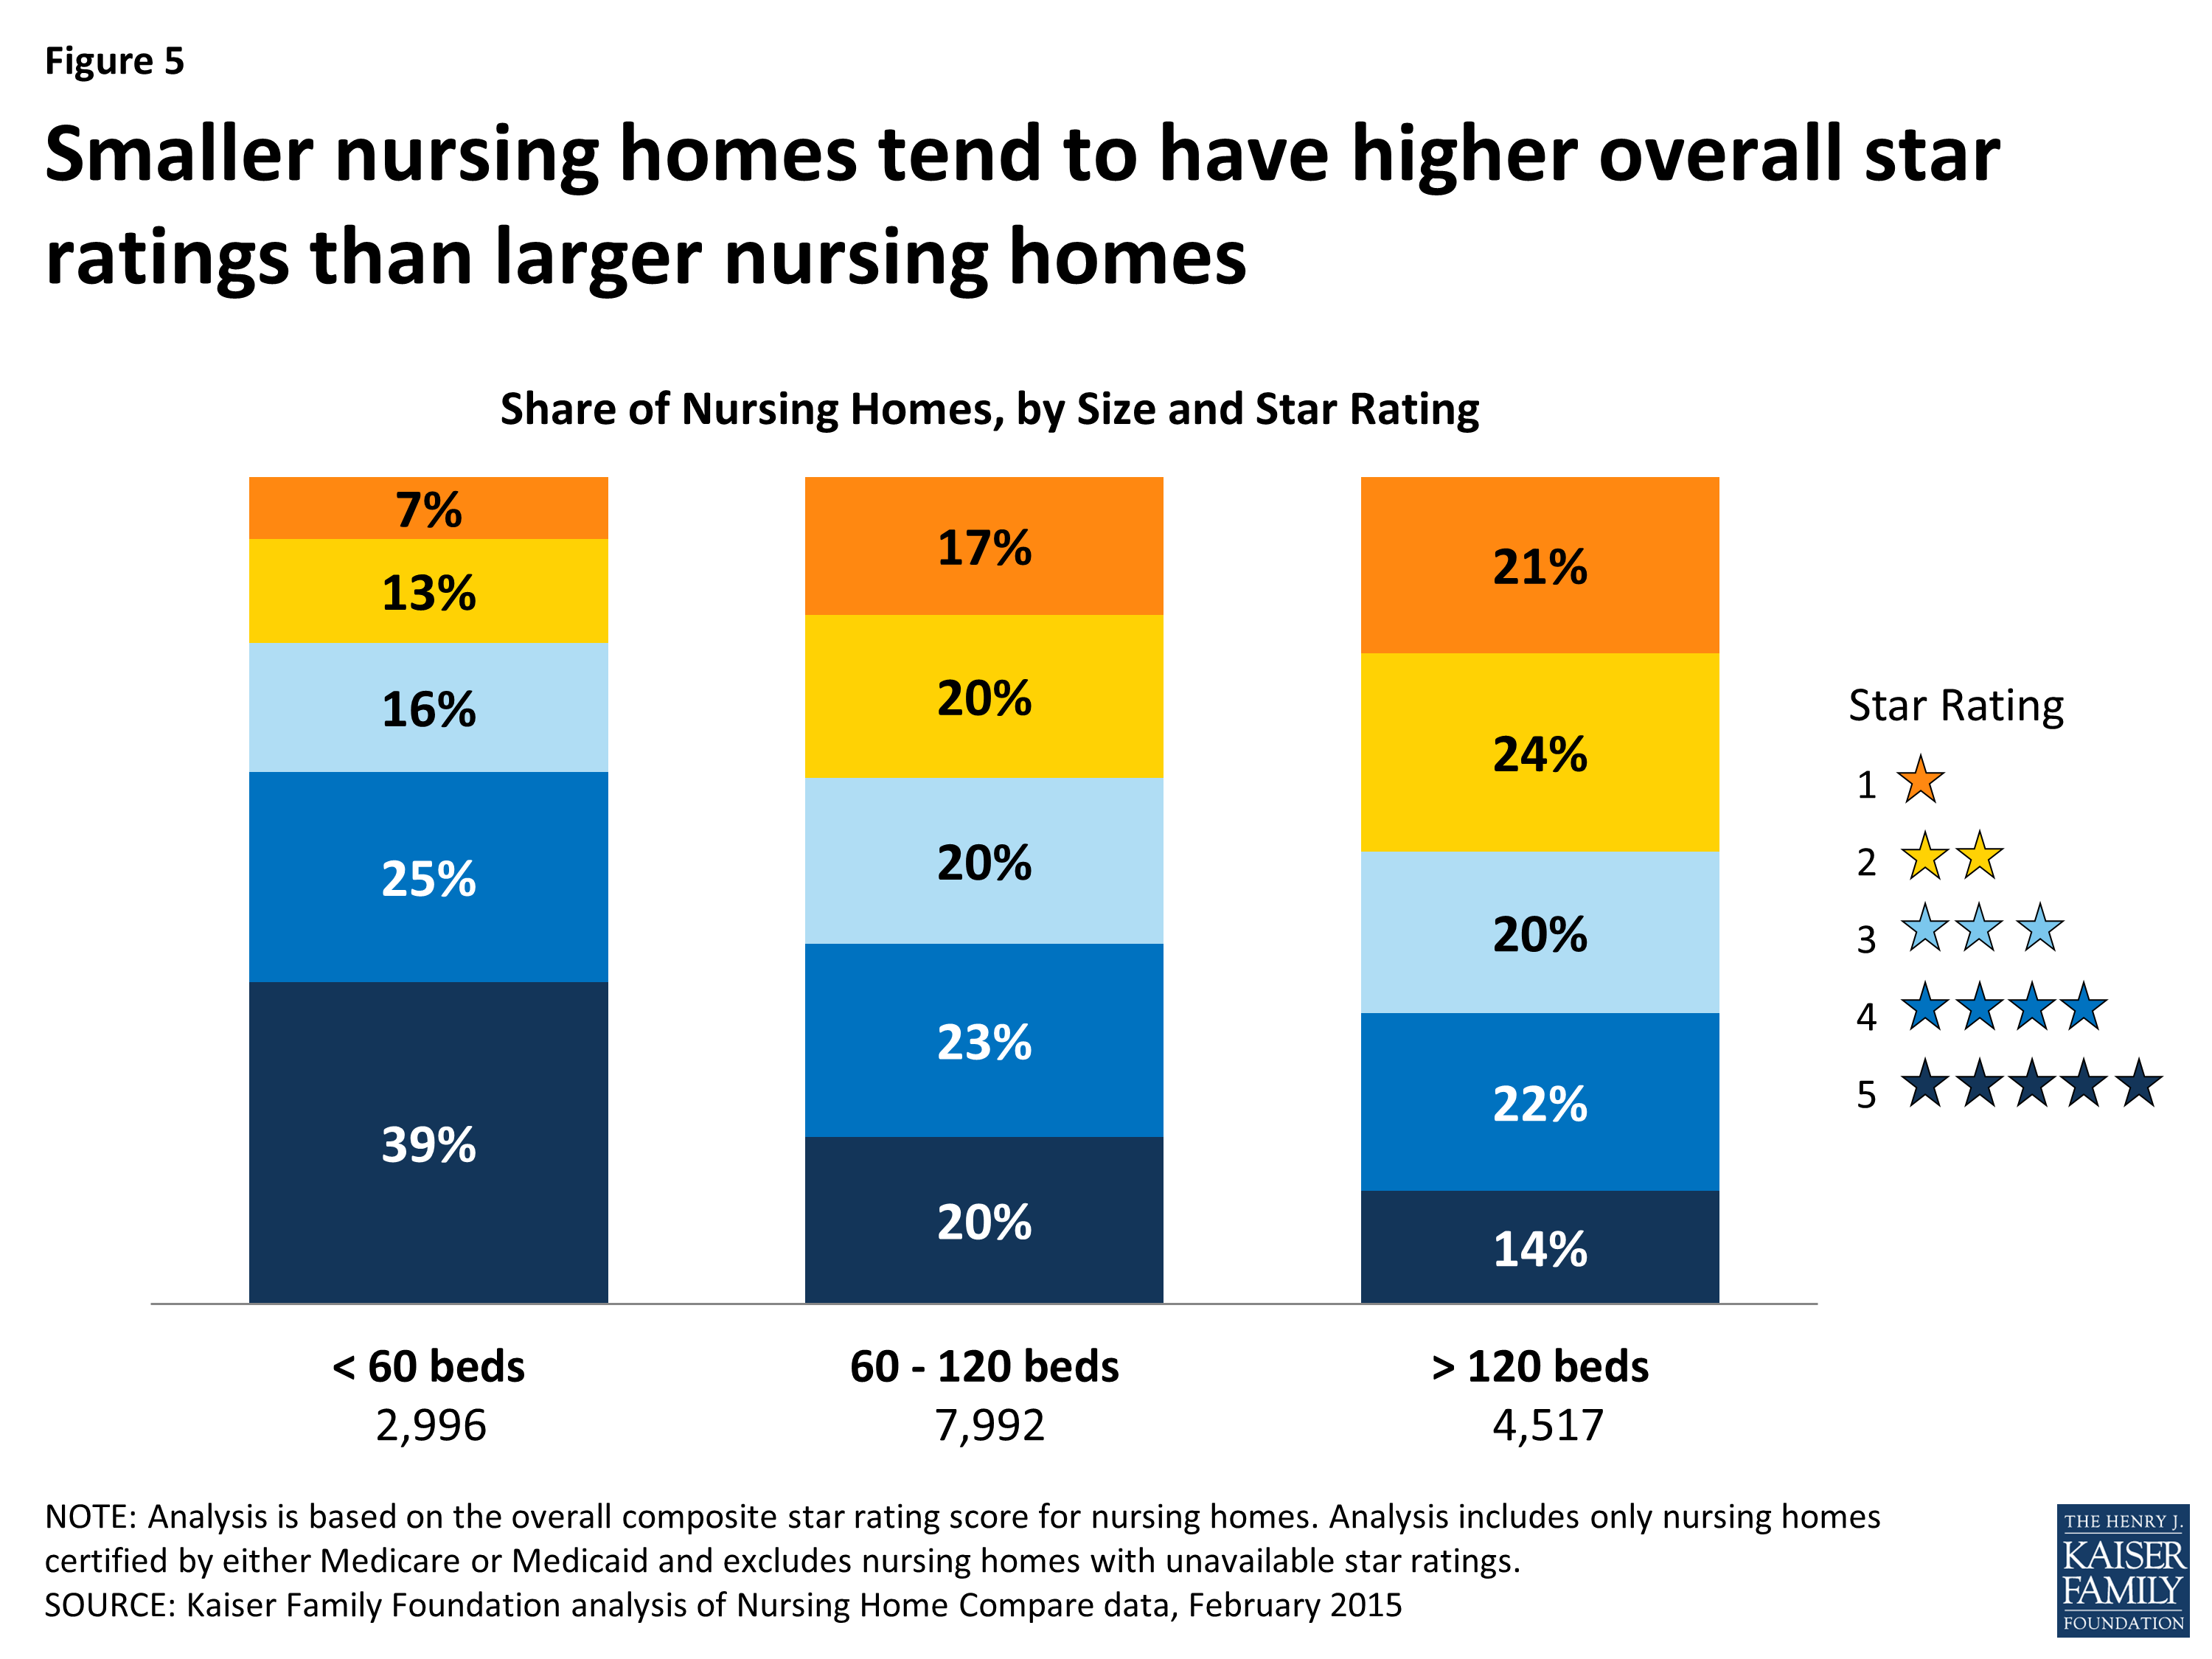
Figure 5: Smaller nursing homes tend to have higher overall star ratings than larger nursing homes
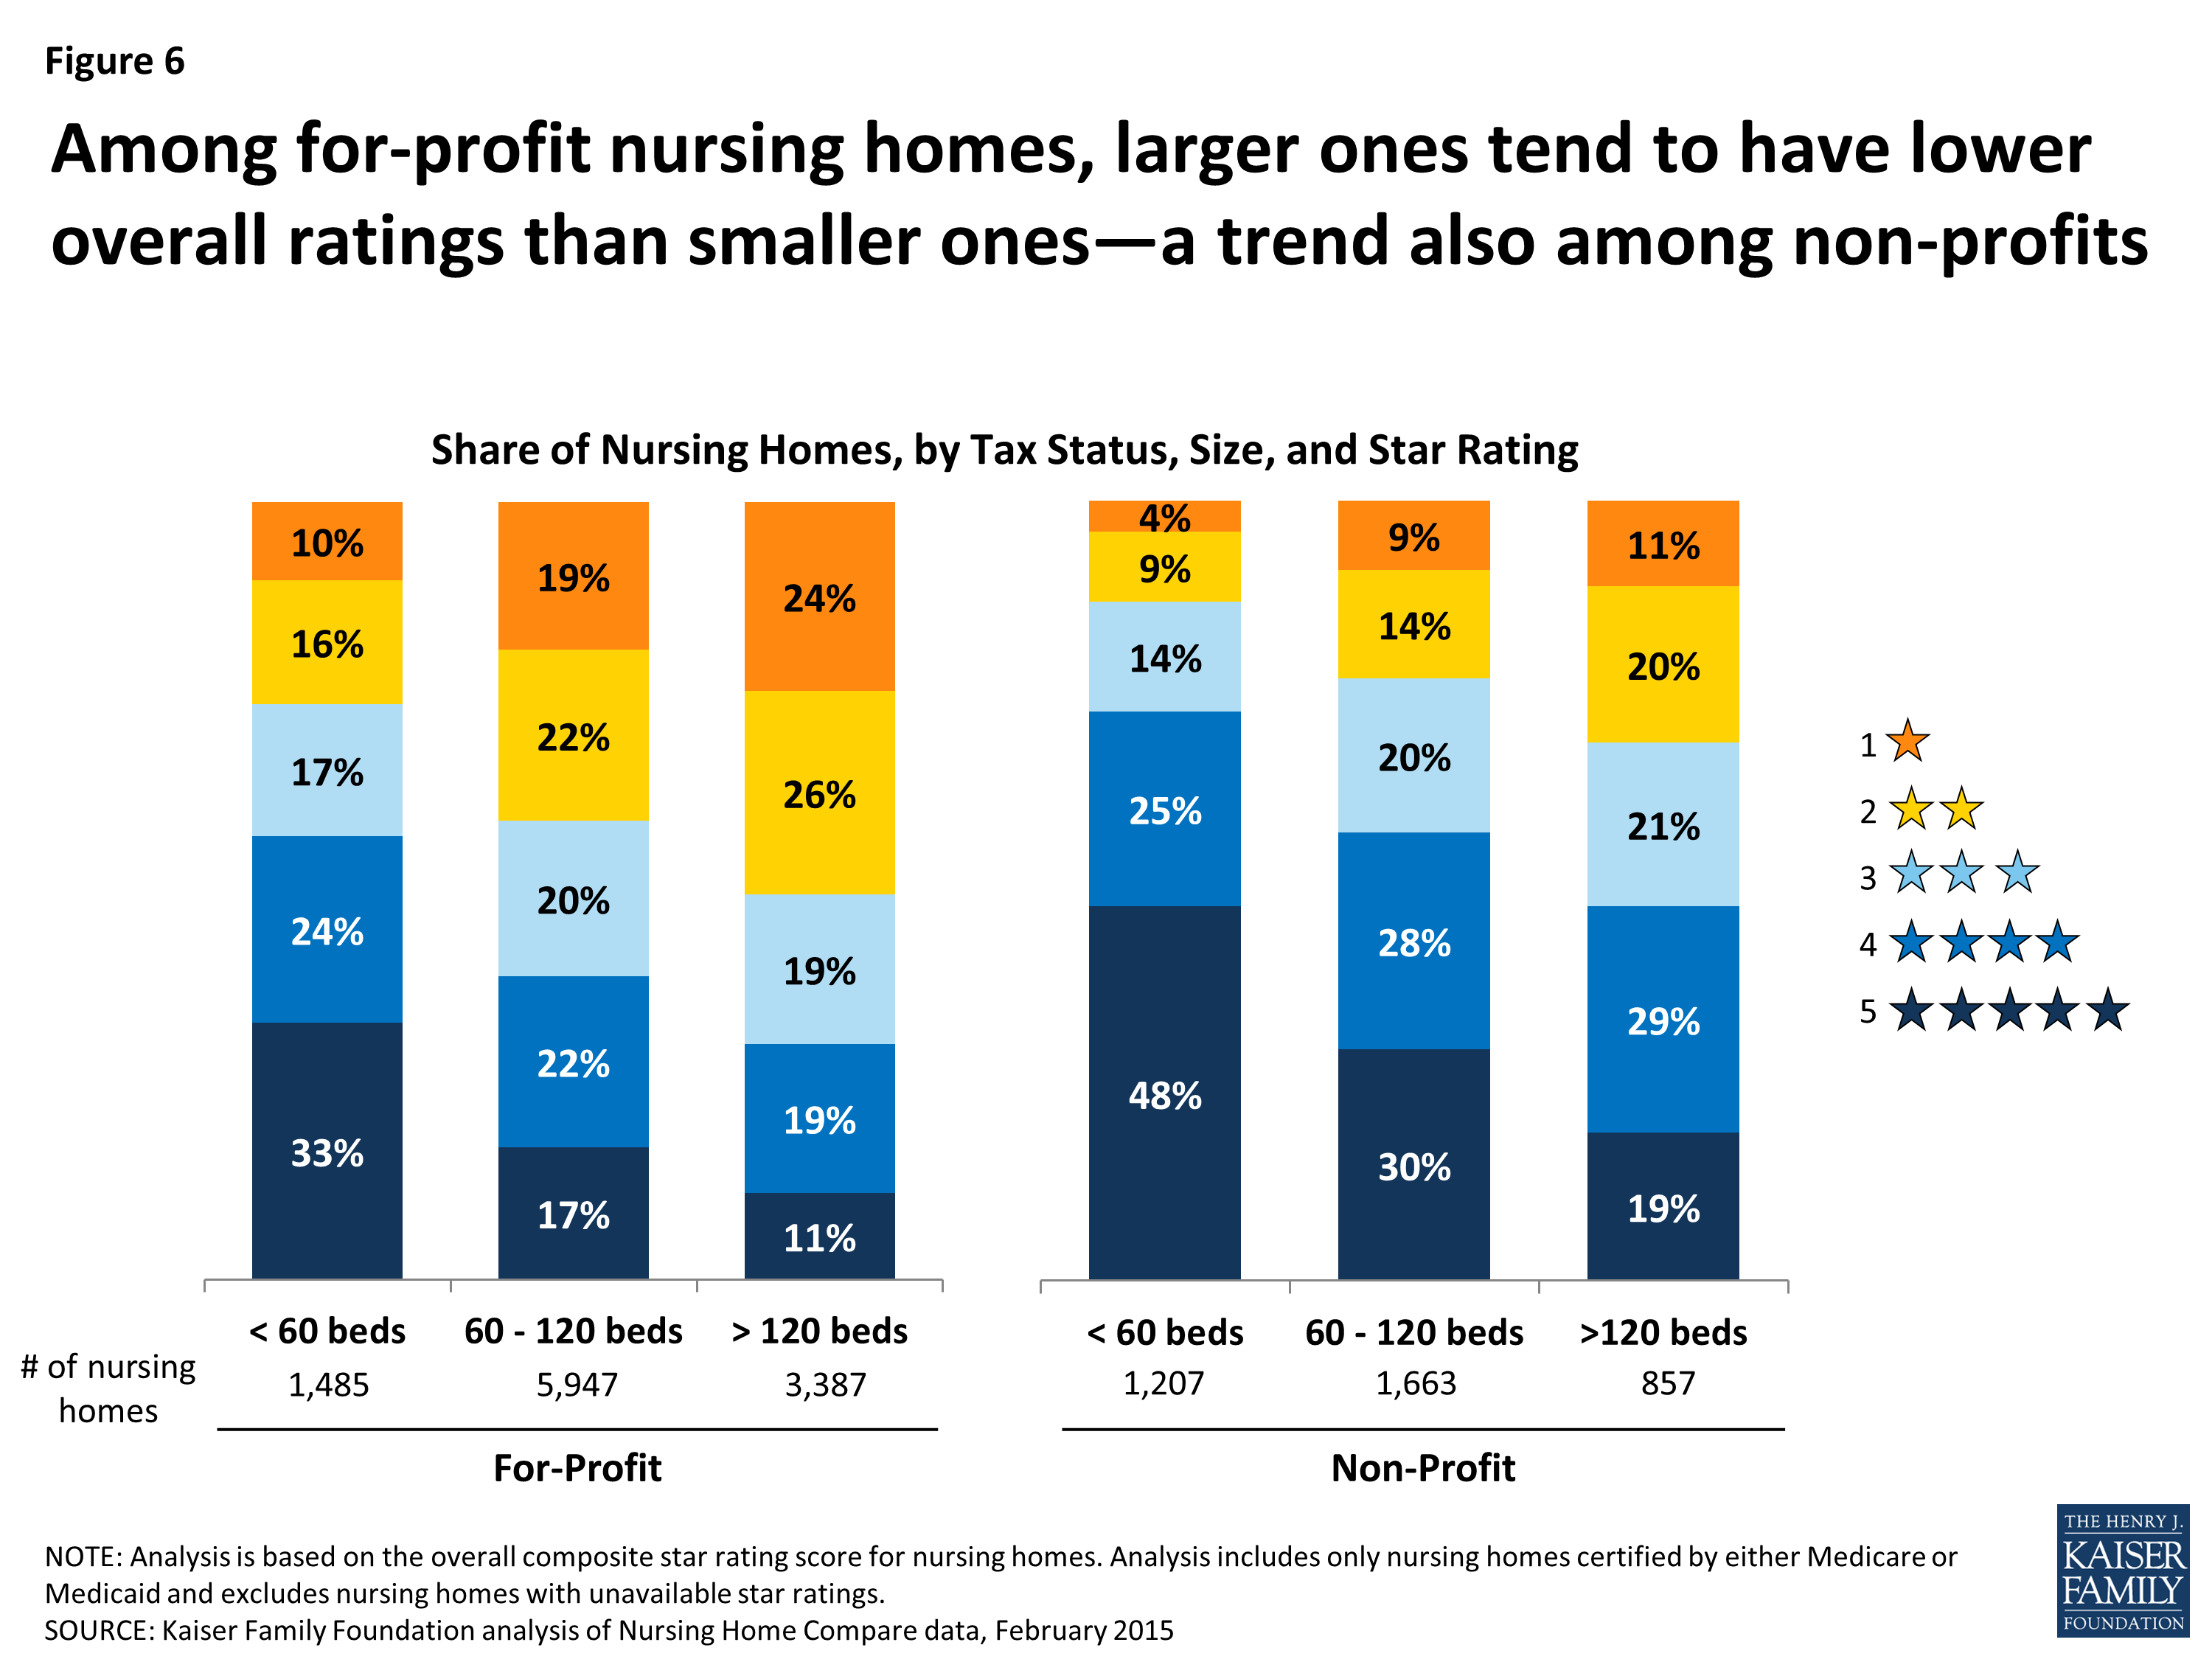
Figure 6: Among for-profit nursing homes, larger ones tend to have lower overall ratings than smaller ones—a trend also among non-profits
- Nursing homes that are part of a continuing care retirement community (CCRC) tend to have higher overall star ratings than nursing homes unaffiliated with a CCRC (Figure 7). Ten percent of all nursing homes certified by Medicare or Medicaid are affiliated with a CCRC. Among them, 64 percent received 4 or 5 star ratings—higher than the 43 percent among nursing homes that are not affiliated with a CCRC. Further analysis finds that 69 percent of CCRC-affiliated nursing homes are non-profits (not shown), which is considerably higher than the 24 percent observed across all nursing homes. Also, CCRC-affiliated nursing homes, with an average bed size of 88 (not shown), tend to be smaller compared with the average across all nursing homes—106 beds.
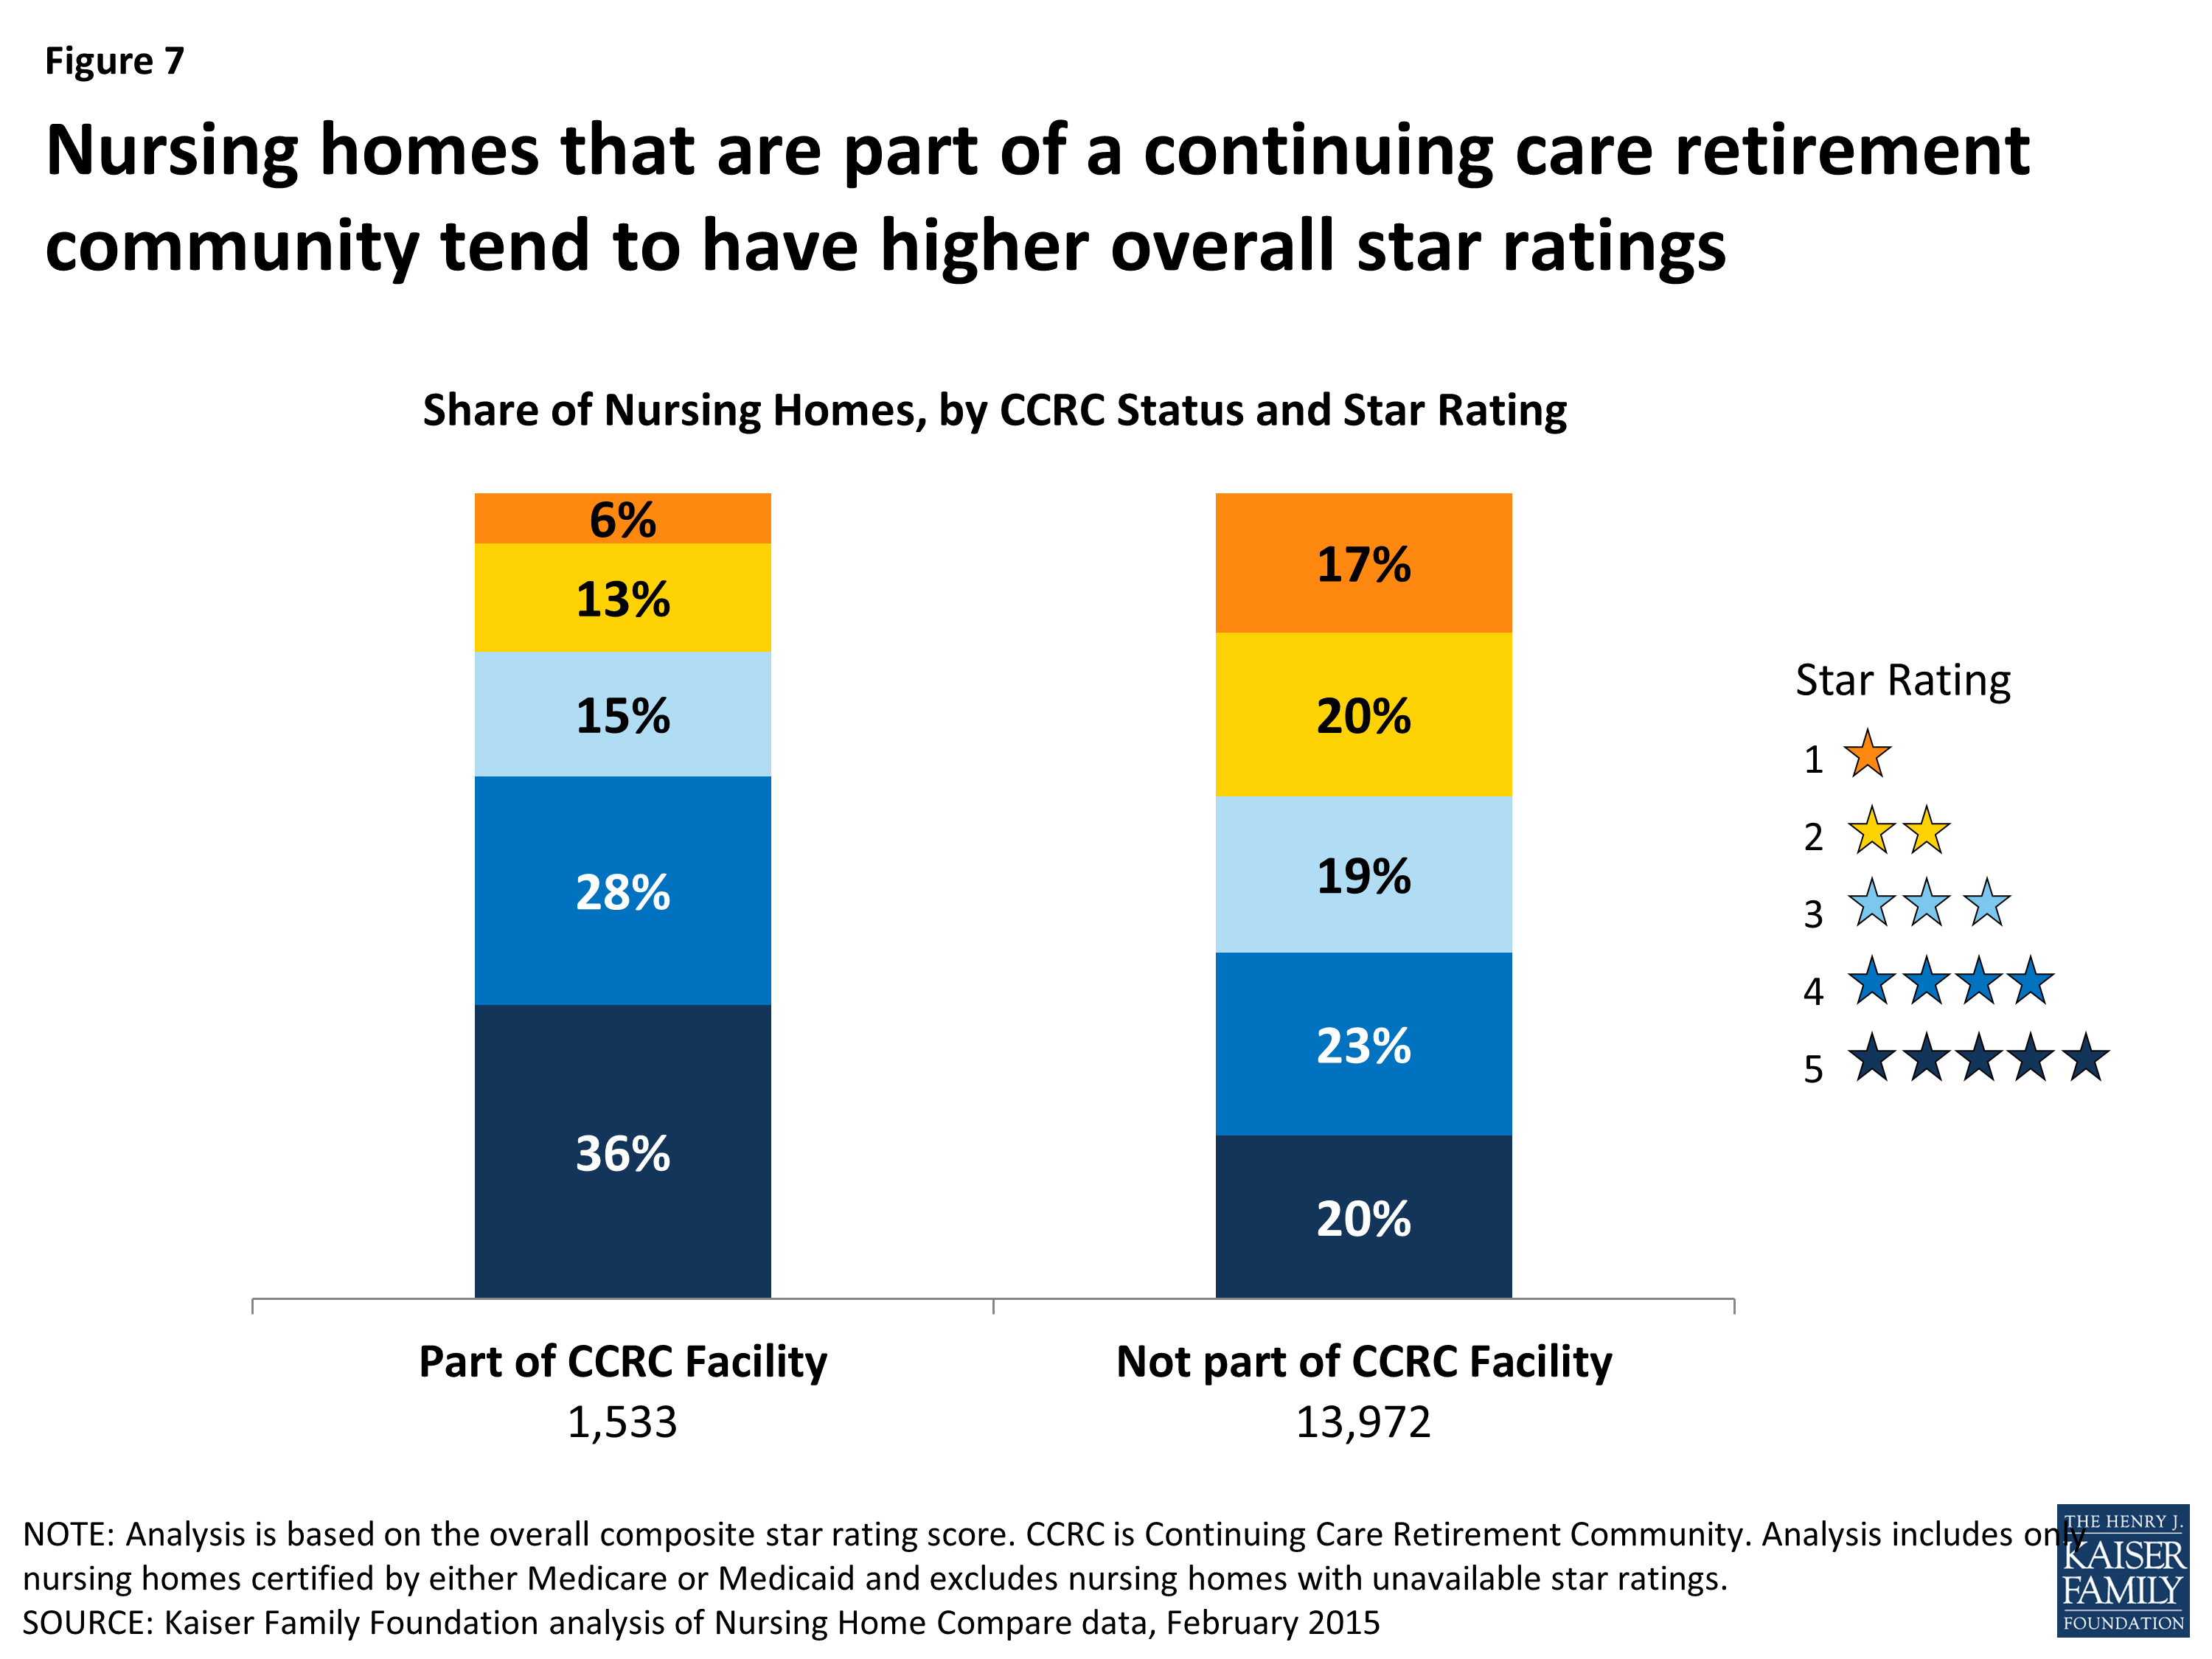
Figure 7: Nursing homes that are part of a continuing care retirement community tend to have higher overall star ratings
State-Level Findings
CMS contracts with states to inspect nursing homes as part of the federal role to certify that nursing homes are eligible for Medicare and Medicaid payment and to enforce federal minimum quality standards, but states may place additional conditions on nursing homes to meet state licensing requirements. These differences and variations in state inspection protocols were considered in determining the star rating methodology. Specifically, the star ratings for the State Health Inspection measure—which is weighted more heavily in the overall composite measure—is curved based on the ranked performance of all nursing homes within a state. Therefore, differences between states in the overall ratings primarily reflect differences in the two domains that rely on self-reported data (quality measures and staffing data). As a result, drawing comparisons between states, based on star ratings, is problematic in some ways. With this caveat, the findings presented below provide analysis of star ratings of nursing homes, by state. Further state-level analysis of nursing home characteristics and star ratings for each set of measures is provided in the Appendix.
- In 11 states, at least 40 percent of all nursing homes have relatively low overall ratings—either 1 or 2 stars (Figure 8). In Texas, for example, more than half (51 percent) of nursing homes received only 1 or 2 stars, followed by Louisiana (49 percent), Georgia, Oklahoma, and West Virginia (all 46 percent). In nine states, more than 20 percent of the state’s nursing homes have the lowest possible rating—1 star (Appendix Table 2). These states are Texas, Louisiana, Oklahoma, Kentucky, Tennessee, New Mexico, West Virginia, Ohio, and Georgia.
- Looking at the individual ratings for staffing and quality specifically, the three states with the highest percentages of 1-star ratings on the Staffing measures are Texas, Louisiana, and Georgia. More than 30 percent of nursing homes in these three states received 1 star on the Staffing measures—well above the national rate of 10 percent (Appendix Table 5). The three states with the highest percentages of nursing homes with 1-star ratings on the Quality measures are Oklahoma, Kentucky, and Mississippi (Appendix Table 4).
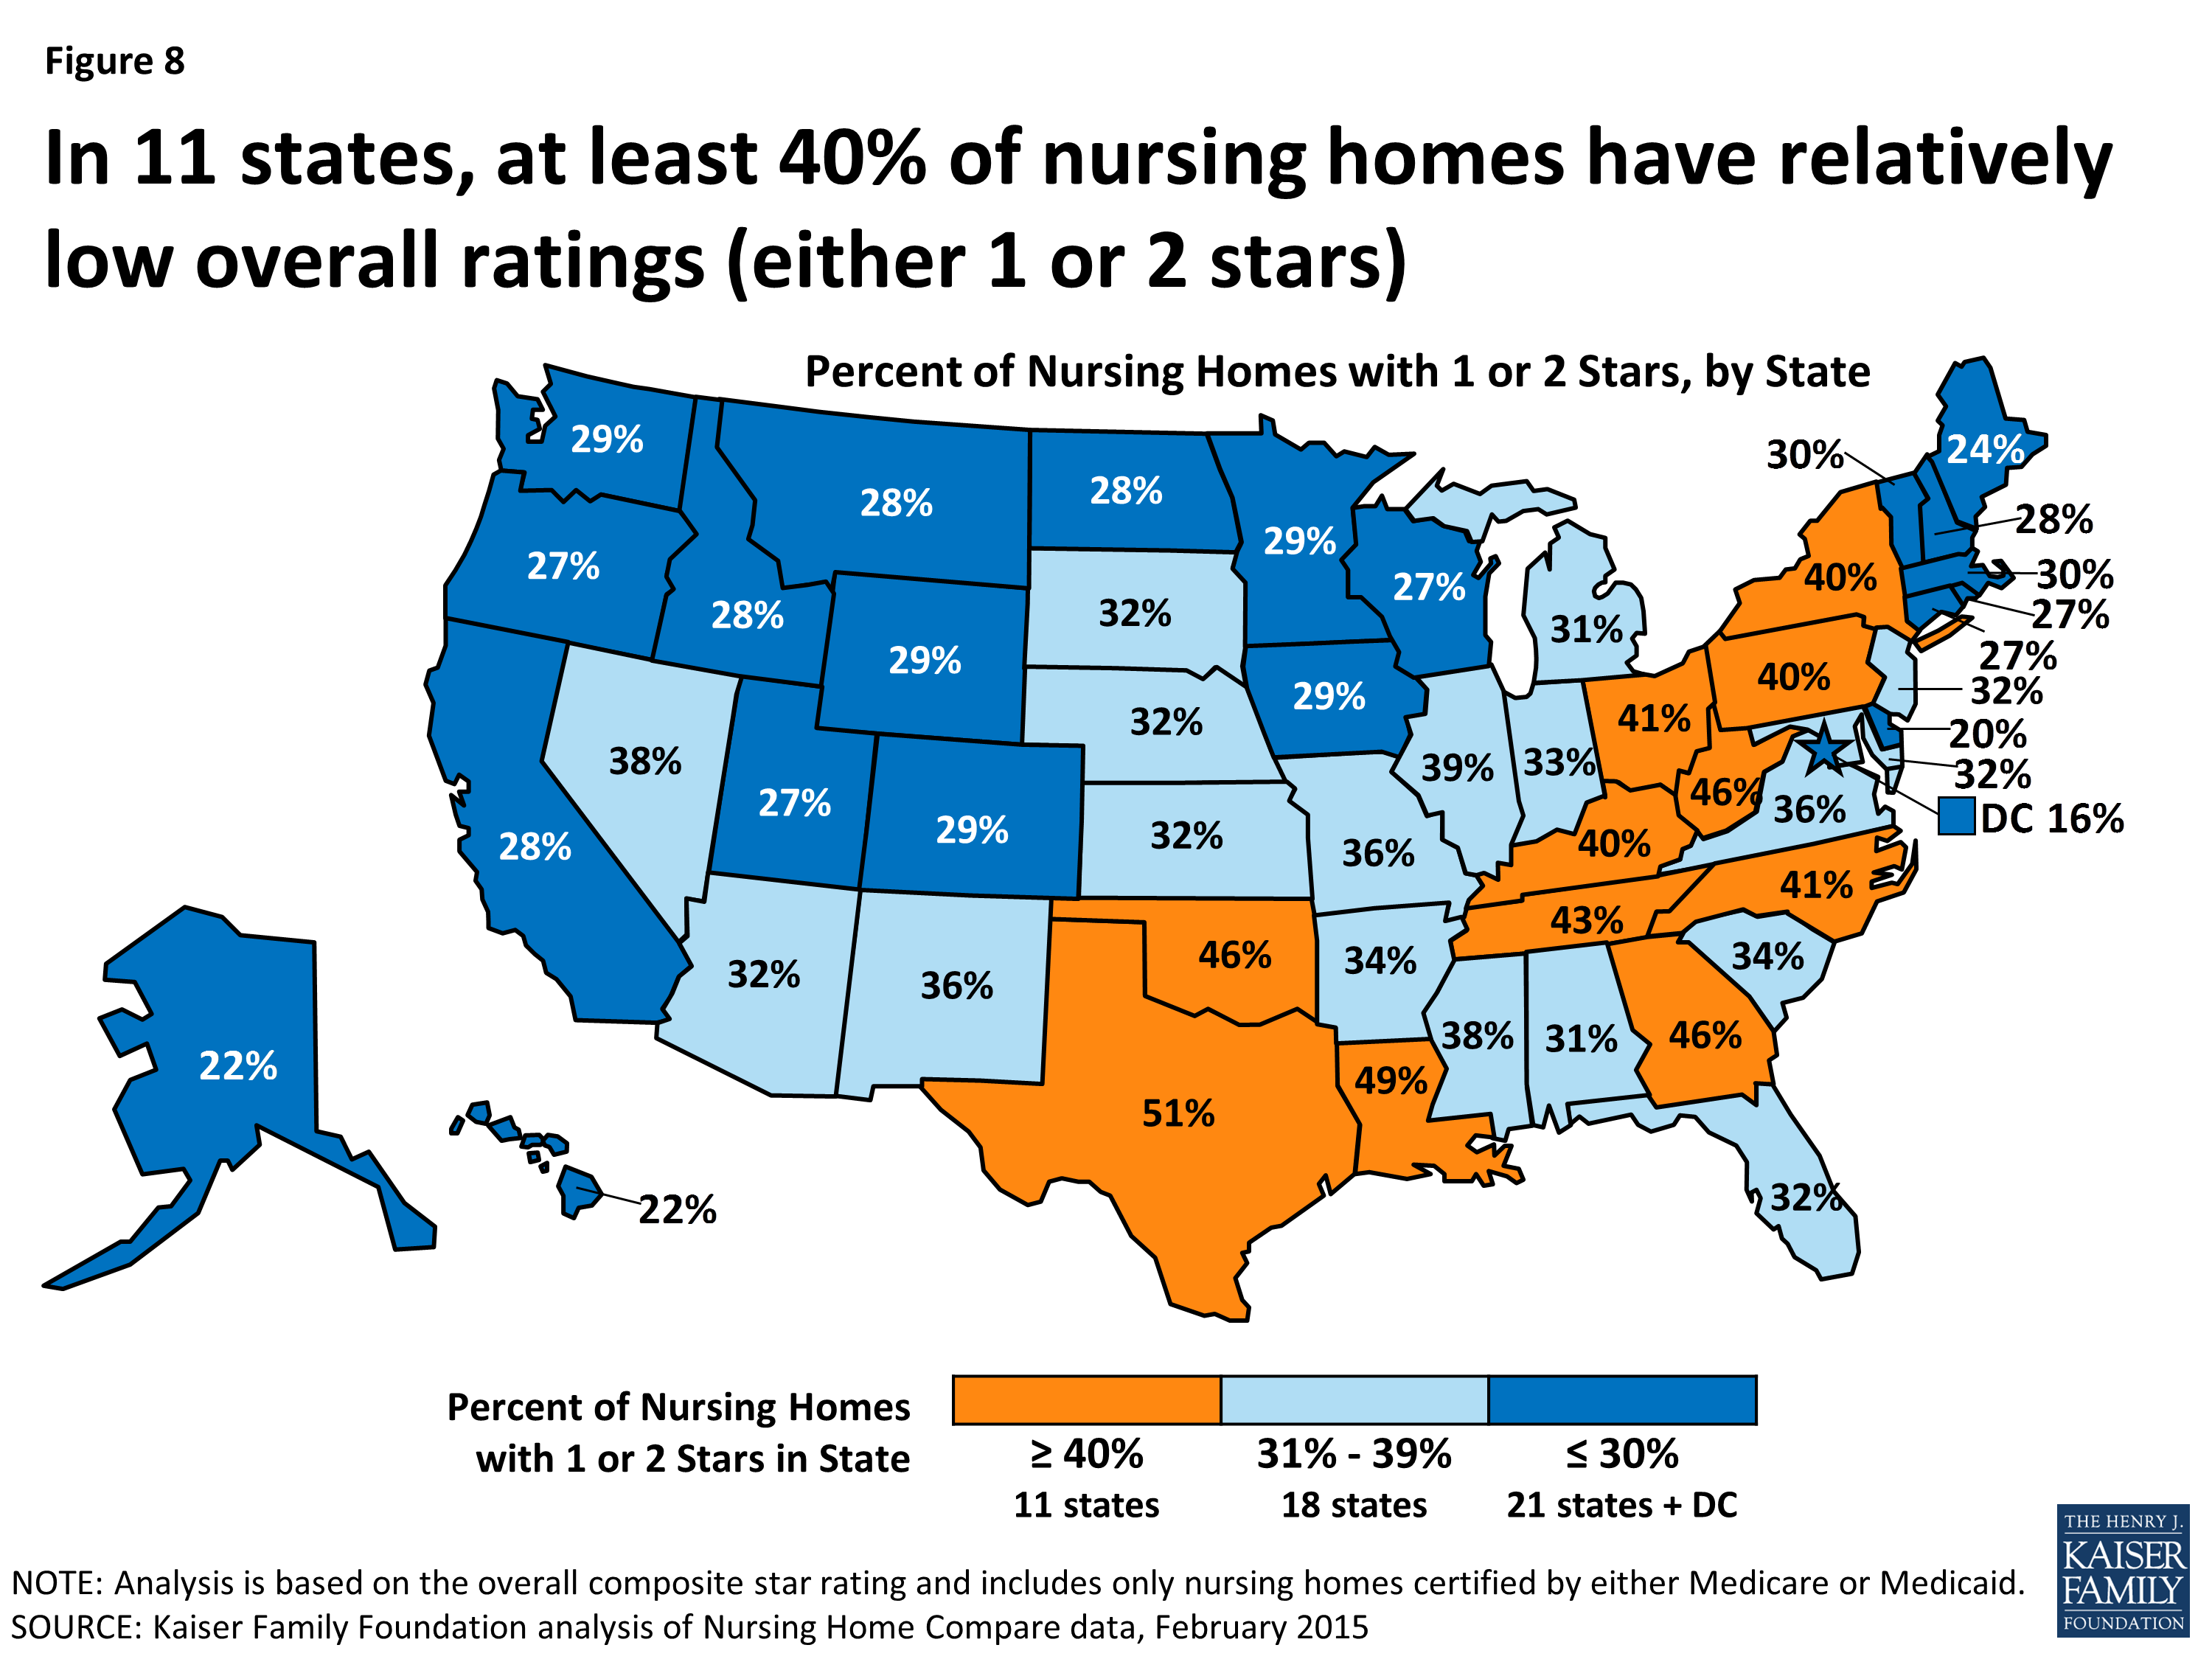
Figure 8: In 11 states, at least 40% of nursing homes have relatively low overall ratings (either 1 or 2 stars)
- In 22 states and the District of Columbia, at least half of the nursing homes in the state have relatively high overall ratings—either 4 or 5 stars (Figure 9). Further, in seven states and the District of Columbia, more than 30 percent of all nursing homes have the highest possible overall rating—5 stars (Appendix Table 2). These are: the District of Columbia, Hawaii, Delaware, California, New Hampshire, Vermont, Idaho, and Rhode 20 For most of these seven states, the percentage of small nursing homes in these states is higher than the national rate—19 percent (Appendix 1).
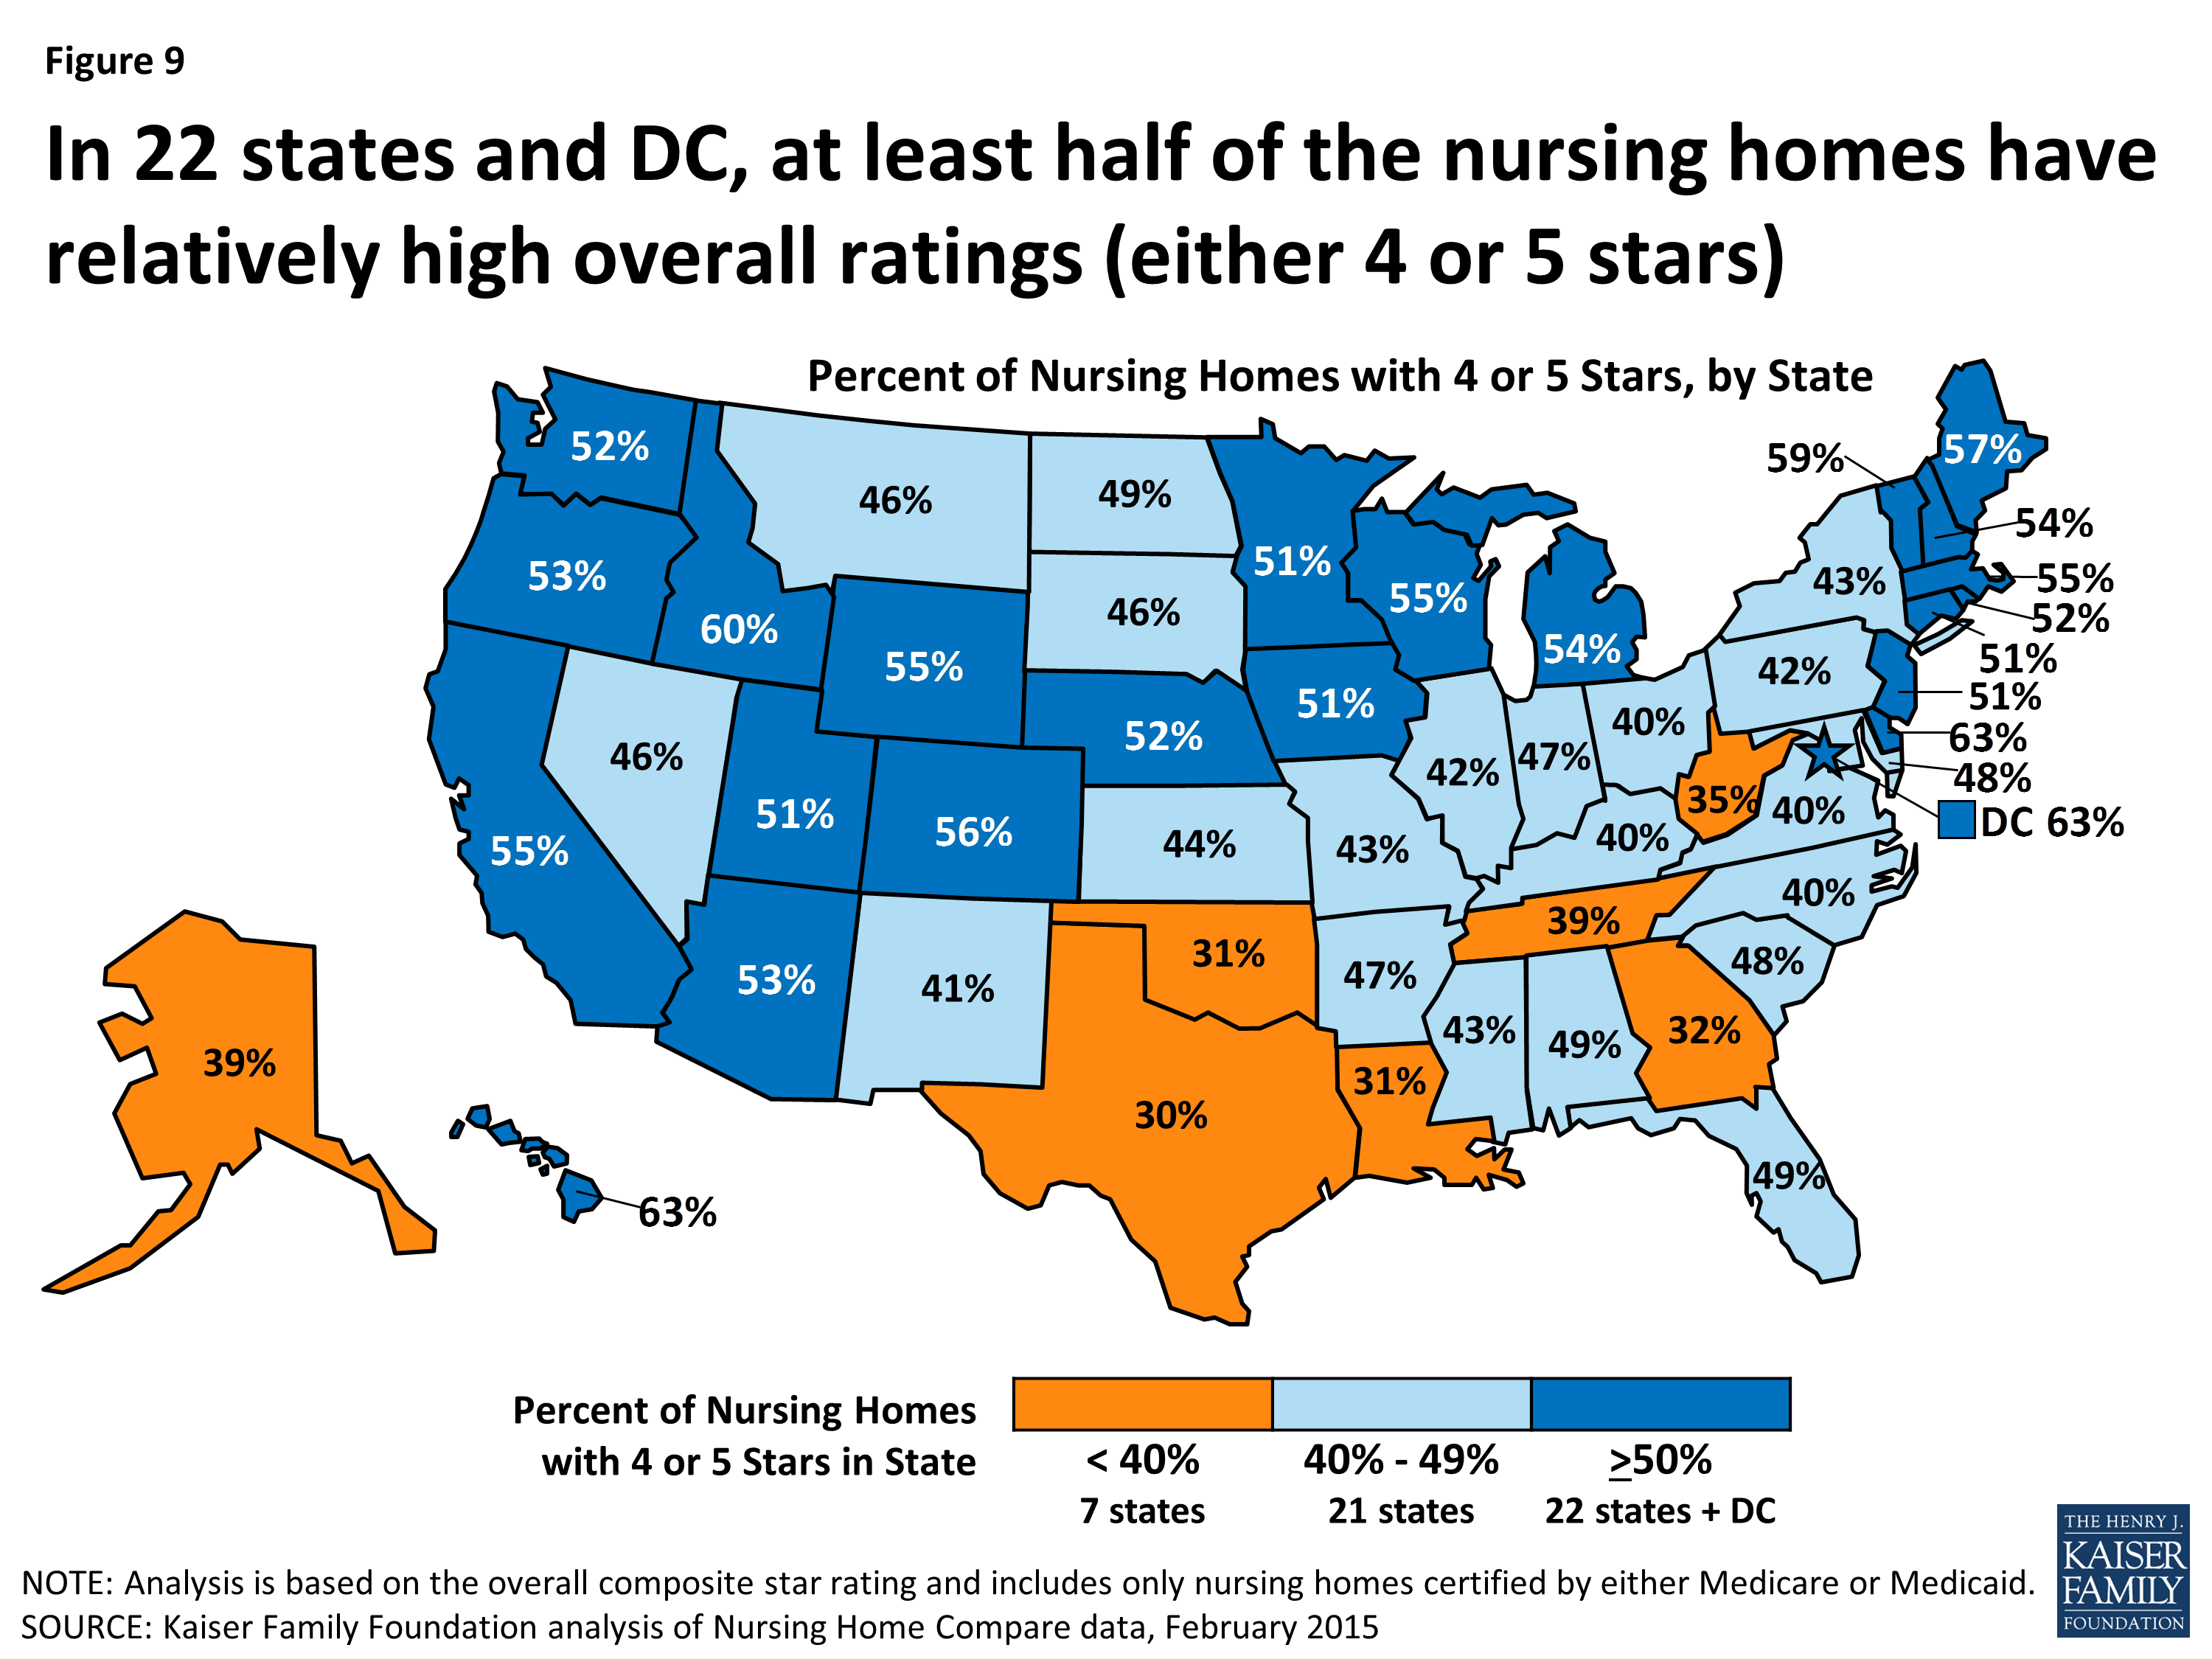
Figure 9: In 22 states and DC, at least half of the nursing homes have relatively high overall ratings (either 4 or 5 stars)
- Among the five states with the largest number of people age 65 and older, the share of nursing homes with the best possible rating (5-stars) ranges from 32 percent in California to just 12 percent in Texas (Figure 10). Conversely, the share of nursing homes with the lowest possible rating (1 star) ranges from 28 percent in Texas to 7 percent in California. About 40 percent of nursing homes in New York and Pennsylvania have relatively low ratings, of 1 or 2-stars.
- Among these five states, Texas and California have the highest share of for-profit nursing homes (86 percent and 84 percent respectively), while Pennsylvania and New York have the lowest shares (55 percent and 56 percent respectively) (Appendix Table 1). Also among these five states, New York and Pennsylvania have the highest share of relatively large nursing homes with more than 120 beds (62 percent and 43 percent respectively), while California and Florida have the lowest shares (23 percent and 25 percent respectively).
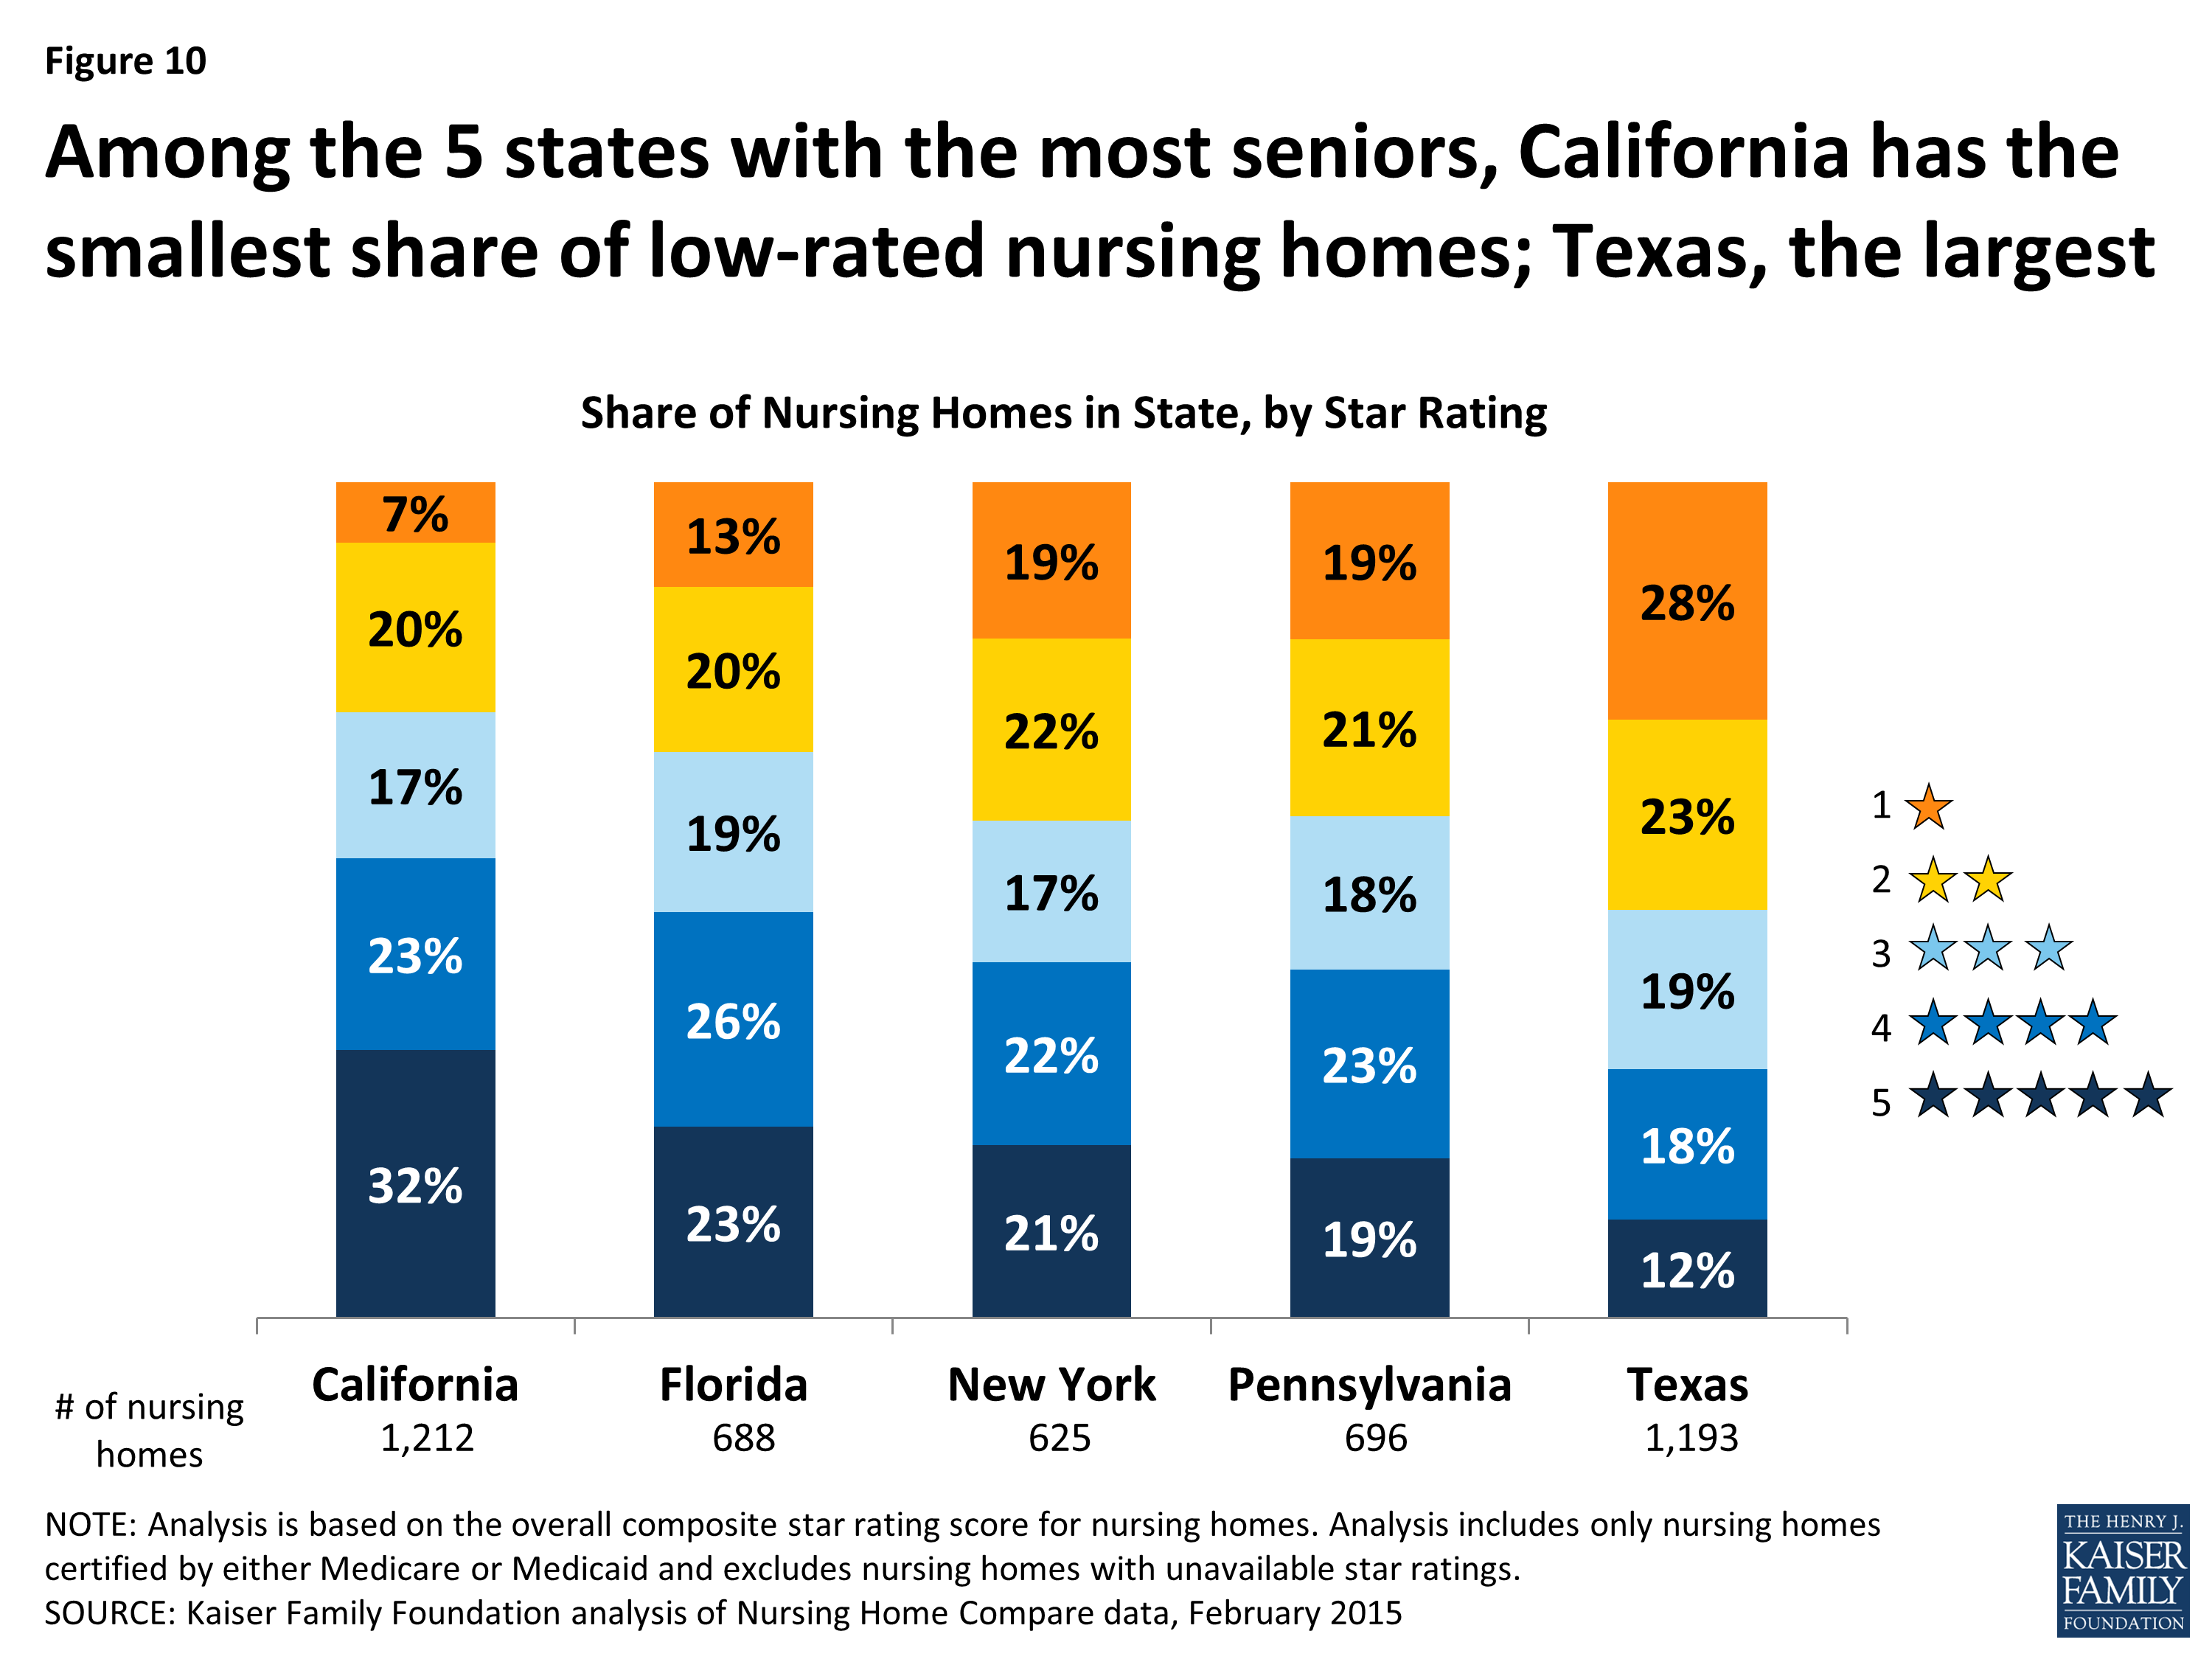
Figure 10: Among the 5 states with the most seniors, California has the smallest share of low-rated nursing homes; Texas, the largest
- In states that have a relatively larger percent of low-income seniors living in the state, nursing homes tend to have lower overall ratings (Figure 11). Among the 12 states and the District of Columbia where more than 35 percent of seniors have incomes below twice the poverty rate (concentrated mostly in the South), 42 percent of nursing homes have a 1- or 2-star overall rating. In contrast, in the 15 states with less than 30 percent of seniors living below twice the poverty level, 30 percent of nursing homes have 1- or 2-star ratings, and half are rated with 4 or 5 stars. (Appendix Table 6). Because data on the incomes of each nursing home’s residents are not provided in the Nursing Home Compare dataset, these findings are based on poverty rates among seniors in each state. Further research could examine factors associated with low-star ratings in states with greater percentages of seniors in poverty, such as Medicaid payment rates, and whether lower income nursing home residents are more likely than higher income residents to be a low-rated nursing home.21
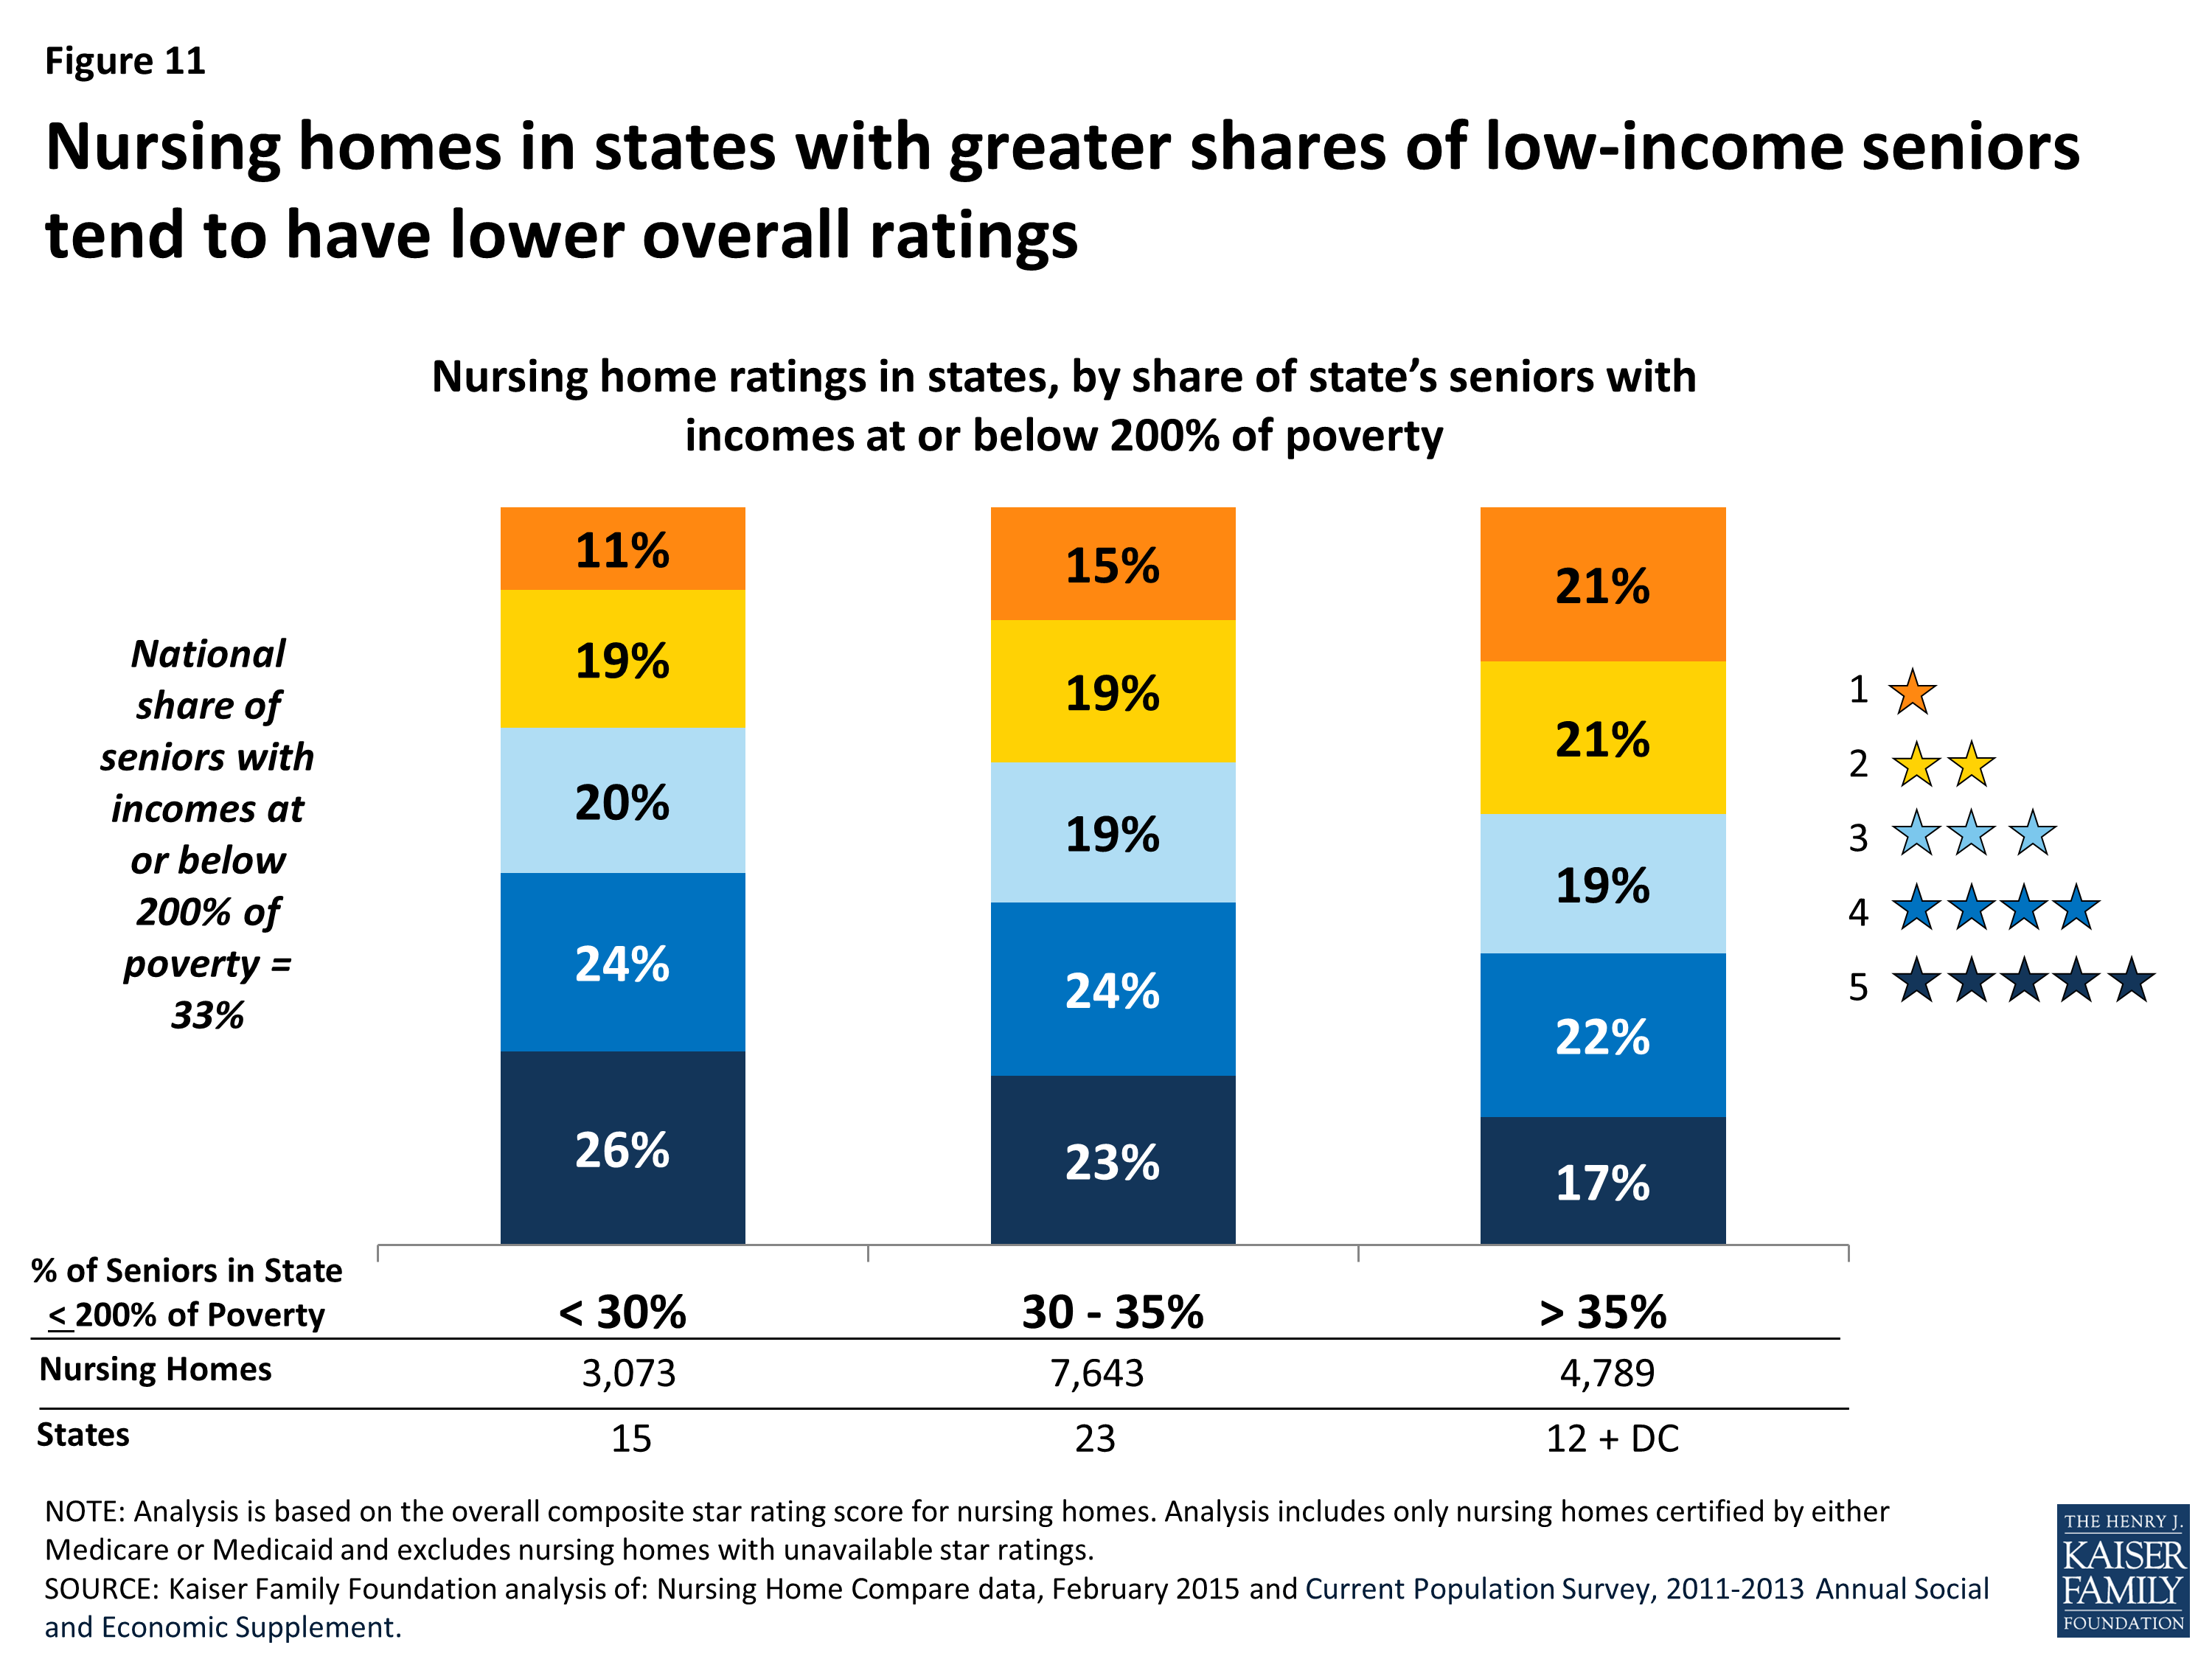
Figure 11: Nursing homes in states with greater shares of low-income seniors tend to have lower overall ratings
- Two-thirds of all counties in the U.S. have at least one Medicare- or Medicaid-certified nursing home with a 4- or 5- star rating (Figure 12). The presence of a 4- or 5-star nursing home in two-thirds of all counties does not necessarily imply that all people in these counties have access to a bed in a highly rated nursing home because these nursing homes may not have an available bed. Also, patients and families may place a high priority on being in a nursing home close to family members. Additionally, prospective nursing home residents and their families may not rely on the Nursing Home Compare website to search for and select a nursing home. These factors may help explain that while 92 percent of nursing home residents live in counties with at least one 4- or 5- star nursing home (not shown), only 41 percent of nursing home residents are in a 4- or 5- star nursing home (Figure 2).
–
One-third of counties (34 percent) have no 4- or 5-star nursing homes, including counties in which all nursing homes are rated with fewer than 3 stars (27 percent) and counties with no Medicare- or Medicaid-certified nursing homes at all (7 percent). Eight percent of nursing home residents live in counties with no 4- or 5-star nursing homes.
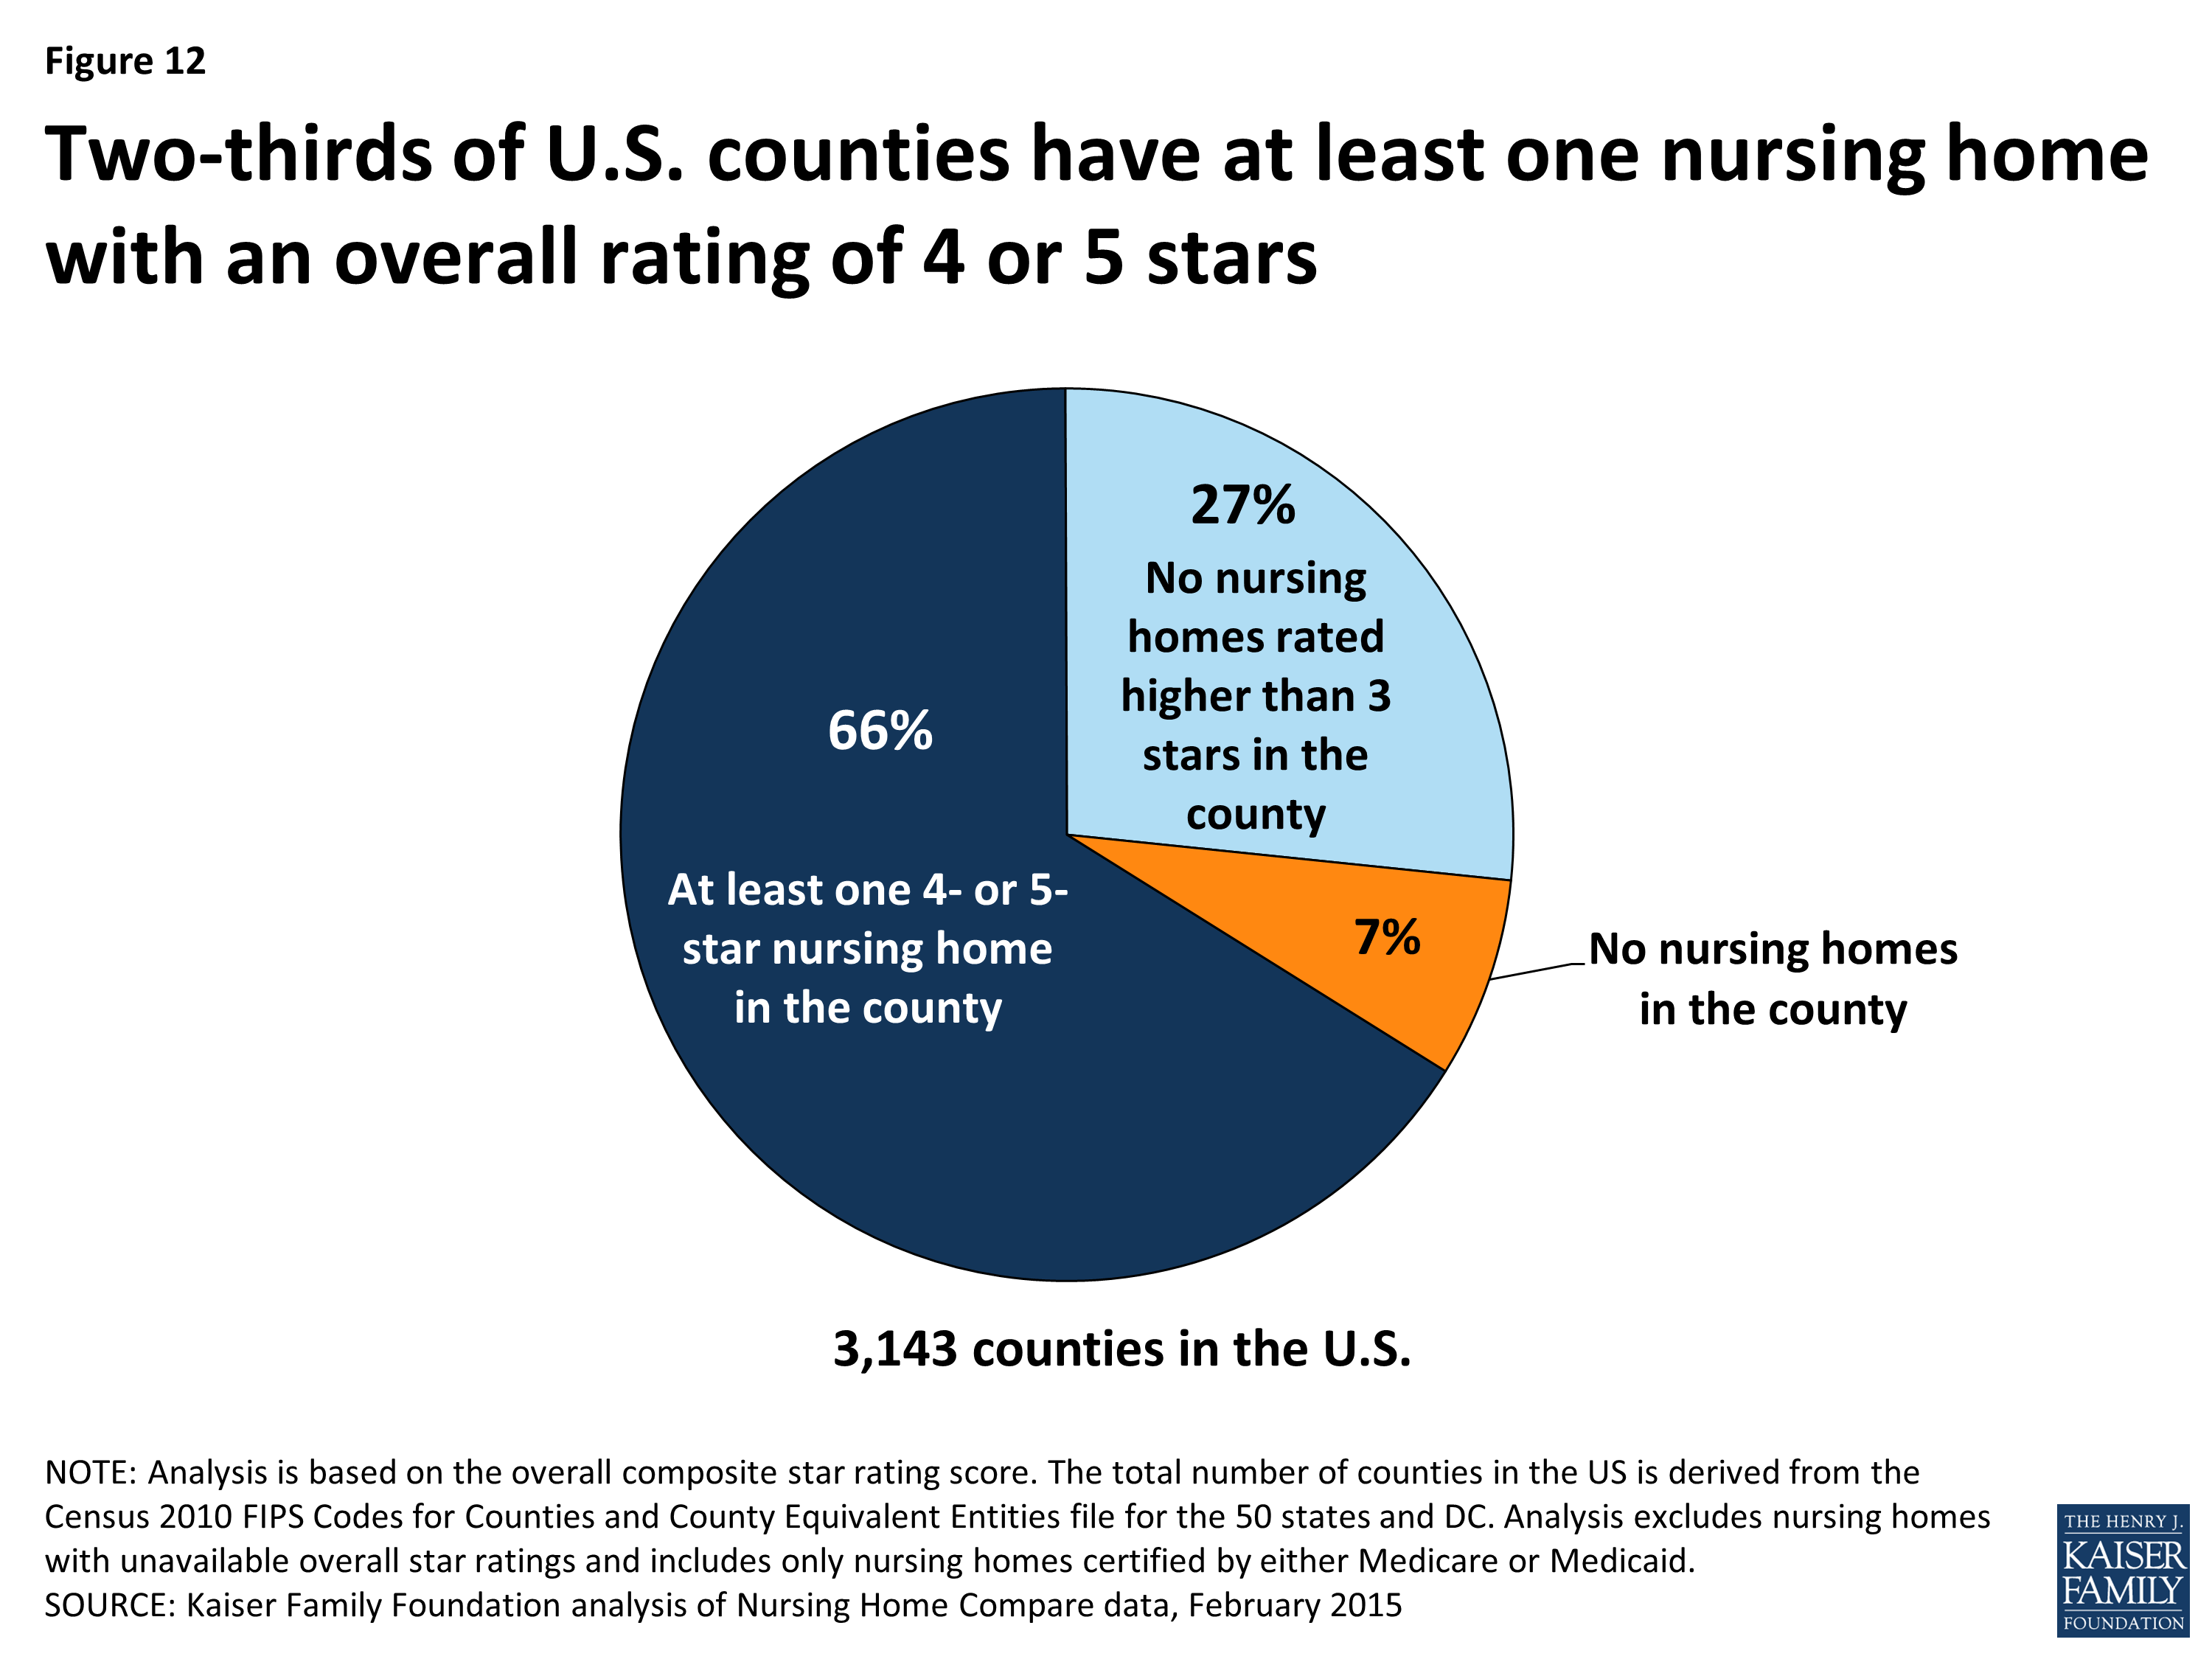
Figure 12: Two-thirds of U.S. counties have at least one nursing home with an overall rating of 4 or 5 stars
Discussion
The nursing home population includes some of the oldest, frailest, more medically compromised and cognitively impaired people covered by Medicare or Medicaid. Nursing home residents—both short-term and longer term residents—are particularly at risk because they are often unable to care for themselves, and dependent on others to get by on a day-to-day basis. Medicare and Medicaid, which together account for more than half of all nursing home revenue, require facilities to meet minimum federal standards to help safeguard the health and safety of nursing home residents. Further, CMS has developed and improved the Nursing Home Compare website to provide consumers with both detailed and summary information on nursing home quality. Nonetheless, researchers, reporters and advocates have continued to identify serious quality concerns among some of the nation’s nursing homes, including those that relate to inadequate staffing, high rates of preventable conditions, such as pressure ulcers (bedsores), and fire safety hazards. A recent study, for example, found that almost one in five nursing homes had deficiencies that caused harm or immediate jeopardy to residents. 22
Our analysis, based on this data, finds that nearly half of the nursing homes certified by Medicare or Medicaid have 4- or 5- star ratings. But, more than one-third of the nursing homes have relatively low ratings of 1 or 2 stars, accounting for almost 40 percent of all nursing home residents in Medicare- or Medicaid-certified nursing homes. For-profit nursing homes, which are more prevalent, tend to have lower star ratings than non-profit nursing homes. Nursing homes with a relatively large number of beds tend to have lower star ratings than smaller nursing homes (with fewer beds). Nursing homes affiliated with CCRCs, which are disproportionately non-profits, tend to have higher ratings than those that are not affiliated with a CCRC.
The analysis also finds that nursing home star ratings vary within and across states. In 22 states, at least half of the nursing homes have relatively high ratings with 4 or 5 stars. But in 11 states, at least 40 percent of nursing homes have ratings of only 1 or 2 stars. In 9 states, more than 20 percent of nursing homes have the worst possible star rating—1 star.
While many nursing homes have relatively high quality ratings with 4 or 5 stars, low ratings in others give rise to questions that warrant serious consideration. What more can CMS do to improve the quality of nursing home care? Should CMS consider linking payments to the Five-Star Quality Rating System (or improvements in these quality ratings) as the agency has done for Medicare Advantage plans? Imposing and enforcing higher standards (e.g., with respect to staffing levels) could improve the quality of care for residents, but also have cost implications for nursing homes and payers. What options are available to residents living in areas with nursing homes with just one or two stars, or in areas where nursing homes with higher ratings have no available beds?
The role of nursing homes may evolve in the future, as part of broader changes in health care delivery. Some suggest that nursing homes could provide more complex levels of care to their residents, as part of a broader effort to reduce the rate of preventable hospitalizations among Medicare patients.23 Others caution that many nursing homes may not be well-equipped to care for patients with complex medical needs, given concerns about staffing levels and other issues. Previous research has shown that limited on-site capacity and other factors may be associated with the relatively high rates of preventable hospitalizations and emergency room visits among nursing home residents.24 Given the substantial needs and vulnerabilities of nursing home residents and the significant investment by Medicare and Medicaid in nursing home care, the quality of care provided in nursing homes is likely to remain an issue for policymakers and families in the years to come.