How Many People Use Medicaid Long-Term Services and Supports and How Much Does Medicaid Spend on Those People?
Data Note
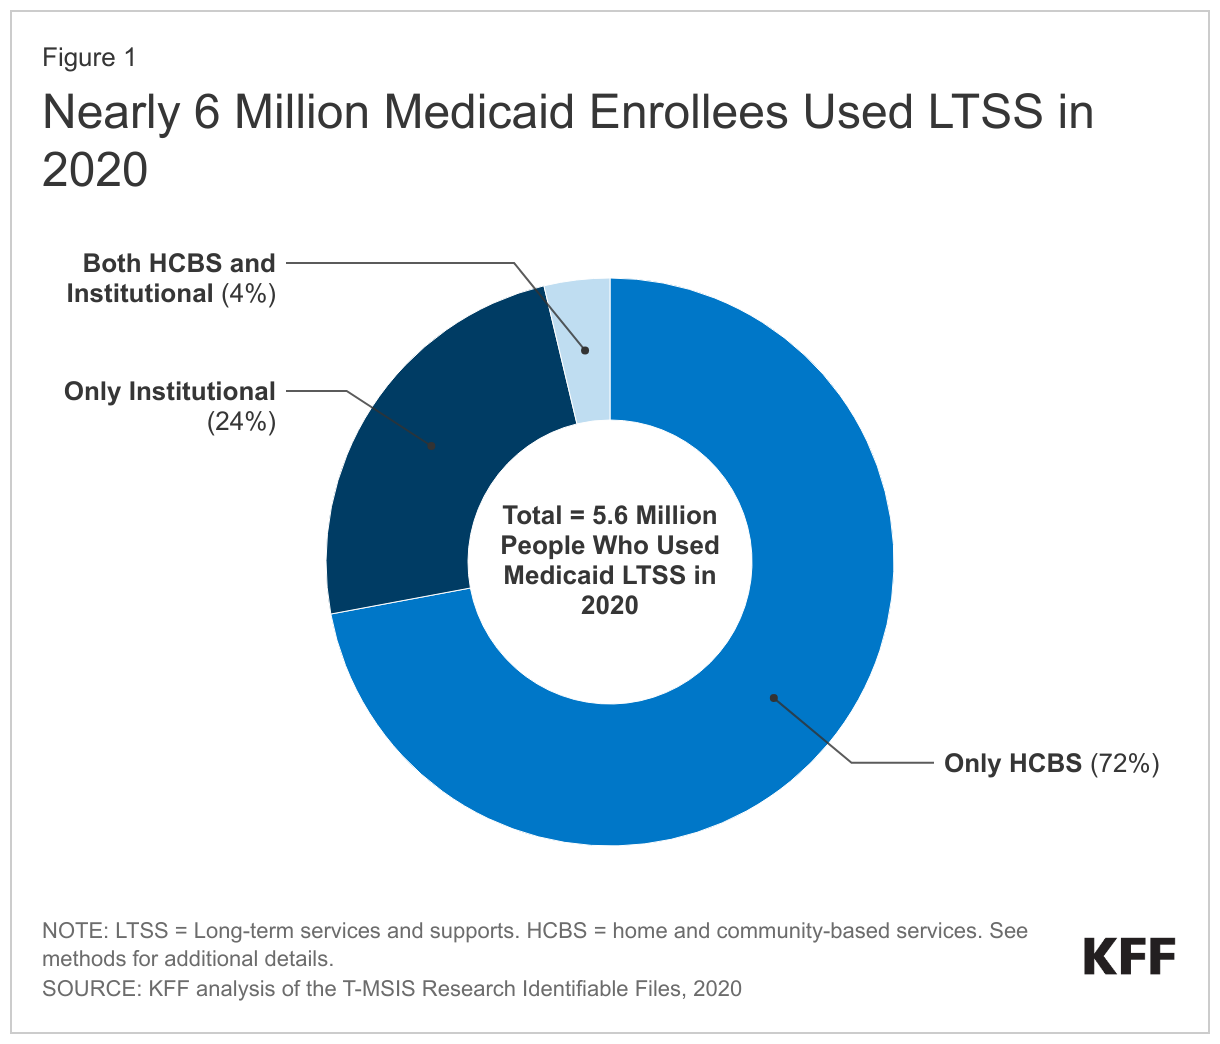
In 2020, KFF estimates that 4.2 million people used Medicaid long-term services and supports (LTSS) delivered in home and community settings and 1.6 million used LTSS delivered in institutional settings (Figure 1). LTSS encompass the broad range of paid and unpaid medical and personal care services that assist with activities of daily living (such as eating, bathing, and dressing) and instrumental activities of daily living (such as preparing meals, managing medication, and housekeeping). They are provided to people who need such services because of aging, chronic illness, or disability and may be provided in institutional settings such as nursing facilities or in people’s homes and the community. Services provided in non-institutional settings are usually referred to as home- and community-based services (HCBS) and include a wide range of services such as adult daycare, home health, personal care, transportation, and supported employment. In 2020, Medicaid was the primary payer for LTSS, covering over half of all LTSS spending in in the U.S. Despite Medicaid’s significant role in funding LTSS in the U.S., eligibility for Medicaid LTSS is complex and varies widely by state. This data note provides an overview of Medicaid coverage of LTSS, KFF estimates of how many Medicaid enrollees used LTSS in 2020, how much Medicaid spent on enrollees who used LTSS, and policy issues to watch in the coming years. Key takeaways include:
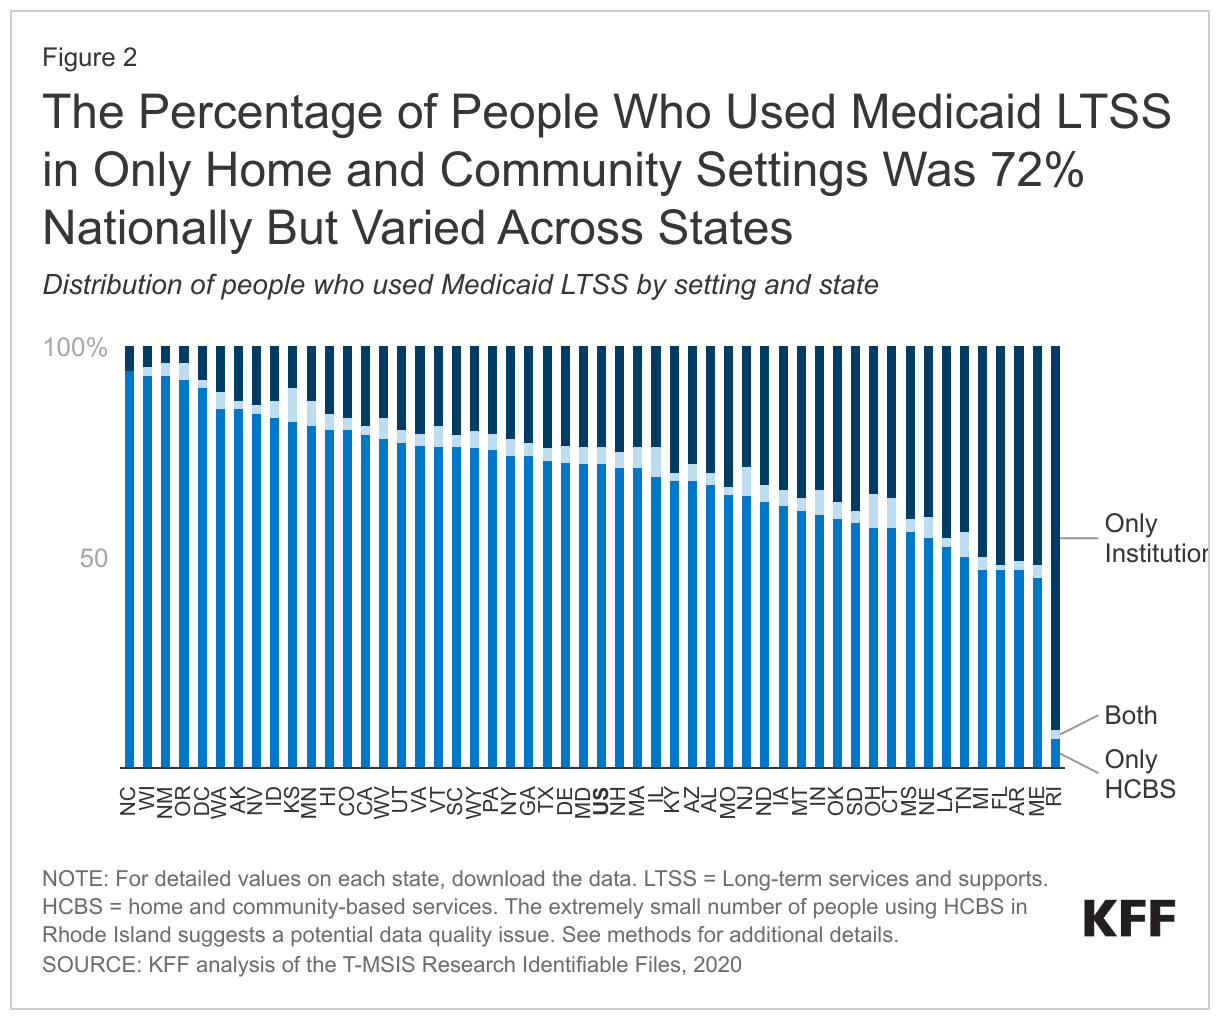
- In 2020, there were 5.6 million people who used Medicaid LTSS, of which 4.0 million (72%) used only HCBS, 1.4 million (24%) used only institutional care, and 0.2 million used both (4%) (Figure 1). The share of people using Medicaid LTSS only in home and community-based settings ranged from 45% in Maine to 94% in North Carolina (Figure 2).
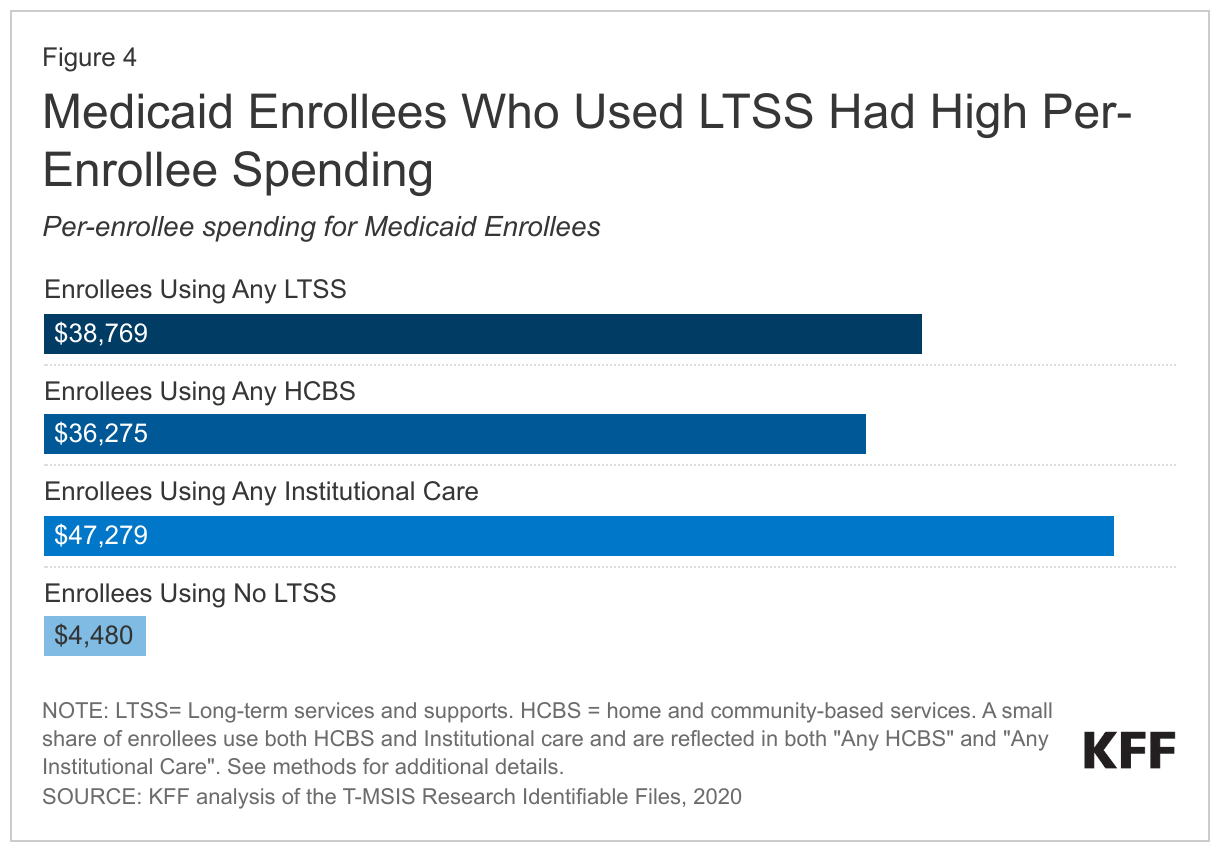
- Medicaid spending per-person was nearly nine times higher for people who used LTSS than for those who did not use LTSS ($38,769 vs. $4,480), with particularly high spending for people who used institutional LTSS (Figure 4).
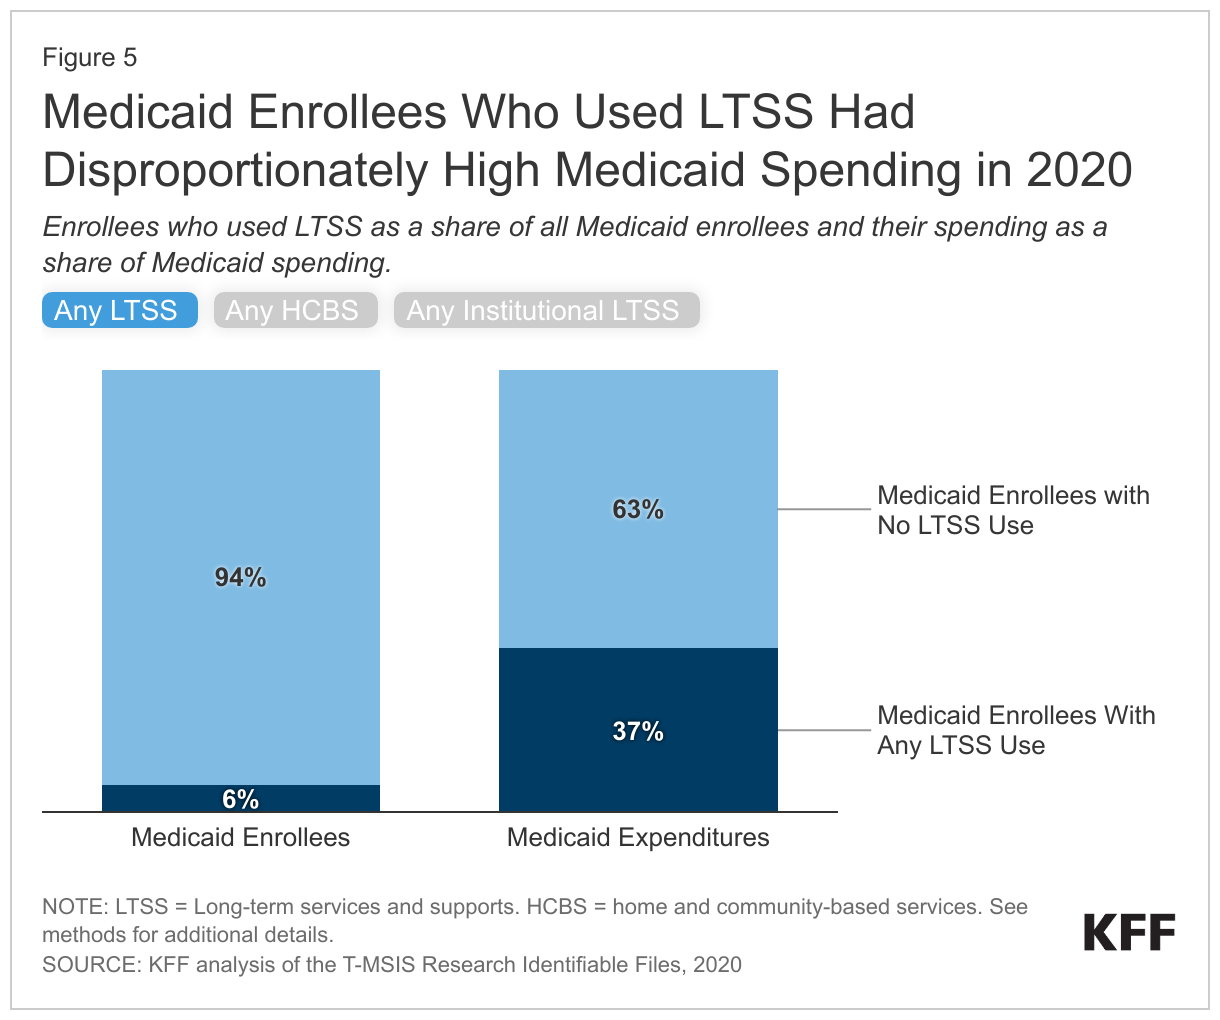
- People who used Medicaid LTSS comprised 6% of Medicaid enrollment but 37% of federal and state Medicaid spending, reflecting the generally high cost of LTSS and more extensive health needs that lead to higher use of other health care services and drugs (Figure 5).
KFF’s estimates differ from the number of people using Medicaid LTSS reported by the Centers for Medicare & Medicaid Services (CMS), which found that about 11 million Medicaid enrollees used LTSS in 2019. CMS counts are higher than KFF counts because CMS defines LTSS more broadly and includes enrollees who may only use LTSS on a single day. CMS counts include people who are using services such as behavioral health, rehabilitation, health homes, and case management, but no other LTSS, whereas KFF only included enrollees if they were using the services identified in the data note below. CMS also counted people as using LTSS if they had one or more claims for a service, but KFF’s definition aims to capture only people who are using the services on an ongoing basis.
What are Medicaid Long-Term Services and Supports?
Medicaid LTSS are generally classified by the location in which they are provided: either in an institutional setting or in home- and community-based settings, also known as HCBS. Institutional care includes care provided in a nursing facility, which is a mandatory Medicaid benefit, and care provided in an intermediate care facility for people with intellectual disabilities, which is an optional benefit that all states currently choose to cover. HCBS include a broader range of benefits, which are all optional except for home health care. HCBS first became available as a Medicaid “waiver” option and in that capacity, services were generally available to certain types of Medicaid enrollees such as those with intellectual disabilities or those with physical disabilities.
In the last 20 years, several new authorities have been created, allowing states to also offer HCBS through the Medicaid state plan (see Appendix Table 1 for a list of HCBS authorities). If services are provided through a state plan, they must be offered to all eligible individuals. In contrast, services provided under waivers, such as 1115s or 1915(c)s, may be restricted to specific groups based on geographic region, income, or type of disability. Waivers may also include a wider range of service types than can be provided under state plans. Historically, Medicaid spent more money on LTSS in institutional settings than on LTSS delivered in home and community-based settings, but initiatives to balance HCBS and institutional care have changed that trend. Since 2013, Medicaid has spent more on HCBS than institutional care.
How Many People Used Medicaid LTSS in 2020?
In 2020, there were 5.6 million people who used Medicaid LTSS, of which 4.0 million (72%) used only HCBS, 1.4 million (24%) used only institutional care, and 0.2 million used both (4%) (Figure 1). These counts and shares did not change notably between 2018 and 2020. KFF’s current count of the number of people using Medicaid LTSS is lower than the number of people using LTSS reported by the Centers for Medicare & Medicaid Services (CMS) because KFF only counted people as using LTSS if they used institutional care or HCBS on an ongoing basis. CMS included a broader set of services in their definition of LTSS and did not require people to use the services on an ongoing basis. KFF’s current counts also differ somewhat from KFF’s annual HCBS survey on account of differences in how states report data in surveys versus how they are reflected in the claims. For example, states do not report unduplicated counts of total enrollees across different types of benefits in KFF’s survey data. See methods for more detail.
In 2020, nearly three-quarters (72%) of people who used Medicaid LTSS were exclusively served in home and community-based settings, but this ranged from 45% in Maine to 94% in North Carolina (Figure 2). The larger share of people receiving care in the community as opposed to in an institution reflects initiatives to make home and community-based care more widely available in recent years and to remove what has been referred to as the “institutional bias” in Medicaid. The shift towards HCBS is readily apparent in analyses of Medicaid spending on LTSS: The percentage of LTSS spending that pays for HCBS has increased from only 12% in 1988 to 59% in 2019. While the number of people using Medicaid HCBS exceeds the number who use institutional care nationally, several states still serve fewer than half of people in exclusively home and community-based settings. Over 5% of Medicaid LTSS users in eight states (MN, IN, TN, NJ, IL, CT, KS, and OH) used both institutional care and HCBS. Such people may have transitioned between institutional and community-based settings due to changes in their level of need during the year.
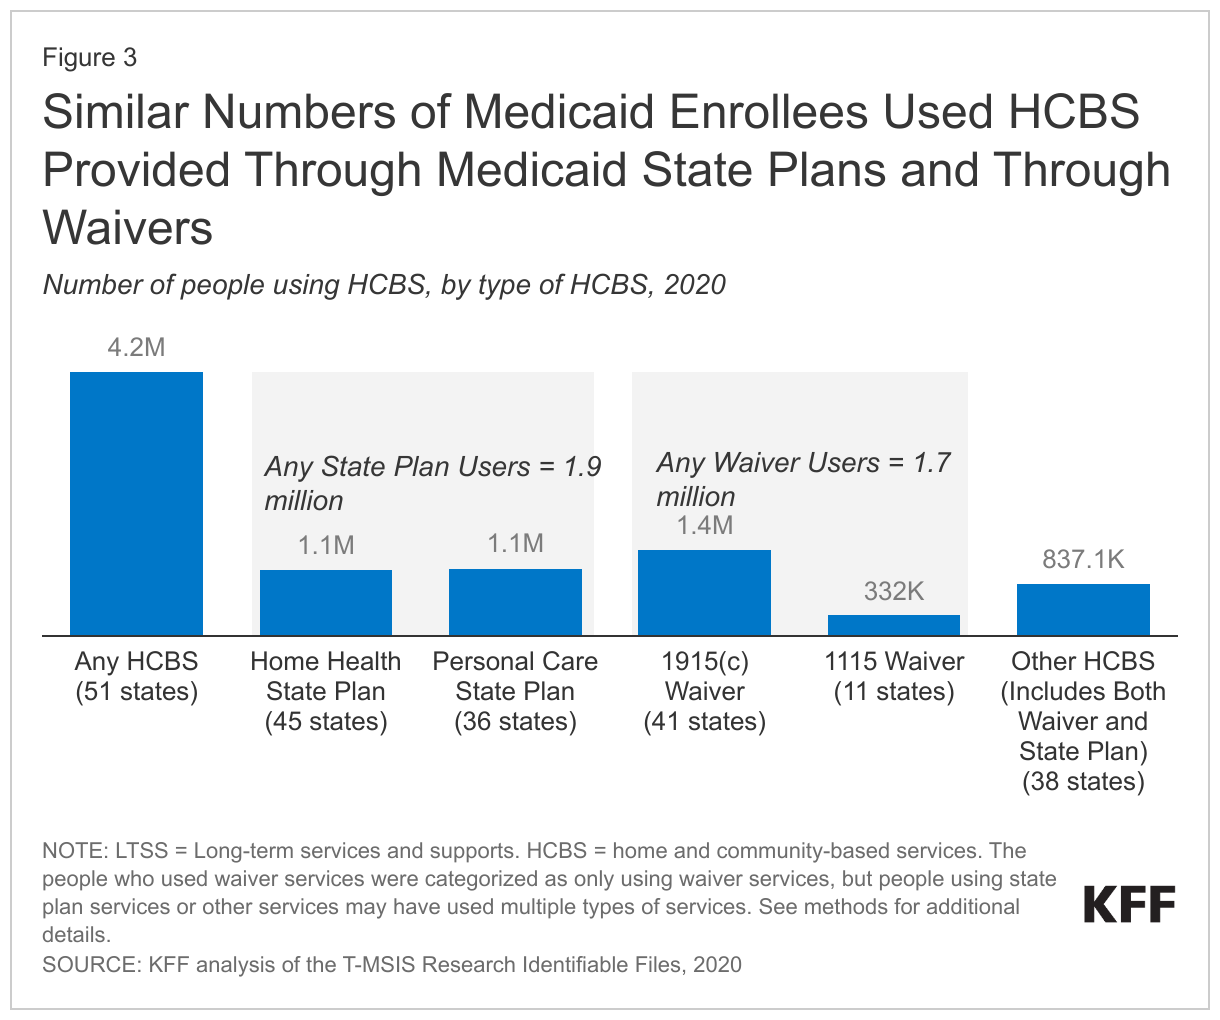
Among the 4.2 million people who used HCBS in 2020, at least 1.9 million used services provided through a state plan such as home health and personal care and at least 1.7 million received services through a waiver (Figure 3). Federal Medicaid statute requires states to cover home health, but the remainder of HCBS are optional. An additional 837,000 people used other HCBS services that were a mix of state plan and waiver services. Among people who used home health, personal care, and “other” HCBS, 0.5 million used more than one type of HCBS. (KFF categorized people using waiver services as only using waiver services, although in some states, people could potentially receive services through a waiver and through the state plan.) In most states, the range of benefits available through a waiver are more comprehensive than those available through the state plan (see Appendix Table), but most states limit the number of people who may use waiver services, often resulting in waiting lists. In a 2022 survey of states HCBS programs, states reported that there were 656,000 people on waiting lists, with people waiting an average of 45 months to receive waiver services.
What Do We Know About Spending for People Who Used Medicaid LTSS in 2020?
Medicaid spending per-person is higher for people who use institutional LTSS and people who use HCBS when compared to those who do not use any LTSS, but spending for people using institutional LTSS is particularly high (Figure 4). In 2020, Medicaid spending—including LTSS and other services such as hospital care and prescription drugs—for the 5.6 million enrollees who used Medicaid LTSS, totaled nearly $217 billion. Per-person spending for these enrollees was $38,769. In comparison, Medicaid spent $4,480 per enrollee who did not use Medicaid LTSS, although that total includes children who comprise 40% of Medicaid enrollees and tend to have much lower spending per person. Medicaid spent an average of $36,275 per person for people who used HCBS and $47,279 per person for people who used institutional LTSS.
People who used Medicaid LTSS comprised 6% of Medicaid enrollment but 37% of federal and state Medicaid spending (Figure 5). The 5% of Medicaid enrollees who used HCBS comprised 26% of Medicaid spending and the 2% of Medicaid enrollees who used institutional LTSS comprised 13% of Medicaid spending. High per-person Medicaid spending among enrollees who use LTSS likely reflects the generally high cost of LTSS and more extensive health needs among such groups that lead to higher use of other health care services and drugs as well.
What Current Policy Questions Could Affect People Who Use Medicaid LTSS?
The COVID-19 pandemic greatly exacerbated shortages of LTSS workers, and many policy questions pertain to expanding the workforce caring for people who use Medicaid LTSS. Recent analysis on the Peterson-KFF Health System Tracker shows that, as of June 2023, the number of workers in LTSS settings was measurably lower than in early 2020. Shortages and high turnover among LTSS workers reflect demanding working conditions and relatively low wages. Workforce shortages have negative effects on the quality of care provided in institutional LTSS settings, and often result in people getting fewer hours or types of HCBS than they need. During the pandemic, states relied on family caregivers to help fill some of those gaps, but many pandemic-era policies will end in November 2023 if they are not transitioned into permanent policies.
The federal government may use its authority to require increased staffing for Medicaid LTSS, but it is not clear what the exact policies will be or how they will be implemented. The Biden Administration is expected to release a proposed rule that would increase nursing facility staffing levels in the near future, but it is unknown what the new staffing levels might be. KFF analysis finds that although nearly all facilities would meet a requirement of 2.5 or fewer HPRD and 85% of facilities would meet a requirement of 3.0 HPRD, but close to half (45%) of all nursing facilities would not meet a 3.5 HPRD requirements, and only 29% would meet an HPRD of 4.0. For HCBS, the Biden Administration recently released a proposed rule aimed at ensuring access to Medicaid services, which has several notable provisions aimed at addressing HCBS workforce challenges. Notably, the states would be required to report payment rates for certain HCBS, to demonstrate that payment rates are “adequate” to provide the level of services in enrollees’ personalized care plans, and to ensure at least 80% of payments are passed through to worker compensation for certain types of HCBS. Higher staffing levels could increase payment rates and spending for LTSS, but it’s unknown who would pay those additional costs.
Although most states have increased payment rates for LTSS, it is unclear where additional funding would come from to further increase payment rates and engage additional staff. In an FY 2022 survey conducted of Medicaid officials in all 50 states and D.C., 44 states implemented Medicaid rate increases in FY 2022 for nursing facilities. Similarly, a 2022 survey of Medicaid HCBS programs found that nearly all states reported experiencing shortages of direct care workers and many reported adopting policies to bolster the HCBS workforce, such as providing recruitment or retention bonuses and increasing provider payment rates. Many of the HCBS initiatives were funded by extra federal funding available through the American Rescue Plan Act, but as that funding expires, states will have to find alternative funding sources if they want to maintain spending levels.
Looking ahead, as the population continues to age, it is likely that more people will need Medicaid LTSS and that workforce challenges will persist. The data on LTSS users provide a rich source of information about who is using LTSS and this data note highlights how many people are currently using LTSS and what types of LTSS they are using.
| Appendix Table 1: Medicaid Authorities for Home and Community-Based Services | |||
| State Plan Benefits | |||
| Home Health Services | Required |
| Home Health in T-MSIS |
| Personal Care | Optional |
| Personal Care in T-MSIS |
| Section 1915(i) | Optional |
| Personal Care or Other in T-MSIS |
| Section 1915(j) | Optional |
| Home Health, Personal Care, or Other in T-MSIS |
| Community First Choice (1915(k)) | Optional |
| Personal Care or Other in T-MSIS |
| HCBS Waivers | |||
| Section 1915(c) | Optional |
| 1915(c) in T-MSIS* |
| Section 1115 | Optional |
| 1115 Waiver in T-MSIS* |
| NOTES: *Indicates the primary category in which KFF categorizes people who use HCBS, though not all states use all fields, so in some cases, many people will be grouped with home health or personal care even though they are using those services under another authority. | |||
Methods
Methods
Data: The KFF State Health Facts on people who use LTSS use the T-MSIS Research Identifiable Demographic-Eligibility and Claims Files (T-MSIS data). Current State Health Facts include data from CY 2018, 2019, and 2020, but the methodology is intended to be applied in all years from 2016 onwards. Each year of data generally has multiple different releases and different releases will produce different counts of people using LTSS.
Overview of Methods: KFF included all people with at least one month of Medicaid enrollment who were using the following types of LTSS: institutional care (care provided in a nursing facility or intermediate care facility) and HCBS (home health, personal care, 1915(c) waiver, 1115 waiver, and “other” HCBS). Several summary level indicators categorize people who used specific types of LTSS as using only institutional care, only HCBS, or both types of care. KFF categorized claims using the type-of-service code from the first line claim, which was applied to the header claim in a merged dataset. More details are below.
Institutional LTSS: KFF defined enrollees who used institutional LTSS if they had a claim for care provided at either a nursing facility or intermediate care facility (see table below).
| TOS_CD Values | KFF Categorization Of Type of Institutional LTSS | Description |
| 9 | Nursing Facility | Nursing facility services for individuals age 21 or older (other than services in an institution for mental disease) |
| 45 | Nursing Facility | Nursing facility services for individuals age 65 or older in institutions for mental diseases |
| 46 | Intermediate Care Facility | Intermediate care facility (ICF)/Intermediate Care Facilities for individuals with Intellectual Disabilities (IIDICF)/Individuals with Intellectual Disabilities (IID) services |
| 47 | Nursing Facility | Nursing facility services, other than in institutions for mental diseases |
| 59 | Nursing Facility | Skilled nursing facility services for individuals under age 21 |
Home and Community-Based Services: KFF used eligibility information and claims files to identify people who used HCBS.
- Enrollees who had at least one month of 1915(c) enrollment (WVR_1915C_MOS > 0) were identified as using 1915(c) waiver services.
- For people who did not have any enrollment in a 1915(c) waiver, KFF used the claims to determine whether they were using HCBS, including home health, personal care, or other HCBS (see table below).
- If enrollees used home health, personal care, or other HCBS; and were enrolled in an 1115 waiver (WVR_TYPE_CD equal to 01 or 29), and lived in a state that provided HCBS through an 1115 waiver, they were identified as using 1115 waiver services. From 2018-2020, the following states provided HCBS through an 1115 waiver: AZ, AR, CA, DE, HI, KS, MD, MN, NJ, NM, NY, RI, TN, TX, VT, and WA.
- For enrollees who used HCBS but were not enrolled in a 1915(c) or 1115 waiver as described above, KFF categorized the types of services they were using as home health, personal care, or other HCBS. Enrollees could use multiple types of HCBS in those categories. KFF compared the T-MSIS data to older HCBS surveys from 2018 and 2020 and identified discrepancies which suggest that the “other HCBS” group likely includes some people using HCBS through a 1915 state plan authority and some people using HCBS through a waiver in states that did not populate 1915(c) information on the eligibility file.
- KFF counted only the enrollees with the top 50% of home health claims in each state as people who used home health to exclude people who used short-term home health. The cut-off point reflects the distribution of home health claim counts per enrollee in each state and was selected to calibrate counts such that the number of people using LTSS in each state was similar to the number identified in the older KFF surveys. The specific claim count cut-off varied by state and year. In 2020, the claim counts for the top 50% of people who used home health services in each state ranged from 1 claim in Utah to 28 claims in Massachusetts.
- Similarly, KFF counted only enrollees with the top 75% of personal care claims as people who used personal care in each state. The claim count cut-off varies by state and year. In 2020, the claim counts for the top 75% of people who used personal care services in each state ranged from 2 claims in Illinois and Delaware to 126 claims in Massachusetts.
| TOS_CD Values | KFF Categorization Of Type of HCBS | Description |
| 16 | Home Health | Home health services — Nursing services |
| 17 | Home Health | Home health services — Home health aide services |
| 18 | Home Health | Home health services — Medical supplies, equipment, and appliances suitable for use in the home |
| 19 | Home Health | Home health services — Physical therapy provided by a home health agency or by a facility licensed by the State to provide medical rehabilitation services |
| 20 | Home Health | Home health services — Occupational therapy provided by a home health agency or by a facility licensed by the State to provide medical rehabilitation services |
| 21 | Home Health | Home health services — Speech pathology and audiology services provided by a home health agency or by a facility licensed by the State to provide medical rehabilitation services |
| 51 | Personal Care | Personal care services |
| 62 | Other HCBS | HCBS — Case management services |
| 63 | Other HCBS | HCBS — Homemaker services |
| 64 | Home Health | HCBS — Home health aide services |
| 65 | Personal Care | HCBS — Personal care services |
| 66 | Other HCBS | HCBS — Adult day health services |
| 67 | Other HCBS | HCBS — Habilitation services |
| 68 | Other HCBS | HCBS — Respite care services |
| 69 | Other HCBS | HCBS — Day treatment or other partial hospitalization services, psychosocial rehabilitation services and clinic services (whether or not furnished in a facility) for individuals with chronic mental illness |
| 70 | Other HCBS | HCBS — Day Care |
| 71 | Other HCBS | HCBS — Training for family members |
| 72 | Other HCBS | HCBS — Minor modification to the home |
| 73 | Other HCBS | HCBS — Other services requested by the agency and approved by CMS as cost effective and necessary to avoid institutionalization |
| 74 | Other HCBS | HCBS — Expanded habilitation services — Prevocational services |
| 75 | Other HCBS | HCBS — Expanded habilitation services — Educational services |
| 76 | Other HCBS | HCBS — Expanded habilitation services — Supported employment services, which facilitate paid employment |
| 77 | Other HCBS | HCBS65-plus — Case management services |
| 78 | Other HCBS | HCBS-65-plus — Homemaker services |
| 79 | Home Health | HCBS-65-plus — Home health aide services |
| 80 | Personal Care | HCBS-65-plus — Personal care services |
| 81 | Other HCBS | HCBS-65-plus — Adult day health services |
| 82 | Other HCBS | HCBS-65-plus — Respite care services |
| 83 | Other HCBS | HCBS-65-plus — Other medical and social services |
| 144 | Other HCBS | Payments to individuals for personal assistance services under 1915(j) |
| Notes: Only people who were not enrolled in either an 1915(c) or 1115 waiver were grouped into home health, personal care, and other HCBS based on the types of service they were using. | ||
Key Limitations: For HCBS, where there are few established benchmarks on the number of people using services, KFF calibrated the selection criteria such that state-level counts were similar to the results from KFF’s HCBS survey. For most states, the approach yielded reasonable results but in several cases, there were significant discrepancies between the survey data and the T-MSIS output. Examples include Maine (where the 1915(c) enrollees appear to be showing up as people who used state plan services), Rhode Island (which has low counts of people using HCBS in all categories), and Wisconsin (where the 1915(c) enrollees are showing up as people who used other HCBS).