Immunizations for Adults Covered by the ACA

Federal law requires most private health insurance plans and Medicaid programs to cover the full cost of recommended immunizations for adults with no cost-sharing. Vaccine and booster recommendations may vary by age and population. Some of the recommended vaccines that are covered in full, at least for some population groups, are for COVID-19, Human papillomavirus (HPV), measles-mumps-rubella (MMR), and Influenza along with many of the traditional childhood vaccinations.

The Advisory Committee on Immunization Practices (ACIP) develops recommendations for vaccine use to prevent the spread of diseases caused by infections and viruses.

The table below presents detailed information on immunizations for adults covered under the ACA, including a summary of the recommendation, the target population, effective date of coverage, and related coverage clarifications. Ongoing litigation over the scope of the preventive services requirement in the case, Braidwood Management Inc. v. Becerra, could affect coverage policy of preventive health services in the future. 

Immunizations

Health Promotion Preventive Services for Adults Covered by the ACA

The Affordable Care Act (ACA) requires most private health insurance plans and Medicaid ACA expansion programs to cover the full cost of several preventive services related to health promotion, such as counseling on healthy diet, obesity prevention, and alcohol use. Plans must also cover screening for intimate partner violence, urinary incontinence, and checkup visits for women.

The required services are recommended by the U.S. Preventive Services Task Force (USPSTF)and the Health Resources and Services Administration (HRSA) based on recommendations issued by the Women’s Preventive Services Initiative.  The Advisory Committee on Immunization Practices recommends vaccines for adults and children that must also be covered without cost-sharing. 

The table below presents detailed information on clinical preventive services related to health promotion for adults covered under the ACA, including a summary of the recommendation, the target population, effective date of coverage, and related coverage clarifications.

Chronic Conditions

Chronic Condition Preventive Health Services for Adults Covered by the ACA

The Affordable Care Act (ACA) requires most private health insurance plans and Medicaid ACA expansion programs to cover many recommended preventive services without any patient cost-sharing, including services  for prevention and early detection of risks associated with chronic conditions, such as heart disease, diabetes, obesity, hepatitis, anxiety, and depression.

The required services for adults are recommended by the U.S. Preventive Services Task Force (USPSTF)and the Health Resources and Services Administration (HRSA) based on recommendations issued by the Women’s Preventive Services Initiative. The Advisory Committee on Immunization Practices recommends vaccines for adults and children that must also be covered without cost-sharing. 

The table below presents detailed information on preventive health services related to chronic conditions for adults covered under the ACA, including a summary of the recommendation, the target population, effective date of coverage, and related coverage clarifications.  

Chronic Conditions

ACA Preventive Services Tracker

Last Updated on June 27, 2025

The Affordable Care Act (ACA) requires most private health insurance plans and Medicaid ACA expansion programs to cover many recommended health care preventive services for adults without any patient cost-sharing, including preventive services for specific conditions.

Select from the categories below for detailed information on preventive services for each condition covered under the ACA for adults, including a summary of the recommendation, the target population, effective date of coverage, and related coverage clarifications.

The required health services for adults are recommended by the U.S. Preventive Services Task Force (USPSTF) and the Health Resources and Services Administration (HRSA) based on recommendations issued by the Women’s Preventive Services Initiative. The Advisory Committee on Immunization Practices recommends vaccines for adults and children that must also be covered without cost-sharing.

Cancer-Related Preventive Health Services for Adults Covered by the ACA

The Affordable Care Act (ACA) requires most private health insurance plans and Medicaid ACA expansion programs to cover many recommended preventive services without any patient cost-sharing, including the following cancer-related screening tests: mammograms, preventive medications and genetic counseling for breast cancer, colonoscopies for colon cancer screening, pap tests for detection of cervical cancer, CT test to screen for lung cancer, and behavioral counseling on skin cancer.

The required services for adults are recommended by the U.S. Preventive Services Task Force (USPSTF) and the Health Resources and Services Administration (HRSA) based on recommendations issued by the Women’s Preventive Services Initiative. The Advisory Committee on Immunization Practices recommends vaccines for adults and children that must also be covered without cost-sharing. 

The table below presents detailed information on cancer-related screening and preventive services covered under the ACA for adults, including a summary of the recommendation, the target population, effective date of coverage, and related coverage clarifications.

Cancer
Poll Finding

Misinformation About Immigrants in the 2024 Presidential Election

Published: Sep 24, 2024


Findings

As part of KFF’s ongoing effort to identify and track misinformation in the U.S., the latest KFF Health Misinformation Tracking Poll examines claims about immigrants that have circulated during the 2024 presidential election cycle. While immigration has been a frequent topic of the campaign, the political discourse surrounding immigrants often overlooks the perspectives and experiences of immigrants themselves. To address this gap, this report includes new insights from a survey of immigrants in addition to views among the general public. This research builds on the 2023 KFF/LA Times Survey of Immigrants, which found that large shares of immigrants are confused and fearful about using government benefit programs. A companion issue brief provides key facts about immigrants’ health care use and costs.

Key takeaways from this report include:

  • Most of the public has heard or read claims – including false claims – about immigrants from elected officials or candidates as part of the campaign. Conducted before the September 10 presidential debate, the survey found that large majorities of adults across partisans say they have heard false statements from candidates and elected officials that immigrants are “causing an increase in violent crime in the U.S.” (80%) and that “immigrants are taking jobs and causing an increase in unemployment for people born in the U.S.” (74%). A majority of adults (69%) also report hearing the true claim from candidates and elected officials that “immigrants help fill labor shortages in certain industries like agriculture, construction, or health care,” though far fewer (31%) report hearing the true claim that “undocumented immigrants pay billions of dollars in U.S. taxes each year.”
  • When it comes to the truthfulness of these claims about immigrants, a majority of adults are in the “muddled middle,” saying the claims are either “probably true” or “probably false.” For example, more than half (56%) of adults overall say the false claim that “immigrants are causing an increase in violent crime in the U.S.” is either “probably true” (28%) or “probably false” (28%), while about one in five each say this claim is “definitely true” (23%) or “definitely false” (20%).
  • Despite many adults falling in the “muddled middle,” there are strong partisan divides in the public’s perceptions of the truthfulness of these claims, with Republicans more likely than Democrats to say false claims about immigrants are “definitely true.” For example, about four in ten (45%) Republicans say it is “definitely true” that immigrants are causing an increase in violent crime in the U.S., whereas a similar share (39%) of Democrats say this claim is “definitely false.” Conversely, Democrats are more likely than Republicans to say each of the true claims about immigrants is “definitely true.”
  • Amid former President Trump’s false claims that undocumented immigrants drain federal benefit programs and receive free government health care, many U.S. adults, as well as immigrants themselves, are confused about whether and when immigrants can qualify for programs like these. Across partisanship and immigration status, about half or more U.S. adults and immigrant adults say they are either unsure or incorrectly believe that most immigrants to the U.S. are eligible to enroll in federal health insurance programs, including Medicare and Medicaid, as soon as they arrive in the U.S. Under longstanding federal policy, most lawfully present immigrants, with some exceptions, are generally ineligible to enroll in federal benefit programs like Medicaid until they have resided in the U.S. for at least five years. Undocumented immigrants are ineligible for federally funded health insurance programs.
  • Nearly four in ten (36%) immigrant adults say the way former President Trump has talked about immigrants in his campaign has had a negative effect on how they are treated as immigrants in the U.S., rising to 45% among Asian immigrant adults. Those who say they have been negatively affected by Trump’s rhetoric point to his role in instigating violence, racism, and discrimination toward immigrants. Most (72%) immigrants say that the way Vice President Harris has spoken about immigrants in her campaign has not affected how they are treated, yet perhaps in a nod to her heritage, three in ten (30%) Asian immigrant adults say the way Harris speaks about immigrants has had a positive effect on how they are treated.
  • More than twice as many immigrant adults say that immigrants will be better off under a Harris (55%) presidency than a Trump presidency (19%), but about one quarter (26%) say who the president is makes no difference in the lives of immigrants. About seven in ten (73%) immigrants who identify as Democrats or lean towards the Democratic party say immigrants will be better off under Harris while nearly half (46%) of Republicans and Republican-leaning immigrants say the same about Trump.
  • Similar to U.S. voters overall, immigrants who are citizens and registered to vote name the economy and inflation (39%) and threats to democracy (24%) as their top voting issues in this year’s presidential election. About one in ten (9%) immigrant voters say immigration and border security is their top issue.

The Public’s Exposure to and Belief in Claims About Immigrants

Immigrants and immigration have been a central issue of the 2024 presidential campaign. The Trump campaign has repeatedly described immigrants as a source of crime, a burden for taxpayers, and a drain on government programs like Medicare and Social Security. The Harris campaign has also focused on immigration, emphasizing her tough on crime stance as a former attorney general of a border state, while also highlighting her family’s immigrant roots. Fielded before the September 10 presidential debate, the latest KFF Health Misinformation Tracking Poll asked the public about true and false claims about immigrants that have circulated during the campaigns. 

False claims about immigrants are pervasive, with large majorities of adults saying they have heard or read statements from candidates or elected officials that “immigrants are causing an increase in violent crime in the U.S.” (80%) and that “immigrants are taking jobs and causing an increase in unemployment for people born in the U.S.” (74%). A majority of adults (69%) also report hearing the true claim from candidates or elected officials that “immigrants help fill labor shortages in certain industries like agriculture, construction, and health care,” though far fewer (31%) report hearing that “undocumented immigrants pay billions of dollars in U.S. taxes every year.” The shares who report hearing or reading these claims are similar across partisans, but fewer Republicans than Democrats have heard the true claim about undocumented immigrants paying billions in taxes (23% vs. 38%).

A Majority of Adults, Including Similar Shares Across Partisans, Say They Have Heard False Claims About Immigrants From Elected Officials or Candidates

As with other forms of misinformation, many adults are not certain what to believe when it comes to campaign-related statements about immigrants, with a majority falling in the “muddled middle,” saying the claims are either “probably true” or “probably false.” Overall, more than half (56%) of adults say the false claim that “immigrants are causing an increase in violent crime in the U.S.” is either “probably true” (28%) or “probably false” (28%). A similar pattern exists on the false claim about immigrants causing an increase in unemployment for U.S.-born workers (27% “probably true,” 30% “probably false”) and the true claim that undocumented immigrants pay billions of dollars in U.S. taxes (27% “probably true,” 32% “probably false”). For the true claim about immigrants filling labor shortages in key industries, overall, about half of adults fall in the middle, but more adults are inclined to say it is “probably true” (44%) than “probably false” (11%).

Most Adults Are Uncertain When it Comes to the Accuracy of Both True and False Statements About Immigrants

Public perceptions of the truthfulness of these claims are sharply divided along partisan lines, with Republicans more likely than Democrats to believe false assertions that immigrants are causing increases in violent crime and unemployment. About four in ten (45%) Republicans say the false claim about immigrants and violent crime is “definitely true,” whereas a similar share (39%) of Democrats says this claim is “definitely false.” There is also a wide partisan gap in perceptions of the false claim that immigrants are taking jobs and contributing to unemployment for U.S.-born adults, with about three in ten (31%) Republicans saying this is “definitely true,” while about four in ten (46%) Democrats say this is “definitely false.”

Republicans Are More Likely Than Democrats and Independents to Believe False Claims About Immigrants Causing Increases in Crime and Unemployment

Partisans also differ in their level of certainty about two true claims about immigrants. For example, sizeable shares of both Democrats and Republicans are inclined to believe the true claim that immigrants help fill labor shortages in certain industries, as at least three quarters from both parties say this claim is at least “probably true.” However, Democrats are stronger than Republicans in this conviction, as a larger share say it is “definitely true” (55% vs. 21%). Few Democrats or Republicans are certain about the truthfulness of the true claim that “undocumented immigrants pay billions of dollars in U.S. taxes every year,” as at least half of adults from both parties say this statement is either “probably true” or “probably false.” Still, on this true claim, Republicans are more likely than Democrats to say it is “definitely false” (43% vs. 13%).

Majorities Across Partisans Believe Immigrants Help Fill Labor Shortages, But Few Republicans Think It's True That Undocumented Immigrants Pay Billions in U.S. Taxes

Knowledge About Immigrants’ Eligibility and Use of Federal Benefit Programs

Immigrants and immigration are key talking points of former President Donald Trump’s campaign as well as many other Republican candidates and elected officials. He and others have frequently made false statements about immigrants, including that undocumented immigrants are receiving free health care from the federal government, immigrants are “killing” Social Security and Medicare, and that immigrants receive an outsized share of government benefits. The latest KFF Health Misinformation Tracking Poll asks both the general public as well as immigrants themselves their knowledge on immigrants’ eligibility and use of federal benefits.

About half of U.S. adults overall (51%) and immigrant adults (49%) incorrectly believe undocumented immigrants are eligible for health insurance programs paid for by the federal government or say they are “not sure.” About three in ten adults overall (29%) and immigrant adults (32%) say they are “not sure” whether undocumented immigrants are eligible for health insurance paid for by the federal government and about one in five of each group (21%, 17%) incorrectly say undocumented immigrants are eligible. The other half of U.S. adults (49%) and immigrant adults (51%) correctly say undocumented immigrants are not eligible for federal health insurance programs. Among U.S. adults overall, Republicans are more likely than Democrats to incorrectly believe undocumented immigrants are eligible for federal health insurance programs (30% vs. 18%). Under federal policy, undocumented immigrants are ineligible to enroll in federal health insurance programs like Medicare, Medicaid, or CHIP, or to purchase coverage through the ACA Marketplaces. As of June 2024, six states plus D.C. provide fully state-funded health insurance coverage to some income-eligible immigrant adults regardless of status. However, these programs are fully paid for by state funds.

About Half of U.S. Adults and Immigrant Adults Either Incorrectly Believe Undocumented Immigrants Are Eligible for Federal Health Insurance Programs or Say They Are Unsure

About half or more U.S. adults and immigrant adults either incorrectly believe most immigrants are eligible to receive benefits like Medicare, Medicaid, and Social Security as soon as they arrive in the U.S. or say they are unsure. Under longstanding federal policy, most lawfully present immigrants, with some exceptions, are generally ineligible to enroll in federal benefit programs like Medicaid, until they have resided in the U.S. for at least five years (see KFF’s companion issue brief on health care use among immigrants for more information). To qualify for Social Security and Medicare, lawfully present immigrants must meet all eligibility requirements, including work and age requirements, which preclude new immigrants from enrolling. About three in ten U.S. adults overall (31%) and one third of immigrant adults (32%) incorrectly believe most immigrants are eligible to receive benefits from Medicaid as soon as they arrive in the U.S., while at least a third of each group (33%, 38%) are unsure. There are similar levels of confusion over Medicare eligibility, with 58% of all U.S. adults and the same share of immigrant adults answering incorrectly or being unsure. About half of U.S. adults overall (53%) and immigrant adults (45%) correctly say immigrants are not eligible for Social Security benefits as soon as they arrive in the U.S., though about half in each group either answer incorrectly or are unsure. Overall, similar shares of U.S. adults and immigrants are confused about immigrants’ eligibility for these federal benefits regardless of their partisanship or citizenship status, respectively, but a higher percentage of U.S. adults who are Republican mistakenly believe immigrants are immediately eligible for Medicaid compared with Democrats (40% vs. 31%).

At Least Half of Adults, Including Similar Shares of Immigrants, Incorrectly Believe Recently-Arrived Immigrants Are Eligible For Social Security, Medicare, or Medicaid or Say They Are Unsure

Most (59%) U.S. adults incorrectly believe that on average, immigrants receive more in government benefits than they pay in taxes, while most (66%) immigrant adults correctly say the opposite: that immigrants pay more in taxes than they receive in government benefits. Among both U.S. adults overall and immigrant adults, there are stark differences by partisanship on this question. About eight in ten (84%) Republican U.S. adults incorrectly believe immigrants receive more in government benefits on average than they pay in taxes, whereas a majority (61%) of Democrats correctly say the opposite. Among immigrant adults, most partisans correctly answer that immigrants pay more in taxes than they receive in government benefits, but Democrats and Democratic-leaning immigrants are more likely than Republicans and Republican-leaners to answer correctly (71% vs. 58%). Perhaps in a reflection of their own ineligibility for many government benefits, about eight in ten (78%) immigrant adults who are non-citizens are aware that immigrants pay more in taxes than they receive in government benefits, while a smaller majority (57%) of immigrant citizens say the same. Analysis shows undocumented immigrants contribute billions in federal, state, and local taxes each year, helping to fund programs they cannot access, including Social Security and Medicare. Research further finds that immigrants pay more into the health care system through taxes and health insurance premiums than they utilize, helping to subsidize health care for U.S.-born citizens.

Most U.S. Adults Believe Immigrants Receive More in Government Benefits Than They Pay In Taxes, While Most Immigrants Say the Opposite

How Immigrants Have Been Affected by the Campaign

Nearly four in ten (36%) immigrant adults say the way former President Trump has talked about immigrants in his campaign has had a negative effect on how they are treated as immigrants in the U.S., rising to 45% among Asian immigrant adults. Overall, about half of (54%) immigrant adults say Trump’s rhetoric about immigrants has not had an effect on how they are treated, while an additional one in ten (10%) say it has had a positive effect. There are no substantial differences in responses among immigrant adults by citizenship status nor by English proficiency in how they say Trump’s immigrant rhetoric has affected them.

About Four in Ten Immigrants Say Trump's Rhetoric About Immigrants Has Negatively Affected Them, Including About Half of Asian Immigrants

In Their Own Words: How Trump’s Campaign Rhetoric Has Affected Immigrants

In a few words, can you describe how the campaign has affected how you are treated?

“With Trump people belittle me and think that we’re thieves and rapists”-  72-year-old Mexican immigrant woman in California

“I am looked at more suspiciously when I am out alone or with only other people of color. I do not feel safe out alone”— 50-year-old Taiwanese immigrant woman in California

“People usually tell me to go back to my country, to go back where I came from, to go back to Mexico even though that’s not where I’m from”-27-year-old Dominican immigrant woman in Rhode Island

“If you happen to speak Spanish (like at [the grocery store]) as my wife and I do, there are generally ‘eye rolls’ and ‘staring’ at us by primarily White folks”-80-year-old Mexican immigrant man in Texas

“Donald Trump’s rhetoric has demonized all immigrants and make them feel like second class citizens”-41-year-old Chinese immigrant man in California

Most (72%) immigrants report that Vice President Harris’s campaign statements about immigrants have had no effect on how they are treated, but perhaps in a nod to her heritage, about three in ten (30%) Asian immigrant adults say her statements have had a positive effect. Overall, about one in five (21%) immigrant adults say they feel the way Harris has talked about immigrants in her campaign has positively affected the way they are treated as immigrants in the U.S., while far fewer (7%) say Harris’s statements have had a negative effect on how they are treated.

Most Immigrants Say Harris' Rhetoric About Immigrants Has Not Affected Them, While About One in Five Say It Has Had a Positive Effect

A majority of immigrant adults say that immigrants would be better off under a Harris (55%) presidency compared to a Trump presidency (19%), but about one quarter (26%) say who the president is makes no difference in the lives of immigrants. Immigrant partisans are divided on this question. About three quarters (73%) of immigrant Democrats and Democratic-leaners say immigrants will be better off under Harris, whereas about one in four (24%) Republicans and Republican-leaning immigrants say the same. While about four in ten (46%) of immigrants who are Republican or lean Republican say immigrants would be better off under Trump, about three in ten (29%) say it makes no difference who is president.

Just Over Half of Immigrants Say Immigrants in the U.S. Will Be Better Off if Harris Is Elected President, While About One in Five Say They Will Be Better Off if Trump Wins

Immigrant Voters’ Priorities

Immigrants who are citizens and registered to vote prioritize similar issues and are equally motivated to vote in the presidential election as U.S. voters overall. About half of immigrants to the U.S. are naturalized citizens and therefore eligible to vote in U.S. Among these voters, about half (53%) say they are more motivated to vote this year compared to previous presidential elections, similar to the share of all U.S. voters who say the same (59%).

Immigrant voters also prioritize a similar list of issues as U.S. voters overall, with the economy and inflation (39%) and threats to democracy (24%) topping the list of issues these voters say are most important to their presidential vote. About one in ten (9%) citizen immigrant voters say immigration and border security is their top issue, followed by Medicare and Social Security (8%), abortion (5%), and the war in Gaza (5%). Partisan splits on these issues are also similar to U.S. voters overall, with a larger share of Republican and Republican-leaning immigrant voters compared to Democrats/Democratic-leaning immigrant voters prioritizing the economy and inflation (51% vs. 32%), and larger shares of Democrats vs. Republicans prioritizing threats to democracy (35% vs. 3%) and abortion (7% vs. 1%).

Immigrant Voters Cite the Economy and Inflation as the Top Issue Determining Their Vote

Methodology

KFF September 2024 Health Misinformation Tracking Poll Methodology

This KFF Health Tracking Poll/Health Misinformation Tracking Poll was designed and analyzed by public opinion researchers at KFF. The survey was conducted August 26-September 4, 2024, online and by telephone among a nationally representative sample of 1,312 U.S. adults in English (1,244) and in Spanish (68). The sample includes 1,028 adults (n=53 in Spanish) reached through the SSRS Opinion Panel either online (n=1,018) or over the phone (n=18). The SSRS Opinion Panel is a nationally representative probability-based panel where panel members are recruited randomly in one of two ways: (a) Through invitations mailed to respondents randomly sampled from an Address-Based Sample (ABS) provided by Marketing Systems Groups (MSG) through the U.S. Postal Service’s Computerized Delivery Sequence (CDS); (b) from a dual-frame random digit dial (RDD) sample provided by MSG. For the online panel component, invitations were sent to panel members by email followed by up to three reminder emails.

Another 284 (n=15 in Spanish) interviews were conducted from a random digit dial telephone sample of prepaid cell phone numbers obtained through MSG. Phone numbers used for the prepaid cell phone component were randomly generated from a cell phone sampling frame with disproportionate stratification aimed at reaching Hispanic and non-Hispanic Black respondents. Stratification was based on incidence of the race/ethnicity groups within each frame.

Respondents in the phone samples received a $15 incentive via a check received by mail, and web respondents received a $5 electronic gift card incentive (some harder-to-reach groups received a $10 electronic gift card). In order to ensure data quality, cases were removed if they failed two or more quality checks: (1) attention check questions in the online version of the questionnaire, (2) had over 30% item non-response, or (3) had a length less than one quarter of the mean length by mode. Based on this criterion, no cases were removed.

The combined cell phone and panel samples were weighted to match the sample’s demographics to the national U.S. adult population using data from the Census Bureau’s 2022 Current Population Survey (CPS), September 2021 Volunteering and Civic Life Supplement data from the CPS, and the 2024 KFF Benchmarking Survey with ABS and prepaid cell phone samples. The demographic variables included in weighting for the general population sample are gender, age, education, race/ethnicity, region, civic engagement, frequency of internet use, political party identification by race/ethnicity, and education. The sample of registered voters was weighted separately to match the U.S. registered voter population using the same parameters above derived from the 2024 KFF Benchmarking Survey. Both weights account for differences in the probability of selection for each sample type (prepaid cell phone and panel). This includes adjustment for the sample design and geographic stratification of the cell phone sample, within household probability of selection, and the design of the panel-recruitment procedure.

The margin of sampling error including the design effect for the full sample is plus or minus 4 percentage points and is plus or minus 4 percentage points for registered voters. Numbers of respondents and margins of sampling error for key subgroups are shown in the table below. For results based on other subgroups, the margin of sampling error may be higher. Sample sizes and margins of sampling error for other subgroups are available by request. Sampling error is only one of many potential sources of error and there may be other unmeasured error in this or any other public opinion poll. KFF public opinion and survey research is a charter member of the Transparency Initiative of the American Association for Public Opinion Research.

GroupN (unweighted)M.O.S.E.
Total1,312± 4 percentage points
Total registered voters1,084± 4 percentage points
Democratic registered voters377± 7 percentage points
Independent registered voters335± 7 percentage points
Republican registered voters332± 7 percentage points


KFF Survey of Immigrants: Election 2024 Methodology

This KFF Survey of Immigrants: Election 2024 was designed and analyzed by public opinion researchers at KFF. The survey was conducted August 19-September 17, 2024, online and by telephone among a nationally representative sample of 543 U.S. immigrants in English (429), Chinese (21), Spanish (80), Korean (12), and Vietnamese (1). The sample was reached through the SSRS/KFF Immigrants Panel either online (n=492) or over the phone (n=51). The SSRS/KFF Immigrants Panel is a nationally representative probability-based panel of immigrants where panel members were recruited randomly in one of three ways: (a) Through invitations mailed to respondents randomly sampled from an Address-Based Sample (ABS) provided by Marketing Systems Groups (MSG) through the U.S. Postal Service’s Computerized Delivery Sequence (CDS); (b) a random digit dial telephone sample of prepaid cell phone numbers obtained through MSG from a dual-frame random digit dial (RDD) sample provided by MSG or (c) calling back telephone numbers from recent SSRS RDD polls whose final disposition was “language barrier,” meaning the person answering the phone spoke a language other than English or Spanish.

An initial invitation letter to the survey was sent to panel members via USPS asking them to take the survey online or by calling a toll-free number. Invitation letters were also sent via email to panelists who provided an email address during registration. Email invitations were sent to those who provided an email address during panel registration. Outbound call attempts were also made to panelists who provided a phone number. Online respondents received a $10 electronic gift card incentive, and phone respondents received a $10 incentive check by mail.

The sample was weighted to match the sample’s demographics to the national U.S. adult immigrant population using data from the 2022 American Communities Survey. The demographic variables included in weighting are home ownership, number of adults in household, presence of children in household, census region, length of time in the U.S., English proficiency, citizenship status, gender, age, race/ethnicity, education, and country of origin. Weights account for recontact propensity and the design of the panel recruitment survey.

Comparisons to total US adults come from the September 2024 KFF Health Misinformation tracking poll which was conducted among a nationally representative sample of N=1,312 US adults in English (1,244) and Spanish (68) from August 26 to September 4, 2024. The sample was reached via the probability based SSRS Opinion Panel (1,028) and through a RDD sample of prepaid cell phone numbers (284). The combined cell phone and panel samples were weighted to match the sample’s demographics to the national U.S. adult population using data from the Census Bureau’s 2022 Current Population Survey (CPS), September 2021 Volunteering and Civic Life Supplement data from the CPS, and the 2024 KFF Benchmarking Survey with ABS and prepaid cell phone samples. The demographic variables included in weighting for the general population sample are gender, age, education, race/ethnicity, region, civic engagement, frequency of internet use, political party identification by race/ethnicity, and education. The sample of registered voters was weighted separately to match the U.S. registered voter population using the same parameters above derived from the 2024 KFF Benchmarking Survey. Both weights account for differences in the probability of selection for each sample type (prepaid cell phone and panel). This includes adjustment for the sample design and geographic stratification of the cell phone sample, within household probability of selection, and the design of the panel-recruitment procedure.

The margin of sampling error including the design effect for the immigrant adults sample is plus or minus 6 percentage points and is plus or minus 4 percentage points for US adults. Numbers of respondents and margins of sampling error for key subgroups are shown in the table below. For results based on other subgroups, the margin of sampling error may be higher. Sample sizes and margins of sampling error for other subgroups are available by request. Sampling error is only one of many potential sources of error and there may be other unmeasured error in this or any other public opinion poll. KFF public opinion and survey research is a charter member of the Transparency Initiative of the American Association for Public Opinion Research.

GroupN (unweighted)M.O.S.E.
Total Immigrant Adults543± 6 percentage points
Total US adults1,312± 4 percentage points
Registered voters
Immigrant registered voters315± 9 percentage points
Total US registered voters1,084± 4 percentage points


Appendix

The KFF Health Misinformation Tracking Poll sought to examine the public’s exposure to and belief in several true and false claims about immigrants. Below are some of the sources used to document their accuracy.

ClaimAccuracy Source
Immigrants are causing an increase in violent crime in the U.S.False. Violent crime is not increasing in the U.S. Studies show that immigrants are less likely to commit violent crimes than U.S.-born adults, and that there is no correlation between immigration and violent crime rates.NY Times; Factcheck.org; NPR
Immigrants are taking jobs and causing an increase in unemployment for people born in the U.S.False. Unemployment rates are not increasing for people born in the U.S. Since 2021, employment for U.S.-born adults has increased more than employment for foreign-born workers.Factcheck.org; Bureau of Labor Statistics
Immigrants help fill labor shortages in certain industries like agriculture, construction, and health careTrue. There are labor shortages in many service industry jobs, and immigrants are more likely to be employed in these sectors than are U.S.-born adults.CNN; Brookings; KFF: Bureau of Labor Statistics
Undocumented immigrants pay billions of dollars in U.S. taxes every yearTrue. Undocumented immigrants paid $96.7 billion in federal, state, and local taxes in 2022.Institute of Taxation and Economic Policy; CNN


News Release

Poll: As the Election Approaches, Most of the Public Say They Have Heard False Claims about Immigrants 

Nearly 4 in 10 Immigrants Say that Former President Trump’s Rhetoric Has Harmed Them

Published: Sep 24, 2024

With immigration and border security getting attention heading into November’s elections, a large majority of the public reports hearing false claims about immigrants from candidates or elected officials, and many immigrants say the rhetoric is negatively affecting how they are treated, a new KFF Health Misinformation Tracking Poll finds.

Fielded before the Sept. 10 debate between former President Trump and Vice President Harris, the poll tested the public’s awareness of, and belief in, several statements about immigrants, both false and true. A companion survey of immigrants examines their views and experiences during the campaign.

Most of the public say they have heard candidates or officials make the false claims that “immigrants are causing an increase in violent crime” (80%) and that “immigrants are taking jobs and causing an increase in unemployment for people born in the U.S.” (74%).

About one in five people wrongly say that each of those two false claims are “definitely true,” with similar shares saying they are “definitely false.” In each case, a majority falls somewhere in between, describing the claims as only “probably” true or false.

For many immigrants, campaign rhetoric can have tangible effects. Nearly four in ten (36%) immigrants – including almost half (45%) of Asian immigrants – say that the way former President Trump talks about immigrants has negatively affected the way they are treated. Few (7%) say the same about Vice President Harris’ rhetoric, while about one in five (21%), including three in ten (30%) Asian immigrants, say that her rhetoric has had a positive effect.

When asked about the potential outcome of the election for immigrants, a narrow majority (55%) of immigrants say they would be better off if Vice President Harris wins, roughly three times the share that say that they would be better off if former President Trump wins (19%). A quarter (26%) say that who the president would not make a difference in the lives of U.S. immigrants.

“Everyone is quick to point to social media as the source of misinformation, and it often is, but it’s candidates who are amplifying misinformation about immigrants. Our poll shows that they’re harming immigrants in the process,” said KFF President and CEO Drew Altman, who also wrote a new column on the issue following comments by former President Trump and Sen. J.D. Vance about Haitian immigrants in Springfield Ohio.  

The poll of the public at large also reveals sharp differences among partisans in their likelihood to endorse those false claims.

Specifically, about four in ten (45%) Republicans say it is “definitely true” that immigrants are causing an increase in violent crime in the U.S., while a similar share (39%) of Democrats say this claim is “definitely false.” And about three in ten (31%) Republicans say the false claim about immigrants causing an increase in unemployment for U.S.-born people is “definitely true,” while nearly half (46%) of Democrats say it is “definitely false.”

Many People, Including Immigrants, Are Confused about Eligibility for Federal Health Benefits

The poll also gauges the public’s – and immigrants’ – understanding about immigrants’ eligibility for government benefits programs amid former President Trump’s false claims during the campaign that immigrants drain federal benefit programs and receive free government health care.

Half of the general public (51%) and immigrants (49%) do not realize that undocumented immigrants are not eligible for health insurance programs paid for by the federal government, either saying either that they aren’t sure or wrongly saying that they are eligible.

Similarly, half or more of the public and immigrants do not understand that most immigrants are not eligible for Social Security, Medicare, or Medicaid benefits as soon as they arrive in the U.S., saying either that they aren’t sure or wrongly saying that they are eligible immediately.

Under longstanding federal policy, most lawfully present immigrants, with some exceptions, are generally ineligible to enroll in federal benefit programs like Medicaid until they have resided in the U.S. for at least five years. Undocumented immigrants are ineligible for federally funded health insurance programs.

A related new KFF report explains these rules as well as other key facts about immigrants’ use of health care and its costs.

Designed and analyzed by public opinion researchers at KFF. The KFF Health Misinformation Tracking Poll was conducted August 26-Sept. 4, 2024, online and by telephone among a nationally representative sample of 1,312 U.S. adults in English and Spanish. Findings for immigrant adults are based on a separate nationally representative survey of 543 immigrant adults (people living in the U.S. who were born outside the U.S. and its territories). The survey of immigrants was conducted August 19-September 17, 2024 online and by telephone in English, Chinese, Spanish, Korean, and Vietnamese. The margin of sampling error is plus or minus 4 percentage points for total U.S. adults and 6 percentage points for immigrant adults. For results based on other subgroups, the margin of sampling error may be higher.

Opioid Deaths Fell in Mid-2023, But Progress Is Uneven and Future Trends are Uncertain

Authors: Heather Saunders, Nirmita Panchal, and Sasha Zitter
Published: Sep 23, 2024

Since the opioid epidemic was declared a public health emergency in 2017, it has claimed 454,464 lives, with opioid-related deaths rising by 67% between 2017 and 2023. Initially driven by prescription opioids and heroin, the epidemic has shifted in recent years, with illicit synthetic fentanyl—a substance 100 times more potent than morphine—now dominating most markets. Even a small amount of fentanyl can be lethal, and in 2023, 7 in 10 counterfeit opioid pills contained a deadly dose.

Although provisional CDC data show a decline in opioid deaths in 2023, the death toll remains much higher than just a few years ago, keeping this issue in the spotlight. Both former President Trump and Vice President Harris have records related to addressing the opioid epidemic, but they also have proposed different approaches to ongoing and future efforts to address the issue. Trump’s 2024 campaign emphasizes a stricter law enforcement strategy aimed at reducing trafficking, primarily through reinstating and tightening border policies and tougher punishment, including the death penalty for “traffickers and drug smugglers.” In contrast, the Biden-Harris administration’s multi-pronged strategy includes reducing supply, expanding harm reduction, and improving access to treatment, with Harris placing a stronger emphasis on increasing fentanyl seizures through enhanced detection technology at the border and ports. Along with the 1 in 3 adults who report in a KFF survey that they or a family member have been addicted to opioids (29%) or illegal drugs (27%), both President Biden and Vice-Presidential hopeful J.D. Vance have close family members who have experienced addiction.

This analysis examines opioid overdose deaths from the last two decades (2003-2023), with a particular focus on the decline in deaths observed in the last six months of 2023. Opioid overdose deaths include fatalities from intentional acts (suicide or homicide), unintentional acts (poisoning or drug assault), or cases of unknown intent. Regardless of other substances involved, any death with opioid involvement is classified as an opioid overdose death. According to provisional 2023 CDC WONDER data, fewer than 1% of deaths remain undetermined. Key takeaways from this analysis include the following:

  • Fentanyl-involved opioid deaths drove rises in overall overdose deaths, by over 23-fold from 2013 to 2023, while prescription opioid deaths stayed steady and heroin deaths declined.
  • In the second half of 2023, opioid overdose deaths started to decline, and by December 2023, they were 20% fewer than there were in December 2022. While it is unclear how much any specific policy may have contributed to the decline, a number of policies were implemented, including those focused on reducing supply of fentanyl, increasing treatment, and improving access to harm reduction supplies—such as opioid overdose reversal medication.
  • Opioid death rates varied widely by race, ethnicity, age, and sex. In the second half of 2023, White people saw the largest decline (-14%) while declines in other racial and ethnic groups were much smaller. Opioid deaths increased for people 65+, while falling in all other age groups.
  • In 2023, opioid death rates were the highest in WV, DC, and DE (71.4, 49.9, and 47.5/100,000, respectively), while states with the lowest opioid death rates included NE, SD, and IA (4.3, 5.7, and 8.4/100,000, respectively). In three-quarters of states, opioid deaths declined in the last six months of 2023 compared to the same period in 2022.

The sharp rise in drug deaths in recent years was driven by fentanyl deaths. Fentanyl-involved opioid deaths surged more than 23-fold over the last decade, while prescription opioid deaths remained steady and heroin deaths declined. Fentanyl deaths more than doubled during the pandemic, increasing from 36,359 in 2019 to 73,838 in 2022 (Figure 1). Illicit synthetic fentanyl (referred to as fentanyl for simplicity) is inexpensive to produce and often mixed into other drug supplies, such as methamphetamine and cocaine. In addition to increases in fentanyl supply, other factors, such as pandemic-related stressors, disruptions in treatment, and other life challenges, as well as insufficient treatment infrastructure and a shortage of skilled providers, may have contributed to rises in opioid deaths.

Increases in Overall Drug Overdose Deaths Were Driven by Sharp Increases in Fentanyl Deaths in the Past Decade

In the second half of 2023, opioid overdose deaths began to decline and continued to fall through the end of the year. In July 2023, deaths were 2% lower than in July 2022, and by December, they were 20% lower compared to December 2022. Looking at 2023 alone, opioid deaths dropped from 6,928 in July to 5,841 in December, a decrease of over 1,000 deaths (Figure 2). Early provisional and partial data for the first quarter of 2024 point to a continuation of this downward trend through early 2024.

Though Opioid Overdose Deaths Are Still High Relative to Pre-Pandemic Levels, Mid-2023 Marked the Start of a Decline

Non-opioid overdose deaths also fell in the last half of 2023 compared to the previous year, though the decline was smaller (-3% vs. -10% for opioid deaths) (Figure 3). Non-opioid deaths refer to drug overdose deaths that did not involve opioids, such as those involving only non-opioid drugs, like cocaine or methamphetamine. Non-opioid deaths account for a much smaller share, about one-third, of overall drug overdose deaths.

Overdose Deaths that Did Not Involve Opioids Also Decreased but to a Lesser Extent

While it is too early to determine if the decline in opioid overdose deaths will continue, several federal policies aimed at reducing deaths may have played a role. The Biden-Harris administration’s strategy for the opioid epidemic focuses three key areas: expanding harm reduction and public awareness, improving access to treatment and supports, and reducing the supply and spread of illicit drugs, particularly fentanyl. FDA’s approval of the first over the counter opioid overdose medication likely increased public access to the medication. Federal opioid response grants and settlement funds supported low-barrier distribution of naloxone and other harm reduction tools, like fentanyl test strips, while campaigns like the DEA’s “One Pill Can Kill,” raised public awareness of fentanyl risks. Federal policies extended or permanently relaxed in-person requirements for methadone and buprenorphine treatment. Federal investments in the broader mental health services, such as 988 and mobile crisis, may have also contributed, perhaps through connections to care. Efforts to reduce fentanyl supply are also ongoing, with increased seizures at U.S. borders and ports of entry.

How do opioid death rates vary across demographics groups?

In 2023, opioid death rates were highest among American Indian/Alaska Native (AIAN) and Black people, individuals aged 26 to 44, and males (Figure 4). AIAN and Black people had the highest death rates across race and ethnicity, at 49.8 and 37.9 per 100,000, respectively. Earlier in the opioid epidemic, overdose rates were highest among White people, but this trend shifted with opioid death rates for Black people surging over 700%, compared to a 140% rise for White people in the past decade. The high rates of opioid deaths among American Indian and Alaska Native (AIAN) people mirrors broader worsening trends in behavioral health, including the highest and fastest-growing suicide and overall drug overdose rates. Among age groups, those aged 26 to 44 had the highest death rates, followed by those aged 45 to 64. Although people aged 12-17 and 65+ have lower overall rates, these groups have seen substantial increases in recent years. In 2023, opioid death rates among males were more than double those of females, with males also experiencing the largest increase over the past decade, rising 238%.

Opioid overdose death rates are the highest among AIAN people, Black people, those aged 26 to 44, and males

Opioid overdose deaths decreased across most racial and ethnic groups from the last 6 months of 2023 compared to the same period in 2022, but drops were greater among White people (-14%) compared to other racial and ethnic groups (-2 to -6%, Figure 5). The larger decline in these deaths among White people may reflect racial disparities in access to OUD treatment. Prior KFF analyses found that White people were more likely to have access to medications used to treat OUD compared to Black and Hispanic people. The uptake of medication treatment services is also low among AIAN people.

While opioid overdose deaths decreased for all non-elderly age groups in the last six months of 2023, they increased for elderly adults (65+). Young adults saw the largest decline (-23%) in opioid deaths from the second half of 2023 compared to the second half of 2022. The rise in overdose deaths among elderly adults (9%) during the same period may be linked to challenges in detecting and treating substance use disorder (SUD) in this group, as symptoms can be mistaken for age-related decline. When a SUD is identified, stigma, decreased social support, transportation, and physical comorbidities can complicate access to treatment services—along with few SUD treatment programs that are designed for geriatric adults. Older adults have higher rates of opioid prescriptions, but co-prescribing of overdose reversal medication is low.

Opioid Overdose Deaths Fell Across Most Demographics in the Second Half of 2023, but the Magnitude of that Change Was Uneven Across Demographic Groups

How do opioid death rates vary across states and how have they changed?

Opioid overdose death rates varied widely across states in 2023, from 4.3 per 100,000 in Nebraska to 71.4 per 100,000 in West Virginia (Figure 6). Nebraska, South Dakota, and Iowa had the lowest rates, with 4.3, 5.7, and 8.4 deaths per 100,000 people, respectively. West Virginia had the highest rate at 71.4 per 100,000—over 40% higher than the next highest rate in D.C., which was 49.9 per 100,000. The national opioid death rate was 24.1 per 100,000, with 33 states having rates within 10 deaths per 100,000 of the national death rate (Figure 5).

Opioid overdose death rates vary widely across states, from 4.3 to 71.4 per 100,000 people in 2023

The last 6 months of 2023 brought drops in opioid deaths nationally and in about three quarters of states, compared to the same months in 2022 (Figure 7). Over this period, opioid overdose deaths decreased the most in North Carolina (-41%), remained relatively steady in New Mexico and Mississippi (-1%, +1%, respectively), and increased the most in Alaska (+58%).

Though Opioid Deaths Dropped in About Three-Quarters of States During the Second Half of 2023, Sharp Increases Continued in a Few States

States can develop their own approaches to addressing the opioid epidemic or build on federal initiatives, but state actions vary. State decisions about allocation of state opioid response grants and settlement funds for low barrier access to naloxone and other harm reduction tools, as well as efforts to ease access to treatment vary by state and may impact outcomes. Some states, like Virginia, have invested in campaigns to expand awareness about fentanyl in drug supplies, building on federal messaging campaigns like the DEA’s “One Pill Can Kill.” State decisions on Medicaid coverage and limits for certain populations and substance use services, along with whether to adopt federal opportunities that expand treatment and health coverage to high-risk groups, such as incarcerated individuals nearing release, may also influence outcomes.

A Snapshot of Sources of Coverage Among Medicare Beneficiaries

Published: Sep 23, 2024

Health care affordability has been a longstanding concern in the U.S., including among older adults, many of whom have relatively low incomes and modest assets to help pay medical bills. Medicare offers important financial protection by providing health insurance coverage to 67 million people in the U.S., including adults age 65 or older and younger adults with long-term disabilities. Coverage of Medicare benefits is provided through either traditional Medicare or Medicare Advantage private plans. Enrollment in Medicare Advantage plans has grown rapidly in recent years, partly because most Medicare Advantage plans charge no premium (other than the Part B premium) and offer extra benefits not available in traditional Medicare such as dental, vision, and hearing benefits. Most people with Medicare also have other coverage, such as Medicaid, Medigap, and employer coverage, which may pay some or all of their Medicare cost-sharing requirements and may also provide benefits that Medicare does not cover.

This brief analyzes the different types of coverage that people with Medicare have and the demographic characteristics of Medicare beneficiaries with different types of coverage, based on the Centers for Medicare & Medicaid Services Medicare Current Beneficiary Survey, 2022 Survey file data (MCBS) (the most recent year of data available, see Methods for details).

Key highlights:

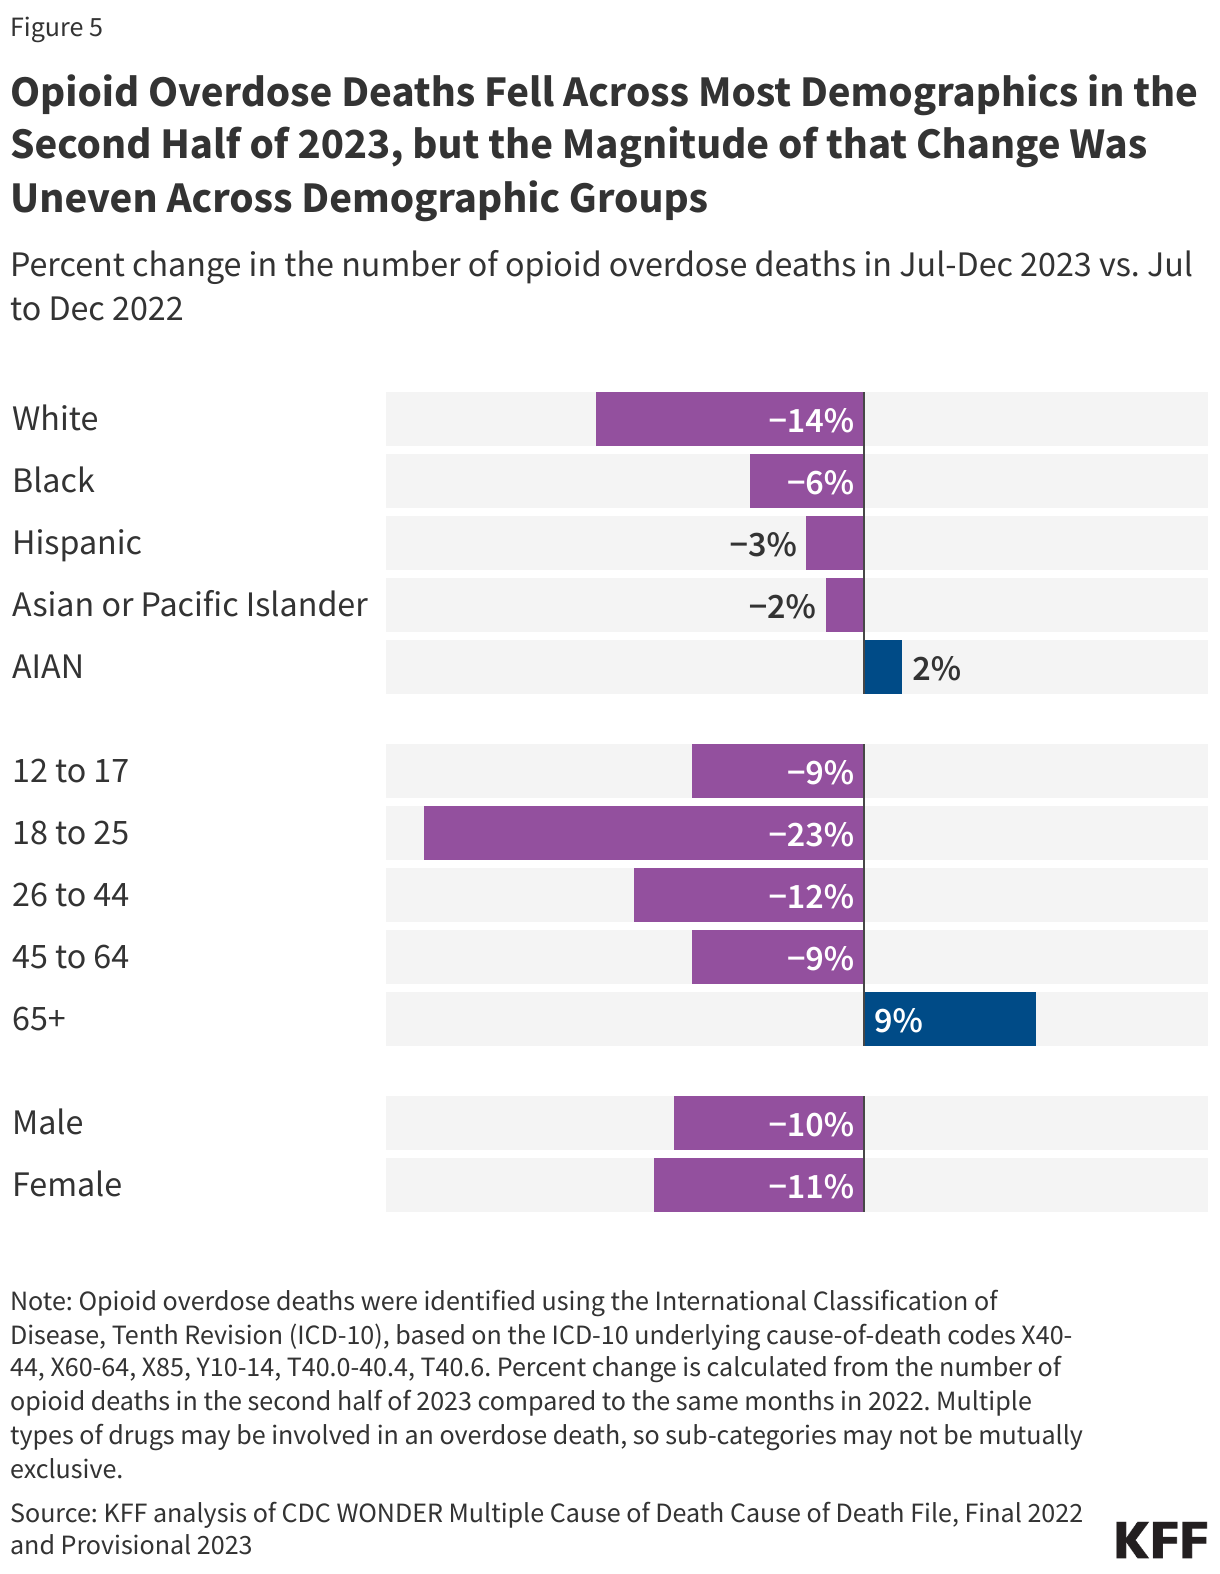
  • In 2022, Medicare enrollment was split equally between Medicare Advantage and traditional Medicare. Overall, more than 4 in 10 Medicare beneficiaries (44%), including beneficiaries in traditional Medicare and Medicare Advantage, had additional coverage from an employer or union sponsored plan (24%) or Medicaid (19%).
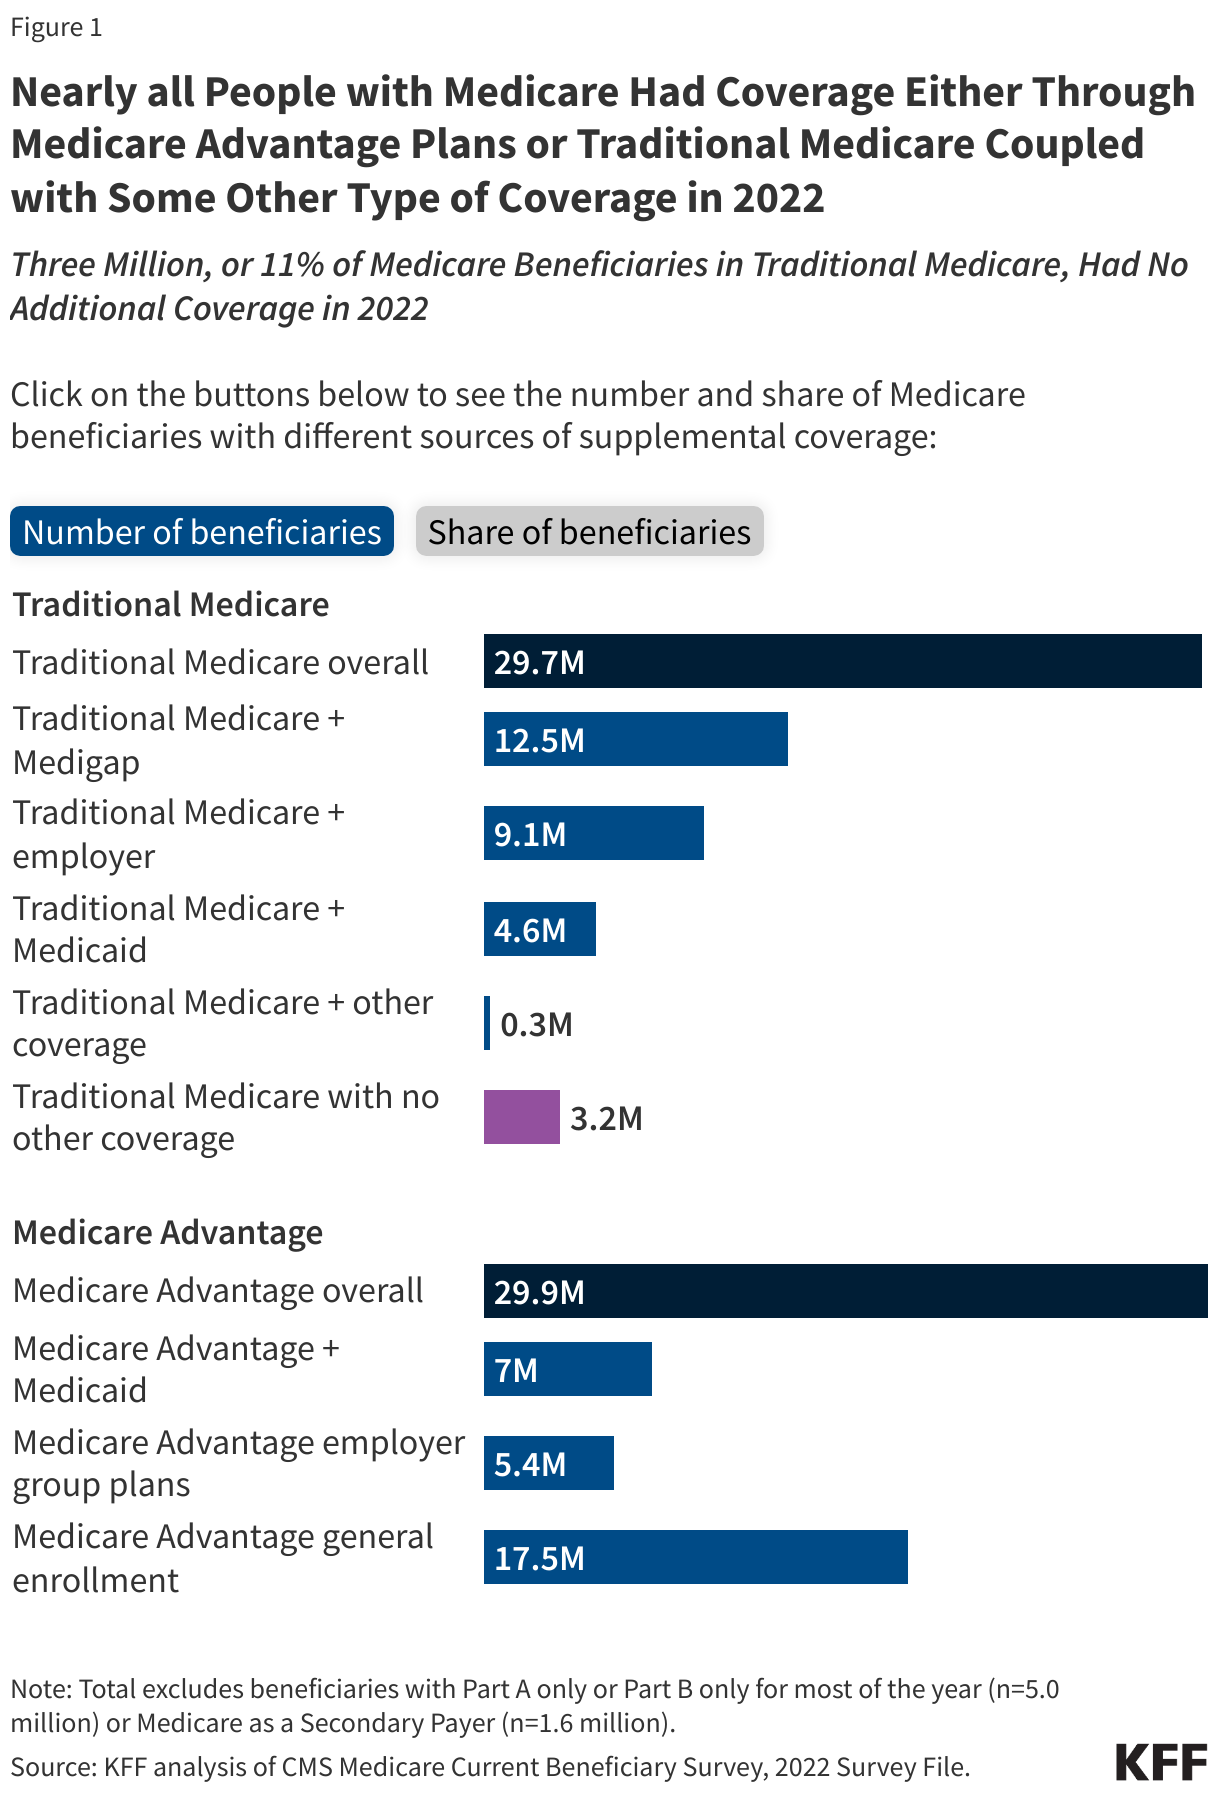
  • Nearly 90% of people in traditional Medicare had some form of additional coverage, such as Medigap (42%), employer or union-sponsored retiree health benefits (31%), or Medicaid (16%), but 11% (three million Medicare beneficiaries) had no additional coverage.
  • More than 40% of all Medicare Advantage enrollees also had some form of coverage from Medicaid (23%) or a union/employer sponsored retiree health plan (18%) in 2022.
  • Beneficiaries in traditional Medicare with Medigap and employer-sponsored insurance had higher incomes, were in relatively good health, had more years of education, and were less likely to be under age 65 with disabilities than all traditional Medicare beneficiaries.
  • As more beneficiaries have shifted to Medicare Advantage plans, the number of Medicare beneficiaries in traditional Medicare with no additional coverage has declined from 5.6 million in 2018 to 3.2 million in 2022. Traditional Medicare beneficiaries with no supplemental coverage were more likely to be under the age of 65 and have relatively lower incomes compared to traditional Medicare beneficiaries overall.
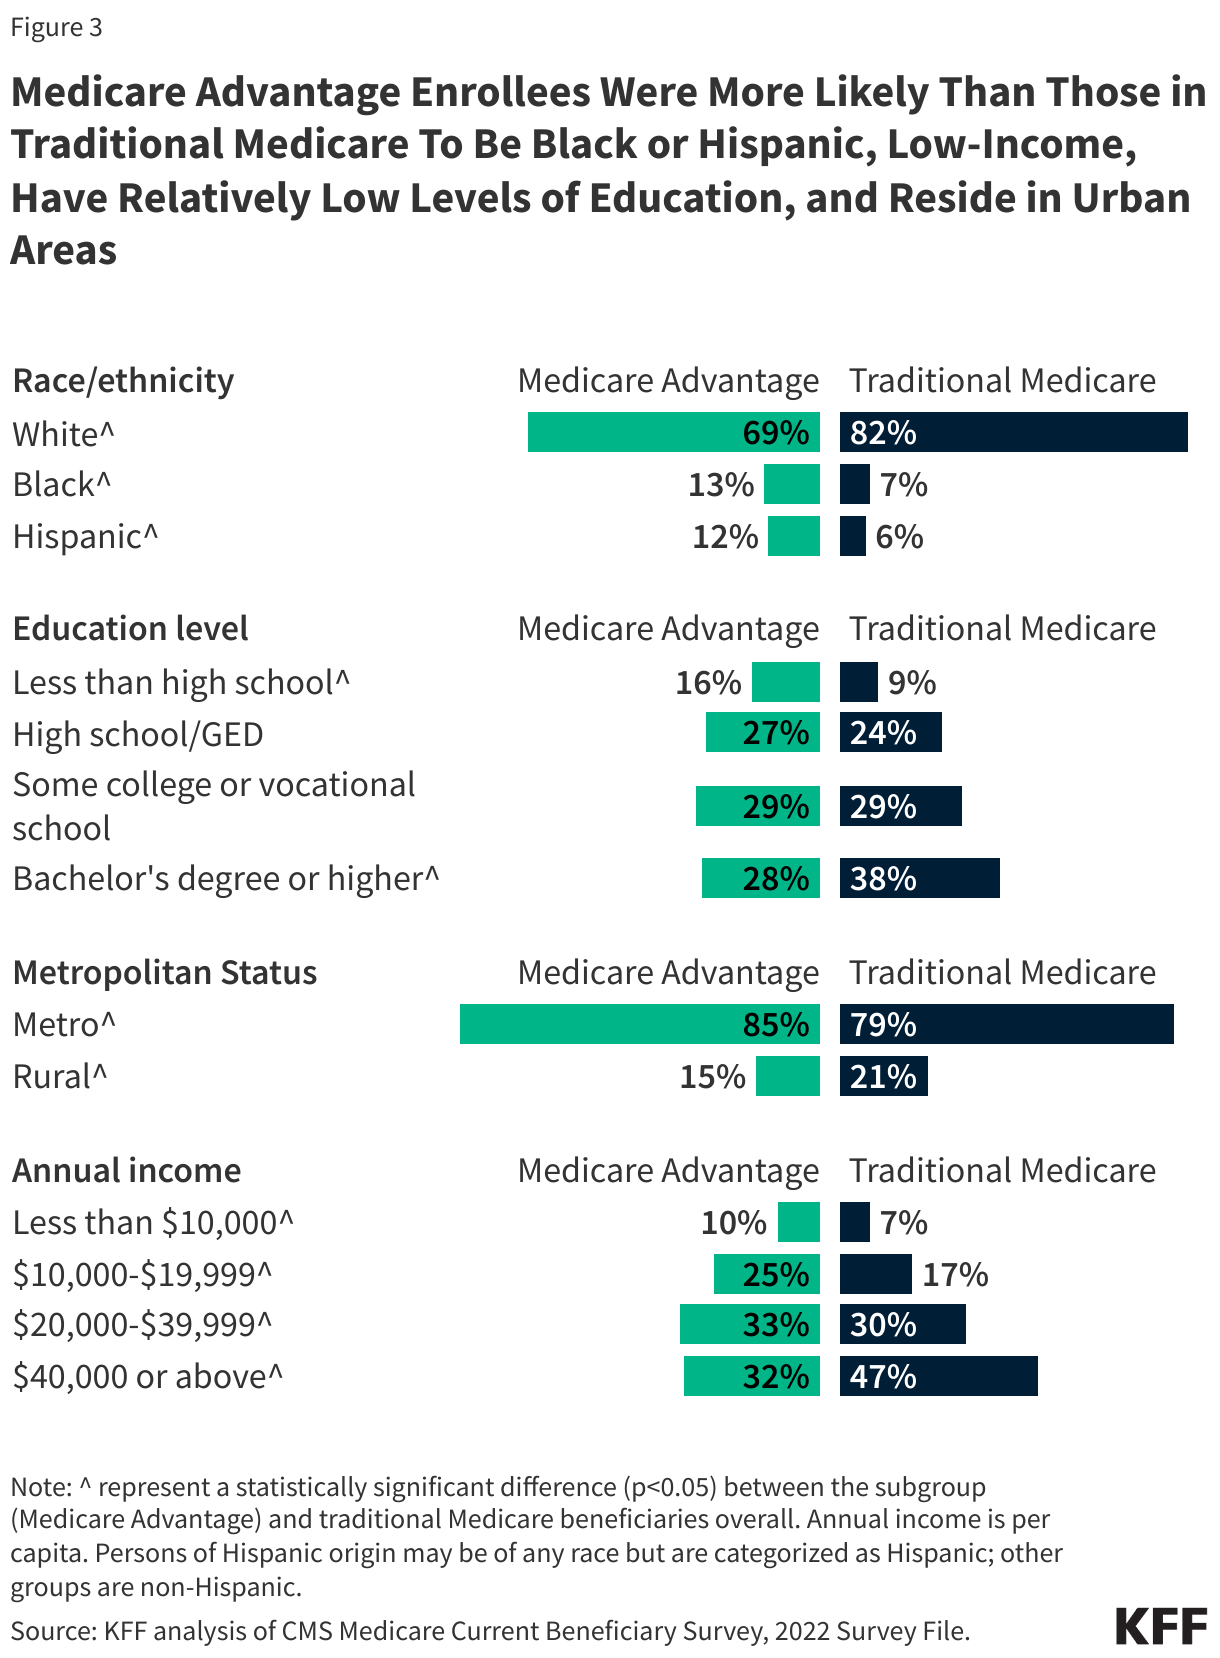
  • Medicare Advantage enrollees were more likely to be Black or Hispanic, self-report relatively poor health, have incomes below $20,000 per person, and have lower levels of education, compared to traditional Medicare beneficiaries in 2022.
  • Dual-eligible individuals accounted for a larger number and share of Medicare Advantage enrollees (7.0 million; 23%) than traditional Medicare beneficiaries (4.6 million; 16%) in 2022. Dual-eligible individuals in both traditional Medicare and Medicare Advantage were more likely to have lower incomes, self-report relatively poor health, identify as Black or Hispanic, and be under age 65 with disabilities than the overall Medicare population. 

Sources of Coverage

Among the 59.6 million people enrolled in both Medicare Part A and Part B in 2022, enrollment was split equally between Medicare Advantage and traditional Medicare (Figure 1). Most people in traditional Medicare had some form of additional coverage, such as Medicaid, retiree health benefits through an employer or Medigap, but three million Medicare beneficiaries (5%) had no additional coverage. While Medicare Advantage enrollment has surpassed 50% of total Medicare enrollment as of 2024, MCBS data beyond 2022 is not yet available.

Nearly all People with Medicare Had Coverage Either Through Medicare Advantage Plans or Traditional Medicare Coupled with Some Other Type of Coverage in 2022

Characteristics of Medicare Beneficiaries, By Source of Coverage

Traditional Medicare

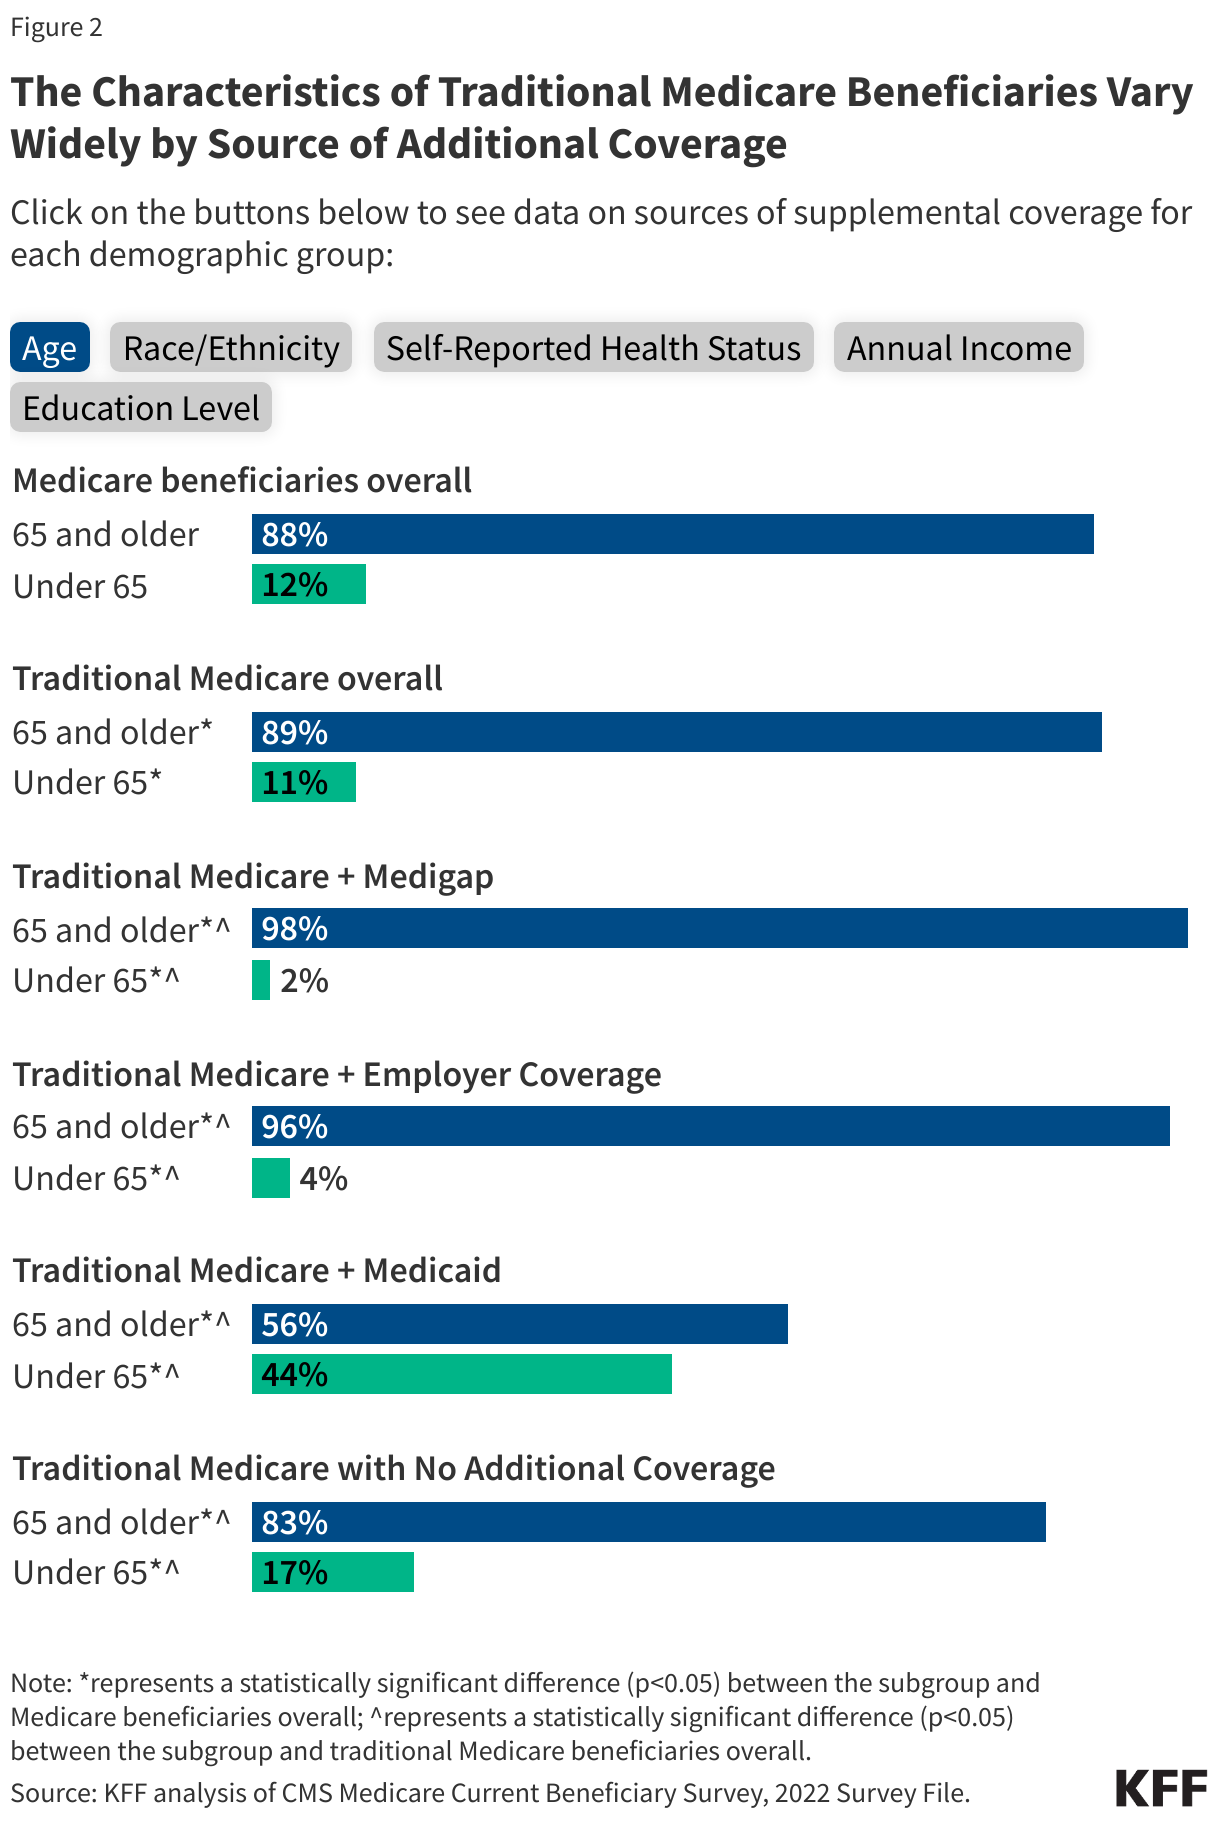
Among the 29.7 million Medicare beneficiaries in traditional Medicare in 2022, most (89%) had some type of additional coverage, either through Medigap (42%), employer coverage (31%), Medicaid (16%), or another source (1%). But 1 in 10 (11%) of Medicare beneficiaries in traditional Medicare had no additional coverage (Figure 1, Appendix Table 1). A more detailed discussion of these types of coverage and the characteristics of people in each category is below.

The Characteristics of Traditional Medicare Beneficiaries Vary Widely by Source of Additional Coverage

Medigap

Medicare supplement insurance, also known as Medigap, covered 2 in 10 (21%) Medicare beneficiaries overall, or 42% of those in traditional Medicare (12.5 million beneficiaries) in 2022. Medigap policies, sold by private insurance companies, fully or partially cover Medicare Part A and Part B cost-sharing requirements, including deductibles, copayments, and coinsurance. Medigap limits the financial exposure of Medicare beneficiaries and provides protection against catastrophic medical expenses. For example, a previous KFF report found that a smaller share of traditional Medicare with additional sources of coverage, such as Medigap, reported cost-related problems than Medicare Advantage enrollees or traditional Medicare beneficiaries without additional coverage. However, Medigap premiums can be costly for beneficiaries living on modest incomes and can rise with age, among other factors, depending on the state in which they are regulated.

Compared to all traditional Medicare beneficiaries in 2022, beneficiaries with Medigap were more likely to be White, have higher annual incomes (above $20,000 per person), self-report excellent, very good, or good health, and have a bachelor’s degree or higher (Figure 2, Appendix Table 1).

In contrast, a smaller share of traditional Medicare beneficiaries under age 65 have a Medigap policy than traditional Medicare beneficiaries ages 65 and older (2% versus 11%). Federal law provides a 6-month guarantee issue protection for adults ages 65 and older when they first enroll in Medicare Part B if they want to purchase a supplemental Medigap policy, but these protections do not extend to adults under the age of 65, who qualify for Medicare due to having a long-term disability. Most states do not require insurers to issue Medigap policies to beneficiaries under age 65, and most do not extend guarantee issue protections to people over age 65 beyond the one-time Medigap open enrollment period.

Employer Coverage

In total, 14.5 million Medicare beneficiaries – a quarter (24%) of Medicare beneficiaries overall – also had some form of employer or union-sponsored health insurance coverage in 2022 in addition to Medicare Part A and Part B. Of this total, 9.1 million beneficiaries had employer coverage in addition to traditional Medicare (31% of beneficiaries in traditional Medicare), while 5.4 million beneficiaries were enrolled in Medicare Advantage employer group plans (see Medicare Advantage section below; estimates do not sum to total due to rounding). People with both Medicare Part A and Part B and employer- or union-sponsored coverage are likely to be retirees for whom Medicare is primary.

Compared to traditional Medicare beneficiaries overall in 2022, beneficiaries with employer or union-sponsored coverage in addition to traditional Medicare were more likely to have higher incomes ($40,000 or greater per person), a bachelor’s degree or higher, self-report excellent or good health, have no limitations in activities of daily living (ADLs), and were less likely to be under age 65 (Figure 2, Appendix Table 1).

Separately, in 2022, an estimated 5.6 million Medicare beneficiaries had Part A only, a group that primarily includes people who were active workers (either themselves or their spouses) and had primary coverage from an employer plan and Medicare as a secondary payer. People with Part A only cannot enroll in a Medicare Advantage plan, so people with coverage through Medicare Advantage employer group plans are likely to be retired.

Medicaid

Medicaid, the federal-state program that provides health and long-term services and supports coverage to low-income people, was a source of supplemental coverage for 11.6 million Medicare beneficiaries with low incomes and modest assets in 2022, or 19% of all Medicare beneficiaries. A larger number of Medicare beneficiaries with Medicaid (known as dual-eligible individuals) were enrolled in a Medicare Advantage plan (7.0 million) than in traditional Medicare (4.6 million people) (see Medicare Advantage section below) (Appendix Table 1). For these beneficiaries, Medicaid typically pays the Medicare Part B premium and may also pay a portion of Medicare deductibles and other cost-sharing requirements. Most dual-eligible individuals are also eligible for full Medicaid benefits, including long-term services and supports. Dual-eligible individuals who are not eligible for full Medicaid benefits receive partial benefits, including assistance with Medicare premiums and, in many but not all cases, Medicare cost-sharing requirements.

Compared to traditional Medicare beneficiaries overall in 2022, dual-eligible individuals were more likely to have low incomes and relatively low education levels, self-report fair or poor health, identify as Black or Hispanic, and be under the age of 65 (Figure 2, Appendix Table 1).

(Estimates of the number of dual-eligible beneficiaries in this analysis may differ from other KFF estimates due to different data sources and methods used; see methods below for details.)

No additional coverage

In 2022, more than 3 million Medicare beneficiaries overall (5%) – 11% of all beneficiaries in traditional Medicare – had no other insurance coverage. Traditional Medicare beneficiaries with no additional coverage are fully exposed to Medicare’s cost-sharing requirements, which would mean paying a $1,632 deductible for a hospital stay in 2024, daily copayments for extended hospital and skilled nursing facility stays, and a $240 deductible plus 20% coinsurance for physician visits and other outpatient services. (These costs are in addition to $174.70 per month (around $2,000 per year) for the standard Part B premium for all of 2024). Beneficiaries in traditional Medicare without additional coverage also face the risk of high annual out-of-pocket costs because there is no cap on out-of-pocket spending for Part A and B services in traditional Medicare, unlike in Medicare Advantage plans.

Beneficiaries in traditional Medicare without any form of additional coverage were more likely to have low and modest incomes (between $10,000 and $40,000 per person) compared to all traditional Medicare beneficiaries in 2022, and include a relatively large share of people on Medicare with disabilities who are under the age of 65 (Figure 2, Appendix Table 1). Medicare beneficiaries with annual incomes between $10,000 and $40,000 per person have limited ability to afford Medigap premiums and are unlikely to qualify for Medicaid because their income and assets are not low enough to meet eligibility guidelines. Further, because they are more likely to self-report fair or poor health than beneficiaries with incomes of $40,000 or more, they may be more likely to have higher out-of-pocket expenses, further exacerbated by the lack of an out-of-pocket limit in traditional Medicare.

The number and share of traditional Medicare beneficiaries without any form of supplemental coverage has steadily declined in recent years. Between 2018 and 2022, the number of traditional Medicare beneficiaries without supplemental coverage declined from 5.6 million beneficiaries (10% of the total Medicare population, or 17% of those in traditional Medicare) to 3.2 million (5% of the total Medicare population, or 11% of those in traditional Medicare). This decline likely reflects the increase in Medicare Advantage enrollment over time, which has increased from 20 million in 2018 to 33 million in 2024.

Medicare Advantage

In 2022, Medicare Advantage covered half of all Medicare beneficiaries (50%), or 29.9 million people with Medicare. (Medicare Advantage enrollment in 2024 now totals 33 million, or 54% of all eligible beneficiaries.)

Of the total number of Medicare Advantage enrollees in 2022, most (59%) were enrolled in plans available to all Medicare beneficiaries, but 5.4 million (18%) were enrolled in employer- or union-sponsored group plans. Under these arrangements, employers or unions contract with an insurer and Medicare pays the insurer a fixed amount per enrollee to provide benefits covered by Medicare. A growing share of large employers with retiree health obligations are offering these benefits through Medicare Advantage plans.

Another 7.0 million Medicare Advantage enrollees in 2022 (23%) also had Medicaid coverage, and were enrolled in either a Special Needs Plan (SNP) or a Medicare Advantage plan generally available to all Medicare beneficiaries. SNPs restrict enrollment to specific types of beneficiaries with significant or relatively specialized care needs, including beneficiaries dually eligible for Medicare and Medicaid (D-SNPs), people with severe chronic or disabling conditions (C-SNPs), and beneficiaries requiring a nursing home or institutional level of care (I-SNPs).

Compared to traditional Medicare beneficiaries in 2022, Medicare Advantage enrollees were more likely to be Black or Hispanic, have incomes below $20,000 per person, live in urban areas, and have lower levels of education (Figure 3, Appendix Table 1). In addition, dual-eligible individuals account for a larger share of Medicare Advantage enrollees (23%) than traditional Medicare beneficiaries (16%).

Medicare Advantage Enrollees Were More Likely Than Those in Traditional Medicare To Be Black or Hispanic, Low-Income, Have Relatively Low Levels of Education, and Reside in Urban Areas

Methods

This analysis is based on the Centers for Medicare & Medicaid Services Medicare Current Beneficiary Survey (MCBS) 2022 Survey file data (the most recent year available), a nationally representative survey of Medicare beneficiaries. Sources of coverage are determined based on the source of coverage held for the most months of Medicare enrollment in 2022. The analysis includes 59.6 million people with Medicare in 2022 (weighted), including beneficiaries living in the community and in facilities, excluding beneficiaries who were enrolled in Part A only or Part B only for most of their Medicare enrollment in 2022 (weighted n=5.0 million) and beneficiaries who had Medicare as a secondary payer (weighted n=1.6 million). The analysis also focuses only on coverage for Part A and Part B benefits, not Part D. This analysis of the MCBS accounted for the complex sampling design of the survey.

The number of beneficiaries enrolled in both Medicare and Medicaid (or dual-eligible individuals) (11.6 million) in this brief does not align with other KFF estimates due to differences in data sources and methods used. The KFF estimates published elsewhere are based on a 100% sample of data from the Chronic Condition Warehouse (CCW) and include dual-eligible individuals with at least one month of enrollment in Medicare Part A or Part B. The analysis in this brief is based on the MCBS because this data source provides a wider array of demographic and health status indicators than CCW. This analysis excludes beneficiaries in Part A or Part B only and assigns beneficiaries to the type of coverage held for the most months of the year.

All reported differences in the text are statistically significant; results from all statistical tests are reported with p<0.05 considered statistically significant. Because estimates reported in the text and figures are rounded to the nearest whole number, some estimates may not sum to overall totals due to rounding.

Sources of Coverage Among Medicare Beneficiaries, 2022

Key Facts on Health Care Use and Costs Among Immigrants

Published: Sep 23, 2024

Immigrant adults are a diverse population who make up 16% of adults in the United States and play a significant role in the nation’s workforce and communities. Leading up to the 2024 election, there has been an increase in anti-immigrant rhetoric and immigration has been a central talking point for candidates. The Trump campaign has repeatedly described immigrants as a source of crime, a burden for taxpayers, and a drain on government programs like Medicare and Social Security. The Harris campaign has also focused on immigration, emphasizing her tough on crime stance as a former attorney general of a border state, while also highlighting her family’s immigrant roots. Some states have also taken restrictive actions focused on immigrants, including requiring hospitals to collect patient immigration status.

Amid this rhetoric and these recent state actions, data on immigrants’ health care use and costs as well as their contributions to the economy and workforce, including in the health care sector, can be informative. This brief provides key data on these topics drawing on KFF analysis across a range of data sources, including the KFF/LA Times Survey of Immigrants, the largest nationally representative survey of immigrants conducted to date, and other research.

Immigrants are not more likely than U.S.-born citizens to report using government assistance for food, housing, or health care, and undocumented immigrants remain ineligible for federally funded assistance.

The 2023 KFF/LA Times Survey of Immigrants shows that, despite having lower household incomes and facing financial challenges, immigrant adults are no more likely than U.S.-born adults to say that they or someone living with them received government assistance with food, housing, or health care in the past year. Overall, about a quarter (28%) of both immigrant adults and U.S.-born citizen adults say they received this type of assistance in the past 12 months (Figure 1).

Lawfully present immigrants face eligibility restrictions for federal programs, including Medicaid and the Children’s Health Insurance Program (CHIP). In general, lawfully present immigrants must have a “qualified status” to be eligible for Medicaid or CHIP, and many, including most lawful permanent residents or “green card” holders, must wait five years after obtaining qualified status before they may enroll even if they meet other eligibility requirements. Some lawfully present immigrants, such as refugees and asylees, are exempt from the five-year waiting period. States can also expand coverage to lawfully residing immigrant pregnant people and children without a five year wait. Lawfully present immigrants can purchase Affordable Care Act (ACA) Marketplace coverage and receive tax credits to offset the cost of that coverage without a five-year wait. Lawfully present immigrants can also qualify for Medicare but must have sufficient work history. If they do not have this work history, they can purchase Medicare Part A after residing legally in the U.S. for five years continuously.

Undocumented immigrants are not eligible to enroll in federally funded coverage including Medicaid, CHIP, or Medicare, or to purchase coverage through the ACA Marketplaces. Medicaid payments for emergency services may be made to hospitals or other providers on behalf of individuals who are otherwise eligible for Medicaid but for their immigration status. Emergency conditions include those that place an individuals’ health in serious jeopardy or cause serious bodily impairment or dysfunction, although states have discretion to determine what services can be reimbursed through Emergency Medicaid.

Some states have established fully state-funded programs to provide coverage to immigrants regardless of immigration status, although they vary in eligibility and scope of benefits provided. Research suggests that expanding health coverage for immigrants can reduce uninsurance rates, increase health care use, lower costs, and improve health outcomes.

Similar Shares of Immigrant and U.S.-Born Adults Say They Have Received Government Assistance with Food, Housing, or Health Care in the Past Year

Immigrants, particularly those who are undocumented, use less health care, including emergency room care, than people born in the U.S.

Overall, research shows that immigrants, including lawfully present and undocumented immigrants, use less health care than U.S.-born citizens. Moreover, the KFF/LA Times Survey of Immigrants shows that among immigrant adults, likely undocumented immigrants are less likely than lawfully present immigrants and naturalized citizens to report seeking or receiving care in the U.S. or having a health care visit in the past year. About six in ten (63%) likely undocumented immigrant adults report a health care visit in the past year compared with 74% of lawfully present immigrant adults and 82% of naturalized citizen adults.

Lower use of health care among immigrants likely reflects a combination of them being younger and healthier than their U.S.-born counterparts as well as them facing increased barriers to care, including language access challenges, confusion, and immigration-related fears. Prior KFF analysis found that Trump-era policies amplified these fears and contributed to greater reluctance to access care.

Likely Undocumented Immigrant Adults are Significantly Less Likely to Receive Health Care Services Than Naturalized Citizens and Lawfully Present Immigrants

Immigrants have lower health care costs than U.S.- born people.

Reflecting their lower use of health care, immigrants have lower health care expenditures than their U.S.-born counterparts. KFF analysis of 2021 medical expenditure data shows that, on average, annual per capita health care expenditures for immigrants are about two-thirds those of U.S.-born citizens ($4,875 vs. $7,277) (Figure 3). This reflects lower spending for most types of health care, including office-based visits, prescription drugs, inpatient care, outpatient care, and dental care. These findings are consistent with other research which shows that immigrants’ overall health expenditures are one-half to two-thirds of those of U.S.-born individuals, regardless of status, and that per capita expenditures from private and public insurance sources are lower for immigrants, particularly for undocumented immigrants. For example, one study found that undocumented immigrants are more likely to be uninsured and have significantly lower health care expenditures than U.S.-born individuals per year, and that despite differences in the likelihood of being uninsured, there are no significant differences in rates of uncompensated care between undocumented immigrants and U.S.-born individuals.

Immigrants Have Two-Thirds the Per Capita Health Care Expenditures of U.S.-Born People

Immigrants contribute to the economy through their role in the workforce and tax payments, with research showing that they help subsidize health care for U.S.- born people and stabilize Medicare and Social Security.

Immigrants support the nation’s workforce by filling unmet labor market needs, and research suggests that they do not take jobs away from U.S.-born people. They play a disproportionate role filling jobs in essential industries such as construction and agriculture that are at increased risk of adverse health outcomes and injuries, including climate-related health hazards. In addition, immigrants as well as the adult children of immigrants play outsized roles in the health care workforce as physicians, surgeons, nurses, and long-term care workers (Figure 4). As health care workforce shortages are projected to continue and the U.S. 65 and older population grows, immigrants could help mitigate these shortages.

Analysis shows that undocumented immigrants contribute billions in federal, state, and local taxes each year. It is estimated that more than a third of their tax dollars are payroll taxes that fund programs they cannot access, including Social Security, Medicare, and the federal share of unemployment insurance. Research further finds that immigrants pay more into the health care system through taxes and health insurance premiums than they utilize, helping to subsidize health care for U.S.-born citizens. Earlier research found that without the contributions undocumented immigrants make to the Medicare Trust Fund, it would reach insolvency earlier, and that undocumented immigrants result in a net positive effect on the financial status of Social Security.

Immigrants and Adult Children of Immigrants Play an Outsized Role in the Health Care Workforce