Beyond the Numbers: Access to Reproductive Health Care for Low-Income Women in Five Communities
Overview
In the spring and summer of 2019, KFF, working with Health Management Associates, conducted interviews with clinicians, social service providers, community-based organizations, researchers, and health care advocates, as well as a focus group with low-income women in five “medically underserved” communities. Based on the interviews and focus groups, the study addresses how national, state, and local policies, as well as cultural factors, shape access to contraceptive care, sexually transmitted infection prevention and treatment, obstetrical care, and abortion services.
EXECUTIVE SUMMARY
- The Executive Summary provides an overview of the major findings and cross-cutting themes, and is available under the Executive Summary tab.
CASE STUDIES
- In-depth case studies of each of the five communities are available under the Case Studies tab or by clicking on each one below.
NEWS RELEASE
- A news release announcing the publication of Beyond the Numbers: Access to Reproductive Health Care for Low-Income Women in Five Communities is available here.
BRIEFING
- On Thursday, November 14, 2019, KFF held a briefing to release Beyond the Numbers: Access to Reproductive Health Care for Low-Income Women in Five Communities. A recording of the event and presentation slides are available here.
Executive Summary
KFF: Usha Ranji, Michelle Long, and Alina SalganicoffHealth Management Associates: Sharon Silow-Carroll, Carrie Rosenzweig, Diana Rodin, and Rebecca Kellenberg
Introduction
In Washington, DC, and in state capitols across the nation, policy debates over the future of access to reproductive and sexual health services are shaping the range of services and providers available to low-income women. Access to these services, including contraceptive care, sexually transmitted infection (STI) prevention and treatment, obstetrical care, and abortion services, have a profound impact on women’s lives. While instructive, national statistics can mask wide regional and local variation, as well as disparities across socioeconomic, racial, and ethnic groups. In order to understand what is happening at the local level, we went beyond the statistics to see how these policies are playing out in diverse communities across the United States.
Service availability and policies related to health care, contraception, and abortion vary significantly across and within states. State policymakers determine whether to expand Medicaid coverage to low-income adults under the Affordable Care Act (ACA), establish and fund family planning programs for uninsured residents, and adopt rules that regulate abortion services. These state policies also intersect with local factors; the number and distribution of family planning and safety net providers, the content of school-based sex education, cultural traditions of local populations, and underlying social determinants of health all shape access to reproductive health care at the community level.
Shifting federal policies and priorities add to already complex state and local dynamics. New federal rules related to the Title X family planning program, for example, directly affect which organizations can receive funding to provide family planning services to low-income and uninsured women, and indirectly affect the availability of other basic health services.
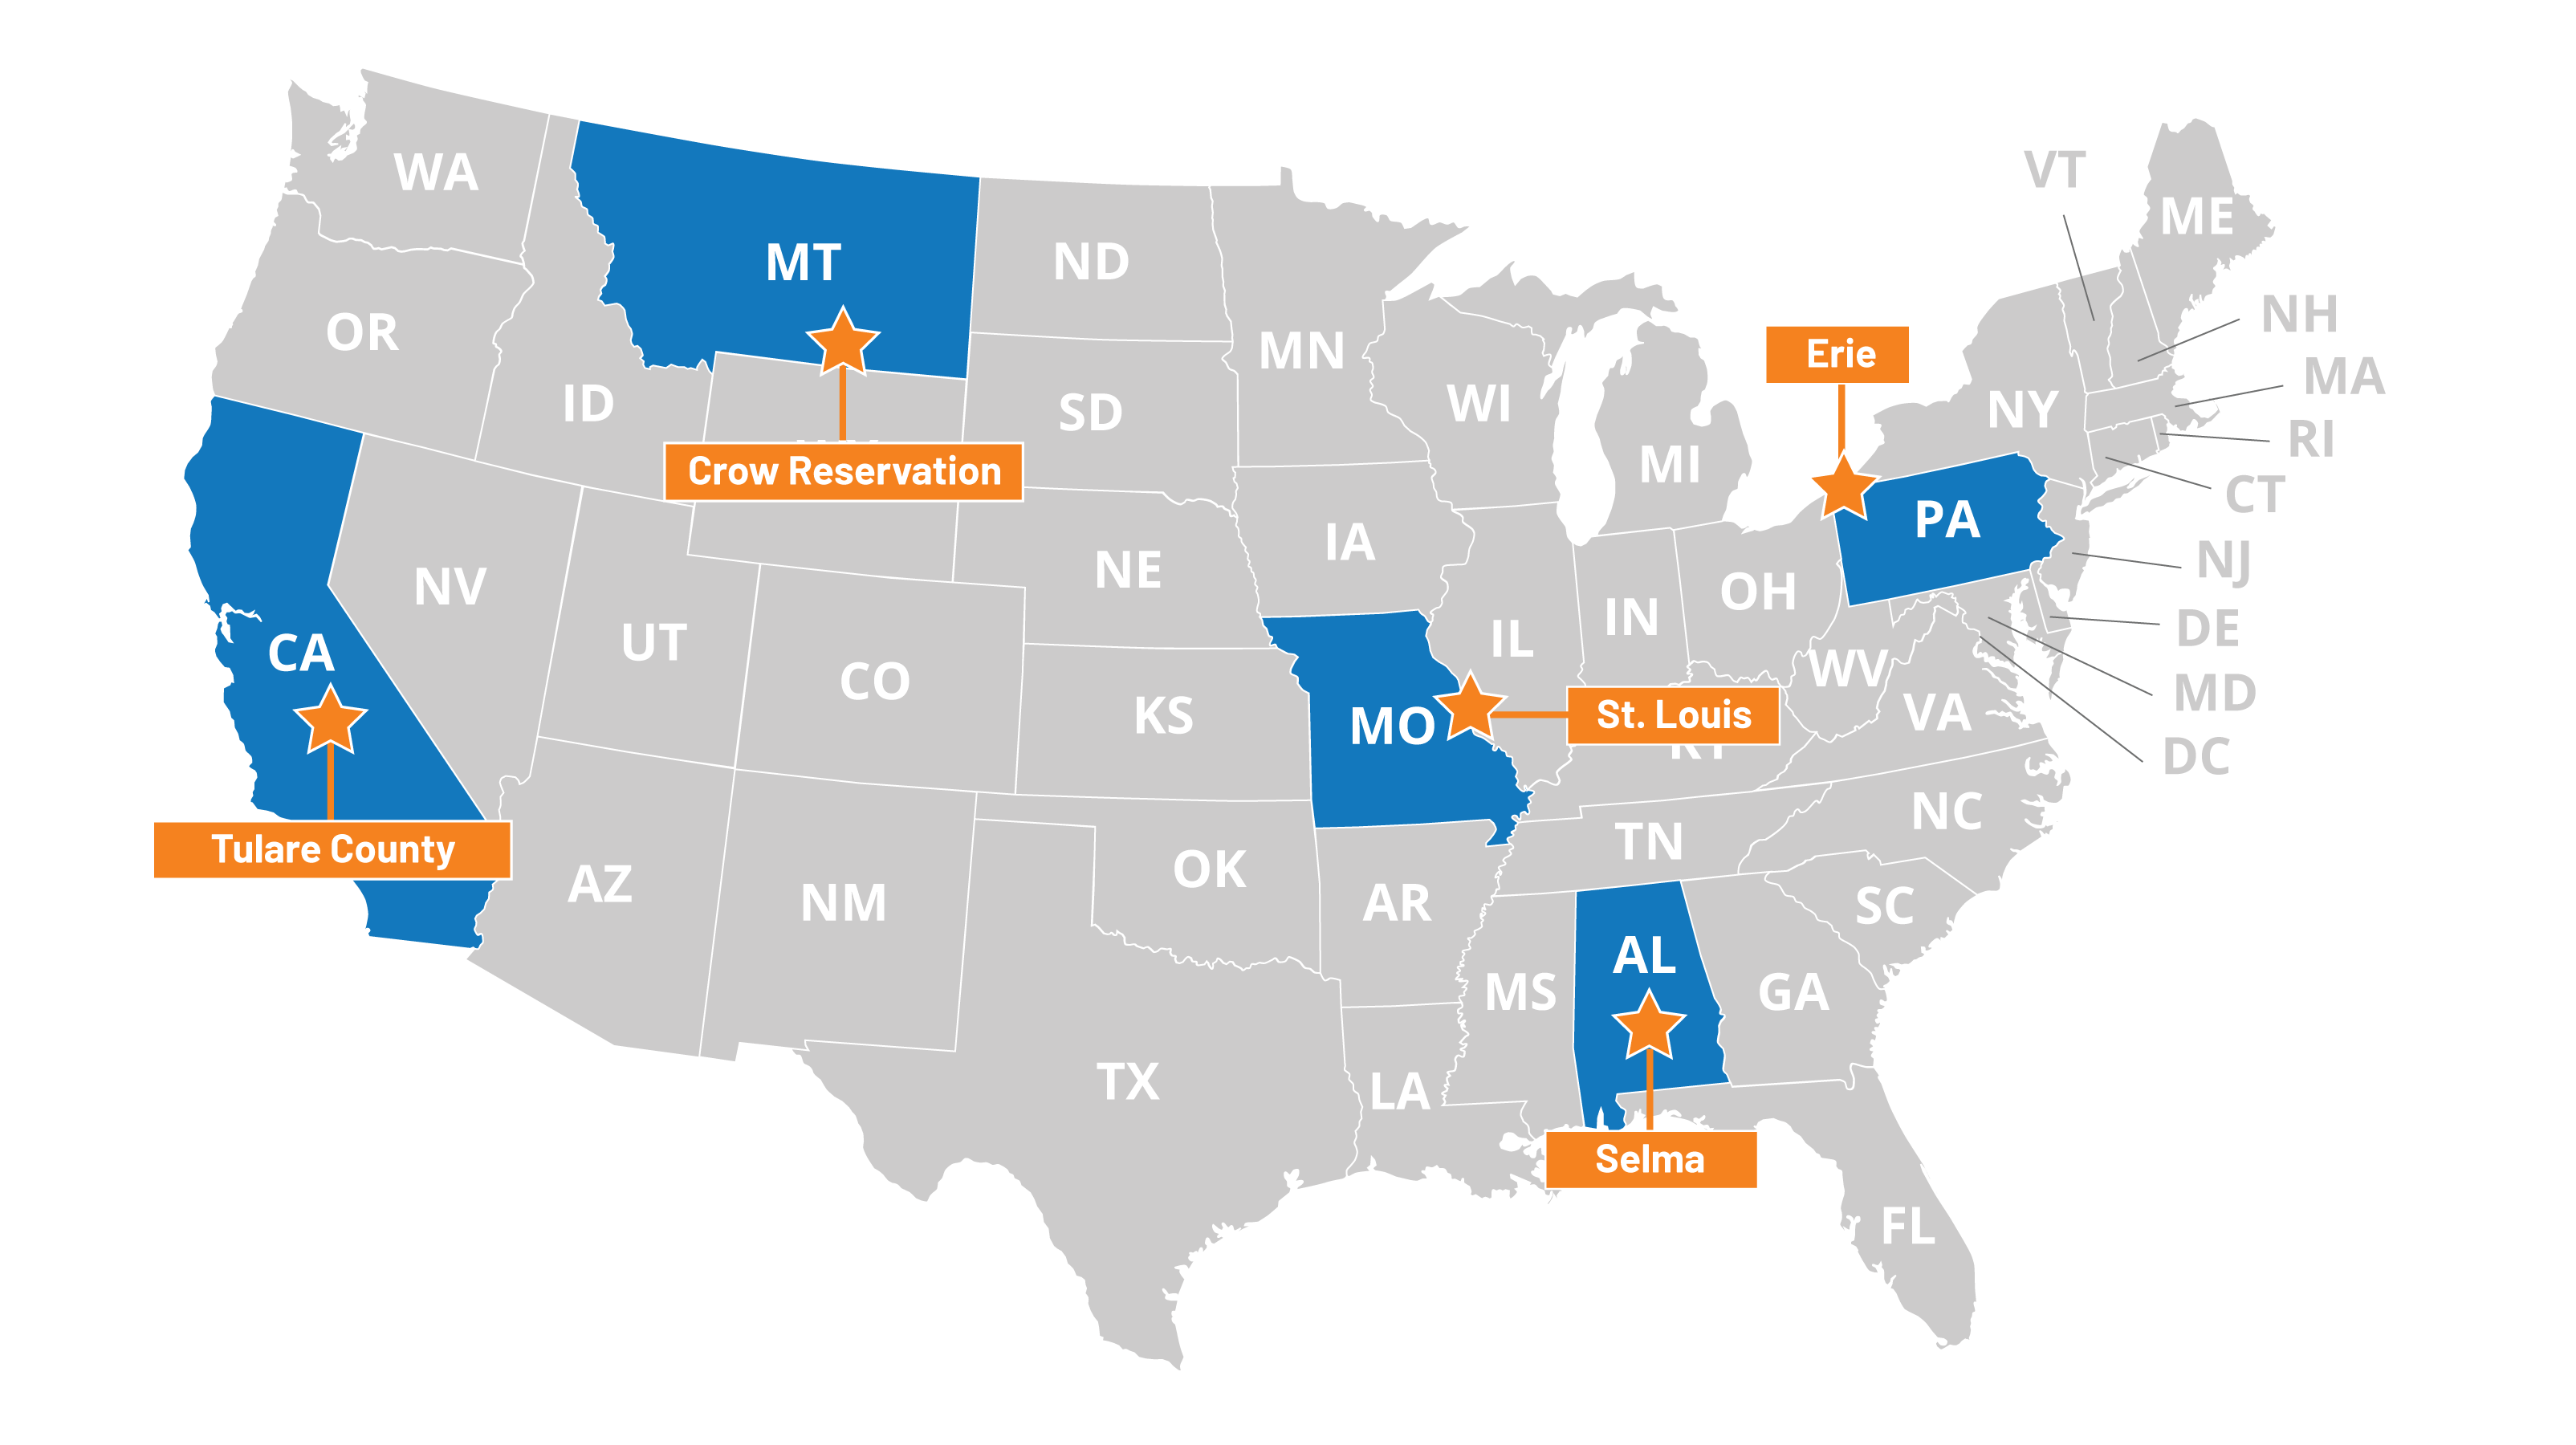
Recognizing the large disparities in access to health care across the country and the importance of the local safety net for low-income populations, KFF, working with Health Management Associates (HMA), undertook a study to identify distinct challenges that low-income women face in obtaining reproductive health care in diverse communities. The research team examined access in five communities across the United States that represent urban and rural areas, regions that are federally designated as medically underserved and health professional shortage areas, and areas that have faced closure and consolidation of family planning providers and hospitals. These communities also vary in demographic characteristics, and have populations that face health inequities such as low-income women, African Americans, Native Americans, immigrants, and refugees. The study team went to: Dallas County (Selma), Alabama; Tulare County, California; St. Louis, Missouri; Crow Tribal Reservation, Montana; and Erie County, Pennsylvania. Between February and September 2019, staff from KFF and HMA conducted structured interviews with local safety net clinicians and clinic directors, social service and community-based organizations, researchers, and health care advocates (“interviewees”) that work on a range of reproductive and sexual health issues in each of the communities. Additionally, at each site we convened a focus group with low-income, reproductive age women to understand their perspectives on the care they receive and the challenges they face. Through this combination of interviews and focus groups, we learned about the experiences of women living in these communities and the reproductive health professionals caring for them.
This report summarizes the major findings, highlighting cross-cutting themes and the degree to which low-income women in diverse communities face challenges in accessing reproductive and sexual health care. We also report on promising initiatives established by community providers to address barriers and improve access to these basic services. In-depth case studies of each community are available at https://www.kff.org/womens-health-policy/report/beyond-the-numbers-access-to-reproductive-health-care-for-low-income-women-in-five-communities.
Key Findings
Despite their differences, low-income women in these communities faced many similar challenges in accessing health care. While each community had distinct environments and features, the barriers to reproductive health services and factors contributing to those barriers were largely consistent, suggesting that these challenges and themes are prevalent well beyond the five communities studied. The key findings are categorized into five areas:
- Cultural and Social Determinants of Health: In each of the communities, poverty, cultural factors, and social determinants were identified as having a considerable impact on women’s ability to prioritize, afford, and get to family planning or abortion services. In addition, the residual effects of historical abuses by the medical establishment result in persistent mistrust of providers in some communities. This was most prominent among the Crow tribe and residents of Dallas County, AL; both communities still feel the legacy of a history of injustices such as forced sterilization upon many Native American women and the Tuskegee syphilis study in a neighboring community in Alabama.
- Coverage: Interviewees identified lack of coverage options for basic health care services for low-income women as a prominent challenge in states that did not adopt the ACA’s Medicaid expansion. Interviewees also identified ways to strengthen Medicaid to improve services available to enrollees, such as eliminating pre-authorization for certain contraceptive methods, increasing provider participation in the program, and improving systems to connect uninsured women to Medicaid-funded family planning programs.
- Provider Supply and Distribution: There are provider shortages in many communities, especially in expansive, rural areas. Interviewees said that challenges with recruitment and retention of clinical staff create access barriers for women. Many interviewees identified gaps in the availability of female clinicians, language translation services, and the need for culturally-congruent care.
- Sex Education: All five communities emphasized the need for comprehensive sex and STI education. A lack of information was said to leave many girls and women uninformed or misinformed about their reproductive health care, contraceptive options, and how to access services.
- Abortion Environment: Abortion was difficult to access in all of the communities. Stigma, anti-abortion beliefs, and policy restrictions at the state and/or community level shape the accessibility of abortion services. Policy restrictions, such as those in Missouri, Alabama, and Pennsylvania, that mandate counseling and waiting periods and bar insurance coverage for abortions dissuade providers from offering services and raise costs for women. Anti-abortion beliefs and stigma were also raised as barriers in Montana and California, states that don’t impose these types of abortion restrictions.
The discussion below highlights perspectives and lessons learned from health care providers, leaders of local support agencies, and low-income women about key barriers as well as how to improve access to reproductive health services.
Cultural and Social Determinants of Health
Despite the differences in the racial and ethnic composition of the populations, local histories, and state-level policies, this theme was prominent and overarching in all five communities. Increasingly, policymakers, advocates, payors, and providers are acknowledging the impact of social determinants such as housing instability, food insecurity, limited education and job training, crime and violence, and unmet transportation needs on health care access and outcomes. For example, a growing number of states are requiring Medicaid health plans to address social determinants of health as part of contractual agreements. Still, unmet needs related to poverty continue to create significant barriers to reproductive care. The increase in anti-immigrant sentiment and ICE raids, as well as long-standing discriminatory practices and negative historical experiences with the health care system, not only affect access to reproductive health services but also utilization and quality of health and social services.
Erie County, Pennsylvania
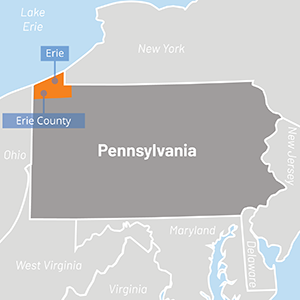
Located in northwestern Pennsylvania on the shore of Lake Erie, Erie County has one large city (Erie), several smaller communities, and a significant rural population. It has a relatively large population of refugees and immigrants. The Roman Catholic Diocese of Erie and the large Catholic population in the region influence both the health care and educational systems.
Poverty, a shortage of affordable housing, and lack of education and employment opportunities leave many women struggling to meet basic needs and with few resources to seek reproductive health services. Interviewees in all regions reported that socioeconomic stresses often result in women prioritizing food and shelter above preventive health care and family planning. One interviewee noted that multi-generational poverty locks women in situations that prevent them from making their own choices. Anxiety and depression are common among low-income women, yet all five communities faced gaps in behavioral health care and related support services.
Immigration status affects women’s willingness and ability to seek family planning, health, and social services. Immigrants who are undocumented or who are not proficient in English face heightened challenges in seeking services due to language barriers, fear of deportation, or concerns about jeopardizing their immigration proceedings due to changes in the public charge rule. Interviewees in Tulare and Erie Counties, both communities with sizable immigrant populations, reported that racism and fear of ICE have increased in recent years. In Tulare County, interviewees noted there have been ICE raids on domestic violence shelters across California and said that women who call to report abuse may not seek services for fear of deportation. Several focus group participants recounted experiences delaying or going without health or pregnancy-related care when they were undocumented.
“If you ask for public assistance while your documents are being processed, they are not going to give you your legal status. That’s why many people don’t want to get [assistance]. Because you are in the process, and they are going to see and think ‘these people are going to be a public burden.”
–Focus group participant, Tulare County, CA
Trauma, prior negative experiences with the health care system, and lack of cultural competency among providers discourage women from accessing reproductive care. Some focus group participants reported that health care providers pressured them to use contraception or to choose certain methods. Others reported providers dissuading them from using particular types of contraception – sometimes based on outdated research and practices or personal attitudes about ideal family size or the age of the patient. In each community, different cultural and historical factors interacted with access to reproductive health care:
Crow Tribal Reservation, Montana
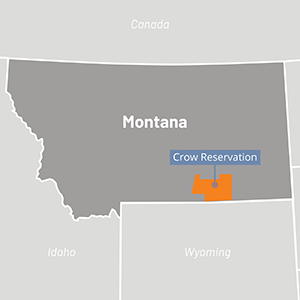
The Crow reservation, located about 60 miles southeast of Billings, is the geographically largest American Indian reservation in Montana and home to about 8,000 members of Crow Nation. The Crow Tribal Council governs the Nation and Indian Health Services (IHS) is responsible for providing health services, although other coverage options and providers are also utilized. The reservation has high unemployment and poverty rates.
- Refugee communities – In Erie, Pennsylvania, interviewees explained that reproductive health and family planning preferences vary widely among the large refugee community, reflecting diverse religious and cultural beliefs. While many refugees face language barriers when seeking care, case managers, dedicated service agencies, and a Federally Qualified Health Center (FQHC) focus on providing culturally appropriate care to support women’s access to their preferred methods of family planning.
- African Americans in the rural south – In Selma, Alabama, some interviewees reported that the legacy of slavery and the Jim Crow era, historical mistrust of the medical establishment (exacerbated by the Tuskegee syphilis study in nearby Macon county), and an insufficient number of female clinicians of color contribute to lack of engagement in early and preventive care. Focus group participants and interviewees also noted the influence of conservative religious beliefs among many in the community, particularly with regard to sex outside of marriage and abortion.
- Crow tribe – Crow interviewees in Montana described traditional beliefs that emphasize modesty, discourage the discussion of sexuality-related topics, and hold that babies are always a blessing. These beliefs, along with historical negative experiences with the federal and state health care systems, such as the coerced sterilization of indigenous women in the 1960s and 1970s, affect utilization of family planning services among Crow women and teens.
“Let’s put [family planning services] in places where we know the people who need access to it are, instead of making them come to us.”
–Katie Plax, Medical Director, the SPOT, St. Louis, MO
Domestic violence interacts with sexual health. Several interviewees reported that women in abusive relationships often experience reproductive coercion in which their partners prevent them from using contraception or sabotage their chosen method. As a result, women are not able to make their own reproductive decisions, and some have had multiple children they did not intend to have.
Community Perspectives on Addressing Barriers Arising from Social Determinants of Health
Interviewees and focus group participants described goals for the health care system, strategies they were implementing, and lessons they have learned to address some of the barriers to sexual and reproductive health service in their communities. These include:
- Case management to help address social and economic needs
- Co-location of clinics in workforce training sites or affordable housing
- Developing and training a more diverse, representative cadre of providers
Availability of Coverage
Thirty-six states plus DC have expanded Medicaid coverage to low-income adults without dependent children under the Affordable Care Act. In states that have not expanded their Medicaid programs, these adults generally do not qualify for full-scope Medicaid coverage.1 While Medicaid income eligibility levels for pregnant women in all states are higher than for people who are not pregnant, pregnancy-related coverage typically ends at 60 days postpartum. Two of the five communities in this study, St. Louis, Missouri, and Dallas County, Alabama, are in states that have not expanded Medicaid. As a result, they have lower rates of Medicaid coverage than the other three communities, which are located in expansion states.
Figure 1 shows the insurance coverage profile of reproductive age women in Tulare County, the St. Louis region, and Erie County. Comparable estimates were not available for Dallas County and the Crow tribal reservation. All of the communities that were studied are in states with a Medicaid-funded family planning program that provides contraception to uninsured, low-income women, except Missouri, which offers an entirely state-funded program.2

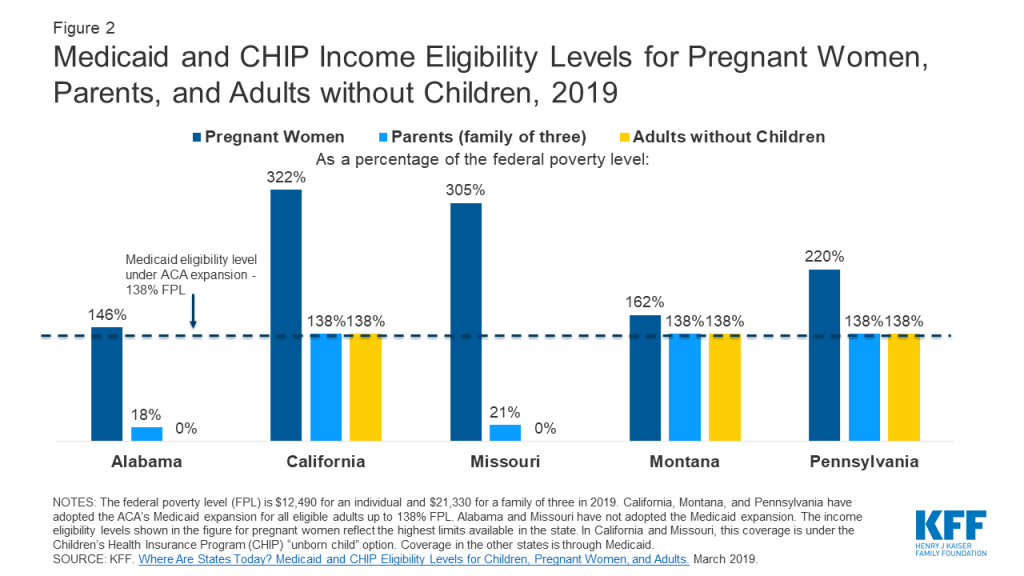
Women in states that did not expand Medicaid have limited options for obtaining coverage for basic health care services. Interviewees in St. Louis, Missouri, and Dallas County, Alabama, both in non-expansion states, reported that most low-income women have no coverage for preventive, acute, or chronic care outside of pregnancy (Figure 2). Annual income eligibility for parents in a family of three is capped at $3,839 (18% FPL) in Alabama and $4,479 (21% FPL) in Missouri. Parents with incomes above these limits do not qualify for coverage. Adults without children in these states do not qualify for Medicaid regardless of income, unless they have a disability or are over age 65. Additionally, federally subsidized coverage through the ACA’s Health Insurance Marketplace is only available to those with incomes above the federal poverty level. This means many of these individuals are not eligible for financial assistance to purchase coverage on their own, creating a coverage gap. Many focus group participants in Dallas County reported that when they need health care, they go to the emergency room, where they are not required to pay fees upfront and would not be turned away. While many knew about the FQHC in their community, they noted that even a sliding fee schedule was too costly for them.
“The lack of expansion of Medicaid is the single greatest factor [affecting access to family planning services] beyond a shadow of a doubt.”
–Felecia Lucky, President, Black Belt Community Foundation, Selma, AL
Loss of Medicaid eligibility after childbirth for women who live in non-expansion states and the lack of automatic transitions to state family planning programs result in gaps in reproductive health care for low-income women with infants. Both interviewees and focus group participants reported that losing full Medicaid coverage at 60 days postpartum, or due to small changes in income, disrupts continuity of care and creates barriers to family planning and other health care services. Also, providers in Missouri said that the state’s policy that disqualifies clinics that provide or are affiliated with abortion providers from participating in Medicaid has reduced women’s access to family planning, as well as to abortion services.
Focus group participants and providers reported experiencing challenges with certain Medicaid rules and low reimbursement rates. There was clear consensus that Medicaid coverage is important for facilitating access to family planning services; yet some clinicians and focus group participants raised concerns with various Medicaid policies. For example, in St. Louis, providers said that state Medicaid rules tie coverage for long-acting revisable contraceptive (LARC) devices (IUDs and contraceptive implants) to specific patients; if a patient does not show for her appointment, the device cannot be used for another woman and may go unused, thus discouraging providers from stocking supplies and providing same-day access. The state has reportedly eliminated this requirement, but one provider noted that there were not yet any guidelines from the state to define or help facilitate the process. Across study states, providers also discussed low reimbursement rates as problematic, and women discussed their frustrations with having a limited range of providers who participate in the program.
Community Perspectives on Addressing Coverage Barriers
- In states that have not adopted Medicaid expansion under the ACA, interviewees often noted that expansion would broaden access to coverage for more low-income women and allow them to maintain coverage continuity after pregnancies. It would also enable men to get appropriate STI prevention and treatment, and provide revenue to support safety net and rural hospitals that serve low-income populations.
- Providers discussed Medicaid policies that limit their ability to provide LARCs to their patients when they want them. These include policies that preclude same-day LARC insertions, tie LARC devices to specific patients, or that do not reimburse providers for LARC immediately after delivery.
- Interviewees noted that low Medicaid reimbursement rates result in limited provider participation, restricting both the number and type of providers that are willing to serve women with Medicaid coverage.
Provider Supply and Distribution
All five communities studied are “medically underserved,” and are health professional shortage areas, designated by HRSA as having too few primary care providers, high infant mortality, high poverty, or a large elderly population. In recent years, many rural areas have experienced a spike in hospital closures or a reduction in obstetrical services, particularly in states that have not expanded Medicaid. This has forced women to travel long distances to see medical providers, particularly for maternity care. In addition, the emergence of federal and state restrictions on funding for reproductive health services is starting to limit the supply of providers that receive funding to serve low-income and uninsured women. The Title X national grant program funds local clinics to provide free or low-cost family planning services to uninsured and low-income individuals. In 2019, the Trump administration finalized new regulations that prohibit any sites that receive Title X funding from providing abortion referrals. They also mandate referrals to prenatal services for all pregnant patients, and require complete financial and physical separation from sites that provide abortion services. These rules were not in effect at the time of the visits to these communities, but some family planning providers that were interviewed raised concerns that such policies would result in a considerable reduction in the share of providers participating in Title X and jeopardize their ability to continue providing family planning services to low-income and uninsured women.
While most focus group participants reported that they know where to go for family planning services, some faced obstacles to obtaining their preferred method in a timely fashion, and others were misinformed about their contraceptive options. In Missouri, pre-authorization and limitations on reimbursement for LARC preclude women from obtaining these methods on the day of their initial visit. This was raised as especially challenging for low-income women who have to take time off work, arrange for childcare, or travel long distances to a clinic. Some focus group participants shared misgivings and concerns about the side effects and safety of LARC methods based on prior personal or friends’ experiences. Interviewees in multiple regions noted a lack of training in LARC insertions and removals among community providers. In Selma, the county health department was in the process of training a clinician to insert IUDs, but at the time of the site visit, women had to go to another county health department or private provider participating in the state’s family planning program if they wanted to get an IUD inserted. Plan B, emergency contraception that helps prevent pregnancy when taken within 72 hours of unprotected sex, was generally available in most communities. However, interviewees and focus group participants cited cost as a barrier to obtaining it over the counter, and some women confused it with medication abortion. Costs associated with family planning in general were often a barrier for women who are uninsured, undocumented, and recent immigrants. In Dallas County, Alabama, fragmentation of the health care system meant that low-income women must go to different clinics for contraception, primary care, and obstetrical care, though a rural health center is in the process of implementing a more integrated approach to serve women in the community.
Tulare County, California
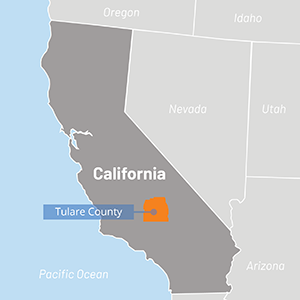
Tulare County sits in the Central Valley, a partially rural and conservative area located in the heart of the agricultural region of California. One of the poorest counties in the state, Tulare County has large migrant worker, immigrant, and Latinx populations. Rates of sexually transmitted infections (STIs) and teen pregnancy are much higher than the state average.
Rural areas, in particular, face severe provider shortages and persistent challenges in recruiting and retaining clinicians trained to offer reproductive and sexual health services. Focus group participants and interviewees described shortages of family planning providers in the rural and low-income areas. They also reported insufficient numbers of providers offering STI testing and treatment, HIV care, obstetrical care, trans-competent and LGBTQ-friendly services, and a scarcity of abortion providers. Practice consolidation in Erie County has resulted in limited choices of obstetricians for those enrolled in Medicaid. At the time of the site visit, the IHS facility on the Crow reservation did not have an ultrasound technician, but they have since hired someone for this position. Interviewees in Alabama reported that the state’s restrictive Medicaid eligibility limit and low reimbursement rates have contributed to a series of hospital closures in the region. This has left the Selma-based hospital with the only maternity ward and obstetrics clinic in the seven-county region. Interviewees in Selma, Tulare County, and the Crow reservation cited challenges attracting physicians to rural, low-income regions, and retaining them after they complete medical school loan forgiveness programs. Telemedicine was identified by many interviewees as an emerging solution to address barriers in these areas, but upfront costs can hinder these efforts, and not all communities have access to broadband. At the time of this study, none of the communities offered reproductive health services using telemedicine beyond e-prescriptions.
“If they have a bad experience with one doctor, they don’t want to go to that practice again, even to another doctor. And there is nowhere else close by, or they don’t accept Medicaid.”
–Provider, Erie, PA
Long travel distances and lack of public transportation in rural regions are major barriers to reproductive services, but transportation issues arose in urban communities as well. Women in some communities face logistical obstacles to obtaining services in a timely manner. This is particularly apparent in an area like Dallas County, Alabama, where many obstetrical care providers have closed, and there is no meaningful public transit infrastructure. Some focus group participants in Selma described having to pay friends or family to drive them to a clinic. Transportation was also problematic for women in the Crow tribe who must travel off the reservation to Billings, Montana, for prenatal services after 30 weeks of pregnancy. The sheer size of Tulare County also makes transportation difficult for low-income farmworkers who often do not have a car and must travel long distances for their care. Even in St. Louis, an urban community, women who lived in the county reported difficulty getting to care as public transit options fell short for them.
Community Perspectives on Addressing Provider Supply
- More provider training is needed for IUD insertion and removal.
- Collaboration with medical residency programs would help identify and nurture providers who are interested in women’s health and obstetrics fellowships, and establish a rural clinical rotation.
- Training of nurse practitioners to initiate conversations about family planning could help broaden access to patient education and the provision of services.
- A summit or other venue for community providers to share “best practices” about what works in promoting family planning would help educate providers and administrators about new models of care.
- More female providers in certain areas and providers whose demographics reflect those of the community would help overcome historical discrimination and facilitate patient-provider trust.
Sex Education
In all of the communities, insufficient sex education for youth emerged as a key issue. Today, about half of states (24 plus DC) require schools to provide sex education, and 34 plus DC require HIV education. A minority of states (18 plus DC), however, require sex education to include information on contraception, while 26 states require that programs stress abstinence. The Trump administration has increased investment in abstinence curricula, and state governments have awarded grants to crisis pregnancy centers (CPCs), faith-based organizations that counsel women against abortion, to teach abstinence. Furthermore, the Centers for Disease Control and Prevention (CDC) recently reported a rise in rates of many STIs, particularly among teens and young adults. In the case study interviews and focus groups, many individuals raised concerns about limited sex education and its contribution to poor health literacy about sexual and reproductive health.
Interviewees described variation in sex education across schools and felt that the content did not cover much of the information young people need; most areas stressed abstinence or “abstinence plus”3 curricula. Sex education curricula are typically selected at the local school district, school, or classroom level, which can cause wide variation in content even within the same community. Focus group participants perceived the availability and curricula of sex education as inconsistent among schools and often inadequate for high school-aged students. The Erie City School District adopted the evidence-based, comprehensive FLASH curriculum,4 while CPCs teach “character education” promoting abstinence in many Erie County schools. An interviewee reported that the CPCs receive state, federal, and private funding, enabling them to conduct more outreach and programs than the more comprehensive reproductive health care providers. An interviewee in St. Louis County recounted recent parent and teacher pushback to the limited sex education from faith-based groups, resulting in the adoption of comprehensive sex education curricula in several school districts. Interviewees in all of the communities concluded that lack of comprehensive sex education in schools contributes to high rates of STIs, HIV, and teen pregnancy. This sentiment was also expressed by many focus group participants who felt that young people were not getting the information they needed to avoid unintended pregnancy and prevent the transmission of STIs.
“Most sex education is informal and focused more on girls than boys. They’re taught to behave with modesty and ‘keep themselves out of trouble’.”
–Lucille Other Medicine, Program Assist., Messengers for Health, Crow reservation, MT
St. Louis, Missouri
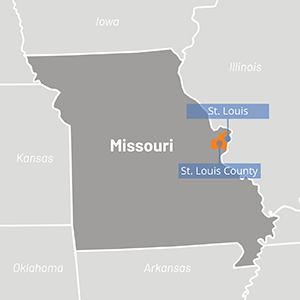
On the eastern edge of Missouri, St. Louis stands out as a liberal region in an increasingly conservative state. The St. Louis metropolitan area is highly segregated, and deep health disparities exist between Black and White residents. St. Louis has a large Catholic population and concentration of Catholic-affiliated hospitals and schools.
Focus group participants and interviewees indicated that cultural influences and norms limit knowledge about contraception and STIs. In Dallas County, interviewees and focus group participants noted that most churches discourage discussion of sexual health, though a few have hosted events to promote HIV prevention and family planning. Some interviewees felt that formalized, comprehensive sex education in schools could be particularly important in more conservative communities, such as Tulare County, where discussions about sexual and reproductive health may not be commonplace at home. Providers on the Crow reservation also pointed out that discussions in the family about sexuality and reproductive health are not part of the cultural norm, and many young people lack access to basic health information.
Abortion Restrictions
Federal and state regulations shape access to abortion, and this was evident in all of the communities included in this study (Table 1). The federal Hyde Amendment restricts state Medicaid programs from using federal funds to cover abortions beyond the cases of life endangerment, rape, or incest. However, 16 states use their own state funds to cover abortions in other circumstances. Many other states have imposed restrictions on abortions including waiting periods, abortion facility requirements, and gestational age limits, some with the intent to overturn Roe v. Wade. These restrictions have translated to clinic closures in several states and the total absence of abortion clinics in many communities. This makes abortion effectively inaccessible for some women, particularly those who are poor or who live long distances from the nearest abortion provider.
Access to abortion in the five communities is severely limited, due to restrictive state policies resulting in a shortage of abortion providers and/or long travel times, plus a lack of transportation options. Alabama and Missouri have enacted some of the strictest abortion regulations in the nation, contributing to closures that leave just one abortion provider in Missouri (located in St. Louis), and one abortion provider in Montgomery, Alabama, that serves all of southern Alabama, parts of Mississippi and the Florida panhandle. Recent laws passed in these states would have essentially outlawed abortions if they had not been (temporarily) blocked by the courts.5 Yet, outside of Missouri’s attempt to ban abortion legislatively, the clinic in St. Louis remains vulnerable to closure. It is at the center of a state-level investigation about facility licensing that has generated national attention. A decision is expected in early 2020 as to whether the clinic can remain open.
| Table 1: Policies Limiting Abortion Access in Alabama, California, Missouri, Montana, and Pennsylvania | |||||
| Alabama | California | Missouri | Montana | Pennsylvania | |
| Waiting period required after mandated counseling | 48 hours | 72 hours | 24 hours | ||
| Gestational age limit | 20 weeks | Viability | Viability | Viability | 24 weeks |
| Abortion can only be performed by licensed physician | √ | √ | √ | ||
| Parental consent required for minor to obtain abortion | √ | √ | √ | ||
| Abortion coverage prohibited in ACA Marketplace plans | √ | √ | √ | ||
| State payments for abortion prohibited* | √ | √ | √ | ||
| NOTES: *Coverage limited to cases of rape, incest, life endangerment of woman.SOURCES: Guttmacher Institute. State Laws and Policies, An Overview of Abortion Laws. As of October 1, 2019.KFF, Intersection of State Abortion Policy and Clinical Practice, June 2019. | |||||
Three of the counties studied (Erie, Tulare, and Dallas) have no abortion providers. Even in Tulare County and the Crow reservation, which are in states that cover abortion services under their Medicaid program and have very few restrictions on the provision of abortion, women must travel at least an hour to reach the nearest provider. Crow women must travel to Billings because the Indian Health Service, as a federal agency, is prohibited from providing abortion.
In each of the communities studied, anti-abortion sentiment played a significant role in limiting access to abortion services. Interviewees reported intense protesting outside abortion clinics in Montgomery and St. Louis and noted that protestors contributed to the closing of clinics in Erie and Selma. In Tulare County, California, anti-abortion billboards lined the highway and the Planned Parenthood of Visalia in Tulare County had been vandalized numerous times despite not providing any abortion services onsite. Focus group participants shared that protestors and cultural stigma surrounding the procedure made them feel ashamed or afraid, or deterred them from discussing or seeking an abortion. Interviewees in Dallas County and St. Louis reported that some providers and health center staff discourage abortions. Some focus group participants in St. Louis felt the state-mandated counseling was intended to make them second guess their own decisions. In many of these communities, churches play a prominent role in daily life, and religious influences discourage women from seeking abortions. In Selma, Tulare, and the Crow reservation, many focus group participants expressed opposition to abortion and said they would not consider it an option for themselves. In every focus group, however, there were a few women who said they had had an abortion or knew of someone who had one.
Dallas County (Selma), Alabama
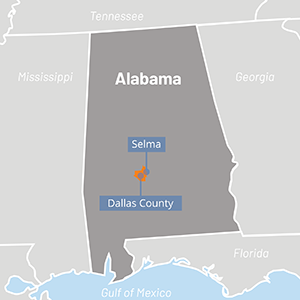
Dallas County is one of 18 counties comprising the largely rural, agricultural Black Belt region of Alabama, with a majority African American population. Selma, the largest town in Dallas County, played a pivotal role in the Civil Rights Movement. Selma faces high poverty and unemployment rates and poor health outcomes. Churches are central pillars of community life.
There was misinformation or lack of information about where women could obtain an abortion, and in some communities, focus group participants believed abortion was illegal in their state. In the communities with strict anti-abortion laws and strong anti-abortion environments, some interviewees and focus group participants incorrectly believed that abortion is illegal in their states. One crisis pregnancy center (CPC) in Erie had a large presence and offered a range of services such as pregnancy tests, STI screening, ultrasounds, and referrals to prenatal care, all at no cost to clients. Many interviewees referred women to the site because they mistakenly thought the CPC offered contraception and abortion referrals. More than one interviewee in Selma mistakenly thought that a local CPC offered abortions, and one listed them on their patient referral sheet for “abortion services,” just above the abortion providers in Montgomery and Tuscaloosa.
Limitations on Medicaid coverage for abortion services in some states, as well as procedure costs, make abortion unaffordable for many low-income women. The California and Montana Medicaid programs cover abortion services beyond the Hyde Amendment exclusions for life endangerment of the woman, rape, and incest. Alabama, Pennsylvania, and Missouri limit Medicaid coverage to the Hyde provisions, but an abortion provider in Alabama noted that she has never been able to obtain reimbursement even under the permitted circumstances. Focus group participants cited cost as a major barrier to accessing abortion care, with procedure costs reportedly ranging anywhere from $400 to $1,500. Many women face additional costs associated with transportation, childcare, and overnight lodging when state laws require women to wait 24-72 hours between state-mandated counseling and obtaining the abortion, as is the case in Missouri, Alabama, and Pennsylvania. There are local and national organizations that provide financial and practical assistance to some women seeking abortion; however, they do not have the resources to assist all the women who seek abortion and who cannot afford the services and the associated travel and lodging costs. Even when funds are available, logistical challenges may remain. For example, an Alabama-based organization provides financial assistance for transportation to women traveling long distances for abortions, but described barriers transferring funds to low-income women who do not have bank accounts.
Community Perspectives on Addressing Barriers to Abortion Services
- Share women’s stories accessing abortion, to dispel myths with reality.
- Ensure providers are informed and offer accurate information to patients about their options and referrals without judgment.
- Do not take away access and funding to the non-abortion services that Planned Parenthood and other abortion clinics offer.
- Reduce regulations that dissuade providers from offering or referring for abortion services.
- Engage in long term strategies to bring more women’s voices into state policymaking.
Community Strengths and Initiatives
Across the communities, providers and community organizations were engaged in initiatives intended to address barriers to reproductive health care. Although interviewees emphasized that much more needs to be done to eliminate the structural, cultural, political, and economic barriers to reproductive health services for low-income women, there were multiple organizations and individuals in each community leading various efforts to fill gaps and meet community needs. In many cases, community-based organizations took active roles in family planning, STI, or HIV education and advocacy, while others provided direct, practical assistance. Some of these strategies include:
- Supporting Positive Opportunities with Teens (SPOT) is a freestanding clinic in St Louis, Missouri, that provides teen-friendly primary care, mental health care, and express STI testing at no cost. They also offer case management to address social determinants of health. The clinic has a school-based health center (SBHC) in an area public high school, which is one of the first comprehensive SBHC programs in the area. SPOT served 3,253 St. Louis teens in 2018 (80% African American, 15% LGBT and unstably housed, and 2-3% gender nonconforming youth).
- ACT for Women and Girls (ACT), a reproductive justice grassroots organization in Tulare County, California, offers youth-led programming with a focus on reproductive health and provides comprehensive sex education in schools. The organization also has conducted a pharmacy access project since 2009 where youth secretly shop at 60-70 pharmacies each year in Tulare County to assess availability of over the counter emergency contraception (EC).
- Medical Advocacy and Outreach (MAO) is a non-profit health and wellness organization based in Montgomery, Alabama. Together with their regional partner, Selma AIDS Information and Referral (AIR), the two organizations make up a comprehensive network of full-service and Bluetooth-enabled telehealth satellite clinics providing health and social services to individuals diagnosed with HIV. This includes medical services such as primary care, gynecological and sexual health services, dental care, and mental health and substance use treatment. They also provide social services such as group and peer counseling, transportation to appointments, housing support, medication assistance, and a food bank. Special outreach and services are provided for pregnant women and formerly incarcerated individuals.
- Messengers for Health is a non-profit organization addressing health equity among the Crow tribe in Montana. They rely on “messengers” from the community to educate the Crow people about risk factors for cancer and assist them to seek out preventive screening. Their first program educated Crow women and girls about the prevention of cervical cancer and related sexual risk factors using a culturally competent curriculum. They also started the Crow Warriors for Health program to increase colorectal, prostate, and lung cancer knowledge among men in the community. In Crow culture, cancer reportedly used to be considered a taboo topic, but due to the work of Messengers for Health, women and men are now discussing it openly and regularly seeking preventive screenings such as pap tests, mammograms, and colorectal screenings.
- Multi-Cultural Health Evaluation Delivery System (MHEDS) in Erie, Pennsylvania, is an FQHC “look-alike” center that conducts health screenings for the area’s refugee population, which grew considerably in the early years of the decade. The health center has tailored its services and staffing to address the particular concerns of Erie’s refugee communities, who come from a wide array of countries, including Nepal, the Democratic Republic of Congo, Bhutan, and others. MHEDS offers interpreters to help bridge language and cultural barriers and is working to shore up provider capacity on specific topics that affect some communities, such as female genital mutilation and differing views on the provision of prenatal care.
Conclusion
A close examination of low-income women’s experiences with reproductive health care in five diverse communities reveals challenges and strengths that are not evident in statistics alone. In-person interviews, focus groups, and first-hand, on-the-ground experiences in each of the communities uncovered barriers to care common to all the communities, as well as obstacles unique to specific locales and populations. These case studies also revealed some surprises. For example, Missouri, which has not expanded Medicaid under the ACA, places significant limits on abortion and prohibits Medicaid payments to its sole abortion clinic for non-abortion services such as contraceptives; yet the St. Louis region is home to a wide variety of providers and community-based organizations that are working to improve access to the full range of family planning services. In contrast, California, expanded Medicaid eligibility under the ACA, imposes few state-level restrictions on abortion access, and operates the nation’s largest Medicaid-funded family planning program; nonetheless, access to abortion services for women in Tulare County is limited, as the nearest abortion provider is at least 50 miles away. These findings underscore that particularly for rural or underserved communities throughout the country, federal and state policies alone do not guarantee or determine access, but rather intersect with local influences.
The factors influencing reproductive health access are a complex web of social determinants of health; coverage policies; state and local investments and leadership; provider supply and distribution; sex education; the political, cultural, and religious environment; and the legacy of discrimination in many parts of the country. Across all of these communities, we met many leaders working in challenging environments to assure that reproductive care is high quality and equitable and that information is accessible to all members of their community. Importantly, talking to low-income women on the ground underscored what they expect of the health care system in providing access to reproductive health services, and the challenges in making affordable access a reality.
Dallas County (selma), Al
KFF: Usha Ranji, Michelle Long, and Alina SalganicoffHealth Management Associates: Carrie Rosenzweig and Sharon Silow-Carroll
This is the first of five case study briefs, beginning with Dallas County (Selma), Alabama. Subsequent case studies can be accessed by scrolling to the bottom of this page or in the ‘Sections’ box to the right.
Introduction
Dallas County is one of 18 counties comprising the largely rural, agricultural Black Belt region of Alabama. Originally a reference to the region’s dark, fertile soil, the term Black Belt later became associated with African American enslavement on plantations, and more recently with its majority African American population (Figure 1).
Selma, the largest town in Dallas County, played a pivotal role in the Civil Rights Movement. While considered the “Queen City of the Black Belt,” Selma faces high poverty and unemployment rates and poor health outcomes. Dallas County is federally designated as medically underserved and as a health professional shortage area. Alabama’s decision not to expand Medicaid, coupled with the state’s extremely low Medicaid income eligibility limits (18% of the federal poverty level for parents), leaves many low-income residents without access to coverage for basic health care services. Approximately 20% of Dallas County residents age 19-64 were uninsured in 2017.6 Several community hospitals have closed in recent years, leaving one hospital in Selma with the only obstetric delivery services in the seven-county region. Alabama has recently been thrust into the national spotlight with its passage of a near-total abortion ban, punishable by up to 99 years in prison for the provider. This law has been blocked by a federal court ruling, but it is expected that the state will continue to challenge it. Churches are central pillars of community life, and many have strict beliefs about sex and reproductive health and tend to oppose abortion.
This case study examines access to reproductive health services for low-income women in Selma and Dallas County, Alabama. It is based on semi-structured interviews conducted by staff of KFF and Health Management Associates (HMA) with safety net clinicians and clinic directors, social service and community-based organizations, researchers, and health care advocates (“interviewees”), as well as a focus group with low-income women in April 2019. Interviewees were asked about a wide range of topics that shape access to and use of reproductive health care services in their community, including availability of family planning and obstetrical services, provider supply and distribution, scope of sex education, abortion restrictions, and the impact of state and federal health financing and coverage policies locally. An Executive Summary and detailed project methodology are available at https://www.kff.org/womens-health-policy/report/beyond-the-numbers-access-to-reproductive-health-care-for-low-income-women-in-five-communities.
Key Findings from Case Study Interviews and Focus Group of Low-Income Women
- Medicaid coverage – The state’s decision not to expand Medicaid under the Affordable Care Act and its low income eligibility limits for full-benefit Medicaid leaves many low-income women with no coverage for preventive, acute, or chronic care outside of pregnancy. Alabama’s family planning program is an important source of coverage for low-income women, but it is limited to coverage of reproductive health services such as contraception and STI testing.
- Provider distribution – Severe provider shortages combined with a lack of public transportation and, for some, the need to travel long distances to see medical providers are major barriers to care. Telemedicine is emerging as a promising solution among some community providers. Alabama Medicaid’s restrictive eligibility standard and low reimbursement rates have contributed to a series of hospital closures in the region, leaving the Selma-based hospital with the only labor and delivery unit in the region. Interviewees spoke about a shortage of providers offering STI services.
- Social determinants of health – High poverty rates, limited affordable housing, a shortage of vocational training and employment opportunities, and other socio-economic stresses cause many women to prioritize health care and family planning behind other competing needs. Historical mistrust of the medical establishment among the African American community also contributes to gaps in early and preventive care.
- Contraceptive access and fragmentation of health care services – Contraceptive care for low-income women is almost exclusively provided by the health department at no cost, while primary care, prenatal care, HIV, and chronic care services are fragmented across a number of providers, with little coordination among them. There are some early efforts to integrate care for people with complex and multiple needs.
- Role of religion and sex education – Interviewees and focus group participants said that most churches, which have central roles in the communities, discourage discussion of sexual health and family planning. Sex education at the community level focuses largely on abstinence. The health department and regional HIV organizations conduct outreach and education, but a lack of comprehensive sex education in schools and the normalization of teen pregnancy is believed to contribute to high rates of STIs, HIV, and teen pregnancy.
- Abortion access – Abortion is highly restricted by the state, and there are no abortion providers in Dallas County. The closest abortion provider is located in Montgomery, which is approximately 50 miles from Selma. They serve many patients from the Selma area, though there is strong anti-abortion sentiment and stigma within the community. Some focus group participants incorrectly believe that abortion is already illegal in the state.
Medicaid Coverage and Continuity
Alabama’s decision not to expand Medicaid and its low Medicaid reimbursement rates and income eligibility limit leave many low-income residents without health care coverage for most basic health care services outside of pregnancy (Table 1). As a result, low-income women rely heavily on the state’s family planning waiver program (Plan First), the federal Title X family planning program, and some targeted, limited public programs.
| Table 1: Alabama Medicaid Eligibility Policies and Income Limits | |
| Medicaid Expansion | No |
| Medicaid Family Planning Program Eligibility | 146% FPL |
| Medicaid Income Eligibility for Adults, Without Children 2019 | 0% FPL |
| Medicaid Income Eligibility for Pregnant Women, 2019 | 146% FPL |
| Medicaid Income Eligibility for Parents, 2019 | 18% FPL |
| NOTE: The federal poverty level for a family of three in 2019 is $21,330.SOURCE: KFF State Health Facts, Medicaid and CHIP Indicators. | |
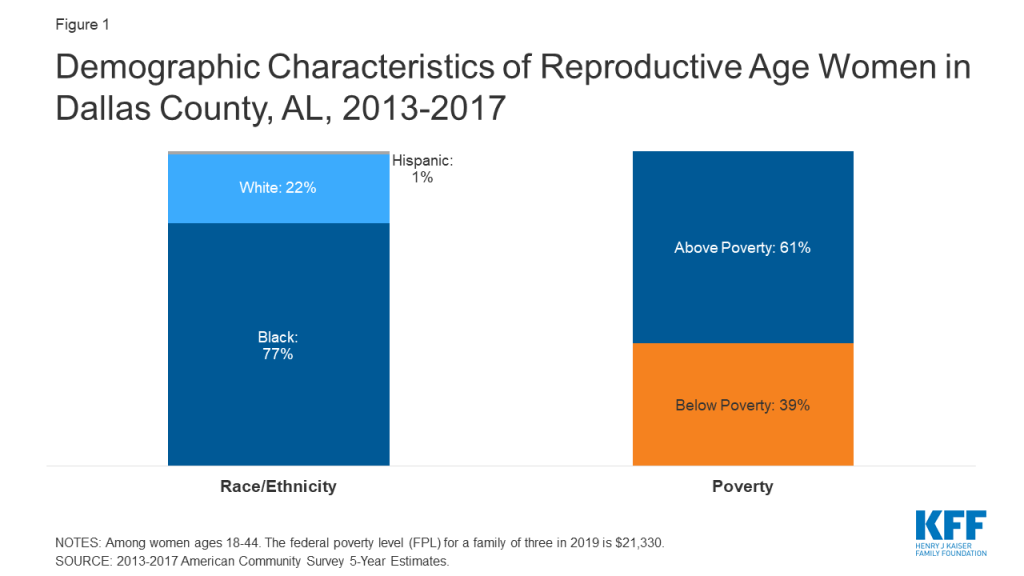
The vast majority of low-income women in Alabama do not have a pathway to basic health coverage outside of pregnancy-related coverage under Medicaid. Alabama has not expanded Medicaid under the Affordable Care Act, and women with dependent children who earn more than 18% of the federal poverty level (FPL), or roughly $3,800 a year for a family of three, exceed the state’s eligibility threshold, which is the second lowest in the United States. Adults without children at any income level who are not pregnant are not eligible. Pregnant woman are eligible for Medicaid up to 146% FPL, though that coverage ends 60 days after delivery. Several interviewees mentioned lack of Medicaid expansion as a significant barrier to accessing care. One focus group participant said that she lost her Medicaid coverage and became uninsured after her husband started collecting Social Security checks. Few low-income focus group participants had full-benefit Medicaid, while many more only had coverage for family planning (Figure 2).
The Dallas County Health Department participates in the Well Woman Alabama program, offering free health counseling, preventative services, screenings, and management of chronic diseases such as elevated cholesterol and hypertension for women ages 15-55. A Federally Qualified Health Center (FQHC) in Selma provides health services to uninsured women on a sliding fee scale; however, many focus group participants reported that when they need health care, they go to the emergency room where they do not need to pay anything upfront.
“The lack of expansion of Medicaid is the single greatest factor [affecting access to family planning services] beyond a shadow of a doubt.”
–Felecia Lucky, President, Black Belt Community Foundation (BBCF)“Pregnant women also need services for after their pregnancies. The women in the Black Belt need dental and vision services, education about what happens after pregnancy…education about lactation. The focus is all on pregnancy and not what the woman needs afterwards. If Medicaid could even cover 12 months after [delivery], she could focus on herself.”
–Keshee Dozier-Smith, CEO, Rural Health Medical Program (RHMP)
Alabama’s family planning program, Plan First, is often the only source of contraceptive coverage for low-income women. The Plan First7 program covers all FDA-approved contraceptive methods, STI and HIV testing, and an annual exam at no cost for women ages 19-55 with income up to 146% FPL. The program also covers tubal ligations and vasectomies for adults 21 and older. In Dallas County, the only providers participating in Plan First are located in Selma. This reportedly poses a barrier to women who live in the outlying areas of the county because there is no public transit infrastructure, and many low-income families do not own cars. Because women who have undergone sterilization are not eligible for the program, some focus group participants reported that they lost access to needed services after they had a tubal ligation or hysterectomy. Interviewees recognized the important role that the Plan First program plays to fill gaps in women’s health services, but felt that expanding full-benefit Medicaid would go much farther in meeting the health needs and providing continuity of care for Alabama’s low-income residents.
“There are women in my state who only have coverage when they are children, pregnant, or turn 65. If we’re serious about saving lives, we would not let so many women of childbearing age to fall into the Medicaid gap.”
–Terri Sewell, U.S. Rep. (AL-07)

Provider Distribution
Because there is only one remaining hospital offering Ob-Gyn and labor and delivery services across much of central and southern Alabama, many women must travel long distances for maternity care and have limited options. Some providers are developing innovative solutions to address transportation difficulties, provider shortages, and health care system fragmentation.
Dallas County has a shortage of obstetric providers, and both focus group participants and interviewees expressed concerns about the quality of care available due to challenges in recruiting and retaining physicians. Providers in Dallas County, one of the poorest counties in the state, reported that it is hard to recruit qualified employees — from front desk staff to physicians — because many people living in the area do not have the required education or work experience, and those who are qualified leave for better opportunities elsewhere. Interviewees reported that the number of Ob-Gyns providing the full range of obstetric and gynecological services in the region has declined to just two, both of whom are employed by the Selma hospital’s outpatient obstetric clinic. Focus group participants and interviewees expressed concerns about the limited choice of providers and quality of care as a result of these shortages. Individuals needing specialty care must travel to Birmingham (90 miles) or Montgomery (50 miles).
“After my third baby I wanted my tubes tied. But they wouldn’t tie them the day I delivered; they wanted me to come back in 30 days. I had already signed my papers…and I was like I’m not going to deliver this baby, get healed up and wait 30 days to go back through this pain. And so, I ended up pregnant again .”
-Focus group participant
Hospital closures throughout the state have left only one community hospital serving five counties, and the only hospital with inpatient labor and delivery services in a seven-county region. The lack of Medicaid expansion and low reimbursement rates were mentioned by providers and other interviewees as contributing factors to hospital closures in smaller towns across southern and central Alabama. As a result, Selma’s community hospital (Vaughan Regional Medical Center) has become the main place people go for health care, and the only site for inpatient labor and delivery services and outpatient obstetric care in the entire region. In addition, there is no Neonatal Intensive Care Unit (NICU) or pediatric surgery unit in Dallas County; newborn infants needing emergency care must be taken by helicopter to facilities in Birmingham. One interviewee commented on the high rates of infant and maternal mortality in the area and said that the lack of Medicaid expansion, education, and providers have all played a role.
“[The only two OB doctors in Dallas County are] doing deliveries all day, so they don’t [likely] have time to do…family planning…. Most of the doctors in our counties are internal medicine doctors. The local health departments currently have limited resources to offer family planning services, and their focus across the Black Belt is chronic care management. Heart, kidney, obesity, and diabetes are the primary diseases.”
–Keshee Dozier-Smith, CEO, RHMP
Telemedicine is emerging as a promising solution to address the transportation and distance barriers in Dallas County. There is no public transit infrastructure in Dallas County and women in outlying parts of the county must travel long distances to access health care, impeding access to all health care services. Although West Alabama Public Transportation, a Medicaid transportation program, is an option, individuals reported that they may have to wait all day to be picked up to return home. Many interviewees and focus group participants reported having to pay their family or friends as much as $20 for a ride to get health services.
Because of transportation barriers and difficulties recruiting clinical staff, several providers are implementing highly sophisticated and successful telemedicine networks. Medical Advocacy and Outreach (MAO) is a Montgomery-based health and wellness service provider serving nearly 2,000 people living with HIV/AIDS, Hepatitis C, and other life-threatening illnesses annually across 28 counties; they have established one of the only telemedicine networks that provides direct medical care in the region. As of April 2019, they had 10 units installed, with a goal to put a telemedicine unit in every county health department. Their local AIDS services partner in Selma, Selma AIDS Information and Referral (AIR), also offers videoconferencing for substance use and mental health counseling. Nonetheless, a lack of broadband throughout the most rural parts of the county limits the utilization of digital health solutions and emphasizes the importance of both transit and communications infrastructure development in rural communities. The Rural Health Medical Program (RHMP), the only FQHC in the county, offers medical consultations across sites between nurse practitioners and collaborating physicians and with partnering specialists. RMHP also has a telepsychiatry program, and they are renovating a mobile van they expect to be operational in fall 2019 that will offer medical care, optometry, as well as behavioral and mental health services in satellite towns, school-based programs, and community health fairs.
“In a lot of rural counties, they weren’t talking about HIV care. Now they are [with telemedicine]. They know that services are available and nearby.”
–Medical Advocacy and Outreach (MAO) staff
The health care delivery system in Selma and Dallas County is significantly fragmented, and providers face challenges with care coordination. Low-income women generally go to the health department for family planning needs and STI care, the hospital and outpatient clinic for obstetrical care, and the RHMP or the emergency room for all other services. One provider felt that although the system was fragmented, providers communicate with one another and patients know where they need to go for each service. The RHMP, however, is trying to integrate care with other providers and centralize services for their patients. They explained that the fragmentation of the health care system places pressure on social workers, who are scarce in Selma, to coordinate and direct patients to care.
Initiative: Integration of health care services
The Rural Health Medical Program (RHMP) is Dallas County’s only Federally Qualified Health Center (FQHC), with eight health centers across six counties. They are a key provider for low-income individuals in the area, serving roughly 7,800 patients annually, 40% of whom are covered by Medicaid, 35% by Medicare or private insurance, and 35% uninsured. They offer a wide range of health care services on a sliding fee scale, and recently received grant funding for behavioral, mental, and oral health expansion. They also recently became a Plan First provider and are working to build up their family planning service line, including a social worker for family planning. To reduce fragmentation within the local provider network, they have established a “memorandum of understanding” with Selma’s hospital (Vaughan Memorial Regional Hospital) and are working on establishing these partnerships with other providers in the area to support and enhance referral relationships.
There is a severe mental health provider shortage, and many focus group participants reported experiencing stress, anxiety, and depression. Focus group participants described significant stress related to finances, family, and health. A few had seen a doctor and were taking medication for their depression and anxiety, but they felt that the medications’ side effects often made them unable to take care of their children or perform daily activities. Some local providers have expanded their mental health programs, but an interviewee still noted a significant shortage in mental health providers.
STI and HIV Screening, Prevention, and Treatment
There are not enough providers distributed around the county to meet the need for STI testing and treatment. Alabama has some of the highest STI rates in the nation, and the Black Belt region is especially hard hit. The Dallas County Health Department offers free testing, treatment, and annual screening for all STIs, HPV vaccines, and discusses HIV and pre-exposure prophylaxis (PrEP) with their patients. They also employ an HIV coordinator, and their disease control staff does extensive education and outreach in colleges and churches. Still, people in the outskirts have difficulty getting to the health department.
Dallas County has a comprehensive, integrated provider network for individuals diagnosed with HIV, but there are not enough providers conducting routine HIV screening, testing, or prevention. In 2017, Dallas County had a new HIV diagnosis rate of 17.9 per 100,000 people (compared to 11.8 nationwide), one of the highest in the state (Figure 3). Interviewees reported that HIV disproportionately affects young African American men who have sex with men. MAO serves as a “one-stop shop” for individuals diagnosed with HIV, providing HIV treatment and comprehensive health care services. Selma AIR conducts HIV testing and refers patients who test positive to the MAO satellite clinic housed at UAB Selma Family Medicine for treatment.
However, updates in testing policies have not yet been fully adopted by many individual clinicians. For example, MAO has been educating hospital administrators about the removal of a requirement for a separate consent for HIV testing, but the change in practice has not yet been implemented at all levels of the system. The hospital’s outpatient obstetric clinic routinely tests for HIV, but interviewees suggested that other doctors are not discussing HIV risks with patients due, in part, to competing priorities like the high burden of chronic diseases, and the continued stigma around HIV.
Interviewees reported there is limited funding for HIV prevention efforts. Although PrEP is a highly effective preventive medication for HIV and is available free of cost for lower-income individuals through an assistance program from the manufacturer, that option does not appear to be fully leveraged. In fact, interviewees reported that most of their patients hit roadblocks because they lack health insurance to cover PrEP.

Stigma and confidentiality concerns were cited as significant barriers to HIV testing and treatment. Interviewees discussed local resistance to HIV testing due to homophobia and assumptions about “what someone with HIV looks like.” They also suggested that some providers in private practice do not want to care for patients with HIV. Additionally, there is a lack of awareness among some providers that women living with HIV can give birth without transmitting it to her infant.
Because Selma is a small community, there is also concern about confidentiality. Selma AIR provides transportation to appointments, but they reported that they have patients who do not want to be seen in their van or in a clinic known to be associated with AIDS, and some have stopped coming in for medical services due to a fear of encountering someone they know.
“Stigma [related to HIV] is alive and well.”
–MAO staff
Initiative: Comprehensive, integrated care for people living with HIV
Medical Advocacy and Outreach (MAO) is a non-profit health and wellness organization that provides clinical HIV care and social services, funded in part by grants from the federal Ryan White HIV/AIDS program. MAO has three full-service clinics and 10 rural e-health satellite clinics that “meet their patients where they are” through telemedicine. Their telemedicine network uses Bluetooth-enabled devices such as stethoscopes and dermascopes, which expands their capacity to serve more patients and get patients into care faster. Often serving as an individual’s only provider, MAO offers their clients living with HIV primary and preventive care, including routine STI testing, dental care, mental health and substance use treatment, PrEP and an in-house pharmacy where patients can access medication regardless of income. MAO also operates a food bank and used clothing closet and provides transportation for medical visits. MAO has a clinic for pregnant women with HIV to help minimize the risk of perinatal transmission. Since starting this clinic, there have been no cases of maternal-fetal HIV transmission. Their family planning clinic offers pregnancy testing, counseling, Depo Provera, the pill, patch, and a direct referral to a private physician for IUDs. MAO can also prescribe oral contraceptives through telemedicine.
Selma AIDS Information and Referral (AIR), Inc. is Alabama’s only African American-led AIDS service organization. Primarily funded by the Ryan White program, they serve nearly 200 HIV positive clients a year across eight Black Belt counties, providing HIV/AIDS information, counseling, referrals, support groups, and peer counseling. They also offer HIV tests, substance use and mental health counseling in-person or by video conference, and social services such as transportation, housing support, medication assistance, and a food bank, with a particular focus on formerly incarcerated people and those with substance abuse disorders. Selma AIR’s clients are referred to the MAO clinic in Selma housed at UAB for medical care and treatment. Selma AIR has a high patient retention rate, partly because they have a dedicated caseworker who is familiar with the community and takes extra measures to ensure confidentiality. Selma AIR has had a significant impact in the community, with local media reporting new HIV diagnoses decreasing by nearly 60% in Dallas and Wilcox counties and by over 40% in other Black Belt counties serviced by Selma AIR since its inception in 1995.
Social Determinants of Health
Social determinants such as housing, employment, education, and poverty play a sizable role in the health of Dallas County residents, contributing to high rates of chronic conditions. In addition, historical and current racism has reportedly fostered mistrust of the medical establishment among the African American community.
High poverty rates, limited affordable housing, lack of vocational training and employment opportunities, and other socio-economic stresses lead many women to prioritize other needs before health care and family planning. Almost a third of the population (32%) in Dallas County lives below the federal poverty level.8 Focus group participants discussed a scarcity of well-paying jobs and challenges with childcare among their daily concerns. One provider pointed out that without transportation or childcare, women living in rural areas will not come into Selma for health care unless they are in pain and that other financial priorities such as food and housing are more pressing. These factors also contribute to high rates of chronic conditions such as diabetes (including among pregnant women), hypertension, obesity, and kidney disease.
“Social determinants of health play a big role. If they don’t have food in the fridge, they will not be worrying about birth control; that’s the last thing on their list.”
–Dallas County Health Department staff“The whole village has to be involved. It can’t be just the church, the school, or the home; the whole puzzle has to be put together. All these entities have to be part of the discussion, and we have failed so far.”
–Felecia Lucky, President, BBCF“[My health] is not a ten [on a scale of ten] because I have other things I have to deal with concerning my kids, their health, their wellbeing, my financial situation; all of that is constant for my health. If [they’re] okay, then I can deal with it.”
–Focus group participant
Historical mistrust of the medical establishment among the African American community may contribute to lack of engagement in early and preventive care. Some interviewees commented on the lasting effect of slavery, racism, and the notoriously unethical Tuskegee syphilis study, conducted by the U.S. Public Health Service in the mid-1900s in nearby Macon County. The legacy of that experiment, slavery, and the Jim Crow era still lives on in the area today. Interviewees discussed a need for more African American providers who could provide culturally congruent care, along with cultural sensitivity training for existing providers. A new Ob-Gyn at the hospital OB clinic is an African American female, which she views as important for her patients.9
“The history of racism weighs on the community heavily.”
–Felecia Lucky, President, BBCF“Black women are not believed about their issues and their pain.”
–June Ayers, Director, Reproductive Health Services (RHS)
Initiative: Supporting regional community development
The Black Belt Community Foundation (BBCF) was created in 2004 and covers 12 counties across the Black Belt region. BBCF has granted more than $3 million to nonprofit organizations, focusing their efforts on four key areas: arts and culture, education, health and wellness, and community economic development. They have funded key health projects including Selma AIR and a health and wellness program in nearby Sumter County to help provide medication to people lacking access. Other projects have included education about AIDS and domestic violence, which they note is a growing need in the area. BBCF also implemented a matched savings program to help low-income individuals buy a car or afford housing or education.
Contraceptive Provision, Access, and Use
Focus group participants and interviewees said that a lack of sex education, the influence of the churches, and cultural norms have contributed to the high rates of teen pregnancy in the area. The Dallas County Health Department is a key provider of contraception for low-income women.
The Dallas County Health Department, the local Title X provider, is the primary resource for contraception in the community and has an extensive case management program; however, resources and capacity are limited. The health department located in Selma serves approximately 3,000 women a year from Dallas County and some of the surrounding counties. It assists uninsured women to enroll in Plan First and is the primary provider of family planning for low-income women in the region. They offer a wide range of methods including emergency contraception, the Depo-Provera shot, oral contraceptives, and implants. At the time of the site visit, women requesting IUDs were referred to a community provider, but the health department was training a clinician to insert IUDs onsite. The health department also provides family planning education and counseling, and extensive case management for patients with myriad challenges related to housing, food, domestic violence, and other needs. Social workers work with teens, reminding them to come in to refill their contraception on time. They also conduct outreach, but interviewees reported that health department does not have the resources to fully meet the needs of the community.
“It’s easy [be]cause you can go to the health department and get everything free.”
–Focus group participant
There are a range of Plan First providers in the county including private physicians’ offices, the RHMP, and the hospital outpatient obstetric clinic, but most focus group participants go to the health department because it is convenient, the providers “understand” them, and services are confidential and free.
Interviewees and focus group participants reported that most women use Depo Provera to prevent pregnancy. Focus group participants said they could get the Depo shot right at the health department, but they noted a “two-step” process at other clinics in which they had to go to the clinic to get a prescription, go to the pharmacy to pick up the shot, and then return to the clinic to get the shot. For women seeking an IUD after giving birth, the Selma hospital does not offer immediate postpartum IUDs. Focus group participants also described challenges obtaining tubal ligations after delivery related to Medicaid policies and scheduling. Some focus group participants said that it is difficult to get an appointment with the hospital outpatient OB clinic. At the time of this study, RHMP was in the process of establishing an MOU with Ob-Gyns serving Medicaid patients to facilitate easier referrals.
Role of Religion and Sex Education
Comprehensive, medically accurate sex education is not usually offered in Dallas County schools. Interviewees and focus group participants said that the lack of health literacy and sex education in the schools contributes to high rates of STIs, HIV, and teen pregnancy. Alabama requires two weeks of HIV education be provided in public schools but does not require general sex education. Interviewees felt that the HIV education requirement is not enforced uniformly within the state, and that schools vary in whether and how they teach sex education, generally focusing on abstinence rather than more comprehensive approaches. Interviewees reported that these factors resulted in a lack of knowledge about STIs, misinformation about contraceptive methods, and numerous HIV cases among students in the area. Selma AIR, which provides HIV education from 5th through 12th grade in every school in its service region, reported that some school nurses and teachers invite them in to teach abstinence as a method of HIV prevention, but that they would prefer to teach more effective evidence-based approaches. A local community development organization highlighted the impact of the lack of resources at the state and local level; they added that sex education is not a priority because schools “are trying to figure out how to keep the lights on.”
“For communities that are already struggling and resources are tight, you bring in another curriculum and add it onto their plate, people become resentful and don’t do a good job. There have to be resources available to support the additional ask from the state level.”
–Felecia Lucky, President, BBCF
Interviewees reported that although there are a small number of churches (e.g., Methodist, Unitarian Universalist) that promote family planning and STI information at community events, the majority of churches do not. Interviewees noted that some churches are strongly opposed to discussing family planning and STI prevention because they believe that sex or pregnancy before marriage is shameful. At the same time, several interviewees suggested that teen pregnancy has been normalized because it is so common.
“There is a community attitude that if you are a woman without kids, it’s weird.”
–June Ayers, Director, RHS
Access to Abortion Counseling and Services
There are no clinics providing abortion in Dallas County. Substantial local opposition to the service was noted among both focus groups participants and interviewees.
There is no abortion provider in Dallas County, and obstacles such as transportation, anti-abortion sentiment, and cost make it difficult for women to obtain an abortion. The closest abortion clinic to Selma is located 50 miles away in Montgomery, where staff reported seeing many patients from the Selma area. There used to be an abortion provider in Selma, but intense protesting and a reported problem with state licensure caused it to close. The sole hospital in Dallas County does not perform abortions even in cases of life endangerment or lethal fetal anomalies. Instead, they refer patients to tertiary clinics in Birmingham or Montgomery. Women whose pregnancies are a result of rape or incest are reportedly referred to rape counseling. According to one interviewee, many health care providers are anti-abortion, and some women seeking an abortion are reportedly told “to get out of their office and never come back.”
“I have a patient with a basketball-sized fibroid and a 6-week pregnancy in lower Mississippi. We cannot do an abortion in an office-based setting and get insurance to cover it. She would die if she continued the pregnancy; she needs an abortion AND hysterectomy. [It’s been] really difficult to get this woman the appropriate care even though you can justify it in a hundred different ways. …[there’s] no local Ob-Gyn or hospital that will provide abortion here.”
–June Ayers, Director, RHS“You ain’t gonna get [an abortion] here, not in Selma.”
–Focus group participant
Cost is cited as a barrier to abortions for many low-income women, with the procedure fees ranging from about $600 to $1,500, depending on the gestational age. In Alabama, Medicaid will not pay for abortion outside of the exceptions of rape, incest, or life endangerment of the woman, but the Montgomery-based clinic reported that they have never been able to get an abortion paid for even under these circumstances. The Yellowhammer Fund assists women seeking abortions with the cost of the procedure; they reported providing about $80,000 in financial assistance in 2018. Since the state passed its near-total abortion ban in 2019, donations to Yellowhammer have risen, and the Fund has increased assistance to cover the procedure from about $650 per week to about $9,000 per week, helping 20 to 40+ women per week pay for abortion services. The Fund also has a budget of $4,000 per month for other logistical support such as transportation. Because many low-income women do not have bank accounts, especially those from rural areas, the Fund also provides gift cards (rather than transferring funds into an account electronically) to women to pay for gas or to rent a car to travel to their appointment.
Initiative: Community-based abortion support services
Montgomery Area Reproductive Justice Coalition (MARJCO)’s offices are housed at People Organizing for Women’s Empowerment & Rights (The P.O.W.E.R House), a historical building next door to Reproductive Health Services (RHS), the only abortion provider in and south of Montgomery. MARJCO, a volunteer organization, offers clinic escort services for patients coming for care at RHS. They also allow family (including children with an adult companion) and friends to wait in the house or on their porch while patients are inside the clinic. Because many women must travel long distances to get to Montgomery for abortion services and because of the mandated 48-hour waiting period, MARJCO can arrange for these women to stay at the P.O.W.E.R. House before their procedure. They also host events to advocate for reproductive rights, provide space for community groups, and offer classes on sex education and contraception.
Highly restrictive state laws and widespread anti-abortion sentiment in the community make it difficult to provide or obtain an abortion. Interviewees cited the 48-hour waiting period and requirement that abortion practitioners have admitting privileges at a local hospital as particularly limiting. The Montgomery abortion clinic explained that the 48-hour waiting period is misleading; because they are a small clinic, they perform abortions only one day a week, so depending on when the woman comes in, she may have to wait up to nine days for her procedure.
Providers also spoke of the anti-abortion sentiment in the community. There are protesters outside the Montgomery abortion clinic every day, which escalates on procedure days. Interviewees reported that many clinics would not last long in the area because “people are very against abortion in this state.” They reported that abortion providers cannot live in the same community in which they work due to harassment. Montgomery Area Reproductive Justice Coalition provides escort services into the clinic, overnight accommodations, and other supports for women traveling to Montgomery for abortion services.
“When [women] get out of the car they are getting screamed at. The [protesters] don’t care how they shame them, how startling it is. Some patients come in and they are angry, and others in tears. They have to go through this twice…we prepare the patients about what to expect. Protestors will video patients and providers, and post them on Facebook. This feeds the culture [of stigma].”
–June Ayers, Director, RHS
Alabama signed the most restrictive anti-abortion measure into law on May 15, 2019. Scheduled to begin in November 2019, it would make abortion a felony except when necessary to prevent serious health risk to the woman, punishable by up to 99 years in prison for the providing physician. This law, passed after this case study was conducted, is temporarily blocked by court order. At the time of this publication, state law allows abortion up to 20 weeks.
“We don’t want to defend abortion access. We want to improve abortion access in Alabama.”
–Amanda Reyes, Executive Director, Yellowhammer Fund“I can’t think of [just] one policy that affects abortion access. It’s more of an avalanche…There is such an animosity to anything that has to do with reproductive rights.”
–June Ayers, Director, RHS
Some providers refer women to the crisis pregnancy center (CPC) in Selma for assistance, unaware of its anti-abortion mission. CPCs typically offer limited medical services such as pregnancy tests and ultrasounds, and discourage women from seeking abortions. The health department in Selma lists Safe Harbor, a local CPC, as a referral for “abortion services” above abortion providers in Montgomery and Tuscaloosa. About half of the focus group participants reported knowing that Safe Harbor provides free pregnancy tests but not contraception. Participants who had gone there reported that they were shown a video about abortion. Two other focus group participants had gone to CPCs in Montgomery and Birmingham for pregnancy tests, where clinic staff pushed adoption as an option and asked the women to read the Bible.
Focus group participants were opposed to abortion, and most thought the procedure is illegal in Alabama. Some interviewees believed that a lack of education about abortion contributes to the anti-abortion environment. One interviewee stated, “If everything they have heard is negative about abortion, if they have heard these messages and no one has sat down to explain to them the positives and negatives, the planning beforehand, there is a huge gap.” All focus group participants expressed opposition to abortion, but some said they were okay with abortion if the pregnancy is life threatening. Two participants shared that they had had an abortion; one said it was a Medicaid-funded abortion because of life-threatening pregnancy and the other was due to a fetal anomaly.
“I’m against abortions, so therefore if that condom broke and I ended up pregnant, I’m just pregnant.”
–Focus group participant“I’m against them, but me personally I had to have one because I had a choice of I live or the baby live, so I ended up getting an abortion…”
–Focus group participant
The focus group identified considerable misinformation about abortion services among women in the community. Most focus group participants incorrectly believed that abortion is illegal in the state, and only half knew where you could get one. Most also incorrectly equated emergency contraception (EC) with abortion, but they knew that you could get EC at the health department or buy it over the counter. Another participant incorrectly thought abortion threatens future pregnancies.
“Abortions happen in Alabama every day. The problem is we don’t talk about it.”
–Mia Raven, Founder & Executive Director, The P.O.W.E.R. House“It’s being where we are, in the Bible belt. It’s not educating people. Someone this past week who has had four previous abortions, she still asked me if this abortion will cause her to be infertile. Patients don’t know what they have access to. A big root of this is educating in the state, which we don’t do.”
–June Ayers, Director, RHS
Conclusion
Dallas County has a network of community-based organizations and health care providers that are committed to improving the health and well-being of women living in the Black Belt region of Alabama, despite considerable structural challenges in the community. Several interviewees said that Alabama’s decision not to expand Medicaid and its strict eligibility limits means many low-income women remain uninsured or only have coverage for family planning services. Women in the county, including those in Selma, suffer from high rates of chronic health conditions and face substantial barriers to care including poverty, unemployment, lack of transportation, unaffordable housing, and limited education. In addition, due in part to provider shortages and hospital closures, women living throughout the Black Belt have to travel long distances to access obstetrical care, exacerbating high rates of infant and maternal mortality. The heavy influence of churches and the state’s politically conservative climate have resulted in limited sexual health education, and stigmatization and restriction of abortion care.
Acknowledgements
The authors thank all of the interviewees that participated in the structured interviews for their insights, time, and helpful comments. All interviewees who agreed to be identified are listed below. The authors also thank the focus group participants, who were guaranteed anonymity and thus are not identified by name.
June Ayers, Director, Reproductive Health Services
Keshee Dozier-Smith, CEO, Rural Health Medical Program, Inc.
Meneka Johnson, PhD, COO, Rural Health Medical Program, Inc.
Felecia Lucky, President, Black Belt Community Foundation
David McCormack, CEO, Vaughan Regional Medical Center
Clara Moorer, Director, Women’s Health Services, Vaughan Regional Medical Center
Rhonda Parr, Nurse Coordinator, Dallas County Health Department
Mia Raven, Founder & Executive Director, Montgomery Area Reproductive Justice Coalition (MARJCO)
Amanda Reyes, Executive Director, Yellowhammer Fund
Terri Sewell, U.S. Rep. (AL-07)
Sarina Stewart, LMSW, Social Work Manager, Dallas County Health Department
Suzanne Terrell, LMSW, Assistant Administrator, Dallas County Health Department
Medical Advocacy & Outreach (MAO) Staff:
Marguerite Barber-Owens, MD, AAHIVS
Laurie Dill, MD, AAHIVS, Medical Director
Stephanie Hagar, LBSW Lead Administrative Social Worker
Rozetta Roberts, NP, Clinic Director
Dianne Teague, Governmental/Donor Affairs
Jennifer Thompson, LICSW, Division Manager of Social Work
K.C. Vick, Director of Capacity Building
Tulare County, Ca
KFF: Usha Ranji, Michelle Long, and Alina SalganicoffHealth Management Associates: Carrie Rosenzweig and Sharon Silow-Carroll
Introduction
The state of California has a wide range of legal protections for reproductive health care access and coverage. Its decision to expand its Medicaid program, Medi-Cal, through the Affordable Care Act (ACA) greatly broadened health insurance coverage for its low-income populations, and the state’s Family PACT program ensures coverage for family planning services to uninsured women up to 200% of the federal poverty level (FPL). California requires that Medicaid and private insurance plans cover abortion. However, these coverage protections have not guaranteed equal access in all parts of the state. Tulare County sits in the Central Valley, the heart of the agricultural region of California. The majority of its population is concentrated in a few small cities in an otherwise sparsely populated county. The area is more politically and socially conservative than many parts of the state. As one of the poorest counties in California, Medicaid expansion has been a significant source of coverage for low-income individuals living there. Still, the area is federally designated as medically underserved and as a health professional shortage area, and residents can face significant barriers in accessing basic health care and family planning services. Tulare County’s rates of some sexually transmitted infections (STIs) and teen pregnancy are much higher than the state average. Tulare County’s large migrant worker, immigrant, and Latinx populations, as well as individuals who identify as LGBTQ, face heightened barriers to care.
This case study examines access to reproductive health services for low-income women in Tulare County, California. It is based on semi-structured interviews conducted in March and April 2019 by staff of KFF and Health Management Associates (HMA) with local safety net clinicians and clinic directors, social service and community-based organizations, researchers, and health care advocates, as well as a focus group with Spanish-speaking, low-income women living in the community. Interviewees were asked about a wide range of topics that shape access to and use of reproductive health care services in their community, including availability of family planning and maternity services, provider supply and distribution, scope of sex education, abortion restrictions, and the impact of state and federal health financing and coverage policies locally. An Executive Summary and detailed project methodology are available at https://www.kff.org/womens-health-policy/report/beyond-the-numbers-access-to-reproductive-health-care-for-low-income-women-in-five-communities.
Key Findings from Case Study Interviews and Focus Groups of Low-Income Women
- Medicaid coverage – Medicaid expansion and a comprehensive Medicaid-funded state family planning program for low-income Californians have greatly reduced the uninsured rate and improved coverage for reproductive health services. As a result, cost is generally not a barrier to contraception, but other financial obstacles and coverage barriers remain, particularly for immigrant populations.
- Provider distribution – There is a severe provider shortage in the region, particularly in the outlying rural areas and for specialists in HIV and obstetrics. Some Federally Qualified Health Centers are addressing this with mobile units, satellite sites, and free transportation services.
- Sex education – Health educators and nurses play a significant role in patient education, but a lack of comprehensive sex education in schools (despite a state mandate to offer medically accurate school-based sex education) reportedly contributes to high rates of STIs, HIV, and teen pregnancy.
- Poverty and immigration status – Tulare is one of the poorest counties in the state, and many residents cannot afford basic needs such as housing or food. Immigrants who are undocumented or who are not proficient in English face heightened challenges in seeking services due to language barriers and fear of deportation, and are typically not eligible for many public programs.
- Sexual and domestic abuse – Domestic violence is prevalent in the area. Women and providers reported that they feel the health care and law enforcement systems further victimize women who experience abuse.
- LGBTQ populations – LGBTQ individuals in the community face significant stigma and a shortage of culturally competent providers. One advocacy and resource center is working with providers and youth in the area to address these barriers.
- Abortion access – Abortion is not easily accessible in Tulare County. There is no abortion provider in the county, so women must travel at least 50 miles to access these services. Religious views, transportation, and stigma prevent many women from seeking abortion services when they want them and prevent providers who otherwise would be willing to offer abortion care from providing those services.
Medicaid Coverage
Many Tulare County residents live in extreme poverty, and there are a significant number of immigrants, including many monolingual Spanish speakers. These communities face serious barriers to health care despite the availability of expanded coverage under Medicaid and the state family planning program.
| Table 1: California Medicaid Eligibility Policies and Income Limits | |
| Medicaid Expansion | Yes |
| Medicaid Family Planning Program Eligibility | 200% FPL |
| Medicaid Income Eligibility for Adults Without Children, 2019 | 138% FPL |
| Medicaid Income Eligibility for Pregnant Women, 2019 | 322% FPL |
| Medicaid Income Eligibility for Parents, 2019 | 138% FPL |
| NOTE: The federal poverty level for a family of three in 2019 is $21,330.SOURCE: KFF State Health Facts, Medicaid and CHIP Indicators. | |
California’s decision to expand Medi-Cal provided broad coverage to many who were formerly uninsured and drastically reduced the uninsured rates in the state; however, gaps remain for undocumented individuals. The 2013 Medicaid expansion greatly increased coverage in Tulare County. California’s Medicaid program covers parents with incomes under 138% of the Federal Poverty Level (FPL), and pregnant women up to 322% FPL under the CHIP “unborn child” option.10 California also extends coverage for family planning services to men and women with incomes below 200% FPL through the Family PACT program, which serves as a major revenue source for clinics serving low-income women across the state. However, several women who participated in the focus group, many of whom were previously undocumented, had not heard of the Family PACT program or did not know that they were eligible for its family planning services. Federally Qualified Health Centers (FQHCs) in the area reported that they still see a significant number of patients who are uninsured, usually because of documentation reasons. Among women of reproductive age in Tulare County, approximately seven in ten are Latinx and nearly three in ten are foreign-born (Figure 1). Agriculture is the dominant industry in the region, and the county is home to many farm workers and their families. In June 2019, following the site visit, California became the first state to expand full Medi-Cal benefits with state-only funding to low-income, undocumented adults ages 19-25, expected to take effect in 2020.
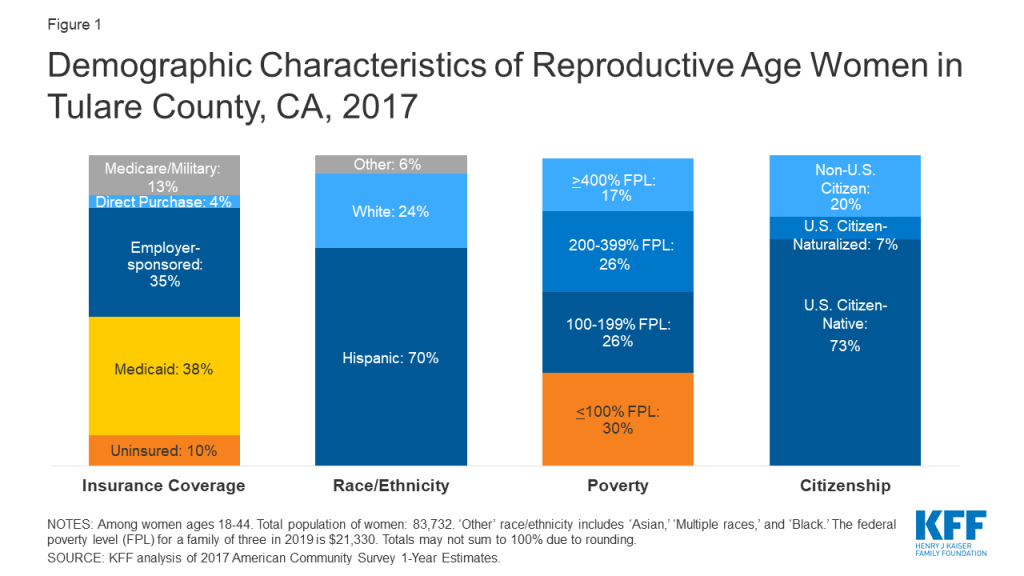
Provider Distribution
Tulare County’s large area and lack of public transit make it difficult for women to travel to larger towns for health care appointments. While prenatal and contraceptive care are generally accessible in the county, there is a significant shortage of providers of specialty care and even fewer specialists who accept Medicaid.
Tulare County is an expansive county, about the size of Connecticut, with a sizable rural footprint. There are provider shortages in the more rural areas, and services are concentrated in the larger towns. Outlying areas that are farther away from the population centers in Tulare and Visalia have limited or no public transportation options, which reduces access to health care services for residents without cars. Interviewees also reported difficulty recruiting doctors to live and work in the area. Some FQHCs are trying to improve access and expand their presence throughout the county using mobile units, satellite clinics, and a transportation fleet to bring patients to and from their appointments free of charge. However, they acknowledge it is not financially viable to build clinics in outlying communities with 100 people (or fewer), and some interviewees suggested that patients do not always know about available transportation services; for example, Medicaid covers transportation to medical appointments in certain cases. The combination of geographic distance, limited public transportation and knowledge of available services means that it is difficult for people in some outlying communities to obtain care.
Focus group participants reported that prenatal care is readily accessible, though their provider choices are limited. Some interviewees expressed that while there may be enough Ob-Gyns in the county, they are not evenly distributed, and the range of Ob-Gyns does not fully meet patient preferences. For example, interviewees and women in the focus group said that the field is male-dominated in the area, and the few doulas and midwives in the county, who are generally female, are overbooked. FQHCs suggested telehealth could help, but they do not currently use this technology for reproductive health or obstetrics. One interviewee commented that there are limited obstetric specialists, so providers refer patients to nearby hospitals for specialty care; however, recent hospital closures have reduced the number of obstetric departments in the area. As in other communities, many private providers do not accept Medi-Cal due to the state’s low reimbursement rates, which are among the lowest in the nation. One interviewee suggested this creates a “two-track system” in which patients with Medicaid are limited to a smaller number of providers.
Initiative: Expanding access to culturally competent perinatal care
Family HealthCare Network, a large, multi-site FQHC in Tulare County, is a participating provider in the Comprehensive Perinatal Services Program (CPSP). They strive to provide culturally competent services to pregnant women enrolled in Medi-Cal in order to decrease the incidence of low-birthweight babies and improve birth outcomes. Funded by the Title V Maternal and Child Health Block Grant Program, CPSP offers enhanced services including nutrition, psychosocial and health education from conception through 60 days postpartum.
Women have access to a variety of contraceptive providers, but limitations remain. Women can get same-day contraception from several FQHCs and a Planned Parenthood clinic in the area. The two county public health clinics also offer some contraceptive services. Planned Parenthood in Visalia was identified by multiple interviewees as the most comprehensive, and the only specialized provider of contraception; however, Planned Parenthood is only open three days a week with limited hours. These limitations are particularly exacerbated for residents in the outlying areas of the county who have to travel farther to get care. In California, pharmacists can prescribe and provide some hormonal contraception (oral contraceptive pills, the patch, injection, and the ring) directly to women. One interviewee noted that pharmacies are one of the “cornerstones” of access in the community, but that not many pharmacists in the area participate in the program due to personal beliefs. A local social justice organization that conducts “secret shopping” at local pharmacies to identify barriers to obtaining emergency contraception (EC) has greatly improved access. Cost is still a barrier since EC costs $40-60 without a prescription, but it is also available at local FQHCs and Planned Parenthood on a sliding fee scale.
Mental health needs are not being met within the community. Although many focus group participants had suffered from anxiety and depression, they said that doctors only talk to them about it when they are pregnant. Long wait times for appointments at the limited number of mental health providers in the county is a barrier to care. One interviewee reported there is a two-month wait for a pediatric mental health assessment, though the victims’ services provider can offer counseling for children who have been exposed to violence, or experienced neglect, endangerment, or abuse within about two weeks. Adults can get mental health services in Visalia or Kingsview, but these services reportedly focus on severe mental health diagnoses only.
Sex Education and STIs
The availability of sex education in the schools is limited in the region despite robust state requirements. Nurses play a large role in educating their patients about sexually transmitted infections (STIs).
Sex education is not consistently taught across the 45 school districts in the county despite a state mandate that schools provide comprehensive sex education. Interviewees report a lag between the state’s passage of legislation and implementation on the ground due to limited resources and lax oversight. The local school board is also resistant to sex education, tied to strong conservative and anti-abortion Roman Catholic influences in the community. Tulare-Kings Right to Life has historically provided abstinence-only sex education in the schools; many interviewee and focus group participants noted this limited curriculum does not offer young people the information they need to make fully informed decisions about their health. Some also noted that as sex education comes into compliance with state law, some parents are choosing to opt their children out of the more comprehensive programs. One interviewee described backlash when an advocacy organization handed out condoms at a high school prom and performed rapid HIV testing at a homelessness event.
“We are a close community that doesn’t know about contraceptives because that is not a topic we talk about at home.” –Focus group participant
Health educators and nurses at local clinics play an important role in educating women about STIs and their contraceptive options. FQHC nurses reported that their patients are uneducated about their sexual health and are often surprised when they learn about STI symptoms and risk factors. However, providers feel limited in their reach because they are only able to educate people who walk into their clinic. On the other hand, focus group participants did not think that providers sufficiently discuss STIs with them. They reported receiving pamphlets but stated they would prefer in-person counseling with reader-friendly guides.
“We [nurses] are a big support to our providers. We do most of the counseling before they see the physician, so the patients can make a decision and get the method they want once they see the doctor.”
–Gabriela Beltran, Title X Patient Care Coordinator, Altura Centers for Health
Initiative: Primary care and sexual health integration
Altura Centers for Health, an FQHC and the Title X provider in the region, works to integrate STI testing and treatment services with primary care. Patient Care Teams, comprised of the provider, Medical Assistant and Patient Care Coordinator, have been successful in integrating screening services at the FQHC’s primary care offices with the goal of testing every sexually active patient once a year. The Patient Care Teams have been taught how to ask patients if they would like to be tested for STIs and how to describe how to collect a urine sample in a patient-centered manner.
Altura Centers for Health also has trained Community Health Educators who conduct health screenings at agricultural sites geared toward the large population of Spanish-speaking migrant workers. These Promotoras are also trained to do family planning counseling. They provide information about contraception and STI testing to individuals, small groups in rural communities, and at health fairs.
In recent years, the county has experienced a rising rates of some STIs, especially syphilis and HIV. Providers have seen an influx of new STI diagnoses (Figure 2), especially among young people. Some attribute this to the small communities of students who are dating each other. Interviewees had mixed views about whether there are enough providers offering STI or HIV testing in the county. One interviewee suggested that many providers do not test for syphilis, and as a result, Tulare County experienced a large outbreak a few years ago; one provider reported they are still seeing one new case of syphilis each week on average. Clients diagnosed with HIV are often 20-25 years old and mostly male. Another provider suggested that most of the testing happens at the county public health clinics where there are concerns about confidentiality and a mistrust of some providers. Sometimes there is also a fear among patients of being “put on a list” [related to immigration] resulting in people going without care.
“Even if they have [HIV], they are not going to tell us [parents]. It is a sin to talk about that, at least in this area. That’s not something you talk about at dinner time.”
–Focus group participant

Access for Special Populations
Undocumented immigrants, people in remote areas, women experiencing domestic violence, LGBTQ individuals, and teens face increased barriers to health care. Tulare County has a variety of community organizations that offer innovative programs focused on improving access for many of these populations.
Immigrants
Barriers affecting low-income women living in Tulare County are amplified for undocumented women. They face additional challenges related to language, costs, and confidentiality. While most of the region’s population is Latinx (65%), there are a number of smaller immigrant communities, including from South and Southeast Asia. Interviewees said that most providers have materials in Spanish and interpretation services or Spanish-speaking staff, but they often do not have the capacity to provide intepretation services for the community’s Southeast Asian populations. Furthermore, providers reported that interpretation in all languages, including Spanish, for ongoing services such as case management is challenging. Many women bring in family members or friends to interpret for them, but providers expressed concern about confidentiality, especially in smaller communities.
Undocumented individuals delay or avoid seeking health, social, or financial services. They may limit their time outside because they fear deportation or a negative impact on their legal status. Multiple interviewees reported that racism and fear of ICE raids have increased in recent years. Several focus group participants recounted experiences in which they delayed or went without health or pregnancy-related care because they were undocumented and afraid of deportation. Women seeking legal status have also forgone needed public assistance, fearing being seen as a “public charge” and jeopardizing the immigration process. There have been ICE raids on domestic violence shelters across California, and interviewees said that women who call to report abuse will not seek services for fear of deportation.
“If you ask for public assistance while your documents are being processed, they are not going to give you your legal status. That’s why many people don’t want to get [assistance]. Because you are in the process, and they are going to see and think ‘these people are going to be a public burden.’”
–Focus group participant“I was undocumented for a long time, and you feel afraid, you feel scared from going [to a health care provider].”
–Focus group participant
Undocumented women in California are eligible for emergency Medicaid coverage of labor and delivery, but their eligibility for Medicaid ends after childbirth. However, under the state’s new expansion of Medi-Cal benefits to young adults 19-25, some would remain eligible for coverage. Several women in the focus group became uninsured following delivery or the 6-week follow up visit. As a result, they did not seek additional care for themselves because they were not covered and felt they could not afford it.
“When I got pregnant [with] my little girl, I didn’t go to the hospital until I was 8-months pregnant because I didn’t know, and I was undocumented.”
–Focus group participant
Poverty and Access in Outlying Areas
Women in the focus group and other interviewees reported that poverty is disproportionately hard on women and plays a role in access to contraception. Visalia, Tulare, and Porterville are the largest towns in the county, but a significant portion of the population lives in unincorporated communities that may not have a grocery store, pharmacy, or health clinic. This leaves many women without even a place nearby to purchase condoms. Some smaller communities do not have running water. Many residents are under- or unemployed and cannot afford housing, food, and hygiene items. Social service providers asserted that when women must make a choice among basic needs, their health is low on the list. One interviewee added that multi-generational poverty locks women who are financially dependent or must work multiple jobs into family environments that prevent them from making their own choices, particularly women in abusive or coercive relationships.
“We are not a woman’s health-friendly community. We have needs that are not being met. Most of the people we serve are women in our communities, but families in our rural communities often don’t have strong networks, education, or access to information [rely on information online]. Young women don’t know where to go.”
–Interviewee
Domestic Violence
Domestic violence is prevalent in the area, but there is a shortage of services and lack of appropriate training among health care providers and law enforcement. The largest victims’ services provider in the county operates the only rape crisis center serving Tulare County. They serve about 350 clients a year, 100 of whom require rape kits/forensic exams. They also operate one of the two emergency shelters in the area; the other is religiously affiliated. Both shelters have long waiting lists due to their limited capacity, housing only eight to ten women, many of whom have multiple children. In addition, barriers facing undocumented individuals in seeking health care services, such as fear of deportation, have also prevented women from utilizing shelters.
“Given recent national changes, we have seen the impact in victims’ services – we have people calling daily to report abuse but will not come into a shelter because of a fear of being connected with the government and deported. We are sure this is happening in other health care organizations.”
–Caity Meader, CEO, Family Services of Tulare County
While screening for domestic violence is recommended as a routine part of primary and prenatal care, health care providers may not screen for it because they do not feel equipped to address the patient’s needs if they disclose abuse. In order to increase domestic violence screening, the victims’ services provider has established operating agreements with hospitals and other health care providers to offer training and education to identify and address domestic violence and abuse among patients. However, they reported implementation challenges at the provider level and that they are not receiving the expected volume of referrals from the clinics.
Most women in the focus group reported that their doctor had discussed domestic violence with them. A few had negative experiences with law enforcement; one focus group participant described how police threatened to remove her children from her custody while she was at the hospital seeking medical attention for injuries due to domestic violence. Because she did not want to accuse her partner, the police implied that the situation was her fault instead of connecting her with resources and support. A few women had positive experiences with police and social workers who helped them obtain the support they needed.
“I did live a lot of domestic violence, I thought they [law enforcement] were going to help me, but they did the complete opposite…they were telling me that they were going to put me in jail because…I was complicit because I didn’t want to accuse him. They were also saying I was exposing my children to that and they were going to take them away from me.”
–Focus group participant
Initiative: Domestic violence high risk team
Family Services of Tulare County, in partnership with the Sheriff’s Office, created a Domestic Violence High Risk Team to address the high rates of domestic violence-related deaths in the county (11 between 2017 and 2018). Tulare County’s domestic violence team is the only example of this model that has been fully implemented west of Ohio. The Sheriff’s team uses a modified danger assessment tool that reviews for evidence-based lethality indicators. If a situation is considered high risk, a collaborative team consisting of staff from the DA’s office, probation, family services, and the Sheriff’s office will meet to address the situation. After implementation of this model, Tulare County did not have any domestic violence-related deaths for an entire year. They plan to expand this model to other areas.
Women who are involved in abusive relationships often experience reproductive coercion. A victims’ services provider and a family resource center reported that women in abusive relationships often experience reproductive coercion where their partners prevent them from using contraception or sabotage their chosen method. As a result, women are not able to make their own reproductive decisions, and many have had multiple children they did not intend to have. These interviewees reported that when they speak to their clients, it is often their first time learning about family planning options and where to obtain those services. Their staff are trained in identifying women and children who might be experiencing abuse.
LGBTQ Individuals
Individuals who identify as LGBTQ in Tulare County experience significant stigma, and interviewees spoke about a severe shortage of culturally competent providers. The stigma that LGBTQ individuals experience plays a large role in discouraging them from seeking appropriate care. This is compounded for LGBTQ individuals who are Latinx, migrant workers, undocumented, or live in the outlying more rural areas. Some interviewees are also concerned that there is a lagging standard of care for this population compared to other metropolitan areas of the state. For example, providers are still drawing blood to test for HIV rather than using a rapid result test which delays results. In addition, some interviewees said that patients are not always aware that they need to request the specific HIV and STI tests they want to receive.
There is reportedly only one provider in the area who provides culturally competent care for transgender patients, but he will not initiate hormone replacement therapy (HRT). Patients seeking this treatment must travel far out of the county to obtain it.
Initiative: LGBTQ+ leadership academy
The SOURCE is the sole LGBTQ advocacy and resource center in Tulare County. Opened in 2016, the center provides youth and peer support groups and advocates for LGBTQ-friendly policies and practices in the health care system. They also offer education and counseling about medical care including STIs, HIV, substance abuse, and mental health. Its LGBTQ+ Leadership Academy teaches youth about LGBTQ history, HIV care, transgender rights, health equity and reproductive justice, local government, public speaking, and state advocacy. As part of the curriculum, youth perform two clinic visits to compare experiences with health care providers and identify LGBTQ-friendly clinics and physicians.
There is a lack of primary care doctors who are trained to prevent HIV among at-risk patients. Preliminary data on HIV rates in Tulare County show a 68% increase from 2017 to 2018.11 California state law requires medical providers to educate patients who are at high risk for HIV infection about methods to reduce their risk, including pre-exposure prophylaxis (PrEP). However, one interviewee asserted that no providers in the Tulare County area are complying with the mandate. There are no self-reported PrEP providers on official listings online, and an interviewee noted that providers in the area refer individuals seeking PrEP to the one infectious disease physician serving patients with HIV, who has a months-long waiting list. Notably, most women in the focus group had not heard of PrEP or its brand name, Truvada. Providers are also not providing expedited partner therapy (EPT) or HIV/STI prevention education. The SOURCE, the single LGBTQ advocacy resource organization in the county, is trying to change this by working with the FQHCs in the area and conducting clinic visits. The SOURCE is also a PrEP Medication Assistance Program site, through the AIDS Drug Assistance Program (ADAP) and Gilead’s PrEP Assistance Program (PrEP AP) which helps under- or uninsured individuals pay for the drug.
Teens
“All the other doctors made me feel as if it was a sin being pregnant. Like if I was a shame for the community.”
–Focus group participant
Initiative: Evaluating access to emergency contraception through youth-led secret shopping
ACT for Women and Girls (ACT) is a local grassroots organization with over 14 years of experience in reproductive justice organizing. ACT offers youth-led programming with a focus on reproductive health and provides comprehensive sex education in schools. The organization also has been conducting a pharmacy access project since 2009 where youth secretly shop at 60-70 pharmacies each year in Tulare County to evaluate access to emergency contraception (EC) based on a set of criteria including accessibility (e.g., location in store), youth-friendliness, and men’s experiences purchasing EC (to assess assumptions about gender). ACT develops an annual report card and issues awards to high-performing pharmacies. The organization also conducts secret shopping in health clinics to evaluate how providers and staff treat pregnant teens, transgender people, and people who believe they might be pregnant.
Access to Abortion Counseling and Services
Compared to many other states, there are fewer restrictions on abortion in California; however, access to and cultural attitudes about abortion vary throughout the state. There are no abortion providers in Tulare County, and interviewees and women in the focus group stated that the community is conservative, creating substantial local resistance among both women and providers to the service.
There are no abortion clinics in Tulare County, and there are significant barriers to providing or obtaining these services. The closest clinic providing abortion services is in Fresno, which is at least 50 miles away. Women face barriers related to transportation, cost, stigma, and fear of family members finding out.
“If you don’t have a car, you don’t get there [to an abortion provider].”
–Focus group participant
Interviewees suggested abortion access is most affected by political and cultural norms, and that anti-abortion groups and crisis pregnancy centers (CPCs), which typically offer limited medical services like pregnancy testing and ultrasounds, and discourage women from seeking abortion services, have considerable local power. Planned Parenthood’s Visalia Health Center has experienced repeated vandalism over the past few years, even though it does not provide abortion services. Local FQHCs fear losing federal funding if perceived as supporting abortion. One interviewee remarked that there is significant bias against abortion among providers and believes that most do not discuss or provide referrals for abortion. Some providers are aware of the potential impact of the new Title X regulations that ban Title X funds from going to providers who offer or refer for abortion services. However, they do not think it will have much of an impact in their community because, “no one is really doing those activities now.”
Half of the focus group participants knew where they could get an abortion, though some suggested that many in the Latinx community oppose abortion. One woman had a friend who wanted an abortion but could not get one because it was too expensive; in the end, she gave birth and placed the baby for adoption. Another woman said she decided to have her provider induce a “miscarriage” after she found out her fetus was developing abnormally, but later doubted her decision. A Title X provider remarked that “we don’t get that many women who want to terminate their pregnancy,” though many interviewees reported a general lack of knowledge and education about abortion as an option.
“It’s really hard to get an abortion here. I don’t know how to emphasize that enough.”
–Erin Garner-Ford, Executive Director, ACT for Women and Girls
Conclusion
California is known for its progressive policies and has extensive protections for health care coverage including family planning and abortion; however, many residents of Tulare County lack access to these services. While the county has a large Medicaid-eligible population, the shortage of providers, particularly specialists and abortion providers, presents barriers to sexual and reproductive health care. In addition, the region’s rural population has little access to public transportation, and faces extreme poverty, making it difficult to afford even basic items. The county’s large Latinx immigrant community, many of whom are undocumented migrant workers, faces heightened challenges; they are often deterred from seeking care due to language barriers, ineligibility for public programs, and a fear of deportation. There is limited support for women experiencing domestic violence, and many face barriers to leaving violent relationships. All these obstacles are amplified for undocumented individuals without health coverage and who fear deportation, and for those who identify as LGBTQ dealing with stigma and a lack of culturally competent providers.
Acknowledgements
The authors thank all of the individuals that participated in the structured interviews for their insights, time, and helpful comments. All interviewees who agreed to be identified are listed below. The authors also thank the women who participated in the focus groups, who were guaranteed anonymity and thus are not identified by name.
Angel Avitia, Assistant Director, Tulare County Family Resource Center Network
Gabriela Beltran, Title X Patient Care Coordinator, Altura Centers for Health
Brandon Foster, PhD, Chief Quality and Compliance Officer, Family HealthCare Network
Erin Garner-Ford, Executive Director, ACT for Women and Girls
Raquel Gomez, Director of Community Initiatives, Tulare County Family Resource Center Network
Caity Meader, CEO, Family Services of Tulare County
Brian Poth, Executive Director, The Source
Leonora Sudduth, RN, Title X Nurse, Altura Centers for Health
Dawn Wells, Grants Specialist, Altura Centers for Health
St. Louis, Mo
KFF: Usha Ranji, Michelle Long, and Alina SalganicoffHealth Management Associates: Sharon Silow-Carroll and Carrie Rosenzweig
Introduction
Over the past couple of decades, Missouri has increasingly become a battleground for reproductive rights and health services. The state has passed a number of regulations that restrict access to reproductive care, and in May 2019, along with several other states, the Republican-controlled Missouri state legislature passed a law banning abortions after 8 weeks. As of this publication, it is temporarily blocked by a federal judge as a legal challenge plays out in court. State regulatory policies and enforcement actions put Missouri at risk of becoming the first state with no operating abortion clinic since Roe v. Wade was decided in 1973. In addition to restrictions on abortion access, Missouri has not expanded Medicaid eligibility under the ACA.
In contrast to the rest of the state, St. Louis stands out as a liberal area, electing Democrats as mayor of the City of St. Louis and to the state senate and House of Representatives.12 The St. Louis metropolitan area (Figure 1) is highly segregated and deep health disparities exist between black and white residents. The region is federally-designated as medically underserved and as a health professional shortage area. One recent study found that there was an 18-year difference in life expectancy between the wealthier, predominantly white, suburbs of Clayton and North St. Louis City, a majority Black area less than 10 miles away. St. Louis also has a large Catholic population and concentration of Catholic-affiliated hospitals and schools, which shape how local health systems offer sexual and reproductive health services and education.
This case study examines access to reproductive health services among low-income women in St. Louis City and County, Missouri. It is based on semi-structured interviews conducted by staff of KFF and Health Management Associates (HMA) with a range of local safety net clinicians and clinic directors, social service and community-based organizations, researchers, and health care advocates, as well as a focus group with low-income women during March and April 2019. Interviewees were asked about a wide range of topics that shape access to and use of reproductive health care services in their community, including availability of family planning and maternity services, provider supply and distribution, scope of sex education, abortion restrictions, and the impact of state and federal health financing and coverage policies locally. An Executive Summary and detailed project methodology are available at https://www.kff.org/womens-health-policy/report/beyond-the-numbers-access-to-reproductive-health-care-for-low-income-women-in-five-communities.
Key Findings from Case Study Interviews and a Focus Group of Low-Income Women
- Medicaid – Missouri did not expand Medicaid under the Affordable Care Act. Therefore, the income eligibility threshold for Medicaid in Missouri, less than $5,000/year for parents in a family of three, limits access to comprehensive coverage, including family planning services. State restrictions on Medicaid reimbursement and public funding for clinics that also offer or are affiliated with abortion providers affect the availability of services in the community. The need for pre-authorization and limitations on reimbursement for long-acting methods of contraception, such as intrauterine devices (IUDs) and implants, also limit access to these methods for low-income women.
- Provider distribution – Although interviewees say that there are several providers offering affordable family planning services, including contraception and STI services, the clinics are maldistributed and many are not easily accessible to some of the area’s most vulnerable populations who face transportation barriers. These inequities reportedly contribute to the severe racial and ethnic disparities in life expectancy and health outcomes in the area.
- Religious health systems – Religious views and a predominance of faith-based hospitals influence the availability of certain reproductive health services (e.g., sterilization) and comprehensive school-based sex education. While many individual providers associated with faith-based health systems inform patients about the full range of contraceptive choices, access to some methods requires going to a different provider, causing delays or extra steps.
- Contraceptive access – Interviewees and focus group participants say that for the most part, low-income women who want contraception can find a local provider where they can get it. Yet, some women still face challenges, for example with distance to a clinic. Several efforts are underway by local non-profits and providers to address cost, transportation, misinformation, and other barriers to the full range of contraceptive choices.
- Abortion access – Abortion is highly restricted by state laws and regulatory enforcement actions. At the time the case study was conducted, only one clinic provided abortion services in Missouri, located in St. Louis. As a result, some women do not know where to go for abortion services, while others travel across the river to nearby clinics in Illinois, where there are fewer restrictions on abortion. Both women and providers cite Missouri’s 72-hour waiting period and rule that requires the same physician to perform the informed consent and the procedure as significant barriers to obtaining or staffing for abortion services.
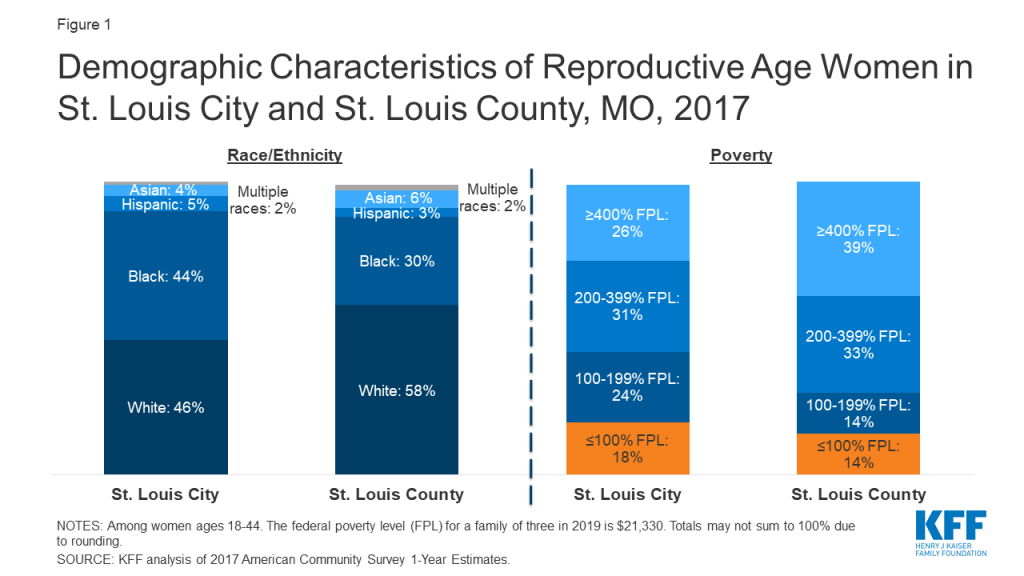
Medicaid Coverage and Continuity
Missouri’s decision not to expand Medicaid, its policies restricting Medicaid reimbursement for providers that offer both contraception and abortion services, as well as the establishment of a state-funded family planning program that excludes providers who offer abortion services and their affiliates, have extensive implications for women’s access to sexual and reproductive health and maternity care. A temporary health care program for low-income adults in St. Louis helps fill some of the gaps in coverage and access to care.
| Table 1: Missouri Medicaid Eligibility Policies and Income Limits | |
| Medicaid Expansion | No |
| Medicaid Family Planning Program | No—Instead, Missouri operates an entirely state-funded program that provides family planning services to uninsured women ages 18-55 with incomes up to 206% FPL. Women losing Medicaid postpartum are also eligible |
| Medicaid Income Eligibility for Childless Adults, 2019 | 0% FPL |
| Medicaid Income Eligibility for Pregnant Women, 2019 | 305% FPL |
| Medicaid Income Eligibility for Parents, 2019 | 21% FPL |
| NOTE: The federal poverty level for a family of three in 2019 is $21,330.SOURCE: KFF State Health Facts, Medicaid and CHIP Indicators. | |
Missouri chose not to adopt the Affordable Care Act’s Medicaid expansion. Medicaid enrollment has declined dramatically over the past year, causing coverage gaps and discontinuity of care for women and children. Missouri’s Medicaid program (Table 1), MO HealthNet, covers parents with incomes under 21% of the Federal Poverty Level (FPL), and pregnant women up to 305% FPL under the Children’s Health Insurance Program (CHIP) “unborn child” option (Show-Me Healthy Babies).13 Adults who are not parents are not eligible unless they are low-income and seniors or have a disability. Missouri’s Women’s Health Services program provides family planning services for women ages 18-55 who are ineligible for full Medicaid, with incomes up to 206% FPL, as long as they seek care at a family planning provider that does not also offer abortion services. Coverage gaps for women who do not qualify for Medicaid or who lose coverage due to small changes in income disrupt continuity of care and create barriers to family planning and other health care services (Figure 2). MO HealthNet enrollment declined roughly 9.5% from May 2018 to May 2019 (Figure 3), the steepest drop in Medicaid and CHIP coverage across all states. Missouri’s state government argues this decline is due to improvement in the economy, but a study by the Center for Children and Families at the Georgetown University Health Policy Institute suggests it resulted at least in part from flawed redetermination processes.
“In a state with high rates of maternal mortality and unintended pregnancy, [lack of Medicaid expansion] undermines women’s ability to have LARC [long-acting reversible contraception] if she wants it.”
–Ob-Gyn at a St. Louis hospital
In St. Louis City and County, uninsured adults living at or below 100% FPL, who do not qualify for Medicaid, can apply for the Gateway to Health program, a federal demonstration program that provides temporary coverage. Benefits include primary care, generic prescriptions, substance use treatment, and specialty care referrals to contracted health centers. There are no premiums and copays are no more than $3.00.
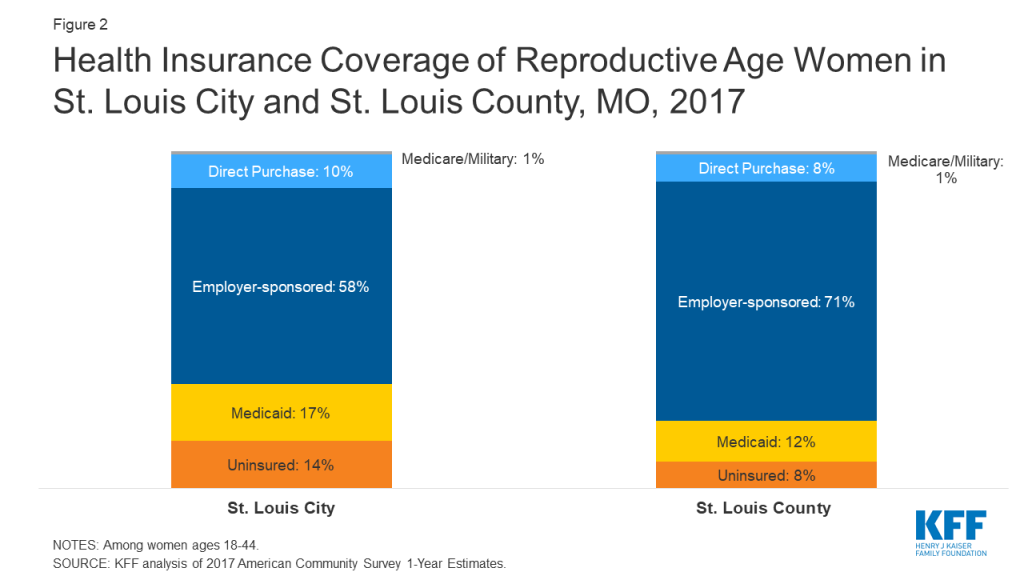
Lack of Medicaid expansion creates barriers to postpartum care. Missouri’s Medicaid income eligibility threshold for parents (21% FPL) is considerably lower than for pregnant women (305% FPL). Pregnancy-related coverage ends 60 days after delivery, so many poor women whose incomes exceed the 21% FPL threshold for parents (roughly $4,500 a year for a family of three) lose coverage two months after delivery. Furthermore, women with incomes below the federal poverty level are not eligible for subsidies to purchase private coverage through the ACA’s health insurance marketplace, meaning that many poor women do not have a pathway to coverage and become uninsured. One provider lamented that they are only able to see women once they are pregnant, but then must “drop them when they lose coverage.” There is no automatic enrollment into the state-funded family planning program for women who lose full Medicaid coverage, leaving many low-income women without coverage for needed contraceptive services after they have a baby. Providers suggested that the Federally Qualified Health Centers (FQHCs) in the area are positioned to provide ongoing care to women who lose their Medicaid coverage, but reported some FQHCs are facing steep financial challenges. In July 2019, the state announced plans to submit a Section 1115 Demonstration waiver to CMS that, if approved, would allow low-income women who have recently given birth and are diagnosed with a substance use disorder (SUD) to maintain coverage for SUD and related mental health treatment, including transportation to appointments, for up to 12 months following the end of their pregnancy benefits.
“You can’t optimize someone’s health care in nine months.”
–Dr. Melissa Tepe, VP/CMO, Affinia Healthcare
State policies bar Medicaid reimbursement for services obtained from providers who offer or are affiliated with abortion services. This reduces access to contraception for low-income women. To exclude abortion providers from participating in its Medicaid family planning program, in 2016, Missouri replaced its federal family planning waiver program with a state-funded family planning program called the Women’s Health Services Program. This program denies reimbursement to any organization that performs or counsels on abortion regardless of the other services that are provided. Additionally, in 2018, Missouri enacted legislation that denies Medicaid reimbursement to abortion facilities or their affiliates regardless of the other services that are provided.
Planned Parenthood of the St. Louis Region (PPSLR) had not received reimbursement for any of the Medicaid beneficiaries they served since July 2018, which makes up a significant portion of their budget. However, a state court judge ruled in June 2019 that Missouri unlawfully restricted Medicaid payments to abortion providers for non-abortion services and ordered the state to restore reimbursements to PPSLR.14 Medicaid reimbursement restrictions also create confusion among health care providers, which one interviewee suggested causes fewer providers to participate in the state family planning program even if they are qualified. Between June 2018 and May 2019, enrollment in the Women’s Health Services Program dropped by almost 12,000 members, or almost 19% (Figure 3).
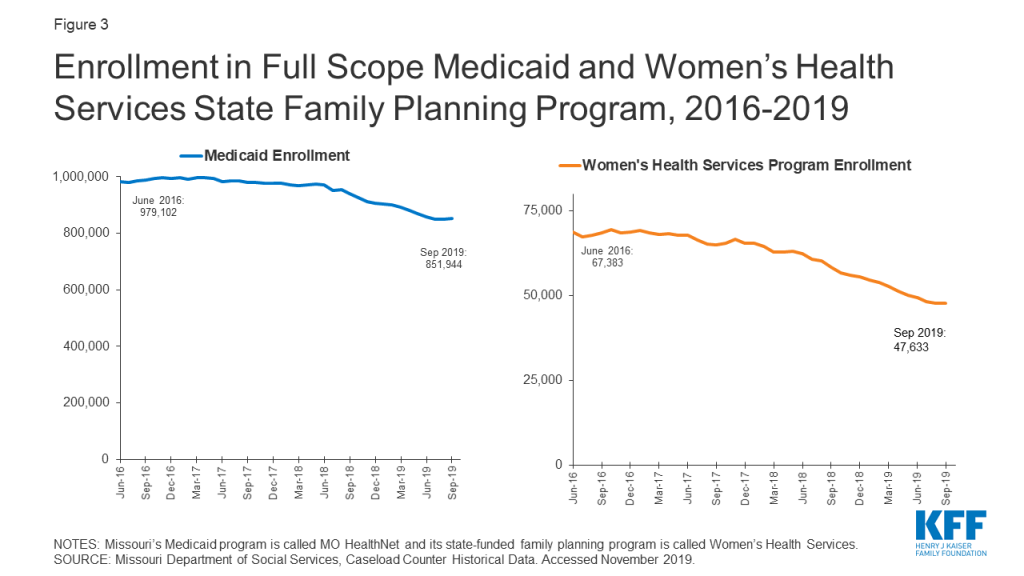
These policies also threaten the financial stability of clinics that provide free or affordable contraception to low-income women, even if they do not provide abortion. For example, the Contraceptive Choice Center (C3), part of the Washington University School of Medicine in St. Louis, was excluded from the state family planning program due to its affiliation with a hospital that provides abortions in cases of severe fetal anomalies or when a woman’s life is in danger.
The state’s Title X clinics may be strained after the Trump Administration’s new program rules are fully implemented. In addition to Medicaid, funds from the federal Title X family planning program support clinics that provide services to low-income women. In March 2019, the Trump Administration issued new rules barring Title X funding from organizations that provide or refer for abortion. At that time, a C3 clinic interviewee stated that should the new rules be implemented, the clinic may have to shut down entirely. Since the time of the interview, the rule has gone into effect and Planned Parenthood has withdrawn from Title X nationwide; the effect on C3 remains to be seen.15
Focus group participants cited cost as a major barrier to health insurance coverage and care. Most focus group participants reported that they are getting their basic health needs met, but a few uninsured women are going without some types of health care such as preventive care, dental care, mental health services, or their preferred method of contraception. For uninsured women, the cost of birth control ranged from $25 to $48 per month. One focus group participant said she wanted to change methods but could not afford the $170 appointment to have her intrauterine device (IUD) removed, and another could not afford a tubal ligation she desired.
Initiative: Contraceptive CHOICE Center (C3)
The Contraceptive Choice Center (C3) grew out of a cohort study that provided no-cost reversible contraception to almost 10,000 women in the St. Louis area over the course of 2-3 years. The goal was to increase uptake of long acting reversible contraception (LARC) and decrease unintended pregnancy using a patient-centered approach and comprehensive counseling. Program evaluation documented a reduction in teen pregnancy, births, and abortions in the cohort from 2006 to 2010. C3 is now a Title X grantee providing comprehensive gynecological and family planning services with sliding scale fees for low-income women. They receive 2,500-3,000 visits a year, with one third of patients uninsured, and a quarter covered by Medicaid. Most (60%) of their patients are below 100% FPL and qualify for care at no cost.
Provider Distribution and Religious Health Systems
Provider distribution remains a problem in the St. Louis area, especially in low-income areas, and the prevalence of faith-based hospitals may cause delays in care. While overall there are sufficient numbers of providers offering affordable contraceptive and pregnancy-related care, maldistribution of providers translates into access problems for many women.
While interviewees reported there are enough providers of publicly-funded contraception within the city limits, they do not feel that they are distributed equitably throughout the county. Interviewees identified provider shortages in North City and North County, areas that are majority low-income and African American, and in other pockets of poverty throughout the county. There are four Title X providers in St. Louis, but there is no public hospital in the area; this need is primarily filled by private or faith-based hospitals. Some reported that there is also a lack of providers trained in long acting reversible contraception (LARC) insertion in publicly funded clinics.
Several health care leaders stated that there is insufficient capacity to meet the demand for sexually transmitted infection (STI) testing and treatment in the face of high and increasing rates of syphilis, chlamydia, and gonorrhea. Following nationwide trends, rates of STIs are increasing in St. Louis, with the highest prevalence among people living with HIV, African Americans, and youth ages 16 to 24. Access to STI testing and treatment is limited by a lack of affordable providers and decreasing federal and state funding. After the city health department closed its STI clinics in the early 2000’s, the county clinic in North County became the only public provider in the area, with lines out the door on most of their STI clinic days. Focus group participants reported that men in particular are not receiving adequate STI testing and treatment services because they are not as connected with the health system and usually ineligible for Medicaid. Therefore, most are not getting preventive care or education about STI prevention, which reduces the likelihood they will seek treatment if they have an infection.
Interviewees and focus group participants felt that there was generally an adequate supply of providers for pregnancy and postpartum services in the St. Louis region and that access was better than in the rest of state. Overall, women participating in the focus group participants reported having positive experiences at the hospitals where they received maternity care and felt their physicians understood their cultural beliefs. They also reported their physicians discussed contraceptive options with them during the 6-week postpartum visit. The County Health Department is a service site for the Nurse Family Partnership program, one of the local programs that makes home visits to low-income first-time mothers and has been effective in improving the utilization of contraceptives during the postpartum period.
Religious health systems do not offer most methods of contraception, but clinicians affiliated with those systems often refer to other providers for a broader range of options. Most focus group participants had received care from one of the area’s many Catholic hospitals, and they did not report any significant impact on their reproductive health care. Although they knew that these hospitals would not perform tubal ligations, they said that their physicians shared information about contraceptive methods and would provide referrals to other hospitals or clinics where they could obtain these services. None of the women knew that there was a non-religiously affiliated hospital in the area. Community stakeholders similarly reported that individual providers affiliated with religious health systems may refer to other providers for contraceptive services not permitted by their institution.
Certain hospitals won’t even allow [tubal ligation] …So you can’t have it there, so if you want your doctor to do it you have to find a way for your doctor to do it at another facility that will allow it to happen.”
–Focus group participant
Initiative: Enhanced centering pregnancy pilot
Enhanced Centering Pregnancy is a group prenatal care pilot program. The program seeks to increase the availability of trauma-informed care, address racism and bias in the health care system, and integrate behavioral and medical services to improve outcomes for pregnant women in the St. Louis region. St. Louis Integrated Health Network is leading this two-year initiative in partnership with Affinia Healthcare, two local hospitals (Barnes Jewish and SSM Health St. Mary’s), and community health centers.
Contraceptive Provision, Access, and Use
Overall, interviewees felt that women living in the St. Louis region can obtain their preferred method of contraception, but cited barriers related to transportation and poverty. They also noted that a lack of comprehensive sex education can impede knowledge of the full range of methods. Several promising efforts are underway to address these barriers and improve access for low-income women.
Family planning providers offer a wide range of contraceptive choices including IUDs and implants, but certain Medicaid policies challenge their ability to offer same-day or timely access to LARCs. Most providers reported they offer comprehensive family planning services. Missouri’s state Medicaid program covers LARC at the time of delivery with a separate provider reimbursement to promote immediate postpartum LARC insertions. Interviewees reported, however, that some hospitals are not aware of this policy or need additional training in LARC insertion to make this option fully available after delivery. Furthermore, several providers noted that Medicaid policies governing payment for LARC cause delays that prevent same-day access. These policies include preauthorization and utilization requirements that limit a patient to one LARC device per FDA-approval period for the device (e.g. up to five years for a Mirena IUD), and policies tying LARC devices to a specific patient. As a result, most patients must return for a second appointment to get their device inserted, and many interviewees reported instances of patients missing appointments or getting pregnant before they are able to return. One focus group participant explained she had to wait three months for her IUD to be delivered because of Medicaid’s pre-authorization requirement. Many clinics cannot afford the high upfront costs to stock LARCs onsite, which would facilitate same-day access for women seeking those methods. In 2018, legislation was passed that allows a provider to transfer a new, unused LARC to a different MO HealthNet patient instead of discarding it. However, one provider noted that there were not yet any guidelines from the state to define or help facilitate that process.
“Sometimes we give someone a depo shot to bridge someone who wants a LARC – would be more cost effective to just give them the LARC upfront. There are better ways to give people what they want when they want it, but there are too many barriers.”
–Dr. Katie Plax, Medical Director, Supporting Positive Opportunities with Teens (the SPOT)
While most focus group participants reported that they can get contraception, many described barriers to getting the methods they want, when they want them. Several focus group participants said they are happy with the treatment they receive from their providers when seeking contraception and are familiar with a wide range of contraceptive methods. However, it can take multiple visits and long wait times between appointments is common. One woman who now goes to a public health clinic after losing her private insurance said she has been waiting months for an appointment because of staff shortages due to furloughs. Several focus group participants had experienced negative side effects from hormonal methods that resulted in their changing or discontinuing contraception. Focus group participants were knowledgeable about emergency contraception, and four had used it in the past. They said it is available at drug stores, but that they must ask for the pharmacist to take it out of a locked case, creating additional barriers to access.
Some low-income women experience financial, logistical, and language barriers to accessing family planning services. Poverty and other socioeconomic factors also affect sexual health outcomes. Interviewees noted a lack of reliable public transportation, scheduling conflicts, long waiting times for appointments, and lack of interpretation services as barriers to care. Providers stated that the safety net was over capacity, with six to eight-week wait times for a women’s health appointment for new FQHC patients. One focus group participant liked that her usual place of care had extended hours during the evening, so she could go after work. Factors such as unstable housing, lack of transportation, poverty, and a lack of education were raised as challenges for low-income women, and these are fundamentally intertwined with sexual and reproductive health services.
“People don’t like to think that housing and sexual health are related, but I have patients who are trading sex for a roof over their head–both men and women.”
–Dr. Katie Plax, Medical Director, the SPOT
Clinicians face time constraints during family planning visits, and some are influenced by their own beliefs or outdated standards of care. Several clinic staff mentioned that clinicians do not have enough time to provide in-depth contraceptive counseling given the clinic flow and the level of demand. Likewise, focus group participants reported that the physicians are too busy to spend much time with them. Lack of provider training and misinformation also impede family planning access, especially around LARC provision. Some providers still adhere to outdated protocols restricting IUD use for women who have not had children. Others may not be providing comprehensive counseling on the full range of methods due to their own cultural or religious beliefs. One interviewee reported that there may be variation within organizations, with pushback from some individual providers and nursing staff regarding the use of LARCs or emergency contraception.
“It takes time to fully counsel someone on birth control, birth spacing, the most effective method, side effects, and patient preference. I would prefer to spend more time counseling on different methods than on talking about costs and completing paperwork.”
–Dr. Melissa Tepe, VP/CMO, Affinia Healthcare
Initiative: The Right Time
Launched in April 2019, the Right Time is a six-year, state-wide initiative, led by the Missouri Family Health Council and funded by the Missouri Foundation for Health. It focuses on reducing cost barriers to family planning, increasing the quality and availability of contraceptive services, and reducing disparities among low-income women, women of color, and those living in rural areas. The program’s ultimate goal is to reduce Missouri’s unintended pregnancy rate by 10% by 2024. Three of the first six health centers in the state selected to participate are in St. Louis City.
Sex Education Policy and Provision
Sex education in schools is not mandated and varies by district. “Abstinence-plus” is the most common approach. In 2007, Missouri passed a law that prohibited school districts from allowing a person or an organization to offer sex education or related materials to its students if they provide or refer to abortion services. One interviewee said that this policy leads to a lot of confusion and individual interpretation at both the administrative and teacher level. It also opens the door for faith-based organizations, such as Crisis Pregnancy Centers (CPCs), which often do not offer a medically-accurate, comprehensive curriculum, to step in. While parent pushback resulted in some schools no longer using CPCs to provide sex education, other schools reportedly continue to use “abstinence only” education or “abstinence-plus” curricula, which stress abstinence but also include information on contraception and condoms. PPSLR offers comprehensive sex education at no cost to hundreds of partners a year, but interviewees say the rule barring abortion providers from offering sex education in schools has a chilling effect despite their legal separation from Reproductive Health Services (RHS), the Planned Parenthood clinic that conducts abortions. Interviewees and focus group participants agree that as a result, youth are not adequately informed of sexual health risks or ways to prevent unintended pregnancy and STIs. Focus group participants believed that most young women rely on their friends for information, and that the gaps in sex education results in teen pregnancies.
“Women are bombarded with a wealth of misinformation, so it’s hard to know what is true and whom to trust.”
–Michelle Trupiano, Executive Director, Missouri Family Health Council, Inc.“Lack of awareness leads to a lack of access.”
–Thomas McAuliffe, Director of Health Policy, Missouri Foundation for Health
Initiative: Supporting Positive Opportunities with Teens (SPOT)
The SPOT is a freestanding site that provides teen-friendly health care, mental health care, and express STI testing at no cost, as well as case management to address social determinants of health. They also have a school-based health center (SBHC) in a North County public high school, which is one of the first comprehensive SBHC programs in the area. The SPOT served 3,253 St. Louis teens in 2018 (80% Black, 17% LGBT, and 2-3% transgender and gender nonconforming youth).
Access to Abortion Counseling and Services
Abortion is highly regulated in Missouri, and women face significant barriers to accessing abortion counseling and services.
The only clinic that provides abortions in the state of Missouri is in St. Louis. Women are increasingly crossing state lines to seek services at clinics in Illinois where there are fewer state restrictions. As of November 2019, RHS of PPSLR, located in the city of St. Louis, is the only clinic providing abortions in Missouri, down from three clinics in 2018.16 ,17 Notably, there is no access to medication abortion in Missouri. RHS provides surgical abortion services, but stopped providing medication abortion because Missouri regulations require providers to conduct a pelvic exam prior to medication prescription; RHS providers consider this medically unnecessary and unethical. Instead, they refer women seeking medication abortion to a Planned Parenthood clinic in Illinois. Consequently, more women are reportedly going across the river to the Planned Parenthood and Hope Clinic for Women, an independent provider, in Illinois, where there are fewer state restrictions including no waiting period. Planned Parenthood is expanding services in their southern Illinois facility to help meet demand for the surrounding region. While access is difficult in St. Louis City and the surrounding county, interviewees agree that access is significantly harder in the rest of the state where there are no nearby abortion providers, and women may have to travel up to five hours to St. Louis for care.
“I’ve seen clinics close. I used to have a Planned Parenthood down the way from me and it’s gone. I don’t know, I can’t even tell you how long it’s been gone now. I couldn’t tell you where the closest one is, if I needed to go to one.”
–Focus group participant“Either we will end up in Handmaid’s tale or people will actually get out in the street and fight against these processes.”
“We are hopeful for St. Louis only because it has bridges into Illinois, which is moving in the other direction.”
–Dr. David Eisenberg, former Medical Director, Planned Parenthood of the St. Louis Region
Focus group participants reported that cost is the largest barrier to abortion care but that many other abortion-specific restrictions also make abortion access challenging. Focus group participants said the cost for the abortion pill is between $500 and $600, and surgical abortion costs around $700, making it out of reach for many women. They also cited other barriers such as transportation, a shortage of providers, and regulations such as the 72-hour waiting period, mandated informed consent counseling, parental consent for minors, and gestational age limits. Some focus group participants felt the state-mandated counseling was intended to make them second guess their own decisions. A few focus group participants were well informed about the state’s abortion laws, and most felt that it was getting harder to get an abortion in Missouri. Some women said they have gone to neighboring clinics in Illinois where there are fewer restrictions.
The volume of state and federal restrictions on abortion have a profound impact on providers and the low-income women they serve. Providers reported that the 72-hour waiting period coupled with the rule that requires the same physician to conduct the informed consent and the procedure three days later are especially burdensome. As a result, RHS had to reconfigure their scheduling to accommodate these policies, losing four providers who could no longer fit it into their schedule. The new Title X rule, which blocks funding for family planning providers who refer women for abortions, is confusing to providers regardless of whether they participate in the Title X program; they reported that when the rules constantly change, they are wary of even providing a referral for abortion. One interviewee reported that FQHC providers have been told never to talk about abortion and are worried about doing anything that would put their federal funding in jeopardy.18 One provider noted that the media mainly discuss the rule’s impact on Planned Parenthood affiliates but believes there would be a much more dramatic effect on other providers, either because they would not want to comply with the rules and choose not to participate in the Title X program, or they were not able to participate. This would mean that they would lose an important source of funding to provide family planning services to poor and uninsured women.
“When there are rules and the rules constantly change, a provider will not feel comfortable giving information about access to abortion or even to do referrals [to make sure you are not breaking the law with penalties that now can include criminal charges].”
–Dr. Katie Plax, Medical Director, the SPOT
Abortion providers and women who utilize their services feel stigmatized and sometimes fearful by the political and social barriers they face in providing and seeking abortion care. Stigma, intimidation, and fear about confidentiality serve as major barriers to women seeking abortion services. There are protestors outside PPSLR and RHS daily, and focus group participants reported that these protestors make them feel afraid and ashamed of their decisions. Crisis pregnancy centers (CPCs), which typically offer limited medical services like pregnancy tests and ultrasounds, and discourage women from seeking abortion, have a large presence in the area. Abortion providers also face a series of obstacles, including myriad state restrictions (see Appendix) and significant cultural and political stigma. One clinician noted she chose not to provide abortion services because the associated stigma would make it difficult for her to be effective in other areas of health care and state health policy due to the political environment. Another interviewee said their organization is seeking long-term political solutions such as the “Clean Missouri” bill that addresses gerrymandering in the state to help elect officials who are supportive of reproductive health and abortion services.
“It’s only one location and, I mean on some days it’s probably even scary to walk in a location that’s full of people with signs out.”
–Focus group participant“Speaking for myself, it’s hard to talk about abortion because of the stigma and politics surrounding it. It is framed in a way that it is difficult to talk about without feeling guilty or uncomfortable…We should frame it around health, women’s empowerment, caring and supporting women, interpregnancy care and planning, and supporting families after a baby is born.”
–Dr. Melissa Tepe, VP/CMO, Affinia Healthcare
Conclusion
While St. Louis has an extensive network of family planning and maternity providers, women who live in the poorest areas of the city and county are especially disadvantaged due to the dearth of providers in their communities and the lack of reliable public transportation to clinics in other areas. Several organizations in the region have undertaken efforts to expand access to contraception, especially to highly-effective, long-acting methods such as IUDs and implants. However, there is a large contrast between the efforts to improve access in St. Louis and state-level policy decisions that have targeted family planning providers that also offer or are affiliated with abortion providers. Providers said that these policies limit their ability to participate in programs like the state family planning program and Title X. The state’s decision not to expand Medicaid and recent efforts to further restrict access to abortion have not only significantly reduced the availability of abortion services, but also have had an impact on contraceptive access, STI care, and other basic health services. More women are reportedly choosing to travel to Illinois for abortion services, where they have far fewer restrictions on abortion.
Acknowledgements
The authors thank all of the interviewees for their insights, time, and helpful comments. All interviewees who agreed to be identified are listed below. The authors also thank the focus group participants, who were guaranteed anonymity and thus are not identified by name.
Meg Boyko, Executive Director, Teen Pregnancy & Prevention Partnership
David Eisenberg, Board-Certified Ob-Gyn and Former Medical Director, Planned Parenthood of St. Louis Region (PPSLR)
Linda Locke, Board President, (PPSLR)
Tessa Madden, MD, MPH, Contraceptive Choice Center (C3), Washington University School of Medicine
Katharine Mathews, MD, MPH, MBA, Associate Professor and Research Division Director, Department of Obstetrics, Gynecology, and Women’s Health, Saint Louis University School of Medicine
Thomas McAuliffe, Director of Health Policy, Missouri Foundation for Health
Tim McBride, PhD, Professor and Co-Director of Center for Health Economics and Policy, Institute for Public Health, Washington University in St. Louis
Colleen McNicholas, DO, Chief Medical Officer, PPSLR
Katie Plax, MD, Medical Director, Supporting Positive Opportunities with Teens (The SPOT), Washington University in St. Louis
Angie Postal, Vice President, Education, Policy, and Community Engagement, PPSLR
Becky Schrama, MA, BSN, RN, Public Health Nursing Manager, St. Louis County Department of Public Health
Melissa Tepe, MD, MPH, FACOG, VP/CMO at Affinia Healthcare, St. Louis, MO
Michelle Trupiano, MSW, Executive Director, Missouri Family Health Council, Inc.
Appendix
| Missouri State-Level Policies Related to Abortion |
|
|
|
|
|
|
|
|
|
|
| SOURCE: KFF, State Health Facts, Abortion Statistics and Policies. Guttmacher Institute, State Facts About Abortion: Missouri. |
Crow Tribal Reservation, Mt
KFF: Usha Ranji, Michelle Long, and Alina SalganicoffHealth Management Associates: Rebecca Kellenberg, Carrie Rosenzweig, and Sharon Silow-Carroll
Introduction
The Crow reservation is the geographically largest Native American reservation in Montana, and home to approximately 8,000 members of Crow Nation, about 75% of the total enrolled membership. Located about 60 miles southeast of Billings, the reservation covers most of Big Horn County, but a small portion extends into Yellowstone County. The Crow Tribal Council governs the Nation, and Indian Health Services (IHS) is responsible for providing health services, although other coverage options and providers are also utilized. Montana offers coverage for reproductive health services for low-income women through its Medicaid expansion program19 and its Plan First family planning Medicaid waiver. These programs have had a significant impact in a community with high unemployment and poverty rates (Figure 1) and where stark health disparities between the white and Native American populations persist.
Although Montana maintains many policies that protect access and coverage for reproductive health services, Crow women living on the reservation face sociodemographic, systemic, and cultural barriers that prevent many from readily accessing services. In many parts of the reservation, the nearest health care provider is an hour drive away; yet, transportation is not readily available in this low-income, rural community, which is federally-designated as medically underserved and as a health professional shortage area. IHS operates a hospital and two health clinics on the reservation, but a legacy of mistrust of IHS, long wait times, and confidentiality concerns prevent some Crow women from using their services. Some of these themes, particularly concerns about confidentiality, are common in small, rural communities across the country, and are not limited to the Crow reservation. While IHS offers a wide range of services including behavioral health, obstetrics and gynecology (Ob-Gyn), dental care, and surgery, pregnant women must transfer to Billings for labor and delivery. Traditional and religious beliefs prevent many Crow women from talking openly about sexual health, which may contribute to high rates of sexually transmitted infections (STIs) and teen pregnancy, and many consider abortion taboo or do not consider it an option when faced with an unplanned or unintended pregnancy.
This case study examines access to reproductive health services for low-income residents of the Crow reservation, Montana. It is based on semi-structured interviews conducted June–July 2019 by staff of KFF and Health Management Associates (HMA) with a range of local safety net clinicians and clinic directors, social service and community-based organizations, researchers, and health care advocates. We also conducted a focus group with low-income women. Interviewees were asked about a wide range of topics that shape access to and use of reproductive health care services in their community, including availability of family planning and maternity services, provider supply and distribution, scope of sex education, abortion restrictions, and the impact of state and federal health financing and coverage policies locally. An Executive Summary and detailed project methodology are available at https://www.kff.org/womens-health-policy/report/beyond-the-numbers-access-to-reproductive-health-care-for-low-income-women-in-five-communities.
Key Findings from Case Study Interviews and a Focus Groups of Low-income Women
- Coverage – Montana’s decision to expand Medicaid has led to increases in coverage rates, especially assisting Native Americans. While members of the Crow tribe can access care free of charge at IHS clinics, Medicaid plays an important role in providing additional funding to IHS and expanding access to a wider range of services provided by non-IHS providers. The state’s Medicaid-funded family planning program for low-income women, Plan First, is an important source of coverage for reproductive health care, including contraception and STI testing.
- Provider distribution – Interviewees said that there are not enough providers to meet the need for publicly-funded contraceptive and pregnancy care, particularly on the reservation. IHS does not perform deliveries, so pregnant women are referred to providers in Billings at 30 weeks gestation. Lack of transportation in this large, rural region is a major barrier to accessing care.
- Contraceptive access – Contraceptive care for low-income women is available at IHS and other providers in Billings and Hardin, MT. However, cultural beliefs, lack of awareness of, and historical mistrust in health care providers among the Crow population are barriers to care. High poverty rates, limited affordable housing, lack of vocational training and employment opportunities, and other socio-economic stresses lead some women to prioritize competing needs over health care and family planning services.
- Sex education – The Crow tribe has strong cultural traditions and religious beliefs related to gender roles. Grandmothers play a central role in families and often raise grandchildren, but many topics of sexuality are considered taboo. Schools have offered some sex education in lower grades and in high school, but not consistently.
- Sexual and domestic violence – The Crow tribe has a history of sexual abuse and domestic violence dating back to colonization and forced placement of Native American children in boarding schools. Provider interviewees reported that the IHS hospital has Sexual Assault Nurse Examiner (SANE)-trained nurses in the emergency department and that all staff have been trained in trauma-informed care. Interviewees also discussed the importance of having female providers to reduce barriers for victims seeking family planning and reproductive health care.
- Abortion access – Community providers and focus group participants reported that most Crow families are strongly opposed to abortion due to strong spiritual beliefs, and therefore are reluctant to talk openly about the topic. This may limit knowledge about what services are available and legal. As a federal program, IHS is not permitted to provide or pay for abortion services. There are two Planned Parenthood clinics that offer abortion services in the Billings area, at least an hour away.

Indian Health Service and Medicaid Coverage
Medicaid expansion has played a significant role in improving coverage rates for Native Americans in Montana, which has allowed Crow tribal members to access a broader set of services and providers beyond those available at IHS. The additional funding provided through the expansion program has also allowed IHS Service Units to expand their scope of services, a move that is essential to addressing the tremendous disparities in health for native women of reproductive age.
| Table 1: Montana Medicaid Eligibility Policies and Income Limits | |
| Medicaid Expansion | Yes |
| Medicaid Family Planning Program Eligibility | 216% FPL |
| Medicaid Income Eligibility for Adults Without Children, 2019 | 138% FPL |
| Medicaid Income Eligibility for Pregnant Women, 2019 | 162% FPL |
| Medicaid Income Eligibility for Parents, 2019 | 138% FPL |
| NOTE: The federal poverty level for a family of three in 2019 is $21,330.SOURCE: KFF State Health Facts, Medicaid and CHIP Indicators. | |
The Indian Health Service (IHS) provides health care services to Native Americans, including the Crow tribe, at no-cost. Nationwide, IHS services are administered through 12 area offices and 170 IHS and tribally managed service units, and 41 urban Indian health programs including hospitals, health stations, and clinics. As of April 2019, IHS served 2.56 million Native Americans. The Crow Service Unit has three sites on the reservation: the Crow/Northern Cheyenne Hospital located at the Crow Agency headquarters, the Lodge Grass Health Clinic, and Pryor Health Station. There is also an Urban Indian Health and Wellness Center in Billings. Because IHS-funded services are paid in full by the federal program, focus group participants expressed that out-of-pocket cost is not an issue for them despite high levels of poverty on the reservation. However, IHS staff did discuss that overall funding is often limited.
Medicaid expansion and changes in Purchased/Referred Care reimbursement policy have supported increased access to health care and reproductive health care services. In 2015, the Montana legislature passed the bipartisan Health and Economic Livelihood Partnership (HELP) Act, extending Medicaid coverage (Table 1) to adults with incomes up to 138% of the federal poverty level (FPL). As of 2018, an additional 15,495 Native Americans gained Medicaid coverage through the expansion program in Montana. Expanded Medicaid coverage has allowed Native Americans throughout the state to seek a broader range of services from any provider that accepts Medicaid, allowing them more flexibility and choice in their provider and the care they receive. The increase in Medicaid coverage has also provided a significant influx in funding for Indian Health Service units, which can bill for services provided to Medicaid-enrolled Native Americans with a 100% federal matching rate. Importantly, in addition to the services that IHS facilities and tribal health departments can provide directly, they can also refer patients to additional services at non-tribal providers through the Purchased/Referred Care (PRC) Program. As a result, Native Americans, including Crow tribal members, now have greater access to reproductive health care, including fertility treatment, which is not provided within the IHS system. Approximately 35% of patients at Planned Parenthood of Montana in Billings are covered by Medicaid expansion or the state’s family planning waiver program, Plan First.
“Medicaid expansion has had a large impact for women here.”
–Lucille Other Medicine, Program Assistant, Messengers for Health“With expanded Medicaid, there is a newly liberated set of patients that can choose where they go. We have seen a huge increase in patients coming to our clinic now.”
–Dr. David Mark, CEO, Bighorn Valley Health Center
Provider Distribution
The Crow Agency IHS Service Unit employs one Ob-Gyn and one midwife, who are the only family planning providers in the community. A shortage of providers on the reservation and lack of transportation are barriers to accessing care in a timely manner. Many women seek care at one of the non-IHS clinics off the reservation in nearby Hardin or farther away in Billings.
Provider recruitment and retention is a key challenge both on and off the Crow reservation. Interviewees reported a significant staffing shortage at the Crow Indian Health Service, not only in obstetrics and gynecology, but also in behavioral health and nursing. IHS is in the process of building a housing unit for staff across from the hospital, which they hope will draw more providers to work there. Planned Parenthood in Billings also reported staffing challenges due to competition with other health care providers in the area. Staffing shortages mean the Planned Parenthood clinic must shorten their hours, limiting availability for working women who can often only come in the evening and on the weekends.
Publicly-funded contraceptive services are available on the Crow reservation, but some women experience barriers to obtaining timely services. The Crow-Northern Cheyenne Hospital offers a broad range of services including behavioral health, Ob-Gyn, dental care, and surgery. All three of the IHS locations also provide family planning services, including STI testing and treatment, and on-site insertion of implants and IUDs (at the hospital and Lodge Grass clinic). Sterilization services are not provided, but IHS clinicians said they will refer patients seeking sterilization to providers in Billings. While some providers are able to see patients on the same day the appointment is made, some interviewees noted they double and triple book appointments to account for no-shows. Several focus group participants reported experiencing long waiting room times.
“You can go to IHS for birth control, but you have to show up when it opens to make sure you get an appointment that day.”
–Focus group participant
There are several other key health care providers serving the Crow population. In nearby Hardin (13 miles away), the Bighorn Valley Health Center’s (BVHC) client population is roughly two-thirds Native American, 80% of whom are Crow, and the clinic offers the full range of contraceptive methods and STI testing and treatment. In addition, the Billings Urban Indian Health and Wellness Center, approximately 60 miles away in Billings, operates as part of the federal Urban Indian Health Program as a nonprofit, full-service medical clinic. They provide low- and no-cost health services including oral contraceptives, STI testing and treatment, and free transportation to and from the Crow-Northern Cheyenne Hospital and Pryor Health Station. The Yellowstone County Health Department and multiple primary and specialty care providers are also in Billings, in addition to two Planned Parenthood clinics offering the full range of contraceptive options and abortion services. BVHC and Planned Parenthood were the only clinics in the area receiving federal Title X family planning funds. However, at the time of this site visit, interviewees noted that if the Trump administration’s Title X rule changes take effect, Planned Parenthood will have to leave the program. Subsequent follow up calls with Title X providers found that this requirement has been challenging, and on August 19, 2019, Planned Parenthood formally withdrew from the Title X program nationally following implementation of the rule.
Crow women may go to Crow-Northern Cheyenne Hospital for prenatal care, but the hospital does not offer labor and delivery services. Some Crow women travel to non-IHS providers in Billings for all of their pregnancy care. There is one Ob-Gyn physician at Crow-Northern Cheyenne Hospital. However, the hospital is not approved for labor and delivery services, so women living on the reservation are referred to Billings after 30 weeks gestation, which can be more than an hour drive away. In emergency situations, women have delivered at the emergency room of Big Horn County Memorial Hospital in Hardin. Several focus group participants shared stories of women they knew who had experienced pregnancy loss or preterm births because they were not able to detect a problem with the pregnancy early enough. Although the Crow-Northern Cheyenne Hospital did not have an ultrasound technician at the time of the site visit, they have since hired someone for this position. Historically, midwifery was a common practice within the Crow tribe20 , but none of the focus group participants had used a midwife. One interviewee noted that St. Vincent in Billings has an active midwifery clinic and provides prenatal care to many women in the area. IHS is also working to restart their midwifery program at the Crow-Northern Cheyenne Hospital. The hospital employs one female midwife who is available for family planning services and has plans to hire another. Transportation is a significant barrier for women traveling for prenatal or pregnancy-related services. Some focus group participants noted they try to use the Crow Transit bus, but it leaves Crow Agency (the seat of the reservation) once a day at 6:00 am and is reportedly unreliable. In addition, many areas of the reservation are over an hour away from Crow Agency. Medicaid will pay for transportation costs for pregnancy care, but that is of little use if reliable transportation is unavailable. One focus group participant said she has had to hitchhike to and from Billings to get to her health care appointments.
“There is a lack of providers and care continuity – women get confused because they do not see the same provider throughout their pregnancy or for other health services and they do not communicate with each other.”
–Lucille Other Medicine, Program Assistant, Messengers for Health
Several statewide and Crow-specific maternal health programs have existed in the past. The state used to administer the Montana Initiative for the Abatement of Infant Mortality (MIAMI) Project to increase access to prenatal, delivery, and postpartum care for high-risk pregnant women and their infants. Additionally, the Crow Healthy Mothers and Healthy Babies program previously provided outreach and education to pregnant women. Recently, the Montana Healthcare Foundation has supported Native American perinatal behavioral health program development efforts statewide, but it is unknown how this will impact the Crow tribe. BVHC provides fully-integrated care for pregnant women including access to substance use treatment with on-site behavioral health providers.
Initiative: Crow Indian Health Service Maternal Child Health Coordinator
The IHS Crow-Northern Cheyenne Hospital recently hired a Maternal Child Health (MCH) Coordinator to increase utilization of prenatal care and prepare for when the hospital is approved to begin deliveries again. In this role, the MCH Coordinator performs prenatal intake and education, arranges for Medicaid-funded breast pumps, labs, and ultrasounds, and provides case management and postpartum contraception.
Substance Use Disorder and Pregnancy
Substance use disorder is a serious concern on the Crow reservation, and a recent policy announced by the Big Horn Attorney’s office to “crack down” on pregnant women using drugs or alcohol has made outreach and engagement even more difficult. Interviewees reported high rates of substance use among youth and adults on the reservation. Focus group participants explained that children whose parents have substance use disorders (SUD) are often sent into foster care out of state, and interviewees said that grandmothers often step in to raise young grandchildren in the absence of parents who are dealing with addiction. BVHC has a robust SUD treatment program for pregnant women. The clinic conducts outreach and screening, performs a warm handoff to internal providers for treatment, and offers Medication-Assisted Treatment (MAT) for those with opioid use disorders. Messengers for Health, a health outreach and education program on the Crow reservation, also teaches substance use prevention to youth within the schools. Still, interviewees reported significant stigma around substance use during pregnancy. In January 2018, the Big Horn County Attorney announced he would seek to jail pregnant women found to be using drugs or alcohol. In response to strong backlash, the attorney has backed away from the policy (although has not yet changed it as of October 2019) and has been participating in workgroups about how to provide holistic care to those with SUD. One interviewee noted the attorney’s actions had a noticeable “chilling effect” on women presenting for prenatal, family planning, and postpartum care and made outreach to these women even more challenging than it already was.
Contraceptive Provision, Access, and Use
The full range of contraceptive methods are available at IHS; however, contraception use is reportedly low, particularly among teens, contributing to the Crow tribe having the highest teen pregnancy rate in Montana. Lack of transportation, confidentiality concerns, cultural beliefs, lack of awareness, and historical mistrust of health care providers among the Crow population are barriers to care.
Provider shortages, traditional beliefs, and a lack of health literacy all contribute to the higher rates of teen pregnancy among Crow youth. The overall Montana teen birth rate is 26 births per 1,000. Big Horn County, where Crow reservation is located, is ranked highest in the state for teen births, at 85 births per 1,000. Contraceptive care for low-income women is available at IHS and various providers in Hardin and Billings. However, interviewees explained that babies are viewed as a blessing in many traditional families, even for teens, and given this perspective, family planning is not always prioritized. Low health literacy was also reported as a limitation to contraceptive use.
“Due to our cultural ways and strong values for life, most Crow people may not actively engage in family planning. However, there are some families especially from our younger generations who do family planning, which I feel is wise because of today’s economy.”
–Alma McCormick, Executive Director, Messengers for Health“Health literacy about puberty, menstruation and birth control is a big barrier, and many young women do not know they can be their own advocates.”
–Nona Main, former Health Educator, Planned Parenthood of Montana
A legacy of forced sterilization and experimentation, confidentiality concerns, and turnover at the IHS administration has led to a distrust of IHS and other western providers. Several interviewees discussed the lasting impact the history of nonconsensual research and forced sterilization has had on the Crow tribe. Native American women,21 including Crow women,22 ,23 were sterilized without their consent by U.S. government employees as recently as 50-60 years ago.
Confidentiality concerns are also a significant barrier to family planning and STI testing services on the reservation, as is common in many small communities. Several interviewees expressed concern that patients’ relatives and friends working at IHS do not always adhere to robust confidentiality standards. In addition, turnover in the service unit director position at IHS and within the tribal administration also serves as a barrier to social service and health education programs such as Messengers for Health, whose leaders must gain each new administration’s buy-in for their existing programs.
St. Vincent is the only religious health system in Billings, and in practice, it has few restrictions on contraception, although it recently stopped performing tubal ligation. There are two major health systems in the area, St. Vincent and Billings Clinic, both of which provide the full range of contraceptive methods including LARC. However, St. Vincent stopped providing tubal ligation in June 2019, and interviewees reported that St. Vincent providers often refer to Planned Parenthood for long-acting reversible contraception (LARC), such as IUDs and implants, because of their own beliefs or they lack experience due to low volume. Several focus group participants noted they typically do not go to St. Vincent for contraception simply because Billings Clinic, the other major hospital in the area, is closer to the reservation.
Initiative: Messengers for Health’s lay health advisor approach to cancer prevention
Messengers for Health started in 1996 as a partnership between members of the Crow Nation and a Montana State University faculty member to address health equity, and in particular, the high rates of cancer among the Crow tribe. According to their website, cancer is the leading cause of death on the Crow reservation, and there are low rates of preventive screening. Using a lay health advisor approach, the organization relies on “messengers” from the community to educate the Crow people about risk factors for cancer and assist them in seeking out preventive screening. Their first program focused on educating Crow women and girls, from 5th to 12th grade, about cervical cancer using a culturally competent curriculum. Messengers for Health also started the Crow Warriors for Health program to increase colorectal, prostate and lung cancer knowledge among men within the community. The program encourages Crow men to lead educational outreach activities using culturally appropriate materials. They also assist Crow men with scheduling appointments, determining eligibility to cover any screening or treatment costs, and transportation or gas vouchers for follow-up visits. In Crow culture, any mention of cancer was considered taboo, but due to the work of Messengers for Health, women and men are now discussing cancer openly and regularly seeking preventive screenings such as pap tests, mammograms, and colorectal screenings. The organization also has a program providing sex education to youth in schools, a stroke prevention campaign, and a chronic illness and self-care management project.
Sex Education Policy and Provision
Sex education is mostly discussed informally in the home, with intermittent efforts to provide formal education in schools. Education about STIs and HIV is lacking, and there is significant stigma associated with HIV.
Sex education on the Crow reservation is influenced by strong cultural and gender roles within the Crow tribe. As some interviewees described it, Crow families are closely knit, and the tribe has a tradition of matrilineal kinship. Older women, especially, adhere to strong beliefs in modesty and treat topics about sexuality, family planning and abortion as taboo. Crow girls often look to their grandmothers for education on these issues. This is significant given many grandmothers are raising their grandchildren. However, family planning is not typically prioritized, and focus group participants said many girls and young women do not know where to get contraception. Two focus group participants shared they each had friends who became pregnant at 11 and 14 years old, respectively. Abortion was not considered an option for either, and someone else raised the babies for them. “This is common,” said one focus group participant.
“Most sex education is informal and focused more on girls than boys. They’re taught to behave with modesty and ‘keep themselves out of trouble’.”
–Lucille Other Medicine, Program Assistant, Messengers for Health
Initiative: Planned Parenthood’s online contraceptive app
Since October 2018, Planned Parenthood of Montana offers a mobile app to conduct online contraceptive visits for residents of Montana over the age of 18. Using the app, new or existing patients can message a provider to discuss their medical history and get a prescription for oral contraceptives. Pills cost $24 per pack for a one month supply and arrive by mail to the patient within a couple days. However, Medicaid does not currently cover the service, and Planned Parenthood staff said that private plans in the state also do not cover it because they have an existing contracted telehealth provider and do not want to use another one. The service is currently underutilized, perhaps due to a lack of outreach and affordability.
Outside of the family, several school-based sex education programs exist but are not adopted consistently. Messengers for Health was invited into schools on the reservation by Crow women in the community to educate girls from 5th to 12th grade about sexual risk factors for cervical cancer using a culturally competent curriculum. Topics reflected cultural values and covered self-respect, peer pressure, substance use, and discussions about what students have heard about sex from their families. Over the years, adoption of this program has varied depending on level of support from the Crow administration. Planned Parenthood in Billings employed a Health Educator who is Native American and has worked with several schools in and around the Crow reservation. In several Crow communities on the reservation, she taught the culturally-tailored “Making Proud Choices” curriculum to high school students. In one town, she was only allowed to work with female students due to Crow cultural norms. However, in another community, both boys and girls participated. Interviewees felt the latter community’s remoteness from Crow Agency and overall lack of services led to greater appreciation and acceptance of the education and outreach. Interviewees added that there appears to be more openness to this type of education as staff gets younger and more aware of these issues, particularly as they relate to substance use.
STI and HIV rates are on the rise, and there is significant stigma associated with HIV. Interviewees report that STI rates have increased dramatically in both Big Horn and Yellowstone counties. The STI incidence rate (including chlamydia, gonorrhea, and syphilis) for Big Horn County, where most of the Crow reservation is located, was 5,484.9 per 100,000 in 2017 compared to 551.6 per 100,000 across the entire state of Montana. Due to confidentiality concerns and lack of awareness, many people do not get tested for STIs or HIV. Stigma, particularly related to HIV, is a growing concern as HIV rates increase due to drug use. Several interviewees said HIV patients travel to Billings for their care to avoid confidentiality concerns at IHS. Another interviewee noted that 20 years ago, tribal public health nurses would go out into the community and provide condoms and testing, but that IHS does not currently do any outreach related to STIs or HIV. Focus group participants said the providers they see in Billings do talk with them about STIs and provide information about prevention and testing services.
“I think people are afraid people will find out if they have [HIV] so they don’t go to get tested.”
–Focus group participant
Sexual and Domestic Violence
As in many tribal communities, the Crow tribe has a history of sexual abuse and domestic violence dating back to colonization and boarding schools. In 1871, the U.S. Congress declared Native Americans wards of the U.S. government and began a forced assimilation campaign to integrate children into the dominant white culture. Native American children were taken from their families at the age of 4 or 5 and placed in government and Catholic church-run boarding schools where communication with their families was prohibited. Many suffered physical and sexual abuse. In the absence of healing, the effects on the community continue, and is exacerbated by substance use, limited access to employment, and poverty.
Interviewees noted that sexual and domestic violence remain major problems in current times. The Crow Agency has a domestic violence program that supports women who are victims of abuse. Advocates visit women who are referred by the police to connect them with needed services including a safe house, restraining orders, and health care. However, interviewees and focus group participants noted that women may wait a long time for the police to come if they call from the reservation, so these advocates often encourage women to go to Billings. Issues with law enforcement jurisdiction can also complicate problems. The FBI, county sheriff, and tribal police all have overlapping roles on these issues, which can result in re-traumatizing victims and missteps in investigations. One interviewee shared a story of an FBI agent barging in on a victim’s family planning appointment. Another provider pointed to domestic violence’s impact on women’s reproductive choices in instances where abusers prohibit women from using contraception, causing pregnancy and increased dependency on the abuser. Focus group participants also raised the issue of the disappearance of tribal members as a key concern of their community. Native Americans make up less than 7% of the state’s population but accounted for 26% of all missing person reports between 2016 and 2018, and Native women and girls account for 30-40% of human and sex trafficking victims in Montana. The emergency department at the Crow-Northern Cheyenne Hospital has Sexual Assault Nurse Examiner (SANE)-trained nurses, and all of the hospital staff have been trained in trauma-informed care. Interviewees also discussed the importance of the availability of female providers to reduce barriers for victims seeking family planning and reproductive health care.
Access to Abortion Counseling and Services
Crow families typically do not discuss abortion, and many are opposed to it. The nearest abortion services are located in Billings.
Many Crow women and girls do not consider abortion an option, and often relatives will raise the child. Some Crow women used to practice abortion using plants/herbs. In fact, women from other tribes used to come to Crow communities for this purpose. However, these practices are not common today due to general opposition to abortion. The Christian church is very influential on the Crow reservation, and abortion is considered taboo due to both traditional and religious beliefs. Interviewees explained that babies are considered a blessing among traditional Crow families, regardless of the circumstance of the pregnancy. When needed, relatives will step in and raise the child. A few of the focus group participants noted they knew of a friend who had an abortion, but most were reluctant to discuss it or said they did not believe in abortion, and it had never crossed their mind as an option.
Abortion counseling and services are not available on the reservation, but there are two Planned Parenthood locations in Billings that offer abortion services. Montana does not have any of the state-level abortion restrictions that some other states have, such as waiting periods, mandated parental involvement, or limitations on publicly-funded abortions. However, IHS providers are federal employees, and therefore do not provide abortions. Some providers make abortion referrals to Planned Parenthood in Billings. Under court order, Montana’s Medicaid program is one of 15 state Medicaid programs that uses state funds to pay for abortion beyond the circumstances of rape, incest, and life endangerment permitted by the federal Hyde amendment, and Planned Parenthood reported they have had no issues receiving reimbursement.
Even though Big Horn County is considered “blue in a red state,” as one interviewee put it, there is strong anti-abortion sentiment in Big Horn and Yellowstone Counties. As a result, women who are seeking abortions, and providers who want to refer them, do so with discretion. Despite abortion being highly stigmatized in the area, Planned Parenthood staff reported they do see Crow patients seeking abortion services.
“There is a lot of confusion about what is legal and what is not [regarding abortion], on both the provider and patient side.”
–Dr. David Mark, CEO, Bighorn Valley Health Center
Conclusion
Montana offers broad coverage for reproductive health services through the expanded Medicaid program and family planning waiver. Medicaid expansion has significantly improved the financial health of both IHS and non-tribal providers, leading to increased capacity to meet the overall health care needs of the Crow tribal community. Tribal members can access most methods of contraception at IHS service units on the reservation at no cost. However, there are not enough providers to meet the reproductive health care needs of Crow women on the reservation. Confidentiality concerns, historical mistrust of the health care system, and lack of transportation are barriers to care. Many topics related to contraception, abortion, and STIs are not discussed openly, contributing to the highest teen pregnancy rates in the state and high rates of STIs. However, several organizations, including Messengers for Health and Planned Parenthood of Montana have had success with outreach and education in schools, and continue to look for ways to engage youth. Substance use also influences family roles, particularly in cases where grandmothers step in to raise children when parents are absent due to challenges with substance use. Sexual and domestic violence affects many Crow families; interviewees reported that enhancements to both victims support services and law enforcement systems are needed to address these issues.
Acknowledgements
The authors thank all of the interviewees that participated in the structured interviews for their insights, time, and helpful comments. All interviewees who agreed to be identified are listed below. The authors also thank the focus group participants, who were guaranteed anonymity and thus are not identified by name.
Nona Main, former Health Educator, Native Outreach Project, Planned Parenthood of Montana
David Mark, MD, CEO, Bighorn Valley Health Center
Timothy P. McCleary, Ph.D., Department Head, General Studies Department, Little Big Horn College
Alma McCormick, Executive Director, Messengers for Health, Crow Nation
Lucille Other Medicine, MSW, Program Assistant, Messengers for Health, Crow Nation
Erie County, Pa
KFF: Usha Ranji, Michelle Long, and Alina SalganicoffHealth Management Associates: Diana Rodin, Carrie Rosenzweig, and Sharon Silow-Carroll
Introduction
Located in northwestern Pennsylvania on the shore of Lake Erie, Erie County has a large city (Erie), where 80% of the population lives, several smaller communities, and a large swath of rural area. Although the state expanded Medicaid under the Affordable Care Act, the county is federally designated as medically underserved and as a health professional shortage area (Figure 1). However, the city of Erie has a relatively strong health care safety net that includes family planning services, and the local health care system is working to meet the needs of a relatively large population of refugees and immigrants. As a whole, Erie County is more politically conservative than the city of Erie, and the Roman Catholic Diocese of Erie and the large Catholic population in the region influence both the health care and educational systems. The conservative culture plays a role in reproductive health care access in the region, particularly as it affects the availability of abortion services.
This case study examines access to reproductive health services for low-income women in Erie County, Pennsylvania. It is based on semi-structured interviews conducted by staff of KFF and Health Management Associates (HMA) with safety net clinicians and clinic directors, social service and community-based organizations, researchers, and health care advocates (“interviewees”), as well as a focus group with low-income women in April 2019. Interviewees were asked about a wide range of topics that shape access to and use of reproductive health care services in their community, including availability of family planning and obstetrical care, provider supply and distribution, scope of sex education, abortion restrictions, and the impact of state and federal health financing and coverage policies locally. An Executive Summary and detailed project methodology are available at https://www.kff.org/womens-health-policy/report/beyond-the-numbers-access-to-reproductive-health-care-for-low-income-women-in-five-communities.
Key Findings from Case Study Interviews and Focus Group of Low-income Women
- Access to contraception – Overall, a range of family planning services for low-income residents are available in the city of Erie, though access can be a challenge in rural parts of the county and for uninsured women.
- Refugee communities – Reproductive health and family planning preferences vary widely among Erie’s large refugee community with its diverse religious and cultural beliefs. While many refugees face language barriers when seeking care, case managers, dedicated service agencies, and a Federally Qualified Health Center focused on providing culturally appropriate care support access to preferred methods of family planning.
- Cost and coverage – Pennsylvania expanded Medicaid, improving access to coverage for thousands of Pennsylvanians. However, low-income uninsured women who are not eligible for refugee support services face barriers to family planning and other health care including high cost sharing, logistical barriers such as lack of transportation, and the need for multiple appointments to obtain long-acting reversible contraception or postpartum tubal ligation.
- Ob-Gyn practice consolidation – Ob-Gyn practice consolidation has reduced options for women in the Erie area who are seeking perinatal care. One large practice dominates the Ob-Gyn provider landscape.
- Abortion – There are no abortion providers within 90 miles of Erie, which makes it difficult for women to get to abortion providers and compounds cost barriers for women seeking abortion services. The region’s conservative and religious culture limits discussion of reproductive and sexual health topics, particularly abortion, which carries significant stigma.
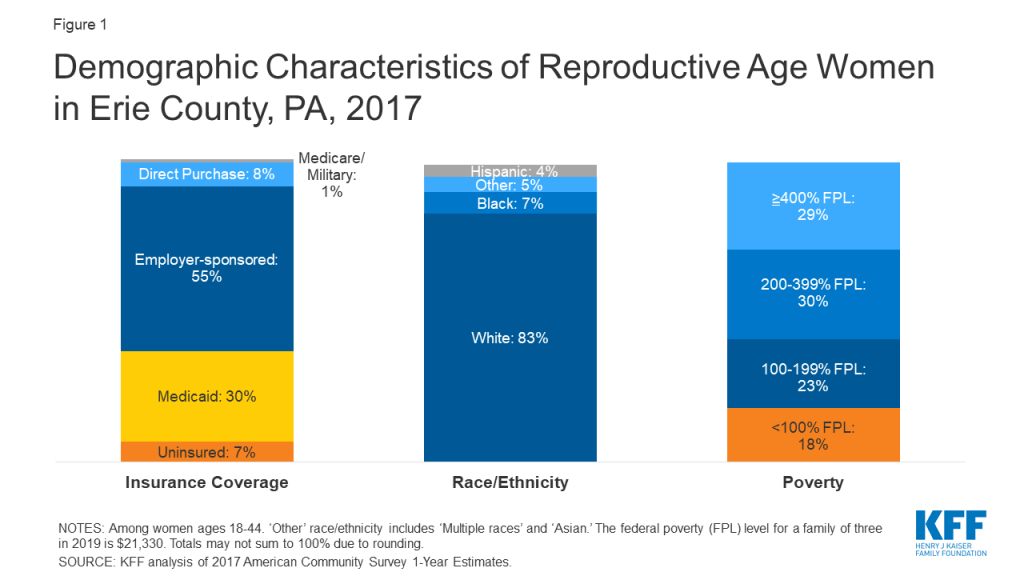
Contraceptive Provision, Access, and Use
Family planning providers offer a wide range of contraceptive choices including long-acting reversible contraceptives (LARCs), but barriers persist for some patients and for same-day access among some providers.
Erie County’s Title X clinic is the only provider offering same-day access to long-acting reversible contraceptives (LARCs), including IUDs and implants. Adagio Health, the most comprehensive provider of family planning services in the county, has a clinic in the city of Erie and one in nearby Edinboro. These clinics are supported by funds from the federal Title X program and are reportedly the only providers offering same-day access to most contraceptive methods including LARCs. Interviewees noted that the need for multiple appointments at other providers can be a barrier to LARC access. A clinician commented that more immigrant and refugee patients were requesting LARCs recently because they feared access to services would soon be restricted under federal policy changes related to immigrants. Federally Qualified Health Centers (FQHCs) in the region offer far fewer contraceptive methods, typically the pill. Interviewees perceived primary care providers as similarly limited in their provision of family planning services, particularly in that they do not provide LARC. One interviewee noted that referral loops between the large Ob-Gyn group and FQHCs are not always closed, leaving clinicians uncertain whether their patient made their appointment or received services. However, these entities are working to improve their coordination.
With the new [Trump] administration, immigrant and refugee patients saw an upswing in LARC because people were afraid they wouldn’t be able to get services because of their status.”
–Susan Scriven, Nurse Practitioner, Adagio Health
Challenges getting patient-centered, respectful care are widespread. While many focus group participants had been able to access family planning services they needed, many also had negative experiences with reproductive services over the course of their lives. Focus group participants described: pressure from providers to use or not use contraception based on the providers’ own preferences and attitudes about ideal family size, the age of the patient, or the provider’s own religious beliefs; traumatic birth experiences or obstetric care; and racial and socioeconomic discrimination in the health care system. Interviewees and focus group participants reported that women who are uninsured or covered by Medicaid are not always treated with respect by private providers and have limited alternatives to switch providers if they have a negative experience.
“Well with my OBs, [contraception has] always been kind of pushed on me. I think with having more children, with having a bigger family, since like baby number three, it’s like automatically they’re like pushing me into using contraception.”
–Focus group participant“I just went to the gynecologist in January… I’m… trying to conceive, and when I brought that up I kind of got brushed off.”
–Focus group participant
Sex Education Policy and Provision
Interviewees described variation among school districts in their willingness to provide sex education and their use of evidence-based programs. The student parenting program associated with Erie City School District recently implemented the evidence-based, comprehensive FLASH curriculum.24 At the same time, there is a significant presence of crisis pregnancy centers (CPCs) in schools from elementary through high school that provide more limited “character education.” A stakeholder reported that the CPCs, which usually promote abstinence, receive state, federal, and private funding which enables them to conduct more outreach and programs than the more comprehensive reproductive health care providers. Focus group participants perceived availability of sex education as inconsistent across schools and not necessarily adequate for high school-aged students.
“We worked really hard to get FLASH implemented. Prior to that, [sex ed] was the most ignored curriculum in the district. [Students] only get this program [FLASH] when they get that health class, and we are in a block schedule, so they are not getting this information every year regularly.”
–Interviewee
Initiative: Supporting Erie’s pregnant and parenting students
The Erie Student Parenting Program, ELECT, assists pregnant and/or parenting middle and high school students in the Erie City School District, charter and prep schools, and other educational programs in Erie, to attain their high school diploma or GED while learning to be parents of healthy babies. Roughly 90 students are enrolled in the program, which provides a wide range of services including: case management; prenatal, family planning, and parenting education; individual and group counseling; and linkages to social services including childcare, transportation, job readiness training, and continuing education. ELECT also has an initiative to promote breastfeeding among teen parents, a doula program to accompany teens to appointments and during the delivery, and a home visiting program to establish individual goals with each student. During the 2017-2018 school year, about 5.4% of the program’s participants had repeat pregnancies, down from 8% in 2015-2016. Average excused absences also decreased from 48% to 30%. In addition, ELECT’s participant graduation rate was 91% in 2016-2017, up from 85% the prior year.
Religious and Cultural Factors
Erie County, including the city, has a large Roman Catholic population, and the church’s policies on family planning and abortion have influenced the health care and educational systems. The Catholic Diocese of Erie includes 12 northwestern Pennsylvania counties in addition to Erie, and claims 202,000 members, almost half of whom are in Erie County. Although Erie County’s formerly-Catholic hospital, St. Vincent, no longer has a religious affiliation,25 some interviewees and focus group participants were unsure whether all faith-based restrictions on care, such as limits on sterilization, have been eliminated. More broadly, Catholic and Evangelical Christian opposition to abortion is reflected in the community, with focus group participants stating that people are “closed off” and reticent to discuss abortion, and to some degree, contraception and other reproductive health issues.
Members of the extremely diverse refugee and immigrant communities in Erie have a wide variety of religious affiliations and beliefs, with varied preferences related to reproductive health care. The health center that provides culturally competent care predominantly to refugees provides referrals to the full range of reproductive health care, including family planning and abortion services. Staff noted that it was rare for patients to seek abortion services, but they had provided referrals when asked.
Specialized Services for Erie’s Refugee Communities
The local health care system is focused on meeting the health and family planning needs of a significant refugee population.
Erie is home to one of the largest refugee resettlement populations in Pennsylvania, and refugee resettlement agencies as well as a refugee-focused health center, the Multi-Cultural Health Evaluation Delivery System (MHEDS), are focused on meeting their health needs including family planning services. According to one interviewee, from 2012 through 2016, Erie settled almost 3,500 refugees from countries including Bhutan, Nepal, the Democratic Republic of Congo, Russia, Somalia, South Sudan, Syria, and Ukraine. Some interviewees mentioned that there has been a significant reduction in the number of refugees seeking services in Erie, which they attribute to the current national political climate. The State Department’s Refugee Processing Center reports that refugee arrivals to Erie has plummeted since 2016.26 Women who are part of those communities have varying preferences and use of family planning services, and the local health care system is building capacity to better meet their needs. MHEDS is an FQHC “look-alike” health center and the sole provider in Erie for the refugee resettlement program, with which it contracts to complete health screenings for newly arrived refugees. MHEDS, along with the Title X program, also provides services to migrant agricultural workers and Amish and Mennonite communities in Erie County.
MHEDS has tailored its services and staffing to address the particular concerns of Erie’s refugee communities and to provide culturally competent care. The health center has medical interpreters from many refugee communities in Erie to address language and cultural barriers. Some women have experienced genital mutilation, and MHEDS is focused on improving provider capacity in Erie to address the associated physical and mental health consequences and competently care for these women. They plan to add well women visits to further develop their onsite women’s health services. Refugees also have varied views of the highly medicalized American model of prenatal care. Some women are not accustomed to the frequent prenatal appointments or standard testing, which can lead to tension with providers. Refugees have Medicaid coverage and are assigned case managers for their first five years in the United States, which helps support access to health care services. However, outside MHEDS, women who need services in languages other than English often face barriers, particularly when providers do not follow requirements to offer interpretation services.
“Language is a barrier – for all languages. We have an interpreting program they can access that is fee-for-service. Providers contract with the interpretation services through our agency. We have a broad range of languages available. We can cover the need, it’s just whether the provider wants to use it. It’s their responsibility. Some providers are very proactive about providing language services, and others bend the rules to get around the standards.”
–Interviewee
Cost and Coverage
Access to contraceptives is shaped by state policies that have expanded Medicaid and promoted availability of all family planning methods, but on the local level, providers are concentrated in the population centers, limiting access for women in the rural parts of the county. Cost is a barrier to contraception for some uninsured women, even at publicly-funded health centers or Title X clinics using sliding fee scales.
| Table 1: Pennsylvania Medicaid Eligibility Policies and Income Limits | |
| Medicaid Expansion | Yes |
| Medicaid Family Planning Program Eligibility | 220% FPL |
| Medicaid Income Eligibility for Adults Without Children, 2019 | 138% FPL |
| Medicaid Income Eligibility for Pregnant Women, 2019 | 220% FPL |
| Medicaid Income Eligibility for Parents, 2019 | 138% FPL |
| NOTE: The federal poverty level for a family of three in 2019 is $21,330.SOURCE: KFF State Health Facts, Medicaid and CHIP Indicators. | |
Medicaid expansion has supported increased access to health care broadly and to family planning services in recent years. Pennsylvania’s Democratic governor presided over Medicaid expansion in 2015.27 Between 2010 and 2017, Pennsylvania’s uninsured rate decreased from 10.2% to 5.5%. As of early 2019, nearly 700,000 Pennsylvanians were enrolled in the Medicaid expansion. Pennsylvania also has a family planning program established through a Medicaid State Plan Amendment that covers comprehensive family planning services for eligible men and women with incomes up to 220% FPL (Table 1).
“No one is turned away. As long as people know about us [they can get access] – we do sometimes hear from patients, ‘Oh, I just found out about you.’ Ten to twenty percent are uninsured and get services through Title X. That number went down as a result of Medicaid expansion.”
–Susan Scriven, Nurse Practitioner, Adagio Health
Erie County’s Title X grantee, Adagio Health, is the key provider of comprehensive family planning services to low-income women, though access to all health care services is limited in rural areas. While Medicaid expansion has increased the number of providers in Pennsylvania, interviewees reported that it remains difficult to recruit and retain clinicians and staff in Erie County, resulting in provider shortages. As a result of competing demands on patients’ time, many providers struggle with high no-show rates which lead to scheduling difficulties. Transportation is a barrier to all health care services. Unreliable buses and lack of access to cars limit low-income women’s ability to travel, particularly in rural areas, but also within the city of Erie where severe winter weather can compound travel challenges.
According to an interviewee, between 10% and 20% of patients served by Adagio Health are uninsured. Because Title X patients pay for care based on a sliding scale, some can face fees up to 50% of the cost of the family planning method, which can be as much as $250 for an IUD. Emergency contraception is available at pharmacies or from a doctor, but focus group participants found it expensive to buy over the counter and hard to get a prescription; one participant described a provider refusing to dispense emergency contraception because of their own religious beliefs.
“The Plan B you can buy…over the counter, but it’s 50, 60 bucks, otherwise you have to get a prescription and it is hard as hell to get a prescription for it.”
–Focus group participant“Because so many different doctors have their own beliefs—and I think that’s part of that problem in women’s care—their personal beliefs will overcrowd what they need to do medically for their patient…”
–Focus group participant
Initiative: Connecting patients to transportation
Because the majority of their patients do not drive, the Primary Health Network (PHN), a local school-based FQHC, provides transportation for patients to and from medical appointments at the clinic at no cost using ride-share applications such as Uber and Lyft. The PHN transportation department receives charitable donations to cover the cost.
Provider Distribution and Ob-Gyn Consolidation
Rural areas of Erie County have less access to health care. The Title X grantee is the primary family planning provider for low-income women, while one Ob-Gyn practice dominates the perinatal care landscape.
Maternity Care
Provider consolidation has resulted in fewer options for maternity care in the county. There are no longer any maternity facilities outside of the city of Erie, so most deliveries take place at one of the three major hospitals in the city. Nearly all perinatal care is provided by a single physician group, with two locations in the city of Erie and two satellite offices in Corry and Union City, smaller towns in Erie County. Interviewees highlighted that there is little competition or alternative to this large provider group. The Title X grantee, Adagio Health, also provides prenatal care to some low-risk women, working with physicians in the large Ob-Gyn practice who track their charts weekly and provide delivery and postpartum services. Many interviewees and focus group participants raised concerns that having only one major Ob-Gyn practice could result in lower quality of care and noted they had heard or directly experienced that some of the practice’s providers do not treat patients with Medicaid coverage with respect. Focus group participants also expressed preferences for greater continuity of care than offered by this practice where patients may see a different prenatal provider during each visit and at delivery. Several focus group participants had used midwifery or doula services, but this was not reported to be the dominant model.
“Ob/Gyn Associates is the go-to, but if there were more options it would be easier for patients. If they have a bad experience with one doctor, they don’t want to go to that practice again, even to another doctor. And there is nowhere else close by, or they don’t accept Medicaid.
–Interviewee
Provider practices around postpartum care and related family planning services vary and often lack continuity. Some providers discuss postpartum resources including family planning during prenatal visits, while others do so after delivery. One interviewee noted that some women do not know where to go for postpartum services; and some return to their prior source of care, only to be directed back to the Ob-Gyn for their postpartum follow-up visits. Most providers refer low-income women to the Title X provider for family planning after their pregnancy Medicaid ends; however, women seeking sterilization are referred to the hospitals in the city of Erie.
“I think we could all suffer from a bit of PTSD with our [reproductive health care] experiences…”
–Focus group participant“I think almost every woman has had a bad experience [seeking reproductive health care] …”
–Focus group participant
Other Reproductive Health and Social Service Providers
The Erie County Department of Health (DOH) operates a sexually transmitted infection (STI) clinic providing testing and treatment, infectious disease surveillance, education, and robust HIV follow-up care. The STI clinic provides free testing and treatment two days per week or by appointment, with a particular focus on pregnant women and their partners. DOH recently identified an increase in syphilis among infants in Erie, reinforcing the need to screen all pregnant women. DOH collaborates with partners including the Title X grantee, which also provides free HIV testing and treatment services. The department also conducts rapid HIV screening, counseling, pre-exposure prophylaxis (PrEP), and ongoing follow-up with each person who tests positive for HIV to ensure that they are connected with and maintain access to treatment, including home visits if needed. Multiple interviewees and focus group participants stated that there is a lack of knowledge about STIs among youth in the community. Stigma continues to be a barrier to STI testing and treatment, but DOH conducts community-based education programs as funding allows.
Initiative: Sexual health promotion and outreach
The Erie Department of Health (DOH) operates a health promotion program in which they conduct educational outreach at community events and promote their services via bus advertisements and billboards. The DOH also distributes condoms in high-risk areas to 26 non-clinical sites such as barbershops. To promote their services, the DOH includes a flyer that identifies where free condoms and STI/HIV testing and care are available. In addition, the DOH attends a state LGBTQ health disparities convention annually and participates in state training on cultural competency and humility. The DOH implements targeted interventions for the LGBTQ population such as testing and providing education about PrEP at events like gay pride and local conventions.
The Erie County Women Infants and Children (WIC) program and the Nurse Family Partnership provide social and medical services and referrals for family planning. The WIC program is well-established, long-standing, co-located with community centers in the city of Erie, and serves a “unique and diverse” caseload of about 7,500 people annually with a wide variety of community-based programs for parents and infants. Two of its centers are located close to Erie’s largest public housing facilities. Enrollment in WIC services has been declining due to fears among the large immigrant population about use of public programs creating risks to immigration status (“public charge”). The Nurse Family Partnership program, based at the DOH, provides evidence-based nurse home visiting services free of charge to low-income women who are pregnant with or parenting their first child, up to the age of two. The program serves an average of 95 women per year, with the goals of improving pregnancy outcomes, child health and development, and economic self-sufficiency.
“People [think] that if they seek benefits they may be deported. This [perception intensified] recently. We see it and have conversations throughout the state. If anything is going to affect a person being here, or benefits, they will shy away. We know through word of mouth in the community people may not be coming [for services] because of that.”
–Debora Jamison, Director, Erie County WIC
Access to mental health care is very limited in Erie County. There is a lack of access to treatment for postpartum depression and to mental health services more broadly. Focus group participants highlighted stigma, concerns about child welfare involvement, and a shortage of mental health services in the city and county as the key barriers.
Access to Abortion Counseling and Services
The lack of abortion providers in Erie County and the anti-abortion climate make it difficult to access abortion counseling and services.
There are no clinics providing abortion services in Erie County, and residents seeking abortion care must travel at least 100 miles away to Pittsburgh, New York, or Ohio. Travel time, transportation, and the cost of the procedure are barriers to abortion access for Erie County residents. Compounding the challenges for low-income women, Pennsylvania Medicaid does not cover most abortions, and the 24-hour waiting period in Pennsylvania (and Ohio) results in women having to make two trips. Furthermore, earlier in 2019, Ohio passed a bill that could prohibit any abortions in the state as early as six weeks of gestation. While the law is currently blocked under judicial order, if implemented, it would further diminish options for abortion services for women in western Pennsylvania. One focus group participant recounted an experience in which she and her husband could not save enough money for the transportation to the clinic, which ultimately prevented her from having the procedure she sought. Several interviewees and focus group participants mentioned that there used to be a local abortion provider, but the clinic closed several years ago. Many interviewees were unfamiliar with the state’s policies and restrictions on abortion, and some focus group participants and more than one interviewee believed, incorrectly, that abortion is not legal in the area.
“When I called [an abortion provider two hours away], one of the first things they asked me was how was I [going to] pay for it because it wasn’t free. They did let me know that there [were] funding options available, which would cover a portion. And they did notify me that certain insurances do cover them, depending on what insurance you have. Mine, since mine is state funded, it did not cover it.…The difference in what they said I had to come up with was $400.”
–Focus group participant
Many providers said they provide women with information on where to obtain an abortion if they ask. It is often hard for women to get information about abortion, or to know which providers can make a referral to services. Some providers discussed looking up information for women who needed abortion counseling or services, and some said they would refer to the Title X program, which could provide abortion referrals. At the time of the interviews, most providers did not view the new Title X regulation that prohibits grantees from making referrals for abortion as having a significant impact in the area because they felt that the number of referrals is already low. (These interviews took place before the new rule took effect.) Subsequent follow up conversations with Title X providers have found that this requirement has in fact been challenging as they have not been able to offer referrals, and this has eroded trust between the providers and the women who seek abortion care.
“There may not be any [abortion] providers in western Pennsylvania at all – not a welcoming atmosphere for an abortion clinic. It’s been the reality here for so long, so most people don’t think about it unless you are in that situation. It’s a very Catholic area. Less so now, but those cultural norms have stayed.”
–Interviewee
Crisis pregnancy centers (CPCs) have a large presence in the community, and many providers refer to CPCs without knowing what services they do and do not offer. CPCs typically offer limited medical services and all discourage women from seeking abortion services. In Erie County, the largest CPC offers pregnancy tests, STI screening, ultrasounds, referrals to prenatal care, adoption counseling, smoking cessation services, and classes on topics such as breastfeeding and childbirth, all at no cost to clients as they receive state and federal funding. Some interviewees suggested that the CPCs provide biased information, and that many providers refer women to the largest CPC in Erie without understanding its limited scope or anti-abortion mission. The major CPC in Erie County reported that they counsel women on all their options; however, this appears to be at odds with its mission, the priorities of its funders, and the typical policies of CPCs. A focus group participant reported feeling pressured by CPC staff to adhere to its faith-based principles, which include opposition to abortion. Focus group participants were aware of the CPCs in the area and knew these organizations provide adoption counseling and pregnancy tests (a few had gone for pregnancy tests in the past) and do not offer abortion services.
Conclusion
Family planning services are generally available in the city of Erie, but access is more limited in the rural parts of the county and for uninsured women. Medicaid expansion, a Medicaid-funded state family planning program, and targeted programs to serve the refugee communities in Erie County facilitate access to contraception for most low-income people. However, lack of integration between primary care and reproductive health services, gaps in referral follow-up, heavy reliance on the area’s sole Title X provider, and language barriers are ongoing challenges to the provision of comprehensive reproductive health services. Further, with no abortion providers in Erie County, a conservative political and cultural environment, and no abortion coverage through Medicaid, low-income women seeking abortion services face cost and transportation barriers as well as stigma.
Acknowledgements
The authors thank all of the interviewees that participated in the structured interviews for their insights, time, and helpful comments. All interviewees who agreed to be identified are listed below. The authors also thank the focus group participants, who were guaranteed anonymity and thus are not identified by name.
Laura Beckes, CHES, HIV Disease Intervention Specialist, Erie County Department of Health
Amanda Cox, Medical Advocate, Safe Journey
Kathy Dahlkemper, Erie County Executive
Heather Goodwin, Medical Assistant, Primary Health Network
Dylanna Grasinger, Director, USCRI-International Institute
Toni Gromacki, Medical Coordinator, Community Health Net
Debora Jamison, Director, Erie County WIC
Chris Kain, Nurse Practitioner, Community Health Net
Juliette Mannino, Nurse Practitioner, Independent Consultant
Wendy Neilsen, RN, Nurse Family Partnership/Immunization Supervisor, Erie County Department of Health
Myrna Otero, Practice Manager, Primary Health Network
Susan Scriven, Nurse Practitioner, Adagio Health
Patricia Stubber, CEO, Multi-Cultural Health Evaluation Delivery System (MHEDS) (and team)
Lisa Szymanski, BSN, RN, Public Health Nurse, HIV/AIDS Surveillance and Partner Services, Erie County Department of Health
Methodology
This project was designed and carried out by staff of KFF and HMA. Major components of the project were the selection of sites, review of documents about state and local policies, structured interviews with providers and organizations in each community, focus groups with women in each community, analysis, and preparation of reports.
Overall design: Site visits by 4-person teams from KFF and HMA including in-depth, semi-structured interviews with local clinicians and representatives from health and social sector organizations caring for low-income, reproductive age women, and focus groups in five communities: Dallas County (Selma), Alabama; Tulare County, California; St. Louis, Missouri; Crow Tribal Reservation, Montana; and Erie County, Pennsylvania.
Site selection criteria: Based on variation in state Medicaid expansion, presence of state-funded family planning program, state laws governing abortion, geographic region in US, racial/ethnic makeup, presence of religiously-affiliated providers and CPCs (Table 1).
Document and policy reviews: Included but not limited to Medicaid eligibility and covered services, state family planning programs and restrictions on use of public funds, sex education, abortion, community health needs assessments, and provider shortage areas.
Structured interviews: The research team, comprised of staff from KFF and HMA, conducted interviews in-person or by phone with key reproductive health safety net clinicians and clinic directors, social service and community-based organizations, researchers, and health care advocates. Qualitative interview guides (master guide available upon request) were developed and included questions and probes regarding policies, access, facilitators and barriers related to contraception/family planning, sex education, STIs, obstetrical care, and abortion services. The interviews were tailored to individual regions and interviewee roles. After obtaining verbal consent, interviews were recorded and typically lasted 60-75 minutes. Interviewees who are quoted by name in this report gave approval for their attribution. Notably, not all individuals who were contacted agreed to be interviewed, and the research team was not able to speak to all providers in the community. Interview responses are self-reported, based largely on perception and experience not verifiable by investigators.
Focus groups: A focus group in each region was conducted with low-income women ages 18-40, with race and language reflecting the community/regions. The number of women in the groups ranged from 9 to 12. Recruitment and facilitation was provided by Perry Undem Research/Communication using a KFF staff-developed moderator guide with questions about their access to and use of family planning, obstetrical, and abortion services. The groups were comprised of a mix of women who were uninsured, on Medicaid, and covered by private insurance. All of the groups were conducted in English, except for Tulare County, which was conducted in Spanish. While the focus groups were audio recorded for preparation of this report, all participants were guaranteed anonymity. Thus, none of the participants are identified in this report. Each woman was paid $200 for her time and participation.
Analysis: Included but not limited to reviews of relevant policies, statistics and background information; qualitative review of interview notes and recordings; development of comparative grid summarizing, comparing and contrasting interviewee responses; focus group transcripts and moderator outlines of key themes; development of individual site case study reports.
| Table 1: Key Characteristics of Study Communities | |||||
| Midwest | Northeast | West | South | ||
| St. Louis, MO | Erie County, PA | Crow Tribal Reservation, MT | Tulare County, CA | Dallas County (Selma), AL | |
| Urban | X | ||||
| Rural | X | ||||
| Urban-rural mix | X | X | X | ||
| Served by Indian Health Service | X | ||||
| Medically underserved and health professional shortage area | X | X | X | X | X |
| Declining number of family planning providers | X | X | X | X | X |
| Large faith-based provider presence | X | ||||
| State has not expanded Medicaid | X | X | |||
| Medicaid-funded family planning program | X | X | X | X | |
| State-only funded family planning program | X | ||||
| High rates of teen pregnancy | X | X | X | X | |
Endnotes
- Wisconsin covers adults up to 100% FPL in Medicaid but did not adopt the ACA Medicaid expansion. ↩︎
- Missouri’s Women’s Health Services Program covers family planning services and approved methods of contraception to uninsured women ages 18-55 with income up to 201% FPL. The program does not permit payments to family planning providers if they also provide abortion services. ↩︎
- Abstinence Plus models typically stress abstinence, but also include information on contraception and condoms. ↩︎
- FLASH is a widely used, comprehensive sexuality education curriculum developed by Public Health Seattle–King County and intended to prevent teen pregnancy, sexually transmitted infections and sexual violence. More information is available at https://www.etr.org/flash/. ↩︎
- In 2019, the state legislatures in Alabama and Missouri passed laws that would have effectively banned abortion services in those states. Federal court rulings have temporarily blocked the enactment of those laws; the states are appealing those rulings. ↩︎
- 2013-2017 American Community Survey 5-Year Estimates. ↩︎
- Established through a waiver agreement between Alabama and the federal government. ↩︎
- 2013-2017 American Community Survey 5-Year Estimates. ↩︎
- Healthy Horizons magazine, 2018. ↩︎
- This reflects the highest eligibility limit for pregnant women in the state under the CHIP program’s “unborn child” option. California Medicaid’s pregnancy eligibility limit is 213% FPL. ↩︎
- HIV/AIDS cases reported by year, preliminary 2018 data, Tulare County, HHSA Public Health. ↩︎
- St. Louis County, which encompasses all the suburban municipalities, is separate from the adjacent but independent St. Louis City. ↩︎
- This reflects the highest eligibility limit for pregnant women in the state under the CHIP program’s “unborn child” option. Missouri Medicaid’s pregnancy eligibility limit is 201% FPL. ↩︎
- As of November 2019, this ruling has not had an immediate effect and the state is expected to appeal. ↩︎
- On June 20, 2019, a panel of federal appeals court judges ruled that parts of the Title X rule, such as the ban on abortion referrals, would go into effect immediately, with physical separation requirements going into effect in March 2020. ↩︎
- The largest hospital in the city provides abortions in cases of health complications and fetal anomalies. ↩︎
- PPSLR and the state of Missouri are involved in a legal battle over their licensure. The case was heard by an Administrative Hearing Commission in October 2019. If the panel sides with the state, Missouri could become the first state without an abortion clinic. ↩︎
- Section 330 of the Public Health Service Act defines federal grant funding opportunities for organizations, such as community health centers, to provide care to underserved populations. ↩︎
- Montana’s Medicaid expansion program, HELP, covers adults with incomes up to 138% FPL, and the Plan First family planning Medicaid waiver covers women ages 18-44 with incomes up to 216% FPL. Also, pregnant women with incomes up to 162% FPL are eligible for Medicaid, with coverage extending 60 days postpartum. ↩︎
- For more information about the history of midwifery among Native American women, see Theobald, B. Reproduction on the Reservation. ↩︎
- Lawrence, J. (2000). The Indian Health Service and the Sterilization of Native American Women. American Indian Quarterly 24(3). Retrieved from http://bixby.ucla.edu/journal_club/Lawrence_s2.pdf. ↩︎
- Jaimes, M. A. (1992). The State of Native America: Genocide, Colonization, and Resistance. Boston, MA: South End Press. ↩︎
- Theobald, B. (2019). Reproduction on the Reservation. Pregnancy, Childbirth, and Colonialism in the Long Twentieth Century. Chapel Hill, NC: The University of North Carolina Press. ↩︎
- FLASH is a comprehensive sexuality education curriculum developed by Public Health Seattle–King County and intended to prevent teen pregnancy, sexually transmitted infections and sexual violence. It is widely used and includes curricula for elementary, middle, and high school and special education classrooms. More information is available at https://www.etr.org/flash/. ↩︎
- Saint Vincent Hospital merged with Allegheny Health Network, operated by the insurer Highmark. ↩︎
- Kaiser Family Foundation analysis of Department of State Worldwide Refugee Admissions Processing System, 2012-2018. Accessed October 2019. ↩︎
- After Pennsylvania’s Medicaid expansion, adults at or below 138% of the federal poverty level are eligible for Medicaid. Pregnant women are eligible for Medicaid up to 220% FPL. ↩︎