Medicaid and CHIP Eligibility, Enrollment, and Cost Sharing Policies as of January 2020: Findings from a 50-State Survey
Executive Summary
As the COVID-19 pandemic expands, needs for health insurance coverage through Medicaid and CHIP will increase for people who get sick and who lose private coverage due to the declining economy. Increasing enrollment for the 6.7 million uninsured individuals who are eligible for Medicaid and facilitating enrollment for the growing numbers of individuals who will become eligible for Medicaid as they lose jobs and incomes decrease will help expand access to care for COVID-19-related needs and health care needs and more broadly. States can adopt a range of options under current rules to increase Medicaid eligibility, facilitate enrollment and continuity of coverage, and eliminate out-of-pocket costs. States can seek additional flexibility through waivers. The Families First Coronavirus Response Act provides states additional options and enhanced federal funding to support state response.
This 18th annual survey of the 50 states and the District of Columbia (DC) provides data on Medicaid and the Children’s Health Insurance Program (CHIP) eligibility, enrollment, renewal, and cost sharing policies as of January 2020. The survey findings highlight state variation in policies that affect individuals’ ability to access coverage and care amid the COVID-19 public health crisis. They also provide examples of actions states can take to expand eligibility and simplify enrollment to respond to the COVID-19 epidemic. Further, the survey findings highlight how changes under the ACA to expand Medicaid eligibility and streamline enrollment and renewal processes have better positioned the Medicaid program to respond to a public health crisis such as COVID-19.
Key Findings
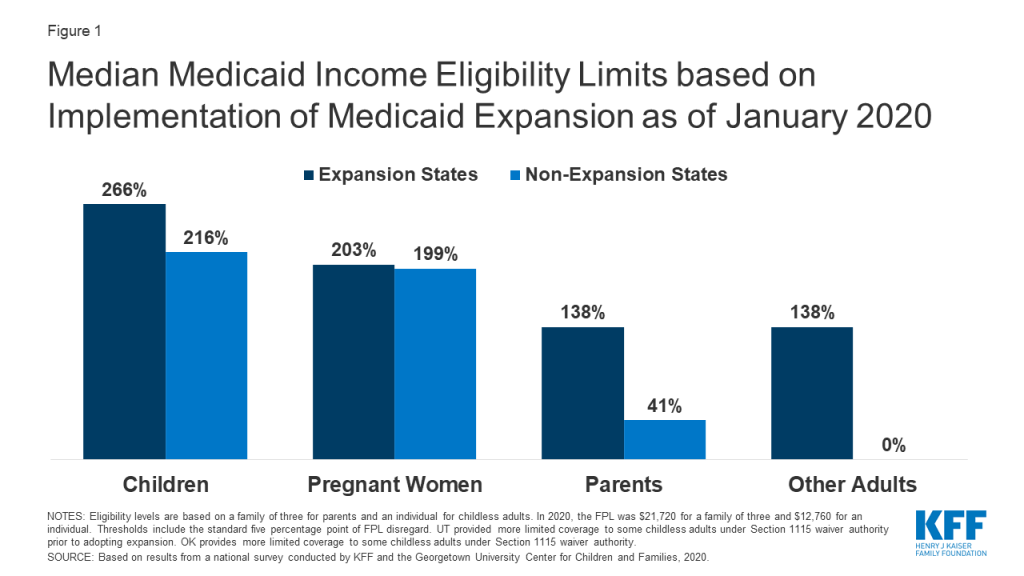
More individuals can access Medicaid coverage in states that have implemented the ACA Medicaid expansion to low-income adults than states that have not expanded. Across eligibility groups, eligibility levels are higher in expansion states compared to non-expansion states (Figure 1). In 2019, two additional states (Idaho and Utah) implementedhe ACA Medicaid expansion, bringing the total to 36 states that extend eligibility to low-income adults with incomes up to at least 138% federal poverty level (FPL, $29,974 for a family of three) as of January 2020. Eligibility for children and pregnant women held steady in 2019, with median income levels of 255% FPL and 205% FPL across all states, respectively, as of January 2020. Eligibility for parents and other adults remains very limited in the 15 states that have not implemented the ACA Medicaid expansion. In non-expansion states, the median eligibility level for parents is just 41% of the FPL ($8,905 for a family of three), and, with the exception of Wisconsin, other adults are not eligible regardless of their income level.
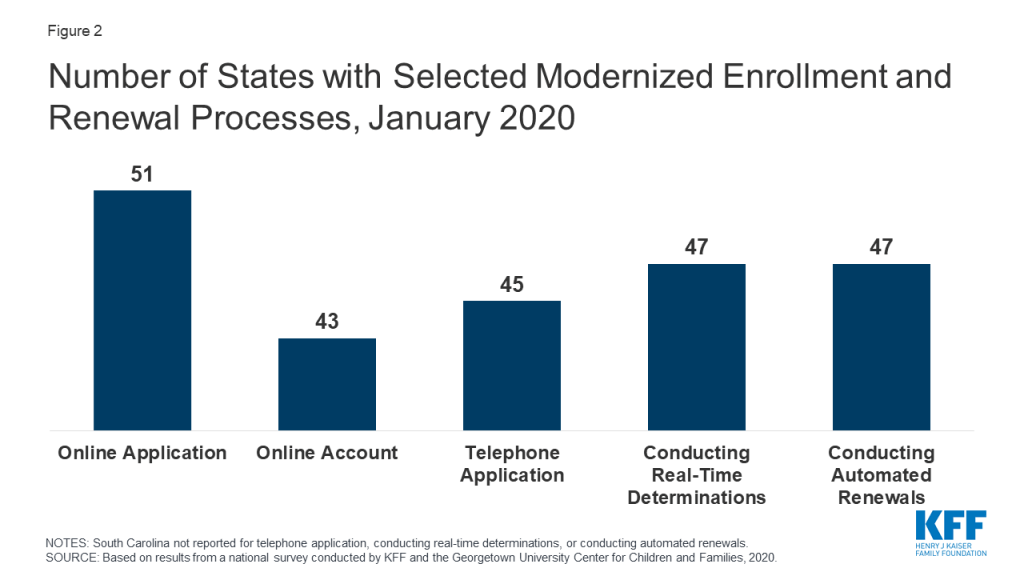
Largely because of the ACA, individuals can apply for Medicaid and CHIP online or via phone, and states can connect individuals to coverage quickly through real-time eligibility determinations and renewals using electronic data matches. In addition to expanding coverage to low-income adults, the ACA established streamlined, electronic data-driven enrollment and renewal processes across states and made enhanced federal funding available to states for system upgrades to implement these processes. As of January 2020, online and phone applications and renewals have become largely standard across states, and most states (43) provide online accounts that enable enrollees to manage their coverage (Figure 2). In contrast, prior to the ACA, individuals could only apply online in two-thirds of states and by phone in one-third of states. Further, as of January 2020, nearly all states are able to make real-time determinations (defined as within 24 hours) and to conduct automated renewals through electronic data matches, with some states achieving high rates of real-time determinations and automated renewals. These advancements mean that individuals may be able to access Medicaid and CHIP coverage more quickly with less administrative burden as coverage needs increase in response to COVID-19.
Eligible individuals may face barriers to maintaining coverage at renewal or when states conduct periodic data matches between renewals. States must renew coverage every 12 months and try to complete renewals using available data before requesting information from an enrollee. When a state requires additional information to complete a renewal, it must provide the enrollee at least 30 days to verify eligibility before terminating coverage. Between annual renewals, enrollees generally must report changes that may affect eligibility, such as fluctuations in income, which are more common among the low-income population. States also may conduct periodic data checks to identify potential changes between renewals, which 30 states reported doing as of January 2020. When states identify a potential change, they must request information to confirm continued eligibility. In contrast to the minimum 30 days provided at renewal, a number of states provide only 10 days from the date of notice for enrollees to respond to information requests for potential changes in circumstances. Eligible individuals may lose coverage at renewal or when these periodic data checks occur if they do not respond to information requests in required timeframes. Enrollees may face a range of challenges to these requests, particularly when given limited time to respond. States can delay or suspend renewals and periodic data checks as one strategy to promote stable coverage as part of COVID-19 response efforts. To access enhanced federal funding under Families First Coronavirus Response Act, states must provide continuous eligibility for enrollees through the end of the month of the emergency period unless an individual asks to be disenrolled or ceases to be a state resident.
Some states have adopted policy options to facilitate enrollment in coverage and promote continuity of coverage. For example, 31 states use presumptive eligibility for one or more groups to expedite enrollment in Medicaid or CHIP coverage by providing temporary coverage to individuals who appear likely eligible while the state processes their full application. In addition, 32 states provide 12-month continuous eligibility to children in Medicaid or CHIP, enabling them to maintain coverage even if their households have small fluctuations in income. Further, 35 states take into account reasonably predictable changes in income when determining eligibility for Medicaid and 12 states take into account projected annual income for the remainder of the calendar year when determining ongoing eligibility at renewal or when an individual has a potential change in circumstances. Some states also have adopted processes to improve communications with enrollees. For example, 10 states reported taking proactive steps to update enrollee address information, and 24 states report routinely following up on returned mail by calling and/or sending email or text notifications. Additional states could take up these policy and processes as part of COVID-19 response efforts.
Premiums and cost sharing are limited consistent with federal rules that reflect enrollees’ limited ability to pay out-of-pocket health care costs. Under federal rules, states may not charge premiums in Medicaid for enrollees with incomes less than 150% FPL and cost-sharing amounts are limited. Only five states charge premiums or cost sharing for children within Medicaid, while most separate CHIP programs (32 of 35 states) charge premiums, enrollment fees, and/or copayments. Similarly, few states charge premiums, enrollment fees, or other monthly contributions for parents or other adults in Medicaid. However, several states have obtained waivers to impose premiums or other charges in Medicaid for parents or other adults that federal rules do not otherwise allow, and two-thirds of states (35 states) charge copayments for parents and other adults. States can waive or eliminate out-of-pocket costs in response to COVID-19.
Responding to COVID-19
Prior to the COVID-19 outbreak, the federal government and some states were taking actions to add eligibility requirements and increase eligibility verification for Medicaid coverage. The administration approved waivers in several states to allow work requirements and other eligibility restrictions and released guidance for new “Healthy Adult Opportunity” demonstrations that would allow for such requirements and other changes. Recent court decisions set aside or struck down work requirements and suggested that similar approvals are likely to be successfully challenged in litigation. The administration also indicated plans to increase eligibility verification requirements as part of program integrity efforts. Outside of Medicaid, other policy changes were contributing to downward trends in coverage, including decreased federal funding for outreach and enrollment and shifting immigration policies. However, given increasing health care needs stemming from COVID-19, states and Congress are taking action to expand eligibility, expedite enrollment, promote continuity of coverage, and facilitate access to care.
States can take a range of actions under existing rules to facilitate access to coverage and care in response to COVID-19. They can take some of these actions quickly without federal approval. For example, they can allow self-attestation of eligibility criteria other than citizenship and immigration status and verify income post enrollment. They can also provide greater flexibility to enroll individuals who have small differences between self-reported income and income available through data matches. Further, they can suspend or delay renewals and periodic data checks between renewals. States can take other actions allowed under existing rules by submitting a state plan amendment (SPA, which is retroactive to the first day of the quarter submitted). Changes states can implement through a SPA include expanding eligibility, adopting presumptive eligibility, providing 12-month continuous eligibility for children, and modifying benefit and cost sharing requirements, among others. Beyond these options, states can seek additional flexibility through Section 1135 and Section 1115 waivers.
The Families First Coronavirus Response Act provides additional options for states and increases federal funding for Medicaid, subject to states meeting certain eligibility and enrollment requirements. Specifically, it provides coverage for COVID-19 testing with no cost sharing under Medicaid and CHIP (as well as other insurers) and provides 100% federal funding through Medicaid for testing provided to uninsured individuals for the duration of the emergency period associated with COVID-19. The law also provides states and territories a temporary 6.2 percentage point increase in the federal matching rate for Medicaid for the emergency period. To receive this increase, states must meet certain requirements including: not implementing more restrictive eligibility standards or higher premiums than those in place as of January 1, 2020; providing continuous eligibility for enrollees through the end of the month of the emergency period unless an individual asks to be disenrolled or ceases to be a state resident; and not charging any cost sharing for any testing services or treatments for COVID-19, including vaccines, specialized equipment or therapies.
Introduction
This 18th annual survey of the 50 states and DC provides data on Medicaid and CHIP eligibility, enrollment, renewal, and cost-sharing policies as of January 2020 and highlights changes in 2019 and over the past decade, under the ACA. The report is based on a telephone survey of state Medicaid and CHIP program officials conducted by the Kaiser Family Foundation and the Georgetown University Center for Children and Families during January 2020. It includes findings in three key areas: Medicaid and CHIP eligibility, enrollment and renewal processes, and premiums and cost-sharing. State-specific information is available in Appendix Tables 1-19. The report includes policies for children, pregnant women, parents, and other adults under age 65 who are determined eligible based on Modified Adjusted Gross Income (MAGI) financial eligibility rules; it does not include policies for groups eligible through Medicaid pathways for seniors and individual eligible based on a disability (non-MAGI groups).
Medicaid/chip Eligibility
Medicaid and CHIP eligibility has evolved over time to provide a comprehensive base of coverage for low-income children, pregnant women, parents, and adults. Leading up to and following the creation of the CHIP in 1997, coverage for children and pregnant women expanded through federal eligibility expansions and state take-up of options to increase coverage for these groups. However, Medicaid eligibility for parents lagged behind. In 2009, the year before passage of the ACA, the median Medicaid eligibility level for working parents was below the poverty level (64% FPL). Moreover, prior to the ACA, states could not use federal Medicaid funds to cover adults without dependent children who did not qualify through a disability- or age-based pathway. As such, adults without dependent children were largely ineligible except in a handful of states with waivers that offered limited benefits and often capped enrollment. The CHIP Reauthorization Act of 2009 (CHIPRA) provided states additional options to expand coverage for children and pregnant women. Then, the enactment of the ACA in 2010 newly allowed states to receive federal Medicaid funds to cover adults without dependent children without a waiver and, as of 2014, provided enhanced federal matching funds for this coverage. As enacted, the ACA expanded Medicaid to nearly all adults with incomes at or below 138% FPL across states effective 2014. However, the 2012 Supreme Court ruling on the ACA effectively made the expansion a state option. Beyond the ACA Medicaid expansion to low-income adults, states have options available under federal rules to increase Medicaid eligibility above the federal minimum income limit of 138% FPL, at regular state match.
Over the past decade, median income eligibility levels significantly increased for parents and other adults, reflecting adoption of the ACA expansion. Median eligibility levels for children and pregnant women also rose over the period as states continued to take up of options to expand coverage for these groups. Specifically, the median Medicaid eligibility level for parents rose from 64% FPL in December 2009 to 138% FPL as of January 2020, while the median eligibility level for other adults increased from 0% FPL to 138% FPL. The median Medicaid/CHIP eligibility levels for children and pregnant women rose from 200% FPL to 255% FPL and from 185% FPL to 205% FPL, respectively, over the period. Despite the increases in eligibility for parents and other adults, eligibility levels for children and pregnant women remain higher than levels for parents and other adults (Figure 3).

In 2019, two additional states (Idaho and Utah) implemented the ACA Medicaid expansion, bringing the total to 36 states that extend eligibility to low-income adults with incomes up to at least 138% federal poverty level (FPL, $29,974 for a family of three) as of January 2020 (Figures 4 and 5). In 2019, Connecticut raised Medicaid eligibility for parents to 160% FPL. DC also covers parents and other adults above the minimum threshold, at 221% FPL and 215% FPL, respectively.
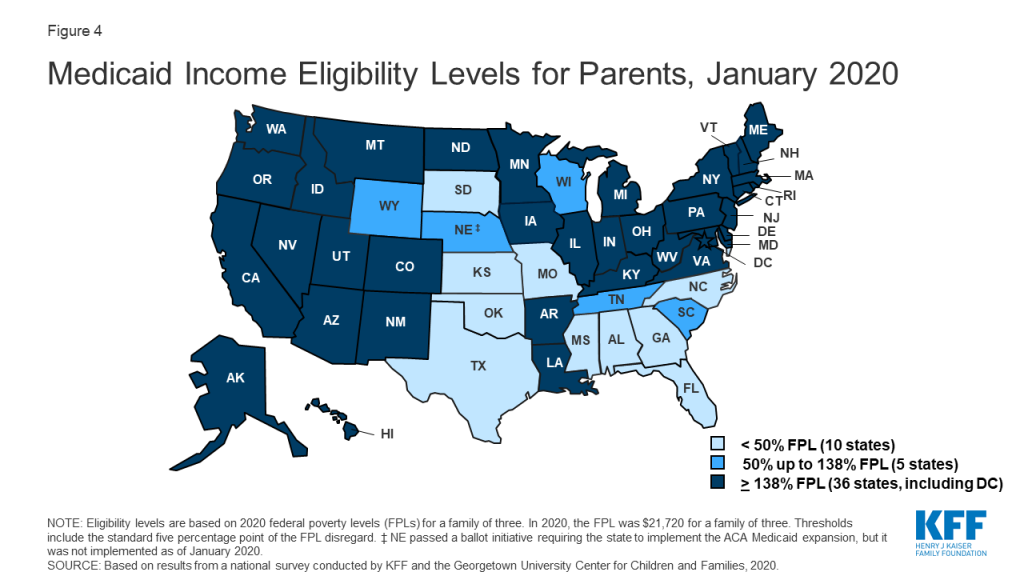
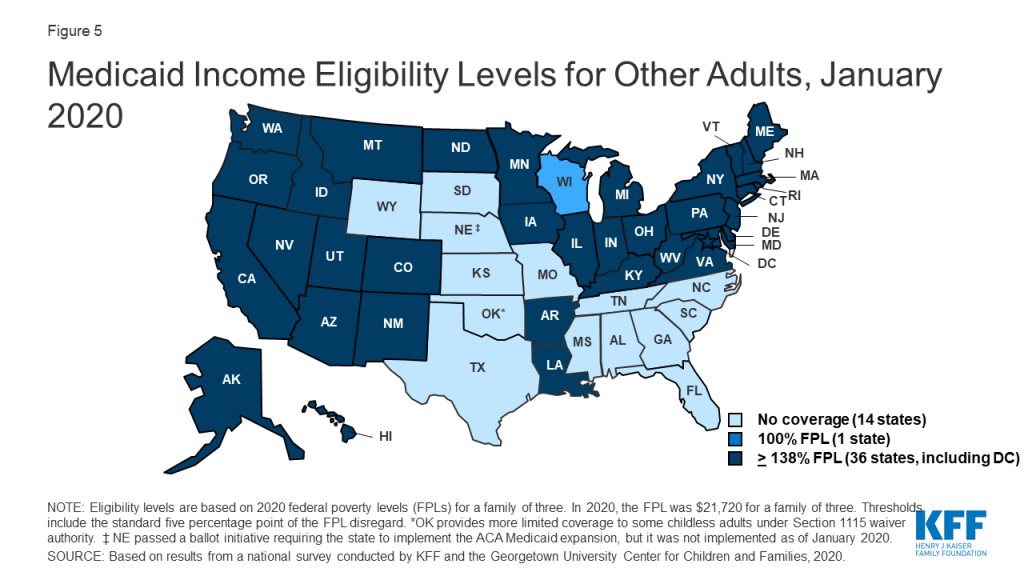
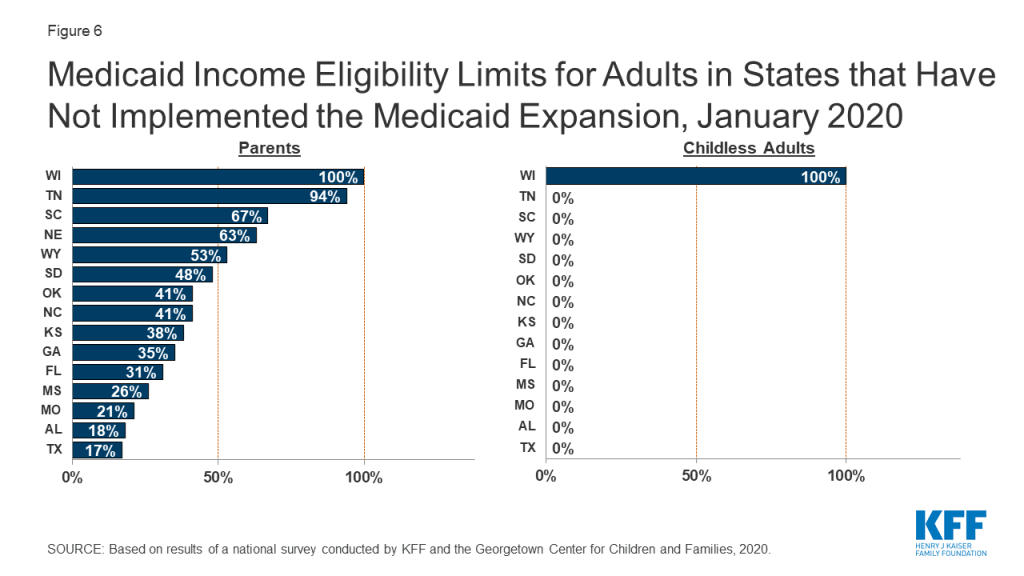
Eligibility for parents and other adults remains very limited in the 15 states that have not implemented the ACA Medicaid expansion. In non-expansion states, the median eligibility level for parents is just 41% of the FPL ($8,905 for a family of three as of January 2020), and, with the exception of Wisconsin, other adults are not eligible regardless of their income level (Figure 6). Moreover, the median eligibility level for parents in non-expansion states declined from 49% FPL to 41% FPL between 2019 and 2020. This erosion largely reflects the fact that ten non-expansion states base parent eligibility on a fixed dollar amount that states do not update on routine basis. As a result, the FPL equivalency declines over time as federal poverty levels adjust annually to account for inflation.
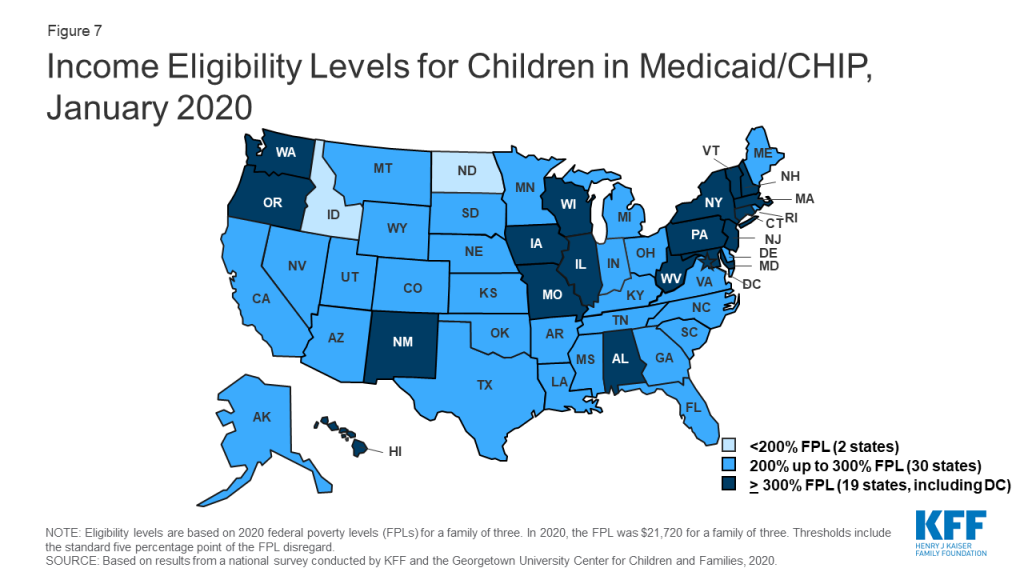
As of January 2020, nearly all states (49) cover children with family incomes up to at least 200% FPL through Medicaid and CHIP (Figure 7). Nineteen states cover children with family incomes at or above 300% FPL. However, eligibility levels vary widely across states, ranging from 175% FPL in North Dakota to 405% in New York.
Over time, states have increasingly integrated their Medicaid and CHIP programs. States can operate their CHIP program as a Medicaid expansion program, as a separate CHIP program, or use a combination of both approaches. In 2019, North Dakota eliminated its separate CHIP program and moved all children covered by CHIP into a Medicaid expansion program. With this change, 16 states administer their CHIP programs solely as extensions of Medicaid. CHIP coverage provided through Medicaid covers full Medicaid benefits, including EPSDT, and is subject to all Medicaid rules and protections. Operating CHIP as a Medicaid expansion makes the coverage between the two programs seamless for families and may be more administratively efficient for states since it eliminates the need to operate two distinct programs. Over the past decade, three other states (CA, MI, and NH) transitioned their separate CHIP programs into Medicaid.
As of January 2020, 35 states operate a separate CHIP program (alone or in combination with a CHIP Medicaid expansion). States have some flexibility over how they operate separate CHIP programs that is not available in Medicaid. For example, they can require children to be uninsured for a certain period before they can enroll in CHIP. As of January 2020, 13 of the 35 separate CHIP programs had a waiting period for children, which the ACA limited to no more than 90 days. Two states (ND and KS) eliminated CHIP waiting periods as of January 2020, continuing a trend of states removing waiting periods over the past decade. In December 2009, 35 of the 39 states with separate CHIP programs had waiting periods, 13 of which were 6 months or longer.1
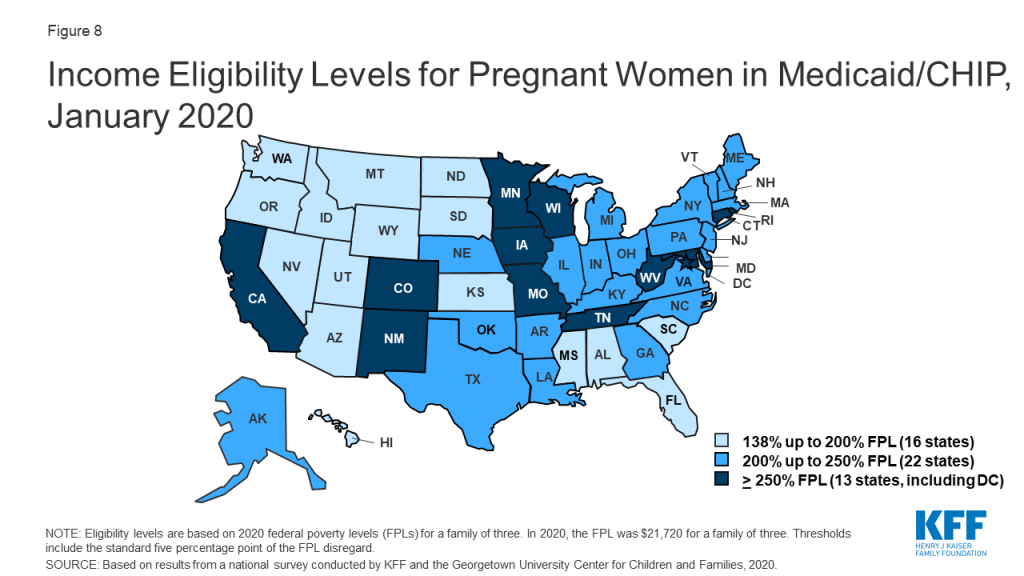
In 2019, two states increased Medicaid/CHIP eligibility for pregnant women, and the median eligibility level for pregnant women remained stable at 205% FPL. North Dakota raised its eligibility Medicaid eligibility limit for pregnant women to 162% FPL, while West Virginia expanded eligibility to 305% FPL through CHIP. As of January 2020, nearly all states (49 states) extend eligibility for pregnant women beyond the federal minimum of 138% FPL. A total of 35 states extend eligibility to at least 200% FPL, including 12 states that cover pregnant women above 250% FPL (Figure 8). However, eligibility varies from a low of 138% FPL in Idaho and South Dakota to a high of 380% FPL in Iowa.
Nine states reported plans to extend the postpartum eligibility period for pregnant women. In response to increasing rates of maternal mortality and severe morbidity, some states and federal legislative proposals are seeking to extend the length of the postpartum Medicaid eligibility period.2 Under current Medicaid rules, pregnancy-related coverage extends through 60 days postpartum. Because Medicaid/CHIP eligibility levels for pregnant women are higher than eligibility levels for parents in most states, women may lose Medicaid coverage at the end of the 60-day postpartum period. This risk of coverage loss is particularly high in states that have not implemented the ACA Medicaid expansion, where eligibility for parents remains very low. As of January 2020, nine states reported plans to extend the Medicaid postpartum eligibility period. Additional states may have pending legislative activity. Most of the nine states that reported activity were in the early planning stages. However, Illinois, Missouri, and New Jersey have developed Section 1115 waiver proposals to extend postpartum coverage, which vary in the length of extension and scope of pregnant women who would receive extended coverage. South Carolina received waiver approval in 2019 to extend postpartum coverage for a limited number of women with substance use disorder (SUD) and/or serious mental illness (SMI). California plans to use state-only funds to implement 12-month postpartum coverage for women with a documented mental health condition during pregnancy beginning July 1, 2020.
As of January 2020, New Jersey became the 29th states to offer family planning services using federal funds. The median eligibility level for family planning services is 205% FPL, but eligibility levels range from 138% in Louisiana and Oklahoma to a high of 306% FPL in Wisconsin. Two states limit eligibility for family planning services to individuals who have lost Medicaid coverage through another eligibility pathway.
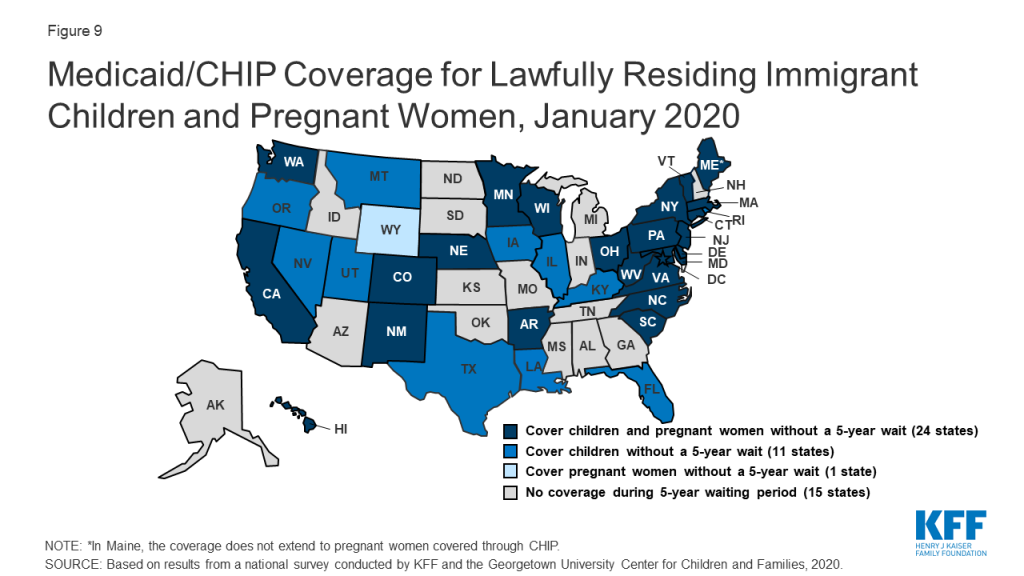
A total of 35 states have eliminated the five-year waiting period for Medicaid/CHIP coverage for lawfully residing immigrant children and/or pregnant women (Figure 9). Lawfully residing immigrants may qualify for Medicaid and CHIP but are subject to eligibility restrictions that require many to wait five years before they may enroll even when they meet all other eligibility requirements. CHIPRA provided states an option to eliminate the five-year wait for lawfully residing immigrant children and pregnant women. Nearly half (24) of states apply the option to both children and pregnant women, while 11 states use it for children only, and one state (WY) uses it only for pregnant women. This count reflects Louisiana’s adoption of the option for children in Medicaid and CHIP in 2019 and West Virginia’s expansion of the option to pregnant women covered under CHIP up to 305% FPL. Since 2002, states also have had the option to provide prenatal care to women regardless of immigration status by extending CHIP coverage to the unborn child, which 17 states provided as of January 2020. Some states have state-funded programs that cover certain groups of immigrants that do not qualify for Medicaid or CHIP.
Enrollment And Renewal Processes
Changes under the ACA
Prior to the ACA, the enrollment and renewal process for Medicaid typically was a lengthy, paper-based process that could take weeks or, in some cases, months to complete. In many states, individuals could only apply via mail or in-person. Some states still required face-to-face interviews and/or imposed asset tests as part of the eligibility determination process and individuals generally had to provide paper documentation to verify eligibility criteria, such as income. Moreover, individuals often would have to repeat these steps at renewal, which could occur more frequently than once a year. These processes reflected the program’s historic ties to cash assistance and most states’ reliance on decades-old, mainframe-based eligibility systems that were difficult to reprogram and upgrade and generally had limited online functions or capabilities to conduct electronic data matches.
After the passage of CHIP, many states began streamlining enrollment and renewal processes to promote enrollment and retention of eligible children. For example, some states eliminated in-person interviews, worked to coordinate rules between Medicaid and CHIP, expanded availability of online and phone applications, reduced documentation requirements, and reduced the frequency of renewal for children.3 State experience showed that these actions contributed to increased enrollment and retention.4 State experience also showed that reinstatement of enrollment barriers led to significant enrollment declines. For example, in 2003, Texas experienced a nearly 30% enrollment decline after it increased premiums, established a waiting period, and moved from a 12- to 6-month renewal period for children in CHIP.5 When Washington State increased documentation requirements, moved from a 12- to 6-month renewal period, and ended continuous eligibility for children in Medicaid and CHIP in 2003, there was a sharp drop off in enrollment.6 Enrollment quickly rebounded when it reinstated the 12-month renewal period and continuous eligibility.7
In addition to expanding coverage to low-income adults, the ACA established streamlined enrollment and renewal rules that drew on previous state experience. These changes included removing face-to-face interviews and asset tests and establishing a 12-month renewal period, which became effective across all states as of January 2014. Prior to the ACA, most states had already removed face-to-face interview requirements and asset tests for children. However, as of December 2009, ten states still required in person interviews for parents and 25 states imposed an asset test for parents. Additionally, while most states had already adopted a 12-month renewal period for children (47 states) and parents (41 states), the remaining states still required renewals more frequently (e.g., every six months). The ACA required states to create a single streamlined application for Medicaid, CHIP, and Marketplace coverage and to provide options for individuals to apply for and renew coverage through multiple modes, including online and phone. The ACA also sought to modernize and improve the efficiency of eligibility determinations and renewals by requiring states to seek to use electronic data matches with reliable data sources to verify eligibility criteria before requesting information or documentation from individuals. To support states in upgrading and modernizing outdated eligibility systems to implement these processes, the Centers for Medicare and Medicaid Services (CMS) provided states 90 percent federal funding for system development and 75 percent funding for ongoing operations. This influx of federal funding was key to enabling states to upgrade and replace systems, particularly at a time when many state budgets had not recovered from the Great Recession.
Eligibility System Upgrades and Integration
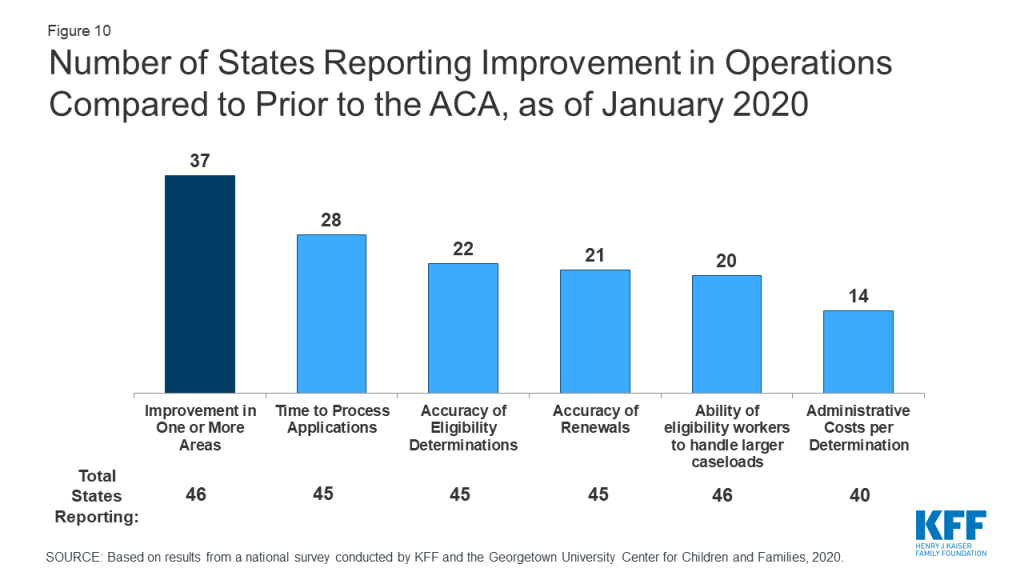
Most states report that system upgrades and modernized processes have contributed to improvements in eligibility and enrollment operations compared to before the ACA. Nearly all states have worked to upgrade or replace their eligibility systems to implement the new processes established under the ACA. However, system statuses and capabilities vary across states, reflecting differences in when they implemented system updates and whether they replaced or upgraded existing systems. The majority (37 of 46 reporting) states report improvement in at least one area of eligibility operations (Figure 10) compared to before the ACA, with 20 states indicating that operations had improved in three or more areas. Only five states report that one or more of these aspects of operations were worse, but several of those states continue to grapple with system implementation challenges, which are resolved as systems are tested and refined. Some states reported that these aspects of operations have not changed since the ACA.
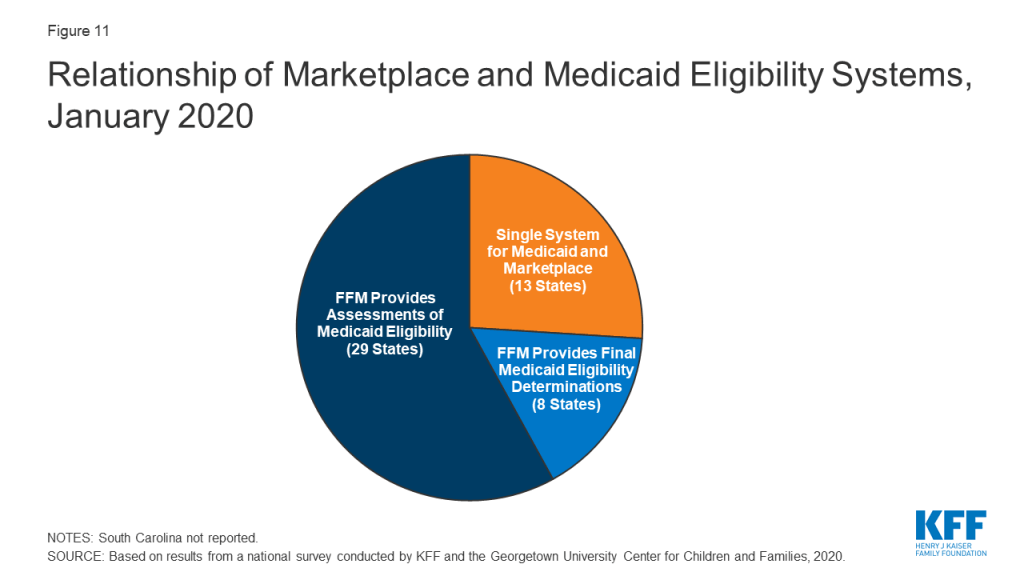
All state systems coordinate enrollment in Medicaid, CHIP, and the Marketplace coverage, but how this coordination occurs varies based on a state’s Marketplace structure. In 2019, Nevada transitioned from using the federal marketplace, Healthcare.gov, for eligibility and enrollment functions (SBM-FP) to become a State-Based Marketplace (SBM). With this transition, 13 states operate a SBM as of January 2020 (Figure 11). An additional 4 states (Maine, New Jersey, New Mexico and Pennsylvania) indicated plans to transition to an SBM in the future. SBM states typically have a single integrated system through which individuals can apply for and renew Medicaid, CHIP and Marketplace subsidies. The 38 states utilizing the FFM as of January 2020 electronically exchange data with the FFM to coordinate Medicaid and Marketplace coverage. While these transfers got off to a rocky start in 2014, states report that they are generally running smoothly with the occasional glitch that may occur when system updates are incorporated and/or amid large volume increases during the open enrollment period for Marketplace coverage. Eight states authorize the FFM to make final Medicaid eligibility determinations for MAGI groups and automatically enroll individuals the FFM deems eligible. The remaining states conduct full eligibility determinations for individuals after the FFM assesses them as eligible for Medicaid.
States continue to integrate non-MAGI Medicaid and non-health programs into their upgraded MAGI Medicaid systems. Prior to the ACA, all states determined eligibility for MAGI groups as well as seniors and individuals with disabilities (non-MAGI groups) through a single system. In addition, 44 state eligibility systems incorporated eligibility determinations for Medicaid and at least one non-health program, including the Supplemental Nutrition Assistance Program (SNAP), Temporary Aid to Needy Families with Dependent Children (TANF), and/or childcare subsidies. When states upgraded their MAGI Medicaid systems, a number separated them from non-MAGI groups and/or non-health programs. As new systems have matured, states have reintegrated determinations for non-MAGI groups and/or non-health programs into MAGI systems. As of January 2020, 31 states have an integrated system for MAGI and non-MAGI determinations and, in 24 states, the MAGI system is integrated with one or more non-health programs. A number of states reported plans to integrate non-MAGI Medicaid and/or non-health programs into their systems during or after 2020.
Applications, Online Accounts, and Mobile Access
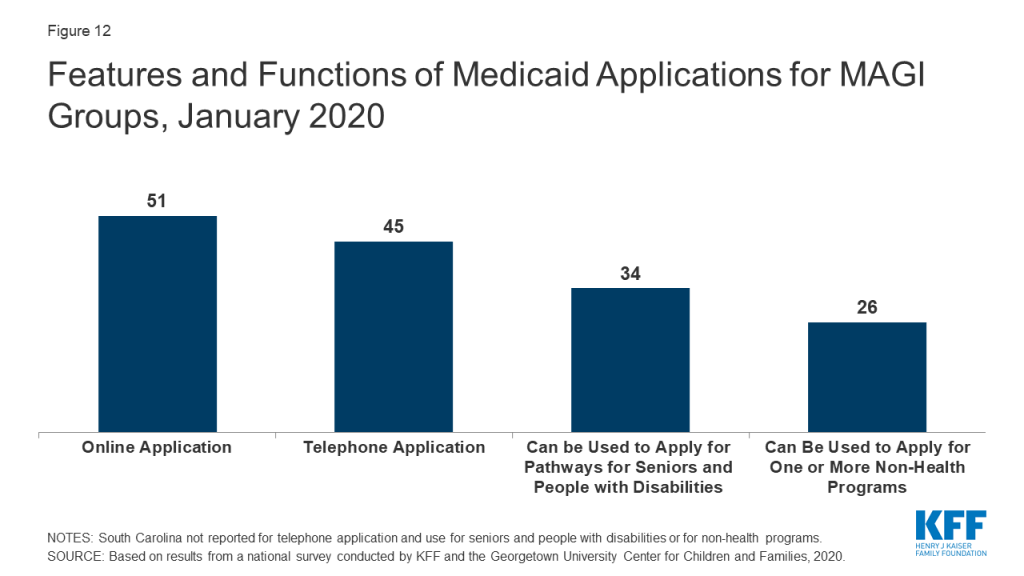
As of January 2020, online and phone applications have become standard options across the states. Just prior to the ACA in 2009, 32 states had an online application, some of which were fillable PDFs that did not connect to the eligibility system, and 16 states accepted telephone applications. Moreover, about half of states (24) had separate applications for children and parents. Today, all states offer a single application for parents and children that can be submitted online, and most states (45) process applications by phone (Figure 12). In 34 states, the application can also be used by individuals applying for non-MAGI eligibility pathways for seniors and people with disabilities and, in just over half of states (26), the application can also be used for at least one non-health program. Online applications have become the predominant mode of submission in nearly half the states (22), although the share of applications submitted online varies significantly across states and other modes of application, including in-person and mail, remain a primary method in some states.
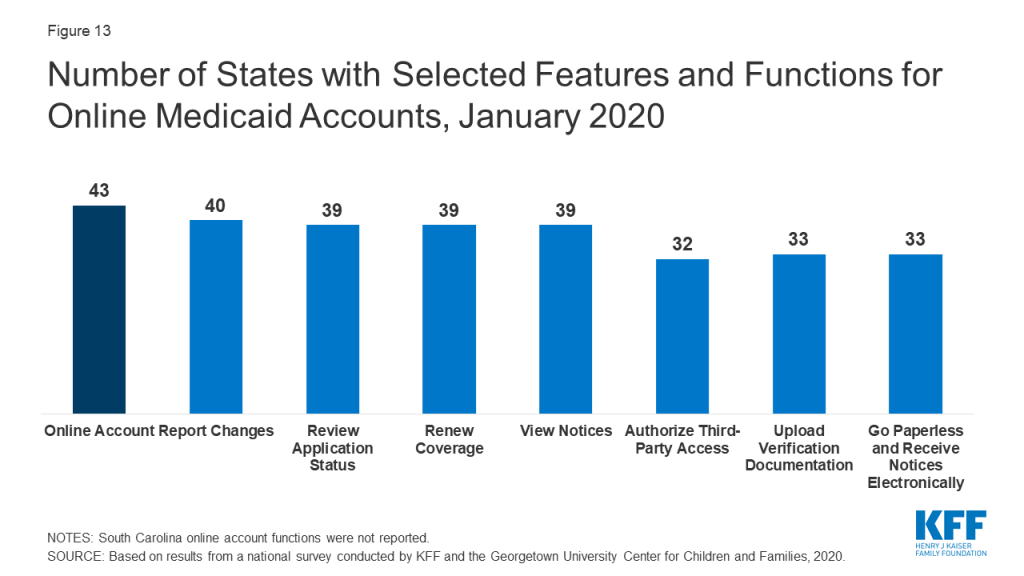
Most states (43) offer online accounts that provide options for enrollees to report changes, submit documentation, or renew coverage as of January 2020 (Figure 13). By providing individuals an avenue to self-report changes, these accounts can help states maintain up-to-date information on enrollees and may reduce administrative tasks for eligibility workers. They also provide an avenue for enrollees to elect to receive communications from the state through text or email. Only a couple of states with advanced systems had online accounts before the ACA.
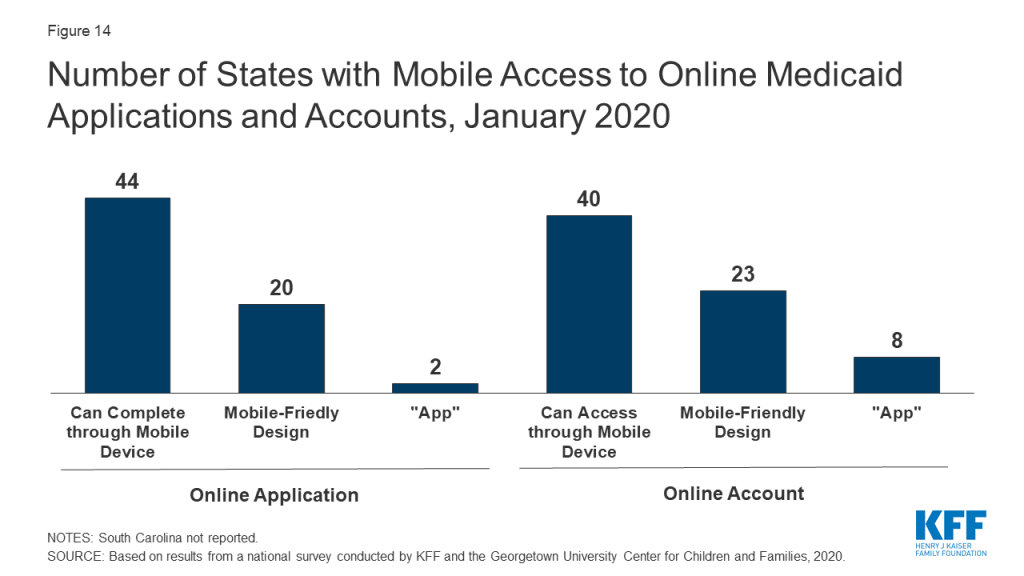
A growing number of states offer mobile access to applications and online accounts. As of January 2020, individuals can submit online applications through a mobile device in 44 states, up from 28 states in 2017, when this survey first collected these data. Enrollees can access online accounts via mobile devices in 40 states, up from 27 states in 2017 (Figure 14). Close to half of these states have taken steps to provide mobile-friendly designs for their application (20 states) and online accounts (23 states). Two states have also taken the next step to create a smart device ‘app’ for their application, while eight states offer an ‘app’ for their online account.
Eligibility Verification Policies
Under the ACA, states must seek to use data available through electronic data matches with reliable data sources to verify eligibility before requesting information from the individual. This process was designed to reduce paperwork burdens on states and enrollees and to allow for faster determinations. Under the ACA, all states must verify citizenship or qualified immigration status, as well as income, to determine eligibility for Medicaid and CHIP. States can electronically verify citizenship or immigration status directly with the Social Security Administration (SSA) or Department of Homeland Security (DHS), or through the federal data services hub that consolidates access to these and other data sources. States must verify citizenship status prior to determining eligibility, however, individuals who attest to a qualified status must be given a reasonable amount of time to provide documentation if eligibility cannot be confirmed electronically. States must also verify income and can do so through the SSA; the federal data hub; state databases, including unemployment, wage, and tax databases; and/or commercial databases. States can verify income prior to enrollment or enroll based on the applicant’s reported income and verify post-enrollment. For other eligibility criteria, including age/date of birth, state residency, and household size, states can verify this information before or after enrollment or accept an individual’s self-attestation unless there is discrepant information in the agency’s records. To expedite enrollment as part of response to COVID-19, under existing rules, states can allow for self-attestation for all eligibility criteria, excluding citizenship and immigration status, on a case-by-case for individuals subject to a disaster when documentation is not available.
Today, all states use electronic data matches with one or more data sources to verify income, and most states (45) verify income prior to enrollment. Prior to the ACA, most states relied on paper documentation to verify eligibility criteria, with less than a third of states (12) using other data sources to verify financial eligibility for children at application. As of January 2020, two-thirds of the states (34) use at least four electronic data sources to verify financial eligibility. A total of 46 states use state wage databases and 46 use state unemployment databases, while 41 states utilize the federal data services hub. Additionally, two-thirds of states (33) use commercial wage databases while just under half (23) access SNAP income data. Nearly two-thirds of states (31) indicate that most income data checks are conducted automatically by the system while another third (16 states) indicate that they conduct these data matches through a mix of automatic matches and manual lookups by eligibility workers. Only three states rely mostly on manual lookups. Most states (33) utilize a reasonable compatibility standard, typically 10%, under which they will determine an individual eligible even if there is a small difference between the amount of reported income and the amount identified through electronic data matches that would otherwise affect eligibility.
Reflecting use of electronic data matches, as of January 2020, 47 states are able to make real-time eligibility determinations (defined as within 24 hours). Nearly one third of these states (15) report that they make more than half of MAGI-based determinations in real time, including 10 that report making over three-quarters of determinations in less than 24 hours (Figure 15). States processing the majority of their applications in real-time are more likely to report that their eligibility system conducts most income verifications automatically without caseworker action. Most states (42) indicate they do not have delays or backlogs in processing applications; the 8 states reporting delays or backlogs generally cite ongoing system challenges or increased application volume due to open enrollment or implementation of the Medicaid expansion.

Renewal Processes
Under the ACA, states must seek to complete automated or ex parte renewals by verifying ongoing eligibility through available data sources before requesting a form or documentation from an enrollee. If a state cannot determine that an individual remains eligible based on available information, it must provide the enrollee with a pre-populated form containing the information relevant to renewal and a reasonable period, at least 30 days, for the individual to provide the necessary information and correct any inaccuracies online, in person, by telephone or by mail.
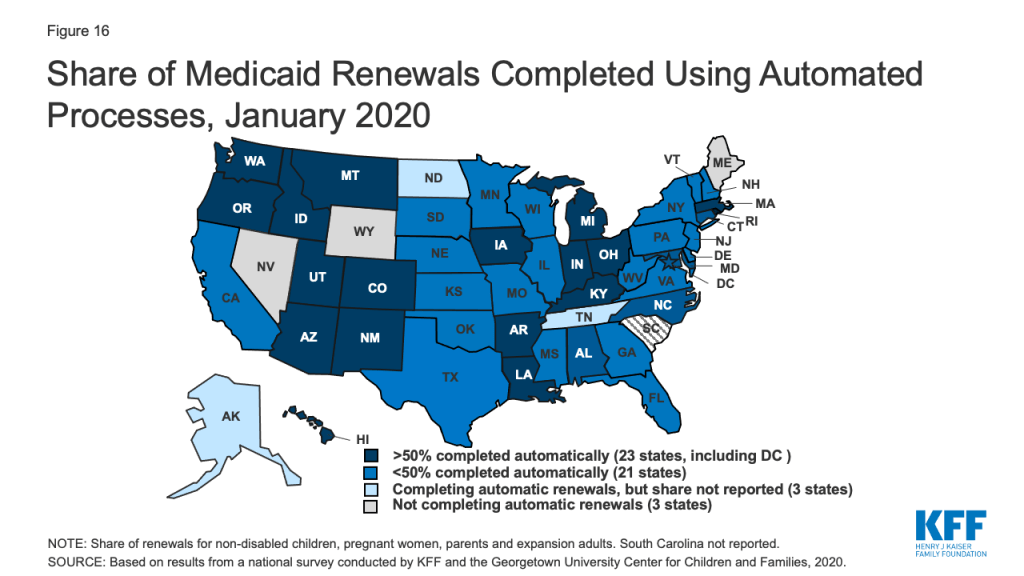
As of January 2020, 47 states are conducting automated or ex parte renewals. This count reflects two states (Alaska and Tennessee), that implemented automated renewals in 2019. In contrast, just 16 states were completing automated or ex parte renewals in 2009, prior to the ACA. In 22 states, at least half of renewals are completed automatically, including 9 states where least three-quarters of renewals are automated and do not require enrollee action (Figure 16). Nearly two-thirds of states (31) report that their system conducts most automated or ex parte renewals without any manual caseworker action, while seven states report that these transactions include a mix of automated actions by the system and manual actions by caseworkers. Nine states report that most ex parte renewals require manual caseworker action. The majority of states (41) allow enrollees to renew by phone without a paper form or signature if the state cannot complete an automated renewal and the enrollee must submit information. However, the large majority of states only contact enrollees 1-2 times to request additional information before terminating coverage, and in a number of cases, enrollees only receive a second contact if they have elected to receive electronic notices through an online account.
Ten states report delays or backlogs in processing renewals in Medicaid or CHIP. These largely are states in the midst of new system builds or major system upgrades that also have delays in processing applications. Three states report that some renewals have been temporarily suspended or delayed, a mitigation strategy that CMS has allowed when states are dealing with system issues or increased volume that inhibit timely processing of applications and renewals. Additional states may delay or suspend renewals as part of their response to COVID-19. Moreover, under the Families First Coronavirus Response Act, to receive the enhanced federal match rate provided under the law, states must provide continuous eligibility for enrollees through the end of the month of the emergency period unless an individual asks to be disenrolled or ceases to be a state resident
Identifying Changes in Circumstances
Although the ACA established a 12-month renewal period, states disenroll individuals within that 12-month period if they have a change in circumstances that affects eligibility, such as an increase in income. Enrollees are required to report changes in circumstances that may affect eligibility. States may also conduct periodic electronic data matches to identify potential changes in circumstances between annual renewal periods. If a state receives information from the enrollee or through another data source about a change that may affect eligibility, it will review the information to determine ongoing eligibility and may request additional information or documentation from the individual to continue coverage. If the individual does not respond to a request within the required timeframe, the state will disenroll the individual from coverage. The Trump administration has promoted use of periodic data matches between renewals as a program integrity strategy.8 However, as noted above, to access enhanced federal funding under the Families First Response Act, states generally must provide continuous eligibility for enrollees through the end of the emergency period.
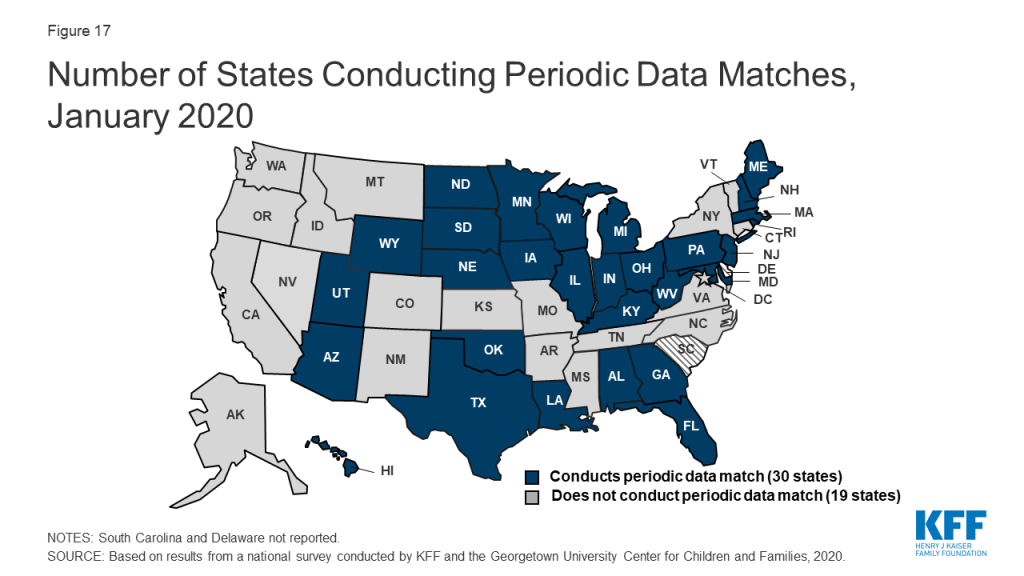
As of January 2020, 30 states reported that they conduct data matches on a periodic basis to identify potential changes that may affect financial or other eligibility criteria between annual renewal periods (Figure 17). The frequency of these checks varies across states and the data sources used for the review. For example, since 2014, Texas has checked income for households with children on Medicaid in the fifth, sixth, seventh, and eighth month of enrollment. These checks are timed to the child’s start date, so households with multiple children who enrolled in coverage at different times face checks even more frequently. In contrast to the minimum 30 days provided at renewal, a number of states that conduct data matches provide only 10 days from the date of notice for enrollees to respond to information requests. Similar to the processes used at renewal, most states only contact enrollees 1-2 times to request this information before terminating coverage with the second notice often sent only to individuals opting for electronic notices through their online accounts.
Adoption of Options to Promote Enrollment and Retention
States can adopt policy options and processes to promote continuity of coverage and minimize coverage gaps or churn—that is, people moving on and off of coverage over relatively short periods of time. These include policy options that can expedite enrollment and prevent coverage gaps due to small fluctuations in income. Income volatility is common among the low-income population, for example, due to seasonal work or fluctuating hours due to employment in industries such as food service and construction.9 ,10 States can also implement processes that enhance communications with enrollees to help prevent individuals from losing coverage because they are not receiving or responding to notices from the state. Enrollees may not receive mailed notices if they move frequently, which also is more common among the low-income population.11 Stable coverage and reduction of churn promotes more continuous access to care, enhances the state’s ability to measure the quality of care, and can reduce administrative costs and burden associated with moving people on and off of coverage.
As of January 2020, 31 states are using presumptive eligibility for one or more groups to expedite enrollment in Medicaid or CHIP coverage (Figure 18). Presumptive eligibility is a longstanding option that allows states to authorize certain qualified entities, like community health centers or schools, to enroll children or pregnant women who appear likely eligible for coverage while the state processes the full application. Presumptive eligibility can be particularly helpful when individuals may need extra time to collect documents needed to complete a full eligibility determination. Under the ACA, states were required to allow hospitals to conduct presumptive eligibility determinations regardless of whether the state had otherwise adopted the policy. The ACA also allowed states that use presumptive eligibility for pregnant women or children to extend the policy for other groups, including parents and other adults. As of January 2020, most states use presumptive eligibility for pregnant women (30 states) and children (19 states) while fewer have implemented the option for parents (9 states), other adults (8 states), family planning coverage (6 states) and former foster youth (8 states).
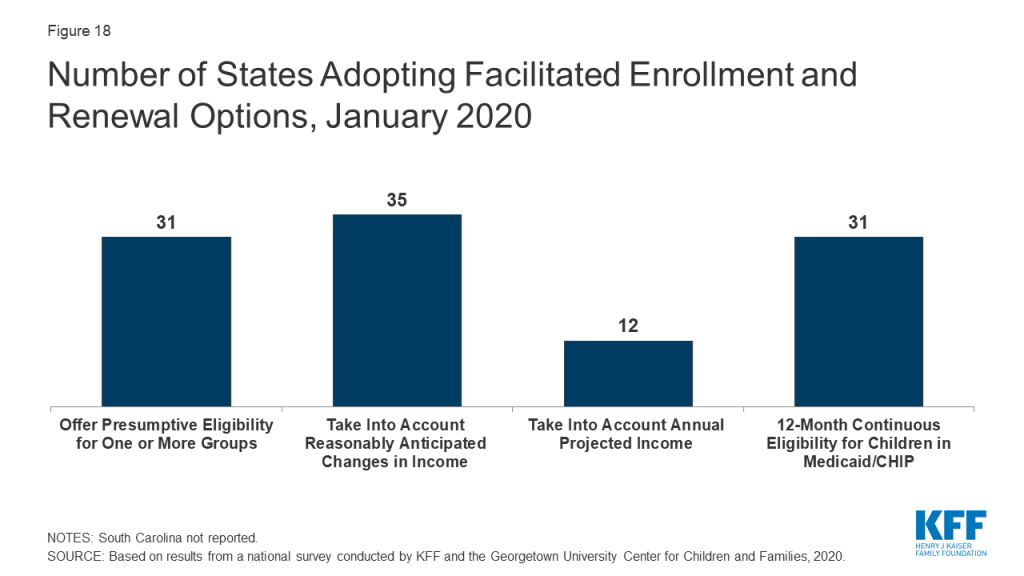
A total of 35 states take into account reasonably predictable changes in income when determining eligibility for Medicaid as of January 2020. This option enables states to account for anticipated income changes, such as recurring seasonable employment or a job change, when determining eligibility at application or renewal. For example, under this option, if a teacher receives a salary under a 10-month contract, the state would divide that income over 12 months to determine current monthly income for assessing eligibility. In addition, 12 states have adopted a similar option to take into account projected annual income for the remainder of the calendar year when determining ongoing eligibility at renewal or when an individual has a potential change in circumstances between renewal periods. This enables individuals to maintain coverage if their projected annual income is below the Medicaid threshold, even if their current monthly income is above the threshold when eligibility is assessed.12 In most cases, the individual or an eligibility caseworker must request or take action to have anticipated income changes or projected annual considered rather than the system accounting for these options automatically.
As of January 2020, 31 states provide 12-month continuous eligibility to children in either Medicaid or CHIP. Under this option, states allow a child to remain enrolled for a full year unless the child ages out of coverage, moves out of state, voluntarily withdraws, or does not make premium payments. As such, 12-month continuous eligibility eliminates coverage gaps due to fluctuations in income over the course of the year. Additionally, two states (Montana and New York) have extended 12-month continuous eligibility to adults under waiver authority.
Some states have implemented processes to facilitate communication with enrollees. For example, ten states reported taking proactive steps to update address information for enrollees. These include regular data matches with the U.S. Postal Service National Change of Address Database and working with managed care plans and providers to update address information. In addition, just under half of states reported routinely taking additional action such as calling enrollees or sending email or text notifications when they receive returned mail from a notice sent to an enrollee.
Premiums And Cost Sharing
Federal rules limit premiums and cost sharing in Medicaid and CHIP given enrollees’ limited ability to pay out of pocket costs. Under these rules, states may not charge premiums in Medicaid for enrollees with incomes less than 150% FPL. However, some states have obtained waivers to impose charges in Medicaid that federal rules do not otherwise allow. Maximum allowable cost sharing varies by type of service and income in Medicaid (Table 1). CHIP programs have more flexibility to charge premiums and cost sharing, but both Medicaid and CHIP limit total family out-of-pocket costs to no more than 5% of family income, and states are required to maintain tracking systems to cease cost-sharing once a family meets the cap. Under the Families First Coronavirus Response Act, states must provide COVID-19 testing with no cost sharing under Medicaid and CHIP. Moreover, to access the increased federal match rate for Medicaid provided under the law, states may not charge any cost sharing for any testing or treatments for COVID-19, including vaccines, specialized equipment, or therapies.
| Table 1: Allowable Cost Sharing Amounts for Adults in Medicaid by Income | |||
| <100% FPL | 100% – 150% FPL | >150% FPL | |
| Outpatient Services | up to $4 | up to 10% of state cost | up to 20% of state cost |
| Non-Emergency use of ER | up to $8 | up to $8 | No limit |
| Prescription Drugs | Preferred: up to $4Non-Preferred: up to $8 | Preferred: up to $4Non-Preferred: up to $8 | Preferred: up to $4Non-Preferred: up to 20% of state cost |
| Inpatient Services | up to $75 per stay | up to 10% of state cost | up to 20% of state cost |
Premiums and Cost Sharing for Children
The number of states (30) charging premiums or enrollment fees for children remained steady in 2019 (Figure 19). The total number of states charging premiums or enrollment fees for children has decreased from 34 in 2009, just prior to the ACA. This decrease, in part, reflects some states transitioning their separate CHIP programs to Medicaid expansions. The stability of premiums since then reflects that extensions in CHIP funding have included a maintenance of effort provision, under which states may not implement new premiums or increase premiums outside of routine increases that were approved in the state’s plan as of 2010. As of January 2020, four states without separate CHIP programs charge premiums to children in Medicaid starting at 160% FPL, and 26 of the 35 separate CHIP programs charge either annual enrollment fees (4 states) or impose monthly or quarterly premiums for children starting at 133% FPL. In 11 states, premiums are family-based, while 15 states have a family cap that limits premiums to no more than three times the individual child rate. Premiums range from $10 for families with income at 151% FPL to a high of $154 per child at 301% FPL.

States vary in disenrollment policies related to non-payment of premiums. Under federal rules, the minimum grace period before canceling coverage for non-payment of premiums is 60 days in Medicaid and 30 days in CHIP. However, 15 of the 22 states charging monthly or quarterly premiums in CHIP provide at least a 60-day grace period. In Medicaid, children who are disenrolled for non-payment of premiums cannot be locked-out of coverage as a penalty for non-payment, while separate CHIP programs may establish a lockout period of up to 90 days. Among the 22 states charging monthly or quarterly premiums in CHIP, eight states do not impose lockout periods. As of January 2020, 14 states have lockout periods in CHIP, with 12 of those states imposing the maximum 90 days.
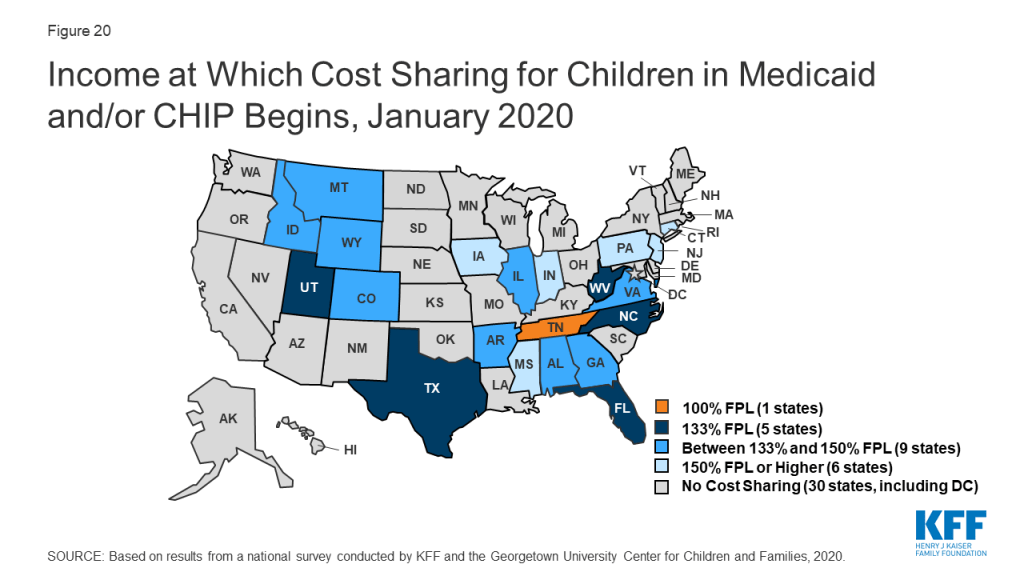
As of January 2020, the majority of states (29) do not charge copayments to children in Medicaid or CHIP. In 2019, North Dakota eliminated copayments for children in Medicaid and Wisconsin stopped charging copayments in both Medicaid and CHIP. With these changes, as of January 2020, 21 of the 35 states with separate CHIP programs charge copayments (Figure 20). Tennessee is the only state that charges copayments for children in Medicaid, and, under a longstanding waiver, it charges copayments for families with incomes below the federal minimum of 133% FPL. Cost sharing varies by state and service. At 151% FPL, 16 states charge cost sharing for non-preventive physician visits, 11 states charge for an inpatient hospital visit, and 12 charge for generic drugs.
Premiums and Cost Sharing for Parents and Other Adults
As of January 2020, seven states have approved waivers to charge premiums or monthly contributions for adults in Medicaid that federal rules do not otherwise allow, but only five states have implemented these charges.13 Arkansas, Indiana, Iowa, Michigan, and Montana charge premiums or monthly contributions for parents and other adults covered through the ACA Medicaid expansion. In Indiana, these charges also apply to parents covered through the traditional eligibility pathway that existed before the ACA. Some of these waivers also allow individuals to be locked out of coverage for a specified period if they are disenrolled due to non-payment and to delay coverage until after the first premium is paid.
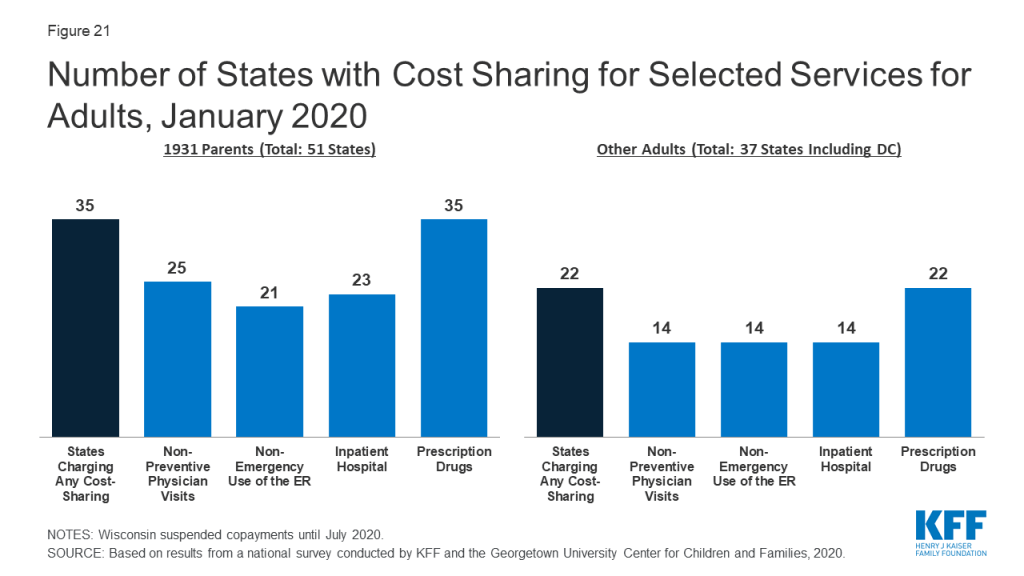
As of January 2020, the majority of states charge cost sharing for parents and other adults, regardless of income. However, the total number of states charging cost sharing fell during 2019, with Illinois, Montana, and North Dakota eliminating copayments for parents and adults. Wisconsin also suspended copayments but plans to reinstate them in July 2020. As of January 2020, 35 states charge copayments for parents eligible for Medicaid under the traditional pathway that existed before the ACA (Figure 21). In addition, of the 37 states that cover other adults (counting the 36 states Medicaid expansion states and Wisconsin, which covers other adults but has not adopted the expansion), 22 charge copayments, including Utah, which expanded Medicaid as of January 2020.
Looking Ahead
Prior to the COVID-19 outbreak, the federal government and some states were taking actions to add eligibility requirements and increase eligibility verification for Medicaid coverage. The administration approved waivers in several states to allow work requirements and other eligibility restrictions and released guidance for new “Healthy Adult Opportunity” demonstrations that would allow for such requirements and other changes. Recent court decisions set aside or struck down work requirements and suggested that similar approvals are likely to be successfully challenged in litigation. The administration also indicated plans to increase eligibility verification requirements as part of program integrity efforts. Outside of Medicaid, other policy changes were also contributing to downward trends in coverage, including decreased federal funding for outreach and enrollment and shifting immigration policies. However, given increasing health care needs stemming from COVID-19, states and Congress are taking action to expand eligibility, expedite enrollment, promote continuity of coverage, and facilitate access to care.
States can take a range of actions under existing rules to facilitate access to coverage and care in response to COVID-19. They can take some of these actions quickly without federal approval. For example, they can allow self-attestation of eligibility criteria other than citizenship and immigration status and verify income post enrollment. They can also provide greater flexibility to enroll individuals who have small differences between self-reported income and income available through data matches. Further, they can suspend or delay renewals and periodic data checks between renewals. States can take other actions allowed under existing rules by submitting a state plan amendment (SPA, which is retroactive to the first day of the quarter submitted). Changes states can implement through a SPA include expanding eligibility, adopting presumptive eligibility, providing 12-month continuous eligibility for children, and modifying benefit and cost sharing requirements, among others. Beyond these options, states can seek additional flexibility through Section 1135 and Section 1115 waivers.
The Families First Coronavirus Response Act provides additional options for states and access to increased federal funding subject to states meeting certain eligibility and enrollment requirements. Specifically, it provides coverage for COVID-19 testing with no cost sharing under Medicaid and CHIP (as well as other insurers) and provides 100% federal funding through Medicaid for testing provided to uninsured individuals for the duration of the emergency period associated with COVID-19. The law also provides states and territories a temporary 6.2 percentage point increase in the federal matching rate for Medicaid for the emergency period. To receive this increase, states need to meet certain requirements including: not implementing more restrictive eligibility standards or higher premiums than those in place as of January 1, 2020; providing continuous eligibility for enrollees through the end of the month of the emergency period unless an individual asks to be disenrolled or ceases to be a state resident; and not charging any cost sharing for any testing services or treatments for COVID-19, including vaccines, specialized equipment or therapies.
Tables
Trend and State-by-State Tables
Table 2: State Adoption of Optional Medicaid and CHIP Coverage for Children, January 2020
Table 5: Coordination between Medicaid and Other Systems, January 2020
Table 7: Features of Online Medicaid Accounts, January 2020
Table 8: Mobile Access to Online Medicaid Applications and Accounts, January 2020
Table 9: Income Verification and Real-Time Eligibility Determinations, January 2020
Table 12: Presumptive Eligibility in Medicaid and CHIP, January 2020
Table 13: Premium, Enrollment Fee, and Cost Sharing Requirements for Children, January 2020
Table 14: Premiums and Enrollment Fees for Children at Selected Income Levels, January 2020
Table 15: Disenrollment Policies for Non-Payment of Premiums in Children’s Coverage, January 2020
Endnotes
- Donna Cohen Ross and Caryn Marks, Challenges of Providing Health Coverage for Children and Parents in a Recession, A 50 State Update on Eligibility, Enrollment, Renewal, and Cost-Sharing Practices in Medicaid and SCHIP in 2009, (Washington, DC: Kaiser Family Foundation, January 2009), https://modern.kff.org/medicaid/report/challenges-of-providing-health-coverage-for-children/. ↩︎
- Kaiser Family Foundation, “Analysis of Federal Bills to Strengthen Maternal Health Care,” accessed March 9, 2020, https://modern.kff.org/womens-health-policy/fact-sheet/analysis-of-federal-bills-to-strengthen-maternal-health-care/. ↩︎
- Kaiser Family Foundation, Key Lessons from Medicaid and CHIP for Outreach and Enrollment Under the Affordable Care Act, (Washington, DC: Kaiser Family Foundation, June 4, 2013), https://modern.kff.org/medicaid/issue-brief/key-lessons-from-medicaid-and-chip-for-outreach-and-enrollment-under-the-affordable-care-act/. ↩︎
- Ibid. ↩︎
- Ibid. ↩︎
- Donna Cohen Ross and Laura Cox, Beneath the Surface: Barriers Threaten to Slow Progress on Expanding Health Coverage of Children and Families, A 50 State Update on Eligibility, Enrollment, Renewal, and Cost-Sharing Practices in Medicaid and CHIP, (Washington, DC: Kaiser Family Foundation, October 2004), https://modern.kff.org/wp-content/uploads/2013/01/beneath-the-surface-barriers-threaten-to-slow-progress-on-expanding-health-coverage-of-children-and-families-pdf.pdf and Laura Summer and Cindy Mann, Instability of Public Health Insurance Coverage for Children and their Families: Causes, Consequences, and Remedies, (New York: The Commonwealth Fund, June 2006), http://www.commonwealthfund.org/publications/fund-reports/2006/jun/instability-of-public-health-insurance-coverage-for-children-and-their-families–causes–consequence. ↩︎
- Laura Summer and Cindy Mann, Instability of Public Health Insurance Coverage for Children and their Families: Causes, Consequences, and Remedies, (New York: The Commonwealth Fund, June 2006), http://www.commonwealthfund.org/publications/fund-reports/2006/jun/instability-of-public-health-insurance-coverage-for-children-and-their-families–causes–consequence. ↩︎
- Centers for Medicare and Medicaid Services, “Oversight of State Medicaid Claiming and Program Integrity Expectations,” June 20, 2019, https://www.medicaid.gov/sites/default/files/Federal-Policy-Guidance/Downloads/cib062019.pdf. ↩︎
- Elaine Maag, H. Elizabeth Peters, Anthony Hannagan, Cary Lou, and Julie Siwicki, Income Volatility: New Research Results with Implications for Income Tax Filing and Liabilities, (Washington, DC: Urban Institute, 2017), https://www.urban.org/sites/default/files/publication/90431/2001284-income-volatility-new-research-results-with-implications-for-income-tax-filing-and-liabilities_0.pdf. ↩︎
- Rachel Garfield, Robin Rudowitz, Kendal Orgera and Anthony Damico, Understanding the Intersection of Medicaid and Work: What Does the Data Say?, (Washington, DC: Kaiser Family Foundation, August 2019), https://modern.kff.org/report-section/understanding-the-intersection-of-medicaid-and-work-what-does-the-data-say-issue-brief/. ↩︎
- Robin Phinney, “Exploring Residential Mobility among Low-Income Families.” Social Service Review 87, no. 4 (2013): 780-815. Accessed March 8, 2020. doi:10.1086/673963. ↩︎
- Centers for Medicare and Medicaid Services, “MAGI 2.0: Building MAGI Knowledge,” September 1, 2016, https://www.medicaid.gov/state-resource-center/mac-learning-collaboratives/downloads/part-2-income.pdf. ↩︎
- Arizona has obtained waiver approval to charge premiums to certain expansion adults but the state has not implemented as of January 2020. In 2019, the courts struck down Kentucky’s waiver that included monthly charges for adults, and, under new state leadership, the state ultimately waiver withdrew its waiver request. New Mexico also had obtained a waiver to charge premiums for certain adults starting in 2019; however, the new governor amended the waiver to remove this authority and does not intend to implement premiums. ↩︎