State Options for Medicaid Coverage of Inpatient Behavioral Health Services
Executive Summary
Since Medicaid’s inception, federal law has generally prohibited states from using Medicaid funds for services provided to nonelderly adults in “institutions for mental disease” (IMDs).1 The IMD payment exclusion was intended to leave states with the primary responsibility for financing inpatient behavioral health services.2 However, the lack of federal funding may limit access to needed inpatient services and contribute to high levels of unmet need. In recent years, the federal government has provided new mechanisms for states to finance IMD services for nonelderly adults through Medicaid in certain situations. There are now four options for states to cover these services: Section 1115 demonstration waivers, managed care “in lieu of” authority, disproportionate share hospital payments, and the SUPPORT Act state plan option.
This report provides new data to understand current patterns of Medicaid enrollees’ use of inpatient and outpatient substance use disorder (SUD) and mental health treatment services; explains the options for states to access federal Medicaid funds for enrollees receiving IMD services; analyzes current waiver activity; and draws on interviews with policymakers in two states and one county using IMD waivers to examine successes and challenges. Appendix Tables contain state-level data. Key findings include:
- Many nonelderly Medicaid adults with a behavioral health condition report unmet treatment needs. Though Medicaid adults with behavioral health needs are more likely than those privately insured to have used services in the past year, treatment rates are low across all payers, including payers not subject to the IMD payment exclusion. Most Medicaid adults who receive behavioral health treatment do so as outpatients.
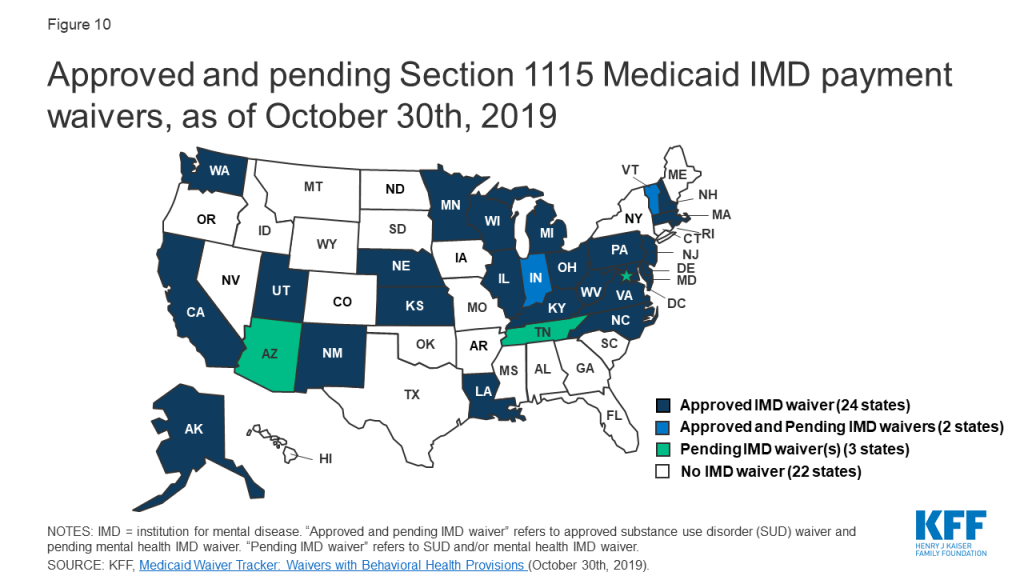
- Twenty-six states have a Section 1115 waiver to use Medicaid funds for IMD SUD services, as of November 2019. Vermont is the only state with an IMD mental health waiver to date.
- Interviews with policymakers in two states and one county using IMD waivers reveal that all devoted substantial time and resources to expanding and strengthening available community-based SUD treatment services in addition to IMD services. All three report overall positive experiences with their waivers, along with some implementation challenges that had to be resolved.
- Early waiver evaluation results in the case study areas show more Medicaid enrollees using SUD services and increased provider participation since allowing IMD payment. Policymakers also described some constraints of the IMD waivers, particularly around the length of stay limits.
As states continue to seek Medicaid IMD payments, key issues to watch include capacity and utilization of treatment services across the care continuum, IMD day limits, discharge planning and care transitions, and the continued evolution of evidence-based best practices for SUD and mental health treatment.
Report
What Behavioral Health Services Does Medicaid Cover?
Medicaid covers many behavioral health services, though there is not a specifically defined category of Medicaid benefits dedicated to behavioral health. Some behavioral health services fall under mandatory Medicaid benefit categories that all states must cover. For example, psychiatrist services are covered under the required “physician services” category. States also cover behavioral health services through optional benefit categories that states may choose to include in their Medicaid programs, such as case management or prescription drugs (which all states do). One important benefit category for behavioral health is the rehabilitative services option, through which states commonly cover non-clinical behavioral health services such as peer support and community residential services. In addition, under waiver or state plan authority, states can provide home and community-based long-term care behavioral health services that support independent community living, such as day treatment and psychosocial rehabilitation services. While all states that participate in Medicaid must cover inpatient services, federal law prohibits payment for services provided in IMDs, as further described below. Box 1 provides examples of behavioral health services that may be covered by Medicaid. A glossary defining key Medicaid behavioral terms is included in the Appendix.
Medicaid coverage of behavioral health services is sometimes more comprehensive than private insurance coverage. While many private insurance plans cover psychiatric hospital visits, in some states, Medicaid is more likely to cover additional services, such as case management, individual and group therapy, detoxification, and medication management. Medicaid is the primary payer for long-term services and supports on which many people with disabilities, including those with mental health needs, rely to live independently in the community.
Box 1: Examples of Medicaid Behavioral Health Services
- Institutional care and intensive services for some populations, such as psychiatric hospital visits, 23-hour psychiatric observation, psychiatric residential, inpatient detoxification, and SUD residential rehabilitation, except for services provided in IMDs.
- Outpatient services, such as case management, psychiatric evaluation, psychiatric testing, psychological testing, individual therapy, group therapy, family therapy, intensive outpatient, outpatient detoxification, methadone maintenance, Suboxone treatment, and medication evaluation, prescription, and management.
- Home and community-based long-term services and supports, such as adult group homes, day treatment, partial hospitalization, psychosocial rehabilitation, supported housing, and supportive employment.
What Are the Patterns of Behavioral Health Treatment Among Nonelderly Medicaid Adults?
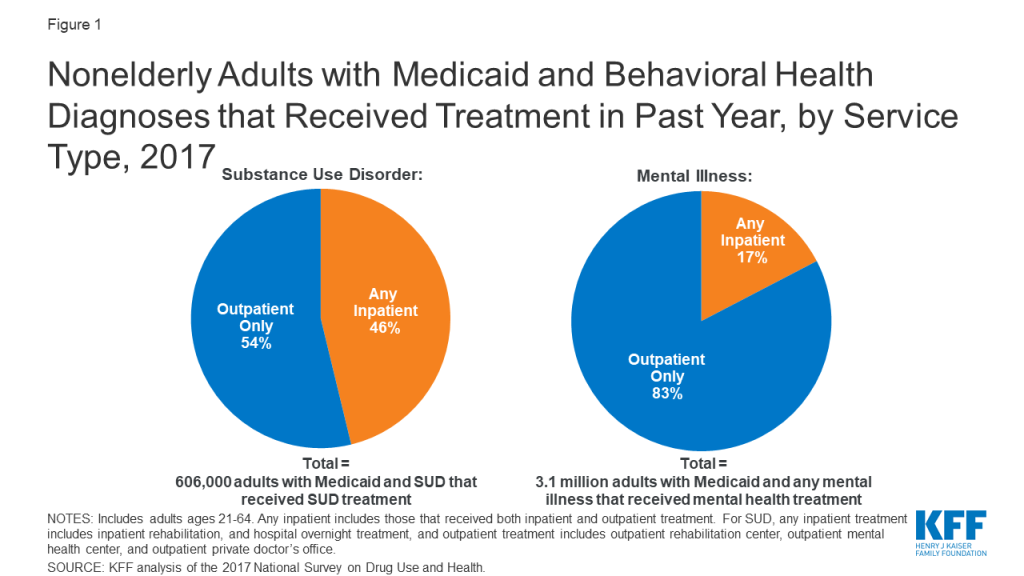
Most nonelderly Medicaid adults receiving behavioral health treatment do so in an outpatient setting, without any inpatient services. In 2017, inpatient services were used by just under half (46%) of nonelderly Medicaid adults with SUD who received drug or alcohol treatment in the past year (Figure 1). A smaller share (17%) of Medicaid enrollees with mental illness who received treatment used inpatient services. The data do not distinguish services provided in IMDs from those provided in other inpatient settings such as a general inpatient hospital.
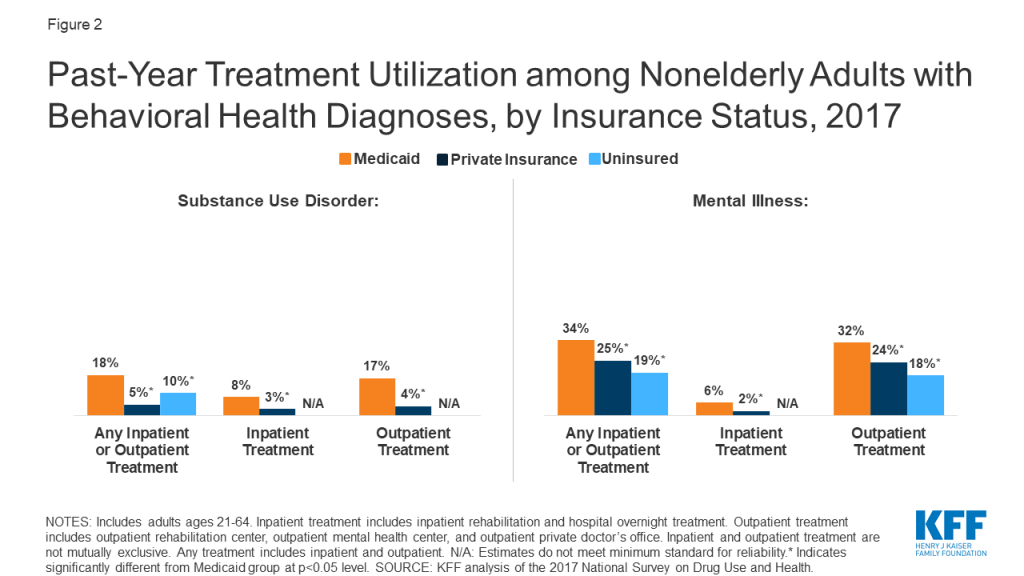
Though nonelderly Medicaid adults with behavioral health needs are significantly more likely than those who are privately insured to have used inpatient and outpatient treatment services in the past year, treatment rates are low across all payers. Among nonelderly adults with SUD, those with Medicaid are more likely have used inpatient treatment services compared to those with private insurance (8% vs. 3%, Figure 2). Similarly, among nonelderly adults with any mental illness, those with Medicaid are more likely to have used inpatient treatment, compared to those with private insurance (6% vs. 2%). Nevertheless, treatment utilization rates (use of treatment services in past year by those with a behavioral health diagnosis), particularly for inpatient treatment, remain low across payers. Inpatient treatment rates are low even for private insurers who, unlike Medicaid, are not subject to the IMD payment exclusion.
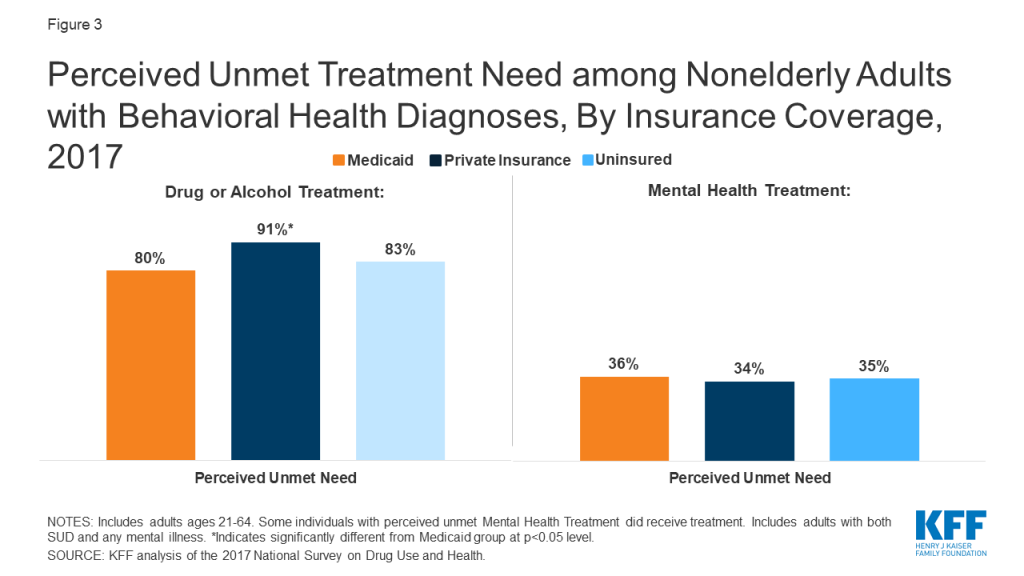
Many people with behavioral health diagnoses report unmet treatment needs. Substantial shares of nonelderly adults with SUD and any mental illness report an unmet need for drug or alcohol treatment, with those with private insurance significantly more likely to have an unmet SUD treatment need compared to those with Medicaid (91% vs. 80%, Figure 3). The share of nonelderly Medicaid adults with SUD and any mental illness reporting an unmet need for mental health treatment is similar to those with private insurance (36% vs. 34%).
Administrative data shows wide state variation in use of inpatient services among nonelderly Medicaid adults who receive mental health or substance use disorder services. In FY 2013, the share of nonelderly Medicaid adults receiving any behavioral health treatment who received any inpatient SUD services ranged from 10% in Alaska to 57% in West Virginia. The share of those receiving any inpatient mental health services ranged from 9% in Alaska to 31% in Alabama and New York (Appendix Table 1). Like the national data discussed above, the state-level data do not separately identify IMD services from other inpatient services. In addition, this data – which is the most recently publicly available – predates the Affordable Care Act’s Medicaid expansion and the opioid epidemic’s impact over the last six years, and consequently may understate the number of enrollees now utilizing these services in states that have implemented the expansion since 2014.3
What is the IMD Payment Exclusion and Its Exceptions?
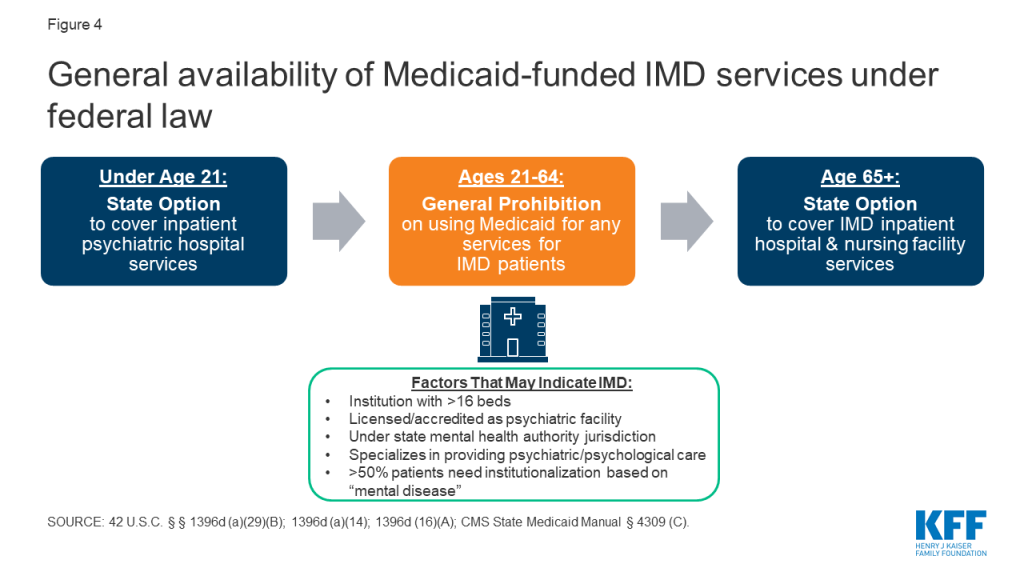
Federal law generally bars states from receiving “any [Medicaid] payments with respect to care or services for any individual who has not attained 65 years of age and who is a patient in an [IMD].”4 The payment exclusion applies to services provided within an IMD as well as to services provided outside an IMD to nonelderly adult IMD patients. An IMD is a “hospital, nursing facility, or other institution of more than 16 beds, that is primarily engaged in providing diagnosis, treatment, or care of persons with mental diseases [sic], including medical attention, nursing care, and related services” (Figure 4).5 Whether a particular facility is an IMD is determined by the state. Figure 4 lists factors considered in this determination. While all states that choose to participate in the Medicaid program must cover inpatient hospital services, those services specifically exclude care provided in IMDs.6 The IMD payment exclusion applies to Medicaid enrollees ages 21 through 64. States have the option to cover inpatient psychiatric hospital services for those under age 217 and IMD inpatient hospital and nursing facility services for those age 65 and older.8
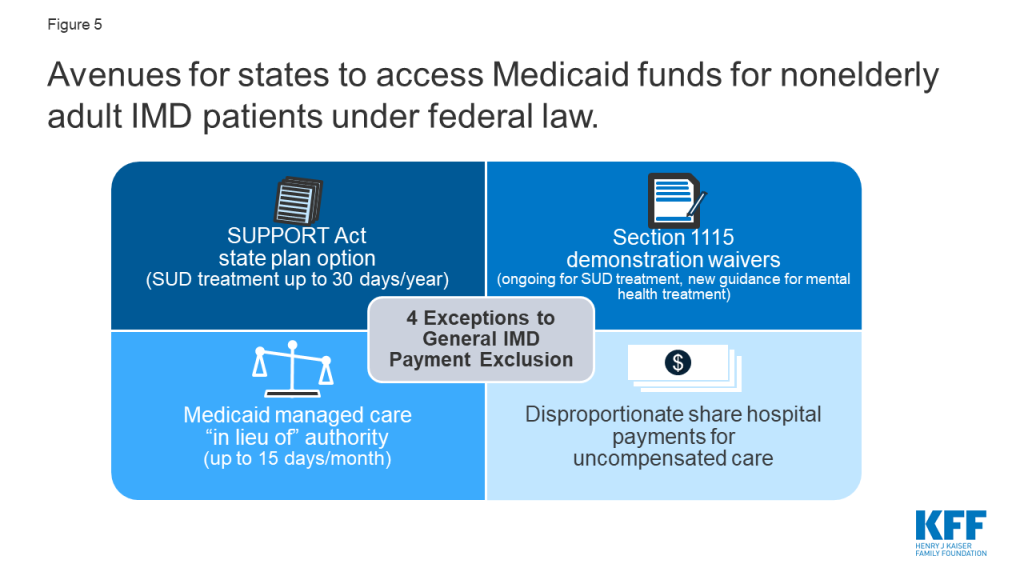
There are four ways that states can receive federal Medicaid funds for IMD services for nonelderly adults. These include Section 1115 demonstration waivers, Medicaid managed care “in lieu of” authority, disproportionate share hospital (DSH) payments, and the SUPPORT Act9 state plan option (beginning in October 2019) (Figure 5). Box 2 discusses considerations for providing institutional services under the Americans with Disabilities Act, separate from Medicaid.
Box 2: Institutional Services and Community Integration
Waiving the IMD payment exclusion and expanding institutional services without also ensuring adequate access to community-based services could have implications for states’ community integration obligations under the Americans with Disabilities Act (ADA) if people with disabilities are inappropriately institutionalized.10 The Supreme Court’s Olmstead decision found that the unjustified institutionalization of people with disabilities violates the ADA. The ADA’s community integration mandate is separate from federal Medicaid law. However, states rely on Medicaid funding to help meet their ADA obligations, because Medicaid is the primary payer for long-term services and supports, including home and community-based services.11 Medicaid also is an important source of financing for behavioral health services, paying for 21% of SUD services and 25% of mental health services as of 2014.12 Consequently, even when providing IMD services to the extent permitted under federal Medicaid law or a waiver, states still separately must meet their independent community integration obligations under the ADA.
Section 1115 waivers
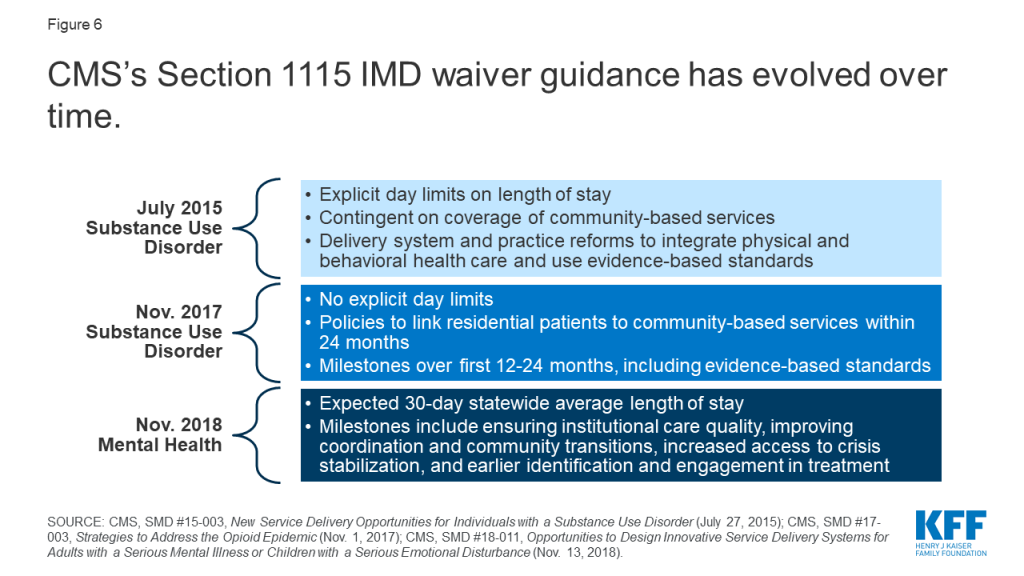
With the opioid epidemic increasing, CMS has been inviting states to apply for Section 1115 IMD SUD waivers,13 with guidance released in 2015,14 and revised in 2017.15 These waivers allow states to test using federal Medicaid funds to provide short-term inpatient and residential SUD treatment services in IMDs. Some of the requirements for these waivers have evolved over time (Figure 6). For example, unlike waivers approved under the 2015 guidance,16 waivers approved under the 2017 guidance do not explicitly limit the length of individual IMD stay.17 In addition, waivers under the 2015 guidance were contingent on states covering community-based SUD treatment services at the time of approval,18 while the 2017 guidance allows states up to two years after waiver approval to cover “critical levels of care.”19 As discussed in more detail below, more than half of states have an approved or pending IMD SUD payment waiver as of November 2019.
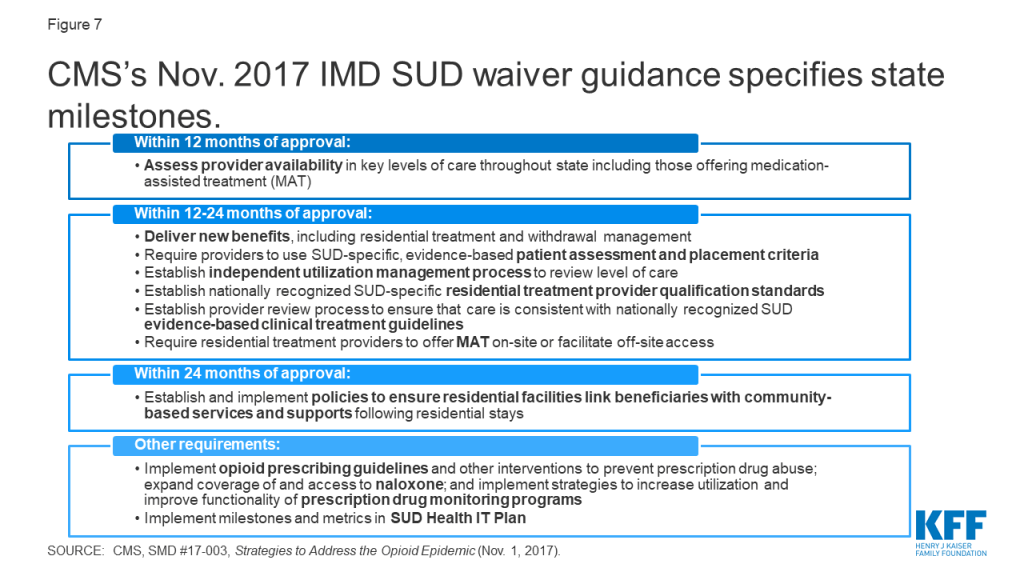
In addition to covering certain levels of care, the 2017 guidance incorporates other milestones that states must achieve during the term of an IMD SUD waiver (Figure 7).20 These include using evidence-based patient placement criteria; applying nationally recognized provider qualification standards; implementing prescribing guidelines and other strategies to address opioid abuse; and improving care coordination and transitions between levels of care.21 CMS’s 2019 IMD SUD waiver evaluation design guidance identifies SUD treatment access and utilization,22 health outcomes,23 and opioid-related overdose deaths as three key areas to assess.24
CMS also reversed long-standing policy and issued new guidance inviting states to apply for Section 1115 IMD payment waivers for mental health services in November 2018 (Figure 6).25 Until this point, CMS had not approved IMD mental health waiver requests in Illinois,26 Massachusetts,27 or North Carolina,28 citing its former policy not to allow Medicaid payments for individuals who receive only mental health treatment in IMDs.29 Under the new guidance, states will have to achieve a set of milestones over the term of these waivers, including ensuring institutional care quality, improving coordination and community transitions, increasing access to crisis stabilization, and earlier identification and engagement in treatment. States that previously had IMD mental health waiver requests that were not approved, as well as states with new requests, can apply for waivers under the 2018 guidance. As of November 2019, only one state (Vermont) has an approved Section 1115 IMD mental health waiver.
Managed care “in lieu of” authority
States with capitated managed care delivery systems can use “in lieu of” authority to cover IMD SUD and mental health services for up to 15 days per month.30 Specifically, states can use federal Medicaid funds for capitation payments to managed care plans that cover IMD inpatient or crisis residential services for nonelderly adults instead of providing other services, such as non-IMD inpatient or outpatient services, that are covered in the state plan benefit package.31 The IMD services must be medically appropriate and cost-effective, and enrollees cannot be required to accept IMD services instead of state plan services. This regulation took effect in July 2016,32 although it codified pre-existing long-standing federal sub-regulatory guidance that allowed federal Medicaid payments for IMD services. However, unlike the regulation, the former guidance did not subject IMD services covered under “in lieu of” authority to a day limit. Of the 41 states using comprehensive risk-based managed care organizations, 31 use Medicaid managed care “in lieu of” authority to cover IMD SUD and/or mental health services in both FY 2019 and FY 2020, and two (MS and NC) report plans to begin doing so in FY 2020.33 Two states reported using the authority in FY 2019 only (Appendix Table 3).34
Disproportionate Share Hospital payments
States can spend a portion of their Medicaid DSH funds on IMD services.35 States must make these payments to offset uncompensated care costs incurred by hospitals that serve a disproportionate number of low-income patients. In FY 2018, 33 states made DSH payments totaling $2.9 billion to mental health treatment facilities including IMDs. These payments ranged from 0.0003% of total DSH payments to mental health facilities in Minnesota to 18% in New York (Appendix Table 4).
Support Act state plan option
The SUPPORT Act partially lifts the IMD payment exclusion by allowing states to use federal Medicaid funds for nonelderly adults receiving IMD SUD services up to 30 days a year,36 from October 2019 through September 2023.37 IMD coverage under the SUPPORT Act option is in addition to IMD services covered under managed care in lieu of authority38 and Section 1115 waivers.39 To receive Medicaid payments under the SUPPORT Act option, IMDs must follow “reliable, evidence-based practices” and offer at least two forms of medication-assisted treatment (MAT) on-site40 for opioid use disorder. Separately, the SUPPORT Act also authorizes Medicaid payments for services provided outside IMDs for pregnant and post-partum women receiving IMD SUD services, as of October 2018.41
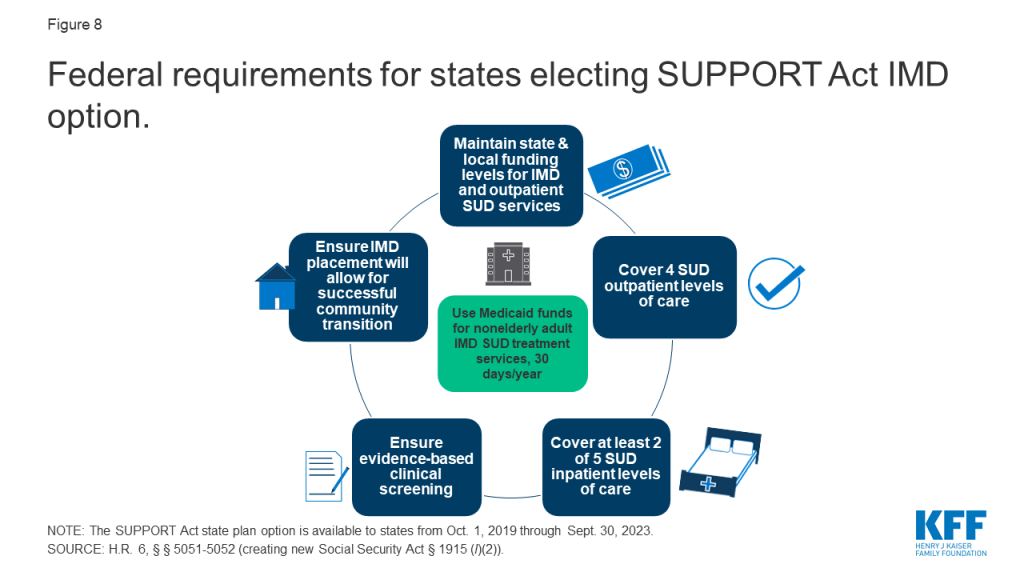
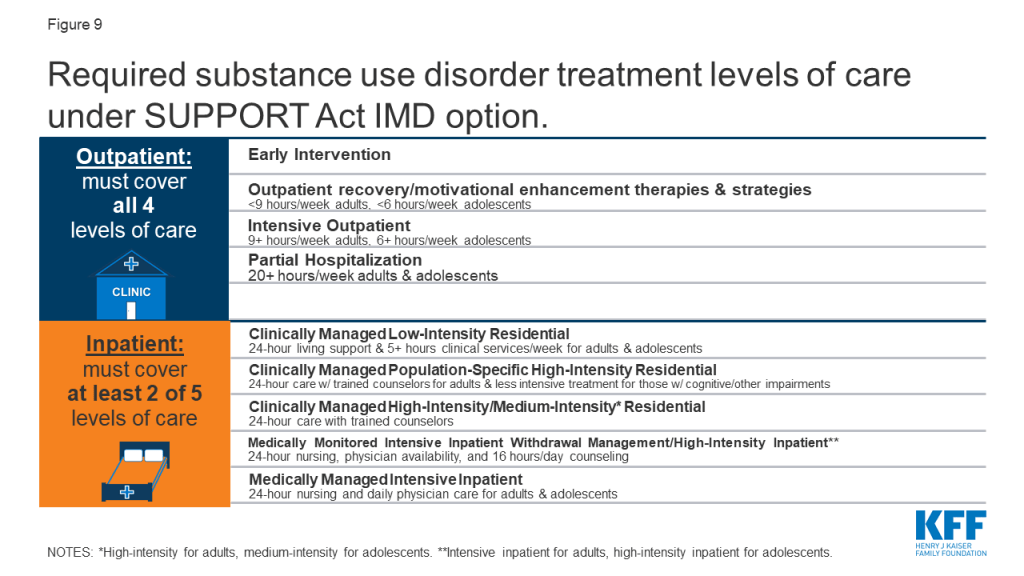
States must satisfy five criteria to qualify for Medicaid funds under the SUPPORT Act option (Figure 8). First, states have to maintain annual state and local funding levels42 for both IMD services and a specific list of community-based outpatient services43 provided to nonelderly adults who become eligible for Medicaid-funded IMD services under the new option. Additionally, states must ensure that nonelderly adults receive “appropriate evidence-based clinical screening” prior to receiving IMD SUD services.44 States also must confirm that IMDs receiving Medicaid payments can provide outpatient services, either themselves or through an established relationship with another facility or provider accepting Medicaid patients, to allow for successful community transitions.45 Finally, states electing the SUPPORT Act option must cover Medicaid SUD treatment services at four outpatient levels of care46 and at least two of five inpatient levels of care47 (Figure 9).
According to a KFF survey, five states report plans to pursue the SUPPORT Act option in FY 2020.48 These states include Idaho, Indiana, New Hampshire, South Dakota, and Tennessee.49 Twenty-one states report that they have not yet determined if they will pursue the SUPPORT Act option,50 and 24 states indicate that they do not plan to pursue this option.51 In explaining the rationale for not pursuing this option, many states noted that they already had a Section 1115 waiver in place or were pursuing such a waiver to allow IMD funding.52 Several states also felt that their Section 1115 waiver would provide more flexible limits on length of IMD stays compared to the 30-day cap on IMD services under the SUPPORT Act option.53 Table 1 compares key elements of Section 1115 IMD waivers with the SUPPORT Act.
| Table 1: Key Elements of Section 1115 Waivers vs. SUPPORT Act Option for IMD Payment | ||
| Program Element | Section 1115 Waiver | SUPPORT Act |
| Type of authority | Waiver | State plan option |
| Length of authority | Initial waivers usually granted for 5 years. States can apply for renewals, usually for 3 years. | Available from October 2019 through September 2023. |
| Type of IMD services allowed | SUD and/or mental health | SUD only |
| Length of stay | Varies by waiver: some numeric day limits, some unspecified, some require 30-day statewide average. | 30 days per year |
| Covered inpatient levels of care | Must cover intensive residential/inpatient and medically supervised withdrawal management within 24 months of waiver approval. | Must cover at least 2 of 5 inpatient levels of care. |
| Covered outpatient levels of care | Must cover outpatient and intensive outpatient services within 24 months of waiver approval. | Must cover all 4 outpatient levels of care. |
| Institutional to community transitions | Must develop policies to link residential patients to community-based services. | Must ensure that IMD placement will allow for successful community transition. |
| Evidence-based practices | Must use evidence-based patient assessment and placement criteria and provide access to MAT. | Must follow evidence-based practices, including clinical screening and MAT. |
| Maintenance of effort | For SUD waivers, CMS encourages states to maintain current funding levels for a continuum of services; waivers should not reduce or divert state spending on behavioral health services. For mental health waivers, CMS will consider a state’s commitment to on-going maintenance of effort on funding outpatient community-based services when approving waivers. | Must maintain state and local funding levels for IMD and outpatient services. |
How Are States Using Medicaid IMD Waivers?
The number of Section 1115 IMD SUD waiver approvals has markedly increased since January 2017. Four states had IMD SUD waivers approved by CMS as of December 31, 2016, and another 22 states have had IMD SUD payment waivers approved since then. Three more states have these waiver requests pending with CMS as of November 2019 (Figure 10 and Appendix Table 2).54 To date, Vermont remains the only state with an existing IMD mental health waiver, the current terms of which require those payments to phase out between 2021 and 2025.55 Vermont recently submitted a request to transition its existing mental health authority to the terms of the new guidance. Additionally, DC and Indiana have submitted pending waiver requests for IMD mental health services under the new guidance, with more states expected to follow. Idaho, Massachusetts, New Hampshire, New Jersey, North Carolina, and Rhode Island report plans to pursue an IMD mental health waiver in FY 2020, while Alaska, Connecticut, Virginia, and Washington report plans to do so after FY 2020.56
While waiver evaluations are still underway, news reports, interim evaluations, and feedback directly from states can inform the ongoing implementation of IMD waivers. While some waiver evaluation results are emerging, most are not expected until 2024 or 2025 (Appendix Table 2).57 Given the attention to state efforts to combat the opioid epidemic and emerging focus on mental health, states are moving forward with waiver implementation. State experience with these initiatives can help inform policy choices and design as other states consider similar waivers. To make some of this information available in advance of formal waiver evaluations, we conducted case studies in two states and one county. Table 2 summarizes the waivers in the three case study areas, and Box 3 describes the case study methodology.
| Table 2: Key Components of Approved 1115 Waivers for California, Virginia, and Vermont | |||
| State | California | Virginia | Vermont |
| Waiver/Program Name | Drug Medi-Cal Organized Delivery System (DMC-ODS) | The Virginia GAP and ARTS Delivery System Transformation | Vermont Global Commitment to Health |
| Approval Date | 8/13/2015 | 12/15/2016 | 1/1/199658 |
| IMD Authority Begins | 1/1/2016 (San Diego County implanted 7/2018) | 4/01/2017 | 1/1/199659 |
| IMD Authority Expires | 12/31/2020 | 12/31/2019 (Submitted amendment to extend) | 12/31/2021 for SUD; mental health to phase-out by 2025 (pending mental health waiver submitted to CMS) |
| SUD Authority | ✓ | ✓ | ✓ |
| Mental Health Authority | ✓ | ||
| Day Limit | 30-day statewide average; 90 day max. | 30-day statewide average | 30-day statewide average |
| SOURCE: KFF analysis of Section 1115 waivers for the IMD Payment Exclusion | |||
Box 3: Overview of Case Study Areas
Because waiver evaluations are ongoing and there is limited information about states’ experiences and outcomes with IMD waivers to date, we conducted case studies in Vermont; San Diego County, California; and Virginia, to provide a snapshot of how these three areas are using IMD waivers and identify common themes and lessons learned. In July 2019, we interviewed state and county officials by phone. We also reviewed publicly available waiver approval, reporting, and evaluation documents. Because San Diego County’s program is part of the California waiver, we also include relevant findings from the overall California waiver evaluation and other California waiver documents as relevant. In addition to considering geographic and political diversity, we chose case study regions to enable us to examine state experiences based on the type of IMD waiver authority (SUD and/or mental health), whether the waiver was approved under the 2015 or 2017 CMS guidance, and duration of implementation (Table 2).
Vermont has long-standing experience with using federal Medicaid funds for both IMD SUD and mental health services, through a Section 1115 waiver dating back to 1996. Vermont’s SUD authority is currently authorized under CMS’s 2017 guidance. Although the current waiver requires Vermont to phase-out IMD mental health funding between 2021 and 2025,60 the state has applied for IMD mental health waiver authority under the 2018 guidance. San Diego County began offering IMD SUD services in July 2018, and is one of the 40 counties participating in California’s Section 1115 waiver Drug Medi-Cal Organized Delivery System pilot program, which was approved under the 2015 guidance.61 Virginia added the Addiction and Recovery Treatment Services (ARTS) Delivery System Transformation Demonstration program, which includes IMD SUD services, to its Section 1115 waiver effective April 2017. Virginia’s waiver initially was approved under the 2015 CMS guidance, although the state subsequently came into compliance with the 2017 guidance.62
Role of Community-Based Services
Interviews with case study areas implementing IMD waivers reveal that some expanded community-based treatment services in addition to IMD services. Notably, Virginia used state funds that previously went to IMD services to finance additional community-based SUD services to complement the IMD SUD services authorized by its waiver. Specifically, Virginia used state plan authority to add recovery supports and expanded medication-assisted treatment to the intensive outpatient, partial hospitalization, and residential levels of care. In addition to IMD residential services, California’s waiver adds enhanced SUD community-based services in the participating counties, including case management, withdrawal management, recovery services, physician consultation, and at county option, additional MAT drugs and partial hospitalization. Without the waiver, the California Medicaid state plan benefit package is limited to outpatient, intensive outpatient, perinatal residential (non-IMD), and opioid treatment program services. Other states not included as case studies for this report similarly expanded community-based services either under or in conjunction with their waivers authorizing payment for IMD services, such as West Virginia,63 Kansas,64 Illinois,65 Alaska,66 Indiana,67 and Wisconsin.68 However, at least one state (Kentucky) has restricted access to some community-based services (methadone) while funding IMD services under its waiver.69
While states believe that newly added community-based services are essential to achieving their waiver goals, utilization of some of the new services during initial implementation has not been as high as expected. Respondents noted that use of recovery supports (Virginia and California)70 and case management (California)71 has been low. As waiver implementation continues, these states are focused on additional provider training to increase new service utilization and improve treatment continuity as enrollees transition among care settings.
States are making efforts to address transitions between inpatient and outpatient care settings. California’s managed care external quality review report recommends that SUD providers at both residential and outpatient levels of care be allowed to bill for services provided to an individual on the same day to align with evidence-based best practices that call for introducing a patient to new treatment staff at least twice before residential discharge.72 This practice is intended to smooth care transitions and increase the rate of community-based treatment engagement after residential discharge. Having implemented bundled payments for episodes of care in 2019, Vermont is transitioning to value-based payments for IMD SUD services by January 2021, seeking to eliminate incentives for longer residential stays resulting in higher provider payments. The model is designed to encourage providers to engage in effective discharge planning, with payment disincentives for rapid readmissions. Virginia requires providers to include comprehensive transition plans and coordination of current care and post-discharge plans related to community services in their treatment plan to ensure continuity of care upon discharge with the individual’s family, school and community.
Provider Networks and Service Delivery Changes
In addition to covering new services, states took steps to expand or maintain IMD residential provider networks for SUD services. San Diego County has worked to develop its residential provider network, while Vermont is focused on maintaining its long-standing network. One challenge in San Diego and other California counties has been helping residential providers establish the record keeping and quality improvement initiatives needed to successfully bill for Medicaid services.73 San Diego’s initiatives in this area include “gentle” reimbursement withholding incentives, in which a portion of provider payment is delayed until certain performance standards are met. San Diego also has spent substantial county staff time offering technical assistance to providers and introduced advance payments so that providers had funding available upfront to establish the needed administrative infrastructure.
States also worked to expand their community-based provider networks and increase payment rates. Virginia has been able to use state funds to fund “significant” provider rate increases for intensive outpatient and partial hospitalization services intended to build the Medicaid provider network. California’s waiver broadens the range of approved SUD treatment providers and allows counties to pay providers at higher than state plan rates to account for geographic differences and encourage providers to add capacity.74
All three areas also have initiatives to improve care coordination across providers to help ensure that enrollees remain connected to care as required under waiver guidance and milestones. For example, Virginia added a new office-based treatment program benefit, which co-locates a buprenorphine waivered provider and a licensed mental health provider, and includes reimbursement for care coordination. Virginia also changed its policy to allow both medical and SUD providers to bill for services for the same patient on the same day. This change was identified as a lesson learned to incentivize engaging patients in SUD treatment when they come in for other needed care. For example, a pregnant woman may see both an obstetrician and an MAT provider on the same day. San Diego County is including peer advocates and social work staff alongside doctors in emergency departments to help connect patients to community-based treatment after discharge.
Utilization and Participation
Evaluation results in all three areas show increased treatment service utilization and provider participation. Results from the first year (April 2017 to March 2018) of waiver implementation in Virginia found that the number of outpatient providers billing for ARTS services increased by 173%;75 the number of Medicaid enrollees who used SUD treatment services increased by 57%;76 and more than 40% of enrollees with SUD received treatment, up from 24% in the prior year.77 In the seven counties that began service delivery in 2017, California’s waiver evaluation found that the number of people accessing treatment increased by about 7%.78 In the three counties included in the California waiver’s managed care external quality review report, the number of enrollees receiving SUD services nearly tripled in the first year of waiver implementation, compared to pre-waiver baseline claims data.79 While not yet included in California’s waiver evaluation findings, San Diego County anecdotally reports a 40 to 50% increase in the number of patients receiving SUD treatment services on both an inpatient and outpatient basis since waiver implementation in July 2018, compared to the corresponding month in the prior year. Vermont’s evaluation for 2013 to 2016 found that rates of initiation and engagement in community-based treatment post inpatient discharge for enrollees who had received IMD services exceeded both the general Vermont Medicaid rate and the national rate for both SUD and psychiatric services.80
California’s waiver evaluation found notable gains in access to residential treatment that could not have been financed by Medicaid without the waiver.81 Additionally, the California waiver’s managed care external quality review report notes that without the IMD payment authority, “[a]pproximately 80 percent of the residential facilities in California would not have qualified for [Medicaid] reimbursement, thus severely limiting treatment options.”82 As of March 2019, San Diego County reported adding 67 IMD beds, which has reduced the number of patients waiting for services.83
Evaluation results also have found decreases in emergency room visits and inpatient hospitalizations. From 2013 through 2016, Vermont’s interim waiver evaluation found that emergency room use within 30-days post-IMD discharge declined compared to emergency room use prior to the IMD admission for both mental health services (with declines ranging from 23 to 44%)84 and SUD services (with declines ranging from 39 to 56%).85 Psychiatric IMD readmission rates averaged 8% after 30 days over the four years, while SUD readmission rates were under 15% across settings (general hospital detox, IMD detox, and IMD residential) during this period.86 During the first 10 months of waiver implementation in Virginia, the number of emergency department visits related to SUD decreased by 14%, and the number of Medicaid enrollees with an acute inpatient admission related to SUD decreased by 4%.87
Implementation Limitations and Challenges
States report that existing IMD authority and policy may limit their efforts to address unique needs of special populations, such as pregnant women and individuals in the criminal justice system. With Vermont’s transition from its older waiver authority to waivers under the more recent CMS guidance, the state will no longer be able to use federal Medicaid funds for a specialized residential treatment facility that serves pregnant women and new mothers and infants. That care delivery model is based on a length of stay of 12 to 18 months, with an average length of stay of six months from 2013 through 2016.88 As a result, including this one program would cause the statewide average length of stay to exceed the 30 days approved in Vermont’s waiver. San Diego County and Virginia both reported unexpected challenges where the courts were ordering defendants to residential SUD treatment instead of incarceration, without regard to the evidence-based placement criteria adopted under the waiver that instead called for outpatient treatment.89 In both cases, Medicaid staff had to educate the courts about the need to order a medical evaluation to determine the appropriate level of care instead mandating residential care in all circumstances.
States report that waiver terms about IMD lengths of stay may not align with current evidence-based or state practices. California’s external quality review report found that the waiver’s limit of two IMD stays per year may be too restrictive because patients often do not complete their initial residential treatment visits, instead leaving in the first week to 10 days, but then later return when they are ready to commit to treatment.90 The report notes that current clinical criteria call for residential treatment to stabilize SUD issues, followed by partial hospitalization or intensive outpatient services, but do not limit residential treatment to two stays per year. In contrast, Virginia’s waiver initially included a 90-day maximum IMD stay, but CMS subsequently removed that provision, recognizing that stays tend to be longer at the lower levels of residential care where the focus is more on supportive services and less on clinical care. While Vermont finds that a 30-day average statewide length of stay is appropriate for SUD treatment, it believes that this limit will be too limiting for mental health treatment, especially with CMS’s newly cited position that federal Medicaid funds will be limited to individual IMD stays that do not exceed 60 days. Vermont’s state hospital serves patients with the most severe needs that can take “substantially longer to stabilize;” the average length of stay there is 120 days. Vermont will be able to meet CMS’s 30-day statewide average requirement by averaging that facility’s stays with another IMD that has more beds and serves patients with less acute needs. However, Vermont is concerned that its ability to use federal Medicaid funds for most of its state hospital patients will be limited because CMS has newly proposed that Medicaid cannot fund individual IMD stays that exceed than 60 days.
States are considering non-waiver exemptions to the IMD waivers, in part due to the time limited nature of waivers. For example, while Vermont reports that its IMD SUD waiver is working well, it also is considering pursuing the SUPPORT Act state plan option. While “largely redundant” of its existing waiver, the state sees the state plan option as more of a “long-term assurance” to have IMD payment authority in place. Virginia noted that it decided to add SUD community-based services using state plan rather than waiver authority as a way of “securing” those services as waivers are not permanent.
States are drawing on their experience with IMD SUD waivers to inform their consideration of whether to pursue and how to design an IMD mental health waiver. Before applying for an IMD SUD waiver, Virginia reviewed its existing Medicaid SUD benefits to determine what was working well and whether there were other evidence-based services that could be added to the benefit package to establish a robust community-based continuum of care. Now, Virginia is similarly assessing its Medicaid-covered mental health services. The state plans to establish a solid community-based services foundation first and then pursue a future IMD mental health waiver. After largely deinstitutionalizing its mental health services over the past 30 years,91 Vermont is working to retain a minimum capacity for patients with the most acute needs.92 The state is concerned that losing its current IMD mental health capacity under the existing federal funding phase-out plan will strain its community-based providers, who would be challenged by having to serve patients with more severe needs and as a result have less capacity to serve those with less severe needs. In Vermont’s experience, providing institutional care for the most acute patients reserves community-based services for those who do not need institutional care.
Looking Ahead
Many people with behavioral health diagnoses report unmet treatment needs, with substantial shares of nonelderly adults with SUD and any mental illness reporting an unmet need for drug or alcohol treatment. Though treatment utilization among nonelderly Medicaid adults with behavioral health needs is greater than the privately insured, treatment rates are low across all payers. Enabling states to access federal Medicaid funds for inpatient SUD and mental health treatment could help to address some of this unmet need and help states to cover services that reflect current evidence-based treatment standards. Additionally, providing federal matching funds for IMD services can free up state dollars previously spent on inpatient treatment to instead fund corresponding expansions in community-based services across the behavioral health care continuum. By law, state initiatives to expand behavioral health services cannot solely focus on inpatient services and instead also must consider community-based services, given states’ community integration obligations under the Americans with Disabilities Act. Thus, state expansion of behavioral health services under efforts to fund IMDs may also address demonstrated unmet treatment needs for outpatient behavioral health services.
The number of states with Section 1115 IMD SUD payment waivers has increased dramatically since 2017, now comprising over half the states. DC, Indiana, and Vermont have submitted applications seeking an IMD mental health payment waiver under the new guidance to date, other states have expressed interest, and more applications are likely to follow. In addition, the SUPPORT Act option for IMD SUD services is newly available to states in October 2019, with a few states expressing interest to date. All three case study areas in this report reported overall positive experiences with their waivers, supported by early evaluation findings, along with some implementation challenges that had to be resolved. Notably, all three areas had devoted substantial time and resources to expanding and strengthening a robust network of community-based SUD treatment services in addition to IMD services. Policymakers reported that receiving federal Medicaid funds for IMD services under the waivers can allow state and local funds to be used to expand community-based service options, increase provider payment rates, and develop other necessary program features that Medicaid does not fund, such as housing.
Given the widespread use of SUD waivers, and the notable policy change now allowing mental health waivers, states, health plans, providers, and enrollees will be interested in evaluation results assessing the waivers’ impact. Key questions include how allowing states to use federal Medicaid funds for IMD services affects access to and utilization of inpatient and outpatient care, health outcomes, care quality, costs, IMD day limits, discharge planning and care transitions, and the continued evolution of evidence-based best practices for SUD and mental health treatment. States may draw on their IMD SUD waiver experience to inform their design and implementation of IMD mental health waivers, and many enrollees have co-occurring SUD and mental health conditions. Still, it is not entirely clear how states’ IMD SUD experience will translate to IMD mental health waivers, given differences in providers and different requirements in CMS guidance. CMS and states may implement policy changes that represent lessons learned based on states’ mid-point assessments toward their waiver milestones. While some waiver evaluation results are emerging, most are not expected until 2024 or 2025. In the meantime, states’ quarterly and annual waiver reports to CMS and interim evaluation findings can provide important information about the waivers’ impact to inform whether CMS makes further Medicaid IMD policy changes and/or whether Congress acts to amend the statute.
This work was supported in part by the Milbank Memorial Fund. We value our funders. KFF maintains full editorial control over all of its policy analysis, polling, and journalism activities. The authors appreciate the time that public officials in Vermont; San Diego County, California; and Virginia, as well as members of the Fund’s Reforming States Group Inpatient Mental Health Financing Workgroup (Nick Macchione, San Diego County; Becky Pasternik-Ikard, Oklahoma; Sue Birch, Washington; Duane Mayes, Alaska; Judy Lee, North Dakota; Kate McEvoy, Connecticut; and Tom Alexander, South Carolina), spent sharing their experience and expertise.
Appendices
- Medicaid Behavioral Health Glossary: Key Terms and Concepts
- Appendix Table 1: Medicaid Beneficiaries Aged 21-64 Receiving SUD and/or Mental Health Services – Inpatient vs. Outpatient Care, FY2013
- Appendix Table 2: Key Components of Approved Section 1115 Waivers for the IMD Payment Exclusion as of Oct. 2019
- Appendix Table 3: States Using Medicaid Managed Care “in lieu of” Authority to Fund IMD Services in FY2019 and/or FY2020
- Appendix Table 4: Disproportionate Share Hospital (DSH) Payments to Mental Health Treatment Facilities in FY 2018
–
Medicaid Behavioral Health Glossary: Key Terms and Concepts
Care Continuum: An integrated system of care that guides and tracks patients over time through a comprehensive array of health services spanning all levels of care.93
Community-based care: Healthcare provided in the home or another community setting and that typically allows the person to stay in their home rather than moving them to a facility to receive care. Examples include home health aides, case management services, and personal care services.94
Disproportionate Share Hospital (DSH) payments: Payments required by federal law from state Medicaid programs to qualifying hospitals that serve a large number of Medicaid and uninsured individuals.95
Inpatient Treatment: Healthcare provided upon admission to a facility, such as a hospital. Typically treats more severe diagnoses, provides 24-hour medical and emotional support, and involves the patient staying in the facility for an extended period of time.
Institution of Mental Disease: Hospital, nursing facility, or other institution of more than 16 beds, that is primarily engaged in providing diagnosis, treatment, or care of persons with mental diseases, including medical attention, nursing care, and related services.96
Institutional Care: Healthcare provided in an institutional setting such as a nursing facility, mental health institution, or an intermediate care facility for individuals with intellectual disability.
Medicaid Managed Care: Delivery system for Medicaid covered services by health plans that accept a set capitated payment for these services through a contract with the state Medicaid agency.97
Olmstead case: 1999 Supreme Court decision that found that the unjustified institutionalization of people with disabilities is illegal discrimination. Requires states to eliminate unnecessary segregation and ensure that persons with disabilities receive services in the most integrated setting appropriate to their needs.98
Outpatient Treatment: Healthcare provided in a part-time setting that allows the patient to continue their day-to-day activities outside of treatment. Typically allows the patient to maintain a more normal daily routine and relies more heavily on social circle support.
Section 1115 Demonstration Waiver: Authority by which HHS Secretary can allow states to test new approaches in Medicaid that differ from what is required by federal statute.99
Serious Emotional Disturbance: Someone under the age of 18 with a diagnosable mental, behavioral, or emotional disorder in the past year, which resulted in functional impairment that substantially interferes with or limits their role or functioning in family, school, or community activities.100
Serious Mental Illness: Someone over the age of 18 with a diagnosable mental, behavior, or emotional disorder that causes serious functional impairment that substantially interferes with or limits one or more major life activities.101
Substance Use Disorder: Recurring use of alcohol or drugs that causes significant clinical and functional impairment.102
SUPPORT Act: Federal law partially lifting the IMD payment exclusion by allowing states to use federal Medicaid funds for nonelderly adults receiving IMD SUD services up to 30 days a year, from October 2019 through September 2023.103
(Back to top)–
(Back to top)–
(Back to top)–
Endnotes
- Nonelderly adults are ages 21-64. “Mental disease” is an antiquated term used in the statute. It comprises “diseases listed as mental disorders in the International Classification of Diseases with the exception of mental retardation [sic], senility, and organic brain syndrome,” including the Diagnostic and Statistical Manual of Mental Disorders, and encompasses alcoholism and other chemical dependency syndromes. CMS State Medicaid Manual § 4309 (D), (E), https://www.cms.gov/Regulations-and-Guidance/guidance/Manuals/Paper-Based-Manuals-Items/CMS021927.html. ↩︎
- David G. Smith and Judith D. Moore, Medicaid Politics and Policy, at 188-89 (2008); see also CMS State Medicaid Manual § 4309 (A)(2), https://www.cms.gov/Regulations-and-Guidance/guidance/Manuals/Paper-Based-Manuals-Items/CMS021927.html. ↩︎
- See Kaiser Family Foundation, Status of State Medicaid Expansion Decisions: Interactive Map (Sept. 20, 2019), https://modern.kff.org/medicaid/issue-brief/status-of-state-medicaid-expansion-decisions-interactive-map/. ↩︎
- 42 U.S.C. § 1396d (a)(29)(B). ↩︎
- 42 U.S.C. § 1396d (i). “Whether an institution is an [IMD] is determined by its overall character as that of a facility established and maintained primarily for the care and treatment of individuals with mental diseases [sic], whether or not it is licensed as such.” 42 C.F.R. § 435.1010. IMDs do not include institutions for people with intellectual disabilities. Id. Whether a particular facility is considered an IMD is based on an assessment of various factors, such as licensure or accreditation as a psychiatric facility; falling under the state’s mental health authority jurisdiction if the facility serves people with mental illness; specializing in providing psychiatric or psychological care and treatment (based on “thorough review” of patient records, an “unusually large” proportion of staff with specialized psychiatric/psychological training, or a large proportion of patients receiving psychopharmacological drugs); and the need for institutionalization resulting from “mental diseases [sic]” for more than 50% of the facility’s patients. CMS State Medicaid Manual § 4309 (C), https://www.cms.gov/Regulations-and-Guidance/guidance/Manuals/Paper-Based-Manuals-Items/CMS021927.html. Other relevant factors also may be considered, such as whether the average age of patients in a nursing facility is significantly lower than a typical nursing facility. Id. Components of entities that are certified as different provider types, such as nursing facilities and hospitals, are considered independent from each other and assessed separately. Id. § 4309 (B). ↩︎
- 42 U.S.C. § 1396d (a)(1); 42 C.F.R. § 440.10. ↩︎
- 42 U.S.C. § 1396d (a)(16)(A). ↩︎
- 42 U.S.C. § 1396d (a)(14). ↩︎
- Substance Use Disorder Prevention that Promotes Opioid Recovery and Treatment for Patients and Communities (SUPPORT) Act, H.R. 6, 115th Congress (2018); see also Kaiser Family Foundation, Federal Legislation to Address the Opioid Crisis: Medicaid Provisions in the SUPPORT Act (Oct. 2018), https://modern.kff.org/medicaid/issue-brief/federal-legislation-to-address-the-opioid-crisis-medicaid-provisions-in-the-support-act/. ↩︎
- Kaiser Family Foundation, Olmstead’s Role in Community Integration for People with Disabilities Under Medicaid: 15 Years After the Supreme Court’s Olmstead Decision (June, 2014), https://modern.kff.org/medicaid/issue-brief/olmsteads-role-in-community-integration-for-people-with-disabilities-under-medicaid-15-years-after-the-supreme-courts-olmstead-decision/. Although the ADA’s anti-discrimination provisions do not apply to individuals who are currently using illegal drugs, the ADA does protect people who previously used illegal drugs and people with mental health disabilities. ADA Title II Technical Assistance Manual, § II-2.3000, https://www.ada.gov/taman2.html. ↩︎
- Kaiser Family Foundation, Medicaid Home and Community-Based Services Enrollment and Spending (April 2019), https://modern.kff.org/report-section/medicaid-home-and-community-based-services-enrollment-and-spending-issue-brief/. ↩︎
- Kaiser Family Foundation, Medicaid’s Role in Financing Behavioral Health Services for Low-Income Individuals (June 2017), https://modern.kff.org/medicaid/issue-brief/medicaids-role-in-financing-behavioral-health-services-for-low-income-individuals/. ↩︎
- Section 1115 of the Social Security Act allows the Health and Human Services Secretary to waive certain provisions of federal Medicaid law for an “experimental, pilot, or demonstration project” that “is likely to assist in promoting the objectives of” the program. 42 U.S.C. § 1315 (a). Section 1115 waiver authority is limited to provisions contained in 42 U.S.C. § 1396a, while the IMD payment exclusion is contained in 42 U.S.C. § 1396d. However, the Secretary has approved IMD payment waivers under Section 1115 expenditure authority, which has been interpreted to independently permit the “costs of such [demonstration] project[s] which would not otherwise be included as [federal Medicaid] expenditures. . . [to] be regarded as expenditures under the State [Medicaid] plan. . . .” 42 U.S.C. § 1315 (a)(2). ↩︎
- CMS, New Service Delivery Opportunities for Individuals with a Substance Use Disorder, SMD #15-003, (July 27, 2015), https://www.medicaid.gov/federal-policy-guidance/downloads/smd15003.pdf. ↩︎
- CMS, Strategies to Address the Opioid Epidemic, SMD #17-003 (Nov. 1, 2017), https://www.medicaid.gov/federal-policy-guidance/downloads/smd17003.pdf. ↩︎
- Waivers issued under the 2015 guidance included specific day limits on IMD stays eligible for federal Medicaid funds: Maryland’s waiver allows two 30-day stays, while California has approval for two 90-day stays for adults and two 30-day stays for adolescents. California allows a one-time 30-day extension if medically necessary, and peri-natal patients may stay for the duration of pregnancy and 60 days post-partum. California’s waiver notes that the average length of stay is 30 days. ↩︎
- Some waivers approved under the 2017 guidance (e.g., KY, LA, UT) do not have an explicit day limit. More recent waivers approved or renewed under the 2017 guidance (e.g. NH, NJ, IL, VT, WA) note that the state “will aim for a statewide average length of stay of 30 days. . . to ensure short-term residential treatment stays.” See, e.g., CMS Special Terms and Conditions, Illinois Behavioral Health Transformation Demonstration, at p.8, section V., ¶ 20 (July 1, 2018-June 30, 2023), https://www.medicaid.gov/Medicaid-CHIP-Program-Information/By-Topics/Waivers/1115/downloads/il/il-behave-health-transform-ca.pdf; CMS Special Terms and Conditions, Vermont Global Commitment to Health Demonstration at p. 53-54, section XV., ¶ 92 (Jan. 1, 2017-Dec. 31, 2021, amended June 6, 2017), https://www.medicaid.gov/Medicaid-CHIP-Program-Information/By-Topics/Waivers/1115/downloads/vt/vt-global-commitment-to-health-ca.pdf. Virginia and West Virginia’s waivers note that the average length of stay is 30 days. ↩︎
- Medicaid community-based behavioral health services can be covered under state plan or waiver authority. The 2015 guidance required states to cover community-based services along with short-term institutional services that “supplement and coordinate with, but do not supplant, community-based services. CMS, New Service Delivery Opportunities for Individuals with a Substance Use Disorder, SMD #15-003, (July 27, 2015), https://www.medicaid.gov/federal-policy-guidance/downloads/smd15003.pdf. ↩︎
- CMS, Strategies to Address the Opioid Epidemic, SMD #17-003 (Nov. 1, 2017), https://www.medicaid.gov/federal-policy-guidance/downloads/smd17003.pdf. The 2017 milestones specify that states must cover outpatient, intensive outpatient, MAT, intensive residential/inpatient, and medically supervised withdrawal management within 12-24 months of waiver approval. Section 1115 SUD Demonstration Guide for Developing Implementation Plan Protocols, https://www.medicaid.gov/medicaid/section-1115-demo/downloads/evaluation-reports/sud-implementation-plan-template.pdf. The 2017 guidance notes that “states should indicate how inpatient and residential care will supplement and coordinate with community-based care in a robust continuum of care in the state” and directs states to “demonstrate how they are implementing evidence-based treatment guidelines.” CMS, Strategies to Address the Opioid Epidemic, SMD #17-003 (Nov. 1, 2017), https://www.medicaid.gov/federal-policy-guidance/downloads/smd17003.pdf. ↩︎
- See also Section 1115 SUD Demonstration Guide for Developing Implementation Plan Protocols, https://www.medicaid.gov/medicaid/section-1115-demo/downloads/evaluation-reports/sud-implementation-plan-template.pdf. ↩︎
- CMS also released a set of 24 required and 12 recommended monitoring metrics for IMD SUD waivers based on Medicaid administrative data that align with the waiver milestones. Monitoring Metrics for Section 1115 Demonstrations with SUD Policies, https://www.medicaid.gov/medicaid/section-1115-demo/downloads/evaluation-reports/sud-monitoring-metrics.pdf; see also Medicaid Section 1115 SUD Demonstration Monitoring Report Template, https://www.medicaid.gov/medicaid/section-1115-demo/downloads/evaluation-reports/sud-monitoring-report-template.pdf; Medicaid Section 1115 SUD Demonstration Monitoring Protocol Template, https://www.medicaid.gov/medicaid/section-1115-demo/evaluation-reports/evaluation-designs-and-reports/index.html. Additionally, states may report on state-identified metrics. ↩︎
- These include increased referrals to and engagement in treatment, increased adherence to treatment, and reduced preventable or medically inappropriate emergency department and inpatient treatment. ↩︎
- These include improved access to care for physical health conditions and fewer preventable or medically inappropriate SUD readmissions. ↩︎
- SUD Section 1115 Demonstration Evaluation Design Technical Assistance (March 6, 2019), https://www.medicaid.gov/medicaid/section-1115-demo/downloads/evaluation-reports/sud-evaluation-design-tech-assistance.pdf. ↩︎
- CMS, SMD #18-011, Opportunities to Design Innovate Service Delivery Systems for Adults with a Serious Mental Illness or Children with a Serious Emotional Disturbance (Nov. 13, 2018), https://www.medicaid.gov/federal-policy-guidance/downloads/smd18011.pdf; see also CMS SMI and SED Demonstration Opportunity Technical Assistance Questions and Answers (May 17, 2019), https://www.medicaid.gov/federal-policy-guidance/downloads/faq051719.pdf. ↩︎
- Letter from CMS Administrator Seema Verma to Illinois Healthcare and Family Services Director Felicia Norwood at 1 (May 7, 2018), https://www.medicaid.gov/Medicaid-CHIP-Program-Information/By-Topics/Waivers/1115/downloads/il/il-behave-health-transform-ca.pdf. ↩︎
- Letter from CMS CMCS Acting Director Tim Hill to MassHealth Assistance [sic] Secretary Daniel Tsai at 3 (June 27, 2018), https://www.medicaid.gov/Medicaid-CHIP-Program-Information/By-Topics/Waivers/1115/downloads/ma/ma-masshealth-ca.pdf. Massachusetts’ approved waiver includes IMD payments as part of the safety net care pool (authorizing payments according to the waiver’s uncompensated cost limit protocol for otherwise covered services for IMD patients at inpatient psychiatric hospitals and community-based detoxification centers as part of the DSH-like Pool) (¶ ¶ 21, 54(a)(i)(3); see also Attachment E, Charts A and B and Attachment H Safety Net Care Pool Uncompensated Care Cost Limit Protocol); for diversionary behavioral health services including those provided by IMDs as part of the managed care benefit package (including acute substance abuse treatment services and substance abuse clinical support services in 24-hour facilities for nonelderly adults) (¶ 40, Table C); and for additional IMD SUD services (clinically managed population-specific high-intensity residential services (specialized treatment services to meet more complex needs) and clinically managed low-intensity residential services (24-hour transitional support services and 24-hour residential rehabilitation services and community-based family SUD treatment services) in 24-hour facilities) (¶ 41, Table D). CMS, MassHealth Medicaid Section 1115 Demonstration Special Terms and Conditions, No. 11-W-00030/1 (approved July 1, 2017-June 30, 2022, amended June 27, 2018), https://www.medicaid.gov/Medicaid-CHIP-Program-Information/By-Topics/Waivers/1115/downloads/ma/ma-masshealth-ca.pdf. In September, 2017, Massachusetts sought an amendment that would have waived all federal payment restrictions on IMD mental health and SUD services for nonelderly adults, including the 15-day managed care limit and the safety net care pool expenditure caps. Commonwealth of Mass. Exec. Office of Health and Human Servs., Office of Medicaid. MassHealth Section 1115 Demonstration Amendment Request (Sept. 8, 2017), https://www.medicaid.gov/Medicaid-CHIP-Program-Information/By-Topics/Waivers/1115/downloads/ma/ma-masshealth-pa3.pdf. In June, 2018, CMS denied the state’s request to expand the IMD payment waiver beyond the terms already approved. ↩︎
- Letter from CMS Administrator Seema Verma to NC Dep’t of Health & Human Servs. Deputy Sec’y for Med’l Assistance Dave Richard at 5 (Oct. 19, 2018), https://www.medicaid.gov/Medicaid-CHIP-Program-Information/By-Topics/Waivers/1115/downloads/nc/nc-medicaid-reform-ca.pdf. ↩︎
- Another state (Maryland) indicated that CMS denied its request for IMD mental health payment waiver authority, while approving its request for IMD SUD payment authority. GAO, States Fund Services for Adults in Institutions for Mental Disease Using a Variety of Strategies, GAO-17-652 at 34 (Aug. 2017), https://www.gao.gov/assets/690/686456.pdf. ↩︎
- States can effectively receive federal matching funds for capitation payments made for enrollees with IMD stays up to 30 days if the stay does not exceed 15 days in a single month. Kaiser Family Foundation, CMS’s Final Rule on Medicaid Managed Care: A Summary of Major Provisions (June 2016), https://modern.kff.org/medicaid/issue-brief/cmss-final-rule-on-medicaid-managed-care-a-summary-of-major-provisions/. ↩︎
- Id. ↩︎
- The SUPPORT Act incorporates the regulatory provisions into the statute. H.R. 6, § 1013; see also Kaiser Family Foundation, Federal Legislation to Address the Opioid Crisis: Medicaid Provisions in the SUPPORT Act (Oct. 2018), https://modern.kff.org/medicaid/issue-brief/federal-legislation-to-address-the-opioid-crisis-medicaid-provisions-in-the-support-act/. ↩︎
- NC did not have managed care in FY 2019. ↩︎
- NM and WV may have discontinued use of managed care in lieu of authority in FY 2020 due to approval/implementation of Section 1115 IMD SUD waivers. Four states (CA, MD, ND, and PA) reported that they do not use this authority, and two states (GA and KS) did not respond to this question. Kaiser Family Foundation, A View from the States: Key Medicaid Policy Changes, Results from a 50-State Medicaid Budget Survey for State Fiscal Years 2019 and 2020 at 55 (Oct. 2019), https://modern.kff.org/medicaid/report/a-view-from-the-states-key-medicaid-policy-changes-results-from-a-50-state-medicaid-budget-survey-for-state-fiscal-years-2019-and-2020/. ↩︎
- DSH payments to IMDs are limited to the lesser of the state’s FY 1995 DSH payment to IMDs and other mental health facilities or one-third of the state’s FY 1995 DSH allotment. 42 U.S.C. § 1396r-4 (h); GAO, States Fund Services for Adults in Institutions for Mental Disease Using a Variety of Strategies, GAO-17-652 at 34 (Aug. 2017), https://www.gao.gov/assets/690/686456.pdf. ↩︎
- The 30 days do not need to be consecutive. H.R. 6, § 5052 (a)(2) (creating new Social Security Act § 1915 (l)(2)). ↩︎
- H.R. 6, § § 5051-5052; see also Kaiser Family Foundation, Federal Legislation to Address the Opioid Crisis: Medicaid Provisions in the SUPPORT Act (Oct. 2018), https://modern.kff.org/medicaid/issue-brief/federal-legislation-to-address-the-opioid-crisis-medicaid-provisions-in-the-support-act/. The new state plan option authorizes Medicaid funding for 30 days of services provided in IMDs as well as for other medically necessary services provided outside IMDs to IMD patients. H.R. 6, § 5052 (a)(2) (creating new Social Security Act § 1915 (l)(6)). ↩︎
- H.R. 6, § 5052 (a)(2) (creating new Social Security Act § 1915 (l)(5)). ↩︎
- H.R. 6, § 5052 (b) (noting that the new state plan option is not be to be construed as preventing states from conducting Section 1115 demonstration waivers to improve access to and quality of SUD treatment for nonelderly adults). ↩︎
- H.R. 6, § 5052 (a)(2) (creating new Social Security Act § 1915 (l)(7)(C)). MAT must include at least one antagonist (e.g., naltrexone) and one partial agonist (e.g., buprenorphine). Methadone is a full agonist. SAMHSA, Medications for Opioid Use Disorder for Healthcare and Addiction Professionals, Policymakers, Patients, and Families Treatment Improvement Protocol 63 at Exhibit 1-1 (2018), https://store.samhsa.gov/shin/content/SMA18-5063FULLDOC/SMA18-5063FULLDOC.pdf. ↩︎
- H.R. 6, § 1012; see also CMCS Informational Bulletin, State Guidance for the New Limited Exception to the IMD Exclusion for Certain Pregnant and Postpartum Women included in Section 1012 of the Substance Use-Disorder Prevention that Promotes Opioid Recovery and Treatment (SUPPORT) for Patients and Communities Act (Pub. L. 115-271), entitled Help for Moms and Babies (July 26, 2019), https://www.medicaid.gov/federal-policy-guidance/downloads/cib072619-1012.pdf. ↩︎
- State and local funding must remain at the level for the most recent fiscal year prior to SUPPORT Act enactment or the most recently ended fiscal year as of the date the state submits a state plan amendment to elect the new option, if higher. H.R. 6, § 5052 (a)(2) (creating new Social Security Act § 1915 (l)(3)(A)). States must verify compliance with the maintenance of effort requirement before a SUPPORT Act SPA can be approved. Id. The Secretary is to establish a process for state reporting within 8 months of enactment. Id. ↩︎
- The maintenance of effort provision applies to outpatient and community-based SUD treatment services; evidence-based recovery and support services; clinically directed therapeutic treatment to facilitate recovery skills, relapse prevention, and emotional coping strategies; outpatient MAT, related therapies, and pharmacology; counseling and clinical monitoring; outpatient withdrawal management and related treatment designed to alleviate acute emotional, behavioral, cognitive, or biomedical distress resulting from or occurring with alcohol or drug use; routine monitoring of medication adherence; and other outpatient and community-based SUD treatment services designated by the HHS Secretary. Id. ↩︎
- The screening must include “initial and periodic assessment to determine the appropriate level of care, length of stay, and setting of care for each individual.” H.R. 6, § 5052 (a)(2) (creating new Social Security Act § 1915 (l)(4)(B)). Additionally, the SUPPORT Act IMD option shall not be construed as encouraging states to place individuals in inpatient or residential settings when home or community-based services would be more appropriate. H.R. 6, § 5052 (b). ↩︎
- H.R. 6, § 5052 (a)(2) (creating new Social Security Act § 1915 (l)(4)(D)(ii)). The state must consider the proximity to an individual’s support network, such as family members, employment, counseling, and other services near an individual’s residence. H.R. 6, § 5052 (a)(2) (creating new Social Security Act § 1915 (l)(4)(D)(i)). ↩︎
- These include (1) early intervention for those who are at known risk of developing substance-related problems and those for whom there is not yet sufficient information to document a diagnosable SUD; (2) outpatient recovery or motivational enhancement therapies and strategies at less than 9 hours per week for adults and less than 6 hours per week for adolescents; (3) intensive outpatient to treat multidimensional instability at 9 hours or more per week for adults and 6 hours or more per week for adolescents; and (4) partial hospitalization to treat multidimensional instability that does not require 24-hour care at 20 hours or more per week for adults and adolescents. H.R. 6, § 5052 (a)(2) (creating new Social Security Act § 1915 (l)(4)(C)). ↩︎
- These include: (1) clinically managed low-intensity residential services for adults and adolescents, including 24-hour living support with trained personnel and at least 5 hours of clinical services per week per individual; (2) clinically managed population-specific high intensity residential services to stabilize multidimensional imminent danger and provide less intense milieu and group treatment for those with cognitive or other impairments unable to use full active milieu or therapeutic community for adults, including 24-hour care with trained counselors and less intensive treatment for those with cognitive or other impairments; (3) clinically managed high intensity residential services intended to stabilize multi-dimensional imminent danger and prepare for outpatient treatment for adults and clinically managed medium-intensity residential services for adolescents, including 24-hour care with trained counselors; (4) medically monitored intensive inpatient withdrawal management for adults and medically monitored high-intensity inpatient services for adolescents, including 24-hour nursing care, physician availability for significant problems, and 16 hours per day of counseling services; and (5) medically managed intensive inpatient services targeted to individuals with severe unstable problems in acute intoxication and/or withdrawal potential, biomedical conditions and complications, and emotional, behavioral or cognitive conditions and complications for adults and adolescents, including 24-hour nursing care and daily physician care. H.R. 6, § 5052 (a)(2) (creating new Social Security Act § 1915 (l)(4)(C)(ii) and (7)(A)). The SUPPORT Act requires physician availability for significant problems in ASAM Dimensions 1, 2, and 3. Id. These include significant problems in acute intoxication and/or withdrawal potential, biomedical conditions and complications, and emotional, behavioral or cognitive conditions and complications. Amer. Soc’y of Addiction Med., At A Glance: The Six Dimensions of Multidimensional Assessment, last accessed Oct. 24, 2019, https://www.asam.org/resources/the-asam-criteria/about. ↩︎
- Kaiser Family Foundation, A View from the States: Key Medicaid Policy Changes, Results from a 50-State Medicaid Budget Survey for State Fiscal Years 2019 and 2020 at 55 (Oct. 2019), https://modern.kff.org/medicaid/report/a-view-from-the-states-key-medicaid-policy-changes-results-from-a-50-state-medicaid-budget-survey-for-state-fiscal-years-2019-and-2020/. ↩︎
- Id. at Table 9. ↩︎
- These states include AL, AK, AZ, AR, FL, GA, HI, KS, KY, MA, MN, MT, NV, NM, NY, OK, UT, VT, WV, WI, and WY. Id. ↩︎
- These states include CA, CO, CT, DE, DC, IL, IA, LA, ME, MI, MS, MO, NE, NJ, NC, ND, OH, OR, PA, RI, SC, TX, UT, and WA. In addition, MD did not respond to this survey question. Id. ↩︎
- Id. at 55. ↩︎
- Id. ↩︎
- Kaiser Family Foundation, Medicaid Waiver Tracker: Approved and Pending Section 1115 Waivers by State (Oct. 9, 2019), https://modern.kff.org/medicaid/issue-brief/medicaid-waiver-tracker-approved-and-pending-section-1115-waivers-by-state/. ↩︎
- Vermont had sought expanded waiver authority for IMD mental health services along with new SUD authority, but CMS approved only the SUD authority. Letter from CMS, CMCS Acting Director Timothy B. Hill to Vermont Agency of Human Services Secretary Al Gobeille, at 1 (June 6, 2018), https://www.medicaid.gov/Medicaid-CHIP-Program-Information/By-Topics/Waivers/1115/downloads/vt/vt-global-commitment-to-health-ca.pdf. ↩︎
- Other states’ plans were undetermined at the time of this survey, with the exception of MD, which did not respond to this question. Kaiser Family Foundation, A View from the States: Key Medicaid Policy Changes, Results from a 50-State Medicaid Budget Survey for State Fiscal Years 2019 and 2020 at 55 and Table 9 (Oct. 2019), https://modern.kff.org/medicaid/report/a-view-from-the-states-key-medicaid-policy-changes-results-from-a-50-state-medicaid-budget-survey-for-state-fiscal-years-2019-and-2020/. ↩︎
- Additionally, the SUPPORT Act directs MACPAC to study Medicaid payments to IMDs in a representative sample of at least two states by January 2020. The study must include the number of IMDs, facility type, and any coverage limits; services provided and clinical assessment, reassessment, and discharge processes; any federal waivers and other Medicaid funding sources such as supplemental payments; state certification, licensure, and accreditation requirements; state quality, clinical, and facility standards; and recommendations for Congress and CMS to improve care, standards, and data collection. H.R. 6, § 5011-5012. ↩︎
- “As part of its original 1115 Demonstration for the Vermont Health Access Plan (VHAP) Medicaid Expansion, Vermont received a waiver of the IMD exclusion. This waiver, effective January 1, 1996, permitted Vermont to reimburse IMDs for individuals enrolled under the 1115 Demonstration. At that time, the rationale behind this waiver was to permit the use of IMDs as alternatives to potentially more costly, general acute hospital services. . . The IMD waiver was completely phased out January 1, 2006. . . Since 2005 Vermont has used its “in lieu of” authority under [the] Global Commitment [to Health Section 1115 Demonstration to fund IMD services.]” The Pacific Health Policy Group, Vermont Global Commitment to Health Section 1115 (a) Medicaid Demonstration 11-W-00194/1, Interim Evaluation Report #1, including Evaluation of IMD Expenditures at 39-40 (March 30, 2018), https://dvha.vermont.gov/administration/vt-gc-1115-demo-interim-eval-report-final-apr2-18.pdf. ↩︎
- See id. ↩︎
- Vermont Agency of Human Servs., Global Commitment to Health Section 1115 Medicaid Demonstration, 11-W-00194/1, Final Evaluation Design Extension Period Jan. 1, 2017-Dec. 31, 2018, Amended June 6, 2018, Effective July 1, 2018, at 11 (approved by CMS June 19, 2019), https://www.medicaid.gov/Medicaid-CHIP-Program-Information/By-Topics/Waivers/1115/downloads/vt/Global-Commitment-to-Health/vt-global-commitment-to-health-eval-dsgn-appvl-20190609.pdf. ↩︎
- CMS Special Terms and Conditions, California Medi-Cal 2020 Demonstration, #11-W-00193/9 (approved Dec. 30, 2015-Dec. 31, 2020, amended June 7, 2018), https://www.medicaid.gov/Medicaid-CHIP-Program-Information/By-Topics/Waivers/1115/downloads/ca/ca-medi-cal-2020-ca.pdf . The counties serve as managed care plans, overseeing provider qualifications and training, network adequacy, quality assurance and performance improvement, beneficiary rights and protections, program integrity, and service delivery. California Health Care Foundation, Medi-Cal Moves Addiction Treatment into the Mainstream: Early Lessons from the Drug Medi-Cal Organized Delivery System Pilots at 4, 5 (Aug. 2018), https://www.chcf.org/wp-content/uploads/2018/08/MediCalMovesAddictionTreatmentToMainstream.pdf. ↩︎
- CMS Special Terms and Conditions, Virginia Governor’s Access Plan for the Seriously Mentally Ill (GAP) and Addiction and Recovery Treatment Services (ARTS) Delivery System Transformation Demonstration, #11-W-00297/3 (approved Jan. 12, 2015-Dec. 31, 2019, amended Sept. 22, 2017), https://www.medicaid.gov/Medicaid-CHIP-Program-Information/By-Topics/Waivers/1115/downloads/va/va-gov-access-plan-gap-ca.pdf. ↩︎
- WV added methadone and peer recovery supports. CMS Special Terms and Conditions, West Virginia Continuum of Care for Medicaid Enrollees with Substance Use Disorders, #11-W-00307/3 (approved Jan. 1, 2018-Dec. 31, 2022), https://www.medicaid.gov/Medicaid-CHIP-Program-Information/By-Topics/Waivers/1115/downloads/wv/wv-creating-continuum-care-medicaid-enrollees-substance-ca.pdf. ↩︎
- Kansas’ waiver added SUD rehabilitation services intended to avoid preventable inpatient hospitalizations and also includes a pilot program to provide supported employment services to 500 enrollees with a behavioral health diagnosis, including those with co-occurring SUD, who receive SSI or SSDI benefits. CMS Special Terms and Conditions, KanCare, No. 11-W-00238/7 (Jan. 1, 2019-Dec. 31, 2023), https://www.medicaid.gov/Medicaid-CHIP-Program-Information/By-Topics/Waivers/1115/downloads/ks/ks-kancare-ca.pdf. ↩︎
- Illinois is piloting case management, peer recovery supports, and supported employment services. CMS Special Terms and Conditions, Illinois Behavioral Health Transformation Section 1115 (a) Demonstration, #11W00316/5 (approved July 1, 2018-June 30, 2023), https://www.medicaid.gov/Medicaid-CHIP-Program-Information/By-Topics/Waivers/1115/downloads/il/il-behave-health-transform-ca.pdf. ↩︎
- Alaska expanded some HCBS under state plan authority and is using the waiver to pilot case management, peer recovery supports, and supported employment services. CMS Special Terms and Conditions, Alaska Substance Use Disorder and Behavioral Health Program, No. 11-W-00318/0 (Jan. 1, 2019-Dec. 31, 2023), https://www.medicaid.gov/Medicaid-CHIP-Program-Information/By-Topics/Waivers/1115/downloads/ak/ak-behavioral-health-demo-ca.pdf. ↩︎
- IN expanded HCBS using state plan authority. CMS Special Terms and Conditions, Healthy Indiana Plan (HIP), #11-W-00296/5 (approved Feb. 1, 2018-Dec. 31, 2020), https://www.medicaid.gov/Medicaid-CHIP-Program-Information/By-Topics/Waivers/1115/downloads/in/in-healthy-indiana-plan-support-20-ca.pdf. ↩︎
- WI expanded HCBS using state plan authority. CMS Special Terms and Conditions, Wisconsin BadgerCare Reform, #11-W-00293/5 (approved Oct. 31, 2018-Dec. 31, 2023), https://www.medicaid.gov/Medicaid-CHIP-Program-Information/By-Topics/Waivers/1115/downloads/wi/wi-badgercare-reform-ca.pdf. ↩︎
- KY added methadone using state plan authority contingent on waiver authority that eliminates the requirement for the state to provide non-emergency medical transportation for enrollees to access those services. CMS Special Terms and Conditions, KY HEALTH 1115 Demonstration, #11-W-00306/4 and 21-W-00067/4 (approved Jan. 12, 2018-Sept. 30, 2018, amended Nov. 20, 2018), https://www.medicaid.gov/Medicaid-CHIP-Program-Information/By-Topics/Waivers/1115/downloads/ky/ky-health-ca.pdf. ↩︎
- UCLA Integrated Substance Abuse Programs, California’s Drug Medi-Cal Organized Delivery System 2018 Evaluation Report at 4 (revised Oct. 19, 2018), http://www.uclaisap.org/dmc-ods-eval/assets/documents/2017-2018%20UCLA%20DMC-ODS%20Evaluation%20Report%2011192018.pdf; VCU Health Behavior and Pol’y School of Medicine, An Evaluation Report Prepared for the Va. Dep’t of Med’l Assist. Servs., Addiction and Recovery Treatment Servs. Access and Utilization during the First Year (April 2017-March 2018) at 15, 24 (Aug. 2018), https://hbp.vcu.edu/media/hbp/policybriefs/pdfs/ARTSone-yearreport_8.9.18_Final.pdf. ↩︎
- Behavioral Health Concepts, Drug Medi-Cal Organized Delivery System External Quality Review Report FY 2017-2018 (Nov. 19, 2018), https://www.caleqro.com/data/DMC/County%20&%20Annual%20DMC%20Reports/FY%202017-2018%20Reports/Annual%20Report/CalEQRO%20DMC-ODS%20Statewide%20Annual%20Report%20FY17-18%20.pdf; UCLA Integrated Substance Abuse Programs, California’s Drug Medi-Cal Organized Delivery System 2018 Evaluation Report (revised Oct. 19, 2018), http://www.uclaisap.org/dmc-ods-eval/assets/documents/2017-2018%20UCLA%20DMC-ODS%20Evaluation%20Report%2011192018.pdf. ↩︎
- Behavioral Health Concepts, Drug Medi-Cal Organized Delivery System External Quality Review Report FY 2017-2018 at xii (Nov. 19, 2018), https://www.caleqro.com/data/DMC/County%20&%20Annual%20DMC%20Reports/FY%202017-2018%20Reports/Annual%20Report/CalEQRO%20DMC-ODS%20Statewide%20Annual%20Report%20FY17-18%20.pdf. ↩︎
- See also California Health Care Foundation, How Medi-Cal is Improving Treatment for Substance Use Disorder in California at 2 Dec. 2018), https://www.chcf.org/wp-content/uploads/2018/11/HowMediCalImprovingTreatmentSUD.pdf; California Health Care Foundation, Medi-Cal Moves Addiction Treatment into the Mainstream: Early Lessons from the Drug Medi-Cal Organized Delivery System Pilots at 8-9 (Aug. 2018), https://www.chcf.org/wp-content/uploads/2018/08/MediCalMovesAddictionTreatmentToMainstream.pdf; UCLA Integrated Substance Abuse Programs, California’s Drug Medi-Cal Organized Delivery System 2018 Evaluation Report at 4 (revised Oct. 19, 2018), http://www.uclaisap.org/dmc-ods-eval/assets/documents/2017-2018%20UCLA%20DMC-ODS%20Evaluation%20Report%2011192018.pdf. ↩︎
- California Health Care Foundation, Medi-Cal Moves Addiction Treatment into the Mainstream: Early Lessons from the Drug Medi-Cal Organized Delivery System Pilots at 4, 5, 6 (Aug. 2018), https://www.chcf.org/wp-content/uploads/2018/08/MediCalMovesAddictionTreatmentToMainstream.pdf. ↩︎
- VCU Health Behavior and Pol’y School of Medicine, An Evaluation Report Prepared for the Va. Dep’t of Med’l Assist. Servs., Addiction and Recovery Treatment Servs. Access and Utilization during the First Year (April 2017-March 2018) at 7 (Aug. 2018), https://hbp.vcu.edu/media/hbp/policybriefs/pdfs/ARTSone-yearreport_8.9.18_Final.pdf. ↩︎
- Id. at 10. ↩︎
- Id. at 11. ↩︎
- UCLA Integrated Substance Abuse Programs, California’s Drug Medi-Cal Organized Delivery System 2018 Evaluation Report at 2 (revised Oct. 19, 2018), http://www.uclaisap.org/dmc-ods-eval/assets/documents/2017-2018%20UCLA%20DMC-ODS%20Evaluation%20Report%2011192018.pdf. ↩︎
- Behavioral Health Concepts, Drug Medi-Cal Organized Delivery System External Quality Review Report FY 2017-2018 at 48 (Nov. 19, 2018), https://www.caleqro.com/data/DMC/County%20&%20Annual%20DMC%20Reports/FY%202017-2018%20Reports/Annual%20Report/CalEQRO%20DMC-ODS%20Statewide%20Annual%20Report%20FY17-18%20.pdf. ↩︎
- Vermont uses HEDIS measures. The Pacific Health Policy Group, Vermont Global Commitment to Health Section 1115 (a) Medicaid Demonstration 11-W-00194/1, Interim Evaluation Report #1, including Evaluation of IMD Expenditures at 82-83 (March 30, 2018), https://dvha.vermont.gov/administration/vt-gc-1115-demo-interim-eval-report-final-apr2-18.pdf. ↩︎
- UCLA Integrated Substance Abuse Programs, California’s Drug Medi-Cal Organized Delivery System 2018 Evaluation Report at 2 (revised Oct. 19, 2018), http://www.uclaisap.org/dmc-ods-eval/assets/documents/2017-2018%20UCLA%20DMC-ODS%20Evaluation%20Report%2011192018.pdf. ↩︎
- Behavioral Health Concepts, Drug Medi-Cal Organized Delivery System External Quality Review Report FY 2017-2018 at v (Nov. 19, 2018), LINK. ↩︎
- Dr. Luke Bergmann, Director Behavioral Health Services and Christian Jones, Public Consulting Group, Update on Advancing the Behavioral Health Continuum of Care Through Regional Collaboration and Innovation, Board Conference First Quarterly Update at 9 (March 26, 2019), on file with authors. ↩︎
- The Pacific Health Policy Group, Vermont Global Commitment to Health Section 1115 (a) Medicaid Demonstration 11-W-00194/1, Interim Evaluation Report #1, including Evaluation of IMD Expenditures at 50, 81 (March 30, 2018), https://dvha.vermont.gov/administration/vt-gc-1115-demo-interim-eval-report-final-apr2-18.pdf ↩︎
- Id. at 67, 81. ↩︎
- Id. at 83. ↩︎
- VCU Health Behavior and Pol’y School of Medicine, An Evaluation Report Prepared for the Va. Dep’t of Med’l Assist. Servs., Addiction and Recovery Treatment Servs. Access and Utilization during the First Year (April 2017-March 2018) at 19-21 (Aug. 2018), https://hbp.vcu.edu/media/hbp/policybriefs/pdfs/ARTSone-yearreport_8.9.18_Final.pdf. The evaluation notes “[a]lthough the report did not specifically identify ARTS as the casual mechanism for the decrease in emergency department visits and inpatient admissions, it is consistent with the expectation that increased access to treatment should result in fewer overdoses and other addiction-related health emergencies and hospitalization.” Id. at 24. ↩︎
- The Pacific Health Policy Group, Vermont Global Commitment to Health Section 1115 (a) Medicaid Demonstration 11-W-00194/1, Interim Evaluation Report #1, including Evaluation of IMD Expenditures at 71 (March 30, 2018), https://dvha.vermont.gov/administration/vt-gc-1115-demo-interim-eval-report-final-apr2-18.pdf. Vermont may be able to achieve an average statewide 30-day length of state looking across all IMD SUD and mental health facilities, but CMS policy requires that length of stay be determined separately for SUD vs. mental health services. ↩︎
- See also California Health Care Foundation, How Medi-Cal is Improving Treatment for Substance Use Disorder in California at 2 Dec. 2018), https://www.chcf.org/wp-content/uploads/2018/11/HowMediCalImprovingTreatmentSUD.pdf; California Health Care Foundation, Medi-Cal Moves Addiction Treatment into the Mainstream: Early Lessons from the Drug Medi-Cal Organized Delivery System Pilots at 8 (Aug. 2018), https://www.chcf.org/wp-content/uploads/2018/08/MediCalMovesAddictionTreatmentToMainstream.pdf; Behavioral Health Concepts, Drug Medi-Cal Organized Delivery System External Quality Review Report FY 2017-2018 at x (Nov. 19, 2018), https://www.caleqro.com/data/DMC/County%20&%20Annual%20DMC%20Reports/FY%202017-2018%20Reports/Annual%20Report/CalEQRO%20DMC-ODS%20Statewide%20Annual%20Report%20FY17-18%20.pdf. ↩︎
- Behavioral Health Concepts, Drug Medi-Cal Organized Delivery System External Quality Review Report FY 2017-2018 at xiii (Nov. 19, 2018), https://www.caleqro.com/data/DMC/County%20&%20Annual%20DMC%20Reports/FY%202017-2018%20Reports/Annual%20Report/CalEQRO%20DMC-ODS%20Statewide%20Annual%20Report%20FY17-18%20.pdf. ↩︎
- The Pacific Health Policy Group, Vermont Global Commitment to Health Section 1115 (a) Medicaid Demonstration 11-W-00194/1, Interim Evaluation Report #1, including Evaluation of IMD Expenditures at 40 (March 30, 2018), https://dvha.vermont.gov/administration/vt-gc-1115-demo-interim-eval-report-final-apr2-18.pdf. ↩︎
- Vermont’s existing inpatient mental health capacity may be inadequate to meet patient needs, given reports of psychiatric boarding in emergency rooms due to high occupancy rates and based on nationally recognized level of care placement criteria. Id. at 84. ↩︎
- Connie J. Evashwick, “Creating the continuum of care.” Health matrix (1989), https://www.ncbi.nlm.nih.gov/pubmed/10293297. ↩︎
- Kaiser Family Foundation, Key State Policy Choices About Medicaid Home and Community-Based Services (April 2019), https://modern.kff.org/medicaid/issue-brief/key-state-policy-choices-about-medicaid-home-and-community-based-services/. ↩︎
- CMS, Medicaid Disproportionate Share Hospital (DSH) Payments, https://www.medicaid.gov/medicaid/finance/dsh/index.html. ↩︎
- 42 U.S.C. § 1396d (a)(29)(B). ↩︎
- CMS, Managed Care, https://www.medicaid.gov/medicaid/managed-care/index.html. ↩︎
- Kaiser Family Foundation, Olmstead’s Role in Community Integration for People with Disabilities Under Medicaid: 15 Years After the Supreme Court’s Olmstead Decision (June, 2014), https://modern.kff.org/medicaid/issue-brief/olmsteads-role-in-community-integration-for-people-with-disabilities-under-medicaid-15-years-after-the-supreme-courts-olmstead-decision/. ↩︎
- Kaiser Family Foundation, Section 1115 Medicaid Demonstration Waivers: The Current Landscape of Approved and Pending Waivers (February 2019), https://modern.kff.org/medicaid/issue-brief/section-1115-medicaid-demonstration-waivers-the-current-landscape-of-approved-and-pending-waivers/. ↩︎
- SAMHSA, Mental Health and Substance Use Disorders (April 13, 2019) https://www.samhsa.gov/find-help/disorders. ↩︎
- Id. ↩︎
- Id. ↩︎
- H.R. 6, § 5052 (a)(2) (creating new Social Security Act § 1915 (l)(6)). ↩︎