From Drew Altman: A One-Pager on What’s Wrong with U.S. Health Care
Asked for a one-pager on what’s wrong with the U.S. health system, Dr. Drew Altman, Founding President and CEO, explains the top issues in this piece, published today as his latest column. Altman explains, “We have neither a competitive health care system nor a regulated one—we have a fragmented, micromanaged health system that fails to control costs and makes both patients and health professionals more miserable than they should be…”


 Liz Hamel
 Juliette Cubanski
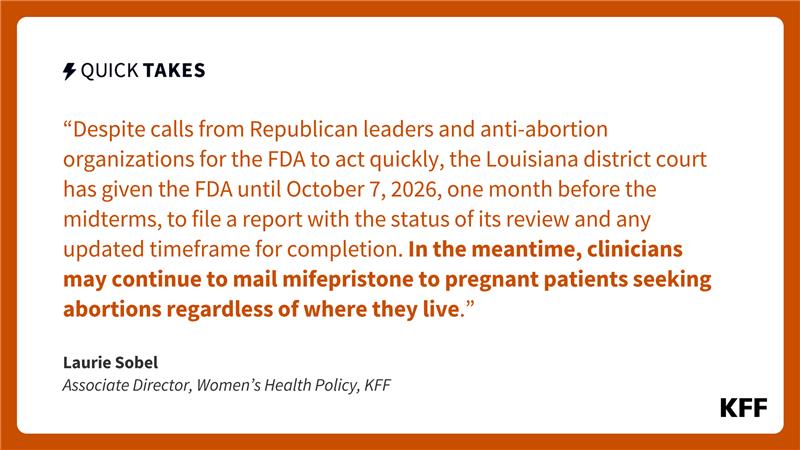
 Laurie Sobel