News Release

New Analysis of Large Employer Health Coverage: The Cost to Families for Health Coverage and Care Has Risen More Than 2X Faster Than Wages and 3X Faster Than Inflation Over the Last Decade 

Published: Aug 15, 2019

A new KFF analysis that looked at both premiums and other out-of-pocket costs shows that families with coverage through a large employer paid 67 percent more for their health benefits and care in 2018 than a decade earlier. In 2018, a typical family of four with large employer coverage spent $4,706 on their share of health premiums and $3,020 on cost sharing (such as deductibles, copayments and coinsurance) for a combined cost to the family of $7,726, the analysis finds. That was up from $2,838 in premiums and $1,779 in cost sharing in 2008, for a combined cost to the family of $4,617 a decade ago. The rise in health costs borne directly by families outstripped the growth in wages (31%) and inflation (21%) over the 10-year period, according to the analysis. Over the same ten-year period, employers’ contributions toward their workers’ health insurance premiums increased 51 percent (from $10,008 to $15,159). The total cost of covering a family with large employer health insurance was $22,885 in 2018, up 56 percent from $14,625 in 2008. Researchers analyzed a sample of health benefit claims from the IBM MarketScan Commercial Claims and Encounters database, as well as KFF’s 2018 Employer Health Benefits Survey, to examine trends in actual employee spending on premiums, deductibles, copayments and coinsurance over time. The analysis is part of the Peterson-Kaiser Health System Tracker, an online information hub dedicated to monitoring and assessing the performance of the U.S. health system. Note: The 2019 KFF Employer Health Benefits Survey that tracks changes in employer health benefits and costs will be released this fall.

Tracking the Rise in Premium Contributions and Cost-Sharing for Families with Large Employer Coverage

Published: Aug 15, 2019

A new KFF analysis that looked at both premiums and other out-of-pocket costs shows that families with coverage through a large employer paid 67% more for their health benefits and care in 2018 than a decade earlier.

In 2018, a typical family of four with large employer coverage spent $4,706 on their share of health premiums and $3,020 on cost sharing (such as deductibles, copayments and coinsurance) for a combined cost to the family of $7,726, the analysis finds. That was up from $2,838 in premiums and $1,779 in cost sharing in 2008, for a combined cost to the family of $4,617 a decade ago.

The analysis of part of the Peterson-Kaiser Health System Tracker, an online information hub dedicated to monitoring and assessing the performance of the U.S. health system.

Changes to “Public Charge” Inadmissibility Rule: Implications for Health and Health Coverage

Published: Aug 12, 2019

Key Takeaways

In August 2019, the Trump Administration announced a final rule that changes the public charge policies used to determine whether an individual applying for admission or adjustment of status is inadmissible to the U.S. Under longstanding policy, the federal government can deny an individual entry into the U.S. or adjustment to legal permanent resident (LPR) status (i.e., a green card) if he or she is determined likely to become a public charge.

  • Under the rule, officials will newly consider use of certain previously excluded programs, including non-emergency Medicaid for non-pregnant adults, the Supplemental Nutrition Assistance Program (SNAP), and several housing programs, in public charge determinations.
  • The changes will create new barriers to getting a green card or immigrating to the U.S. and likely lead to decreases in participation in Medicaid and other programs among immigrant families and their primarily U.S.-born children beyond those directly affected by the new policy. Nationwide, over 13.5 million Medicaid and CHIP enrollees, including 7.6 million children, live in a household with at least one noncitizen or are noncitizens themselves and may be at risk for decreased enrollment a result of the rule.
  • Decreased participation in these programs would contribute to more uninsured individuals and negatively affect the health and financial stability of families and the growth and healthy development of their children.

Introduction

In August 2019, the Trump Administration announced a Department of Homeland Security (DHS) final rule to make changes to “public charge” policies that govern how the use of public benefits may affect individuals’ ability to enter the U.S. or adjust to legal permanent resident (LPR) status (i.e., obtain a “green card”). The final rule does not affect public charge deportability grounds, which are governed by the Department of Justice. The rule broadens the programs that the federal government will consider in public charge determinations to include previously excluded health, nutrition, and housing programs, and outlines the factors the federal government will consider in making a public charge consideration.1  The preamble to the rule indicates that its primary goal is to better ensure that individuals who apply for admission to the U.S., seek an extension of stay or change of status, or apply for adjustment of status, are self-sufficient. The preamble also identifies a range of consequences on the health and financial stability of families, as well as direct and indirect costs associated with the rule. This fact sheet provides an overview of the proposed rule and its implications for health and health coverage of immigrant families.

What Was Public Charge Policy Prior to This Rule?

Under longstanding policy, if authorities determine that an individual is “likely to become a public charge,” they may deny that person’s application for lawful permanent residence or their entry into the U.S.2  Certain immigrants, including refugees and asylees and other humanitarian immigrants, are exempt from public charge determinations under law.

Under previous policy clarified in 1999, the federal government specified that it would not consider use of Medicaid, the Children’s Health Insurance Program (CHIP), or other non-cash programs in public charge determinations. Previously, there was confusion about whether use of Medicaid, CHIP, or other non-cash programs applied in public charge determinations.3  In 1999, the Immigration and Naturalization Service (now part of the Department of Homeland Security (DHS)) issued guidance that defined a public charge as someone who has become or who is likely to become ‘‘primarily dependent on the government for subsistence, as demonstrated by either the receipt of public cash assistance for income maintenance or institutionalization for long-term care at government expense.”4  The guidance specified that the federal government would not consider use of Medicaid, CHIP, or other supportive programs in public charge determinations, with the exception of use of Medicaid for long-term institutional care.5  The guidance noted that this clarification was needed because confusion about policies “deterred eligible aliens and their families, including U.S. citizen children, from seeking important health and nutrition benefits that they are legally entitled to receive. This reluctance to access benefits has an adverse impact not just on the potential recipients, but on public health and the general welfare.”6 

What are the Key Changes in the Rule?

The rule broadens the programs that the federal government will consider in public charge determinations to include previously excluded health, nutrition, and housing programs. The rule redefines a public charge as an “alien who receives one or more public benefits for more than 12 months in the aggregate within any 36-month period (such that, for instance, receipt of two benefits in one month counts as two months),” and defines public benefits to include federal, state, or local cash benefit programs for income maintenance and certain health, nutrition, and housing programs that were previously excluded from public charge determinations, including non-emergency Medicaid for non-pregnant adults, the Supplemental Nutrition Assistance Program (SNAP), and several housing programs (see Appendix Table 1).7  The rule does not include CHIP or subsidies for Affordable Care Act Marketplace coverage as public benefits. Public charge determinations will only consider use of benefits by the individual and will not take into account benefits used by other family members, including children, of the person for whom officials are making the determination.8 

DHS will find an individual “inadmissible” if officials determine that he or she is more likely than not at any time in the future to become a public charge based on the totality of the person’s circumstances. At a minimum, officials must take into account an individual’s age; health; family status; assets, resources, and financial status; and education and skills when making this determination.

The rule identifies characteristics deemed as positive factors that reduce the likelihood of an individual becoming a public charge and negative factors that increase the likelihood of becoming a public charge. In general, being younger or older than working age, having health needs, lacking private health coverage, having limited income or resources, not being employed and not being a primary caregiver, having a lower education level, having limited English proficiency, and using or previously using public benefit programs would be considered negative factors. The rule establishes a new income standard of 125% of the federal poverty level (FPL) ($26,663 for a family of three as of 2019); family income below that standard will be considered to be a negative factor.9 

The rule also identifies heavily weighted negative or positive factors. One heavily weighted negative factor is having received or being approved to receive one or more public benefits for more than 12 months in the aggregate within the 36-month period prior to applying for admission or adjustment of status. Another health-related heavily weighted negative factor includes having a medical condition that is likely to require extensive treatment or institutionalization and being uninsured and lacking the financial resources to pay for the medical costs associated with the condition. Other heavily weighted negative factors include not being a full-time student or employed and having been previously found inadmissible or deportable on public charge grounds. Heavily weighted positive factors include having income above 250% of the FPL ($53,325 for a family of three in 2019) or having private health insurance that is not subsidized by Affordable Care Act tax credits.

The rule will become effective 60 days after it is officially published in the federal register. The rule specifies that DHS will not consider an individual’s use of the previously excluded health, nutrition, and housing programs prior to the effective date.

Who Do the Changes Affect?

The rule will affect individuals seeking to become LPRs or “green card” holders and individuals seeking to immigrate to the U.S. It also will affect certain people seeking to extend or adjust their non-immigrant status while in the U.S. Most individuals seeking to adjust to LPR status or to immigrate to the U.S. are immediate relatives of U.S. citizens or have a family-based sponsor. In 2016, 1.2 million individuals obtained LPR status, including over half a million who were already present in the U.S.10  Some immigrants, including refugees and asylees and other humanitarian immigrants, remain exempt from public charge determinations under law. Public charge policies do not apply to LPRs seeking to obtain citizenship. However, obtaining LPR status is a key step toward citizenship for immigrants seeking naturalization.

The rule will likely increase confusion and fear broadly across immigrant families about using public programs for themselves and their children, regardless of whether they are directly affected by the changes. In 2016, there were 22 million noncitizens residing in the U.S. About six in ten noncitizens were lawfully present immigrants, who include LPRs, refugees, asylees, and other individuals who are authorized to live in the U.S.11  Many individuals live in mixed immigration status families that may include lawfully present immigrants, undocumented immigrants, and/or citizens. Nearly 19 million, or 25% of children, had an immigrant parent as of 2017, and the large majority of these children were citizens. About 10 million, or 13%, were citizen children with a noncitizen parent. (Figure 1).12 

Figure 1: Immigrants and Children of Immigrants as a Share of the Total U.S. Population, 2017

What are the Implications for Health & Health Coverage?

Today, Medicaid fills gaps in private coverage for some lawfully present immigrants, providing them access to health care and financial protections that support their ability to work and care for their children. Medicaid provides families access to preventive and primary care, including prenatal care, as well as care for chronic conditions. In addition, the coverage provides families financial protection from high medical costs. By enabling families to meet their health care needs, Medicaid supports families’ ability to work and care for their children. The majority of lawfully present immigrants live in a family with at least one full-time worker (84%), a rate higher than that of citizens.13  However, lawfully present immigrants are more likely than citizens to live in low-income families and often work in jobs and industries that do not offer health coverage. Medicaid and CHIP coverage help fill this gap, but many lawfully present immigrants remain uninsured due to eligibility restrictions for immigrants that require many otherwise eligible lawfully present immigrants to wait five years after obtaining lawful status before they may enroll as well as barriers to enrollment for eligible immigrants, including fear.14 

The rule will likely lead to declines in participation in Medicaid and other programs broadly across immigrant families, including their primarily U.S.-born children. Previous experience and recent research suggest that the rule will lead individuals to forgo enrollment in or disenroll themselves and their children from public programs because they do not understand the rule’s details and fear their own or their children’s enrollment could negatively affect their or their family members’ immigration status.15  For example, prior to the final rule, there were growing anecdotal reports of individuals disenrolling or choosing not to enroll themselves or their children in Medicaid and CHIP due to growing fears and uncertainty.16  Providers also have reported increasing concerns among parents about enrolling their children in Medicaid and food assistance programs,17  and WIC agencies across a number of states have had enrollment drops that they attribute largely to fears about public charge.18  A survey conducted prior to the final rule found that one in seven adults in immigrant families reported avoiding public benefit programs for fear of risking future green card status, and more than one in five adults in low-income immigrant families reported this fear.19 

Nationwide, 13.5 million Medicaid/CHIP enrollees, including 7.6 million children, live in a household with a noncitizen or are noncitizens themselves and may be at risk for decreased enrollment as a result of the rule. Decreased participation in Medicaid/CHIP would increase the uninsured rate among immigrant families, reducing their access to care and contributing to worse health outcomes. Reduced participation in nutrition and other programs would likely compound these effects. Overall, reduced participation in Medicaid and other programs would negatively affect the health and financial stability of families and the growth and healthy development of their children. As noted in the preamble to the rule, decreased participation in Medicaid and other programs would also reduce federal and state program costs; at the same time, there will be declines in federal payments to states and revenues to health care providers, pharmacies, grocery retailers, agricultural producers, and landlords as well as increased costs for individuals and organizations serving immigrant families.

Outreach and education efforts could minimize chilling effects from the rule. As noted, chilling effects on program participation will likely extend broadly beyond individuals directly affected by the rule’s changes. Outreach and education to immigrant families and communities may help reduce fears and confusion stemming from the rule to reduce this chilling effect. However, overcoming fears and uncertainty in the current environment, particularly as immigration policies continue to evolve and change, may be challenging.

Appendix Table 1: Key Differences between Previous and New “Public Charge” Policies
 Policy Based on 1999 GuidanceUnpublished Final Rule Released August 12, 2019
Definition of Public ChargeAn alien who has become or who is likely to become ‘‘primarily dependent on the government for subsistence, as demonstrated by either the receipt of public cash assistance for income maintenance or institutionalization for long-term care at government expense.’’Public charge means an alien who receives one or more public benefits for more than 12 months in the aggregate within any 36-month period (such that, for instance, receipt of two public benefits in one month counts as two months).
Public Benefits that May Be Considered for Public Charge Purposes
  • SSI
  • TANF
  • State/local cash assistance programs
  • Public assistance for long-term care in an institution (including Medicaid)
  • SSI
  • TANF
  • Federal, state, or local cash benefit programs for income maintenance
  • Non-emergency Medicaid for non-pregnant adults over age 2120 
  • SNAP
  • Section 8 Housing Assistance under the Housing Choice Voucher Program
  • Section 8 Project-Based Rental Assistance
  • Subsidized public housing
Consideration of Use of Public Benefits in a Public Charge Determination
  • May take into consideration past and current receipt of cash public assistance for income maintenance or institutionalized long-term care
  • No weight should be placed on receipt of non-cash benefits or receipt of cash benefits for purposes other than income maintenance
  • Cash benefits received by children or other family members should not be attributed to the individual, unless the family member’s benefits are the family’s sole source of support
  • Will consider whether an individual has applied for, been approved for, or received public benefits
  • Will not consider benefits received by or applied for on behalf of other family members
  • Will not consider benefits received by active duty or reserve service members and their families
  • Will not consider benefits received by an individual during periods in which the individual was present in an immigration category that is exempt from a public charge determination
  • Will not consider benefits received by foreign-born children of U.S. citizen parents who will be automatically eligible to become citizens
Heavily Weighted Negative FactorsNot Specified
  • Has received one or more public benefits for more than 12 months in the aggregate within the prior 36 months
  • Not a full-time student and is authorized to work, but is unable to demonstrate employment, recent employment, or a reasonable prospect of future employment
  • Has a medical condition that requires extensive treatment or institutionalization and is uninsured and does not have sufficient resources to pay for medical costs related to the condition
  • Previously found inadmissible or deportable on public charge grounds
Heavily Weighted Positive FactorsNot Specified
  • Household has financial assets/resources of at least 250% of the FPL
  • Authorized to work or employed with an income of at least 250% of the FPL
  • Individual has private insurance that is not subsidized by Affordable Care Act tax credits
  1. The rule also makes changes related to use of public charge bonds. ↩︎
  2. Becoming a public charge may also be a basis for deportation in extremely limited circumstances. “Public Charge Fact Sheet,” U.S. Citizenship and Immigration Services, https://www.uscis.gov/news/fact-sheets/public-charge-fact-sheet, accessed February 12, 2018. ↩︎
  3. This confusion increased after new Medicaid and CHIP eligibility restrictions were imposed on immigrants in 1996. Those restrictions required many lawfully present immigrants to wait five years after obtaining lawful status before they could enroll in Medicaid or CHIP and made some lawfully present immigrants ineligible for coverage. However, they did not change public charge policy. ↩︎
  4. “Field Guidance on Deportability and Inadmissibility on Public Charge Grounds,” Immigration and Naturalization Service, Justice, 64 Fed. Reg. 28689-28693 (March 26, 1999), https://www.gpo.gov/fdsys/pkg/FR-1999-05-26/pdf/99-13202.pdf. ↩︎
  5. Ibid. ↩︎
  6. Ibid. ↩︎
  7. In the final rule, DHS removed the reference to long-term institutionalization within the definition of public benefit as this care would be provided through programs already included in the new public benefit definition (TANF, SSI, and Medicaid). ↩︎
  8. Public charge determinations will not consider receipt of benefits by active duty or reserve service members or their spouses or children, receipt of benefits during periods in which an individual was present in the U.S. with an immigration status that is exempt from public charge determinations, or receipt of public benefits by foreign-born children of U.S. citizen parents who will be automatically eligible to become citizens. ↩︎
  9. If an individual has income below this standard, DHS will assess whether the total value of the individual’s household assets and resources is at least five times the difference between the household’s annual income and the federal poverty guidelines for his or her household size. Income standards vary for individuals on active duty in the armed forces. ↩︎
  10. “Table 6. Persons Obtaining Lawful Permanent Resident Status by Type and Major Class of Admission: Fiscal Years 2014 to 2016,” 2016 Yearbook of Immigration Statistics, Department of Homeland Security, https://www.dhs.gov/immigration-statistics/yearbook/2016/table6, accessed February 12, 2018. ↩︎
  11. Kaiser Family Foundation analysis of the March 2017 Current Population Survey, Annual Social and Economic Supplement. ↩︎
  12. Kaiser Family Foundation analysis of the March 2017 Current Population Survey, Annual Social and Economic Supplement. ↩︎
  13. Kaiser Family Foundation analysis of the March 2017 Current Population Survey, Annual Social and Economic Supplement. ↩︎
  14. Ibid. ↩︎
  15. Findings show that recent immigration policy changes have increased fears and confusion among broad groups of immigrants beyond those directly affected by the changes. See Samantha Artiga and Petry Ubri, Living in an Immigrant Family in America: How Fear and Toxic Stress are Affecting Daily Life, Well-Being, & Health, (Washington, DC: Kaiser Family Foundation, December 2017), https://modern.kff.org/disparities-policy/issue-brief/living-in-an-immigrant-family-in-america-how-fear-and-toxic-stress-are-affecting-daily-life-well-being-health/ and Samantha Artiga and Barbara Lyons, Family Consequences of Detention/Deportation: Effects on Finances, Health, and Well-Being (Washington, DC: Kaiser Family Foundation, September 2018), https://modern.kff.org/disparities-policy/issue-brief/family-consequences-of-detention-deportation-effects-on-finances-health-and-well-being/. Similarly, earlier experiences show that welfare reform changes increased confusion and fear about enrolling in public benefits among immigrant families beyond those directly affected by the changes. See. Neeraj Kaushal and Robert Kaestner, “Welfare Reform and Health Insurance of Immigrants,” Health Services Research,40(3), (June 2005), https://www.ncbi.nlm.nih.gov/pmc/articles/PMC1361164/; Michael Fix and Jeffrey Passel, Trends in Noncitizens’ and Citizens’ Use of Public Benefits Following Welfare Reform 1994-97 (Washington, DC: The Urban Institute, March 1, 1999) https://www.urban.org/sites/default/files/publication/69781/408086-Trends-in-Noncitizens-and-Citizens-Use-of-Public-Benefits-Following-Welfare-Reform.pdf; Namratha R. Kandula, et. al, “The Unintended Impact of Welfare Reform on the Medicaid Enrollment of Eligible Immigrants, Health Services Research, 39(5), (October 2004), https://www.ncbi.nlm.nih.gov/pmc/articles/PMC1361081/; Rachel Benson Gold, Immigrants and Medicaid After Welfare Reform, (Washington, DC: The Guttmacher Institute, May 1, 2003), https://www.guttmacher.org/gpr/2003/05/immigrants-and-medicaid-after-welfare-reform. ↩︎
  16. Samantha Artiga and Petry Ubri, Living in an Immigrant Family in America: How Fear and Toxic Stress are Affecting Daily Life, Well-Being, & Health, (Washington, DC: Kaiser Family Foundation, December 2017), https://modern.kff.org/disparities-policy/issue-brief/living-in-an-immigrant-family-in-america-how-fear-and-toxic-stress-are-affecting-daily-life-well-being-health/; Samantha Artiga and Barbara Lyons, Family Consequences of Detention/Deportation: Effects on Finances, Health, and Well-Being (Washington, DC: Kaiser Family Foundation, September 2018),https://modern.kff.org/disparities-policy/issue-brief/family-consequences-of-detention-deportation-effects-on-finances-health-and-well-being/; and Hamutal Bernstein, Dulce Gonzalez, Michael Karpman, and Stephen Zuckerman, With Public Charge Rule Looming, One in Seven Adults in Immigrant Families Reported Avoiding Public Benefit Programs in 2018, (Washington, DC: Urban Institute, May 2019), https://www.urban.org/urban-wire/public-charge-rule-looming-one-seven-adults-immigrant-families-reported-avoiding-public-benefit-programs-2018 ↩︎
  17. The Children’s Partnership, “California Children in Immigrant Families: The Health Provider Perspective,” 2018, https://www.childrenspartnership.org/wp-content/uploads/2018/03/Provider-Survey-Inforgraphic-.pdf . ↩︎
  18. Bottemiller Evich, H., “Immigrants, fearing Trump crackdown, drop out of nutrition programs,” Politico (Washington, DC, September 4, 2018). Accessed July 18, 2019, https://www.politico.com/story/2018/09/03/immigrants-nutrition-food-trump-crackdown-806292  ↩︎
  19. Hamutal Bernstein, Dulce Gonzalez, Michael Karpman, and Stephen Zuckerman, With Public Charge Rule Looming, One in Seven Adults in Immigrant Families Reported Avoiding Public Benefit Programs in 2018, (Washington, DC: Urban Institute, May 2019), https://www.urban.org/urban-wire/public-charge-rule-looming-one-seven-adults-immigrant-families-reported-avoiding-public-benefit-programs-2018 ↩︎
  20. Services or benefits funded by Medicaid but provided under the Individuals with Disabilities Education Act and school-based services or benefits provided to individuals who are at or below the oldest age eligible for secondary education as determined under state or local law are not included as a public benefit. ↩︎

Data Note: Prescription Drugs and Older Adults

Published: Aug 9, 2019

Findings

With continued attention from policymakers on prescription drug costs, a 2019 KFF Health Tracking Poll took a deep dive into the views of Americans on a variety of topics related to prescription drugs with special attention paid to the experiences and attitudes of older adults, defined here as people ages 65 and older. Older adults’ experiences with prescription medications can vary significantly based on their health status, how many prescription drugs they are currently taking, and other demographic variables like household income. This data note explores the varied experiences of older adults across such different demographic groups. With most older adults (83%) reporting that they currently have insurance that helps them pay for prescription drugs1 , this data note also explores how older adults chose their prescription drug plans and what they prioritize in their coverage. In addition, it explores older adults’ views on several prescription drug policy options currently being discussed by policymakers.

Prescription Drug Use and Affordability Issues

Nearly nine in ten (89%) adults 65 and older report they are currently taking any prescription medicine. This compares to three-fourths of 50-64 year olds who report taking prescription drugs, half (51%) of 30-49 year olds, and four in ten (38%) 18-29 year olds. Older adults are also more likely than their younger counterparts to be taking multiple prescription medications. More than half of adults 65 and older (54%) report taking four or more prescription drugs compared to one-third of adults 50-64 years old (32%) and about one in ten adults 30-49 (13%) or 18-29 (7%).

Most seniors have prescription drug coverage through Medicare Part D, but majorities across party lines say drug costs are unreasonable. This @KFF data note examines this group’s experiences across a variety of demographics.

While a majority of older adults have prescription drug coverage through Medicare Part D, which is Medicare’s voluntary prescription drug benefit, most older adults (76%) think the cost of prescription drugs is unreasonable. This viewpoint is consistent across party identification, with majorities of Democrats (81%), independents (74%), and Republicans (70%) saying the cost of prescription drugs is unreasonable.

Figure 1: Most Older Adults Say The Cost Of Prescription Drugs Is Unreasonable

Nearly 1 in 4 older adults say it’s difficult to afford their prescription drugs. Who has the most trouble? Those in fair or poor health and those with low incomes. Read more @KFF

In addition, one-fourth of older adults (23%) who take prescription drugs say it is difficult to afford their prescription drugs, including about one in ten (8%) saying it is “very difficult.” As is true among the public as a whole, there are certain groups of older adults who are much more likely to report difficulty affording medications, including those who report being in either “only fair” or “poor” health (45%), whose household income is less than $30,000 annually (34%), and who take four or more prescriptions (28%). These factors are inter-related, as those who are in relatively poor health are also more likely to be taking four or more prescriptions and spending at least $25 a month on their medications.

Figure 2: Older Adults In Fair Or Poor Health More Likely To Report Difficulty Affording Their Prescription Drugs

About one in five older adults (21%) say they did not take their medicines as prescribed at some point in the past year because of the cost. This includes those who report that, due to costs, they haven’t filled a prescription (12% of total older adults), took an over-the counter drug instead (11% of total), or cut pills in half or skipped a dose (8% of total).

Figure 3: About One-Fifth Of Older Adults Report Not Taking Their Prescriptions As Prescribed Due To Cost

Notably, among those who report not taking their medicines as prescribed, slightly more than half (53%) say they didn’t tell their doctor or health care provider (11% of the total) and one-fifth (22%) of this group say their condition got worse as a result of not taking their prescription as recommended (5% of total).

Figure 4: One In Ten Older Adults Didn’t Tell Their Doctor They Did Not Take Their Prescription Medication, Some Say Condition Worsened

Less Than Half Of older adults report discussing the cost of Their prescriptions with their doctor or pharmacist

The KFF polling finds that older adults are more likely to report discussing safety concerns than cost issues with their doctors and pharmacists when getting a new prescription. Seven in ten older adults (72%) say they usually talk to their doctor about the safety and potential side effects of the drug when their doctor writes a prescription for a drug they haven’t taken before. In contrast, around four in ten older adults (43%) say they usually talk to their doctor about whether there is a less expensive alternative, and just over one-third (36%) talk about the cost they will have to pay for the new medication.

Similarly, while half of older adults say they usually talk to their pharmacist about the safety and potential side effects of a new prescription drug, fewer (32%) say they talk to their pharmacist about whether there is a less expensive alternative available. About four in ten (43%) say they talk their doctor about the same thing.

Figure 5: More Seniors Say They Talk About Safety, Side Effects Of a New Drug Than About The Cost Of The Drug

Older adults who report difficulty affording their prescriptions are no more likely to report talking to their doctor or their pharmacist about drug costs than those who report no difficulty affording their medications.

Experiences with Prescription Drug Coverage

People with prescription drug coverage under Medicare Part D are encouraged to compare plans each year to find coverage that best meets their individual needs, based on the specific drugs they take. For 2019, Medicare beneficiaries could choose from among 27 stand-alone Medicare Part D prescription drug plans, and 21 Medicare Advantage prescription drug plans, on average.

Less than four in ten older adults report comparing plan premiums (36%) or co-pays for prescription drugs they were currently taking (36%), and about three in ten (28%) say they compared which prescription drugs were covered by each of the different drug plans. Overall, about half (47%) of older adults who have prescription drug coverage say they did some comparison shopping when choosing their current prescription drug plan.

Figure 6: Half Of Older Adults With Prescription Drug Coverage Report Comparison Shopping When They Chose Their Current Plan

Some older adults report various problems accessing prescription drugs through their plan

Overall, nearly half (45%) of older adults with prescription drug coverage say they have experienced various problems accessing prescription drugs through their drug plan in the past 12 months. Nearly three in ten older adults (28%) report that their plan did not cover a drug prescribed by their doctor. Nearly one-fourth (23%) report that their plan required them to try a less expensive drug before they could get a more expensive drug initially prescribed by their doctor—a utilization management tool known as step therapy—and one in five (21%) report having to wait more than two days to get a prescription filled due to prior authorization requirements by their drug plan.

Figure 7: About Half Of Older Adults With Prescription Drug Coverage Say They’ve Experienced The Following In The Past Year

Certain groups of older adults were more likely than others to report experiencing difficulty with their prescription drug coverage in the past 12 months, including more than half of those with a household income of less than $30,000 a year and just over half of those taking four or more prescription drugs.

Figure 8: About Half Of Older Adults With Drug Coverage Say They’ve Experienced A Problem With Their Plan In The Past Year

Few older adults report using patient assistance programs or other types of discounts

One-fifth of older adults say they have received a discount on a prescription drug in the past year, either through a coupon, a co-pay card, drug company patient assistance program, or some other type of discount. Those who report difficulty affording their medications are no more likely than those who do not report difficulty affording their medications to say they have received a discount on a prescription drug in the past year (25% compared to 20%, respectively).

Figure 9: One-Fifth Of Older Adults Across Groups Say They Have Received A Discount On A Prescription Drug In The Past Year

When older adults with prescription drug coverage were asked what feature of their coverage is more important to them, a larger share say having a lower co-pay at the pharmacy is more important to them than paying a lower premium each month (51% versus 35%). This finding may reflect the greater frequency of payment for prescription drug co-pays versus monthly premiums. In addition, monthly Part D premiums have been relatively stable in recent years, which may help to lessen concerns about premium levels among older adults.

Figure 10: Among Older Adults With Drug Coverage, Most Say They Prioritize Lower Co-Pays Over Premiums

Majorities of Older Adults Support Various Actions Aimed at Keeping Costs Down

Unlike many other health policies that divide partisans, majorities of older adults across party identification favor many of the policy proposals included in the KFF poll, including recent Trump administration proposals like international reference pricing, Democratic proposals to allow the federal government to negotiate drug prices, and bipartisan proposals to add a cap on out-of-pocket spending to Part D. Each of these policy proposals is supported by large majorities of Democrats, independents, and Republicans.

Table 1: Majorities Of Older Adults Across Partisans Say They Favor Medicare Drug Negotiations, Reference Pricing, And Placing Limits On Spending To Lower Drug Costs
Percent of older adults who favor each of the following actions to keep prescription drug costs down:TotalDemocratsIndependentsRepublicans
Allowing the gov’t to negotiate with drug companies to get a lower price for people with Medicare82%88%79%81%
Placing an annual limit on out-of-pocket drug costs for people with Medicare68686773
Lowering what Medicare pays based on amounts in other countries60616158
Allowing Medicare drug plans to put more restrictions on use of certain drugs45484642
Allowing Medicare drug plans to exclude more drugs24282120

Fewer older adults favor allowing Medicare to restrict access to certain prescription medications such as allowing Medicare drug plans to put more restrictions on the use of certain drugs (45%) or allowing these plans to exclude more drugs (24%).

Methodology

This KFF Health Tracking Poll was designed and analyzed by public opinion researchers at the Kaiser Family Foundation (KFF). The survey was conducted February 14th–24th 2019, among a nationally representative random digit dial telephone sample of 1,440 adults ages 18 and older, living in the United States, including Alaska and Hawaii (note: persons without a telephone could not be included in the random selection process). The sample included 290 respondents reached by calling back respondents that had previously completed an interview on the KFF Tracking poll more than nine months ago. This month’s poll also includes an analysis of older Americans age 65 or older (n=606). To obtain a large enough sample, the sampling frame included an oversample of older adults using cell phones (n=26) and landlines (n=75) as well as callbacks to adults who fit the age criterion using the SSRS Omnibus poll (n=136). To efficiently obtain a sample of lower-income and non-White respondents, the sample also included an oversample of prepaid (pay-as-you-go) telephone numbers (25% of the cell phone sample consisted of prepaid numbers) as well as a subsample of respondents who had previously completed Spanish language interviews on the SSRS Omnibus poll (n=11). Both the random digit dial landline and cell phone samples were provided by Marketing Systems Group (MSG).

Computer-assisted telephone interviews conducted by landline (464) and cell phone (976, including 662 who had no landline telephone) were carried out in English and Spanish by SSRS of Glen Mills, PA. For the landline sample, respondents were selected by asking for the youngest adult male or female currently at home based on a random rotation. If no one of that gender was available, interviewers asked to speak with the youngest adult of the opposite gender. For the cell phone sample, interviews were conducted with the adult who answered the phone. KFF paid for all costs associated with the survey with additional funding for the over-sample provided by the John Hopkins’ Bloomberg School of Public Health.

The combined landline and cell phone sample was weighted to balance the sample demographics to match estimates for the national population using data from the Census Bureau’s 2017 American Community Survey (ACS) on sex, age, education, race, Hispanic origin, and region along with data from the 2010 Census on population density. The sample was also weighted to match current patterns of telephone use using data from the January-June 2018 National Health Interview Survey. The weight takes into account the fact that respondents with both a landline and cell phone have a higher probability of selection in the combined sample and also adjusts for the household size for the landline sample, and design modifications, namely, the oversampling of prepaid cell phones and likelihood of non-response for the re-contacted sample. To ensure accurate representation of the older population, the data were weighted separately for those younger than 65 and those 65 or older. All statistical tests of significance account for the effect of weighting.

The margin of sampling error including the design effect for the full sample is plus or minus 3 percentage points. Numbers of respondents and margins of sampling error for key subgroups are shown in the table below. For results based on other subgroups, the margin of sampling error may be higher. Sample sizes and margins of sampling error for other subgroups are available by request. Note that sampling error is only one of many potential sources of error in this or any other public opinion poll. Kaiser Family Foundation public opinion and survey research is a charter member of the Transparency Initiative of the American Association for Public Opinion Research.

GroupN (unweighted)M.O.S.E.
Total1,440±3 percentage points
Adults who currently take prescription medicine1030±4 percentage points
Adults with prescription drug plans1092±4 percentage points
Democrats473±6 percentage points
Republicans410±6 percentage points
Independents397±6 percentage points
Adults, 65 and older606±5 percentage points
Adults, 65 or older, with prescription drug plan513±5 percentage points


Endnotes

  1. Another analysis conducted by the Kaiser Family Foundation of Medicare Part D enrollment data finds about three-fourths of older adults are Part D enrollees (72%), but some older adults may have other sources of drug coverage, such as retiree health benefits or coverage through the Veterans Administration. ↩︎
News Release

As Policymakers Debate Medicare-for-All, Analysis Finds the Medicare Advantage, Individual and Group Health Insurance Markets Appear to Be Profitable, Especially Medicare Advantage

Published: Aug 5, 2019

Three key private health insurance markets — Medicare Advantage, the individual market and the fully-insured group market — appear to be financially healthy and attractive to insurers, according to a new KFF analysis. The private Medicare Advantage market generates significantly larger gross margins per person than the individual market or fully-insured market, the analysis finds. The future of these markets has become a focus for policymakers amid the debate over Medicare for All. Some proposals would essentially eliminate private health insurance, while others would retain a role for it but create a new public program to promote affordability and expanded coverage.  Some of these proposals would allow insurers to contract with the federal government’s public option to provide coverage, modeled on the Medicare Advantage program, in which plans are paid by the federal government. The analysis finds that private insurers achieved annual gross margins of $1,608 per person in Medicare Advantage, on average, between 2016 and 2018, about double the average gross margins in the individual market ($779) and group market ($855). The ACA-compliant individual market was marked by volatility in the early years of the exchanges, with insurers initially setting premiums too low before the market stabilized and insurers returned to pre-ACA profitability levels in 2018 following substantial premium increases. When aggregated across all plans in this analysis for 2016 to 2018, total gross margins averaged $23.9 billion per year for the Medicare Advantage market, $26.5 billion per year for the fully-insured group market and $10.6 billion per year for the much smaller individual market.

Medical loss ratios – medical expenses paid by insurers as a share of the total premiums collected – are similar across all three markets.  But gross margins are much higher for Medicare Advantage insurers because both medical expenses and premiums paid to Medicare Advantage plans are substantially higher, since Medicare enrollees tend to use more health care than people in the individual and group markets. Medicare Advantage plans cover 22 million beneficiaries. Plans purchased by individuals and families in the individual market, including the Affordable Care Act marketplaces in which subsidies are available to some, cover roughly 15 million people. The fully insured group market for employers and their employees, which gets tax-preferred treatment, serves over 30 million people (though most workers are covered through self-insured employer plans). For more analysis of Medicare, private insurance and Medicare for All proposals, visit kff.org.

Financial Performance of Medicare Advantage, Individual, and Group Health Insurance Markets

Authors: Gretchen Jacobson, Rachel Fehr, Cynthia Cox, and Tricia Neuman
Published: Aug 5, 2019

Executive Summary

Medicare-for-All proposals have sparked discussion about the role of private health insurance in the U.S. health care system. Some of the current Medicare-for-All proposals would essentially eliminate private insurance. Others would allow private insurers to administer benefits under the new public program, similar to the role of Medicare Advantage plans today, which serve as a private-plan alternative to traditional Medicare. Another set of proposals would create a new Medicare-like public plan option, but preserve a role for private health insurance, including employer-sponsored coverage and policies sold to individuals and families in the Affordable Care Act (ACA) Marketplaces.

As context for these discussions, this brief examines and compares the financial performance of insurers in the Medicare Advantage, individual, and fully-insured group markets, using data reported by insurance companies to the National Association of Insurance Commissioners and compiled by Mark Farrah Associates. We analyze how insurers’ gross margins vary across the three markets, over time, and among insurers. Gross margins are the difference between premiums collected and medical expenses and do not account for administrative expenses. The brief also examines medical expenses as a percentage of premiums collected (simple loss ratios) across these three markets. See the Methods section for more information on calculations.

Key findings include:

  • Annual gross margins in the Medicare Advantage market averaged $1,608 per covered person between 2016 and 2018, about double the margins in the individual and group markets (E.S. Figure). Between 2016 and 2018, the individual market experienced substantial volatility, and the three-year average gross margins are not representative of any single year.  In 2016, individual market insurers saw significant losses, and in 2018, margins were unusually high and plans were overpriced due to policy uncertainty.
  • When aggregated across all plans in this analysis, annual gross margins sum to $23.9 billion, $10.6 billion, and $26.5 billion for the Medicare Advantage, individual, and group markets, respectively, for 2016-2018.
  • Total medical expenses as a share of premiums collected (simple loss ratios) were similar for across the three markets between 2016 and 2018 (about 84-86%; E.S. Figure).
ES Figure: Annual gross margins in the Medicare Advantage market were about double the margins in the individual and group markets

Each of these three health insurance markets now appear to generate high gross margins per person, particularly for insurers of Medicare Advantage plans.

Issue Brief

Background on Private Insurance Markets

The Medicare Advantage, individual (also known as non-group), and fully-insured group (employer) health insurance markets are three distinctly different markets. Each of these private insurance markets has unique features that affect the profitability for insurers, and which in turn affect coverage for eligible people. These markets are dominated by many of the same health insurers, with most of the country’s largest health insurers offering plans in all three markets.

Medicare Advantage. The Medicare Advantage market provides Medicare-covered benefits through private plans to 22 million Medicare beneficiaries in 2019, with enrollment steadily increasing over the past decade. The federal government makes risk-adjusted payments (higher payments for sicker enrollees and lower payments for healthier enrollees) to plans (averaging $11,545 per enrollee in 2019) to cover the preponderance of the cost of Medicare benefits for plan enrollees, with some plans charging enrollees an additional premium. In addition, the Medicare program pays plans more if they submit bids below the “benchmarks” set in statute or qualify for quality-related bonus payments; all of these payments are included as premiums in this analysis. In 2019, the federal payments to Medicare Advantage plans are about the same as what it would cost to cover the same people under traditional Medicare. When health risk coding differences are fully taken into account, payments to plans are 1-2% higher than traditional Medicare. Selection bias has been estimated to result in annual spending that is $1,253 lower for each Medicare Advantage enrollee compared to similar people who remain in traditional Medicare, suggesting that pegging payments to the costs of people in traditional Medicare overpays plans.

Individual Market. The individual market, which accounted for about 14 million people in 2018, includes coverage purchased by individuals and families through the Affordable Care Act’s exchanges (Marketplaces) as well as coverage purchased directly off-exchange, which includes both plans complying with the ACA’s rules and non-compliant coverage. (e.g., grandfathered policies purchased before the ACA went into effect and some short-term plans). The federal government provides subsidies for low-income people in the Marketplace and includes measures, such as risk adjustment, to help limit the financial liability of insurers. Insurers in the individual market receive premium payments from enrollees, plus any federal subsidies for people in the Marketplaces. Individual market premiums and plan availability have been considerably less stable than the Medicare Advantage and group markets.

Group Market. The fully-insured group market, the largest of the three markets (over 30 million people in 2018, excluding plans regulated by California’s Department of Managed Health Care), serves employers and their employees that are enrolled in fully-insured health plans. This market includes both small and large group plans, but excludes employer-sponsored insurance plans that are completely or partially self-funded, which account for 61% of all workers with employer-sponsored insurance.1  Plans typically receive premium payments from both employers and their employees. While both average claims and average premiums for enrollees in the group market have increased, the market has been relatively stable for insurers over the past decade.

Average Gross Margins

Average gross margins, or the average amount by which premium income exceeds claims costs per enrollee in a given year, are a key measure of insurer financial performance.

Average Gross Margins. Gross margins for Medicare Advantage plans averaged $1,608 per covered person per year between 2016 and 2018 – about double the average annual gross margins for plans in the individual and group markets ($779 and $855 per member per year, respectively; Figure 1).

Average gross margins were calculated as the difference between total premiums collected and total medical expenses incurred, and were averaged across the past three years (2016 to 2018) to even out year-to-year fluctuations, particularly those in the individual market. As discussed more below, there has been significant volatility in individual market margins, due in part to underpricing in the early years of ACA implementation and more recent overcorrections amid uncertainty about ACA repeal, enforcement of the individual mandate, and in response to the Trump Administration’s decisions to cease cost-sharing subsidy payments and reduce funding for outreach. The three-year average gross margins shown in Figure 1 include a year when individual market insurers generally saw significant losses as well as a year when profits were unusually high.

Figure 1: Annual gross margins in the Medicare Advantage market were about double the margins in the individual and group markets

Gross margins do not necessarily translate into profitability since they do not account for administrative expenses. Nonetheless, gross margins are an indicator of financial performance and signal how much insurers retain, including profits, after paying for enrollees’ covered medical expenses.

Variation in Gross Margins Over Time. In every year since 2006, average gross margins for Medicare Advantage plans have exceeded those of plans in the individual and group markets (Figure 2).  Average gross margins for Medicare Advantage plans climbed between 2006 and 2009, somewhat flattened after 2009, as federal overpayments to Medicare Advantage plans took on a more prominent role in policy discussions. Average margins then dipped somewhat after 2012 as federal payments to plans were reduced as a result of the ACA. Since 2015, average gross margins for Medicare Advantage plans have been on the rise, with the average gross margin for 2018 ($1,683 per member) nearly reached its peak 2009 value of $1,692 per member. The increase in average gross margins in the past few years has primarily been due to a sharp increase in the size and number of plans receiving bonus payments for high quality ratings, with total bonus payments more than doubling between 2015 and 2018.

Figure 2: Since 2006, Medicare Advantage plans’ average gross margins have exceeded those for plans in the individual or group markets

Gross margins in the individual market have been more volatile. Gross margins fell from about $446 per member per year in 2013 to -$122 in 2015 as the ACA’s market rules and consumer protections went into effect in 2014. At the time, insurers had very little information to work with in setting their premiums and many underpriced, experiencing significant losses. By 2017, the individual market generally had begun to stabilize. However, going into 2018, insurers raised benchmark premiums by an average of 34% in response to policy changes such as the Trump Administration’s decision to cease cost-sharing subsidy payments and uncertainty over whether the ACA as a whole would remain law or whether the individual mandate would be enforced. These premium hikes, along with slow claims growth, made 2018 the most profitable year for individual market insurers since the ACA went into effect. These high 2018 individual market profits will be offset somewhat by record high Medical Loss Ratio rebates insurers are required to issue in 2019 to 2018 enrollees due to overpricing. Premiums fell slightly on average for 2019, as it became clear that some insurers had raised 2018 rates more than was necessary, and margins will likely be lower for 2019.

Average gross margins for plans in the fully-insured group market have slowly, but steadily, increased since 2006, rising 71% from $525 per member in 2006 to $897 per member in 2018.

Simple Loss Ratios

Simple loss ratios, or the percentage of premium income that insurers pay out in claims, provide further context about the financial status of each of these markets. Despite differences in gross margins, medical expenses comprised a similar share of total premiums collected (simple loss ratios) across plans in the Medicare Advantage, individual, and fully-insured group markets (Figure 3). Between 2016 and 2018, the medical expenses of Medicare Advantage enrollees averaged about 86% of the total premiums collected by Medicare Advantage plans (primarily federal payments for Medicare-covered benefits), which is similar to the individual market (84%) and fully-insured group market (84%) three-year averages.

Figure 3: Medical expenses as a percentage of premiums collected were similar across the three markets

Medical expenses as a percentage of total premiums collected have been relatively constant since 2006, the first year for which data are available, for the plans in the Medicare Advantage and group markets. There has been quite a bit more year-to-year variation in the individual market since 2014, as the major provisions of the ACA went into effect and created uncertainty for insurers (see Appendix Table 1).

As with the gross margins, the simple loss ratios do not account for administrative expenses, and medical loss ratios as defined by the ACA are generally higher because the ACA calculation makes adjustments for taxes, fees, and quality improvement expenses. As with the analysis of gross margins, medical expenses as a percentage of premiums collected were averaged across three years (2016 to 2018) to even out year-to-year fluctuations in the individual market.

Reconciling Gross Margins and Simple Loss Ratios. Although loss ratios are similar across the three markets, gross margins are much higher for Medicare Advantage plans because both medical expenses and premiums are substantially higher for Medicare Advantage enrollees. In other words, a 5% margin, for example, in the Medicare Advantage market is a larger amount than a 5% margin in the individual or group market. People on Medicare tend to use more health care and incur higher medical expenses than people in the individual and group markets, and the federal payments (premiums) to Medicare Advantage plans are tied to the medical expenses of people in traditional Medicare. For instance, in 2018, Medicare Advantage enrollees spent an average of 1,856 days in a hospital per 1,000 enrollees, compared with averages of 304 and 294 hospital days for people in the individual and group markets, respectively (Appendix Table 2).

Variation in Performance Among Insurers Over Time

Annual gross margins varied substantially among insurers in the individual market and Medicare Advantage market, with relatively less variation among insurers in the fully-insured group market (Figure 4). In 2018, most of the Medicare Advantage market had gross margins between $1,014 (25th percentile) and $2,342 (75th percentile), and gross margins in most of the individual market varied substantially between $358 and $2,027 (25th and 75th percentiles, respectively). In contrast, gross margins in the fully-insured group market varied much less (from $501 at the 25th percentile to $1,215 at the 75th percentile in 2018).

Figure 4: Gross margins varied less across group market insurers than insurers in the individual or Medicare Advantage markets

In 2018, gross margins among insurers in the bottom quartile of the Medicare Advantage market (those with margins below $1,014) were similar to, or higher than, the average gross margin in the group market ($897). Conversely, many insurers in the top quartile of gross margins in the group market (those with margins above $1,215) had margins lower than the average in the Medicare Advantage market ($1,683) in 2018. The group market may have less variation in gross margins in part because of less uncertainty and because it has not been as subject to changes in policy. In all markets, 5-10% of insurers had negative gross margins, with medical expenses exceeding premiums, indicating that some insurers are losing money in the same markets where other insurers are making profits.

Total Gross Margins

After aggregating gross margins across all plans and enrollees in this analysis, total gross margins were highest for the fully-insured group market for all years between 2006 and 2017 (Figure 5). However, as of 2018, the Medicare Advantage market has caught up to the group market, with both markets reaching $27 billion in total gross margins in 2018. The rise in total gross margins for the Medicare Advantage market is primarily due to a steady increase in people enrolling in Medicare Advantage plans over the past decade. Total gross margins in the individual market remain significantly lower than the fully-insured group or Medicare Advantage markets, reaching $18 billion in 2018, in part because fewer people are covered in the individual market.

Figure 5: Total gross margins for Medicare Advantage plans have been rapidly nearing those for the group market

For 2016 to 2018, total gross margins averaged $23.9 billion, $10.6 billion, and $26.5 billion per year for the Medicare Advantage, individual, and group markets, respectively.2  Since this analysis excludes some plans in these markets (see Methods for more details), these aggregated margins would be larger if all plans were included.

Discussion

This analysis suggests insurers are profitable in each of the three markets. There is a particular focus in policy debates right now on Medicare Advantage plans. Several Medicare-for-All and other health reform proposals would allow private insurers to administer benefits under a new Medicare-like public option, which could be lucrative and attractive for health insurers, depending on how payments to plans are set. Based on the history of Medicare Advantage plans, setting payments to private plans at the appropriate rate remains a challenge, given competing goals of broadening plan choice and fiscal accountability. With a new public program or option, policymakers are likely to face similar challenges, depending on their goals and priorities.

Methods

We analyzed insurer-reported financial data from Health Coverage Portal TM, a market database maintained by Mark Farrah Associates, which includes information from the National Association of Insurance Commissioners (NAIC). The dataset analyzed in this report does not include NAIC plans licensed as life insurance or California HMOs regulated by California’s Department of Managed Health Care. We excluded plans that filed negative enrollment, premiums, or claims and corrected for plans that did not file “member months” in the annual statement but did file current year membership. The group market in this analysis only includes fully insured plans.3   Premiums to Medicare Advantage plans do not include payments for Medicare Part D benefits.

Gross margins were calculated by subtracting the sum of total incurred claims from the sum of unadjusted health premiums earned and dividing by the total number of members in each market. Premiums for Medicare Advantage plans primarily consist of federal payments made to plans for Medicare-covered benefits, and also include any additional amounts plans may choose to charge their enrollees.  Premiums for the individual market were not adjusted to account for rebates required to be remitted to enrollees.  To calculate medical expenses as a percentage of premiums (or simple medical loss ratios), we divided the market-wide sum of total incurred claims by the sum of all unadjusted health premiums earned. Medical loss ratios in this analysis are simple loss ratios and do not adjust for quality improvement expenses, taxes, or risk program payments.

Appendix

Table 1: Average Medical Expenses as a Share of Total Premiums, 2016–2018
YearMedicare Advantage MarketIndividual MarketFully-Insured Group Market
200687%76%83%
200786%82%85%
200886%83%86%
200985%84%87%
201086%82%84%
201186%85%85%
201285%86%85%
201387%87%85%
201487%98%83%
201588%102%84%
201686%96%84%
201786%83%83%
201886%75%83%
Table 2: Average Annual Hospital Patient Days per 1,000 Enrollees, 2006–2018
YearMedicare Advantage MarketIndividual MarketFully-Insured Group Market
2006 2,090 200 286
2007 2,122 233 301
2008 2,104 226 287
2009 1,943 276 320
2010 1,938 257 296
2011 1,980 247 307
2012 1,885 256 307
2013 1,987 258 310
2014 2,113 289 475
2015 2,006 316 284
2016 1,894 308 298
2017 1,933 314 301
2018 1,856 304 294

Endnotes

  1. As of 2016, states must define small group as 1-100 employees (and large groups as having 101 or more employees). Prior to 2016, however, states were allowed to continue to define small groups as having a maximum of 50 employees. ↩︎
  2. These figures are extrapolated based on enrollment in the plans included in this analysis, which do not represent the full enrollment of the private insurance market. Enrollment figures do not include plans that do not file data with the NAIC, plans licensed as life insurance, California HMOs regulated by Californiau2019s Department of Managed Health Care, plans that recorded negative premiums, claims, or enrollment numbers, or plans domiciled outside of the U.S. ↩︎
  3. 61% of workers with employer-sponsored insurance are enrolled in a plan that is completely or partially self-funded. This analysis only includes fully-insured group plans. ↩︎
News Release

What Steps Are Washington Policymakers Pursuing to Control Medicare Prescription Drug Spending?

Published: Aug 1, 2019

As policymakers in Washington discuss ways to curb the rising cost of prescription drugs, KFF has released a summary and analysis of proposals and recently finalized initiatives that affect Medicare prescription drug spending.  Medicare, the federal health program that covers more than 60 million seniors and younger people with disabilities, accounts for 30 percent of the nation’s retail prescription drug spending. A Look at Recent Proposals to Control Drug Spending by Medicare and its Beneficiaries serves as a primer for policymakers and others amid ongoing policy discussions pertaining to Medicare drug spending. It describes, in brief, recent and proposed changes, discusses the implications for key stakeholders, and provides information on projected savings (when available) for Medicare and beneficiaries for proposals, such as:

  • Limiting drug price increases by requiring manufacturers to pay a rebate to Medicare if drug prices increase faster than inflation;
  • Allowing the government to negotiate drug prices on behalf of Medicare beneficiaries;
  • Adding an out-of-pocket spending limit to Part D, and shifting more of the responsibility for catastrophic drug costs from Medicare to insurance plans and drug manufacturers; and
  • Using the price of drugs in other countries to help set Medicare payment rates.

Also available is a new brief, What’s the Latest on Medicare Drug Price Negotiations? This brief provides an in-depth look at an approach that would allow the Secretary of HHS to negotiate drug prices on behalf of Medicare beneficiaries. It describes current policy proposals that would allow the government to negotiate drug prices, summarizes the Congressional Budget Office’s (CBO) assessments of potential savings, and discusses the prospects for action on these proposals. For more KFF analyses and data on prescription drugs and their costs, visit kff.org.

Poll Finding

KFF Health Tracking Poll – July 2019: The Future of the ACA and Possible Changes to the Current System, Preview of Priorities Heading Into 2nd Democratic Debate

Authors: Ashley Kirzinger, Cailey Muñana, and Mollyann Brodie
Published: Jul 30, 2019

Findings

Key Findings:

  • Health care is playing a prominent role at the start of the 2020 presidential primary season with Democratic candidates offering competing proposals aimed at expanding coverage to more Americans. The latest KFF Health Tracking Poll finds a larger share of Democrats and Democratic-leaning independents preferring approaches that expand coverage building on the Affordable Care Act (55%) rather than replacing the ACA with a national Medicare-for-all plan (39%).
  • The poll also finds a slight dip in overall favorability of the idea of a national Medicare-for-all plan. About half (51%) of the public now say they favor such a proposal compared to 56% in April 2019. On the other hand, nearly two-thirds of the public (65%) favor a public option, which would compete with private health insurance plans and be available to all Americans. But as with polling on Medicare-for-all, attitudes toward this change to the current health care system can be swayed by common arguments. For example, net favorability towards such a plan ranges as high as +53 and as low as -18 after hearing arguments either in favor of or against a public option.
  • The survey finds that, while a majority of the public hold favorable views of Medicare (83%), the public also has largely favorable views of employer-sponsored insurance (76%) and Medicaid (75%). In addition, both those with Medicare coverage (95%) and employer coverage (86%) rate their own health insurance coverage positively.
  • Health care, climate change, and issues affecting women are among the top issues that Democrats and Democratic-leaning independents want to hear the candidates discuss in the upcoming second Democratic presidential debate. Issues affecting women has consistently ranked among this group’s top issues for the candidates to speak about and when asked specifically what they want to hear about, at least three in ten overall offer topics related to reproductive rights (33%) and equal pay (30%).
  • With the ACA and its various provisions under legal threat from an ongoing federal court case, this month’s KFF Health Tracking Poll probes the public on how important it is for different ACA provisions to remain in effect if the law is ruled unconstitutional. Most Americans say it is “very important” to them that each of the provisions included in this month’s survey are kept in place.

Public Opinion on the Competing Health Care Proposals Aimed At Expanding Coverage

Health care is playing a prominent role at the start of the 2020 presidential primary season with Democratic presidential candidates offering competing proposals aimed at expanding coverage to more Americans. This month’s KFF Health Tracking Poll examines public support for both a national Medicare-for-all plan and a government-administered public option.

Medicare-for-all

Support for a Medicare-for-all plan stands at 51% in July @KaiserFamFound poll, a slight dip from April’s 56%.

KFF has been tracking public polling on a national Medicare-for-all plan since the 2016 presidential campaign and this month’s tracking poll finds a slight dip in overall favorability towards Medicare-for-all. About half (51%) of the public say they favor such a proposal compared to 56% who said they were in favor earlier this year and a high of 59% more than a year ago in March 2018.

Figure 1: Half Of Public Favors National Medicare-for-all Plan, Down Slightly From Recent Months

The gradual decline in favorability is driven by both Democrats and Republicans with somewhat smaller shares of both now saying they favor such a proposal. In addition, the share of Democrats who now say they “strongly favor” a national Medicare-for-all plan is down from 54% to 42% compared to last time it was asked in April 2019. A majority of Democrats (72%) still express favorable views towards this proposal.

Figure 2: Somewhat Smaller Shares Of Democrats And Republicans Now Say They Favor A National Medicare-for-all Plan

Overall, a larger share of Democrats and Democratic-leaning independents would prefer lawmakers build on the existing ACA (55%) to expand health care coverage to more Americans rather than replace the ACA with a national Medicare-for-all plan (39%).

Figure 3: Larger Share Of Democrats And Democratic-Leaning Independents Prefer Building on ACA Than Replacing It

This is true across ideology (liberal v. moderate) as well as for self-identified Democrats. Similar shares of Democratic-leaning independents say they prefer replacing the ACA with a national Medicare-for-all plan (45%) as say they would prefer building on the ACA (50%).

Table 1: Most Democrats Prefer Lawmakers Build On ACA
Which of the following approaches to expanding health care coverage to more Americans would you prefer?Building on the existing ACAReplacing the ACA with a national Medicare-for all plan
All Democrats and Democratic-leaning Independents55%39%
Moderate6036
Liberal5637
Self-identified Democrats5736
Democratic-leaning independents5045

Public Option

Another type of government health plan garnering recent attention is a public option. This type of plan would allow everyone to have access to a public health insurance option like Medicare. Earlier this month, Democratic presidential candidate Joe Biden announced his own health care proposal, which builds heavily on the ACA – legislation passed during his term as Vice President in the Obama administration – and one element of which includes a public option. Previous KFF polling conducted in 2009, prior to the passage of the ACA, found about half of the public (47%) said a government-administered public health insurance option that would compete with private plans was an important feature of health reform.

Nearly two-thirds of the public (65%) favor having a government-administered health plan that would compete with private health insurance plans and be available to all Americans while 31% oppose. Views are largely driven by partisanship with majorities of Democrats (85%) and independents (68%) favoring a public option while a majority of Republicans oppose such a proposal (62%).

Figure 4: Majorities Of Democrats And Independents Favor A Public Option, Majority Of Republicans Oppose

Similar to previous polling on other proposed changes to the current health care system such as Medicare-for-all, attitudes towards a public option can swing significantly, depending on what arguments the public hears.

Nearly two-thirds of the public support a government-run “public option” to compete with private health plans, – but views shift significantly after hearing arguments for and against the idea. More in this @KaiserFamFound poll

Net favorability towards a public health insurance option (measured as the share in favor minus the share opposed) starts at +34 percentage points and ranges as high as +53 percentage points when people hear the argument that this would help drive down costs because private insurers would be competing with the public plan. Net favorability is also high (+51 percentage points) when the public hears that this would provide more choice to people getting insurance through the ACA marketplaces. On the other side of the debate, net favorability drops to -18 percentage points when people hear the argument that it would lead to too much government involvement in health care. Net favorability also drops, but remains net positive (+12 percentage points) after people hear the argument that it would cause doctors and hospitals to be paid less.

Figure 5: Attitudes Towards Public Option Can Be Swayed By Arguments

Public’s Views towards Health Insurance Coverage

In the first set of Democratic presidential primary debates held last month, Medicare-for-all took a leading role with candidates debating the future of the current health care system. The July KFF Health Tracking Poll asks the public their overall impressions of both public and private health insurance programs as well as assesses how people covered by Medicare rate their coverage compared to those who have employer-sponsored coverage. The survey finds that while a majority of the public hold favorable views of Medicare, the public also has largely favorable views of employer-sponsored insurance and Medicaid, the government health insurance program for certain low-income adults and children.

Overall, 83% of the public hold a favorable opinion of Medicare, the government health insurance program for seniors and for younger adults with long-term disabilities, including 51% who view it “very favorably.” Somewhat similar shares hold favorable views of employer-sponsored insurance (76%) and Medicaid (75%). The public is more likely to hold a favorable view of Medicare, employer coverage, and Medicaid than private health insurance plans that people purchase on their own (59%).

Figure 6: Half Hold “Very Favorable” View Of Medicare, Majorities View Both Private And Public Health Insurance Coverage Favorably

Medicare is also very popular across partisanship. More than eight in ten Democrats (84%), independents (84%), and Republicans (83%) say they have a favorable opinion of Medicare.

Figure 7: At Least Eight In Ten Across Partisans View Medicare Favorably But Views Differ On Other Forms Of Health Insurance

Views towards the other ways that Americans get their health insurance coverage vary across party identification. Republicans hold more favorable views of both employer-sponsored insurance (91%) and private health insurance coverage purchased by individuals (80%) than Democrats (68% and 47%) and independents (77% and 58%). On the other hand, Democrats hold more favorable opinions of Medicaid (85%) compared to both independents (76%) and Republicans (65%).

When asked to rate their own health insurance coverage, nearly half of older adults with Medicare coverage (65 and older) give their coverage an “excellent” rating (48%) and an additional 47% rate it as “good.” Five percent of older adults give their coverage a rating of either “not so good” (4%) or “poor” (1%). Fewer adults 18-64 with employer coverage give their own coverage an “excellent” (36%) rating, but half give their coverage a “good” rating. About one in seven give their coverage a rating of either “not so good” (10%) or “poor” (4%).

Figure 8: Majority Of Insured Adults, Despite Whether They Have Private Or Public Health Insurance, Rate Their Coverage Positively

Preview of 2nd Democratic Debates

Last month’s KFF Health Tracking Poll found health care leading the list of possible topics Democrats and Democratic-leaning independents want to hear the 2020 Democratic presidential candidates talk about during their upcoming debates. This month’s tracking poll, conducted a week prior to the second round of Democratic presidential debates, finds health care once again among the top issues along with climate change. Eight in ten Democrats and Democratic-leaning independents say it is “very important” for candidates to talk about health care (83%) and three-fourths (76%) say the same about climate change. This is closely followed by seven in ten who say it is “very important” for the candidates to talk about issues affecting women (71%) and immigration (69%). Majorities also want to hear the candidates talk gun policy (64%), criminal justice reform (62%), the economy (60%), income inequality (58%), foreign policy or national security (56%), and taxes (53%). Less than half (42%) say it is “very important” for the candidates to discuss international trade and tariffs.

Figure 9: Health Care Ranks Among Top Issues Democrats Want To Hear About In Upcoming Presidential Debates

While there is a consensus among Democrats and Democratic-leaning independents that health care is the top issue they want to hear the 2020 presidential candidates discuss in the Democratic presidential debates, this group is more divided on whether they want to hear about how the candidates’ plans differ from each other or how they differ from President Trump’s approach to health care. About half of Democrats and Democratic-leaning independents (51%) say they want to hear how the Democratic plans differ from each other while four in ten (38%) say they want to hear how the plans differ from President Trump’s approach.

Figure 10: Most Democrats Want To Hear How Democratic Health Care Plans Differ From Each Other

On this question, there is a difference between those who identify as Democrats and those who call themselves independents but lean towards the Democratic party. Nearly six in ten Democratic-leaning independents (58%) say they want to hear about how the Democratic plans differ from each other while fewer (29%) say they want to hear about how the plans differ from President Trump’s approach. Democrats are more divided, with similar shares saying they want to hear how the Democratic plans differ from each other (47%) and saying they want to hear about how the plans differ from President Trump’s approach (42%).

Issues Affecting Women

Over the past two months, women’s issues has ranked high on the list of possible topics that Democrats and Democratic-leaning independents want to hear the 2020 Democratic presidential candidates discuss in debates. When those who say issues affecting women is at least somewhat important for the candidates to discuss (which is 96% of all Democrats and Democratic-leaning independents) are asked to offer in their own words what specifically they want to hear about, a significant share of them offer reproductive issues. One-third of Democrats and Democratic-leaning independents overall say they want to hear the Democratic presidential candidates talk about reproductive issues such as abortion, reproductive rights, or women’s control over their own bodies. Similarly, three in ten Democrats and Democratic-leaning independents offer issues such as equal pay or the wage gap (30%). Slightly fewer offer equal treatment or equal rights (17%), women’s health care issues other than reproductive health (12%), workplace issues (7%), or violence against women and sexual assault (7%).

Figure 11: Reproductive Rights And Equal Pay Top List Of Women’s Issues

Democratic and Democratic-leaning women and men offer similar responses to what they mean when they issues affecting women is important for the candidates to discuss, with one exception. A larger share of Democratic women (38%) overall offer reproductive issues such as abortion, reproductive rights, or women’s control over their own bodies compared to the total share of Democratic men (27%).

The Affordable Care Act

About half of the public (48%) say they have a favorable opinion of the 2010 Affordable Care Act (ACA) while four in ten (41%) view the law unfavorably. Opinions have remained relatively unchanged for the past two years since the Republican efforts to repeal the law with a slightly larger share expressing positive views. Attitudes are also largely partisan with eight in ten Democrats having a favorable view of the ACA compared to nearly half of independents (49%), and a much smaller share of Republicans (14%).

Figure 12: Nearly Half Hold Favorable View Of The Affordable Care Act

Earlier this month, the U.S. Court of Appeals for the 5th Circuit heard oral arguments in Texas v. U.S., the court case challenging the future of the ACA in which a federal judge sided with Republican state attorneys general and ruled the entire ACA is invalid. 1  The future of this case is uncertain and it may be headed to the U.S. Supreme Court. About three-fourths (76%) of the public say they have heard at least “a little” about the ongoing legal battle over whether the ACA is unconstitutional.

If the judge’s decision takes effect, a host of ACA provisions would be eliminated. This month’s KFF Health Tracking Poll probes the public on how important it is for various parts of the ACA to remain in effect if the Supreme Court upholds the federal judge’s decision.

Across the provisions included in this month’s survey, most Americans say it is “very important” to them that each of the parts of the law are kept in place.

Figure 13: Most Say It Is Important That ACA Provisions Remain In Place

Majorities across partisans say it is “very important” that the ACA’s protections for people with pre-existing conditions remain in place. Nearly nine in ten Democrats (88%), 73% of independents, and 62% of Republicans say it is “very important” that the part of the law that prohibits private health insurance companies from denying coverage because of a pre-existing medical condition remains in place. Similarly, 76% of Democrats, 64% of independents, and 55% of Republicans say it is “very important” the part of the law that prohibits private health insurance companies from charging sick people higher premiums than healthy people remains in place.

Figure 14: Majorities Across Partisans Say It Is Important For ACA Pre-Existing Condition Protections To Remain In Place

Yet, as anything related to the ACA, there are partisan differences. Majorities of Democrats and independents and nearly half of Republicans say it is “very important” the parts of the law prohibiting health insurance companies from denying coverage to pregnant women (89% of Democrats, 73% of independents, and 49% of Republicans), requiring health insurance companies to cover the cost of most preventive services (80% of Democrats, 58% of independents, and 49% of Republicans), and prohibiting health insurance companies from imposing lifetime limits (72% of Democrats, 65% of independents, and 48% of Republicans) remain in place. Across the other provisions asked about, fewer than half of Republicans say it is “very important” for these parts of the law to be kept in place including less than four in ten who say it is “very important” that Medicaid expansion (36%) and subsidies for people who buy their own health insurance (31%) to stay in place.

Table 2: Partisans’ View On The Importance Of Various Aspects of ACA Remaining In Place if Supreme Court Rules the Law is Unconstitutional
Percent who say it is “very important” that each of these parts of the ACA are kept in place:DemocratsIndependentsRepublicans
Prohibits private health insurance companies from denying coverage because of a pre-existing medical condition88%73%62%
Prohibits private health insurance companies from denying coverage to pregnant women897349
Prohibits private health insurance companies from charging sick people higher premiums than healthy people766455
Requires private health insurance companies to cover the cost for most preventive services805849
Gives states the option of expanding their Medicaid programs to cover more low-income, uninsured adults845536
Provides financial help to low- and moderate-income Americans who don’t get insurance through their jobs to help them purchase coverage825431
Prohibits private health insurance companies from setting a dollar limit on how much they will spend on your coverage during your lifetime726548
Prohibits private health insurance companies from setting a dollar limit on how much they will spend on your coverage each year674638
Allows young adults to stay on their parents’ insurance plans until age 26685036

Methodology

This KFF Health Tracking Poll was designed and analyzed by public opinion researchers at the Kaiser Family Foundation (KFF). The survey was conducted July 18th – July 23rd 2019, among a nationally representative random digit dial telephone sample of 1,196 adults ages 18 and older, living in the United States, including Alaska and Hawaii (note: persons without a telephone could not be included in the random selection process). The sample included 289 respondents reached by calling back respondents that had previously completed an interview on the KFF Tracking poll at least nine months ago. Computer-assisted telephone interviews conducted by landline (296) and cell phone (900, including 623 who had no landline telephone) were carried out in English and Spanish by SSRS of Glen Mills, PA. To efficiently obtain a sample of lower-income and non-White respondents, the sample also included an oversample of prepaid (pay-as-you-go) telephone numbers (25% of the cell phone sample consisted of prepaid numbers) as well as a subsample of respondents who had previously completed Spanish language interviews on the SSRS Omnibus poll (n=7). Both the random digit dial landline and cell phone samples were provided by Marketing Systems Group (MSG). For the landline sample, respondents were selected by asking for the youngest adult male or female currently at home based on a random rotation. If no one of that gender was available, interviewers asked to speak with the youngest adult of the opposite gender. For the cell phone sample, interviews were conducted with the adult who answered the phone. KFF paid for all costs associated with the survey.

The combined landline and cell phone sample was weighted to balance the sample demographics to match estimates for the national population using data from the Census Bureau’s 2017 American Community Survey (ACS) on sex, age, education, race, Hispanic origin, and region along with data from the 2010 Census on population density. The sample was also weighted to match current patterns of telephone use using data from the July-December 2018 National Health Interview Survey. The weight takes into account the fact that respondents with both a landline and cell phone have a higher probability of selection in the combined sample and also adjusts for the household size for the landline sample, and design modifications, namely, the oversampling of prepaid cell phones and likelihood of non-response for the re-contacted sample. All statistical tests of significance account for the effect of weighting.

The margin of sampling error including the design effect for the full sample is plus or minus 3 percentage points. Numbers of respondents and margins of sampling error for key subgroups are shown in the table below. For results based on other subgroups, the margin of sampling error may be higher. Sample sizes and margins of sampling error for other subgroups are available by request. Note that sampling error is only one of many potential sources of error in this or any other public opinion poll. Kaiser Family Foundation public opinion and survey research is a charter member of the Transparency Initiative of the American Association for Public Opinion Research.

GroupN (unweighted)M.O.S.E.
Total1,196±3 percentage points
Registered voters1,010±4 percentage points
Party Identification
Democrats335±7 percentage points
Republicans307±7 percentage points
Independents438±6 percentage points
Democrats and Democratic-leaning independents511±5 percentage points

What’s The Role of Private Health Insurance Today and Under Medicare-for-all and Other Public Option Proposals?

Published: Jul 30, 2019

Introduction

The role of private health insurance under Medicare-for-all and other proposals has emerged as a prominent issue in the Democratic primary and an important issue for voters. Candidates are debating what role private insurance should have in the U.S. health care system and the implications of such a change for individuals across the country.

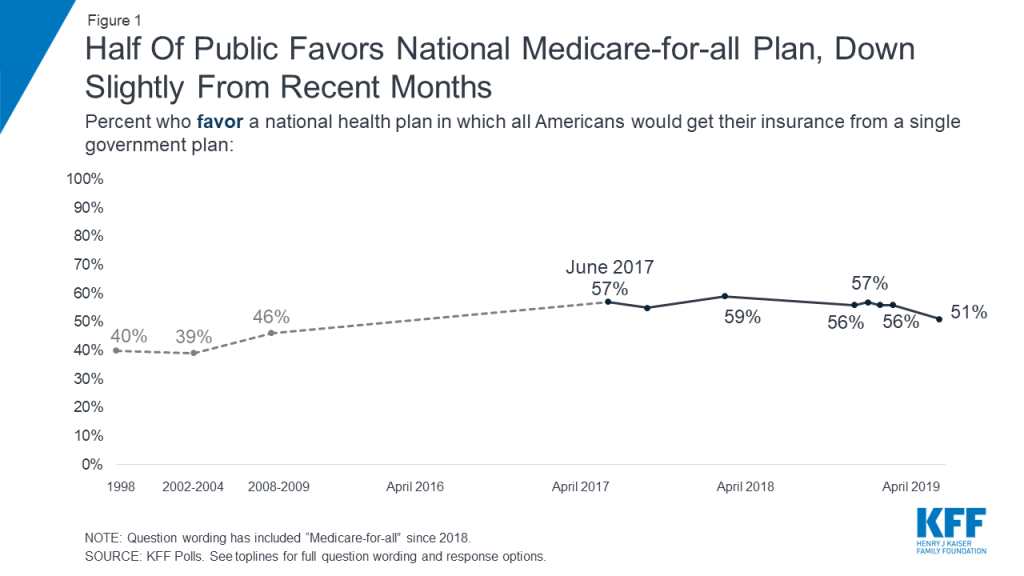
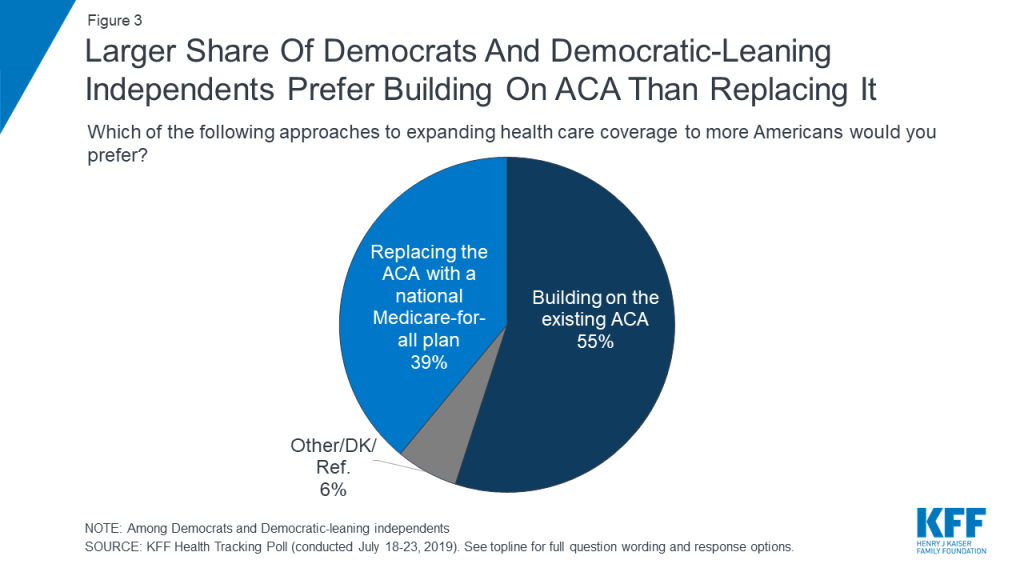
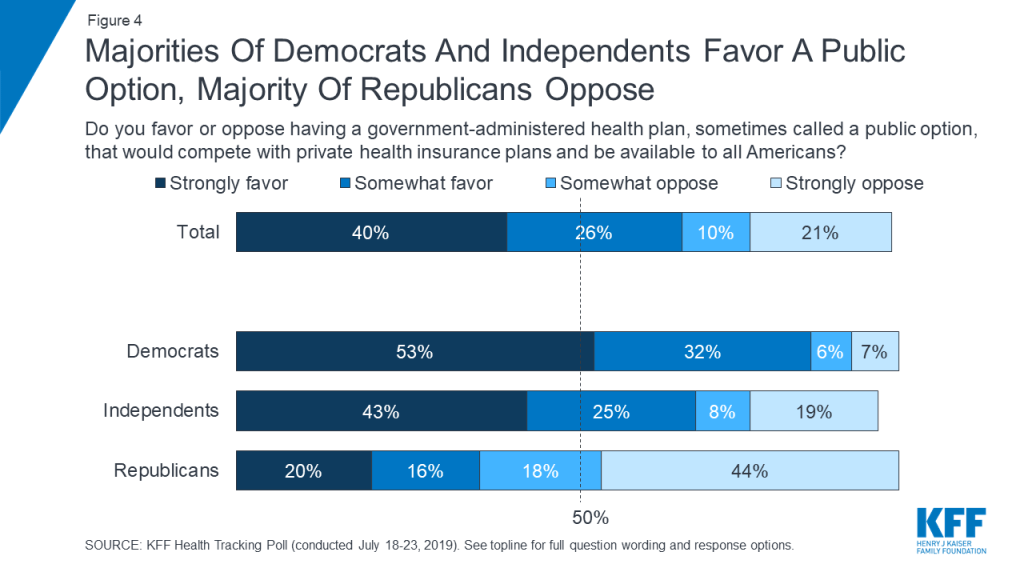
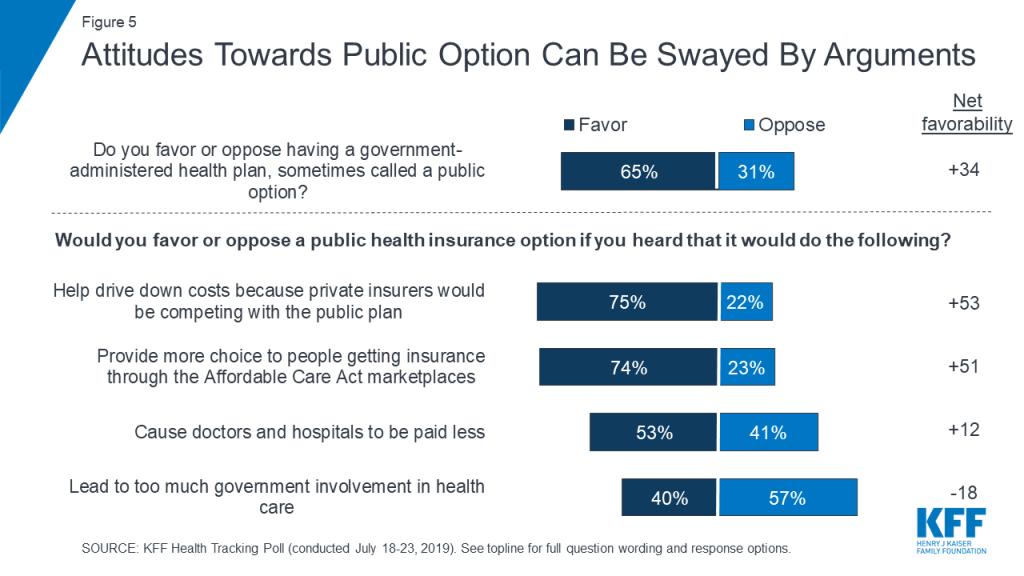
For more than two years KFF polling has found a majority of the public favoring a national Medicare-for-all plan with the most recent poll finding a slight dip in support with about half the public (51%) now saying they favor Medicare-for-all.  However, surveys also show most people do not have a clear understanding about the current Medicare-for-all proposals, and how they might change the nature of coverage people have today. For example, based on a poll fielded in early 2019, 55% of the public think that they and their families would be able to keep their current health insurance under Medicare-for-all; 54% think they would continue to pay health insurance premiums and 69% think they would continue to pay deductibles and copays for covered health services.  Public opinion is malleable in response to additional information and arguments about Medicare-for-all.  Support for Medicare-for-all increases to 67% when people hear it would eliminate insurance premiums and reduce out-of-pocket health costs, and increases to 71% when people hear it would guarantee health insurance as a right for all Americans, but drops to 37% when people hear Medicare-for-all would eliminate private health insurance.

What’s the role of private insurance today and how would it change under Medicare-for-all and other public option proposals? This new @KaiserFamFound brief explores the issues

This brief begins by examining the role that private insurers play in providing health coverage for Americans today, not only in employer plans and the individual insurance market, but also in Medicare and Medicaid. It then discusses how that would likely change under Medicare-for-all and other proposals and summarizes evidence on consumers’ experiences with private insurance.

Current Role of Private Health Insurance in the U.S.

Today, the majority of the U.S. population have some form of coverage delivered by a private health insurer. This includes: non-elderly people with employer-sponsored coverage or individually purchased health insurance plans; low-income Medicaid enrollees covered by managed care organizations; people age 65 and older and younger adults with disabilities in Medicare Advantage plans; and people in traditional Medicare who also have private insurance, such as Medicare part D stand-alone prescription drug plans, supplemental (Medigap) policies, or employer-sponsored retiree health coverage.

The following coverage estimates are the most current data available for each category of private insurance. These data points cannot be summed because they derive from different sources, from different years, and because some people have private insurance from multiple sources.

Employment-based coverage accounts for the largest share of people in the U.S. with private insurance. In 2017, 153 million non-elderly people had private, employer-sponsored health coverage. Typically, employers pay most of the premium on behalf of employees and their dependents – on average 82% of the premium for single coverage and 71% for family coverage. Employees and their families are typically responsible for deductibles and other cost-sharing requirements. The Affordable Care Act (ACA) requires large employers to provide full-time workers and their dependents health coverage that meets minimum standards for affordability and coverage value or pay a penalty. Although not mandated by law, a majority of small firms offer health benefits.

Non-group, individually purchased coverage is another source of private health insurance. An estimated 14 million people had private insurance coverage in the non-group market (also known as the individual market) in the first quarter of 2018. Of this total, roughly three-quarters purchased coverage through the ACA Marketplaces, where subsidies are available to eligible individuals with incomes between 100% and 400% of the federal poverty level (FPL). Most non-group plans are ACA compliant, meaning they must cover essential health benefits and cannot discriminate based on a person’s pre-existing condition; however, recent regulatory changes have made health plans that do not comply with the ACA consumer protections increasingly available in the individual market outside the Marketplaces.

The majority of Medicaid enrollees have coverage provided by managed care plans under contract with each state’s Medicaid program. Two thirds of all Medicaid enrollees (54 million) were enrolled in Medicaid managed care organizations (MCOs) as of July 2017 in the 38 states and DC that contract with Medicaid managed care organizations to deliver services to at least some beneficiary populations (e.g. children, parents, ACA expansion adults). MCOs generally provide all covered services to enrollees, but states may carve out specific services from MCO contracts (e.g. long-term care, dental, or behavioral health) and deliver these through fee-for service systems or limited benefit health plans. Medicaid MCOs are subject to broad federal and state standards and beneficiary protections. Federal standards prohibit premiums for most Medicaid enrollees, unless permitted under a demonstration waiver. Federal rules also prohibit deductibles and allow nominal cost-sharing for non-exempt enrollees. Payments to Medicaid MCOs totaled nearly $264 billion in FY 2017, accounting for about 46% of total Medicaid spending. While states contract with private plans, not all enrollment and spending is for private managed care plans. For example, California has a number of public county-operated health plans.

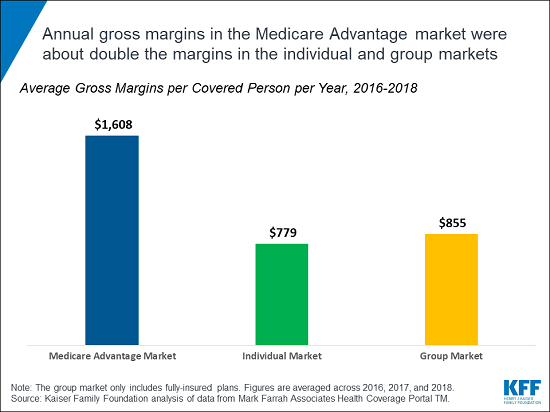
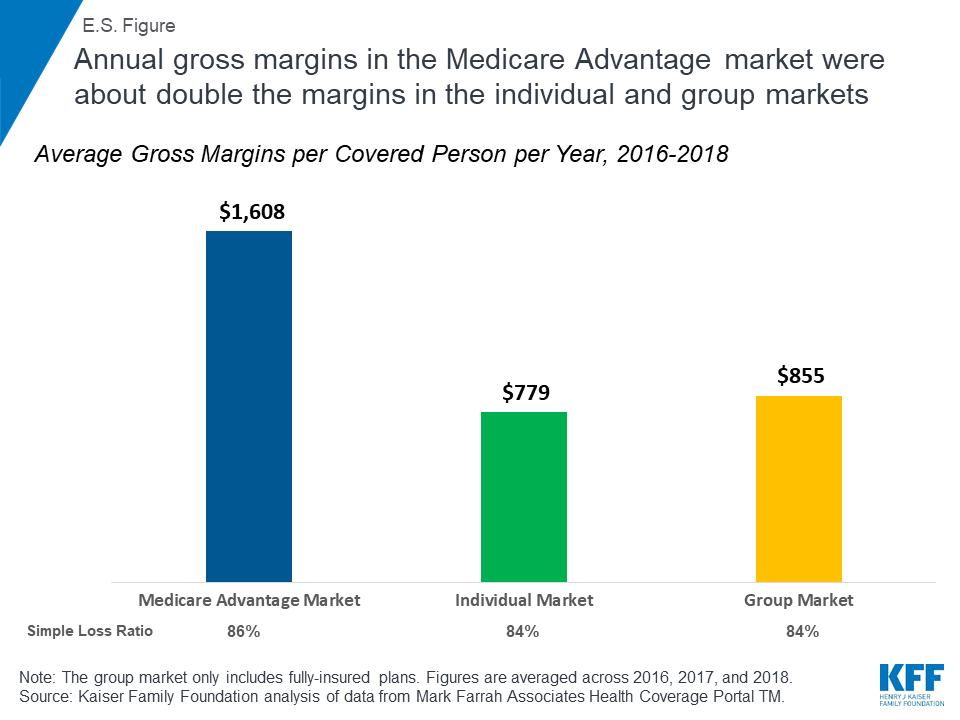
A growing share of Medicare beneficiaries are enrolled in Medicare Advantage plans, such as HMOs and PPOs, which are sponsored by private insurers and paid by the federal government to provide Medicare-covered services. Among the more than 60 million people now covered by Medicare, about one-third (22 million in 2019) are in a Medicare Advantage plan. Medicare Advantage plans are required to provide all Medicare-covered services, and are subject to federal standards with respect to benefits and cost-sharing requirements, and network adequacy. Many also provide additional benefits, such as dental, vision and gym memberships. Medicare Advantage plans receive capitated, risk adjusted payments from the federal government to provide Medicare-covered services, exceeding $250 billion in 2019, sometimes supplemented by beneficiary premiums. The Congressional Budget Office (CBO) projects nearly half of all Medicare beneficiaries (47 percent) will be in a Medicare Advantage plan by 2029.

The majority of people in traditional Medicare have additional coverage provided by one or more private plan sponsors. For example, 25 million Medicare beneficiaries in traditional Medicare are enrolled in private stand-alone Part D prescription drug plans. Enrollees typically pay an additional premium for this coverage, unless they qualify for low-income subsidies, and have cost-sharing requirements that vary across plans. In addition, nearly 20 million beneficiaries in traditional Medicare had private supplemental coverage in 2016, including 9.5 million traditional Medicare beneficiaries who purchased Medicare supplemental insurance (Medigap) policies in 2016, and another 9.6 million Medicare beneficiaries with private, employer or union-sponsored retiree health benefits that year.

Treatment of Private Insurance under Medicare-for-all and Other Public Plan Option Proposals

The role of private health insurance in the U.S. would vary across the range of proposals under discussion that establish a public program to broaden coverage and make health care more affordable.  Medicare-for-all proposals would have the most far-reaching effect; under some current Medicare-for-all proposals, the new public program would replace virtually all sources of private health insurance. Other proposals would establish a public option, but retain private insurance, with wide variation across proposals in the extent to which coverage would shift from private insurance to a public plan.

Under Medicare-for-all approaches proposed by Senator Bernie Sanders (S.1129) and Representative Pramila Jayapal (H.R.1384), all U.S. residents would be covered under a public program that provides comprehensive benefits, with no premiums or cost-sharing requirements.  Both Medicare-for-all bills would prohibit employers and private health insurers from offering coverage that duplicates Medicare-for-all covered benefits. The bills would permit supplemental insurance. However, because Medicare-for-all covered benefits would be comprehensive, the market for insurance to cover supplemental benefits likely would largely be limited to nursing home care, and only under the Senate bill, since the House bill covers institutional long-term care.

The Sanders Medicare-for-all bill would permit private contracting between health care providers who do not participate in the universal Medicare program and patients, and allow private insurance to cover these costs – a practice that is generally prohibited under the House bill. As a result, under the Sanders bill, there could also be a continued role for private insurance to cover or defray the cost of care for people who can afford to privately contract for medical care. Recognizing the likely impact on the private insurance workforce, both Medicare-for-all bills would set aside 1% of all national health expenditures per year for the first five years to offset anticipated economic dislocation of private health insurance and billing industry employees.

Under another approach, Medicare for America (H.R. 2452), all U.S. residents would be covered under the public program unless they opted out for a qualified employer plan. Medicare for America would maintain a role for private insurance by allowing employers to offer qualified health plans. It would however, eliminate private insurance sold through the individual market. Individuals covered under Medicare for America would also have the option to enroll in Medicare Advantage for America plans, building on the private insurance approach permitted under the current Medicare program. Today, for example, Medicare Advantage plans are offered in most, though not all, counties in the US.

Other proposals on the pathway to universal coverage would establish a public plan option and leave the current private health insurance system largely intact. The implications for private insurance would vary depending on a number of factors. For example, proposals that allow employers to choose to cover their employees under the public program would be more likely to diminish the role of private insurance than proposals that limit eligibility to people buying their own insurance. Likewise, proposals that allow employees in firms that offer group coverage to opt instead for the public plan could shift the balance between public and private insurance, particularly if such employees are eligible for subsidies under the public plan.

Several candidates running in the 2020 presidential race have addressed the role of private insurance in one way or another. In addition to the Sanders’ Medicare-for-all approach, co-sponsored by several presidential candidates, others have introduced proposals that would retain a role for private insurance while establishing a new public program or public plan option. Senator Kamala Harris’ new proposal would also establish a Medicare-for-all program, but it would allow private insurers to offer plans, modeled on Medicare Advantage, through the public program, and allow employers to provide a private Medicare plan to their employees. Former Vice President Joe Biden’s proposal would build on the architecture established by the Affordable Care Act (ACA) to create a government-sponsored public plan option available to employees, those in the individual market, and those currently in the Medicaid coverage gap, while retaining job-based coverage, Medicare and Medicaid. Other candidates, such as Senator Michael Bennet would create a new public plan option that would be available only to people who get their insurance through the ACA Marketplaces, alongside other private insurance options.

The level of provider payment rates used by the public plan could also influence the distribution of public and private insurance, and the competitiveness of private insurance against the new public option. All other things equal, if provider payment rates  were lower under the public plan than under private insurance, then the public plan would be expected to have lower premiums – assuming similar benefits and no selection effects.

Consumer Experiences with Private Health Insurance

In general, the public reports relatively high rates of satisfaction with their health insurance coverage, both in private insurance and public programs. At the same time, surveys and other studies document problems encountered by people that are somewhat unique to private insurance, relating to high cost-sharing, narrow provider networks, surprise medical bills, and lack of continuity of coverage. Because Medicare Advantage and Medicaid managed care plans are highly regulated, relatively speaking, these issues tend to be more prominent in employer and individually-purchased coverage. These issues also tend to disproportionately affect people in relatively poor health with significant medical care needs, who use their insurance more, and people with modest incomes and limited resources to cover unanticipated expenses.

  • High deductibles — High deductibles and other cost-sharing requirements have become prevalent in private health plans offered by employers and in the non-group market. For employer plans, in 2018 the average single deductible was $1,573 for those who have one, and 26% of covered workers were in plans with deductibles of $2,000 or higher. Deductibles in job-based health plans have risen at eight times the rate of workers’ earnings in the past decade. In the non-group market, nearly all ACA Marketplace plans have deductibles of $1,000 or higher, although half of all consumers who buy non-group coverage through the ACA Marketplaces qualify for cost-sharing subsidies.Consumers in high-deductible health plans are more likely to experience problems paying their out-of-pocket medical bills and are less satisfied with their coverage. According to a recent KFF/LA Times survey, two-thirds of consumers in high-deductible job-based plans say they could not pay a bill equal to their deductible at all or without borrowing or going into debt. Among people in employer plans with the highest deductibles, over half (55%) give their plan a grade of C or lower. And, 40% of people with employer coverage say they or someone in their family experience one or more health care affordability challenges in the last year.High deductibles are not generally a feature of Medicare Advantage plans; however, in traditional Medicare, the Part A deductible is $1,364 per benefit period, the Part B deductible is $185 and the standard Part D deductible is $415 in 2019, although some Part D plans have lower or no deductibles. Deductibles are not permitted in Medicaid.
  • Provider networks – Private health plans typically create networks of providers to negotiate the prices they pay. In PPO plans, patients pay lower cost-sharing if they receive care from network providers. In HMO plans, patients can only see network providers.Unlike traditional Medicare, which includes virtually all doctors and hospitals, private plans generally exclude some or many providers in an area, and may offer employers and non-group purchasers choices of more or less restrictive network options.  Networks with fewer available providers may have lower costs (because insurers can bargain more aggressively on the terms of inclusion), but also reduce patient provider choice at the point when they need care. The use of provider networks, which is necessary to make private insurance work, creates some issues for enrollees, including limited choice of providers, disruption of care continuity if an enrollee changes plans (and networks) or a provider leaves the network, and surprise medical bills (discussed more fully below).Medicare Advantage plans are subject to federal minimum standards with respect to provider network adequacy, but many have limited provider networks. On average, Medicare Advantage plan physician networks included less than half (46%) of all physicians in a county, and about one in three (35%) Medicare Advantage enrollees were in plans with narrow physician networks; one in six Medicare Advantage plans had narrow or ultra-narrow hospital networks.With respect to Medicaid MCOs, federal rules require that states establish network adequacy standards.  States have a great deal of flexibility to define those standards. Medicaid MCOs may use narrow networks but must comply with established network adequacy standards.
  • Surprise medical bills – In any type of network plan, patients sometimes receive care from hospitals and doctors they do not choose and are not in their plan’s network. So-called surprise medical bills can arise in emergencies—18% of emergency claims by people covered under large group health plans involved at least one out-of-network bill.  However, planned care can also involve surprise bills, such as when a pregnant woman chooses to deliver at an in-network hospital, but the on-call anesthesiologist is out-of-network—16% of in-network hospital claims by people covered under large group health plans involved at least one out-of-network bill.While people with private insurance HMOs can be charged unlimited amounts for out-of-network care, people in Medicare Advantage HMOs who see out-of-network providers can only be charged what the provider would receive from traditional Medicare. Medicaid MCOs must adequately and timely cover services out-of-network at no more than in-network cost to enrollees, if the services cannot be provided in-network, including emergency care.
  • Coverage continuity – Each month, many people lose or transition to new commercial coverage because they leave, lose, or change jobs. Even with no change in employment status, one’s group health benefits can change if an employer changes the plans it offers to employees. Disruptions in health insurance coverage can lead to disruptions in medical care, which could in turn have health consequences, lead to higher out-of-pocket costs, and cause stress for consumers.In 2018, 61% of all firms offering health benefits shopped for a new health plan or health insurance carrier and, of those, 25% changed plans/carriers. Turnover in non-group coverage is higher.  In 2016, 30% of enrollees were new to the market, and another 25% had switched from a different non-group plan the prior year. People who switch plans in the ACA Marketplaces changed coverage for a variety of reasons – for example, to find a lower premium or a plan that covered their doctor or because the prior plan was cancelled.Medicare Advantage enrollees generally have the option of remaining covered by the same plan, switching to a new Medicare Advantage plan, or switching to traditional Medicare program during the annual open enrollment period. The majority of Medicare Advantage enrollees do not voluntarily switch plans during the open enrollment period; however, enrollees with significant medical needs, enrollees who are under age 65 with significant disabilities, and enrollees with low incomes tend to disenroll from their private plan and switch to traditional Medicare at higher than average rates.For Medicaid, enrollees in mandatory managed care arrangements must be given a choice of at least two plans (with certain exceptions). Enrollees have the right to change plans “without cause” within 90 days of enrolling in the plan, and every 12 months thereafter, and can change plans for cause at any time. However, continuity/transition issues may occur if/when plans end their contract in a state and when enrollees move on and off the Medicaid program due to changes in income.

Discussion

Evidence shows the public is generally satisfied with their health insurance coverage, which may explain why the question of how private insurance is treated under Medicare-for-all and public plan option proposals has become a contentious issue in the Democratic primary and influences public opinion.  At the same time, there are growing concerns that people with private insurance encounter problems with their coverage, including high deductibles, surprise medical bills, narrow networks, denials, and other affordability challenges – problems that would be addressed under some Medicare-for-all proposals, as currently drafted. About half of the public support Medicare-for-all; yet, the idea of being required to give up private insurance for a new national health program clearly makes people nervous. The United States is an outlier among high-income countries in its lack of universal coverage. However, even in countries that have achieve universal coverage through some form of single-payer health care system, there is typically a role for private insurance in providing supplemental coverage.

Today, there is broad support among Democratic presidential candidates for expanding access to public health insurance programs, like Medicare.  Some favor a new Medicare program that will replace most or all current private coverage and promise affordability and coverage continuity that private insurance today does not always deliver, with the trade-off of higher taxes and substantial disruption to the current system.  Others favor a new Medicare option that can offer advantages over private insurance but not eliminate private coverage altogether, requiring less new federal spending but also continued premiums and cost sharing for many.  As the debate continues, it remains to be seen how effectively candidates and other advocates can educate the public about the specifics of their proposals and about the relative merits of providing health coverage through a public plan versus a system of competing public and private plans, and how well voters will come to understand the trade-offs involved.