Individual Insurance Market Performance in Early 2020

Authors: Rachel Fehr, Daniel McDermott, and Cynthia Cox
Published: Jul 13, 2020

Issue Brief

The coronavirus pandemic and the resulting economic downturn are likely to impact the individual insurance market in profound but complex ways. In this brief, we analyze first quarter data from 2011 through 2020 to examine how the individual insurance market performed under the Affordable Care Act (ACA) and during the first few months of the year, when the coronavirus pandemic was first emerging in the United States.

We use financial data reported by insurance companies to the National Association of Insurance Commissioners and compiled by Mark Farrah Associates to look at the average premiums, claims, medical loss ratios, gross margins, and enrollee utilization in the individual market. These figures include coverage purchased through the ACA’s exchange marketplaces and ACA-compliant plans purchased directly from insurers outside the marketplaces (which are part of the same risk pool), as well as individual plans originally purchased before the ACA went into effect.

We find that, on average, the individual market remained relatively stable through the first three months of 2020. Individual market insurers remained profitable, on average, as claims costs rose only slightly in the first three months of 2020. On average nationally, hospitalization rates, inpatient admissions, and physician encounters through March did not changed substantially compared to previous years. It is likely that the most significant impacts of the coronavirus outbreak and economic crisis on the individual market will not be evident nationally until data from the second and third quarters of 2020 become available.

Medical Loss Ratios

As we found in our previous analysis, insurer financial performance as measured by loss ratios (the share of health premiums paid out as claims) worsened in the earliest years of the ACA Marketplaces, but began to improve in recent years. This is to be expected, as the market had just undergone significant regulatory changes in 2014 and insurers had very little information to work with in setting their premiums.

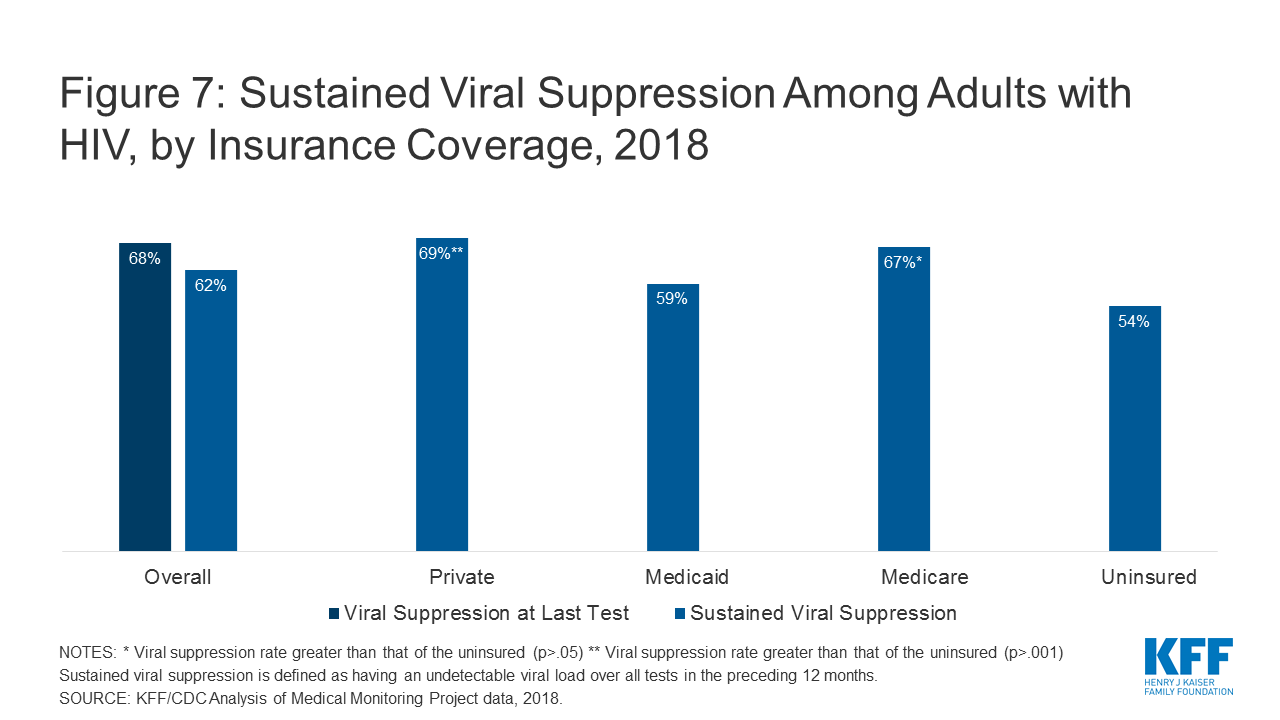
The chart below shows simple loss ratios, which differ from the formula used in the ACA’s MLR provision.1  Loss ratios began to decline in 2016, suggesting improved financial performance. In 2017, following relatively large premium increases, individual market insurers saw significant improvement in loss ratios, a sign that individual market insurers on average were beginning to better match premium revenues to claims costs. Loss ratios continued to decline in 2018, averaging 68% through the first quarter, suggesting that insurers were able to build in the loss of cost-sharing subsidy payments when setting premiums and some insurers over-corrected. With such low ratios, insurers could not justify premium hikes for 2019, and loss ratios rebounded to average 73% in the first three months of 2019. In early 2020, medical loss ratios fell slightly, to an average of 70%. This decline reflects slow growth in claims costs, possibly due to cancelled elective procedures and routine care due to COVID-19 restrictions.

First quarter loss ratios tend to follow the same pattern as annual loss ratios, but in recent years have been between 2 and 10 percentage points lower than annual loss ratios (Figure 1).2 
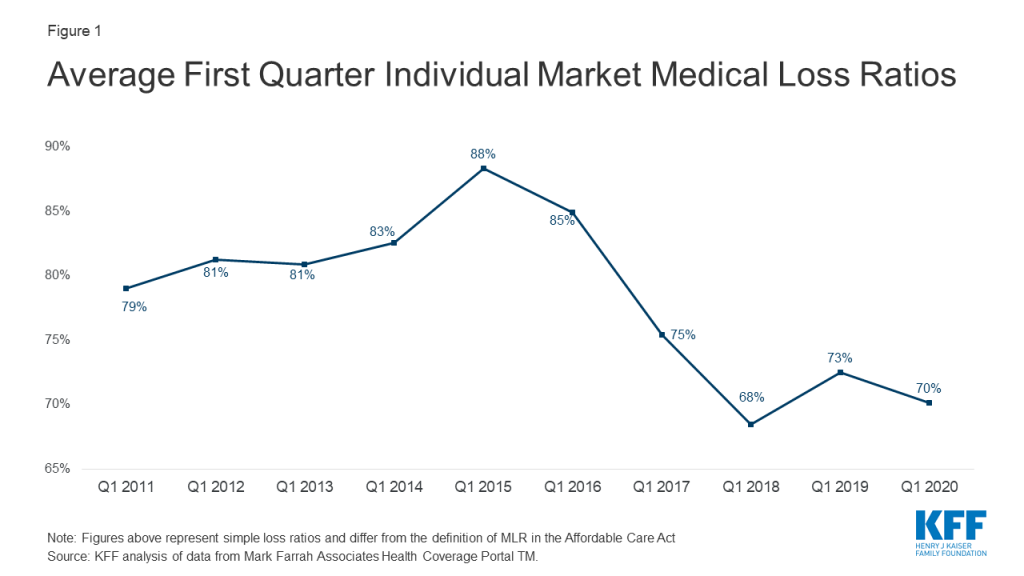
Figure 1: Average First Quarter Individual Market Medical Loss Ratios

Gross Margins

Another way to look at individual market financial performance is to examine average gross margins per member per month, or the average amount by which premium income exceeds claims costs per enrollee in a given month. Gross margins are an indicator of performance, but positive margins do not necessarily translate into profitability since they do not account for administrative expenses.

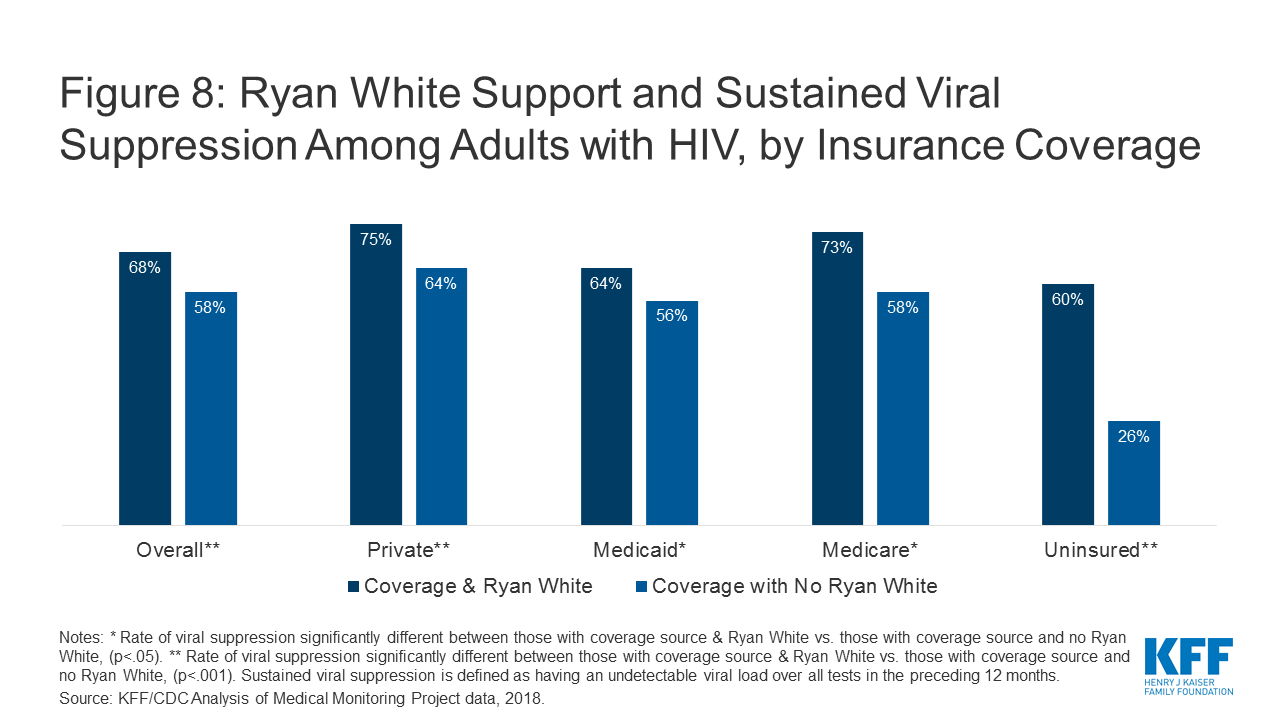
Gross margins show a similar pattern to loss ratios (Figure 2). Insurer financial performance improved through early 2018 and fell slightly in 2019 as premium growth moderated. Margins increased during the first three months of 2020 to an average of $156 per member per month, slightly above the previous high point of $155 in 2018. These data suggest that insurers in this market remain financially healthy, on average, even while the coronavirus outbreak emerged during the first three months of 2020.
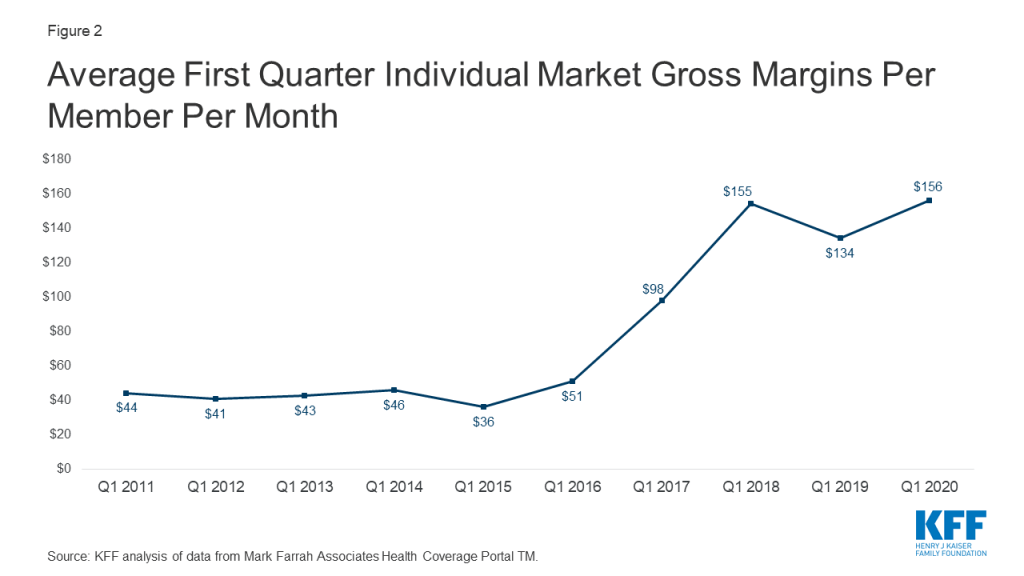
Figure 2: Average First Quarter Individual Market Gross Margins Per Member Per Month

Some individual market insurers have seen high claims costs for those who needed testing or treatment for coronavirus, particularly as insurers are prohibited by law from charging patient cost-sharing for COVID-19 testing and some insurers have voluntarily waived cost-sharing for coronavirus-related treatment costs. However, insurers have also seen claims fall for elective procedures and routine care. On net, claims per enrollee grew by only 3% on average, while per person premiums grew by 7% during first quarter 2020 relative to the same period last year (Figure 3).
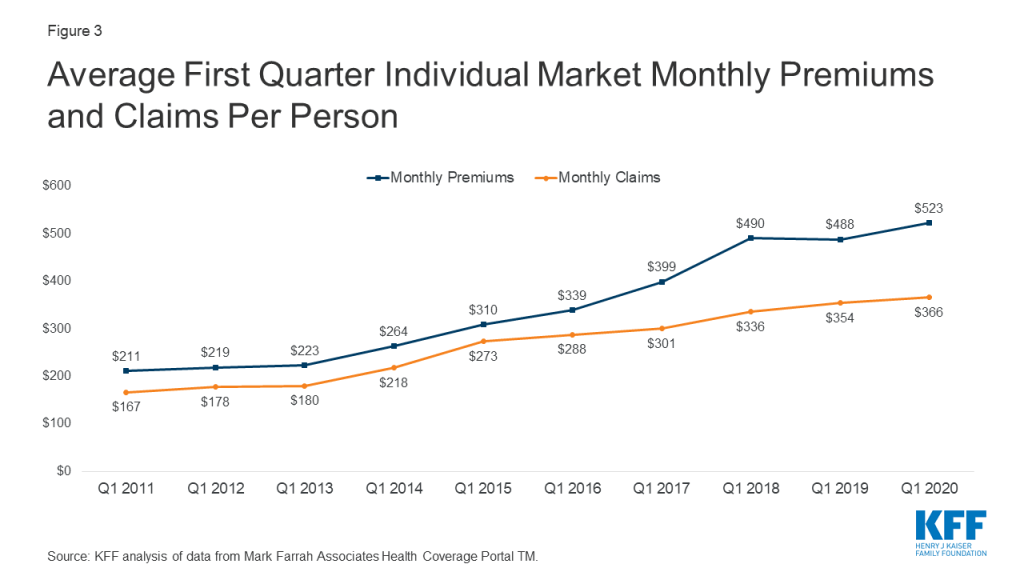
Figure 3: Average First Quarter Individual Market Monthly Premiums and Claims Per Person

Similarly, several competing forces affected health care utilization among those enrolled in the individual market through the first three months of 2020. Enrollees who contracted coronavirus often had lengthy hospital stays or several physician encounters for COVID-19 testing and treatment. However, in many cases, routine health care was delayed or forgone and hospitals delayed or canceled elective procedures. On net, average hospital days per month and average inpatient admissions remained essentially unchanged in early 2020, compared with 2019 (Figure 4).
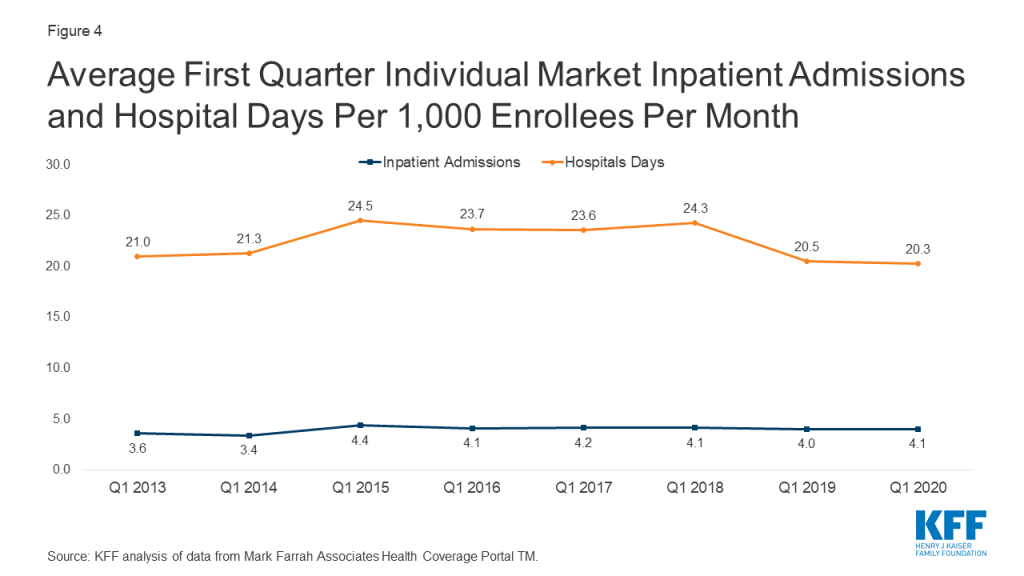
Figure 4: Average First Quarter Individual Market Inpatient Admissions and Hospital Days Per 1,000 Enrollees Per Month

Average physician encounters in the individual market were lower in the first quarter of 2020 than in 2019, falling to 484 encounters per 1,000 enrollees per month (Figure 5). This drop may reflect routine care that was delayed or cancelled due to coronavirus, but the decrease is within the variation seen in previous years.
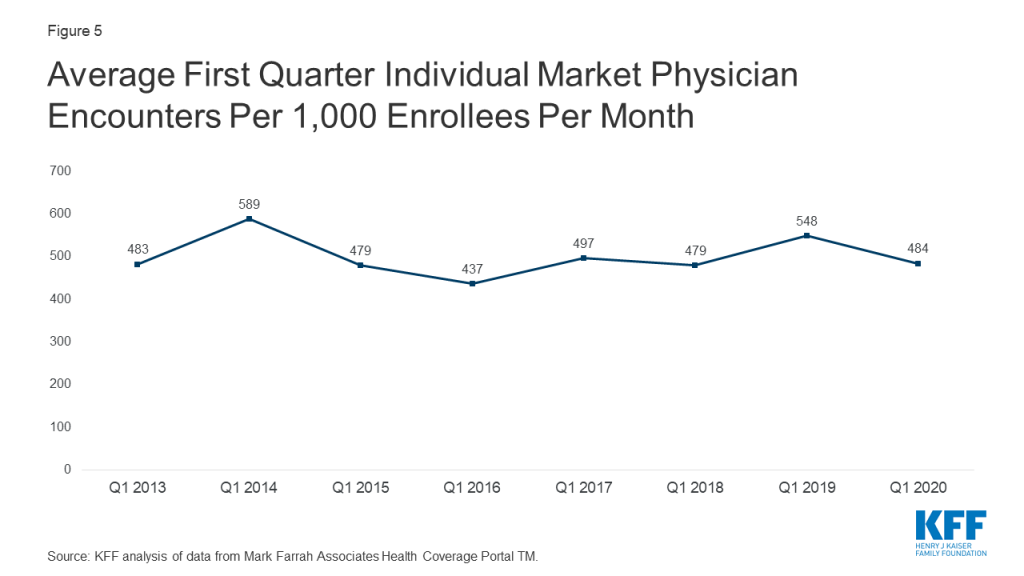
Figure 5: Average First Quarter Individual Market Physician Encounters Per 1,000 Enrollees Per Month

Discussion

Data from the first three months of 2020 suggest that the individual market had not yet been severely impacted by the coronavirus pandemic or the economic crisis as of March, but there are reasons to suspect more significant changes in the second and third quarters. Enrollment in individual market plans may have increased since March, as people losing job-based coverage may have moved onto the individual market. CMS recently reported that, since the end of the open enrollment period in December, 487,000 consumers have enrolled in plans through HealthCare.gov after qualifying for a Special Enrollment Period (SEP) following the loss other qualifying health coverage. Second quarter data for 2020 may also show more changes in utilization among individual market enrollees, as other data have shown health care utilization dropped sharply in late March through Mid-April due to social distancing and fears of contracting the virus, although some services began to return by late-April and May.

Insurers have begun to submit their 2021 premiums to state regulators for review. Most insurers have said they expect the pandemic to have complex effects on premiums, but many do not yet have a specific estimate of how much premiums might change due to COVID-19. It therefore remains to be seen how continued uncertainty around the coronavirus pandemic and the economic crisis may affect premiums and plan participation in 2021 or beyond.

Methods

We analyzed insurer-reported financial data from Health Coverage Portal TM, a market database maintained by Mark Farrah Associates, which includes information from the National Association of Insurance Commissioners. The dataset analyzed in this report does not include NAIC plans licensed as life insurance or California HMOs regulated by California’s Department of Managed Health Care; in total, the plans in this dataset represent at least 80% of the individual market. All figures in this issue brief are for the individual health insurance market as a whole, which includes major medical insurance plans and mini-med plans sold both on and off exchange. We excluded some plans that filed negative enrollment, premiums, or claims and corrected for plans that did not file “member months” in the annual statement but did file current year membership.

To calculate the weighted average loss ratio across the individual market, we divided the market-wide sum of total incurred claims by the sum of all unadjusted health premiums earned. Medical loss ratios in this analysis are simple loss ratios and do not adjust for quality improvement expenses, taxes, or risk program payments. Gross margins were calculated by subtracting the sum of total incurred claims from the sum of unadjusted health premiums earned and dividing by the total number of member months (average monthly enrollment) in the individual insurance market.

Endnotes

  1. The loss ratios shown in this issue brief differ from the definition of MLR in the ACA, which makes some adjustments for quality improvement and taxes, and do not account for reinsurance, risk corridors, or risk adjustment payments. Reinsurance payments, in particular, helped offset some losses insurers would have otherwise experienced. However, the ACA’s reinsurance program was temporary, ending in 2016, so loss ratio calculations excluding reinsurance payments are a good indicator of financial stability going forward. ↩︎
  2. Although first quarter loss ratios and margins generally follow a similar pattern as annual data, starting in 2014 with the move to an annual open enrollment that corresponds to the calendar year, first quarter MLRs have been about 2 – 10 percentage points lower than annual loss ratios in the same year. This is because renewing existing customers, as well as new enrollees, are starting to pay toward their deductibles in January, whereas pre-ACA, renewals would occur throughout the calendar year. ↩︎
How Many Teachers Are at Risk of Serious Illness If Infected with Coronavirus?

Authors: Gary Claxton, Larry Levitt, Rabah Kamal, Tricia Neuman, Jennifer Kates, Josh Michaud, Wyatt Koma, and Matthew Rae
Published: Jul 10, 2020

As the nation continues to struggle to contain the spread of coronavirus, there is considerable debate about when and how to reopen schools. Education is primarily a state and local concern, and although they have received mixed guidance from federal officials, the decisions over reopening will be made at the state and local level.

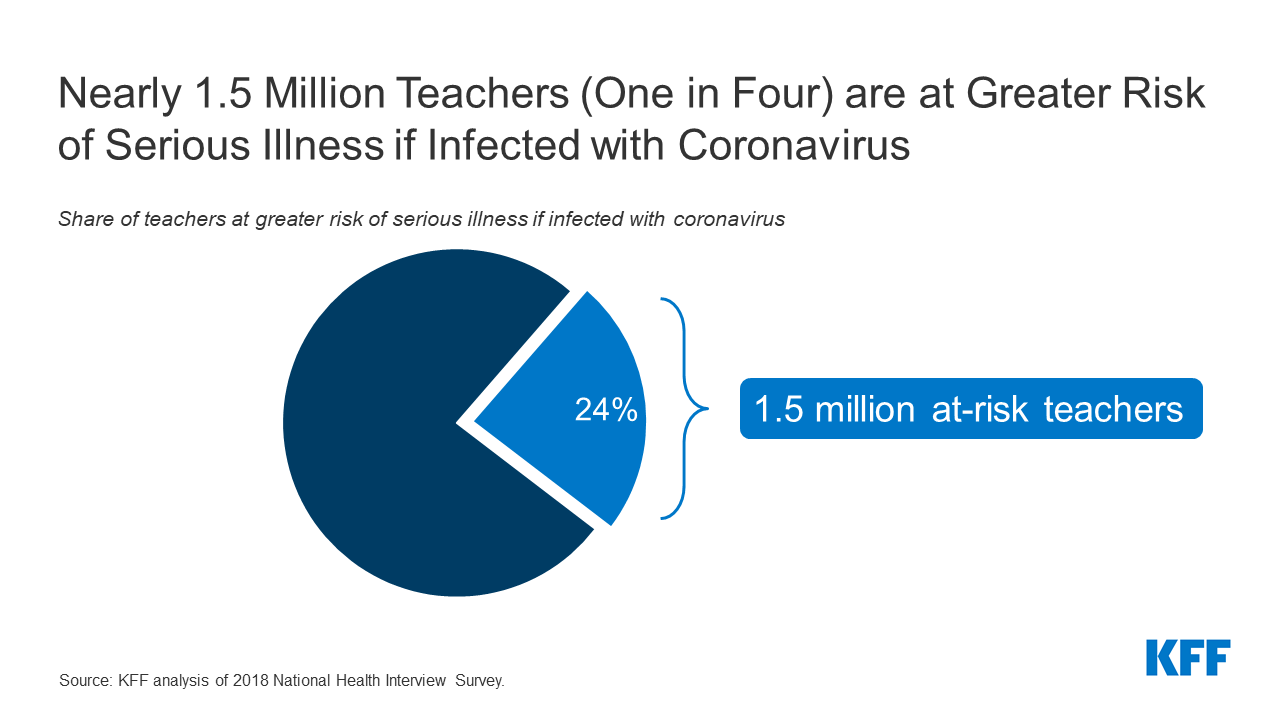
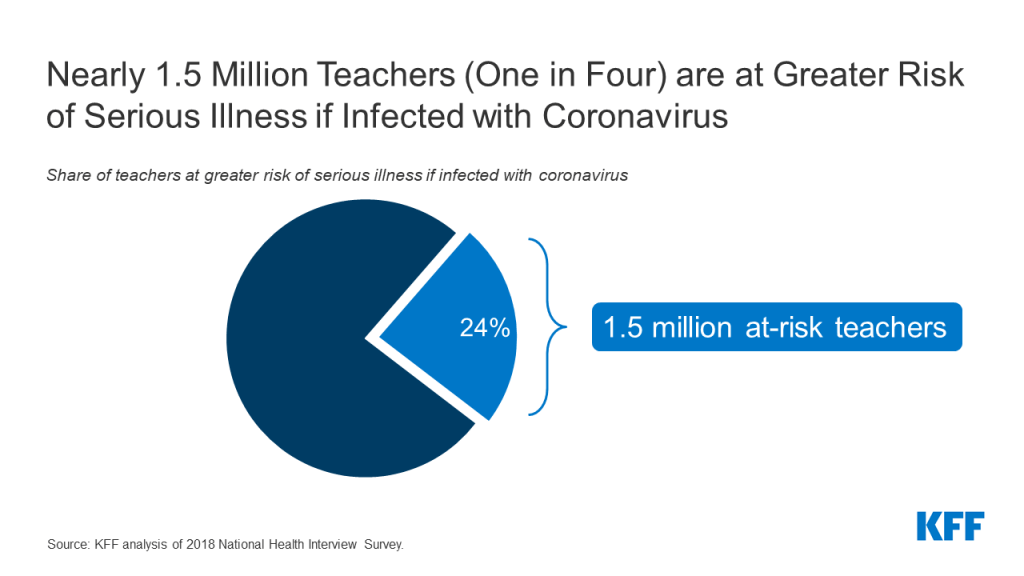
One of the myriad of issues these officials will face will be how to keep school employees safe at work, particularly those who are at increased risk of serious illness if they become infected with coronavirus. The Centers for Disease Control have identified a number of factors that put individuals at increased risk of serious illness if infected; these include several health conditions, including having diabetes, chronic obstructive pulmonary disease (COPD), heart disease, moderate or severe asthma, having a body mass index (BMI) of greater than 40, or having a compromised immune system, which for example, may occur during cancer treatment. Being age 65 and older also is considered to be a risk factor. In a previous study, we reported that almost one in four workers are at higher risk of severe illness if they were to become infected. While children are at less risk for serious illness from coronavirus than adults and often have mild or no symptoms when infected, the teachers and other adult staff in schools face higher risk. We used a similar approach to look at teachers and other instructors, and we find that one in four teachers (24%, or about 1.47 million people), have a condition that puts them at higher risk of serious illness from coronavirus (Figure). This percentage is the same as the one we found for workers overall; the challenge for school systems and for teachers in particular is the sheer volume of traffic and tight quarters in many school environments, which may make social distancing a significant challenge in many settings. For higher-risk teachers, failure to achieve safe working conditions could have very serious results.

Nearly 1.5 Million Teachers (One in Four) are at Greater Risk of Serious Illness if Infected with Coronavirus

Given the difficulty of maintaining social distancing in a crowded school environment, these at-risk teachers may be reluctant to return to their schools until infection rates fall to much lower levels. At the same time, teaching is not a particularly high-paying profession, so many teachers may feel economically compelled to return to their schools if they reopen, even if those teachers do not feel safe. How state and local officials balance the desire to reopen schools and other facilities with the need to assure the safety of students, parents, and school personnel will have significant health and economic consequences for both people and the communities they live in. Assuring the safety of teachers and others at higher risk of serious illness from coronavirus is a crucial part of the calculation around reopening.

Methods

This analysis uses data from the 2018 National Health Interview Survey (NHIS) to look at the share of workers who would be at increased risk of becoming seriously ill if they become infected with coronavirus. The risk factors we were able to analyze were having diabetes, chronic obstructive pulmonary disease (COPD), heart disease, a body mass index (BMI) above 40, and a functional limitation due to cancer. As we previously discussed we included 62% of those with asthma none of the other risk factors, as at risk. In addition, the CDC criteria consider all people over age 65 to be at increased risk. We define teachers as individuals whose occupation is “primary, secondary, and special education school teachers” or “other teachers and instructors,” and are employed in the “Education Services Industries” industry. Only teachers who are currently working, looking for work or on a temporary absence such as a planned vacation, maternity leave or temporary medical leave were included.

This Week in Coronavirus: July 2 to July 9

Published: Jul 10, 2020

Every week we recap the past week in the coronavirus pandemic from our tracking, policy analysis, polling, and journalism.

The number of COVID-19 cases in the U.S. is expanding rapidly. On Wednesday, July 8, the United States surpassed another grim milestone when the day ended with more than 3 million confirmed cases. While the locations of outbreaks continue to move across the country, surging in some states and falling in others, much of the recent case growth has been occurring in the South and West.

As of July 8th, we identified 33 states as hotspots (experiencing recent increases in cases for 14 days and an increasing positivity rate or positivity rate over 10%), 23 of which were in the South and West. The shifting surge in outbreaks to the South and West will likely exacerbate the disparate effects of COVID-19 for people of color, who already are facing a higher burden of cases, hospitalizations, and deaths as well as a larger economic toll compared to their White counterparts. Hispanic people may be particularly hard hit as outbreaks rise in these regions of the country.

The coronavirus pandemic and resulting economic downturn have taken a toll on mental health for many people, with over 30% of adults in the U.S. now reporting symptoms consistent with an anxiety and/or depressive disorder. KFF polling during the pandemic has consistently found large shares of the public saying that worry and stress related to the coronavirus have had a negative effect on their mental health. This is coming at a time when mental health resources were already strained, and people with mental health diagnoses often face barriers to care. Our new fact sheets examine national and state-level data on mental health prior to the pandemic, which is expected to place additional strains on the system.

Here are the latest coronavirus stats from KFF’s tracking resources:

Global Cases and Deaths: Total cases worldwide passed 12 million between July 2 and July 9– with an increase of approximately 1.4 million new confirmed cases. There were also approximately 33,500 new confirmed deaths worldwide between July 2 and July 9, bringing the total to approximately 555,000 confirmed deaths.

U.S. Cases and Deaths: Total confirmed cases in the U.S. surpassed 3 million this week. There was an approximate increase of nearly 374,500 confirmed cases between July 2 and July 9. Approximately 4,500 confirmed deaths in the past week brought the total to over 133,000 confirmed deaths in the U.S.

U.S. Tests: There have been over 38 million total COVID-19 tests with results in the U.S. In the past 7 days, 1.4% of the total U.S. population was tested.

Race/Ethnicity Data: Black individuals made up a higher share of cases/deaths compared to their share of the population in 30 of 48 states reporting cases and 33 of 44 states reporting deaths. In 6 states (KS, WI, MO, MI, TN, and IL) the share of COVID-19 related deaths among Black people was at least two times higher than their share of the total population. Hispanic individuals made up a higher share of cases compared to their share of the total population in 37 of 45 states reporting cases. In 7 states (KY, TN, IA, WI, NE, SD, and MN), Hispanic peoples’ share of cases was more than 4 times their share of the population. COVID-19 continues to have a sharp, disproportionate impact on American Indian/Alaska Native as well as Asian people in some states.

Adults at Higher Risk of Serious Illness if Infected with Coronavirus: 38% of all U.S. adults are at risk of serious illness if infected with coronavirus (92,560,223 total) due to their age (65 and over) or pre-existing medical condition. Of those at higher risk, 45% are under age 65 and at increased risk of serious illness if infected with coronavirus due to their existing medical condition such as such as heart disease, diabetes, lung disease, uncontrolled asthma or obesity. Among nonelderly adults — low-income, American Indian/Alaska Native & Black adults have a higher risk of serious illness if infected with coronavirus. In both cases – for race and household income – the higher risk of serious illness if infected with coronavirus is chiefly due to a higher prevalence of underlying health conditions and longstanding disparities in health care and other socio-economic factors.

State Reports of Long-Term Care Facility Cases and Deaths Related to COVID-19 (Includes Washington D.C.)

  • Data Reporting Status: 47 states are reporting COVID-19 data in long-term care facilities, 4 states are not reporting
  • Long-term care facilities with known cases: 11,644 (across 44 states)
  • Cases in long-term care facilities: 283,973 (across 43 states)
  • Deaths in long-term care facilities: 56,143 (in 42 states)
  • Long-term care facilities as a share of total state cases: 12% (across 43 states)
  • Long-term care facility deaths as a share of total state deaths: 44% (across 42 states)

State Social Distancing Actions (includes Washington D.C.):

  • Status of reopening: Proceeding in 26 states, paused in 10 states, new restrictions in 7 states, reopened in 8 states
  • Stay At Home Order: Original stay at home order in 6 states, stay at home order eased or lifted in 39 states, no action in 6 states
  • Mandatory Quarantine for Travelers: Original traveler quarantine mandate in place in 9 states, new traveler quarantine mandate in place in 3 states, traveler quarantine mandate eased or lifted in 16 states, no action in 23 states
  • Non-Essential Business Closures: Some or all non-essential businesses permitted to reopen (some with reduced capacity) in 43 states, new business closures or limits in 3 states, no action in 5 states
  • Large Gatherings Ban: Original gathering ban/limit in place in 5 states, gathering/ban limit expanded or lifted in 42 states, new gathering/ban limit in place in 3 states, no action in 1 states
  • Restaurant Limits: Restaurants reopened to dine-in service in 48 states, newly closed to dine-in service in 1 state, new capacity limits in 1 state, no action in 1 state
  • Bar Closures: Closed in 9 states, reopened in 34 states, newly closed in 8 states
  • Face Covering Requirement: Required for general public in 23 states, required for certain employees in 18 states, allows local officials to require them for general public in 5 states, no action in 7 states
  • Primary Election Postponement: Postponement in 15 states, no postponement in 36 states
  • Emergency Declaration: There are emergency declarations in all 51 states.

State COVID-19 Health Policy Actions (Includes Washington D.C.)

  • Waive Cost Sharing for COVID-19 Treatment: 3 states require, state-insurer agreement in 3 states; no action in 45 states
  • Free Cost Vaccine When Available: 9 states require, state-insurer agreement in 1 state, no action in 41 states
  • States Requires Waiver of Prior Authorization Requirements: For COVID-19 testing only in 5 states, for COVID-19 testing and treatment in 6 states, no action in 40 states
  • Early Prescription Refills: State requires in 17 states, expired in 1 state, no action in 33 states
  • Premium Payment Grace Period: Grace period extended for all policies in 3 states, grace period extended for COVID-19 diagnosis/impacts only in 4 states, expired in 9 states, no action in 35 states
  • Marketplace Special Enrollment Period: Marketplace special enrollment period still active in 5 states, ended in 7 states, no special enrollment period in 39 states
  • Paid Sick Leave: 13 states enacted, 2 proposed, no action in 36 states

State Actions on Telehealth (Includes Washington D.C.)

  • New Requirements for Coverage of Telehealth Services: Parity with in-person services in 6 states, broad coverage of telehealth services in 6 states, limited coverage of telehealth services in 6 states, no action in 33 states
  • Waiving or Limiting Cost-Sharing for Telehealth Services: Waived for COVID-19 services only in 7 states, waived or limited for all services in 8 states, expired in 1 state, no action in 35 states
  • Reimbursement Parity for Telehealth and In-Person Services: Required for all services in 17 states, no action in 34 states
  • Require Expanded Options for Delivery of Telehealth Services: Yes in 34 states, for behavioral health services only in 1 state, expired in 1 state, no action in 15 states

Approved Medicaid State Actions to Address COVID-19 (Includes Washington D.C.)

  • Approved Section 1115 Waivers to Address COVID-19: 4 states (HI, NC, NH, WA) have approved waivers
  • Approved Section 1135 Waivers: 51 states have approved waivers
  • Approved 1915 (c) Appendix K Waivers: 50 states have approved waivers
  • Approved State Plan Amendments (SPAs): 46 states have temporary changes approved under Medicaid or CHIP disaster relief SPAs, 1 state has an approved traditional SPA
  • Other State-Reported Medicaid Administrative Actions: 51 states report taking other administrative actions in their Medicaid programs to address COVID-19

The latest Coronavirus Policy Watch posts:

  • Growing COVID-19 Hotspots in the U.S. South and West will Likely Widen Disparities for People of Color (CPW PostNews Release)

The latest KFF COVID-19 resources:

  • Mental Health and Substance Use State Fact Sheets (State Data, News Release)
  • Updated: State Data and Policy Actions to Address Coronavirus (Interactive)
  • Updated: COVID-19 Coronavirus Tracker – Updated as of July 8 (Interactive)
  • Updated: Medicaid Emergency Authority Tracker: Approved State Actions to Address COVID-19 (Issue Brief)
  • Trump Administration Notifies U.N. Of U.S. Withdrawal From WHO; Move Draws Concern, Criticism From Lawmakers, Global Health Experts (KFF Daily Global Health Policy Report)

The latest KHN COVID-19 stories:

  • Colorado, Like Other States, Trims Health Programs Amid Health Crisis (KHN)
  • Lost On The Frontline (KHNThe Guardian)
  • Amid Surge, Hospitals Hesitate To Cancel Nonemergency Surgeries (KHNLA Times)
  • KHN’s ‘What The Health?’: ‘Open The Schools, Close The Bars’ (Podcast)
  • As COVID Testing Soars, Wait Times For Results Jump To A Week — Or More (KHNLA Times)
  • Could Trump’s Push To Undo The ACA Cause Problems For COVID Survivors? Biden Thinks So. (KHN)
  • High Court Allows Employers To Opt Out Of ACA’s Mandate On Birth Control Coverage (KHN)
  • Analysis: How A COVID-19 Vaccine Could Cost Americans Dearly (KHNNY Times)
  • ‘Please Tell Me My Life Is Worth A LITTLE Of Your Discomfort,’ Nurse Pleads (KHN)
  • How We Reported ‘Underfunded And Under Threat’ (KHNAP)
  • In Texas, Individual Freedoms Clash With Efforts To Slow The Surge Of COVID Cases (KHN)
  • COVID Cuts A Lethal Path Through San Quentin’s Death Row (CHLDaily Beast)
  • COVID Catch-22: They Got A Big ER Bill Because Hospitals Couldn’t Test For Virus (KHNNPR)
  • What Seniors Should Know Before Going Ahead With Elective Procedures (KHNNY Times)
  • COVID-Tracking Apps Proliferate, But Will They Really Help? (CHLSF Chronicle)
  • Lost On The Frontline (KHNThe Guardian)
  • Life Beyond COVID Seclusion: Seniors See Challenges And Change Ahead (KHN)
  • Coronavirus Crisis Disrupts Treatment For Another Epidemic: Addiction (KHNLA Times)
  • Social Media Image About Mask Efficacy Right In Sentiment, But Percentages Are ‘Bonkers’ (KHNPolitiFact)
News Release

New State Fact Sheets Highlight Key Data About Mental Health and Substance Use Needs and Capacity

Published: Jul 10, 2020

The COVID-19 pandemic and resulting economic downturn are taking a toll on mental health for many Americans, with large shares of the public saying that related worry and stress is having a negative effect on their mental health.

A new KFF analysis and series of state fact sheets examine mental health and substance use disorder needs in the states and capacity to meet residents’ needs prior to the pandemic, which is expected to place additional strains on the system. Average weekly data for June 2020 found that 36.5% of adults in the U.S. report symptoms of anxiety or depressive disorder, up from 11.0% in 2019. Louisiana (42.9%), Florida (41.5%) and Oregon (41.3%) have the highest shares reporting such symptoms, while Wisconsin (27.2%), Minnesota (30.5%) and Nebraska (30.6%) have the lowest.

The analysis highlights the wide range of needs and resources across states. For example:

  • The share of adults with any diagnosable mental, behavioral or emotional disorder ranged from a high of 25.3% in Utah to a low of 16.1% in New Jersey in 2017-2018. Utah also has the highest prevalence of adults with serious mental illness (6.4%), while New Jersey has the lowest (3.6%).
  • Nationally, more than a third (34.3%) of adults with serious mental illness did not receive treatment. This includes about half of those in Alaska, Louisiana and Georgia, and less than a quarter of those living in Tennessee, Vermont, South Dakota and Washington State.
  • Suicide is one of the top 10 causes of death in the U.S. and has increased in almost every state over time. Age-adjusted suicide rates are about three times as high in New Mexico, Montana and Wyoming as they are in the New York, New Jersey and the District of Columbia.
  • Deaths due to drug overdose increased nearly fourfold nationally from 1999 to 2018. West Virginia and Delaware have the highest age-adjusted overdose death rates – more than five times the rate in South Dakota and Nebraska, which have the lowest rates.

The state fact sheets compile key information on mental illness prevalence; substance abuse and related deaths; suicide; mental health workforce; unmet need and barriers to care; private insurance coverage and costs; and Medicaid benefits.

They are designed to allow policymakers, health care professionals, patient groups and journalists to quickly assess the mental health and substance use landscape in each of the 50 states and the District of Columbia.

The fact sheets draw on dozens of indicators in KFF’s State Health Facts data collection related to mental health and substance use disorder. The data collection allows for quick comparisons across states and allows the creation of custom reports for select states and indicators.

This work was supported in part by Well Being Trust. We value our funders. KFF maintains full editorial control over all of its policy analysis, polling and journalism activities.

News Release

As the COVID-19 Pandemic Shifts to the South and West, the Disparate Impact on Communities of Color Will Follow

Published: Jul 10, 2020

The geographic shift of the nation’s worst COVID-19 outbreaks to states in the South and West is expected to intensify the well-documented disparities in the health and economic impacts of the pandemic on people of color — especially Hispanics, according to a new KFF analysis.

Twenty-three of the 33 states identified as coronavirus hotspots as of July 8 are in the South and West. The 23 states account for just over half (51%) of the nation’s overall population, but are home to more than 7 in 10 of all Hispanic individuals (71%) in the U.S. Overall, nearly two-thirds of all people of color (62%) in the U.S. reside in these states, compared to less than half of Whites (43%). Moreover, in a number of these states, people of color account for a larger share of the population compared to their share of the U.S. population overall.

Data already show that the pandemic has taken a harder toll on people of color in many of these states, with these groups accounting for a higher share of cases and deaths relative to their share of the population. The disproportionate impacts of COVID-19 for people of color mirror and compound underlying inequities in social and economic circumstances that leave people of color at higher risk of being exposed to the virus, experiencing serious illness if they contract the virus, facing barriers to accessing health care, and experiencing financial challenges due to the economic disruption caused by the pandemic.

The findings point to the importance of continuing to prioritize health equity as part of response and relief efforts and directing resources to communities who are at the highest risk and experiencing disproportionate effects.

News Release

About 1.5 Million Teachers are at Higher Risk of Serious Illness From COVID-19

Published: Jul 10, 2020

As local, state and federal official debate when and how to reopen schools across the nation, a new KFF analysis estimates nearly 1.5 million teachers have health conditions that put them at higher risk of serious illness if they were to contract COVID-19. This represents nearly one in four (24%) of all teachers around the country, creating challenges for schools trying to provide in-person classroom education safely for students and teachers alike.

While children are at less risk for serious illness from COVID-19 than adults and often have mild or no symptoms when infected, teachers and other adult staff in schools face higher risk.

The analysis finds teachers are similar to the broader workforce in terms of the share who are considered high risk for serious illness from COVID-19 as identified by the Centers for Disease Control and Prevention.  Factors that put someone at risk include being at least 65 years old; having diabetes, chronic obstructive pulmonary disease, heart disease, or moderate or severe asthma; being severely obese; and having a compromised immune system, as often occurs during cancer treatment.

Education is primarily a state and local concern, and although they have received mixed guidance from federal officials, decisions over reopening will be made at the state and local level.

One challenge for school systems is the sheer volume of traffic and tight quarters in many school environments, which may make social distancing difficult in the classroom and other settings. How state and local officials balance the desire to reopen schools with the need to assure the safety of students, parents, and school personnel will be have significant health and economic consequences for people and communities.

Growing COVID-19 Hotspots in the U.S. South and West will Likely Widen Disparities for People of Color

Published: Jul 10, 2020

The number of COVID-19 cases in the U.S. is expanding rapidly, particularly in many states in the South and West. While the locations of outbreaks continue to move across the country, surging in some states and falling in others, much of the recent case growth has been occurring in the South and West. As of July 8th, we identified 33 states as hotspots (experiencing recent increases in cases and an increasing positivity rate or positivity rate over 10%), 23 of which were in the South and West. The shifting surge in outbreaks to the South and West will likely exacerbate the disparate effects of COVID-19 for people of color, who already are facing a higher burden of cases, hospitalizations, and deaths as well as a larger economic toll compared to their White counterparts. Hispanic people may be particularly hard hit as outbreaks rise in these areas.

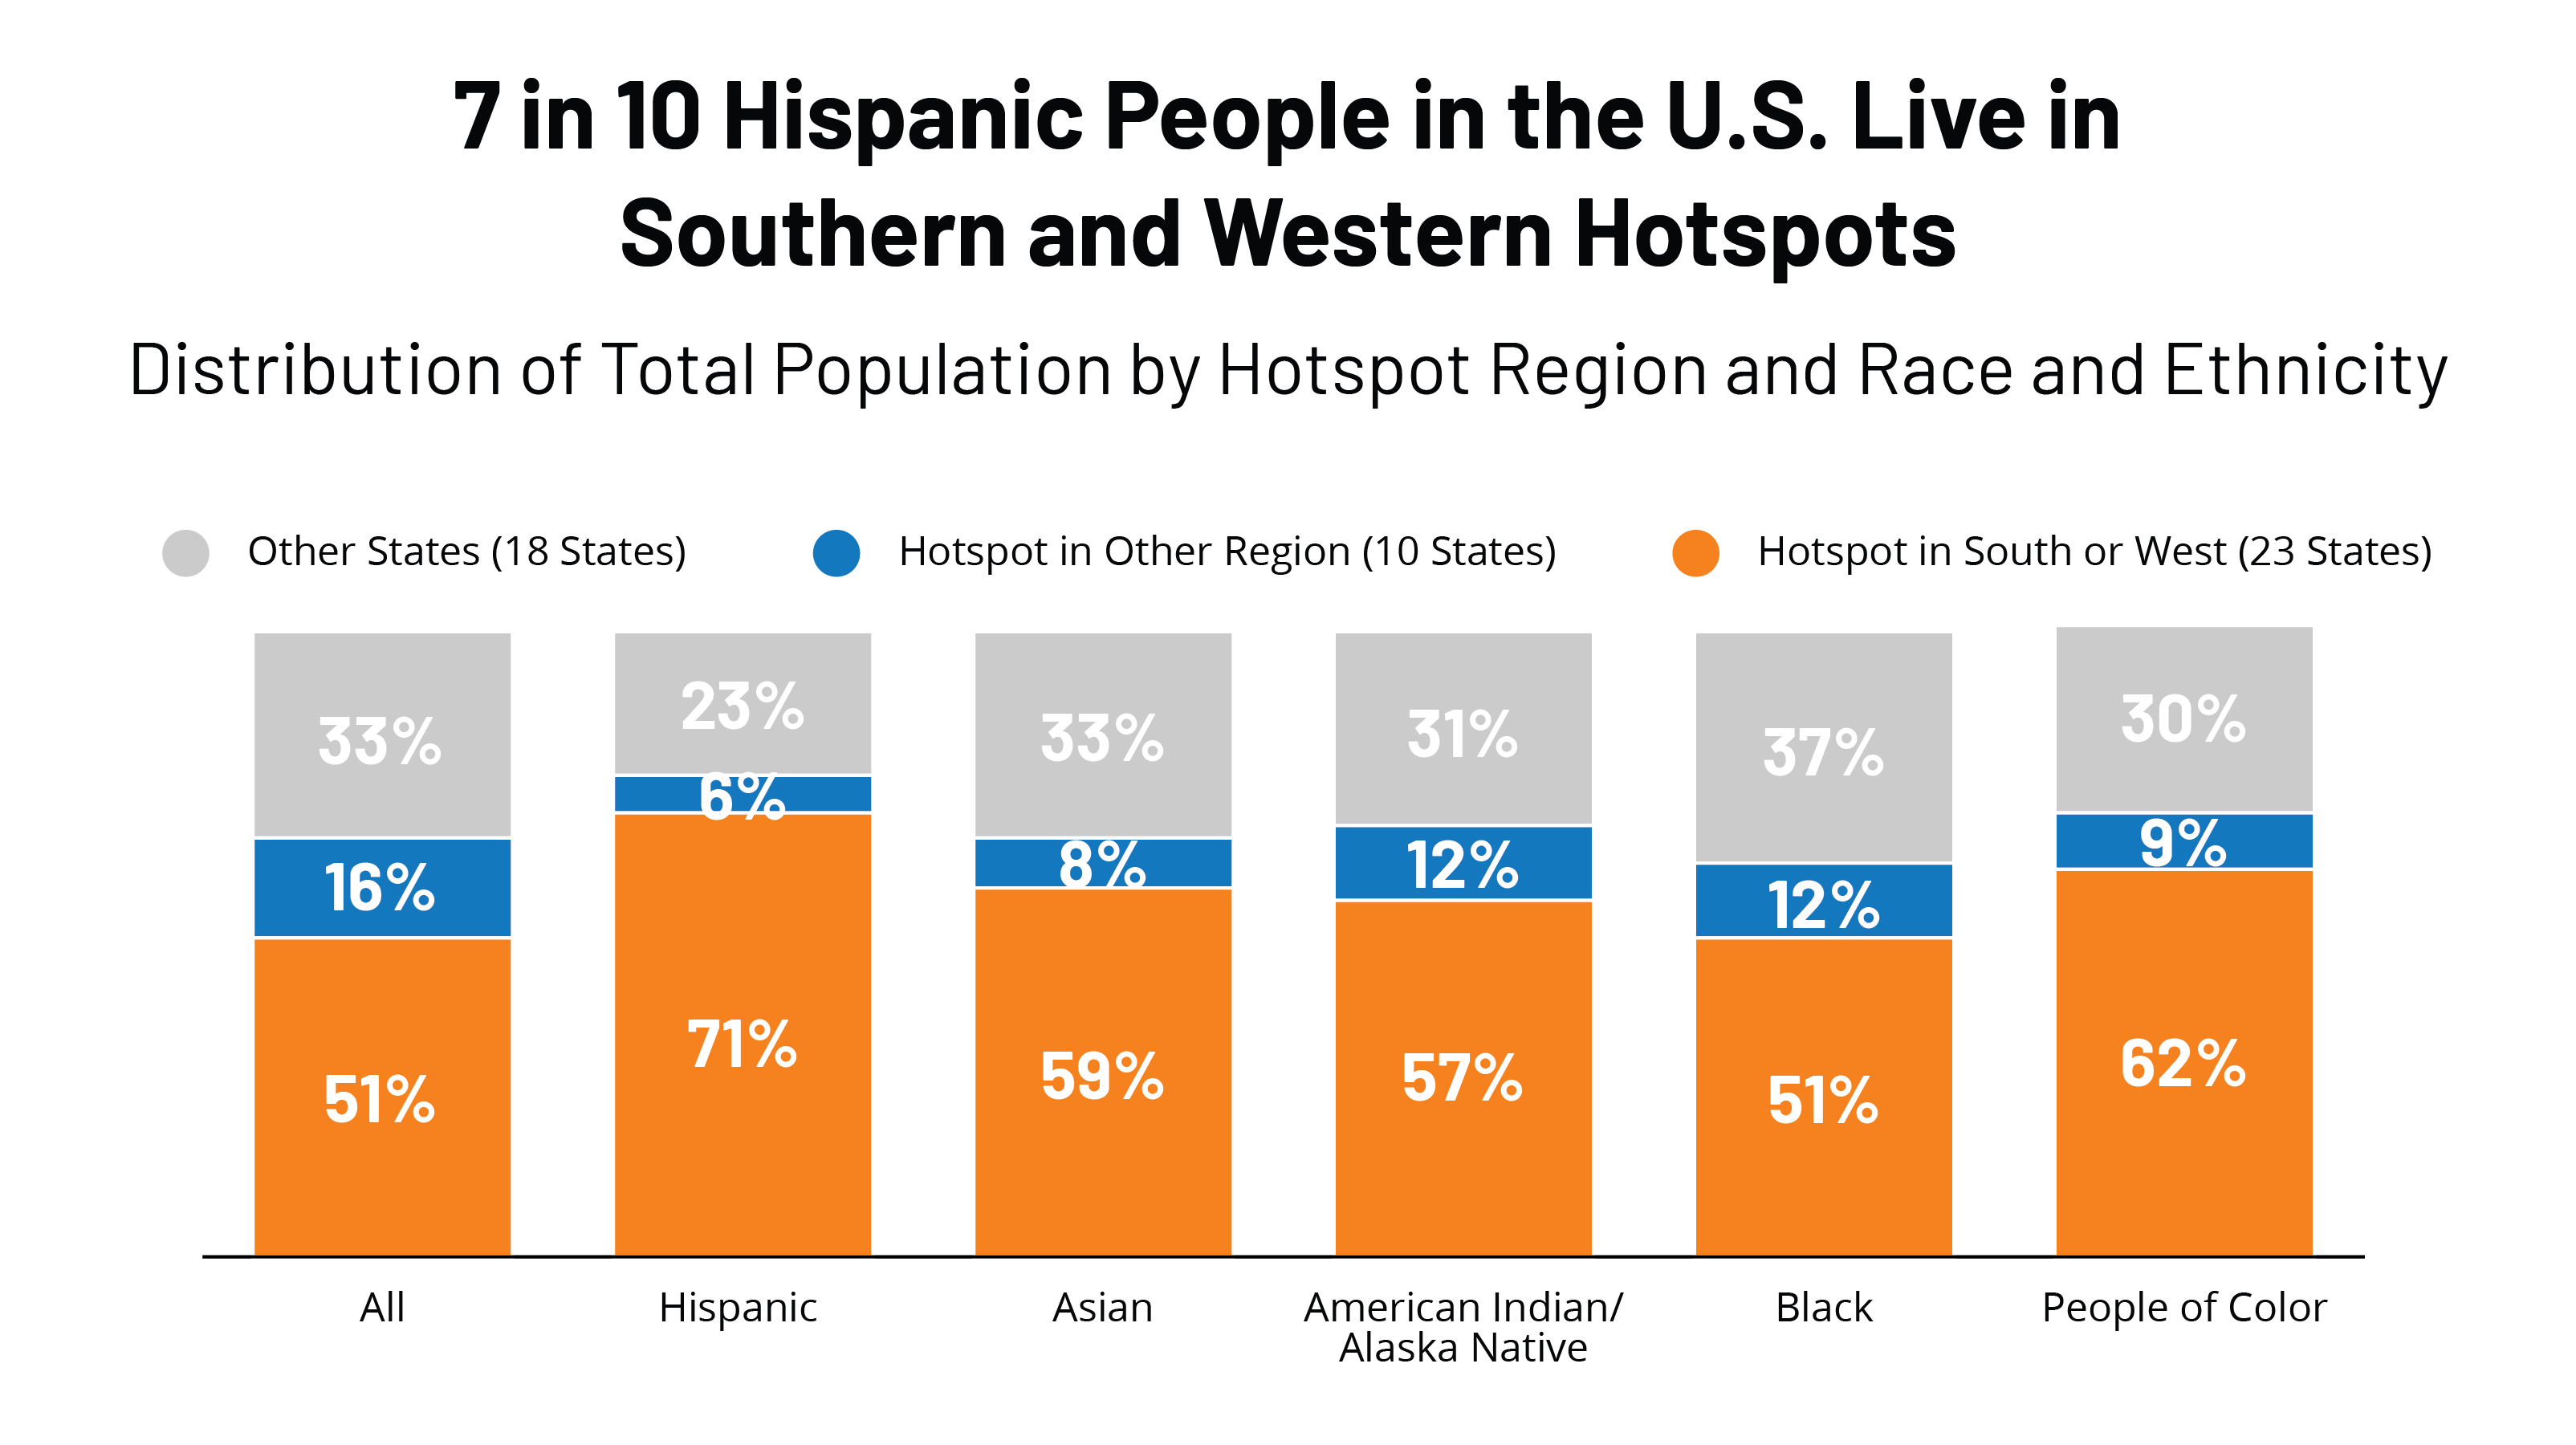
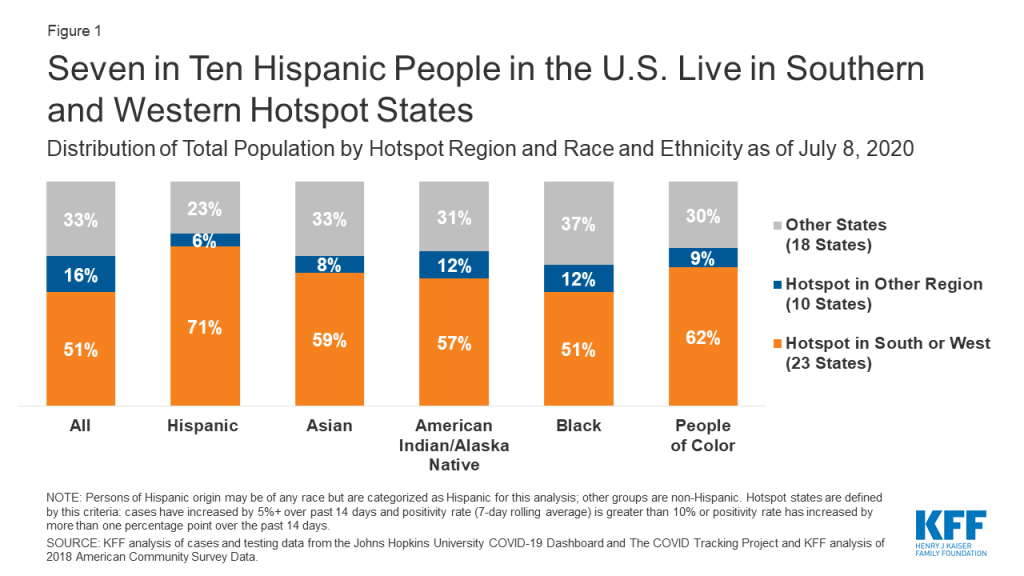
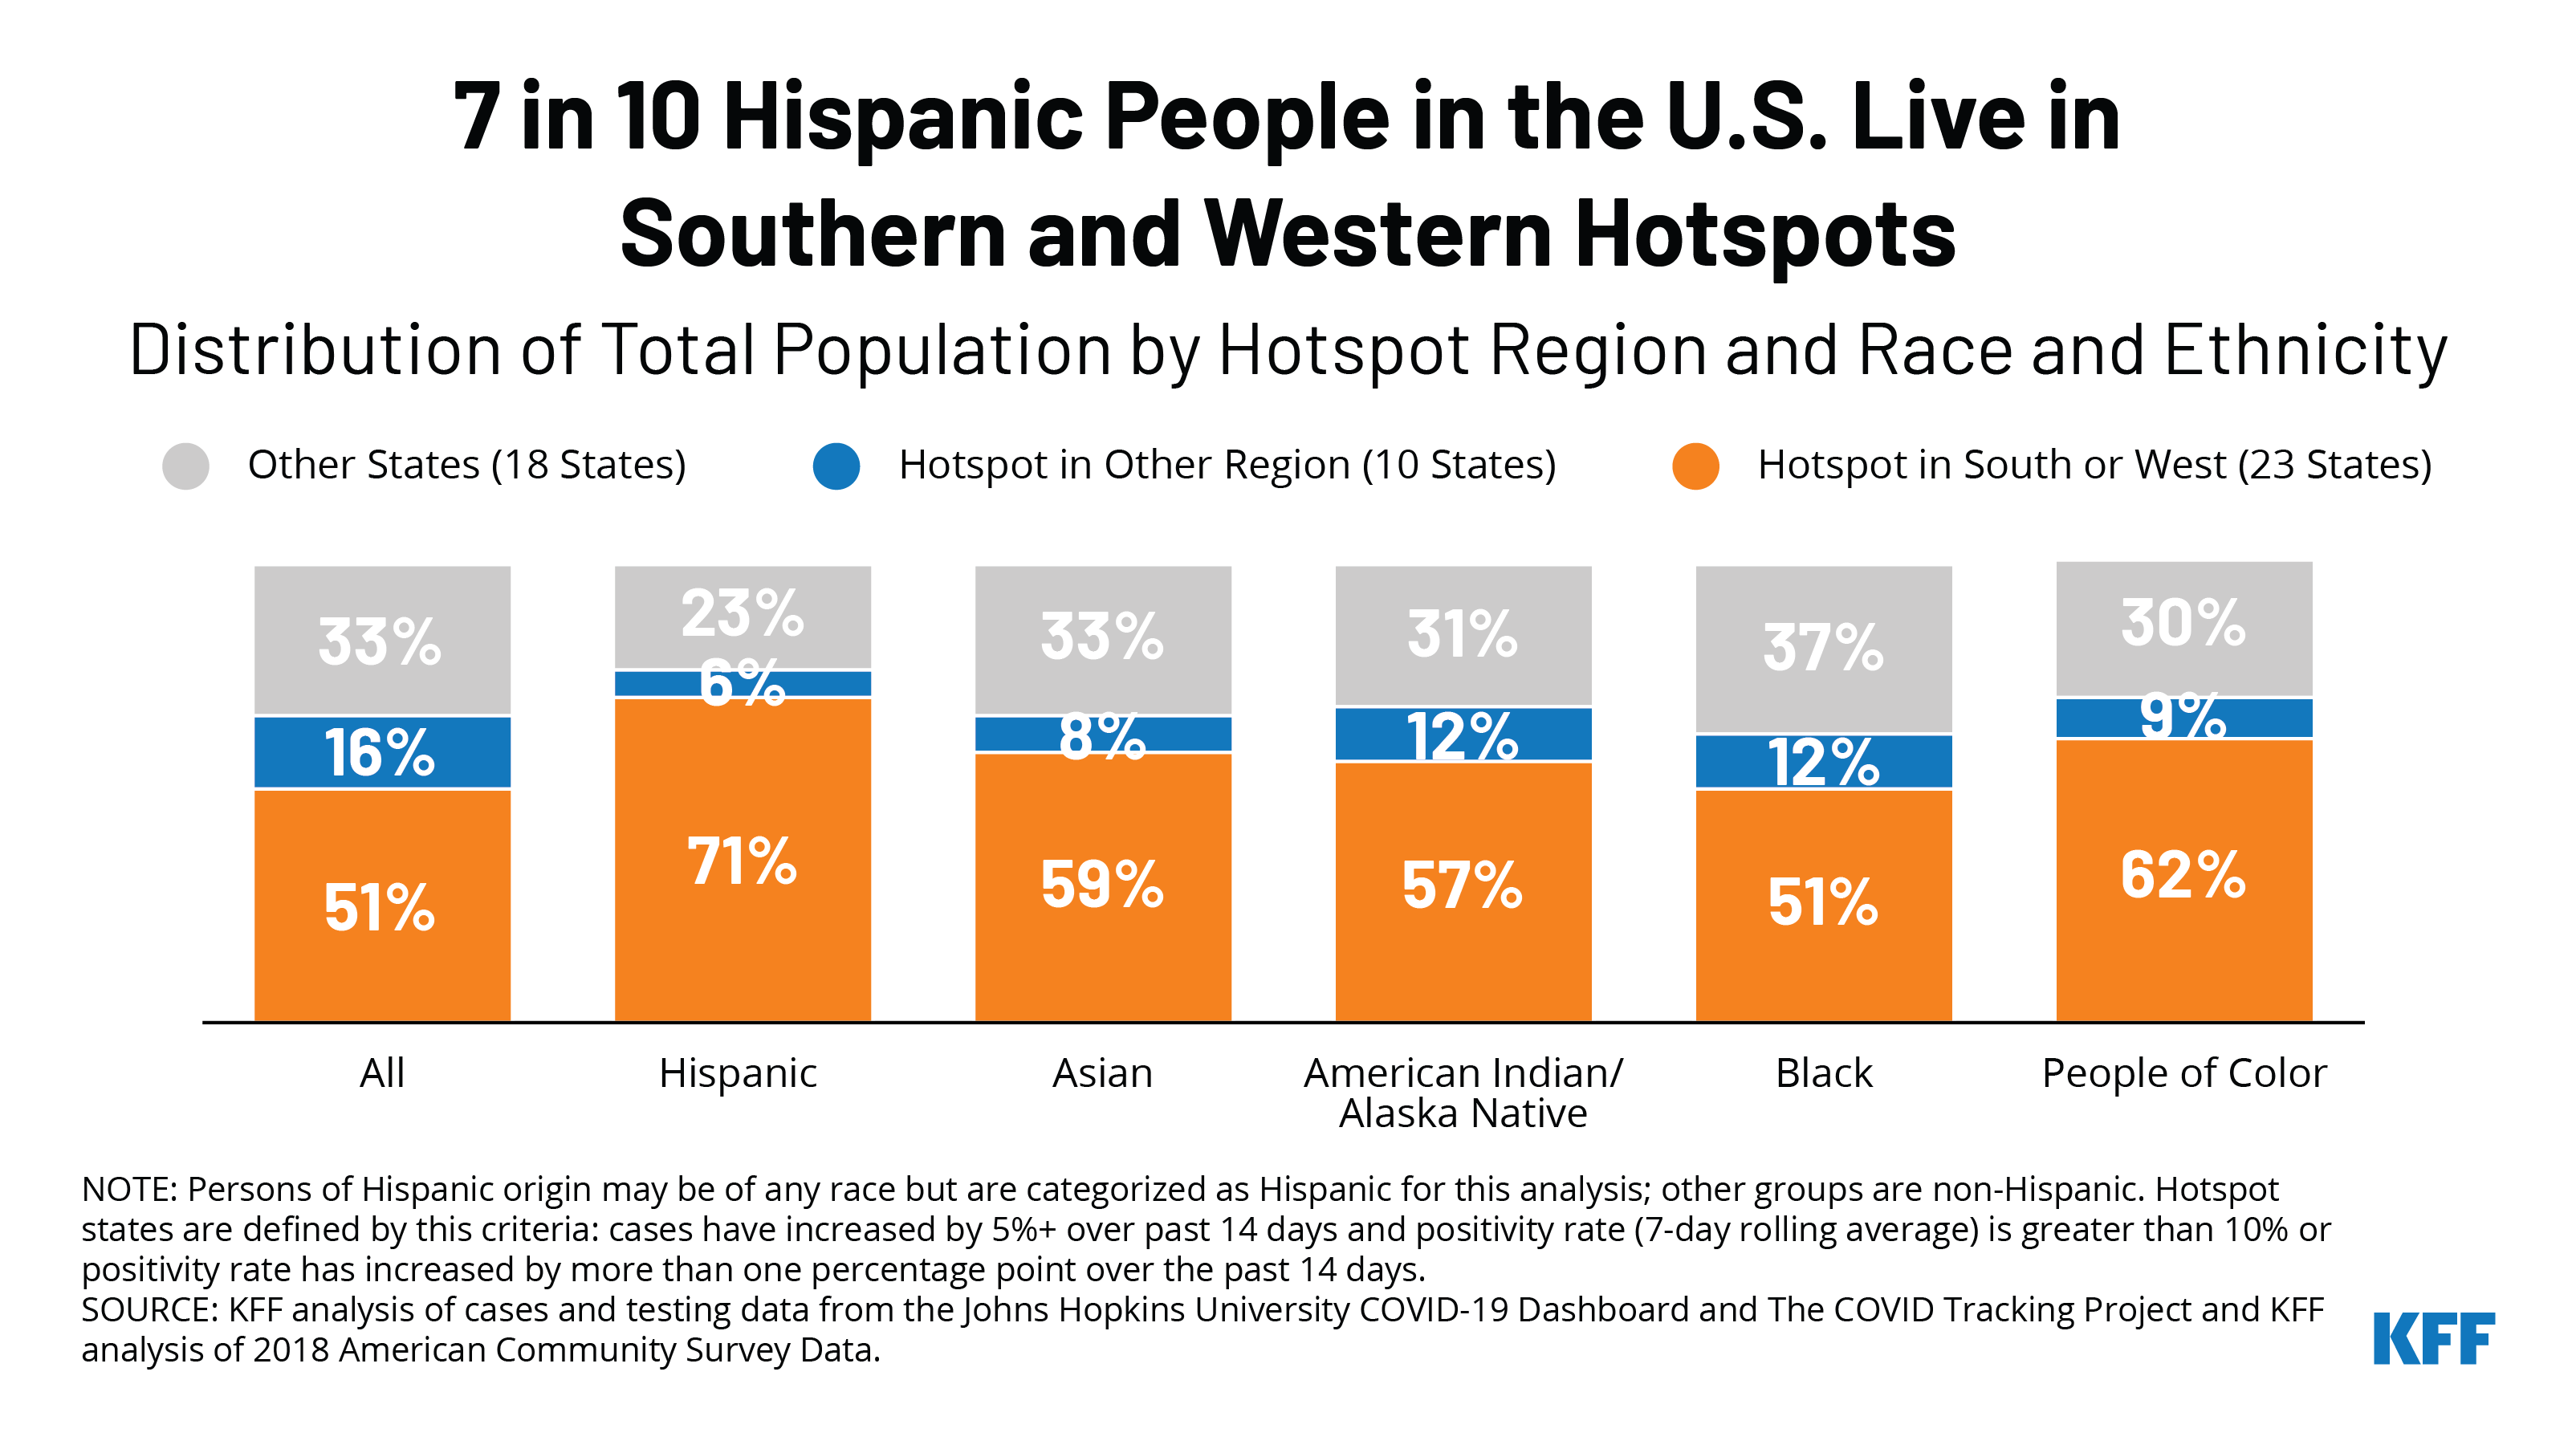
Just over half (51%) of people in the U.S. reside in these 23 Southern and Western hotspot states, but these states are home to seven in ten of all Hispanic individuals (71%) (Figure 1). Moreover, roughly six in ten Asian (59%) and American Indian and Alaska Native  (AIAN) (57%) people live in these states, as do over half (51%) of Black people. Overall, nearly two-thirds of people of color (62%) reside in these states, compared to less than half of White people (43%).

Figure 1: Seven in Ten Hispanic People in the U.S. Live in Southern and Western Hotspot States

In addition, people of color account for a larger share of the population compared to their share of the total U.S. population in a number of these states. For example, in 9 of the 23 Southern and Western hotspot states, Black people make up a larger share of the population compared to their share of the total U.S. population (12%). These states include Georgia (31%), Louisiana (32%), and Mississippi (38%), where more than three in ten residents are Black. AIAN people also make up a larger share of the population in 9 of these 23 states, including Montana (6%), New Mexico (9%), and Alaska (16%), compared to their share of the total U.S. population (<1%). Similarly, while 18% of the total U.S. population is Hispanic, they make up a higher share of the population in 7 of these 23 states, including roughly a third or more of the population in Arizona (32%), California (39%), Texas (40%), and New Mexico (49%). Asian people also account for a higher share of the population in Nevada (8%), Washington (9%), California (15%), and Hawaii (38%) compared to the U.S. overall (6%).

Moreover, within many of these states, COVID-19 has already disproportionately affected people of color. Based on data reported as of July 6, Black people accounted for a higher share of COVID-19 related deaths compared to their share of the population in 13 of these states that were reporting deaths by race/ethnicity. Similarly, Hispanic people made up a larger share of cases compared to their share of the population in 13 states, including in Tennessee and Arkansas, where their share of cases is over three times higher than their share of the population. There are also striking disparities for AIAN and Asian people in some of these states. For example, in Arizona, AIAN people made up 7% of cases and 16% of deaths compared to just 4% of the population and, in Nevada, Asian people made up 14% of deaths compared to 8% of the population.

The large number of people of color living in COVID-19 hotspots coupled with the already disproportionate impact for people of color will likely lead to further growth in disparities as the outbreak shifts to the South and West. Potential growing impacts for the large shares of Hispanic and Asian people living in these areas heighten the importance of providing information and services in linguistically and culturally appropriate ways and addressing potential fears that could make those who have an immigrant family member hesitant to access services. Prior to the pandemic, growing research showed that many immigrant families were increasingly fearful of accessing services, including health care services, due to recent immigration policy changes. Rising cases will likely compound the major challenges AIAN people already are facing due to the pandemic and widen disproportionate impacts for Black individuals, as these groups are at increased risk of experiencing serious illness if they contract the virus due to high rates of underlying health conditions. People of color also are at increased risk of exposure to the virus, face increased barriers to testing and treatment, and are more vulnerable to financial challenges due to the pandemic due to social and economic circumstances.

As discussed in previous work, the disparate impacts of COVID-19 mirror and compound existing racial and ethnic disparities in health and health care that are driven by broader underlying structural and systemic barriers, including racism and discrimination. For example, people of color are more likely to be uninsured, report poorer access to health care, and face increased economic and social challenges compared to their White counterparts. Further, 8 of these 23 hotspot states have not yet implemented the ACA Medicaid expansion to low-income adults, leaving a gap in coverage for poor adults in these states.

Together the findings point to the importance of prioritizing health equity as part of response and relief efforts and directing resources to communities who are at the highest risk and experiencing disproportionate effects. Such efforts include collecting data to monitor the impact across communities; working with trusted community members and leaders and providing information in linguistically and culturally appropriate ways to effectively reach individuals; making testing and care readily accessible within communities to facilitate access to services, including for those who are uninsured; and providing adequate resources and support to help prevent spread of the virus. At the same time, broader efforts to address systemic and structural barriers both within and outside the health care system remain pivotal to addressing the underlying health inequities that have been highlighted and exacerbated by the COVID-19 pandemic.

Read the news release.

House Appropriations Committee Approves FY21 State and Foreign Operations (SFOPs) Appropriations Bill

Published: Jul 9, 2020

UPDATED: The House Committee on Appropriations approved the FY 2021 State & Foreign Operations (SFOPs) appropriations bill (and accompanying report) on July 9, 2020 (a draft version of the bill was released on July 6 and the accompanying report was released on July 8). The SFOPs bill includes funding for U.S. global health programs at the State Department and the U.S. Agency for International Development (USAID). Funding for these programs, through the Global Health Programs (GHP) account, which represents the bulk of global health assistance, totaled $9.2 billion, an increase of $64.5 million (1%) above the FY 2020 enacted level and $3.2 billion (53%) above the President’s FY 2021 request. The bill provides higher levels of funding for almost all program areas compared to the FY 2021 request. The bill also provides $10 billion in emergency funding for global COVID-19 response efforts through the Department of State and USAID. Key highlights are as follows (see Table 1 for additional detail on global health funding and Table 2 for additional detail on emergency funding for COVID-19):

  • Bilateral HIV funding through the President’s Emergency Plan for AIDS Relief (PEPFAR) is $4,700 million ($4,370 million through State and $330 million through USAID), matching the FY 2020 enacted level, and $1,520 million (48%) above the FY 2021 request ($3,180 million).
  • The House bill includes $1,560 million for the U.S. contribution to the Global Fund to Fight AIDS, Tuberculosis and Malaria (Global Fund), matching the FY 2020 enacted level and $902 million (137%) above the FY 2021 request ($657.6 million).
  • Funding for tuberculosis (TB) totals $310 million, matching the FY 2020 enacted level, and $35 million (13%) above the FY 2021 request ($275 million).
  • Funding for malaria totals $755 million, $15 million (2%) below the FY 2020 enacted level ($770 million), and $46.5 million (7%) above the FY 2021 request ($708.5 million).
  • The House bill includes $850 million for maternal and child health (MCH), matching the FY 2020 enacted level and $190 million (29%) above the FY 2021 request ($660 million). Specific areas under MCH include:
    • Gavi, the Vaccine Alliance funding totals $290 million, matching the FY 2020 enacted and FY 2021 request levels.
    • Polio funding totals $61 million, matching the FY 2020 enacted level. The President’s FY 2021 request did not specify funding for polio.
    • Funding for the U.S. contribution to the United Nations Children’s Fund (UNICEF) provided through the International Organizations and Programs (IO&P) account totals $139 million, matching the FY 2020 enacted level. The President’s FY 2021 request did not specify funding for UNICEF.
  • Funding for nutrition totals $145 million, $5 million (3%) below the FY 2020 enacted level ($150 million), and $55 million (61%) above the FY 2021 request ($90 million).
  • Bilateral family planning and reproductive health (FP/RH) funding totals $750 million ($585.5 million through GHP and $164.5 million through the Economic Support Fund account), $175 million (30%) above the FY 2020 enacted level ($575 million). The FY 2021 request specified FP/RH funding through the GHP account only ($237 million); the House bill provides $585.5 million for FP/RH through the GHP account, $348.5 million (147%) above the FY 2021 request.
  • Funding for the United Nations Population Fund (UNFPA) totals $55.5 million, $23 million (71%) above the FY 2020 enacted level ($32.5 million). The President’s FY 2021 request proposed eliminating funding for UNFPA. In FY 2020 the Trump Administration invoked the Kemp-Kasten amendment to withhold UNFPA funding (learn more about the Kemp Kasten amendment here). The House FY 2021 bill notes that if this funding is not provided to UNFPA it “shall be transferred to the ‘Global Health Programs’ account and shall be made available for family planning, maternal, and reproductive health activities.”
  • Funding for the vulnerable children program totals $24 million, $1 million (4%) below the FY 2020 enacted level. The President’s FY 2021 request proposed eliminating funding for this program.
  • Funding for neglected tropical diseases (NTDs) totals $102.5 million, matching the FY 2020 enacted level and $28 million (37%) above the FY 2021 request ($75 million).
  • Funding for global health security totals $125 million, an increase of $25 million (25%) above the FY 2020 enacted level ($100 million) and $35 million (39%) above the FY 2021 request ($90 million).
  • The House bill states that “up to $50,000,000 of the funds made available under the heading ‘Global Health Programs’ may be made available for the Emergency Reserve Fund.” The FY 2021 request provided $25 million for the Emergency Reserve Fund through the GHP account, $25 million below the House level.
  • Funding for the World Health Organization (WHO) totals $319 million ($200 million through GHP and $119 million through the Contributions to International Organizations account). Funding for the WHO in the FY 2020 enacted bill and FY 2021 request was provided through the CIO account only — $122.7 million in the FY 2020 enacted bill ($3.8 million above the House level) and $57.9 million in the FY 2021 request ($61 million below the House level). The President has moved to suspend funding to the WHO and formally withdraw U.S. membership from the organization (learn more about the U.S. government and WHO here).
  • Coronavirus pandemic preparedness and response emergency funding for global efforts totals $10 billion, of which $2.5 billion is provided through the GHP account at USAID, including:
    • $150 million transferred to the Emergency Reserve Fund, based on a determination by the Secretary of State,
    • $750 million for Gavi, the Vaccine Alliance, and
    • $800 million for the Global Fund.
    • Additional funding provided through other accounts is detailed in Table 2 below.

The SFOPs bill also includes the following policy provisions:

  • The Global HER Act, which would permanently repeal the Protecting Life in Global Health Assistance, also known as the Mexico City Policy, reinstated by President Trump in January 2017 (learn more about the Mexico City Policy here)
  • The bill includes a prohibition on the use of current or prior funds for implementing the Mexico City Policy.

Resources:

Table 1 (.xls) below compares global health funding in the FY 2021 House bill to the FY 2020 enacted funding amounts as outlined in the  “Consolidated Appropriations Act, 2020” (P.L. 116-94; KFF summary here) and the FY 2021 request (KFF summary here). Table 2 provides a summary of emergency funding in the FY 2021 House SFOPs appropriations bill.

Note: Some funding amounts (e.g. global health funding provided through the Economic Support Fund account at USAID) will be determined at the agency level, and are not earmarked by Congress in the SFOPs appropriations bill.

Table 1: KFF Analysis of FY21 House Appropriations for Global Health
Department / Agency / AreaFY20 Enacted(millions)FY21Requesti(millions)FY21House(millions)Difference(millions)
FY21 House– FY20 EnactedFY21 House  – FY21 Request
 SFOPs – Global Health
HIV/AIDS$4,700.0$3,180.3$4,700.0$0 (0%)$1519.7 (47.8%)
State Department$4,370.0$3,180.3$4,370.0$0(0%)$1189.7(37.4%)
USAID$330.0$0.0$330.0$0(0%)$330.0(NA)
of which Microbicides$45.0$0.0$45.0$0(0%)$45.0(NA)
Global Fund$1,560.0$657.6$1,560.0$0 (0%)$902.4 (137.2%)
Tuberculosisii –  – – –
Global Health Programs (GHP) account$310.0$275.0$310.0$0(0%)$35(12.7%)
Economic Support Fund (ESF) accountNot specifiedNot specifiedNot specified – –
Malaria$770.0$708.5$755.0$-15 (-1.9%)$46.5 (6.6%)
Maternal & Child Health (MCH)iiiiv – – –
GHP accountv$851.0$659.6$850.0$-1(-0.1%)$190.4(28.9%)
of which Gavi$290.0$290.0$290.0$0(0%)$0(0%)
of which Poliov$61.0Not specified$61.0$0(0%) –
UNICEFvi$139.0Not specified$139.0$0(0%) –
ESF accountNot specifiedNot specifiedNot specified – –
of which PoliovvNot specifiedNot specified – –
Nutritionvii – – – –
GHP account$150.0$90.0$145.0$-5(-3.3%)$55(61.1%)
ESF accountNot specifiedNot specifiedNot specified – –
Family Planning & Reproductive Health (FP/RH)$607.5 –$805.5$198 (32.6%) –
Bilateral FPRH$575.0 –$750.0$175(30.4%) –
GHP account$524.0$237.0$585.5$61.5(11.7%)$348.5(147%)
ESF account$51.1Not specified$164.5$113.5(222.3%) –
UNFPAviii$32.5$0.0$55.5$23(70.8%)$55.5(NA)
Vulnerable Children$25.0$0.0$24.0$-1 (-4%)$24.0(NA)
Neglected Tropical Diseases (NTDs)$102.5$75.0$102.5$0 (0%)$27.5 (36.7%)
Global Health Security$100.0$90.0$125.0$25 (25%)$35 (38.9%)
GHP account$100.0$90.0$125.0$25(25%)$35(38.9%)
Emergency Reserve Fundix$25.0ix – –
World Health Organization (WHO)x$122.7$57.9$318.9$196.2 (159.9%)$261 (450.9%)
GHP accountx – –$200.0 – –
Contributions to International Organizations (CIO) account$122.7$57.9$118.9$-3.8(-3.1%)$61(105.4%)
SFOPs Total (GHP account only)$9,092.5$5,998.0$9,157.0$64.5 (0.7%)$3159 (52.7%)
Notes:
i – In the FY21 Request, the administration proposed to consolidate the Development Assistance (DA), Economic Support Fund (ESF), the Assistance for Europe, Eurasia, and Central Asia (AEECA), and the Democracy Fund (DF) accounts in to one new account — the Economic Support and Development Fund (ESDF). ESF funding for the FY21 Request reflects the amounts requested by the administration for ESDF.
ii – Some tuberculosis funding is provided under the ESF account, which is not earmarked by Congress in the annual appropriations bills and determined at the agency level (e.g. in FY18, TB funding under the ESF account totaled $4 million).
iii – Some MCH funding is provided under the ESF account, which is not earmarked by Congress in the annual appropriations bills and determined at the agency level (e.g. in FY18, MCH funding under the ESF account totaled $15.5 million).
iv – It is not possible to calculate total MCH funding in the FY21 request because UNICEF, which has historically received funding through the International Organizations and Programs (IO&P) account, was not specified in the FY21 request.
v – The minority summary of the FY20 conference agreement states that part of the increase in MCH funding is “due to a shift of $7.5 million for polio prevention programs from the Economic Support Fund account to the Global Health Programs account.”
vi – UNICEF funding in the FY20 Conference Agreement and FY21 House bill both include an earmark of $5 million for programs addressing female genital mutilation.
vii – Some nutrition funding is provided under the ESF account, which is not earmarked by Congress in the annual appropriations bills and determined at the agency level. (e.g. in FY17, nutrition funding under the ESF account totaled $21 million).
viii – In FY20 the Trump Administration invoked the Kemp-Kasten amendment to withhold UNFPA funding. The FY21 House bill text states that if this funding is not provided to UNFPA it “shall be transferred to the ‘Global Health Programs’ account and shall be made available for family planning, maternal, and reproductive health activities.”
ix – The explanatory statement accompanying the FY20 Conference Agreement states that the “agreement includes authority to reprogram $10,000,000 of Global Health Program funds to the Emergency Reserve Fund if necessary to replenish amounts used during fiscal year 2020 to respond to emerging health threats.” The House FY21 appropriations bill states that “up to $50,000,000 of the funds made available under the heading ‘Global Health Programs’ may be made available for the Emergency Reserve Fund.”
x – The FY20 enacted WHO amount is an estimate. The House FY21 appropriations bill states that of the GHP funding provided to USAID, “not less than $200,000,000 shall be available for grants or contributions to the World Health Organization, which shall be allocated and allotted not later than 60 days after the date of enactment of this Act.” This amount is not included in the GHP total in this table.
Updated: July 8, 2020
Table 2: KFF Analysis of Coronavirus Pandemic Preparedness and Response Emergency Fundingin House FY21 SFOPs Appropriations Bill
Department / Agency / AreaFY21House(millions)
Total Funding$10,018.60
Department of State$959.40
Diplomatic Programs$955.00
Office of Inspector General$4.40
USAID$108.00
Operating Expenses$105.00
Office of Inspector General$3.00
Bilateral Economic Assistance$7,670.00
Global Health Programs (GHP)  Account$2,500.00
of which Emergency Reserve Fund$150.00
of which GAVI$750.00
of which Global Fund$800.00
Development Assistance$900.00
of which Basic and Higher Education$150.00
International Disaster Assistance$1,125.00
Economic Support Fund$1,500.00
Assistance for Europe, Eurasia and Central Asia$500.00
Migration and Refugee Assistance$1,125.00
Inter-American Foundation$10.00
United States African Development Foundation$10.00
Multilateral Assistance$1,281.20
International Organizations & Programs (IO&P)$1,281.20
Updated: July 15, 2020