The Business of Health with Chip Kahn

AI at Scale: Does It Deliver?

May 26, 2026

Video

Audio

About this Episode


Episode 5, AI Series: How is AI applied to clinical care and hospital operations across a real health system at full scale? Chip Kahn talks to Dr. Michael Schlosser, Senior Vice President and Chief Transformation Officer at HCA Healthcare, about how AI is developed for everyday use, starting with careful testing and customization, with clinicians and nurses engaged from the very beginning as end users. 

The Host


Headshot photo of Chip Kahn wearing a navy blue suit with a red tie, red pendant on lapel, and glasses.

Sr. Visiting Fellow

Charles N. Kahn III is a senior visiting fellow at KFF. He is also a visiting senior fellow at the American Enterprise Institute and a nonresident senior scholar at the University of Southern California’s Schaeffer Center for Health Policy & Economics. He serves as co-chair of the international Future of Health collaborative.

Guest
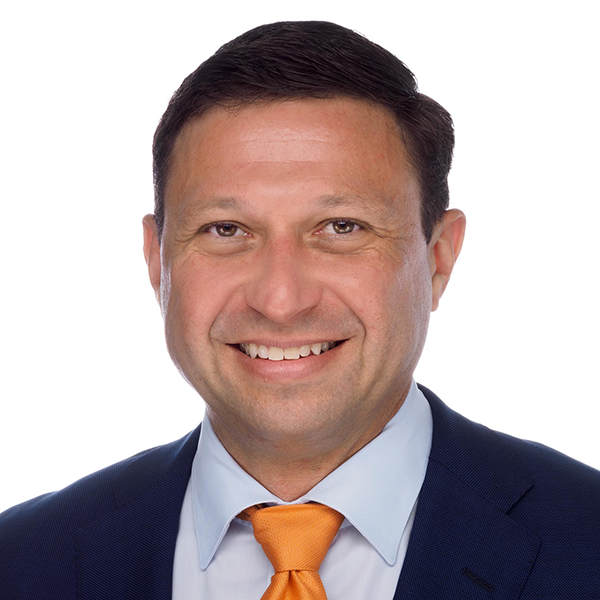

Senior Vice President and Chief Transformation Officer at HCA Healthcare

Michael Schlosser, MD, MBA, is the Senior Vice President and Chief Transformation Officer at HCA Healthcare. Previously, he served as Senior Vice President for Care Transformation and Innovation, launching HCA Healthcare’s initial digital transformation initiatives. Before that, he was Group Chief Medical Officer, National Group, overseeing clinical operations for 100 HCA Healthcare hospitals with a focus on quality, patient outcomes, and clinical strategy. He has also held the role of Chief Medical Officer at HealthTrust.  

A neurosurgeon by training, Dr. Schlosser completed his residency and fellowship at Johns Hopkins. He has served as a medical officer with the FDA, holds a degree in chemical engineering from the Massachusetts Institute of Technology and earned his Master of Business Administration from Vanderbilt University. 

Transcript


AI Usage Disclosure: This transcript was created with assistance from AI tools. It was reviewed and edited by KFF Staff.

Chip Kahn: Today we move from the wide angle to the front line. We turn to the actual application of AI to clinical care and hospital operations across a real health system at full scale. My guest is Dr. Michael Schlosser, Senior Vice President and Chief Transformation Officer at HCA Healthcare. 190 hospitals; 2,500 ambulatory sites; more than 47 million patient encounters a year. No other private sector operator is that large and no one else deploys AI at that scale. What you will hear is how AI in health care actually gets developed for everyday use. It starts with careful testing and customizing with clinicians and nurses engaged as end users from the very beginning. Then comes the path from a promising pilot to enterprise-wide deployment. And then comes what is often overlooked, the work that begins after deployment. When navigation, feedback and course correction take over. You cannot get away from the miraculous technology of AI. But where the rubber hits the road, two things matter. The first is data. Its breadth, its integrity, the infrastructure that holds it. To borrow a decades old phrase, it’s the data, stupid. The second is the human factor. What determines in the end whether a solution actually works to further the health care mission. 

Let’s get started. Mike Schlosser, welcome to KFF’s Business of Health. 

Dr. Michael Schlosser: Glad to be here Chip, thanks for inviting me. 

Chip Kahn: This is going to be a great conversation. You and I have talked before, and I know that our audience is going to learn so much today. Let’s start off with the obvious, which is HCA Healthcare is a huge organization. You’re deploying AI across 189 hospitals with 47 million patient encounters a year. When a AI solution company hands you sensitivity, specificity and accuracy numbers on a product, what criteria does that solution have to meet before you deploy it across this sort of massive set of hospitals and ambulatory surgery centers and other kinds of care settings? 

Dr. Michael Schlosser: Yeah, it’s a great question. And yes, the scale of HCA is a superpower for us, but it also can be a challenge. But to answer your question directly, the model performance metrics themselves, the sensitivity, specificity, F1 score to me really is a small piece of the story. We really think more about sort of the human AI system, because most of the tools that we’re deploying, the human is still in the loop, right? The people are taking advantage of whatever the AI is producing for them or enhancing their workflow, whatever the product might be. And so in the end it’s really the impact or the outcome of that system that we really care about. So said a much simpler way, are we actually solving the problem? Like, do we see a better clinical outcome? Do we see a better orchestration of care or operational outcome? Are we more efficient? Are we reducing cost? And so those are the KPIs that we track very carefully. Now, the model metrics matter. In fact, where we end up using them more often than not is in ongoing monitoring of models once we’ve scaled them. So, once we’ve gotten comfortable that that system is working as designed and we’re getting the outcomes we’re looking for, those metrics, which can be calculated in a much more automated fashion, can be a way of to make sure that the model continues to perform over time and at scale. And so, they’re very useful from that perspective. But really we want to focus on business problems and clinical problems, and we want to measure those problems directly, more so than just say, oh, your model performs well, therefore we will deliver it. I’m sure we’ll talk a little bit about our nurse handoff tool, but when we developed that solution, we had multiple different metrics around the conciseness, the factuality, the helpfulness of the model that we paid very close attention to, which were much closer to the problem in the bedside than just sort of the F1 score, if you will. 

Chip Kahn: Our focus here is AI, but in a sense we miss it, I think, because it isn’t, AI, it’s the data, stupid. And, you called data a strategic asset. What does that mean in a practical sense for your system? 

Dr. Michael Schlosser: You mentioned the 47 million patient encounters a year that we have the privilege of caring for. All those encounters create data, and there are incredible patterns inside that data that we can harvest the value from. So, I’ll throw another number out. We do over 210,000 deliveries in our hospitals every year. That’s in the ballpark of how many occur on the continent of Australia. So, we have these massive populations and data describing everything about them. You know, the clinical aspects of the care, but also operations, supply chain, you know, what products were used, you name it. And so that is a strategic asset. And in fact, it’s where the value and the intelligence comes from. The AI models are kind of like shells. And I’m not trying to take anything away from the brilliant people who build these things. They’re incredible, but they don’t become intelligent until you fill them with data. So ChatGPT is trained on the entire Internet. It’s pretty knowledgeable about everything, but it’s not an expert in anything. You give it 47 million patient encounters worth of data and it can become an expert in health care delivery. You then have to pair that with the human insight because it’ll learn the patterns. Some of those are good patterns, some are not good. And the humans have to help identify which is which. But in the end the power comes from the data. And so we treat data like an asset. We’ve invested heavily in building out a new data infrastructure, a data lake house on Google Cloud that allows us to capture all that data, organize it, harmonize it, and then manage it continuously as a product so we can make it available to AI models, to our analysts, to really everyone in the organization. and ultimately that’s where the real step forward is going to come from. 

Chip Kahn: Well, you’re a leader in the field, but you also work a lot with others. And how do you compare your notion of this strategic asset and how does that compare with academic health centers or other large systems that either you’re working with or that you are following as developments go in this area? 

Dr. Michael Schlosser: Well, and I think there’s great synergy here and there’s, there’s several academic systems that we work with directly we partner with on research. I was actually hearing about this in detail yesterday from the gentleman who leads our trauma research organization that a lot of academic centers come to us because of the density and the velocity of our data. And we can do studies at scale that that they couldn’t do on their own because while they may have incredible experts, they do, they have the most brilliant minds in the field usually working there. They’re often one hospital or a small hospital system. So they just don’t have the depth and breadth of the experience that we do. Also, our data is interesting because it comes from sort of every corner of health care delivery. We have rural hospitals, we have urban and academic centers, we have quaternary care facilities. You know, we have 61 bed hospitals that are truly community hospitals. And so we can see patients and care delivery in sort of every flavor of health care across the country. Which again makes the data set that much more interesting when you talk about training or testing models. So, I’d say we are really synergistic with the academic centers in terms of all of us trying to move health care forward. I will say we tend to come at this from a little bit of a different bend. I think a lot of academic centers see their purpose as advancing the science. Like how do we make the science better, how do we find the next standard of care? We tend to focus more on how can we deliver care in our current standard at the most reliable, the most efficient, the most effective level. I think of if everyone who entered an HCA hospital or any hospital got exactly what the best standard of care treatment was in a timely fashion every single time, how much better the health care system would be than the current state where we’re reliant on a lot of manual processes and local decision making. And they get to the right answer pretty darn frequently. But I think with partnering the humans and AI together, we could do it at a different velocity. 

Chip Kahn: When you look at new technologies, whether it’s in the AI area or in other areas, you have innovation hubs, UCF Lake Nona Hospital and TriStar Hendersonville Medical Center. There you have both clinicians and operators who are sort of in a development mode for your enterprise. How does that model work and what has it taught you? 

Dr. Michael Schlosser: Yeah, and we actually have three now. We just launched a third one which is HCA Florida Aventura, down in the South Florida market. They’re critical to our strategy. So, when we started this journey of transformation, one of the things that I recognized from my prior experiences as a hospital operator, a group CMO, was that a lot of technology was sort of hoisted upon the care teams, the operators in the hospital. And many times they found it just didn’t work, it didn’t fit into their workflow, it didn’t really understand the nuances of care delivery. I’d say the best or worst example of this is the electronic health record, which achieved the goals it set out to achieve. We created a lot of data, but it did not make the process of delivering care better, faster or more efficient. And so we decided from the very beginning like we were going to do the opposite of that. We are going to design products and solutions or co-develop or bring them into our system that our caregivers really say are solving problems for them, making their lives better, making care for patients better, making patients’ lives better. And to do that we knew we were going to have to get them into the middle of the process. And so we stood up these innovation hubs as a way to bring the technology and the innovation to the bedside. So, we were doing forward deployed engineering before it was cool. We would take our data scientists and our software engineers and other innovation leaders and we would make them go to the hospital, actually insist that all of my DT&I team wear scrubs when they go into our hospitals so that they blend in with the care team, they become part of the milieu and they just sit there in the nurses station, following doctors around in the ERs. And they learn from them, they understand their workflows, their lives, how they do their job, what they care about, what they’re scared of. And it’s not to say that we want to anchor on the current process. I mean, sometimes we need to blow up the current process, but you have to really understand where you’re starting from if you’re going to drive that kind of change. And so the innovation hubs were designed, if you will, to be a place where we could do that work. And it’s a two-way street. So we, you know, we had to get the engineers and the teams to want to go in and spend substantial time in the hospitals. We also had to train the folks in the hospitals to be part of an innovation process. They were not used to this. They’re used to a product being done when we turn it on in a hospital, because of the nature of that environment, it’s high risk. And so the fact that we were going to bring them products that not only weren’t done, but they might just be a prototype on an iPhone was a totally new experience. And that they were going to talk to data scientists who didn’t know anything about health care. These were all new experiences that they were going to go through multiple iterations of change management. So we spent a lot of time upskilling the people, the leaders and the care teams that work in these hospitals to really be an innovation hub. And it’s been an incredible return on investment. We get so much amazing feedback from them. It changes the trajectory of the work that we do every time we go. I wouldn’t do it any other way. And we have a very robust discovery and design and process engineering team that goes in and understands problems at a very deep level. Even if we’re just buying a solution, we want to understand the problem in a really detailed way before we ever start trying to bring a solution in. 

Chip Kahn: Let’s take a little deep dive then on some of the solutions that you’ve actually put in place and deployed at scale. You’ve got ambient clinical documentation, you got Timpani staffing and nurse handoff. Can we take each of those, and see what they mean when they leave these innovation centers and go out into the real world across the entire system? 

Dr. Michael Schlosser: And three very different problems and very different solutions. So, I think some good illustrative examples here. I want to start with ambient clinical documentation. So this is one that, I would say most people are probably familiar with or getting familiar with, using artificial intelligence and large language models to listen to a conversation between a doctor and a patient or any provider and a patient, understand what’s being talked about and then structure that data into a draft note that can go into electronic health record. And then the doctor is the human in the loop. They review that note and ensure it’s all factual and accurate, make edits, and then they can sign it. The idea being that we would create better documentation, that the AI would be more thorough in that it would capture everything that was talked about, that it would be faster for the doctors. They would spend much less time editing notes or writing notes, and so they could spend more time focused on their patients and on critical thinking and care delivery. And that also the medical record would be more timely, that we would have complete notes, complete H&P in the chart. Much faster for the rest of the care team, but also for payers and authorization that are dependent on timely medical record documentation. And so a number of different value streams there that we saw ambient clinical documentation could provide. We partnered with a company called Commure. And full disclosure, we have a small investment in Commure as well. And we’ve actually been working with them now for over a couple of years refining this approach. And so rather than buying a solution off the shelf, so, you know, going back to this, care teams being in the middle of the product, we partnered with someone who would do the forward deployed engineering model and they would bring their product, but also bring their people and learn from our physicians. In this case, for a few reasons, we actually use some hospitals in Dallas as our guinea pigs. But we had some great physicians, some hospitalists and ER doctors there, who spent a tremendous amount of time with Commure continuously refining their product. And, the CEO of Commure told me he thinks they’re on version 300 of the product and the model, which is why I think we’re getting the performance we get. And so we’re now rolling this out. We’re live in, I think, 67 hospitals as of today. We’ll hit somewhere in the neighborhood of 105 by the end of 2026. We’re doing about 200,000 notes a month on the ambient documentation platform. A lot of H&Ps, a lot of progress notes, a lot of ER provider notes. We’re about to turn on automated discharge summary, broadly here shortly. We’ve got cardiology coming up quickly. So very rapidly bringing this across our entire platform. And we’ve seen tremendous results. Our doctors are averaging between an hour and an hour and a half of time saved every 12-hour shift. We’re getting great feedback, from our patients, including in our patient experience surveys that the doctors are spending more time at the bedside and they’re more communicative with them because they have to verbalize more in the room so the AI can hear them. So the patients are benefiting. And we’ve seen a pretty significant improvement in how quickly the notes are getting signed. That’s a metric that we track. And so I think it went from something like 67% within 24 hours to almost 90% within 24 hours. So the medical record’s getting completed faster, which helps with care delivery downstream. But the best part of this entire rollout has been the quotes that I get emailed to me all the time from the physicians. I’m constantly getting these nuggets of doctors saying, this has changed my life. I go home, I don’t have to do notes, I can spend time with my family. Like, this is one of the first times that a technology has truly made my life as a physician better. So that’s one of the best parts of my day, is when I get to read those quotes that we’re achieving. One of the missions I set out to achieve when we started this, which was to reduce the administrative burden in health care for providers. So, it’s been a tremendous success, but it came at the end of a lot of hard work. We really worked with our doctors to refine this platform and this model and the application, to get it to the point where it’s being adopted at this rate. I’ll throw out one more number. We have an 81% adoption rate in our emergency rooms amongst our ER doctors and other ER providers, which I’m fairly confident is the highest number I’ve seen reported anywhere. A lot of folks are reporting something more like 25 to 50% adoption of ambient in various care settings. Most of those are outpatient clinics. So, it really has made a tremendous impact. 

I’ll pivot and talk a little bit about nurse handoff. This was a problem that our nurses brought to us and basically told us they’ve been working on this for a long time with the EHR companies. Lots of different solutions and really had never been able to crack this. And handoffs, as you know, are just a critical part of care delivery. When the responsibility for a patient is transferred from one care team to the next, there’s a lot of risk involved. We do 60,000 handoffs a day, 24 million of them a year in our acute care setting. And so, you’ve got to get that right. Aand right now, it really falls to the nurses. They do this on their own. They scrape data from the EHR, they write handwritten notes, they communicate verbally to the oncoming shift. and they’re working very hard, doing the best they can. But it’s a process that absolutely can be improved. And so we saw this as a great use case for a large language model. We thought we can teach an LLM to read the chart and figure out how to think like a nurse. And actually, the Google research team was really excited about this. And so they partnered with us to help us build out the system that is around the Gemini model to make it good at this. And it took some time. We worked with nurses. We would have them do mock handoffs, real patient data deidentified, and we would have them read the handoff note, tell us everything that was wrong with it. We’d feed that data back to the engineers and we iterated like that dozens and dozens of times with hundreds and hundreds of examples until we got to the point where the model was really performing at a high level. So that’s the pilot. Then we put it in the real world, tried it out in eight different hospitals and got a whole other set of feedback. I think we got 7,000 comments, about how they wanted the data organized differently. They wanted to view it the way they were used to viewing data. And so we went back and we iterated again. And now we’re at a beta pilot in 12 hospitals and getting just tremendous feedback from our nurses that it’s making their job easier. They feel more confident in taking care of patients. And we’re tracking our safety events. We have a safety event reporting system and we’ve seen an 80% reduction in handoff-related safety event reporting. Some of those are near misses, a lot of them, but nonetheless we’re seeing it in the data that this is making patient care safer and that brings confidence to our nurses. You know, nurses are always concerned about the patients and their safety. So it’s been a real home run. We’re in the process of hardening the data product that sits underneath it. Back to your previous comment about it’s all about the data. We’ve got to make sure that that data product is really ready for primetime if it’s going to be used 24 million times a year reliably. So a little work to do there and then we’ll start rolling out beyond those 12 hospitals probably in the middle of this summer, on a pretty aggressive strategy. That’s, I think, a really great example of how we’ve worked at the bedside built by nurses for nurses, and that is a sense of pride for them as well. 

The last one you mentioned is Timpani. And this has been a really interesting journey. It’s maybe a little bit of a cautionary tale also. This was one of the first products we actually started working on. And we did that for a very specific reason. We knew that if we didn’t have the right care team on every unit every day, if we couldn’t deploy the right people, right place, right time, right set of skills, it would be hard to innovate on top of that platform. If we had uneven staffing, that’s not a strong platform to stand on and try to drive even more innovation. And so we said, we’ve got to make sure that we’re deploying our clinical staff uniformly and also doing it with the right set of skills, the right predictive algorithms to know how busy the units are going to be. And so we built all that. And it’s a great piece of software. It’s a really sophisticated application and it’s programmed, I think, with really sort of altruistic goals, to take whoever the team is you have on this unit in this hospital, know who they are, their skills, their preferences, how they like to work, when they like to work, and deploy them on a schedule and maintain that schedule such that we have the best likelihood of providing the right team for the patients who are going to show up. We have great machine learning algorithms that predict how busy the units are going to be. And we rolled it out to 130 hospitals at this point. 

The cautionary tale piece of this is around change management. And honestly, we haven’t talked about it yet, but change management is probably the hardest part of the job that I do on any given day, because, as I mentioned, there’s always people involved here. We’re not replacing people with AI, we’re augmenting them, which means the people have to change. And that’s hard. It’s definitely hard at scale. And so what we didn’t recognize was all of the nuances that went into building a schedule, the personal relationships between the nurse leaders and their team and how scheduling and staffing was part of that personal relationship, just all of the things coming out of the pandemic and since then that they’d done to try to maintain that staff, you know, there’s a workforce crisis. And while the system had, I think, really good rules built into it, it didn’t quite understand the nuance at that level. And so, we had trouble getting people to really accept the output of the model and they would go in and edit the schedules to look more like what they would have built on their own. Which means we were losing some of the time savings it was supposed to create. We were losing some of the value in spreading the team out more evenly. So, we’re still learning. That’s one of the things that I would say is the most interesting about AI, is that it’s always about learning, the AI learning and us learning. And so we still think that this is going to be a good solution and it’s going to solve a big problem for us in the long term. But it turned out to be a little more complex than we knew what we were getting into. 

Chip Kahn: So it really sounds like you just can’t take it off the shelf when you bring these solutions on. It’s a process. It’s not just a ready-made item to implement. What’s next? What’s sort of in your stack that you’re working with your clinicians and the other staff or the members of the team. Is there anything you can talk about that’s sort of in the wings? 

Dr. Michael Schlosser: We’re doing a lot of work in supply chain, and so this is all about making sure that we have the right products in the right place at the right time. We run a lot of our own supply chain and distribution centers. But a lot of it’s manual, a lot of it’s driven by people and their experience. And so we’re bringing intelligence to those systems. So that’s exciting to me because there’s a good financial ROI attached to the supply chain use cases. And so if I’m going to continue to get funding from the organization, we have to focus on things that also improve the finances of HCA in addition to the care experience and the clinical outcomes and the patient safety. Because AI is expensive, as you know. Another one that I’m really excited about is our partnership with OpenAI. We’re just a handful of months into this strategic partnership. but they’ve already brought their engineers to work with our teams on a few really high impact use cases, one of which we refer to as our moonshot, where we’re working with them to build a team of agents that can do the orchestration of care delivery in a hospital. So, you know, if you got 100 patients in a hospital, and they each have dozens of things that they need to have done on any given day. Meds, delivered procedures, scans, therapy. The way that gets done in a hospital right now is sort of by the people like the doctors, the nurses, the therapists. They all sort of just figure it out. Like, they have their work lists and they just get through it. But if we had a team of agents that knew everything that was going on and could behind the scenes, organizing, and orchestrating what’s the most efficient and effective way to get things done. What’s the next priority that has to happen? Who needs to go to MRI right now? Like, you know, just all of those individual details could be organized by agents. And then because they’re agents, they can also take action. They can message PT and say, hey, divert from where you’re headed, go up to the sixth floor and see this patient because they’re waiting on discharge. You could actually make a hospital run way more effectively. The patients would have a better experience. They might even know, like, when their MRI scan is going to occur next. We could get them through their plan of care faster, which means we have more capacity to care for our communities. There’s a tremendous upside that we could create here, clinically, operationally, financially. It’s a moonshot because this is a highly complex use case. Incredible amount of data that we have to organize a team of agents that we have to get to work with each other and then people on either side of those. So, it’s a heavy lift, but so far so good. We’re making incremental progress. I think we’ll have something that we can pilot later this year. So, we’re really excited about that sort of operating system of a hospital of the future, if you will. 

Chip Kahn: You’re sort of getting at it now. And I’m going to ask a conceptual question of you. We had Bob Wachter on. He asked whether AI is really changing what it means to be a clinician, and he wrote a whole book about that. And from your view, I mean, you’ve got 44,000 either affiliated or employed physicians across this gigantic system. What is your perception of the gains, risks, or both for the quarterback? I mean, historically and traditionally and in terms of the practice of medicine, those physicians are the quarterback of the care. Agentic AI really coming online at some point begins to either change that or provide some kind of new factor that hadn’t been in the physician’s workflow before. 

Dr. Michael Schlosser: Yeah, my short answer to your initial question of is it going to change what it means to be a physician is, I really hope so, because I see this as an incredibly positive change if we want it to be. And I already talked about ambient documentation and the positive change that’s happening. I see now that this is making our physicians’ lives better. And I think when the workforce is happy, the patients are happier. So there’s a lot of downstream positive impact we could have. I think the more we can use AI to make the health care system run better, the more they can be that quarterback. They can spend their time thinking critically, studying, reading articles, talking to their patients, engaging in research and other scientific endeavors. A lot of the things that we became doctors to do and maybe not have to do any of the things that we don’t have to do. I remember back to my days practicing, getting on a phone call with an insurance company explaining to them why my patient needed six more weeks of physical therapy. Like, that’s not what I went to school and to become a neurosurgeon to do. So, I think there’s a first wave here where we can massively clean up a lot of the complexity and the burden we’ve injected into our health care system, which I’m excited about and we’re focused on. And then I think once we build trust with doctors and clinicians, once they come to see AI as a tool and a partner and maybe less of a threat, then I think it opens up for a lot of other possibilities. I do think in the future we will have AI and humans working together to make most of the important critical decisions in our health care industry. That when you go to make a decision for a patient, a treatment or diagnostic decision or whatever it might be, that you can tap into your own knowledge and experience, but then you can also tap into AI and the data and the patterns. And as a second opinion, like a real time, always on second opinion, I want the doctors to stay in control. I don’t think a health care system where AI makes the choices is one that I want to help develop, at least not at this point. I don’t think the AI models are ready for that, to be honest, but I think they’re very capable of being a copilot. That health care system that I just described, where you don’t spend time on administrative burden, you get to spend time thinking and maybe enjoying your life a little bit, and then you have AI helping you do your job better, sounds like one that people would want to be a part of. 

Chip Kahn: You know, this podcast is built on the premise that patient care and ultimately patient outcomes really depend on the business model. And in some ways our conversation has covered that. So when AI improves clinical quality or promotes operational efficiency for HCA Healthcare, that’s a good. But where’s the line between that and what makes the world go round, which is volume and payment frankly? 

Dr. Michael Schlosser: You’re spot on. It has to do both. And so we think of our AI investments and you and I are saying AI, it’s really digital AI data, it’s the whole technology ecosystem. But we think of our investments in digital transformation as a portfolio. And really it sort of functions like an investment portfolio with, you know, your mutual funds and individual stocks or what have you. And so we have some high risk bets, some lower risk, but much more likely to perform. We have some things that are not going to return a financial return, but they’re really important and we want to do them, we want to support them. And then we have some that we really expect significant financial ROI from like supply chain and revenue cycle. And the idea is that we spread our investments across that entire portfolio and then we manage it as a portfolio and the whole thing collectively has to perform. So it’s got to be ROI positive, right? We’ve got to have a financial return, but every individual use case doesn’t have to. So nurse handoff doesn’t have a big financial ROI. I think there’ll be a lot of downstream benefits. Nurses are our most important workforce that we hire directly. We don’t employ a lot of our physicians. And so if, you know, if we shore up that workforce and people want to work for us, maybe down the line there’s a financial impact, but in the immediate term it’s about patient safety. But then to offset that, I’ve got other use cases that are much more focused on driving an immediate financial ROI. We call this value tracking. But the discipline of value tracking I think is intrinsic to a digital transformation agenda. And it’s not a side gig for us. Like we have people who focus all of their energy on tracking the value of each individual use case, whatever that value might be. It comes in all kinds of different forms, but it’s got to be measurable at scale, not just in a pilot. Like we’ve got to be able to see the value occurring, either the money or the safety or whatever it is, numbers, progressing as we roll it out. Otherwise, we don’t keep going. 

Chip Kahn: I guess that you must see every day really miraculous solutions and you’re sort of hitting at it, I think, with the end of that last question. So what are the characteristics or criteria that make you decide not to deploy? To say, wow, that really must be a wonderful thing. But not here. 

Dr. Michael Schlosser: The most common reason is actually because it ends up not being an interesting problem to solve and the value isn’t there. Right. So a lot of times people will pitch us an idea and they’ll say, hey, this is going to solve this amazing problem for you. And when we go in and we start looking at it, we realize, well, that problem actually isn’t really something that’s strategic for us, or it’s not top of our list, or, yes, you can make that better, but we don’t really see that that’s going to create the return for us. It’s rarely that the technology doesn’t work. I mean, most of the times the technology is solid. It’s because it doesn’t sort of fit, it won’t fit in our workflow, or it doesn’t integrate well with our systems, or we don’t see people adopting because it’s creating a new app that they have to go to that’s outside of their normal workflow and that just creates burden instead of solving for it. So it’s usually at that level, at that sort of technology, human interface level, that things fail more so than the technology. So the way we avoid spending too much time going down those rabbit trails is that discovery process. We make sure we really understand the problem we’re solving at a very detailed level. And where does the problem originate from and what does the current workflow look like? If you’ve got a manual paper process, if people are already working around a piece of technology with a paper process, enhancing that technology is not going to do anything. So you’ve got to understand sort of the people and how they’re doing their jobs if we’re going to pick the right solutions. I would say the other way is that it doesn’t scale. And so there are a lot of processes or products, technologies that you can kind of force to work in a pilot. You can sort of stand up everything you need to make it work. You can get the people on board, you can sort of get the data pipes doing what you need them to do. Then you see a result in a pilot. But it just, there’s no way to take that to 189 hospitals. It becomes prohibitively expensive. People don’t adopt it because you had this really controlled environment where you generated all this excitement around it. But at beta or at scale, the excitement’s not there. And people decide it’s really not solving the problem. For me, that’s sort of the second most common way. And so we see those through the data.That’s where the value tracking and the adoption tracking comes in. And so hopefully we catch those quickly and we pivot. 

Chip Kahn: You know, no matter what happens in the systems that affect clinical care directly, humans are going to be involved. So as we get into more clinical decision support and other kinds of, I’ll call them bells and whistles, but alerts, we see in hospitals and other areas, you know, something called alert fatigue. Actually it predates AI and the new solutions, but it’s going to become a real issue in terms of the human role. Across your system as you adopt all kinds of new solutions and particularly, eventually you will get heavily into clinical decision support because it’s coming, how do you deal with the human factor, which is really what alert fatigue is all about? 

Dr. Michael Schlosser: The simple answer is you’ve got to directly manage it. So we are very sensitive to alert fatigue. I talk with my team all the time that we really can’t deploy any solutions that add alerts right now. Like, if you were to go talk to our nurses in our hospitals, they’ll tell you they’re already past the saturation point. All of our nurses have what we call imobile. They all have iPhones that we provided them and then software on those iPhones that help them communicate with their colleagues and others. And so they have a platform where we can deliver alerts to them. And we deliver a lot of alerts. And they’ll tell us like, you know, it’s work to sort through all that and find the signal from the noise. And so we have to actively manage that. And so I would say we have as much or more work going on figuring out how to reduce the number of alerts going to those phones as we do people trying to design like, new AI solutions that could potentially throw off new alerts. The nursing team did a big project around bed alarms. Like, how do we clean all that up so that we’re not overloading them with bed alarms all the time? So, you have to actively manage it. You have to have a discipline around it. Now the future state. I have a really innovative design team that has this concept that they refer to as nugentic. It’s a combination of nudge and agentic. When they talk about nugentic, I sort of, I almost think of like the old-style telephone, systems where there was a person plugging in, like the, you know, I’m talking about plugging in, like the connections. Could you have an agent that’s sitting in the middle of all of these communication streams and figuring out what does Dr. Schlosser actually want to know right now? Like which of all of these signals that are coming in that are screaming for attention are the ones that really matter? And how does he like to receive that information? Does he like to get a text message, a phone call, an email, an overhead page? Smoke signals? And the agent could be figuring out how to parse out the information in a way that it’s not overloading, that we’re not missing critical things where patients are going to get hurt if we miss them. But we’re also filtering the noise as much as we possibly can. So that’s a future state, that’s a long-term solution. But we’re starting to build that technology because this is a problem that’s going to have to be solved because the alert fatigue is a very, very real thing. And so, we’re putting some effort behind it. 

Chip Kahn: And I guess along those same lines, you’ve described a very comprehensive process of design and development and then integration into your system very carefully done. But when I had one of my other guests, Elad Walach from Aidoc, he mentioned something called drift. In a sense, his system’s a medical miracle. Over time, there’s some, either statistical or data or technological things that happen. And whether it’s drift or whether it’s other kinds of degrading, what are the feedback loops that you all are anticipating to try to keep an eye on all these new systems that are dynamic? I mean, they’re going to change over time and there may be unintended consequences. 

Dr. Michael Schlosser: Yeah, and sometimes it’s the patient population that changes. Right? I mean, if, God forbid, we ever had another pandemic, the patient population your model would be working on now would not be the same as the one it was trained on, because that disease didn’t exist. So there’s lots of reasons why model drift can occur. And yeah, your point is a great one. You have to have this ongoing monitoring. And so, I’ll go back to what was the first question about sort of the model scores. So we’ve set up a model registry with model cards. Lots of folks have done that, but we also have invested, and this is early days, but in a technology where we can bring that kind of data in in real time. I mean, it wouldn’t be like literally minute by minute, but at whatever the right cadence is, we could ingest those kinds of metrics back into the model cards and have an AI system that’s watching that so that we can see, okay, has the performance changed, like month over month? Is the accuracy of his model changing, and if so, what do we need to do about that? How do we flag that? With the large language models, we do have to rely on the people. And so because you can’t measure an F1 score, you can’t measure a model performance the way you can with like a machine learning model, like his systems use when you’re talking about a big foundation model. So we built into the nurse handoff tool, like UI that makes it really easy for them to tell us if they see something wrong. If they see a hallucination or an error or an omission that they think is material, they basically just press a button on the interface and that data goes back to us. And we capture that. In our ambient clinical documentation, we worked with Commure to build multiple layers of safety nets. So we have a hallucination checker, which is an LLM that’s really good at seeing the hallucinations from other LLMs. Then we have a subset of notes that are just hand reviewed by people on a regular basis. And then we archive de-identified data so that we can use it as a QA testing environment in the future. And so it depends on the type of solution, what kind of, program you have to put into place. But this concept of having sort of ongoing machine learning operations, LLM ops, ongoing monitoring, I think is part of the challenge of scale and part of why going from pilot to scale is actually really hard. 

Chip Kahn: What I understand here is first there’s choices about even looking at solutions. Then there’s development and design and bringing the staff in. The evolutionary process that you go through with your staff, with the solution producers, and then there’s implementation and scaling, and then there’s the feedback loop. HCA is a very large organization that can do these kinds of things. What’s your view about how smaller systems, because if we look across the country, there are a few, but not that many systems at your scale, that have the management structure and the development structure. You know, what’s your observation about how the solutions that you’re talking about that are so necessary for the future of health care to ensure the quality, to bring the cost down. What’s your observation about what smaller systems should do in this environment when these solutions are coming out every day? 

Dr. Michael Schlosser: It’s gonna be a challenge. I would agree. I think that we are sort of the tip of the spear right now. And I would hope that they will benefit from our learnings that as we build these solutions, as we work with partners like Commure, we’re working with Google, with GE, with OpenAI, that we’re helping sort of the whole ecosystem of health care technology get better at this. And therefore the products will be more complete products. They won’t just be an algorithm or, you know, an AI dictation system, but they’ll come with the kinds of belts and suspenders, safety systems that you need, because that’s going to be necessary for these smaller health systems to be able to adopt that technology. The other thing that I think about, sometimes, and I’ve talked with some folks in Washington D.C. about this, is should we be thinking about the next version of what meaningful use was, what the HITECH bill did? Is this important enough that there should be some ways that government supports funding this kind of technology to get down to sort of every nook and cranny of health care? And we don’t need that. Like we, as you said, we’re big enough and successful enough that we can afford this, but we are definitely the outlier. The vast majority of systems would struggle to make these kinds of investments. And so, if in the next few years we really see health care changing for the better because of AI and technology, should there be some way of trying to ensure that all patients and all systems have a way to access that kind of technology? That might end up being the case. We’ll see. But in the meantime, I’m hoping what we learn can benefit all healthcare systems in the future. 

Chip Kahn: So you’re actually bringing up one, but let me ask, are there other changes, one or two in payment regulation, what AI and developers do, that you think you’d like to see, to accelerate the dissemination of all these really medical miracles that AI and health care can produce? 

Dr. Michael Schlosser: I’ll give you two. One is something that we’ve been pretty consistent about in our talking about this, and that is I think we would benefit from some common sense federal regulations or standards, just some guardrails, around what good looks like for deploying AI across health care systems. If for no other reason then it would help us not have to deal with 50 different sets of rules that every state will feel like they need to enact in order to protect patients or whatever the reasons are. I’m not trying to wade into a political space here. I can just leave it at that. But I think that would actually help drive innovation if we had some agreed-upon guardrails. The second thing I would say is that I wish the conversation and reporting around AI was a little more transparent and a little less hype, cycle driven and that this is never going to happen because it’s just the way the media works. But the constant sort of frenzy around what AI is capable of or could do versus what it actually takes to deploy agentic AI in a health system, there’s an enormous gap between those two things. And so every day there’s some new article or something about what these AI agents are capable of and the dramatic change it’s going to create and all these things. And it completely ignores the fact that you have to do all those steps that you really clearly outlined here just a minute ago if you’re going to put AI in a heavily regulated, high-risk environment like health care delivery. And so I’m incredibly bullish about AI. I’m a huge tech optimist. I think it’s going to create enormous change. It is not going to come overnight, it’s not going to be easy, but we’re going to do it because I think it’s worth doing. I wish that gap was a little more narrow so that people could work on reality of AI rather than fantasy. 

Chip Kahn: Mike to close out, we’ve really gone over the whole waterfront, I think, in terms of implementation of AI at HCA healthcare. What keeps you up at night, in this AI area, either in terms of your environment, your ecosystem or even larger scale. 

Dr. Michael Schlosser: I’m going to cheat and give you two here also. So the number one has to be change management because we have to adopt these changes and all the people who make up health care have to become open to change and open to innovation if this is going to work. And that’s a challenge. And so that worries me. The second thing that worries me is that I don’t really know that we fully understand AI even yet at this point. I’ll feel schizophrenic where sometimes I feel like, hey, these models make mistakes all the time and are they really going to be any good? And then I’ll read something where I’m like, oh my gosh, humanity is already in trouble because the AI is smarter than us. And the reality is somewhere in between. But that keeps me up at night. I don’t know that we fully understand the technology that we’re using and it might surprise us one day. So, we’ll see. 

Chip Kahn: Well, hopefully we can avoid the downside and enjoy all the value from everything you’ve described here today. Mike, this is terrific and I just so appreciate you coming on the podcast. 

Dr. Michael Schlosser: Chip, thanks for having me. Enjoyed the conversation. 


SERIES
This weekly podcast features insightful conversations between host Chip Kahn and his guests, who discuss the business of health care, connecting the dots between the health care business, policy, and patients.

The podcast’s first series on AI in health care illuminates how AI is changing health care, and features guests who are deploying this technology, managing its consequences, and designing policy around it.
Is The U.S. Stepping Up In The Fight Against Ebola?

Published: May 23, 2026

Editorial Note: Originally published on May 21, this Policy Watch was updated on May 23 to incorporate additional information and developments.

The recently announced Ebola outbreak in the Democratic Republic of the Congo (DRC), which is quickly escalating in the region, emerges at a time when the larger fiscal and programmatic environment for global health efforts faces particular hurdles, and international cooperation has been significantly challenged. This is in large part due to policy decisions made by the Trump administration and presents the first real global outbreak test following those changes.

On May 15, news broke of a large, ongoing Ebola outbreak concentrated in northeastern DRC. Two days later, the Director-General of the World Health Organization (WHO) declared the outbreak to be a “public health emergency of international concern” (PHEIC) given its size and because Ebola cases were already reported across the border in Uganda, making the outbreak a regional threat. Despite only recently being detected and reported, this already appears to be one of the largest Ebola outbreaks to date, with almost 746 suspected cases and over 176 suspected deaths as of May 21st. 

National and international health authorities have recent experience responding to Ebola outbreaks, such as in West Africa in 2014-2015 (the largest since the virus was discovered in 1976) and in DRC between 2018 and 2020. However, this outbreak presents particular challenges. These include:

  • First, the species of Ebola virus circulating in the current outbreak is different from that which caused most prior major outbreaks, which means countermeasures such vaccines and treatments are not available, and even testing for this species can only be done at more specialized labs currently.
  • Second, the outbreak is happening in a geographic area with ongoing insecurity, multiple concurrent humanitarian crises, high population mobility, and limited access to health services. These factors played a role in the delayed identification of the outbreak and pose difficulties for the response.
  • Third, the international environment of health cooperation and financial support has changed significantly since the last big outbreak, driven in large part by the U.S. withdrawal from WHO and international cooperation more broadly as well as its reductions in foreign aid and health programming, but also by larger financial constraints due to aid cuts by other donors.

Even so, the public health effort has already started to ramp up, with DRC and Ugandan health authorities leading responses in their respective countries, supported by WHO, United Nations humanitarian agencies, the Africa CDC, and a network of other local, regional, and international non-governmental organizations.

For its part, the U.S. government has reported that it has already taken a number of steps in response to the outbreak, including:

  • Providing some financial support to national Ebola responses in DRC and Uganda. Within two days of learning of the outbreak, the State Department announced it had mobilized $23 million in emergency funding to support DRC and Ugandan government health responses. The State Department also announced it would direct U.S. humanitarian funding to assist with the broader humanitarian response in these countries. By comparison, this initial funding amount is larger than the $8 million the U.S. provided through USAID in the weeks following the identification of the 2018 Ebola outbreak in Equateur province in DRC, though the 2026 outbreak is already much larger and affects a wider geographic area. It is unclear at this point how much funding will ultimately be necessary for the current Ebola response, with authorities still trying to understand the true scope of the outbreak and community needs. The State Department expects the U.S. will increase its financial support for the current outbreak response over time. Over the course of the series of DRC Ebola outbreaks from 2018-2020, which ultimately caused over 2,300 deaths, USAID contributed $324 million, and CDC $37 million, to country response efforts, with these funds drawn entirely from prior emergency Ebola appropriations provided by Congress during the 2014-2015 West Africa Ebola epidemic.
  • Activating CDC emergency operations and mobilizing CDC staff and resources. CDC held a press conference within two days of the outbreak announcement, reporting that the agency has begun to assist DRC and Ugandan officials and connect with other partners via CDC offices in each country. CDC and State Department have begun supporting partner organizations in procuring and deploying needed supplies, such as personal protective equipment (PPE). CDC says it has a “long-standing” team of 30 staff in its DRC country office (primarily located in the capital, Kinshasa, which is hundreds of miles from the affected areas in northeastern DRC) and about 100 in Uganda, with more expected to be mobilized in the coming days, including experts from Atlanta who will travel to the affected countries. According to reports, CDC is taking the lead role for the U.S. government in the Ebola response in affected countries. For some context, during the response to Ebola outbreaks in DRC that began in 2018 and eventually grew to thousands of cases, CDC had 187 staff members complete 278 deployments through June 2019.  
  • Committing to help stand up Ebola isolation and treatment units. In a May 19 announcement, the State Department says it will be financing the deployment of “up to 50” Ebola Treatment Units and “associated frontline costs” to assist further with the response. These units will provide emergency Ebola screening, triage, and isolation capacity in affected areas.  According to the State Department, the U.S. funding will be delivered via “pooled funding vehicles administered by the United Nations Office for the Coordination of Humanitarian Affairs (OCHA).”
  • Deploying a Disaster Assistance Response Team (DART) to the region.  The State Department reports it will be deploying a DART to DRC, which is a mechanism meant to align and coordinate resources from various U.S. agencies under a single organizational structure. The State Department expects the DRC DART will allow CDC, State, and other U.S. agencies to be located together, fostering unified communications with host country governments and other partners.
  • Investigating potential monoclonal antibody treatments. According to a spokesperson for the Department of Health and Human Services (HHS), the Biomedical Advanced Research and Development Authority (BARDA) is working with a biotechnology company to make available an experimental Ebola treatment based on monoclonal antibodies for potential use in high-risk individuals. It is unclear how much may be made available and under what circumstances the treatment may be used.  

Still, given all of the changes made by the U.S. to its foreign assistance and global health response, U.S. support is taking shape under very different circumstances and through different organizational mechanisms compared to past Ebola responses. For example:

  • The absence of USAID. USAID supported Ebola prevention and detection activities in DRC, Uganda, and elsewhere for many years, employing dozens of staff members with outbreak surveillance and response expertise. However, much of that expertise and the underlying network of organizations was lost when USAID was dissolved and almost all its staff was fired last year. Historically, USAID was the lead agency representing the U.S. government during major Ebola response and was home to interagency DARTs. Now, the newly created State Department Bureau of Global Health Security and Diplomacy (GHSD) and State’s Bureau of Disaster and Humanitarian Response (DHR) are responsible for overseeing diplomatic and coordinating with CDC on technical aspects of an Ebola response for the first time, including through the newly announced DART, despite having fewer personnel than USAID had and limited prior experience overseeing an operational response. Ultimately, staffing for the U.S. response could be scaled up over time, as it was during prior outbreaks, such as during the 2014-2015 West Africa Ebola response, which ultimately consisted of a large U.S. government interagency presence that included the deployment of thousands of U.S. military personnel, hundreds of CDC and HHS staff, and representatives from other agencies.
  • Ongoing effects of foreign assistance funding freeze and cuts. Alongside the dissolution of USAID, in early 2025 the Trump administration implemented a freeze on all foreign assistance funding for a period last year. As a consequence, partner organizations report that they had to fire staff and cease many disease prevention and detection activities, including Ebola-focused activities in Uganda and DRC. . Eventually, the State Department issued “waivers” to allow funding for existing “life-saving” assistance programs to continue, which included infectious disease outbreak detection and response programs. While certain activities resumed, the underlying system itself was affected.
  • Withdrawal of U.S. membership in WHO. During past response to major Ebola outbreaks, WHO played important coordinating and financing roles, and is poised to serve a leading role in bringing international resources to bear in DRC and Uganda. WHO has already mobilized almost $4 million funding from its Contingency Fund for Emergencies (CFE), the mechanism created after the 2014-2015 West Africa Ebola outbreak to rapidly channel donor funding to support public health emergency response efforts. In the past, the U.S. had always been a major supporter of WHO’s responses and the CFE, including as one of the largest donors to the CFE, and to the multilateral Ebola response, during the 2018-2020 DRC Ebola outbreaks. However, given the U.S. withdrawal from WHO and more limited formal communications between U.S. government officials and WHO officials, the U.S. does has not indicated an interest in directly supporting a WHO-led response this time, a departure from past practices. With just $5.4 million in total donor contributions to the fund in 2026, CFE is already close to being exhausted, with other donors so far unable to fill the funding gaps left by the U.S. absence. While some formal communications between the U.S. and WHO have been limited, CDC has explicit permission to coordinate as necessary with international organizations involved in the response on the ground, including staff from WHO.
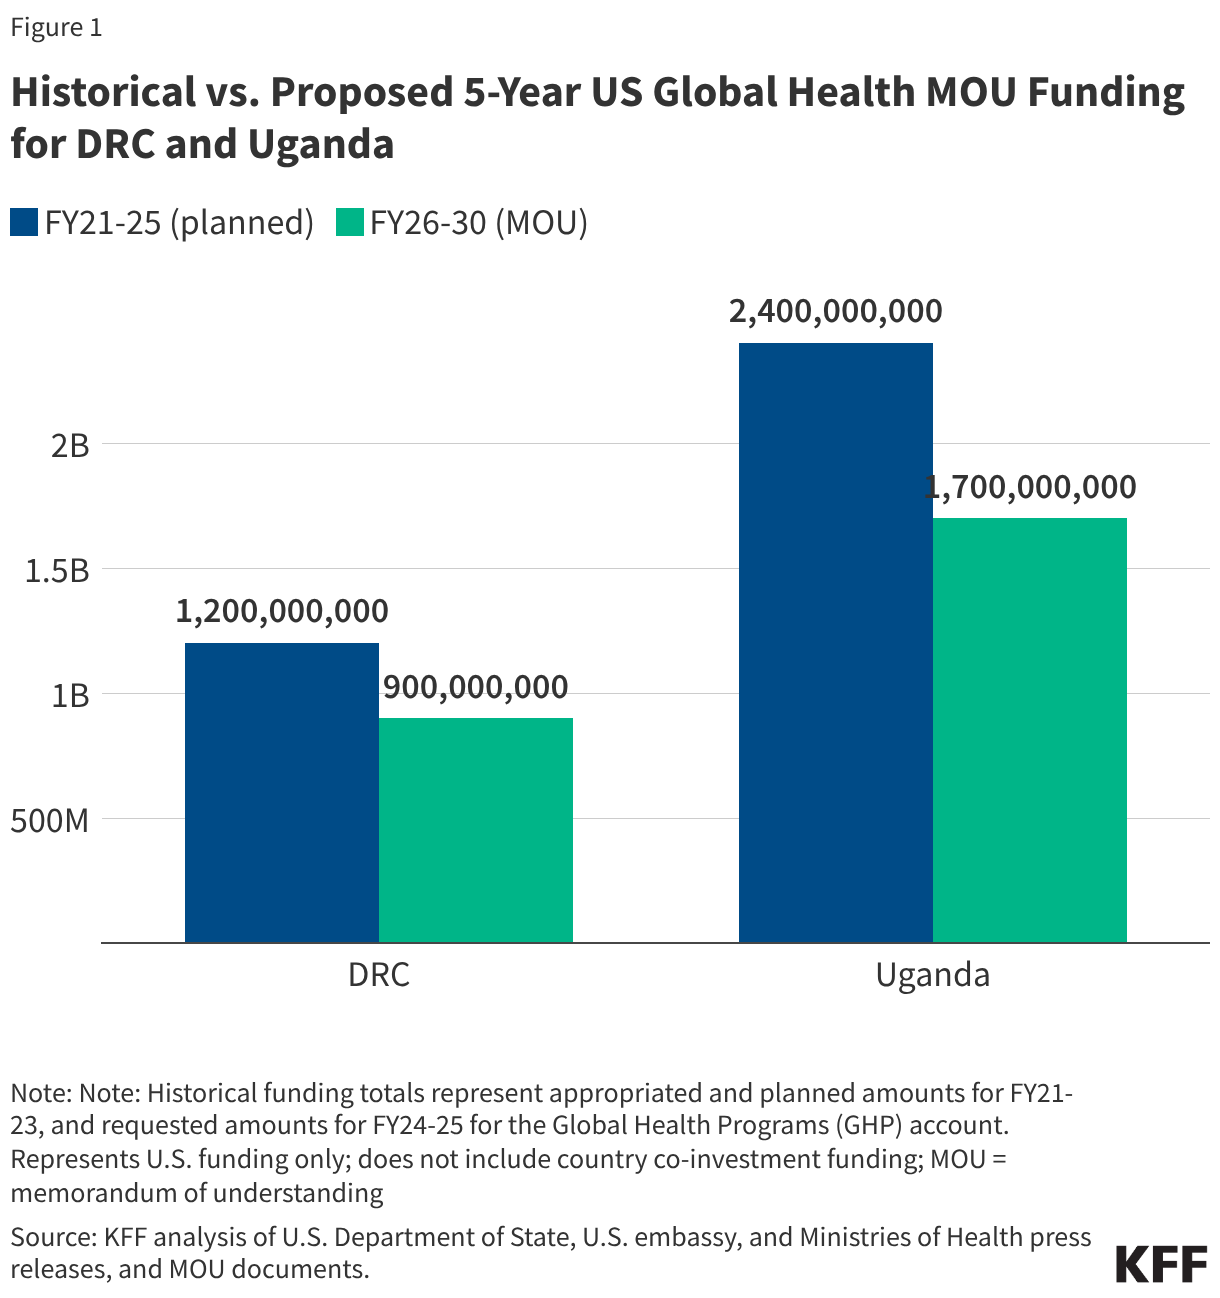
  • Reduced funding for global health in new U.S. agreements with DRC and Uganda. As referenced above, the dissolution of USAID and the foreign assistance funding freeze last year created de facto cuts to global health assistance in the Ebola-affected countries, affecting country programs. U.S. pledges of assistance over the next few years do represent a cut in funding compared to previous years. The new U.S. approach to global health assistance relies on negotiating country-specific agreements (memoranda of understanding, or MOUs), and such agreements have already been reached with Uganda (signed December 2025) and DRC (signed February 2026). However, the amount of funding pledged by the U.S. for the next 5 years represents a 27% cut compared to that provided over the past five years (see Figure).  The MOUs also outline priorities for the US and the partner countries for global health assistance, with disease surveillance and response being a key aspect for both the DRC and Uganda agreements. For example, the MOU with Uganda states the U.S. wishes to “advance its bilateral relationship with the Government of Uganda and prevent the spread of emerging and existing infectious disease threats globally”, and outlines the funding amounts the U.S. intends to provide the country each year to advance these priorities. However, it is not exactly clear how this new mechanism will shape the programs and outcomes from U.S. global health funding in these priority areas going forward.
Historical vs. Proposed 5-Year US Global Health MOU Funding for DRC and Uganda (Grouped column chart)

While these are still early days in a response that could last months (and facing an outbreak that appears to be escalating quickly), there are several key questions regarding the U.S. response going forward:

  • If the needs on the ground increase significantly, will the Trump administration request additional emergency funding from Congress, as previous administrations have done? In addition to the United Nations OCHA funds the U.S. is tapping into, are there other, as of yet untapped existing resources that could be mobilized?
  • If the outbreak worsens significantly, will the U.S. scale up its on the ground presence? Because the outbreak is occurring in an area with active conflict, direct deployment of CDC staff to affected areas in eastern DRC is unlikely, which is similar to the situation during the 2019 outbreaks of Ebola in DRC, where CDC provided support from afar but was not directly stationed in the field in affected areas. Could military personnel once again be called on to assist with the response, echoing the role they played in the 2014-2015 response?
  • How far have U.S., WHO, and other disease response capacities been stretched now that officials are responding to two international emerging disease events in a short span – hantavirus and Ebola? And what might happen if yet another strain is placed on the already strained global response system?
  • Will the Ebola outbreak and response affect other U.S. global health programs operating in the affected countries, and how might the U.S. government address any temporary interruptions or changes in services delivered through those programs?

Given its scale, the urgent messaging, and a rapid series of actions taken by national and international health authorities already, it appears that this Ebola outbreak will be a significant regional public health emergency ideally requiring a sustained, coordinated response. It also presents as the first real test of U.S. government commitment to supporting a major global outbreak response effort since the beginning of this administration, not unlike how hantavirus has been a test of sorts for U.S. domestic public health response to an emerging disease threat.

The U.S. President’s Emergency Plan for AIDS Relief (PEPFAR)

Published: May 22, 2026

Editorial Note: Originally published in November 2009, this resource is updated as needed to reflect the latest developments.

Key Facts

  • Although the U.S. has been involved in efforts to address the global AIDS crisis since the mid-1980s, the creation of the President’s Emergency Plan for AIDS Relief (PEPFAR) in 2003 marked a significant increase in funding and attention to the epidemic. Now, more than 20 years in, PEPFAR reports saving an estimated 26 million lives and is currently providing HIV prevention and treatment services to millions.
  • PEPFAR has been the largest commitment by any nation to address a single disease in the world, credited with not only saving millions of lives but also helping to change the trajectory of the global HIV epidemic.
  • PEPFAR funding is comprised of U.S. bilateral funding and U.S. contributions to multilateral organizations addressing HIV, primarily the Global Fund to Fight AIDS, Tuberculosis and Malaria (Global Fund).1
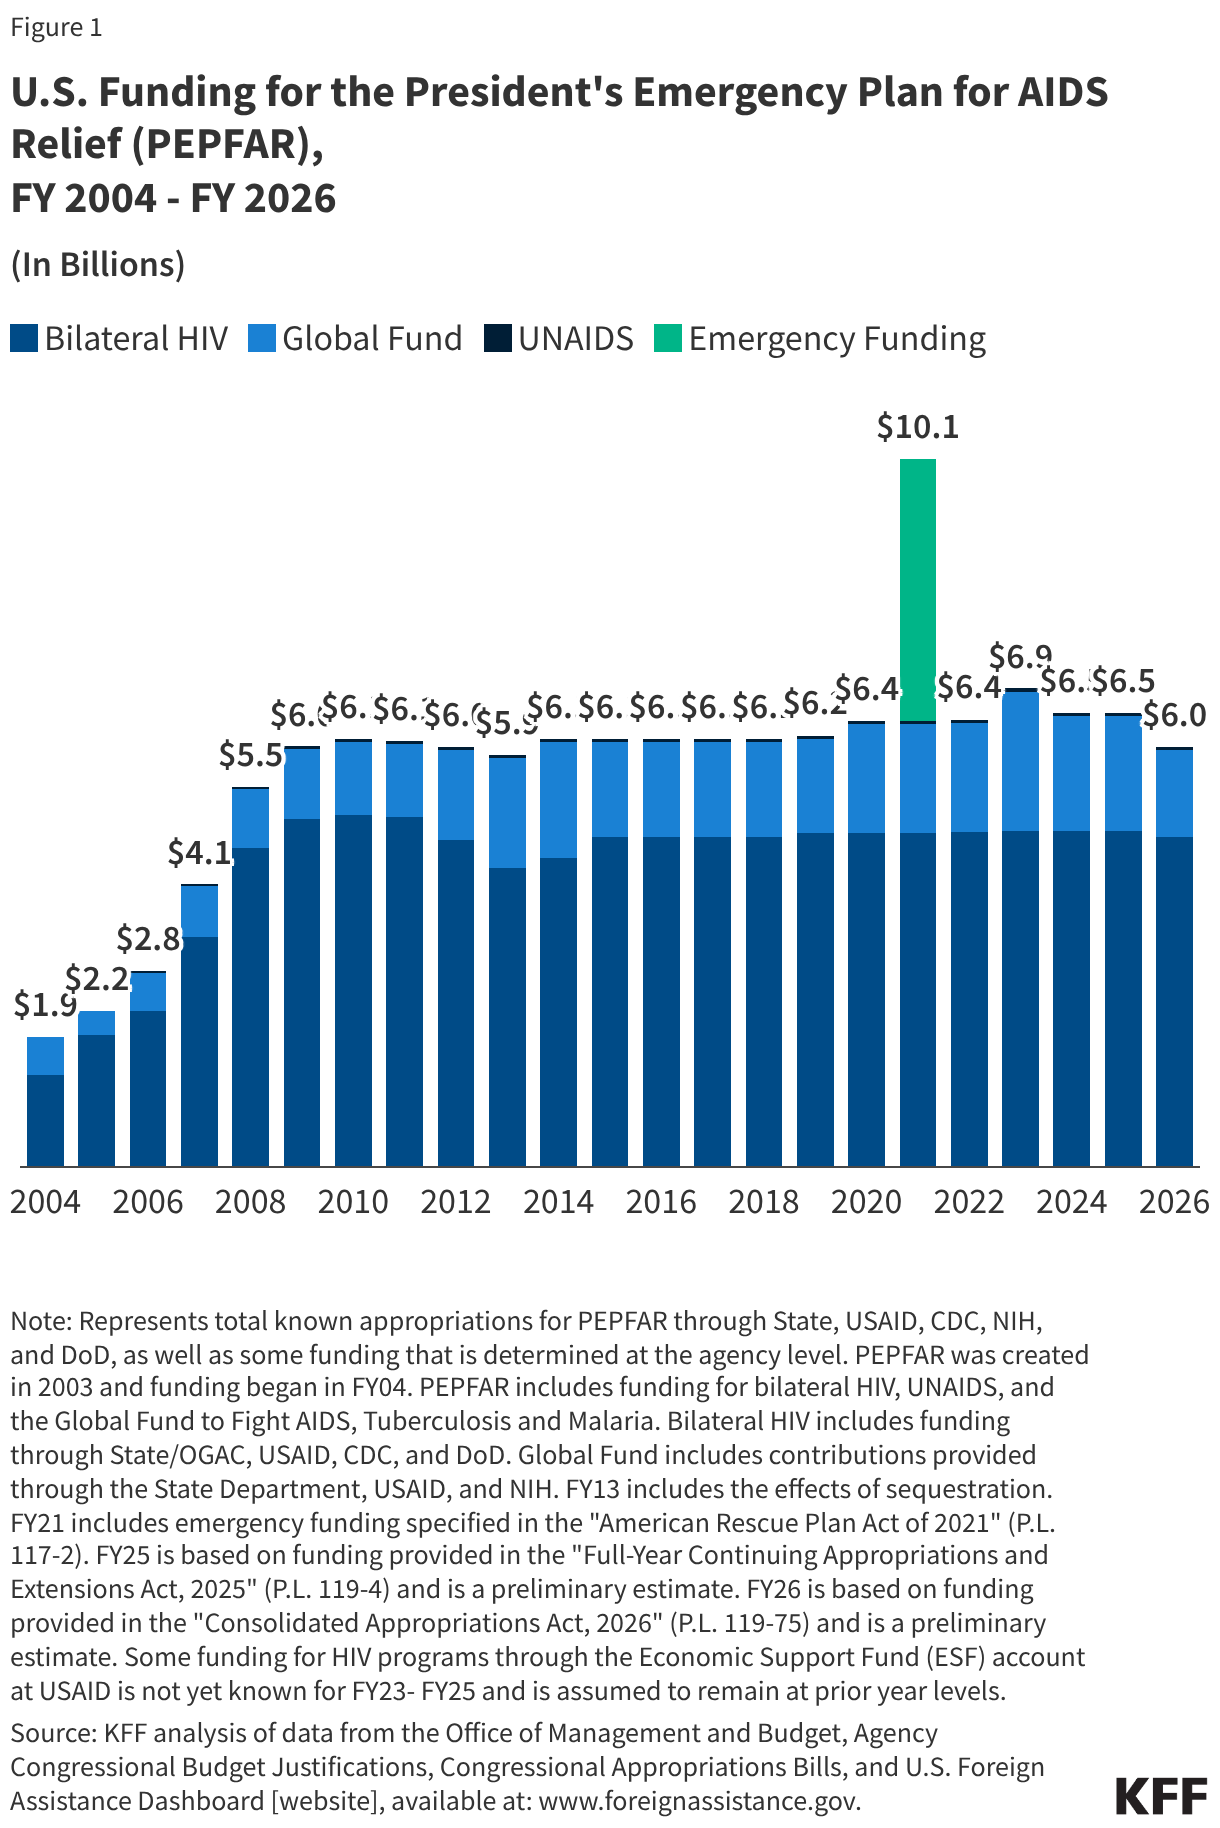
  • To date, U.S. funding appropriated by Congress for PEPFAR has totaled over $130 billion, growing from $1.9 billion in FY 2004 to $6 billion in FY 2026; in FY 2026, funding includes $4.7 billion provided for bilateral HIV efforts and $1.3 billion for multilateral efforts ($45 million for UNAIDS and $1.25 billion for the Global Fund).2
  • PEPFAR has been reauthorized by Congress four times, most recently in March 2024 for one year. Although that authorization expired on March 25, 2025, PEPFAR is a permanent part of U.S. law and, other than a now-expired set of eight time-bound provisions, continues as long as Congress appropriates funding for the program.
  • At the same time, changes made by the Trump administration starting in 2025 (including a reorganization of foreign assistance, reductions in funding, and cancellation of programs) have fundamentally altered the global health landscape generally and PEPFAR specifically. As part of its new America First Global Health Strategy, anchored in bilateral health agreements with countries, HIV services will be integrated into country health systems, and the U.S. will aim to reduce its funding over time.

Global Situation

HIV, the virus that causes AIDS (“acquired immunodeficiency syndrome” or Advanced HIV Disease), has become one of the world’s most serious health and development challenges. Today, there are approximately 40.8 million people living with HIV, and tens of millions of people have died of AIDS-related causes since the beginning of the epidemic (see the KFF fact sheet on the global HIV epidemic).3

Box 1: Snapshot of Global Epidemic Today

  • Number of people living with HIV: 40.8 million
  • Number of people newly infected with HIV: 1.3 million
  • Number of AIDS-related deaths: 630,000
  • Number of people with HIV on treatment: 31.6 million

Notes: Reflects 2024 data.

U.S. Government Efforts

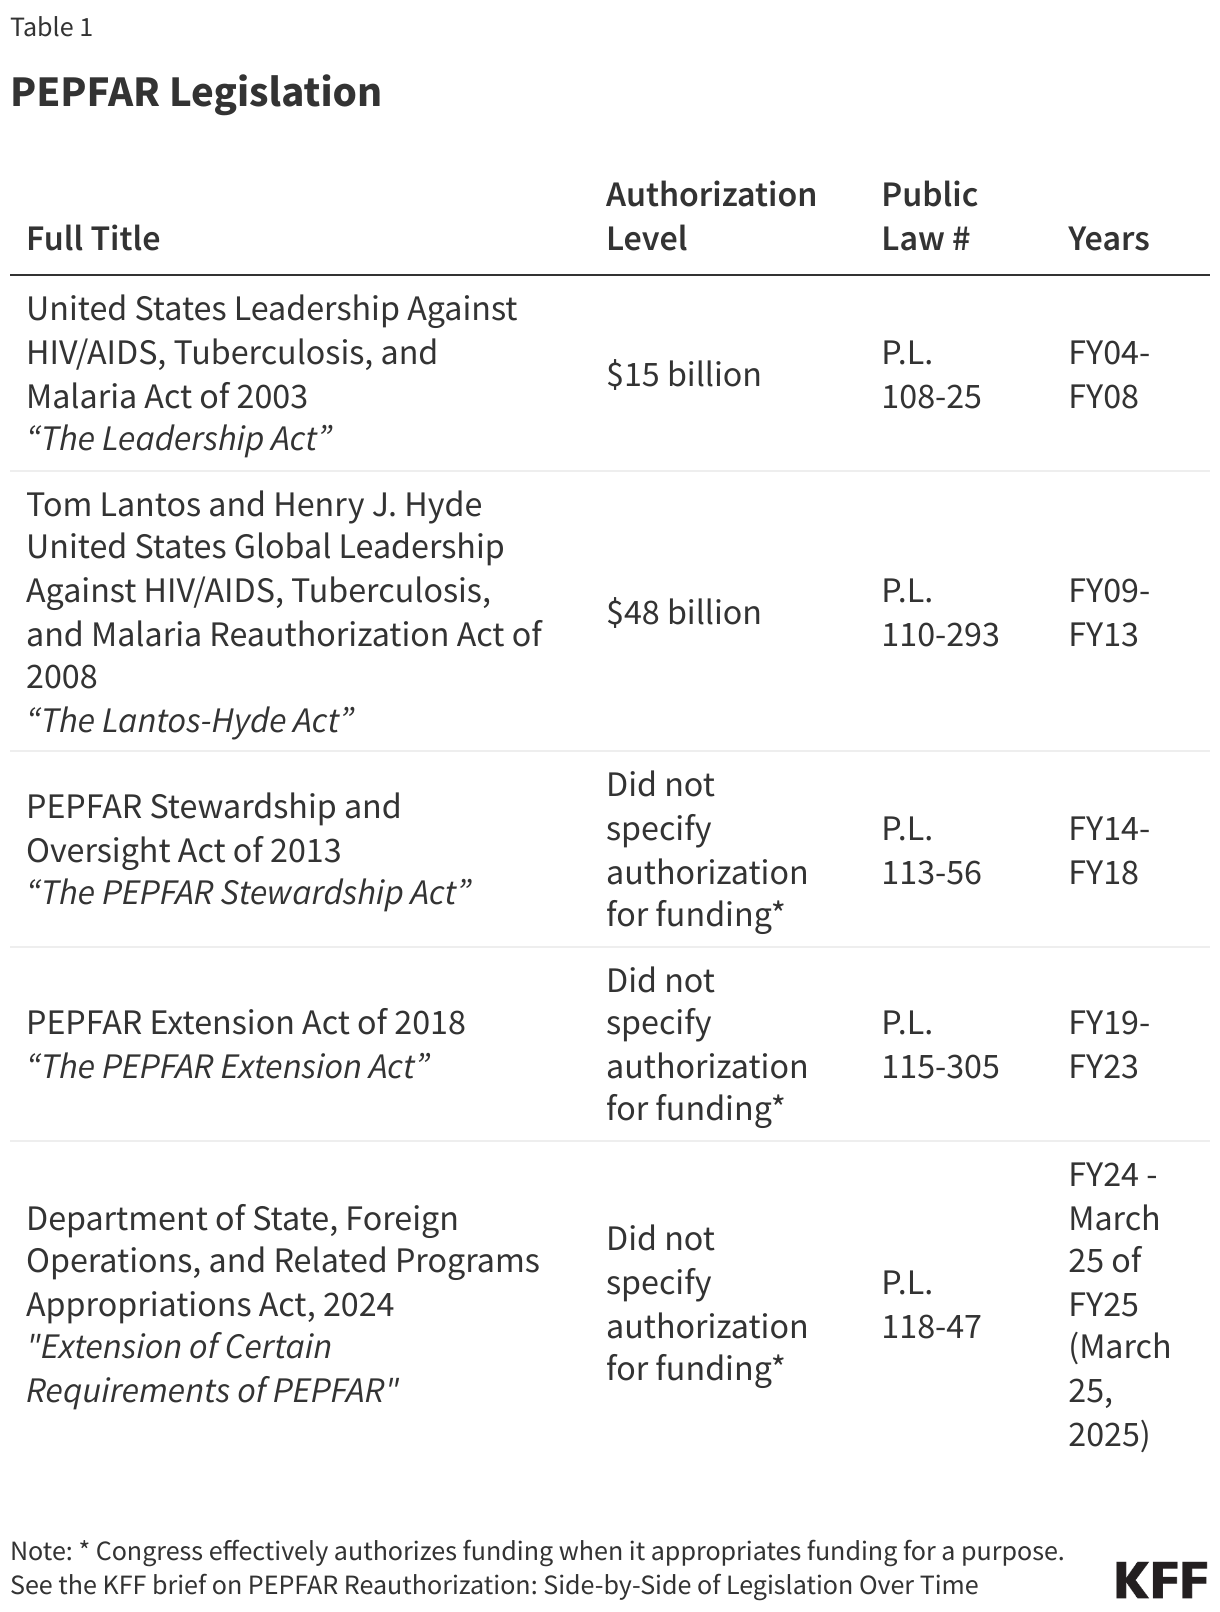
Although the U.S. had been involved in efforts to address the global HIV/AIDS crisis since the mid-1980s,4 the creation of the President’s Emergency Plan for AIDS Relief (PEPFAR) in 2003 marked a significant increase in funding and attention to the epidemic.5 PEPFAR, the U.S. government’s global effort to combat HIV and the largest global health program devoted to a single disease, is credited with saving millions of lives and helping to change the trajectory of the global HIV epidemic. It was announced in January 2003 during President George W. Bush’s State of the Union and authorized by Congress that same year through the Leadership Act. The Leadership Act governs PEPFAR’s HIV response, as well as U.S. participation in the Global Fund (an independent, international multilateral financing institution that provides grants to countries to address HIV, TB, and malaria) and bilateral assistance for TB and malaria programs.6 Congress has updated, extended, and made changes to the program through the Lantos-Hyde Act of 2008, the PEPFAR Stewardship Act of 2013, the PEPFAR Extension Act of 2018, and more recently, a short-term reauthorization of PEPFAR in early 2024 that extended certain timebound provisions through late March 2025, which have since lapsed (see Table 1 and the KFF brief on PEPFAR reauthorization legislation over time). This short term reauthorization signaled a departure from the program’s long history of strong bipartisan support across multiple Congresses and administrations when, in an increasingly partisan environment, PEPFAR was caught up in the broader U.S. political debate over abortion (see the KFF brief on PEPFAR’s short term reauthorization). This and other developments, including the Trump administration’s review of foreign assistance and new America First Global Health Strategy, have fundamentally altered PEPFAR and introduced significant uncertainty about its future.

PEPFAR Legislation (Table)

Organization

PEPFAR’s original authorization established new structures and authorities, consolidating all U.S. bilateral and multilateral activities and funding for global HIV/AIDS.7 Historically, PEPFAR has been overseen by the U.S. Global AIDS Coordinator, who is appointed by the President, confirmed by the Senate, and reports directly to the Secretary of State, as established through PEPFAR’s authorizing legislation.8 The Coordinator holds the rank of Ambassador and leads the Office of the Global AIDS Coordinator (OGAC) at the Department of State.9 The Coordinator has primary responsibility for the oversight and coordination of all U.S. global HIV activities and funding across U.S. implementing agencies and departments. In addition, the Coordinator serves as the U.S. Government’s board member to the Global Fund (the U.S. Government holds a permanent seat on the Global Fund’s Board). The Coordinator is dual-hatted as the U.S. Special Representative for Global Health Diplomacy and also leads the broader Bureau of Global Health Security and Diplomacy (GHSD), which brings together PEPFAR with global health security and global health diplomacy functions.10 Currently, the President has not yet nominated a Coordinator, and it is unclear when or whether someone will be nominated.

In addition to the Department of State, other implementing departments and agencies for HIV activities have included: the U.S. Agency for International Development (USAID), PEPFAR’s largest government implementing agency (the Trump administration dissolved USAID and integrated remaining USAID global health activities into GHSD); the Department of Health and Human Services, primarily through the Centers for Disease Control and Prevention (CDC), which has also gone through staff reductions and seen a diminished role under the Trump administration; the Departments of Labor, Commerce, and Defense (DoD); and the Peace Corps.11 Currently, however, most PEPFAR activity is being managed out of the State Department as it transitions programs and services to country governments.

Key Activities and Results

PEPFAR reports having saved an estimated 26 million lives, focusing on expanding access to HIV prevention, treatment, and care interventions. This has included provision of antiretroviral treatment, pre-exposure prophylaxis, voluntary male circumcision, condoms, and other commodities related to HIV services, although some of these services have now been scaled back or discontinued by the administration.12 In addition, PEPFAR launched specific initiatives in key strategic areas. For example, in 2015, PEPFAR launched DREAMS, a public-private partnership that aimed to reduce HIV infections in adolescent girls and young women; the DREAMS program has been discontinued.

In FY 2024, the last full year of data reported, PEPFAR indicated that it had supported testing services for 83.8 million people; prevented 7.8 million babies from being born with HIV, who would have otherwise been infected; provided care for more than 6.6 million orphans, vulnerable children (OVC), and their caregivers; supported training for nearly 342,000 new health care workers; and supported antiretroviral treatment for 20.6 million people.13 However, more recent data is mixed. For example, analysis of data from Quarter 4 of FY 2025 found that while the number of people on antiretroviral therapy was stable compared to Quarter 4 of FY 2024, the number newly enrolled on antiretroviral therapy, the number tested, and the number receiving PrEP, dropped significantly.14

Since the beginning of the second Trump administration, numerous actions have already had a significant impact on PEPFAR operations and programmatic outcomes), including the following:

  • the administration’s foreign aid review and funding freeze, announced in 2025, which limited PEPFAR’s activities to those defined in a limited waiver, significantly scaling back PEPFAR’s scope to what the waiver defines as “life-saving HIV services,” which include only certain activities: HIV treatment and care, prevention of mother-to-child transmission (PMTCT), pre-exposure prophylaxis (PrEP) for pregnant and breastfeeding women, and HIV testing, but even after the initial period, not all of these services have been continued;
  • the administration’s September 2025 announcement that PEPFAR would partner with the Global Fund to provide long-acting injectable PrEP, reaching up to 2 million people in high-burden HIV countries through 2028, and then more recently in April 2026, the announcement of an expanded commitment to reach an additional 1 million people, bringing the total to 3 million people; and
  • the administration’s September 2025 release of its new America First Global Health Strategy, which provides a framework for global health efforts in countries receiving PEPFAR assistance through bilateral health agreements that aim to reduce U.S. funding over time. Under the agreements, the U.S. plans to provide 100% of current levels of PEPFAR funding for commodities and frontline healthcare workers in 2026 and reduced funding thereafter. More broadly, HIV services will be integrated into country health systems, as the U.S. reduces its funding and direct implementation role.

Countries Reached

Historically, PEPFAR bilateral programs were carried out in more than 50 countries.15 Additional countries are reached through U.S. contributions to the Global Fund. Prior to the second Trump administration, PEPFAR required 25 countries16 and the Asia, Western Hemisphere, and West Africa regional programs to develop “Country Operational Plans” (COPs) and “Regional Operational Plans” (ROPs), respectively, to document annual investments and anticipated results.17 OGAC reviewed and the Global AIDS Coordinator approved COP/ROPs. Currently, this process has been replaced by new bilateral global health agreements with partner countries, which are not specific to PEPFAR or HIV and which require partner countries to increasingly co-invest domestic government resources while the U.S. decreases its health assistance over time. (See the KFF tracker on bilateral global health agreements for more details.)

Funding18

Total PEPFAR funding19 includes bilateral funding to U.S. agencies for HIV activities as well as U.S. contributions to the Global Fund and UNAIDS,20 as specified by Congress for PEPFAR in annual appropriations bills.21 It has represented the majority of U.S. global health funding (ranging from 53-55% in recent years22) and is the largest commitment by any nation to address a single disease in the world. To date, funding appropriated for PEPFAR totals more than $130 billion, with funding reaching $6 billion in FY 2026 (see figure).

U.S. Funding for the President's Emergency Plan for AIDS Relief (PEPFAR),FY 2004 - FY 2026 (Stacked column chart)

PEPFAR’s creation marked a significant increase in the amount of funding provided by the U.S. for HIV. Trends in funding for bilateral programs and contributions to multilateral organizations are as follows (see the KFF fact sheet on the U.S. Global Health Budget: Global HIV Funding, Including PEPFAR and U.S. Global Health Budget: The Global Fund):

  • Bilateral HIV Funding: The majority of PEPFAR funding (ranging from 70-79% each year over the past decade) is provided for bilateral programs through the State Department (most of which had been transferred to other agencies – particularly USAID and CDC – but now is managed by the State Department). Bilateral funding rose rapidly from $822 million in FY 2003 (the year before PEPFAR) to a peak of $5.0 billion in FY 2010. Between FY 2010 and FY 2013, it declined by more than $750 million. While it has risen since then, funding leveled off for several years, and in FY 2026, appropriations totaled $4.7 billion ($316 million below its peak level).
  • Multilateral Funding: The U.S. also supports global HIV efforts through contributions to the Global Fund and UNAIDS. Support for the Global Fund, which accounts for most of the multilateral contributions, increased rapidly in its early years and fluctuated over time; it reached its highest level to date ($2.0 billion) in FY 2023. In FY 2026, Congressionally-appropriated funding for the Global Fund was $1.25 billion, $400 million less than the FY 2025 level, though Congress noted that this funding is intended for the first installment of the $4.6 billion U.S. pledge to the Global Fund’s eighth funding replenishment period (2026-2028).23 The U.S. contribution to UNAIDS has fluctuated between $45 and $50 million; it was $45 million in FY 2026.
  • Emergency COVID-19 Funding: In FY 2021, an additional $3.8 billion in emergency supplemental funding was provided for bilateral HIV ($250 million) and the Global Fund ($3.5 billion) to address COVID-19.24

Spending Directives25

PEPFAR has included several spending directives, or earmarks, from Congress over the course of its history, many of which have changed over time:

  1. The Leadership Act, PEPFAR’s original authorization, included the following spending directives: 55% of funds were to be spent on treatment; 15% on palliative care; 20% on prevention, of which at least 33% be spent on abstinence-until-marriage programs; and 10% on OVC. While these were included as “sense of Congress” recommendations, the treatment, OVC, and abstinence-until-marriage earmarks were made requirements as of FY 2006.
  2. The Lantos-Hyde Act relaxed some of these directives for the FY 2009 – FY 2013 period: while still requiring that 10% of funds be spent on programs targeting OVC, it changed the treatment earmark from 55% to requiring that at least half of bilateral HIV assistance be spent on treatment and care. It removed the 33% abstinence-until-marriage directive and replaced it with a requirement of “balanced funding” for prevention to be accompanied by a report to Congress if less than half of prevention funds were spent on abstinence, delay of sexual debut, monogamy, fidelity, and partner reduction activities in any host country with a generalized (high prevalence) epidemic.
  3. The PEPFAR Stewardship Act, The PEPFAR Extension Act, and recent short-term reauthorization have maintained the language in the Lantos-Hyde Act. With the expiration of the short-term reauthorization in 2025, eight timebound provisions have now lapsed, although PEPFAR is a permanent part of U.S. law.

PEPFAR & The Global Fund

The U.S. is the single largest donor to the Global Fund. Appropriations for the U.S. contribution to the Global Fund totaled almost $33 billion from FY 2001 through FY 2026 (including emergency funding for COVID-19).26

The Global Fund provides another mechanism for U.S. support by funding programs developed by recipient countries, reaching a broader range of countries, and supporting TB, malaria, and health systems strengthening (HSS) programs in addition to (and beyond their linkage with) HIV.27 To date, over 120 countries28 have received Global Fund grants. Most Global Fund support (52%) has been signed and approved by the Board for HIV and HIV/TB programs,29 followed by 29% to malaria, 15% to TB, and 5% to other health issues.30 The original authorization of PEPFAR, and subsequent reauthorizations, included a limit on annual U.S. contributions to the Global Fund that prevented them from causing cumulative U.S. contributions to exceed 33% of the Global Fund’s total contributions (see the KFF fact sheet on the Global Fund). 31

Endnotes

  1. KFF analysis of The Global Fund: https://data-service.theglobalfund.org/downloads. ↩︎
  2. Totals represent funding specified by Congress in annual appropriations bills and/or identified by agencies for the Department of State, USAID, CDC, and DoD. In addition, international HIV research activities are supported by the NIH Office of AIDS Research (OAR) through its annual appropriated budget, but these amounts are not considered part of PEPFAR. See KFF's “Breaking Down the U.S. Global Health Budget by Program Area” for additional information. ↩︎
  3. UNAIDS. 2025 UNAIDS Global AIDS Update: AIDS, Crisis and the Power to Transform; July 2025. ↩︎
  4. The U.S. first provided funding to address the global HIV epidemic in 1986. Then, in 1999, President Bill Clinton announced the Leadership and Investment in Fighting an Epidemic (LIFE) Initiative to address HIV in 14 African countries and in India. Later, in 2002, President George W. Bush announced the International Mother and Child HIV Prevention Initiative focused on 12 African and two Caribbean countries. ↩︎
  5. PEPFAR. 2009 Annual Report to Congress; Jan. 2009. ↩︎
  6. U.S. Congress. P.L. 108-25; May 27, 2003. ↩︎
  7. KFF. The U.S. Government and Global Health, Sep. 2022. CRS. PEPFAR Reauthorization: Key Policy Debates and Changes to U.S. International HIV/AIDS, Tuberculosis, Malaria and Programs and Funding; Jan. 2009. ↩︎
  8. U.S. Congress. Public Law No: 108-25; May 27, 2003. ↩︎
  9. U.S. Department of State. “Leadership – Bureau of Global Health Security and Diplomacy” webpage, https://www.state.gov/leadership-bureau-of-global-health-security-and-diplomacy. ↩︎
  10. Department of State. “ Leadership – Bureau of Global Health Security and Diplomacy,” webpage, https://www.state.gov/leadership-bureau-of-global-health-security-and-diplomacy/. ↩︎
  11. PEPFAR. “About Us,” webpage, https://www.state.gov/about-us-pepfar/. ↩︎
  12. KFF. Funding for Key HIV Commodities in PEPFAR Countries; July 2021. ↩︎
  13. PEPFAR. PEPFAR Latest Global Results; December 2024. ↩︎
  14. KFF. What We Know from the Latest PEPFAR Data: Analysis of FY 2025 Quarter 4 Results; April 2026. ↩︎
  15. PEPFAR, “Where We Work” webpage, https://www.state.gov/where-we-work-pepfar/; PEPFAR 2023 Country Operational Plan Guidance for all PEPFAR Countries; and CDC’s “Where We Work” webpage, https://www.cdc.gov/global-hiv-tb/php/where-we-work/. ↩︎
  16. The 25 countries that were required to complete a FY23 COP are Angola, Botswana, Burundi, Cameroon, Cote d’Ivoire, Democratic Republic of the Congo, Dominican Republic, Eswatini, Ethiopia, Haiti, Kenya, Lesotho, Malawi, Mozambique, Namibia, Nigeria, Rwanda, South Africa, South Sudan, Tanzania, Uganda, Ukraine, Vietnam, Zambia, and Zimbabwe. PEPFAR. “Where We Work” webpage, https://www.state.gov/where-we-work-pepfar/. ↩︎
  17. PEPFAR. 2023 Country and Regional Operational Plan Guidance and Technical Considerations; Feb. 2023. ↩︎
  18. U.S. Congress. Public Law No: 112-25; Aug. 2, 2011. White House Office of Management and Budget (OMB). OMB Report to the Congress on the Joint Committee Sequestration for Fiscal Year 2013; March 1, 2013. KFF analysis of data from: Congressional appropriations bills and reports; Federal Agency Budget and Congressional Justification documents; ForeignAssistance.gov; KFF personal communication with the Office of Management and Budget. ↩︎
  19. Overall PEPFAR funding technically includes support for bilateral HIV and TB activities, as well as contributions to multilateral organizations (specifically, the Global Fund and UNAIDS). This analysis only focuses on bilateral funding for HIV and contributions to multilateral organizations. ↩︎
  20. UNAIDS is the Joint United Nations Programme on HIV/AIDS, the U.N. system’s coordinating body that serves to help galvanize worldwide attention to AIDS. ↩︎
  21. Totals represent funding specified by Congress for PEPFAR in annual appropriations bills and/or identified by agencies for the Department of State, USAID, CDC, and DoD. In addition, international HIV research activities are supported by the NIH Office of AIDS Research (OAR) through its annual appropriated budget, but these amounts are not considered part of PEPFAR. See KFF's “Breaking Down the U.S. Global Health Budget by Program Area” for additional information. ↩︎
  22. Includes bilateral funding for HIV as well as U.S. contributions to UNAIDS and the Global Fund to Fight AIDS, Tuberculosis and Malaria through regular appropriations. ↩︎
  23. U.S. Congress. Public Law No: 119-75; February 2026. The explanatory statement accompanying the FY 2026 conference agreement notes that the U.S. contribution supports the $4.6 billion U.S. pledge to the eighth replenishment and that the $1.25 billion provided in the agreement is for the first installment of the replenishment. The explanatory statement also states that the “funds shall be contributed to the Global Fund on a quarterly basis to the fullest extent practicable” and that “sufficient unobligated balances [that] exist[ed] from prior Acts to fully fund the first installment of the eighth replenishment and to fulfill the United States pledge for the seventh replenishment” are to be provided in a “timely manner.” ↩︎
  24. KFF analysis of data from the “American Rescue Plan Act of 2021” (P.L. 117-2). ↩︎
  25. U.S. Congress. Public Law No: 108-25; May 27, 2003. U.S. Congress. Public Law No: 110-293; July 30, 2008. U.S. Congress. Public Law No: 113-56; Dec. 2, 2013. U.S. Congress. Public Law No: 115-305; Dec. 11, 2018. U.S. Congress. Public Law No: 118-47; March 23, 2024. ↩︎
  26. Includes funding through regular appropriations and emergency supplemental funding. KFF analysis of data from: Congressional appropriations bills and reports; Federal Agency Budget and Congressional Justification documents; ForeignAssistance.gov; KFF personal communication with the Office of Management and Budget. KFF analysis of data from the “American Rescue Plan Act of 2021” (P.L. 117-2). ↩︎
  27. Congress states that the Global Fund is the multilateral component of PEPFAR in the following: U.S. Congress. Public Law No: 110-293; July 30, 2008. U.S. Congress. Public Law No: 113-56; Dec. 2, 2013. ↩︎
  28. Does not include countries that may have received funding through multi-country or regional programs. Additional countries may be reached through multi-country or regional programs. ↩︎
  29. Of the 52% committed to HIV and HIV/TB programs, 38% was for HIV activities and 14% was for HIV/TB activities. ↩︎
  30. Percentages may not sum due to rounding. In 2020, some donor governments provided COVID-specific emergency contributions to the Global Fund in addition to their contributions to core activities. For the purposes of this fact sheet, these COVID-specific amounts have been excluded as they cannot be attributed to a specific area, such as HIV, TB, or malaria. The Global Fund. Data Explorer; accessed January 2026: https://data.theglobalfund.org/. ↩︎
  31. U.S. Congress. Public Law No: 108-25; May 27, 2003. U.S. Congress. Public Law No: 110-293; July 30, 2008. U.S. Congress. Public Law No: 113-56; Dec. 2, 2013. U.S. Congress. Public Law No: 118-47; March 23, 2024. KFF. PEPFAR Reauthorization: Side-by-Side of Legislation Over Time. ↩︎

Texas Emerges as Focus of New Trump Administration Actions to Limit Gender-Affirming Care 

Author: Lindsey Dawson
Published: May 21, 2026

Since early 2025, the Trump Administration has sought to limit youth access to gender-affirming care, taking a comprehensive approach to impose and enforce limitations. The administration has implemented or initiated dozens of actions with this aim, some of which have been challenged in court. In response to these actions, at least 40 health care institutions have walked back the provision of gender-affirming care over the last year and a half. This attrition has occurred in waves and in direct response to policy making – first following an executive order laying out the administration’s approach to limiting this care in January 2025, and then several times since in response to subpoenas (see below), proposed rulemaking, and a (now vacated) “declaration” from the Secretary of Health and Human Services, among other efforts. Over this period, when providers shut down services, they have generally said they were doing for reasons such “external pressures beyond our control,” “new federal orders targeting such procedures,” and “mounting pressure from the federal government”, not because they had concerns about safety, medical indication, or effectiveness. At times state Attorneys General have pushed providers to reopen or maintain services, stating that failing to do so would put them in potential violation of state non-discrimination laws and some have expressed frustration that pulling back on this care has at times preempted formal policy making. Pressure from the federal government to end care, oppositional pressure from states to provide care, and institutional barriers to providing best practice care, have left clinics and clinicians in a challenging position.

Notably, the most recent actions out of the administration have been concentrated in Texas, even though the state has banned youth access to gender-affirming medical care since 2023. The administration may have  selected Texas as a site to enforce and pursue investigations against providers in an effort to forum shop and force changes within a hospital in a state where the Attorney General has aligned policy priorities. This includes three main actions in just the last couple of weeks, widely seen as intensifying federal efforts to limit this care. The three actions are as follows:

  • On April 30, 2026, the DOJ sought assistance from a federal district court in Texas  in enforcing a subpoena of Rhode Island Hospital (RIH). This request for enforcement stemmed from a July 2025 action where the department issued over 20 civil subpoenas (at least 7 of which have been quashed in court) to providers delivering gender-affirming care to young people, including to RIH. While the hospital does not operate in Texas, DOJ states its investigation of Federal Food, Drug, and Cosmetic Act (FDCA) claims is taking place in the Northern District of Texas in front of Judge Reed O’Connor  without providing a more detailed explanation for the relevance of the venue. The DOJ appears to be especially focused on off-label prescribing of hormonal/puberty blocking prescription medication, a common practice in medicine across medication classes and diagnoses. The FDA regulates drug approval, labeling and manufacturer promotion. However, the FDA does not regulate physicians’ prescribing decisions. This marked the first time the department asked a court to compel compliance with these administrative subpoenas. Within hours of the request for enforcement, and before hearing from RIH, the Texas court ordered RIH to comply within 14 days. RIH appealed to the 5th Circuit Court of Appeals (covering Texas, Louisiana, and Mississippi) and sought a stay which was denied, though the appeal continues.

    In parallel, on May 4, 2026, the Rhode Island Child Advocate, the state official charged with protecting the legal rights of children in state care, asked a  federal district court in Rhode Island  to quash the same subpoena and on May 9th the hospital asked to join as an intervenor (specifically noting it had not had an opportunity to respond to DOJ’s petition in Texas and that the clock to comply with the order was running), which the court granted. RIH filed its own motion to quash on May 11th. On May 13, 2026, the court quashed the subpoena and enjoined DOJ from “seeking, receiving, using, retaining, or disseminating any patient-identifying information or protected health information produced by RIH in response to Administrative Subpoena.” The court also questioned the case’s nexus to Texas. DOJ stated it would comply and appeal to the 1st Circuit Court of Appeals (covering Maine, Massachusetts, Rhode Island, and Puerto Rico), which it filed on May 15th.

    On May 18th the federal district court in Texas demanded that RIH produce the requested documents in just over 24 hours in camera (to be held by the court and not available to DOJ). In response, though they were not a party in the Texas matter, Rhode Island Child Advocate sought an emergency injunction with the 1st Circuit on May 19th , requesting the court order the hospital not to produce documentation (to the Texas district court). The 1st Circuit denied the emergency request that night. At the same time, RIH told the Texas court it planned to comply with the document request and would anonymize and de-identify patient information (though on an extend timeline than that requested by the court). Watching what happens next will require monitoring both district (Texas and Rhode Island) and both appellate (5th and 1st) courts moving forward and teasing out parallel litigation.   
  • On May 6, 2026, the U.S. Attorney’s office in the Northern District of Texas issued grand jury subpoenas to NYU Langone Hospital, and per NYU, other health care institutions. A grand jury summons suggests a criminal investigation, as does the direction to turn requested documents over to the FDA’s Office of Criminal Investigation. This is widely viewed as an escalation over the previous subpoena efforts that were administrative in nature. These subpoenas were issued by the Federal District Court in the Northern District of Texas  less than a week after DOJ efforts to enforce the out of state RIH administrative subpoena in Texas, in the same federal district court (discussed above).

    What is known is based on information released by NYU Langone, first by way of a public statement, and then in making the full subpoena public (and eventually adding it to an updated version of their statement. New York’s Shield Law requires any entity in the state that receives a request for legally protected health information to attempt to notify the individuals to whom that request pertains at least 30 days before complying with it, which may have influenced the hospital’s decision to go public.  The subpoena to NYU included a sweeping demand for document production for the 2020-2026 time period. The documents requested included, for example, personnel files of those associated with provision of or billing for gender-affirming care, billing records and documentation policies, communications and materials with pharmaceutical companies regarding gender-affirming care, the identities of and detailed medical information on patients seen for gender-affirming care, communications related to off-label use of hormones, communications with World Professional Association for Transgender Health (WPATH), among other types of information. The subpoena requests that the produced materials be sent to the FDA Office of Criminal Investigations in the Kansas field office which might suggest an investigation related to the FDCA. 
  • On May 15, 2026, the DOJ announced a “resolution to end pediatric ‘gender-affirming care’ and create [a] detransition clinic” with Texas Children’s Hospital [TCH]. DOJ stated the settlement is part of its “ongoing national investigation into violations of federal law in connection with the provision of sex-rejecting procedures on minors” (their term for gender-affirming care). The release stated TCH “entered into agreements with the Department and the Texas Attorney General that include commitments” not to provide young people with gender-affirming medical care (which is already banned in Texas) and “pay over $10 million in damages and civil penalties” related to “false billing” allegations under the FDCA, the False Claims Act, and federal fraud and conspiracy laws. Additionally, TCH agreed to establish a clinic dedicated to providing detransition-related services, an unusual move that the state and DOJ say are “first-of-its-kind”.In relatively rare cases when someone seeks medical care in detransitioning, they would not need a specialized clinic to do so.Separately, the Texas AG, Ken Paxton, issued his own press release with similar content to the one issued by DOJ except that it additionally notes that as part of the settlement, multiple providers were terminated and had their privileges revoked.

    The DOJ wrote that “the claims resolved by the United States in the settlements are allegations only and there has been no determination of liability. Both entities have denied all allegations.” In a press statement that has since been removed from their website, TCH, wrote that throughout the process with the DOJ and Texas AG they have been “navigating an unconscionable campaign of mistruths and mischaracterizations related to gender affirming care.” The institution writes they have been compliant with all laws and is “settling to protect our resources from endless and costly litigation.” 

The administrative and grand jury subpoenas as well as the settlement DOJ entered into with TCH, especially relating to provider terminations and revocation of privileges, will likely add to the chilling effect already characterizing the provision of gender-affirming care. Additionally, the language used throughout the DOJ documents discussed here could foster misinformation related to gender-affirming medical care (such as referring to it as a “destructive and discredited practice”), which remains recommended for young people who need it.
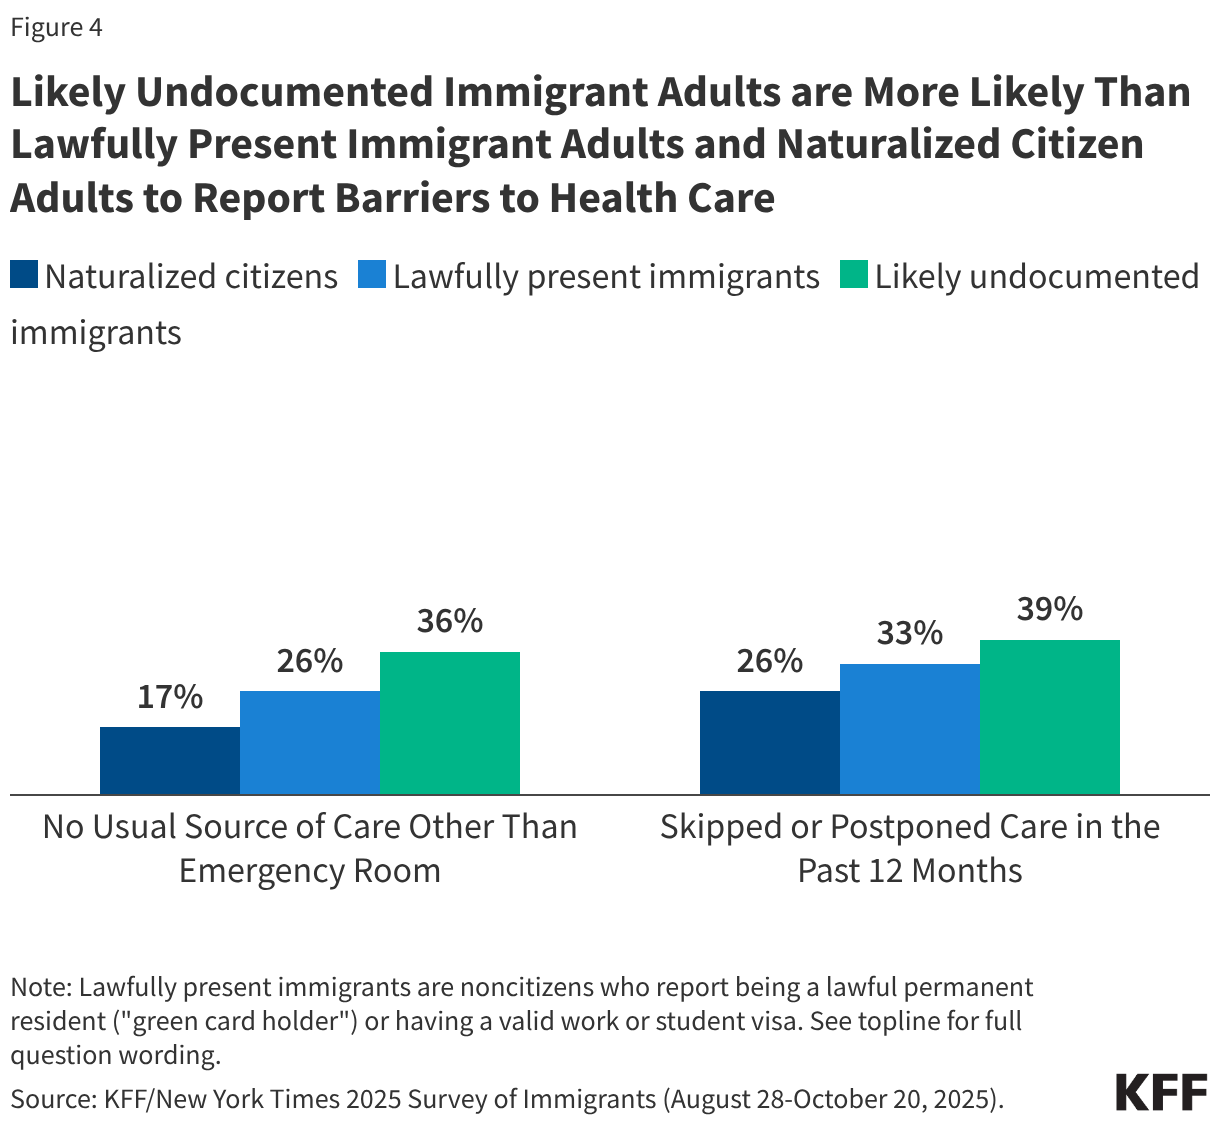
While Texas has banned core gender-affirming medical services for young people since 2023, the Trump administration DOJ has chosen a federal district court in Texas to file its enforcement efforts, and with the help of the Texas Attorney General negotiated a settlement with a Texas hospital, potentially seeing it as a warning to other hospital systems. The Rhode Island federal district court judge who quashed the administrative subpoena offers one theory as to why the lone star state has been in the spotlight, in a generally sternly worded order, accusing DOJ of selecting Texas “in favor of a distant forum that DOJ deems friendly to its political positions.”

Understanding Medicaid Cost Sharing and Policy Changes from the 2025 Reconciliation Law

Published: May 21, 2026

The 2025 reconciliation law makes significant changes to the Medicaid program, including requiring states to impose cost sharing on adults enrolled through the Affordable Care Act (ACA) Medicaid expansion, marking the first time the federal government has required states to impose cost sharing on Medicaid enrollees. Current federal rules allow, but do not require, states to impose cost sharing on certain Medicaid enrollees. In addition, the law creates new eligibility requirements that will affect expansion enrollees, including work requirements and the requirement for states to redetermine eligibility every six months. Together these provisions could create barriers to expansion enrollees maintaining coverage and increase their health care costs.

This brief explains current Medicaid cost sharing rules and changes made to cost sharing rules by the 2025 reconciliation law, reports on cost sharing amounts states currently impose on ACA expansion adults, and highlights literature on the impact of cost sharing. Key takeaways include:

  • As of January 2026, 19 states of the 41 that have adopted the ACA Medicaid expansion charge cost sharing on some services for adults enrolled in the expansion.
  • While current rules generally limit cost sharing to nominal amounts, states can charge higher cost sharing to individuals with income above 100% of the federal poverty level (FPL), which is $27,320 for a family of three. The Medicaid expansion covers people with incomes up to 138% of the poverty level.
  • The 2025 reconciliation law requires states to impose cost sharing of up to $35 per service on adults enrolled in the Medicaid expansion with income between 100% and 138% FPL. CMS guidance may address how much flexibility states have in determining which non-exempt services require cost-sharing and how much states may charge. 
  • Evidence shows that cost sharing is associated with reduced use of care, worse health outcomes and increased financial burden for low-income populations.
  • Nearly half of expansion adults have at least one chronic condition. Medicaid expansion enrollees utilize some services more than traditional Medicaid enrollees, and expansion enrollees who are older or who have multiple chronic conditions are likely to face greater cost sharing burden than younger, healthy enrollees.

Current rules permit, but do not require, states to impose cost sharing on certain populations, within limits designed to protect Medicaid enrollees who have low incomes from high out-of-pocket costs. States have flexibility to impose cost sharing on certain populations. Cost-sharing is generally limited to nominal amounts but may be higher for those with incomes above 100% FPL. Certain populations and services are exempt from cost sharing requirements (Table 1). Total out-of-pocket costs for premiums and cost sharing for all individuals in a Medicaid household are capped at 5% of monthly or quarterly household income. States are required to establish a process for tracking incurred cost sharing that does not rely on enrollee documentation and stops cost sharing once a family meets the cap. States must allow providers to reduce or waive cost sharing for enrollees on a case-by-case basis. A state may allow providers to deny services to enrollees for nonpayment of cost sharing, if the enrollees have a household income above 100% FPL and are not a part of a population exempt from cost sharing except for certain services.

While cost sharing is generally limited to nominal amounts, states can charge higher cost sharing to individuals with income above 100% FPL. The nominal cost sharing amounts for individuals with income up to 100% FPL are specified in regulation and are set at $4 for most outpatient services and preferred drugs, $8 for non-preferred drugs and non-emergency use of the emergency department (ED), and $75 per inpatient stay. These maximum allowable amounts are increased annually by the percentage increase in the medical care component of the Consumer Price Index. For services other than prescription drugs and non-emergency ED use, cost sharing cannot exceed 10% of the cost of the service for individuals in families with incomes from 101-150% FPL and cannot exceed 20% of the cost of the service for individuals in families with incomes above 150% FPL.

States have additional flexibility for imposing cost sharing on non-preferred drugs and non-emergency ED (emergency department) use, including imposing cost sharing for populations otherwise exempt from cost sharing. For prescription drugs, states may impose different cost sharing amounts for preferred and non-preferred drugs and may impose nominal cost sharing for non-preferred drugs on populations otherwise exempt from cost sharing. Preferred drug cost sharing must be applied to non-preferred drugs if the prescribing doctor determines that the preferred drug would not be as effective or would have adverse effects for the individual.

For non-emergency ED use, states may require cost sharing if enrollees are screened by a medical professional to confirm that the care is non-emergency. Enrollees must be notified about the cost sharing charges and provided with the name and location of an available and accessible alternative non-emergency services provider. States may impose cost sharing for non-emergency ED use for individuals otherwise exempt from cost sharing but must limit cost sharing to the maximum amount allowed for individuals with income below 150% FPL. For individuals with income above 150%, there is not a maximum cost sharing amount states may impose. (See Table 1 for full cost sharing rules on prescription drugs and non-emergency ED use.)

Under current rules, states may not charge premiums for Medicaid enrollees with incomes less than 150% FPL. States may charge certain pregnant individuals with premiums of up to 10% of the amount by which their income exceeds 150% FPL. States may also obtain waivers to impose premiums in Medicaid that federal rules do not otherwise allow. 

New Cost Sharing Requirements

The 2025 reconciliation law requires states to impose cost sharing on adults enrolled in the Medicaid expansion with income between 100% and 138% FPL. Starting October 1, 2028, states will be required to impose cost sharing of up to $35 per service on expansion adults with incomes between 100-138% FPL (Table 1). The law maintains existing exemptions of certain services from cost sharing and exempts additional services from cost sharing for this group. It also limits cost sharing for prescription drugs to nominal amounts. States may continue imposing existing cost sharing on other populations, including expansion adults with incomes below 100% FPL under existing rules. CMS guidance may clarify any flexibility states may have in determining whether some or all non-exempt services must require cost-sharing, and what cost sharing amounts are allowable. The reconciliation law does not specify a minimum level of cost-sharing that must be imposed, except that the cost sharing must be greater than $0.

Current Medicaid Cost Sharing Rules and New Cost Sharing Rules for ACA Expansion Enrollees (Table)

Current Cost Sharing Imposed by States

As of January 2026, 19 states that have adopted the ACA Medicaid expansion charge cost sharing on some services for adults enrolled in the expansion. Fourteen of the 19 states impose cost sharing regardless of income while three states impose cost sharing only on expansion adults with income 100%-138% FPL and two states charge cost sharing starting at incomes less than 100% FPL. States most commonly charge cost sharing for prescription drugs (Figure 1). Sixteen states charge cost sharing for preferred brand-name drugs. Fifteen states charge cost sharing for generic drugs and non-preferred brand-name drugs. Most of these states charge the same cost sharing amount for both preferred and non-preferred drugs. Twelve states require a copayment for non-emergency ED and outpatient hospital visits, while ten states charge cost sharing for inpatient hospital visits.

Number of ACA Expansion States Imposing Cost Sharing by Service Type (Bar Chart)

Four states (Delaware, Louisiana, Maryland, and New Hampshire) only impose cost sharing for prescription drugs. One state (Colorado) only imposes cost sharing for non-emergency ED visits. (Full details on cost sharing amounts by service can be found in Appendix Table 1. Data was collected through KFF’s 2026 Medicaid Eligibility, Enrollment, and Renewal Policies Annual Survey.)

While most states limit cost sharing amounts to under $10 per service, four states charge more than $35 for hospital stays. Each of these four states charges more than $35 for inpatient hospital stays. Alaska charges $50 per day up to $200 per discharge; Michigan charges $50 per inpatient stay; Utah charges $75 per stay; and West Virginia charges $75 per stay for enrollees with income above 100% FPL. These states will likely need to reduce these cost sharing amounts to meet the new requirements.

North Carolina has recently enacted legislation that sets all Medicaid copayments at the maximum amount allowable under federal law starting July 1, 2027. This will require North Carolina to increase current cost sharing amounts for certain services (e.g., non-preferred drugs, non-emergency use of ED, and inpatient stays) to the maximum allowable amounts for populations currently subject to cost sharing. When new cost sharing rules for expansion adults go into effect on October 1, 2028, the state will increase cost sharing amounts for most services to $35 for these adults.

Impact of Cost Sharing on Enrollees

Evidence shows that cost sharing is associated with reduced use of care, worse health outcomes and increased financial burden for low-income populations. Cost-sharing results in higher costs and greater financial burden for low-income adults. Studies show that cost-sharing reduces utilization of both medically necessary care, including medications, behavioral health services for Medicaid enrollees with substance use disorders (SUDs) and clinically appropriate cancer screenings, as well as care that may be less necessary. Studies suggest that cost-sharing in older and low-income populations causes higher mortality.

Medicaid expansion enrollees utilize some services more than traditional Medicaid enrollees, and expansion enrollees who are older or who have multiple chronic conditions are likely to face greater cost sharing burden than younger, healthy enrollees. KFF analysis of 2021 Medicaid claims data found that one-third of expansion adults have a chronic physical health condition and a quarter have a chronic behavioral health condition. Likely because of these health conditions, expansion adults were more likely to use prescription drugs and behavioral health treatment compared to other adult Medicaid enrollees. Another KFF analysis of Medicaid utilization patterns estimates that among Medicaid expansion enrollees who used non-exempt services, the average enrollee could pay $542 if states charge $35 on all non-exempt services. Copayments that are required at the point of service have a greater impact on enrollees with higher health care needs who use more services. The analysis further suggests that expansion adults who are older could face cost sharing that is twice as high as younger enrollees and those with multiple chronic conditions could pay up to five times more cost sharing compared to enrollees with no chronic conditions.

Cost Sharing Requirements for Selected Services for ACA Expansion Adults, January 2026 (Table)

Assessing PEPFAR’s Health Spillover Effects Beyond HIV: An Update

Authors: Jennifer Kates, William Crown, Collins Gaba, Monica Jordan, and Allyala Nandakumar
Published: May 20, 2026

This analysis updates earlier work that assessed whether PEPFAR, the U.S. global HIV/AIDS program credited with saving 26 million lives, had health impacts beyond HIV (a companion update looks at economic and educational spillover effects). Specifically, the earlier analysis found that PEPFAR investments were associated with significant improvements in all-cause mortality and maternal and child health measures between 2004 and 2018, positive spillover effects that suggest the program has had a greater impact than for HIV alone; this was the case even though PEPFAR funding has been relatively flat for more than a decade. The current analysis updates these estimates through 2022 to capture additional years of data as well as the potential impact of the COVID-19 pandemic, which more broadly affected health and development. It similarly finds that PEPFAR was associated with continued health gains, especially for mortality outcomes. Moreover, where COVID-19 seems to have had a temporary impact, it did so across all countries, not just those receiving PEPFAR support. These findings suggest that more recent changes to the PEPFAR program by the Trump administration, including significantly scaling back funding and services with plans to further do so in the coming years, could not only have negative impacts on the HIV response, but dampen improvements in other health areas.
PEPFAR, the U.S. global HIV/AIDS program credited with saving 26 million lives, is the largest commitment by any nation to address a single disease. In many countries, PEPFAR funding had accounted for the biggest share of external health investment, often surpassing domestic HIV spending. Numerous studies have documented PEPFAR’s impact on improving HIV outcomes, including reductions in new HIV infections and HIV-related deaths, reversing the epidemic’s trajectory in sub-Saharan Africa.1 In addition, a growing body of research has also found that PEPFAR investments are associated with improvements in other health areas, such as maternal and child health.2 For example, the prior analyses found that PEPFAR was associated with significant reductions in all-cause mortality and maternal and child mortality, and increases in child immunization rates, between 2004 and 2018. The reasons for this impact are multifaceted and, while often thought of as a “vertical” program focused solely on HIV, PEPFAR has invested significantly in country health systems, including the health care workforce, laboratory strengthening, and supply chain development and management. In addition, PEPFAR had increasingly emphasized integration of services, including reaching women where they received prenatal care and sought immunizations and other services for their children. These investments and approach could account for these broader impacts.

The current analysis, done by researchers at KFF and Boston University, updates earlier work to assess whether the spillover effects found between 2004 and 2018 persisted through 2022, to capture additional years of data as well as the potential impact of the COVID-19 pandemic, which more broadly affected health and development. Specifically, the analysis uses a difference-in-difference, quasi-experimental design to analyze the change in the all-cause mortality rate, maternal and child mortality rates, and childhood immunizations in PEPFAR countries and a comparison group of low- and middle-income countries between 2004 and 2022.  Several model specifications were tested. The final model specification controls for numerous baseline variables that could also be expected to influence these health outcomes, which helps to make the non-PEPFAR group more comparable to the PEPFAR group. Still, despite the strengths of the difference-in-difference model design, it is possible that there may be other, unobservable ways in which comparison countries differed from PEPFAR countries, which could account for the results (see Methodology for more detail).

PEPFAR was associated with significantly lower mortality during the 2004 to 2022 period.

  • Prior to the initiation of PEPFAR, all-cause mortality rates were higher in PEPFAR than in comparison countries. Once PEPFAR began, there was a much more rapid decline in mortality in PEPFAR countries, with the average all-cause mortality rate converging with that of comparison countries over time. While there was a substantial uptick during COVID-19, this occurred in both sets of countries (see Figure 1).
  • Moreover, the difference-in-difference analysis finds that PEPFAR investments were associated with an all-cause mortality rate that was 2.5 deaths per 1,000 lower, on average, than would have been expected in the absence of PEPFAR — a 23.4% reduction relative to the 2004 baseline (see Figure 2 and Tables 5-6).
  • The estimated effects were larger in PEPFAR’s “COP” countries, those that engaged in more intensive planning and programming, and also generally had greater PEPFAR investments.3[i] In COP countries, the reduction was 28.0% relative to the 2004 baseline (see Tables 5-6).
Line chart comparing all-cause mortality rates per 1,000 people from 1990 to 2022 between PEPFAR countries and comparison countries. Mortality rates in PEPFAR countries start higher at about 12 deaths per 1,000 in 1990 and steadily decline after 2004, when PEPFAR funding began, reaching near 8 deaths per 1,000 by 2022. Comparison countries show a relatively stable mortality rate around 8 deaths per 1,000 throughout the period. The chart highlights a notable decline in mortality rates in PEPFAR countries after the program's start, converging with comparison countries by 2022.

PEPFAR was associated with even larger reductions in both maternal and child mortality over the period.

  • Maternal and child mortality rates were significantly higher in PEPFAR countries than comparison countries before the start of the program. While their decline accelerated after PEPFAR began, they remained higher over the period. There was some uptick in maternal mortality rates during COVID-19 in both sets of countries (see Figures 3-4).
  • As with all-cause mortality rates, PEPFAR investments were associated with significant reductions in both maternal and child mortality, reducing them further than what would have been expected without PEPFAR. Specifically, PEPFAR was associated with a maternal mortality ratio that was 119.1 deaths per 100,000 live births lower than would have been expected without PEPFAR — a 29.1% reduction relative to the 2004 baseline — and a child mortality rate that was 30 deaths per 1,000 live births lower, a 38.0% reduction (see Figure 1 and Tables 5-6).
  • These effects were stronger in COP countries. In these countries, maternal mortality was 31.3% lower and child mortality 40.3% lower, relative to the baseline. (see Tables 5-6).
Bar chart showing estimated percent change in mortality associated with PEPFAR investments from 2004 to 2022 relative to 2004 baseline. All-cause mortality decreased by 23.4%, maternal mortality decreased by 29.1%, and child mortality decreased by 38.0%. The data indicate significant reductions in mortality rates linked to PEPFAR investments.
Line chart comparing maternal mortality rates per 100,000 live births from 2000 to 2022 between PEPFAR countries and comparison countries. The PEPFAR group starts with a higher mortality rate around 460 in 2000, which steadily declines to about 210 by 2022. The comparison countries start near 110 in 2000 and show a slight decline to around 60 by 2022. The start of PEPFAR funding in 2004 is marked, after which the PEPFAR countries show a consistent downward trend in maternal mortality.
Line chart comparing child mortality rates per 1,000 live births from 1990 to 2022 between PEPFAR-supported countries and comparison countries. Both groups show a decline in child mortality rates over time. PEPFAR countries start with a higher rate around 115 in 1990, decreasing to about 40 by 2022. Comparison countries start near 45 in 1990, declining to about 18 by 2022. The start of PEPFAR funding in 2004 is marked, after which the child mortality rate in PEPFAR countries continues to decline but remains higher than in comparison countries.

In addition, PEPFAR was associated with significant increases in childhood immunization rates.

  • Immunization coverage increased in PEPFAR countries over time approaching coverage levels in comparison countries for measles, DPT, and hepatitis B and converging for the share of newborns protected from tetanus because their mothers were immunized. Coverage rates for measles, DPT, and hepatitis B fell slightly during COVID-19 in both PEPFAR and comparison countries (see Figures 5-8).
  • PEPFAR investments were associated with improvements in immunization coverage rates for all measures compared to what would have been expected without PEPFAR, including measles coverage that was 7 percentage points higher (or a 9% increase relative to the baseline), DPT coverage 8.9 percentage points higher (11.4% increase), and Hepatitis B vaccine coverage of 6.4 percentage points higher (8.1% increase). In addition, the share of newborns protected against tetanus was 5 percentage points higher (6.6%). As with the above measures, these effects were stronger in COP countries (See Figure 9 and Tables 5-6).

Finally, for most outcomes, PEPFAR investments were associated with incremental improvements in each successive phase of the program.

  • In each successive phase of the program, corresponding to its different authorization periods, PEPFAR investments continued to be associated with improvements in most outcomes (with the exception of newborn tetanus protection; in addition, other immunization measures did not see incremental improvement in the most recent phase). The greatest incremental improvements were in the first five years of the program, which also marked a significant influx of new funding; PEPFAR funding plateaued after that which may explain the smaller gains in later years. Incremental improvements were largest for the three mortality measures (see Table 7).

Taken together, these findings provide continued evidence of PEPFAR’s knock-on effects for health beyond HIV alone, suggesting that such investments have yielded bigger dividends and served as a wider platform. These findings also suggest that more recent changes made to the PEPFAR program by the Trump administration, including significantly scaling back funding and services with plans to further do so in the coming years, could not only have negative impacts on the HIV response, they could also dampen improvements in these other health areas.

Line chart comparing measles immunization rates from 1990 to 2022 between PEPFAR-supported countries and comparison countries. The vertical axis shows measles immunization percentage from 0% to 100%. The horizontal axis shows years from 1990 to 2022. The chart highlights the start of PEPFAR funding in 2004. Before 2004, PEPFAR countries had immunization rates around 65% to 75%, while comparison countries were higher, around 82% to 88%. After 2004, immunization rates in PEPFAR countries steadily increased, reaching about 85% by 2014 and then slightly declining to around 78% by 2022. Comparison countries maintained higher rates, fluctuating near 85% to 90%, with a slight decline after 2018. Overall, PEPFAR countries showed notable improvement in measles immunization after 2004 but remained below comparison countries throughout the period.
Line chart comparing DPT immunization rates from 1990 to 2022 between PEPFAR-supported countries and comparison countries. The vertical axis shows DPT immunization percentage from 0% to 100%, and the horizontal axis shows years. PEPFAR countries start around 68% in 1990, gradually increasing to about 82% by 2022. Comparison countries start higher at about 85%, rising slightly to around 90% by 2004, then remaining stable near 88-90%. The start of PEPFAR funding in 2004 is marked, after which PEPFAR countries show a steady increase in immunization rates, narrowing the gap with comparison countries.
Line chart comparing hepatitis B immunization rates from 1990 to 2022 between PEPFAR-supported countries and comparison countries. The vertical axis shows immunization percentage from 0 to 100%. The horizontal axis shows years from 1990 to 2022. Immunization rates in PEPFAR countries start around 20% in 1990, dip in the early 1990s, then steadily increase to about 80% by 2022. Comparison countries start higher near 65% in 1990 and rise to around 85% by 2004, remaining relatively stable through 2022. A vertical line marks the start of PEPFAR funding in 2004. After 2004, immunization rates in PEPFAR countries continue to rise and narrow the gap with comparison countries. The chart highlights progress in hepatitis B immunization in PEPFAR countries following the start of funding.
Line chart comparing the percentage of newborns protected against tetanus through HepB immunization in PEPFAR and comparison countries from 1990 to 2022. Both groups show an upward trend in immunization rates, starting around 50% for PEPFAR and 60% for comparison countries in 1990. PEPFAR rates steadily increase, surpassing comparison countries around 2006, shortly after PEPFAR funding began in 2004. By 2022, both groups reach about 88% immunization. The chart highlights the convergence and improvement in newborn tetanus protection over time.
Bar chart showing estimated percent changes in childhood immunizations associated with PEPFAR investments from 2004 to 2022, relative to the 2004 baseline. The chart compares four immunizations: measles increased by 9.0%, DPT by 11.4%, HepB by 8.1%, and newborn tetanus protection by 6.6%. The data indicate positive effects of PEPFAR on vaccination rates, with DPT showing the highest increase.

Jen Kates is with KFF. William Crown, Collins Gaba, Monica Jordan and Allyala Nandakumar are with Boston University.

A difference-in-difference, quasi-experimental design was used to estimate a “treatment effect” (PEPFAR), based on comparison to a control group (the counterfactual). The difference-in-difference design compares the before and after change in outcomes for the treatment group to the before and after change in outcomes for the comparison group. The outcomes of interest, their definitions and sources are listed in Table 1. Baseline variables are listed in Table 2. The panel data set of 157 low- and middle- income countries used in the prior analysis, covering 1990 to 2018, was updated to include data through 2022 (due to data limitations, the time trend for maternal mortality began in 2000). COVID-related funding was not included. All values were adjusted to constant 2022 dollars.

The PEPFAR group included 90 countries that had received PEPFAR support over the period. The comparison group included 67 low- and middle- income countries that had not received any PEPFAR support or had received minimal PEPFAR support (<$1M over the period or <$.05 per capita) between 2004 and 2022.  Data on PEPFAR spending by country were obtained from the U.S. government’s https://foreignassistance.gov/ database and represent U.S. fiscal year disbursements. Data on mortality rates were obtained from the World Bank’s World Development Indicators (WDI) (https://datatopics.worldbank.org/world-development-indicators/.  Several different model specifications were explored. Each specification controlled for numerous baseline variables, compared to an unadjusted model, variables which may be expected to influence the outcomes of interest and which help make the comparison group more comparable to the PEPFAR group.

Table 3 provides the model specifications tested in the updated analysis. Each model specification produced similar, statistically significant results. All models were also run with and without China and India, the two most populous countries in the world, to assess whether they were influencing the results. In both cases, PEPFAR’s impact was still significant and results were similar. The final reported results are from model specification 3. The pre-intervention period for this model started in 2002. Almost all results were significant at the p<0.001 level; one result was significant at the p<0.01 level and one at the p<0.05 level. Table 4 provides the mean values for baseline outcomes and Tables 5-6 provide model results. The Table 5 difference-in-difference estimates should be interpreted as the unit change (e.g., in number of deaths per 1,000) in the outcome associated with PEPFAR. The Table 6 estimates should be interpreted as the percent change in the outcome, relative to the baseline, associated with PEPFAR.

Despite the strengths of the difference-in-difference design, there are limitations to this approach. While the models adjusted for numerous baseline factors that could be correlated with the outcomes of interest, there may be other, unobservable factors not captured. Similarly, while baseline factors are also intended to adjust for selection bias, and make the PEPFAR and comparison groups more similar, there may be other ways in which comparison countries differed from PEPFAR countries (and factors which influenced which countries received PEPFAR support), which could bias the estimates. Recent, published research, based on the earlier 2004-2018 period, examined several other model specifications as well as double log transformations for each model. The results were similar across all models, adding to the confidence of the analytic approach used here.4 Another analysis, under review for publication, conducted additional robustness tests and found consistent results.5

Table 1: Outcome Variables
VariableData Source
1. Crude death rateAll causes per 1,000 population
2. Child mortality rateProbability of a child dying between birth and 5 years of age per 1,000 live births
3. Maternal mortality ratioNumber of women who die from pregnancy-related causes while pregnant or within 42 days of pregnancy termination per 100,000 live births
4. Measles immunization Percent of children ages 12-23 months who received the measles vaccination
5. DPT immunizations Percent of children ages 12-23 months who received DPT vaccinations (3 doses)
6. Hepatitis B immunizations Percent of children ages 12-23 months who received hepatitis B vaccinations (3 doses)
 
7. Newborns protected against tetanusPercentage of births by women of child-bearing age who are immunized against tetanus
Source:  World Bank, WDI, https://datatopics.worldbank.org/world-development-indicators/
Table 2: Baseline Variables
VariableData Source
1. Gross Domestic Product (GDP) per capita (current USD)World Bank Development Indicators
2. Recipient of U.S. HIV funding prior to 2004 (dummy variable)https://foreignassistance.gov/
 
3. Total populationUnited Nations, Department of Economic and Social Affairs, Population Division
4. Life expectancy at birth (years)World Bank Development Indicators
5. Total fertility rate (births per woman)World Bank Development Indicators
6. Percent urban population (of total population)World Bank Development Indicators
7. School enrollment, secondary (% gross)World Bank Development Indicators
8. World Bank country income classificationWorld Bank
9. HIV prevalence (% of population ages 15-49)World Bank Development Indicators. To address missing values in some cases, additional data were obtained from the Global Burden of Disease Collaborative Network
10. Per capita donor spending on health (non-PEPFAR) (constant $)OECD Creditor Reporting System database
 
11. Per capita domestic health spending, government and private, PPP (current $)World Bank Development Indicators
12. Measles prevalence in under 5 population (measles immunization models only)IHME, http://ghdx.healthdata.org/gbd-results-tool
13. Diphtheria prevalence in under 5 population (DPT immunization models only)IHME, http://ghdx.healthdata.org/gbd-results-tool
14. Whooping cough prevalence 15. in under 5 population (DPT immunization models only)IHME, http://ghdx.healthdata.org/gbd-results-tool
15. Tetanus prevalence in under 5 population (DPT immunization models only)IHME, http://ghdx.healthdata.org/gbd-results-tool
16. Hepatitis B prevalence in under 5 population (Hepatitis B immunization models only)IHME, http://ghdx.healthdata.org/gbd-results-tool
Table 3: Model Specifications
1. Unadjusted model
2. Includes baseline variables 1-9 (and an additional baseline variable for disease incidence, 12-16, depending on outcome measure)
3. Includes baseline variables 1-11 (and an additional baseline variable for disease incidence, 12-16, depending on outcome measure)
Table 4: Baseline Mean Outcome Values, 2004
OutcomeAll PEPFAR CountriesPEPFAR COP Countries
All-cause mortality rate10.512.6
Maternal mortality ratio409.8497.5
Child mortality rate78.997.9
Measles immunization percent77.574.5
DPT immunization percent78.074.2
Hepatitis B immunization percent79.174.4
Prevalence of newborns protected against tetanus75.775.6
Table 5: Difference-in-Difference Estimates Associated with PEPFAR, 2004-2022 (standard errors in parentheses)
OutcomeAll PEPFAR CountriesPEPFAR COP Countries
All-cause mortality rate-2.452***-3.523***
 (0.171)(0.235)
Maternal mortality ratio-119.1***-155.9***
 (14.618)(19.101)
Child mortality rate-30.02***-39.48***
 (1.329)(1.979)
Measles immunization percent7.004***7.795***
 (0.678)(0.956)
DPT immunization percent8.871***9.022***
 (0.626)(0.880)
Hepatitis B immunization percent6.435**13.67***
 (2.133)(2.915)
Prevalence of newborns protected against tetanus4.962***3.303*
 (1.299)(1.495)
***p < 0.001   **p < 0.01 *p < 0.05
Table 6: Estimated Percent Change Associated with PEPFAR, 2004-2022 (Relative to 2004 Baseline)
OutcomeAll PEPFAR CountriesPEPFAR COP Countries
All-cause mortality rate-23.4%***-28.0%***
Maternal mortality ratio-29.1%***-31.3%***
Child mortality rate-38.0%***-40.3%***
Measles immunization percent9.0%***10.5%***
DPT immunization percent11.4%***12.2%***
Hepatitis B immunization percent8.1%**18.4%***
Prevalence of newborns protected against tetanus6.6%***4.4%*
***p < 0.001   **p < 0.01 *p < 0.05
Table 7: Estimated Incremental Percent Change Associated with PEPFAR by Time Period (Relative to 2004 Baseline)
Outcome2004 – 20082009 – 20132014 – 20182019 – 2022
All-cause mortality rate-9.8%-5.7%-5.0%-2.8%
Maternal mortality ratio-14.2%-6.3%-4.1%-4.5%
Child mortality rate-22.0%-7.0%-5.7%-3.3%
Measles immunization percent5.3%2.4%1.2%0.1%
DPT immunization percent7.9%2.3%1.1%0.1%
Hepatitis B immunization percent6.8%0.6%1.0%-0.3%
Prevalence of newborns protected against tetanus9.0%-1.3%-0.8%-0.4%
  1. Eran Bendavid E, Bhattacharya J. The President’s Emergency Plan for AIDS Relief in Africa: An Evaluation of Outcomes. Ann Intern Med. 2009;150:688-695. Available at: https://www.acpjournals.org/doi/10.7326/0003-4819-150-10-200905190-00117?url_ver=Z39.88-2003&rfr_id=ori%3Arid%3Acrossref.org&rfr_dat=cr_pub%3Dpubmed&; Bendavid E, Holmes CB, Bhattacharya J, Miller G. HIV Development Assistance and Adult Mortality in Africa. JAMA. 2012;307(19):2060–2067. Available at: https://jamanetwork.com/journals/jama/fullarticle/1157487; IOM (Institute of Medicine). 2013. Evaluation of PEPFAR. Washington, DC: The National Academies Press. Available at: https://www.ncbi.nlm.nih.gov/books/NBK207013/; Wagner Z, Barofsky J, Sood N. PEPFAR Funding Associated With An Increase In Employment Among Males in Ten Sub-Saharan African Countries. Health Aff (Millwood). 2015;34(6):946-953. Available at: https://www.ncbi.nlm.nih.gov/pmc/articles/PMC4782769/; and Daschle T, Frist B. Building Prosperity, Stability, and Security Through Strategic Health Diplomacy: A Study of 15 Years of PEPFAR. Bipartisan Policy Center, Washington DC, 2018. Available at: https://bipartisanpolicy.org/download/?file=/wp-content/uploads/2019/03/Building-Prosperity-Stability-and-Security-Through-Strategic-Health-Diplomacy-A-Study-of-15-Years-of-PEPFAR.pdf; Chun HM, Dirlikov E, Cox MH, et al. Vital Signs: Progress Toward Eliminating HIV as a Global Public Health Threat Through Scale-Up of Antiretroviral Therapy and Health System Strengthening Supported by the U.S. President’s Emergency Plan for AIDS Relief — Worldwide, 2004–2022. MMWR Morb Mortal Wkly Rep 2023;72:317–324. Available at: https://www.cdc.gov/mmwr/volumes/72/wr/mm7212e1.htm?s_cid=mm7212e1_w#suggestedcitation; Gaumer G, Luan Y, Hariharan D, Crown W, Kates J, Jordan M, et al. “Assessing the impact of the president’s emergency plan for AIDS relief on all-cause mortality”. PLOS Glob Public Health 2024; 4(1): e0002467. Available at: https://pmc.ncbi.nlm.nih.gov/articles/PMC10796053/. ↩︎
  2. “The Future of Investment In PEPFAR: Understanding PEPFAR’s Multiple Economic, Health, And Diplomatic Impacts”, Health Affairs Blog, April 17, 2017. Available at: https://www.healthaffairs.org/content/forefront/future-investment-pepfar-understanding-pepfar-s-multiple-economic-health-and-diplomatic; Crown W, Hariharan D, Kates J, Gaumer G, Jordan M, Hurley C, et al. “Analysis of economic and educational spillover effects in PEPFAR countries.” PLoS ONE 2023; 18(12): e0289909. Available at: https://journals.plos.org/plosone/article?id=10.1371/journal.pone.0289909;  ; Gaumer G, Crown WH, Kates J, et al. “Analysis of maternal and child health spillover effects in PEPFAR countries.” BMJ Open 2023;13: e070221. Available at: https://bmjopen.bmj.com/content/13/12/e070221.long. ↩︎
  3. Historically, a subset of countries receiving PEPFAR support had been required to prepare annual Country Operational Plans (COPs) which documented annual funding levels linked to results and served as budget and tracking tools. These were prepared by country teams who worked intensively to develop these plans in concert with headquarters at the State Department. ↩︎
  4. Gaumer G, Luan Y, Hariharan D, Crown W, Kates J, Jordan M, Hurley CL, Nandakumar A. “Assessing the impact of the president’s emergency plan for AIDS relief on all-cause mortality”. PLOS Glob Public Health. 2024 Jan 18;4(1):e0002467. doi: 10.1371/journal.pgph.0002467; Gaumer G, Crown WH, Kates J, Luan Y, Hariharan D, Jordan M, Hurley CL, Nandakumar A. “Analysis of maternal and child health spillover effects in PEPFAR countries”. BMJ Open. 2023 Dec 21;13(12):e070221. doi: 10.1136/bmjopen-2022-070221. ↩︎
  5. Crown W, Stenoien D, Reid MJA, Kumar S, Kates J, Jordan M, Nandakumar A. “The Economic Impact of Lives Saved in PEPFAR Countries”, under review BMJ Global Health. https://doi.org/10.12688/verixiv.2057.1 ↩︎

Assessing PEPFAR’s Economic and Educational Spillover Effects: An Update

Authors: William Crown, Jennifer Kates, Deborah Stenoien, and Allyala Nandakumar
Published: May 20, 2026

This analysis updates earlier work that assessed whether PEPFAR, the U.S. global HIV/AIDS program credited with saving 26 million lives, had impacts beyond health (a companion update looks at broader health spillover effects). Specifically, the earlier analysis found that PEPFAR investments were associated with a significant increase in the GDP per capita growth rate and reductions in the shares of girls and boys who were out of school between 2004 and 2018, positive spillover effects that suggest the program has had a greater impact beyond health alone; this was the case even though PEPFAR funding has been relatively flat for more than a decade. The current analysis updates these estimates through 2022 both to capture additional years of data as well as the potential impact of the COVID-19 pandemic, which severely affected the global economy and resulted in widespread school closures. It similarly finds that PEPFAR was associated with continued improvement in these non-health indicators. These findings suggest that more recent changes to the PEPFAR program by the Trump administration, including significantly scaling back funding and services with plans to further do so in the coming years, could not only have negative impacts on the HIV response, but dampen improvements beyond health.

PEPFAR, the U.S. global HIV/AIDS program credited with saving 26 million lives, is the largest commitment by any nation to address a single disease. In many countries, PEPFAR funding had accounted for the biggest share of external health investment, often surpassing domestic HIV spending. Numerous studies have documented PEPFAR’s impact on improving HIV outcomes, including reductions in new HIV infections and HIV-related deaths, reversing the epidemic’s impact in sub-Saharan Africa.1 In addition, a growing body of research has also found that PEPFAR investments are associated with improvements in other health areas, such as maternal and child health and outbreak response.2 Research has also examined the relationship between PEPFAR and non-health benefits, such as to the economy and educational sectors. For example, the prior analysis found that PEPFAR was associated with a significant increase in the GDP per capita growth rate and reductions in the shares of girls and boys who were out of school between 2004 and 2018. The reasons for this impact are multifaceted and although PEPFAR is a health program, its investments have led to significant reductions in mortality and greater life expectancy, which are generally associated with economic growth and other benefits. External aid also acts as an economic stimulus in countries.3
 
The current analysis, done by researchers at KFF and Boston University, updates earlier work to assess whether the spillover effects found between 2004 and 2018 persisted through 2022, to capture additional years of data as well as the potential impact of the COVID-19 pandemic, which severely disrupted the global economy and resulted in widespread school closures.  Specifically, the analysis uses a difference-in-difference, quasi-experimental design to analyze the change in the GDP per capita growth rate and the  shares of girls and boys of primary school age who were out of school in PEPFAR countries and a comparison group of low- and middle-income countries between 2004 and 2022. Several model specifications were tested. The final model specification controls for numerous baseline variables that could also be expected to influence these outcomes, which helps to make the non-PEPFAR group more comparable to the PEPFAR group. Still, despite the strengths of the difference-in-difference model design, it is possible that there may be other, unobservable ways in which comparison countries differed from PEPFAR countries, which could account for the results (see Methodology for more details).

PEPFAR was associated with a significantly higher GDP per capita growth rate during the 2004 to 2022 period.

  • Prior to PEPFAR’s initiation, the GDP per capita growth rate was generally higher in comparison countries than PEPFAR countries, although there was some volatility in both.4 The rate in PEPFAR countries accelerated particularly after program’s initiation and until the 2008 global financial crisis, when it dropped in both sets of countries; however, this drop was more pronounced in comparison countries, where it was briefly negative. Similarly, during COVID-19, the GDP per capita growth rate was negative in both PEPFAR and comparison countries, but more so in comparison countries. (see Figure 1).
  • The difference-in-difference analysis finds that PEPFAR investments were associated with an annual GDP per capita growth rate 1.98 percentage points higher than what would have been expected without the program. While it is possible that the broad economic shocks of 2008 and 2020 affected PEPFAR and comparison countries differently, the model is designed to control for this possibility, supporting the finding that PEPFAR itself was associated with the outcome of interest (see Figure 2 and Tables 5-6).
  • These estimated effects were even larger in PEPFAR “COP” countries, those that engaged in more intensive planning and programming.5 In COP countries, PEPFAR was associated with an annual GDP per capita growth rate 2.41 percentage points higher (see Tables 5-6).

PEPFAR was also associated with significant declines in the shares of girls and boys of primary school age who were out-of-school over the period.

  • Before PEPFAR, the shares of girls and boys who were out-of-school were higher in PEPFAR than in comparison countries. While they had begun to drop in PEPFAR countries, the drop accelerated after the introduction of the program, moving closer to comparison countries. There was a slight uptick in both sets of countries during COVID-19, a period marked by widespread school closures. (see Figures 3-4).
  • The analysis finds that the share of primary school-age girls who were out of school was 9.37 percentage points lower than would have been expected without PEPFAR (a 43.3% decline relative to the 2004 baseline). The percentage point decline for boys was 8.14 (a 44.1% decline (see Figures 5-6 and Tables 5-6).  
  • The estimated effects were larger in COP countries (57.9% for girls and 63.7% for boys relative to the baseline) (see Tables 5-6).

Finally, PEPFAR investments were associated with incremental improvements in most outcomes in each successive phase of the program.

  • In each successive phase of the program, corresponding to its different authorization periods, PEPFAR investments continued to be associated with improvements in most outcomes; the only exception was the GDP per capita growth rate in the most recent period. The greatest incremental improvements were in the first five years of the program, which also marked a significant influx of new funding; PEPFAR funding plateaued after that which may explain the smaller incremental gains in later years (see Table 7). 

Taken together, these findings provide continued evidence of PEPFAR’s knock-on effects beyond health alone. This is supported by numerous other studies that have found that health investments generally are correlated with educational attainment and economic growth, including, for example, by enabling children to stay in school longer and by supporting adults to join and/or remain in the labor force.These findings also suggestthat more recent changes made to the PEPFAR program by the Trump administration, including significantly scaling back funding and services with plans to further do so in the coming years, could not only have negative impacts on the HIV response, they could also dampen economic and educational gains beyond health.

Jen Kates is with KFF. William Crown, Deborah Stenoien, and Allyala Nandakumar are with Boston University.

A difference-in-difference, quasi-experimental design was used to estimate a “treatment effect” (PEPFAR), based on comparison to a control group (the counterfactual). The difference-in-difference design compares the before and after change in outcomes for the treatment group to the before and after change in outcomes for the comparison group. The outcomes of interest, their definitions and sources are listed in Table 1. Baseline variables are listed in Table 2. The panel data set of 157 low- and middle- income countries used in the prior analysis, covering 1990 to 2018, was updated to include data through 2022. COVID-related funding was not included. All values were adjusted to constant 2022 dollars. 

The PEPFAR group included 90 countries that had received PEPFAR support over the period. The comparison group included 67 low- and middle- income countries that had not received any PEPFAR support or had received minimal PEPFAR support (<$1M over the period or <$.05 per capita) between 2004 and 2022. Data on PEPFAR spending by country were obtained from the U.S. government’s https://foreignassistance.gov/ database and represent U.S. fiscal year disbursements. Data for other indicators were obtained from the World Bank’s World Development Indicator database (WDI) (https://datatopics.worldbank.org/world-development-indicators/, unless otherwise noted. Several different model specifications were explored. Each specification controlled for numerous baseline variables, compared to an unadjusted model, variables which may be expected to influence the outcomes of interest and which help make the comparison group more comparable to the PEPFAR group.

Table 3 provides the model specifications used in the updated analysis. Each model specification produced similar, statistically significant results. All models were also run with and without China and India, the two most populous countries in the world, to assess whether they were influencing the results. In both cases, PEPFAR’s impact was still significant and results were similar. The final reported results are from model specification 3. The pre-intervention period for this model started in 2002. All results were significant at the p<0.001 level. Table 4 provides the mean values for baseline outcomes and Tables 5-6 provide model results. The Table 5 difference-in-difference estimates should be interpreted as the unit change (e.g., percentage point change in the GDP per capita growth rate) in the outcome associated with PEPFAR. The Table 6 estimates should be interpreted as the percent change in the outcome, relative to the baseline, associated with PEPFAR. 

Despite the strengths of the difference-in-difference design, there are limitations to this approach. While the models adjusted for numerous baseline factors that could be correlated with the outcomes of interest, there may be other, unobservable factors not captured. Similarly, while baseline factors are also intended to adjust for selection bias, and make the PEPFAR and comparison groups more similar, there may be other ways in which comparison countries differed from PEPFAR countries (and factors which influenced which countries received PEPFAR support), which could bias the estimates. A recent published research article, based on the earlier 2004-2018 period, tested multiple model specifications and conducted sensitivity analyses. The results were similar across all models, adding to the confidence of the analytic approach used here. At the same time, there were some tests that indicated that the parallel trends assumption was not supported in all cases, warranting further analysis.6 Another recent analysis, under review for publication, conducted additional robustness tests and found consistent results.7

Table 1: Outcome Variables
VariableData Source
1. GDP per capita growth (annual %)Annual percentage growth rate of GDP per capita based on constant local currency. GDP per capita is gross domestic product divided by midyear population.
2. Children out of school, female (% of female primary school age)Percentage of female primary-school-age children who are not enrolled in primary or secondary school.
3. Children out of school, male (% of male primary school age)Percentage of male primary-school-age children who are not enrolled in primary or secondary school.
Source:  World Bank, WDI, https://datatopics.worldbank.org/world-development-indicators/
Table 2: Baseline Variables
VariableData Source
1. Gross Domestic Product (GDP) per capita (current USD)World Bank Development Indicators
2. Recipient of U.S. HIV funding prior to 2004 (dummy variable)https://foreignassistance.gov/
 
3. Total populationUnited Nations, Department of Economic and Social Affairs, Population Division
4. Life expectancy at birth (years)World Bank Development Indicators
5. Total fertility rate (births per woman)World Bank Development Indicators
6. Percent urban population (of total population)World Bank Development Indicators
7. School enrollment, secondary (% gross)World Bank Development Indicators
8. World Bank country income classificationWorld Bank
9. HIV prevalence (% of population ages 15-49)World Bank Development Indicators
To address missing values in some cases, additional data were obtained from the Global Burden of Disease Collaborative Network
10. Per capita donor spending on health (non-PEPFAR) (constant $)OECD Creditor Reporting System database
 
11. Per capita domestic health spending, government and private, PPP (current $)World Bank Development Indicators
Table 3: Model Specifications
1. Unadjusted model
2. Includes baseline variables 1-9
3. Includes baseline variables 1-11
Table 4: Baseline Mean Outcome Values, 2004
OutcomeAll PEPFAR CountriesPEPFAR COP Countries
GDP per capita growth rate (% change)4.54.1
Primary School-Age Girls Out of School (%)21.721.3
Primary School-Age Boys Out of School (%)18.519.2
Table 5: Difference-in-Difference Estimates Associated with PEPFAR, 2004-2022
(standard errors in parentheses)
OutcomeAll PEPFAR CountriesP Countries
GDP per capita growth rate (% change)1.9772.410
 (0.449)(0.653)
Primary School-Age Girls Out of School (%)-9.374-12.31
 (1.077)(1.223)
Primary School-Age Boys Out of School (%)-8.140-12.19
 (0.961)(1.089)
All results significant at p < 0.001
Table 6: Estimated Percent Change Associated with PEPFAR, 2004-2022 (Relative to 2004 Baseline)
OutcomeAll PEPFAR CountriesPEPFAR COP Countries
GDP per capita growth rate (% change)43.5%59.2%
Primary School-Age Girls Out of School (%)-43.3%-57.9%
Primary School-Age Boys Out of School (%)-44.1%-63.7%
All results significant at p < 0.001
Table 7: Estimated Incremental Percent Change Associated with PEPFAR by Time Period (Relative to 2004 Baseline)
Outcome2004-20082009-20132014-20182019-2022
GDP per capita growth rate (% change)19.3%21.6%4.7%-2.1%
Primary School-Age Girls Out of School (%)-30.9%-7.0%-4.5%-0.9%
Primary School-Age Boys Out of School (%)-30.7%-8.2%-4.3%-1.0%
  1. Eran Bendavid E, Bhattacharya J. The President’s Emergency Plan for AIDS Relief in Africa: An Evaluation of Outcomes. Ann Intern Med. 2009;150:688-695. Available at: https://www.acpjournals.org/doi/10.7326/0003-4819-150-10-200905190-00117?url_ver=Z39.88-2003&rfr_id=ori%3Arid%3Acrossref.org&rfr_dat=cr_pub%3Dpubmed&; Bendavid E, Holmes CB, Bhattacharya J, Miller G. HIV Development Assistance and Adult Mortality in Africa. JAMA. 2012;307(19):2060–2067. Available at: https://jamanetwork.com/journals/jama/fullarticle/1157487; IOM (Institute of Medicine). 2013. Evaluation of PEPFAR. Washington, DC: The National Academies Press. Available at: https://www.ncbi.nlm.nih.gov/books/NBK207013/; Wagner Z, Barofsky J, Sood N. PEPFAR Funding Associated With An Increase In Employment Among Males in Ten Sub-Saharan African Countries. Health Aff (Millwood). 2015;34(6):946-953. Available at: https://www.ncbi.nlm.nih.gov/pmc/articles/PMC4782769/; and Daschle T, Frist B. Building Prosperity, Stability, and Security Through Strategic Health Diplomacy: A Study of 15 Years of PEPFAR. Bipartisan Policy Center, Washington DC, 2018. Available at: https://bipartisanpolicy.org/download/?file=/wp-content/uploads/2019/03/Building-Prosperity-Stability-and-Security-Through-Strategic-Health-Diplomacy-A-Study-of-15-Years-of-PEPFAR.pdf; Chun HM, Dirlikov E, Cox MH, et al. Vital Signs: Progress Toward Eliminating HIV as a Global Public Health Threat Through Scale-Up of Antiretroviral Therapy and Health System Strengthening Supported by the U.S. President’s Emergency Plan for AIDS Relief — Worldwide, 2004–2022. MMWR Morb Mortal Wkly Rep 2023;72:317–324. Available at: https://www.cdc.gov/mmwr/volumes/72/wr/mm7212e1.htm?s_cid=mm7212e1_w#suggestedcitation; Gaumer G, Luan Y, Hariharan D, Crown W, Kates J, Jordan M, et al. “Assessing the impact of the president’s emergency plan for AIDS relief on all-cause mortality”. PLOS Glob Public Health 2024; 4(1): e0002467. Available at: https://pmc.ncbi.nlm.nih.gov/articles/PMC10796053/. ↩︎
  2. “The Future of Investment In PEPFAR: Understanding PEPFAR’s Multiple Economic, Health, And Diplomatic Impacts”, Health Affairs Blog, April 17, 2017. Available at: https://www.healthaffairs.org/content/forefront/future-investment-pepfar-understanding-pepfar-s-multiple-economic-health-and-diplomatic; Crown W, Hariharan D, Kates J, Gaumer G, Jordan M, Hurley C, et al. “Analysis of economic and educational spillover effects in PEPFAR countries.” PLoS ONE 2023; 18(12): e0289909. Available at: https://journals.plos.org/plosone/article?id=10.1371/journal.pone.0289909;  ; Gaumer G, Crown WH, Kates J, et al. “Analysis of maternal and child health spillover effects in PEPFAR countries.” BMJ Open 2023;13: e070221. Available at: https://bmjopen.bmj.com/content/13/12/e070221.long. ↩︎
  3. “The Future of Investment In PEPFAR: Understanding PEPFAR’s Multiple Economic, Health, And Diplomatic Impacts”, Health Affairs Blog, April 17, 2017. Available at: https://www.healthaffairs.org/content/forefront/future-investment-pepfar-understanding-pepfar-s-multiple-economic-health-and-diplomatic; Crown W, Hariharan D, Kates J, Gaumer G, Jordan M, Hurley C, et al. “Analysis of economic and educational spillover effects in PEPFAR countries.” PLoS ONE 2023; 18(12): e0289909. Available at: https://journals.plos.org/plosone/article?id=10.1371/journal.pone.0289909;  ; Gaumer G, Crown WH, Kates J, et al. “Analysis of maternal and child health spillover effects in PEPFAR countries.” BMJ Open 2023;13: e070221. Available at: https://bmjopen.bmj.com/content/13/12/e070221.long.
    [iii] Vogl T, Education and health in developing economies, Working Papers 1453, Princeton University, Woodrow Wilson School of Public and International Affairs, 2012; Wagner Z, Barofsky J, Sood N, “PEPFAR funding associated with an increase in employment among males in ten sub-Saharan African countries,” Health Affairs, 2015 Jun, 34(6): 946-953. Available at: https://pmc.ncbi.nlm.nih.gov/articles/PMC4782769/; Piabuo S, Tieguhong J, “Health expenditure and economic growth – a review of the literature and an analysis between the economic community for central African states (CEMAC) and selected African countries,” Health Econ Rev, 2017 Dec, 7(23); Bloom D, Kuhn M, Prettner K, Health and economic growth, 2018, IZA DP No. 11939, available at: https://www.iza.org/publications/dp/11939/health-and-economic-growth; Collin M, Weil D, The effect of increasing human capital investment on economic growth and poverty: a simulation exercise, World Bank, WPS8590, 2018, available at: https://openknowledge.worldbank.org/handle/10986/30463. Remes J, Wilson M, Ramdorai A, How investing in health has a significant economic payoff for developing economies, Brookings, July 2020, available at: https://www.brookings.edu/blog/future-development/2020/07/21/how-investing-in-health-has-a-significant-economic-payoff-for-developing-economies/; Bloom D, Khoury A, Kufenko V, Prettner K, “Spurring economic growth through human development: research results and guidance for policymakers,” Population and Development Review, 2021 Jun, 47(2): 377-409; World Bank, Human Capital Project, available at: https://www.worldbank.org/en/publication/human-capital. ↩︎
  4. This volatility appears to have been influenced by a subset of outlier countries; after removing these countries from the analysis, the results remain significant. ↩︎
  5. Historically, a subset of countries receiving PEPFAR support had been required to prepare annual Country Operational Plans (COPs) which documented annual funding levels linked to results and served as budget and tracking tools. These were prepared by country teams who worked intensively to develop these plans in concert with headquarters at the State Department. ↩︎
  6. Crown W, Hariharan D, Kates J, Gaumer G, Jordan M, Hurley C, Luan Y, Nandakumar A. (2023) “Analysis of economic and educational spillover effects in PEPFAR countries”. PLOS ONE 18(12): e0289909. https://doi.org/10.1371/journal.pone.0289909. ↩︎
  7. Crown W, Stenoien D, Reid MJA, Kumar S, Kates J, Jordan M, Nandakumar A. “The Economic Impact of Lives Saved in PEPFAR Countries”, under review, BMJ Global Health. https://doi.org/10.12688/verixiv.2057.1 ↩︎

State Health Coverage for Immigrants and Implications for Health Coverage and Care

Published: May 19, 2026

Editorial Note

This brief was updated on June 11, 2026 to include additional details on fully state-funded coverage in Washington.

As of 2024, there were 24 million noncitizen immigrants, including lawfully present and undocumented immigrants, living in the U.S. Noncitizen immigrants, particularly those who are undocumented, face significant barriers to accessing health coverage and care and are significantly more likely than citizens to be uninsured. These higher uninsured rates reflect more limited access to private coverage and eligibility restrictions for federally funded coverage options. Undocumented immigrants are not eligible for federally funded coverage options and lawfully present immigrants face eligibility restrictions for coverage. Under the 2025 reconciliation law there will be increased eligibility restrictions for many lawfully present immigrants for Medicaid and the Children’s Health Insurance Program (CHIP), subsidized Affordable Care Act (ACA) Marketplace coverage, and Medicare coverage.

Some states have taken up options in Medicaid and CHIP to expand coverage for lawfully present immigrants and/or established fully state-funded programs to fill gaps in coverage for immigrants. However, some states have recently made reductions to these programs due to budget pressures. On the other hand, a few states are considering how they can use state-funded coverage to fill the gaps in coverage that will result from the reconciliation law eligibility restrictions. This brief provides an overview of state take-up of these options and fully state-funded health coverage programs for immigrants.

As of April 2026, 15 states, including DC, provide fully state-funded coverage for income-eligible children regardless of immigration status; seven states, including DC, provide fully state-funded coverage to some income-eligible adults regardless of status; and most states have taken up options in Medicaid and CHIP to expand coverage to lawfully present immigrant children and pregnant people. Six states, including DC, have recently scaled back their state-funded coverage for adults. Two states have plans to expand state-funded coverage to fill gaps in coverage that will be created by the 2025 reconciliation law eligibility restrictions, and several other states have pending legislation to fill gaps.

Looking ahead, states may face increased challenges maintaining state-funded coverage programs, while at the same time there may be growing need for coverage due to new restrictions in federally funded coverage for lawfully present immigrants under the reconciliation law. More limited access to federally funded coverage as well as reductions in state-funded coverage programs will likely lead to increases in uninsured rates for immigrant families contributing to greater challenges accessing care and potentially worse health outcomes over the long-term. These changes could also have negative implications for the U.S. economy and workforce, where immigrant families make significant contributions.

Health Coverage for Immigrants

Lawfully present immigrants may qualify for federally funded coverage but face eligibility restrictions. For example, many must meet a five-year waiting period before qualifying for Medicaid or CHIP even if they meet other eligibility criteria. Lawfully present immigrants can purchase coverage through the ACA Marketplaces and may receive tax credits for this coverage without a waiting period. Lawfully present immigrants have been eligible for Medicare if they have the required work quarters and meet the disability or age requirements. Under the 2025 reconciliation law, eligibility for Medicaid and CHIP, subsidized Marketplace, and Medicare coverage will be limited to immigrants who are lawful permanent residents (LPRs) or green card holders, certain Cuban and Haitian entrants, and people residing in the U.S. as citizens of the Freely Associated (COFA) nations of the Marshall Islands, Micronesia, and Palau. The law also eliminates ACA Marketplace coverage for lawfully present immigrants with incomes less than 100% FPL effective January 1, 2026. States may also continue to cover lawfully residing children and pregnant immigrants under a Medicaid or CHIP option. These changes will result in some groups of lawfully present immigrants losing access to federally funded coverage, including refugees and asylees.

Undocumented immigrants are ineligible to enroll in federally funded coverage, including Medicaid or CHIP, the ACA Marketplaces, or Medicare. Medicaid payments for emergency services reimburse hospitals for emergency care they are obligated to provide to individuals who meet other Medicaid eligibility requirements (such as income), but who do not have an eligible immigration status, including undocumented immigrants as well as some lawfully present immigrants. These payments help cover costs to hospitals for providing emergency care to immigrants who remain ineligible for Medicaid but are not coverage for individuals. Emergency spending accounted for less than one percent of total Medicaid spending between fiscal years 2017 and 2023. The 2025 reconciliation law reduces the federal Medicaid matching rate provided to states for Emergency Medicaid services provided to expansion adults who would otherwise be eligible for Medicaid except for their immigration status to the regular matching rate starting October 1, 2026.

State Take-up of Optional Coverage for Lawfully Present Immigrants

Most states have taken up options in Medicaid and CHIP to expand coverage for lawfully residing children and/or pregnant people. In general, lawfully present immigrants must have a “qualified” immigration status to be eligible for Medicaid or CHIP, and many, including most lawful permanent residents or “green card” holders, must wait five years after obtaining qualified status before they may enroll even if they meet other eligibility requirements. Some immigrants, such as those with Temporary Protected Status, are lawfully present but do not have a qualified status and are not eligible to enroll in Medicaid or CHIP regardless of their length of time in the country. As noted, under the 2025 reconciliation law, eligibility will be further restricted to lawfully present immigrants who are LPRs or green card holders, certain Cuban and Haitan entrants, and people residing in the U.S. under COFA starting October 1, 2026. States can provide coverage to lawfully residing children and pregnant people without a five-year wait under the Immigrant Children’s Health Improvement Act (ICHIA) option. As of April 2026, 38 states, including DC, have taken up this option for children and 32 states, including DC, have elected the option for pregnant people (Figure 1). States may continue to provide this coverage under the 2025 reconciliation law. North Carolina enacted a Medicaid funding bill in April 2026 that codified the 2025 reconciliation law’s immigrant eligibility changes by limiting eligibility to coverage that the state is federally required to provide, starting October 1, 2026. This would eliminate ICHIA coverage as it is optional for states to provide. However, the Governor has called for the state legislature to reinstate this coverage and some state legislators have indicated that the cut was unintentional.

Federally-Funded Coverage of Lawfully Residing Immigrant Children and Pregnant People Without a 5-Year Waiting Period as of April 2026 (Choropleth map)

A total of 25 states, including DC, have extended coverage through the CHIP From-Conception-to-End-of-Pregnancy (FCEP) option, which provides prenatal care and pregnancy related benefits to eligible low-income children beginning from conception to end of pregnancy regardless of their parent’s citizenship or immigration status (Figure 2). While other pregnancy-related coverage in Medicaid and CHIP requires 60 days of postpartum coverage, the CHIP FCEP option does not include this coverage. However, some states that took up this option provide postpartum coverage through a CHIP health services initiative or using state-only funding. Eleven of the states that have implemented the FCEP option (California, Colorado, Connecticut, Illinois, Maine, Massachusetts, Minnesota, New York, Oregon, Rhode Island, and Washington) have used state funding or CHIP health services initiatives to extend postpartum coverage to 12 months to align with the Medicaid extension established by the American Rescue Plan Act. Maryland extends coverage for four months postpartum, and Alabama, Texas, Virginia, and DC extend coverage for 60 days postpartum using CHIP health services initiatives.

State Take-Up of CHIP From-Conception-to-End-of-Pregnancy (FCEP) Option to Cover Pregnant People Regardless of Immigration Status as of April 2026 (Choropleth map)

Fully State-Funded Coverage

Beyond state take-up of options in Medicaid and CHIP for lawfully present immigrants, some states provide fully state-funded coverage to fill gaps in coverage for immigrants. States vary in the eligibility and scope of benefits offered through these coverage programs. These programs extend coverage to lawfully present immigrants who are in the five-year waiting period for Medicaid or CHIP or do not have “qualified status” and are ineligible for federally funded coverage as well as undocumented immigrants. These programs also extend coverage to Deferred Action for Childhood Arrivals (DACA) recipients who are not considered lawfully present for purposes of eligibility for federally funded health coverage programs. While the Biden administration had published regulations to extend Marketplace coverage to DACA recipients, new regulations by the Trump administration and the 2025 reconciliation law excluded them from coverage.

As of April 2026, 15 states, including DC, provide comprehensive state-funded coverage for children regardless of immigration status, with one state (Colorado) planning to scale back coverage due to budget pressures (Figure 3). These states include California, Colorado, Connecticut, Illinois, Maine, Massachusetts, Minnesota, New Jersey, New York, Oregon, Rhode Island, Utah, Vermont, Washington, and DC. Three of these states (Colorado, New Jersey, and Vermont) also provide state-funded coverage to income-eligible pregnant people regardless of immigration status, with Vermont extending this coverage for 12 months postpartum. Colorado plans to implement rollbacks to their state-funded coverage program for children and pregnant people, including capping enrollment and limiting certain benefits, starting January 2027 due to funding constraints.

State-Funded Coverage for Children and Pregnant People Regardless of Immigration Status as of April 2026 (Choropleth map)

As of April 2026, seven states, including DC, have also expanded fully state-funded coverage to at least some income-eligible adults regardless of immigration status (Figure 4). These states include California, Colorado, DC, Illinois, New York, Oregon, and Washington. In some cases, coverage is limited to certain age groups, and several states have closed new enrollment. Some additional states cover some income-eligible adults who are not otherwise eligible due to immigration status using state-only funds but limit coverage to specific groups, such as lawfully present immigrants who are in the five-year waiting period for Medicaid coverage, or provide more limited benefits.

Six states, including DC, have recently eliminated or reduced or plan to scale back state-funded coverage due to budget pressures.

  • California previously extended state-funded coverage to all income-eligible adults regardless of immigration status but implemented coverage reductions for adults 19 and older who are not pregnant or former foster youth under age 26 due to funding constraints, including: closing enrollment starting January 2026, ending dental benefits starting July 2026, and charging $30 monthly premiums for adults ages 19-59 starting July 2027. The California governor’s 2026-27 budget also proposes applying Medicaid policy changes included in the 2025 reconciliation law (work requirements and more frequent six-month renewals) to adults enrolled in the state-funded coverage program.
  • Colorado allows adults regardless of immigration status to obtain Marketplace coverage through OmniSalud using a section 1332 waiver. Colorado uses state funds to provide plans with $0 premiums through SilverEnhanced Savings. The state reduced the enrollment cap for the program from 12,000 in 2025 to 6,700 people due to funding constraints. As noted above, the state also plans to cap enrollment and limit benefits for children and pregnant people beginning in January 2027 due to funding constraints.
  • DC provides health coverage to low-income adults 21 and older regardless of immigration status through its longstanding locally funded Healthcare Alliance program. However, DC closed enrollment to adults ages 26 and older and reduced income limits for adults 21 and older starting October 2025. DC plans to end coverage for all adults ages 21 and older by October 2027.
  • Illinois extended state-funded coverage to low-income individuals ages 65 and older regardless of immigration status through its Health Benefits for Immigrant Seniors (HBIS) program in December 2020 but new enrollment has been paused since 2023. Illinois previously extended coverage to low-income immigrants ages 42 to 64 regardless of immigration status through the Health Benefits for Immigrant Adults (HBIA) program in 2022, but ended HBIA coverage on July 2025 due to funding constraints.
  • Minnesota extended state-funded health coverage to income-eligible adults 18 and older regardless of immigration status in January 2025 but ended this coverage starting January 2026 due to funding constraints. 
  • Washington uses state funds to provide Marketplace coverage with premium subsidies to individuals with incomes up to 250% FPL regardless of immigration status through Cascade Care using a section 1332 waiver, but funding is limited. In July 2024, Washington extended state-funded health coverage to individuals with incomes up to 138% FPL who are not eligible for either federal Medicaid or federal advance premium tax credits, but the state closed enrollment due to funding constraints and moves current and future enrollees to a fee-for-service program.

In addition to these states, Maryland also delayed plans to allow income-eligible individuals to purchase Marketplace coverage without subsidies regardless of immigration status to 2028 due to changes in the 2025 reconciliation law that will require additional administrative resources to implement.

State-Funded Coverage for Adults Regardless of Immigration Status as of April 2026 (Choropleth map)

Two states (New Mexico and New York) are planning to provide fully state-funded coverage to lawfully present immigrants that will lose Medicaid and ACA Marketplace coverage due to eligibility restrictions in the 2025 reconciliation law. New Mexico plans to use state funds to cover lawfully present immigrants losing Medicaid and ACA Marketplace Coverage in addition to DACA recipients. The New York governor’s 2026-27 budget proposes using state funds to cover lawfully present immigrants losing Medicaid coverage. The state will also use state funds to cover income-eligible lawfully present immigrants losing federally-subsidized health coverage through the Essential Plan. Under a longstanding court ruling, New York is required to provide state-funded coverage to lawfully present immigrants who would be eligible for Medicaid if not for their immigration status. Legislation introduced in New York and several other states, including California, Illinois, and Washington, would expand state-funded health coverage for immigrants to help fill gaps created by the reconciliation law; however, it is uncertain these bills will be enacted.

Impact of State Coverage Expansions on Health Care Access and Use

While coverage expansions for immigrants increase spending, research suggests that they reduce uninsured rates, increase health care use, and improve health outcomes. Data from the KFF/New York Times 2025 Survey of Immigrants show that immigrant adults who live in states that provide more expansive coverage, including the ACA Medicaid expansion for low-income adults overall and immigrant coverage expansions, are about half as likely to be uninsured compared with those living in states with less expansive policies (11% vs. 23%). Other research shows that coverage expansions for immigrant children increase access to health care and are associated with improved health outcomes. A study found that eliminating the five-year wait for Medicaid or CHIP was associated with a decline in uninsured rates among lawfully present foreign-born children in states without state-funded health care programs. California’s 2016 expansion to low-income children regardless of immigration status was associated with a 34% decline in uninsurance rates, and the state’s expansion to all adults was associated with an increase in health coverage among immigrant adults ages 50 and older. Similarly, a study found that children who reside in states that have expanded coverage to all children regardless of immigration status were less likely to be uninsured, to forgo medical or dental care, and to go without a preventive health visit than children residing in states that have not expanded coverage. Another study found that immigrant children residing in states with more expansive health coverage policies were more likely to have uninterrupted health coverage and a usual source of primary care than those residing in states with less expansive health coverage policies. Research has also found that expanding Medicaid coverage to pregnant people regardless of immigration status is associated with higher rates of prenatal care and improved birth outcomes, while more restrictive state coverage policies were associated with reduced postpartum care utilization.

Children in Immigrant Families: Key Facts on Health Coverage and Care

Published: May 19, 2026

Introduction

One in four children aged 18 and under living in the U.S. has at least one immigrant parent. Policies undertaken by the Trump administration and Congress aimed at restricting access to health coverage and care for immigrants as well as the significant increase in immigration enforcement activities could have significant implications for the health and well-being of these children, the vast majority of whom are citizens.

This brief provides key data on socioeconomic characteristics and health coverage among children (aged 18 and under) of immigrants based on KFF analysis of 2024 American Community Survey data. It also examines potential implications of recent policies and actions on the health and well-being of children in immigrant families drawing on KFF survey data from Fall 2025.

Children in Immigrant Families

One in four children aged 18 and under in the U.S. has an immigrant parent, and the vast majority of these children are U.S. citizens. As of 2024, close to 20 million, or one in four (26%), children in the U.S. had an immigrant parent (Figure 1). This includes about one in ten (12%) who are citizen children with a noncitizen parent, a similar share (11%) who are citizen children with a naturalized citizen parent, and 3% who are noncitizen children. The share of children with an immigrant parent varies significantly by state, ranging from about 3% in West Virginia to about 45% in California.

About One in Four Children in the U.S. Has an Immigrant Parent (Pie Chart)

Most children of immigrants live in households with a full-time worker regardless of parental citizenship status; however, children with a noncitizen parent are more likely than children with citizen parents to live in lower income households. More than eight in ten citizen children live in a household with a full-time worker across parental citizenship statuses, and over three in four (77%) noncitizen children live in a household with a full-time worker (Figure 2). However, noncitizen children (34%) and citizen children with a noncitizen parent (26%) are more likely than those with U.S.-born parents (19%) and naturalized citizen parents (13%) to live in lower income households with annual incomes of less than $40,000. Lower household income among children of noncitizen immigrants reflects noncitizen immigrants’ disproportionate employment in lower-wage jobs in industries such as construction, agriculture, and service, which are less likely to provide employer-sponsored insurance.

Most Children Live With At Least One Full-Time Worker But Children of Noncitizen Immigrants Have Lower Incomes (Split Bars)

Uninsured rates among children remain relatively low, but those with a noncitizen parent or who are noncitizens are more likely to be uninsured than those with citizen parents. As of 2024, the uninsured rate was 9% among citizen children with noncitizen parent(s) and 26% among the small share of children who are noncitizens compared to 5% of citizen children with citizen parents (Figure 3). Medicaid and the Children’s Health Insurance Program (CHIP) offer broad coverage to lower-income children. However, lawfully present immigrant children may face eligibility restrictions on coverage, including a five-year waiting period, and the small number of children who are undocumented are ineligible for Medicaid, CHIP, and other federally funded coverage options. Moreover, parents may be reluctant to enroll citizen or lawfully present children in coverage even if they are eligible due to immigration-related fears or have difficulty enrolling their children due to confusion about eligibility rules or language barriers. States have an option to expand Medicaid or CHIP coverage for lawfully residing children without a five-year waiting period, which was taken up by 38 states, including DC, as of April 2026. Additionally, as of April 2026, 15 states, including DC, provide comprehensive fully state-funded coverage for lower income children regardless of immigration status with one state (Colorado) planning to scale back coverage due to budget pressures (Figure 4).

Uninsured Rates Among Most Children Are Low, but Noncitizen Children are More Likely to be Uninsured (Column Chart)
State-Funded Coverage for Children Regardless of Immigration Status as of April 2026 (Choropleth map)

Potential Implications of Recent Policies

Since taking office, the Trump administration has taken a range of actions focused on increasing immigration enforcement, restricting immigration, and limiting immigrants’ access to health care and other services. These actions include an Executive Order (EO) issued in January 2025 to end birthright citizenship, a right guaranteed under the 14th amendment of the U.S. Constitution, for the children of some noncitizen parents, including those who may be undocumented as well as lawfully present individuals on non-immigrant visas (for example, certain work visas). Implementation of the EO is blocked as of April 2026 under court order, with the Supreme Court expected to rule on it in June or July 2026. Ending birthright citizenship for the children of some immigrants would have broad implications, including limiting their access to health coverage. Moreover, the 2025 reconciliation law will further restrict lawfully present immigrants’ access to health coverage, which is expected to increase the number of uninsured. The combination of growing immigration-related fears among immigrant families, increased restrictions on coverage for lawfully present immigrants, and growing financial pressures will likely negatively impact health and health care for children in immigrant families, including U.S. citizens, and could have longer-term impacts on the U.S. workforce.

Increased immigration-related worries will likely have long-term negative impacts on children’s physical and mental health. The American Academy of Pediatrics has identified fear of parental deportation and separation as a toxic stress, which can adversely affect a child’s development, leading to lifelong negative effects on physical, mental, and behavioral health. KFF survey data from Fall 2025 show that over one in four (27%) immigrant parents say their children have expressed worries about something bad happening to someone in their family due to immigration status, with this share rising to six in ten of likely undocumented parents. These worries have negative impacts on children’s health and well-being. About one in five (18%) immigrant parents say a child has experienced problems sleeping or eating (14%), changes in school performance or attendance (12%), or behavior problems (12%) due to worries about a family member’s immigration status (Figure 5). This share rises to nearly half among parents who are likely undocumented.

About One in Five Immigrant Parents Report Negative Impacts on the Well-Being of Their Child Due to Immigration-Related Worries Since January 2025 (Split Bars)

Children in immigrant families may face greater barriers to accessing health care due to increased restrictions on health coverage and immigration-related fears. The Trump administration and Congress have enacted a number of policy changes aimed at reducing access to health coverage and care for immigrants including but not limited to new restrictions on eligibility for health coverage for lawfully present immigrants under 2025 reconciliation law, proposed changes to public charge rules, sharing of noncitizen Medicaid enrollee data with immigration enforcement officials, as well as restrictions on access to community health centers and other social services. These changes are likely to result in coverage losses for immigrants, including among citizen children in immigrant families. Coverage losses among immigrant parents may lead to losses among their children as research shows that parental coverage impacts children’s access to health coverage and care. Moreover, growing immigration-related fears have made families more reluctant to access programs and services even if they are eligible. KFF survey data from Fall 2025 show that about one in ten (11%) immigrants say they stopped participating in government programs that help pay for food, housing, or health care since January 2025 due to immigration-related fears. Further, one in seven (14%) immigrant parents, rising to over four in ten (43%) of likely undocumented immigrant parents, say that their child missed, skipped, or delayed health care in the past 12 months due to immigration-related concerns (Figure 6).

Three in Ten Immigrant Parents Say That Their Child Skipped or Delayed Health Care in the Past 12 Months (Split Bars)

Beyond impacts on the health and well-being of immigrant families, the current environment may negatively impact the U.S. workforce given the significant role immigrants and their adult children play, especially in health care. Adult children of immigrants have higher educational attainment and incomes than their parents as well as the adult children of U.S.-born parent(s) and play an outsized role in the U.S. health care workforce. Based on KFF analysis of 2024 federal survey data, adult children of immigrants ages 18 and older make up about 7%, or over 1.4 million, of the total health care workforce, including 11% of physicians, surgeons, and other practitioners. Moreover, immigrants and their adult children contribute billions of dollars in federal, state, and local taxes each year and help to create jobs for U.S.-born people. Research further shows that adult children of immigrants contribute more in taxes on average than their parents or the rest of the U.S.-born population and that their fiscal contributions exceed their costs associated with health care, education, and other social services. As such, restrictions in immigration could have long-term implications for the U.S. workforce and economy.

Key Facts on Health Coverage of Immigrants

Published: May 19, 2026

Editorial Note

This brief was updated on June 12, 2026 to include additional details on fully state-funded coverage in Washington.

As of 2024, there were about 50 million immigrants residing in the U.S., including 24 million noncitizen immigrants and 26 million naturalized citizens, who each accounted for about 7% and 8% of the total population, respectively. Noncitizens include lawfully present and undocumented immigrants. Many individuals live in mixed immigration status families that may include lawfully present immigrants, undocumented immigrants, and/or citizens. One in four (26%) children has an immigrant parent, including over one in ten (12%) who are citizen children with at least one noncitizen parent.

This fact sheet provides an overview of health coverage for immigrants based on data from the KFF/New York Times 2025 Survey of Immigrants and discusses implications of the current policy and immigration enforcement environment for their health and health care. It shows:

  • Although the majority of uninsured people are citizens, noncitizen immigrant adults, particularly likely undocumented immigrants, are significantly more likely to report being uninsured than citizens. As of 2025, almost half (46%) of likely undocumented immigrant adults and one in five (21%) lawfully present immigrant adults reported being uninsured compared to less than one in ten naturalized citizen (7%) and U.S.-born citizen (6%) adults. These higher uninsured rates reflect a combination of more limited access to private coverage due to working in jobs less likely to offer health coverage and exclusions and limitations on eligibility for federally funded coverage options, including Medicaid, Affordable Care Act (ACA) Marketplace, and Medicare coverage.
  • Reflecting their higher uninsured rate, noncitizen immigrants are more likely than citizens to report barriers to accessing health care and skipping or postponing care. Immigrants have lower health care expenditures than their U.S.-born counterparts reflecting lower use of care due to a combination of them being younger and healthier and facing more barriers to accessing care.
  • Some states have expanded access to health coverage for immigrants through Medicaid options for lawfully residing immigrant children and pregnant people and fully state-funded programs, but some states have rolled back this coverage since 2025.
  • Recent policy changes will further restrict lawfully present immigrants’ access to health coverage, and immigrants across all statuses have become more fearful about accessing health coverage and care due to increased immigration enforcement actions under the Trump Administration.

Based on federal survey data, as of 2024, there were about 50 million immigrants residing in the U.S., including 24 million noncitizen immigrants and 26 million naturalized citizens, who each accounted for about 7% and 8% of the total population, respectively (Figure 1). More recent estimates show that the number of immigrants in the U.S. has since been declining, with the population declining by about 1.4 million immigrants between January 2025 and June 2025. KFF estimates for this analysis are based on the American Community Survey, the latest year of data for which is 2024, and thereby don’t reflect population changes since 2025. Estimates suggest that about half of noncitizens were lawfully present immigrants, such as lawful permanent residents (“green card” holders) and those with a valid work or student visa, while the remaining half were undocumented immigrants, who may include individuals who entered the country without authorization, individuals who entered the country lawfully and stayed after their visa or status expired, or individuals who lost their lawful status due to recent policy changes like immigrants with temporary protected status (TPS) from certain countries.1 The underlying estimates used in this analysis also include some immigrants with temporary deportation protections in the undocumented immigrant population. Many individuals live in mixed immigration status families that may include lawfully present immigrants, undocumented immigrants, and/or citizens. Close to 20 million, or one in four (26%), children living in the U.S. had an immigrant parent as of 2024, and the majority of these children were citizens (Figure 2). About 9 million, or 12%, were citizen children with at least one noncitizen parent.

About 50 Million Immigrants Resided in the U.S. as of 2024 (Pie Chart)
About One in Four Children in the U.S. Has an Immigrant Parent (Pie Chart)

Uninsured Rates by Immigration Status

The KFF/New York Times 2025 Survey of Immigrants, a nationally representative survey of immigrants, provides data on health coverage of immigrant adults and experiences accessing health care, including by immigration status.

Although the majority of uninsured people are citizens, noncitizen immigrant adults, particularly likely undocumented immigrants, are significantly more likely to report being uninsured than citizens. As of 2025, almost half (46%) of likely undocumented immigrant adults and one in five (21%) lawfully present immigrant adults reported being uninsured compared to less than one in ten naturalized citizen (7%) and U.S.-born citizen (6%) adults (Figure 3).

About One in Five Lawfully Present Immigrant Adults and Nearly Half of Likely Undocumented Immigrant Adults Report Being Uninsured (Bar Chart)

Reflecting their higher uninsured rates, noncitizen immigrants, especially those who are likely undocumented, are more likely than citizens to report barriers to accessing health care and skipping or postponing care. Research shows that having insurance makes a difference in whether and when people access needed care. Those who are uninsured often delay or go without needed care, which can lead to worse health outcomes over the long-term that may ultimately be more complex and expensive to treat. Overall, likely undocumented immigrant adults are more likely than lawfully present immigrant adults and naturalized citizen adults to report not having a usual source of care other than an emergency room and skipping or postponing care in the past 12 months (Figure 4).

Likely Undocumented Immigrant Adults are More Likely Than Lawfully Present Immigrant Adults and Naturalized Citizen Adults to Report Barriers to Health Care (Grouped column chart)

Research also shows that immigrants have lower health care use and expenditures than their U.S.-born counterparts and help to subsidize health care for U.S.-born citizens. Overall, research shows that immigrants, including lawfully present and undocumented immigrants, use less health care than U.S.-born citizens. Lower use of health care among immigrants likely reflects a combination of them being younger and healthier than their U.S.-born counterparts as well as them facing increased barriers to care including a higher uninsured rate, language access challenges, confusion, and immigration-related fears. Reflecting their lower use of health care, immigrants have lower health care expenditures than their U.S.-born counterparts. 2023 Medical Expenditure Panel Survey data show that, on average, annual per capita health care expenditures for immigrants are about 30% lower than those for U.S.-born citizens ($5,453 vs. $7,838).2 Research further finds that, because immigrants, especially undocumented immigrants, have lower health care use despite contributing billions of dollars in insurance premiums and taxes, they help subsidize the U.S. health care system and offset the costs of care incurred by U.S.-born citizens.

Access to Health Coverage Among Immigrants

Private Coverage

Despite high rates of employment, noncitizen immigrants have limited access to employer-sponsored coverage. Although most noncitizen immigrant adults report being employed, they are significantly more likely than citizens to report being lower income (household income less than $40,000) (Figure 5). This pattern reflects disproportionate employment of noncitizen immigrants in low-wage jobs and industries that are less likely to offer employer-sponsored coverage. Given their lower incomes, noncitizen immigrants also face challenges affording employer-sponsored coverage when it is available or through the individual market.

Most Immigrant Adults are Employed but Noncitizen Immigrant Adults Have Lower Household Incomes (Grouped column chart)

Federally Funded Coverage

Some lawfully present immigrants may qualify for Medicaid and the Children’s Health Insurance Program (CHIP) subject to eligibility restrictions. Prior to the 2025 reconciliation law, lawfully present immigrants who have a “qualified” immigration status have been eligible for Medicaid or CHIP if they meet other eligibility requirements such as income. Qualified immigrants are a subset of lawfully present immigrants and generally include lawful permanent residents, refugees, asylees, survivors of trafficking, Compact of Free Association (COFA) migrants, Cuban/Haitian entrants, members of federally recognized tribes, and some parolees (Appendix A). Many immigrants with qualified status, including most lawful permanent residents or “green card” holders, must wait five years after obtaining qualified status before they may enroll. Some immigrants with qualified status, such as refugees and asylees, as well as citizens of COFA nations, do not have to wait five years before enrolling. Some immigrants, such as those with temporary protected status, are lawfully present but do not have a qualified status and are not eligible to enroll in Medicaid or CHIP regardless of their length of time in the country (Appendix A). Once changes in the 2025 reconciliation law go into effect, fewer qualified immigrants will be eligible for Medicaid and CHIP (see below).

For children and pregnant people, states can eliminate the five-year wait and extend coverage to some lawfully present immigrants without a qualified status. As of April 2026, 38 states, including DC, have taken up this option for children and 32 states, including DC, have elected the option for pregnant individuals. A total of 25 states, including DC, have also extended coverage to pregnant people regardless of immigration status through the CHIP From-Conception-to-End-of-Pregnancy (FCEP) option. States have the option in CHIP to provide prenatal care and pregnancy related benefits to eligible low-income children beginning from conception to end of pregnancy regardless of their parent’s citizenship or immigration status. While other pregnancy-related coverage in Medicaid and CHIP requires 60 days of postpartum coverage, the CHIP FCEP option does not include this coverage. However, some states that took up this option provide postpartum coverage through a CHIP health services initiative or using state-only funding. Eleven of the states that have implemented the FCEP option (California, Colorado, Connecticut, Illinois, Maine, Massachusetts, Minnesota, New York, Oregon, Rhode Island, and Washington) have used state funding or CHIP health services initiatives to extend postpartum coverage to 12 months to align with the Medicaid extension established by the American Rescue Plan Act. Maryland extends coverage for four months postpartum, and Alabama, Texas, Virginia, and DC extend coverage for 60 days postpartum using CHIP health services initiatives.

Lawfully present immigrants can purchase coverage through the ACA Marketplace and, like citizens, may receive tax credits to help pay for premiums and cost sharing that vary on a sliding scale based on income. Generally, these tax credits are available to people with incomes starting from 100% of the federal poverty level (FPL) who are not eligible for other affordable coverage. In addition, lawfully present immigrants with incomes below 100% FPL had been eligible to receive tax credits if they were ineligible for Medicaid based on immigration status, for example due to being in the five-year waiting period for Medicaid or CHIP or because they did not have a “qualified” status. However, this coverage was eliminated effective January 1, 2026, under the 2025 reconciliation law (see below).

Individuals with Deferred Action for Childhood Arrivals (DACA) status are not considered lawfully present for purposes of health coverage eligibility and remain ineligible despite having a deferred action status, which is otherwise considered a lawfully present status. The Biden administration published regulations in 2024 that changed the definition of lawfully present to include DACA recipients for purposes of eligibility to purchase coverage through the ACA Marketplace and to receive tax credits to help pay for premiums and cost sharing, but this change faced legal challenges. The Trump administration published regulations in June 2025 that once again made DACA recipients in all states and DC ineligible for ACA Marketplace coverage. Most states terminated coverage for enrolled DACA recipients on September 30, 2025.

Lawfully present immigrants also can qualify for Medicare subject to certain restrictions. Specifically, lawfully present immigrants must have sufficient work history to qualify for premium-free Medicare Part A. If they do not have sufficient work history, they may qualify if they are lawful permanent residents and have resided in the U.S. for five years immediately prior to enrolling in Medicare, although they must pay premiums to enroll in Part A. Once changes in the 2025 reconciliation law go into effect, fewer lawfully present immigrants will be eligible for Medicare (see below).

Undocumented immigrants are not eligible to enroll in federally funded coverage including Medicaid, CHIP, or Medicare or to purchase coverage through the ACA Marketplaces. Medicaid payments for emergency services may be made to hospitals on behalf of individuals who are otherwise eligible for Medicaid but for their immigration status. These include lawfully present immigrants who are subject to a five-year waiting period for Medicaid, lawfully present immigrants who are not eligible for Medicaid, and undocumented immigrants. These payments may help cover the costs for emergency care provided to immigrants who remain ineligible for Medicaid but are not coverage for individuals. Much of Emergency Medicaid spending goes towards labor and delivery costs and Emergency Medicaid spending represented less than 1% of total Medicaid spending in fiscal year 2023.

Eligibility Restrictions for Immigrants Under the 2025 Reconciliation Law

The 2025 reconciliation law will further limit the groups of lawfully present immigrants who may qualify for federally funded coverage, including Medicaid and CHIP, the ACA Marketplace, and Medicare. Specifically, effective October 1, 2026, Medicaid and CHIP eligibility will be limited to lawful permanent residents (LPRs or “green card” holders), Cuban and Haitian entrants, people residing in the U.S. under COFA, and lawfully residing children and pregnant immigrants in states that cover them under the Medicaid and/or CHIP option (Table 1). This will result in some groups of lawfully present immigrants losing eligibility, including refugees and asylees without green cards. The law also eliminates ACA Marketplace coverage for lawfully present immigrants with incomes less than 100% FPL effective January 1, 2026, and limits subsidized ACA Marketplace coverage to lawfully present immigrants who are LPRs, Cuban and Haitian entrants, and people residing in the U.S. under COFA beginning January 1, 2027. As a result, a broader group of lawfully present immigrants will lose access to subsidized Marketplace coverage, including refugees and asylees without green cards, people with TPS, and individuals on work visas, among others. Medicare eligibility also will be limited to lawfully present immigrants who are LPRs, Cuban and Haitian entrants, and people residing in the U.S. under COFA, eliminating eligibility for similar groups. Current beneficiaries subject to the new restrictions will lose coverage no later than 18 months from the enactment of the legislation (January 4, 2027).

The Congressional Budget Office (CBO) estimates that the health coverage eligibility restrictions for lawfully present immigrants in the 2025 reconciliation law will result in 1.4 million lawfully present immigrants becoming uninsured by 2034. This includes 100,000 who will lose coverage due to eligibility restrictions for Medicaid and CHIP, 1.2 million who will lose coverage due to eligibility restrictions for ACA Marketplace coverage, and another 100,000 who will lose coverage due to eligibility restrictions in Medicare by 2034. The CBO also estimates that these coverage restrictions will result in $131 billion in reduced federal spending and $4.8 billion in increased federal revenues by 2034.

Some states have established fully state-funded programs to provide health coverage to some groups of low-income immigrants who remain ineligible for federally funded coverage options. This coverage is sometimes limited to certain groups, such as children, and varies in scope. While some programs offer benefits similar to Medicaid coverage, these programs are separate state programs that are not part of the Medicaid program. Several states have recently scaled back their state-funded coverage due to budget pressures.

As of April 2026, 15 states, including DC, provide comprehensive state-funded coverage to children regardless of immigration status, with one state (Colorado) planning to scale back coverage due to budget pressures (Figure 6). These states include California, Colorado, Connecticut, Illinois, Maine, Massachusetts, Minnesota, New Jersey, New York, Oregon, Rhode Island, Utah, Vermont, Washington, and DC. Three of these states (Colorado, New Jersey, and Vermont) also provide state-funded coverage to income-eligible pregnant people regardless of immigration status, with Vermont extending this coverage for 12 months postpartum. Colorado plans to implement rollbacks to their state-funded coverage program for children and pregnant people, including capping enrollment and limiting certain benefits, starting January 2027 due to funding constraints.

State-Funded Coverage for Children and Pregnant People Regardless of Immigration Status as of April 2026 (Choropleth map)

As of April 2026, seven states, including DC, have also expanded fully state-funded coverage to some income-eligible adults regardless of immigration status (Figure 7). These states include California, Colorado, DC, Illinois, New York, Oregon, and Washington. In some cases, coverage is limited to certain age groups, and several states have closed new enrollment. Some additional states cover some income-eligible adults who are not otherwise eligible due to immigration status using state-only funds but limit coverage to specific groups, such as lawfully present immigrants who are in the five-year waiting period for Medicaid coverage, or provide more limited benefits.

Six states, including DC, have recently eliminated or reduced or plan to scale back state-funded coverage due to budget pressures.

  • California previously extended state-funded coverage to all income-eligible adults regardless of immigration status but implemented coverage reductions for adults 19 and older who are not pregnant or former foster youth under age 26 due to funding constraints, including: closing enrollment starting January 2026, ending dental benefits starting July 2026, and charging $30 monthly premiums for adults ages 19-59 starting July 2027. The California governor’s 2026-27 budget also proposes applying Medicaid policy changes included in the 2025 reconciliation law (work requirements and more frequent six-month renewals) to adults enrolled in the state-funded coverage program.
  • Colorado allows adults regardless of immigration status to obtain Marketplace coverage through OmniSalud using a section 1332 waiver. Colorado uses state funds to provide plans with $0 premiums through SilverEnhanced Savings. The state reduced the enrollment cap for the program from 12,000 in 2025 to 6,700 people due to funding constraints. As noted above, the state also plans to cap enrollment and limit benefits for children and pregnant people beginning in January 2027 due to funding constraints.
  • DC provides health coverage to low-income adults 21 and older regardless of immigration status through its longstanding locally funded Healthcare Alliance program. However, DC closed enrollment to adults ages 26 and older and reduced income limits for adults 21 and older starting October 2025. DC plans to end coverage for all adults ages 21 and older by October 2027.
  • Illinois extended state-funded coverage to low-income individuals ages 65 and older regardless of immigration status through its Health Benefits for Immigrant Seniors (HBIS) program in December 2020 but new enrollment has been paused since 2023. Illinois previously extended coverage to low-income immigrants ages 42 to 64 regardless of immigration status through the Health Benefits for Immigrant Adults (HBIA) program in 2022, but ended HBIA coverage on July 2025 due to funding constraints.
  • Minnesota extended state-funded health coverage to income-eligible adults 18 and older regardless of immigration status in January 2025 but ended this coverage starting January 2026 due to funding constraints. 
  • Washington uses state funds to provide Marketplace coverage with premium subsidies to individuals with incomes up to 250% FPL regardless of immigration status through Cascade Care using a section 1332 waiver, but funding is limited. In July 2024, Washington extended state-funded health coverage to individuals with incomes up to 138% FPL who are not eligible for either federal Medicaid or federal advance premium tax credits, but the state closed enrollment due to funding constraints and moves current and future enrollees to a fee-for-service program.

In addition to these states, Maryland also delayed plans to allow income-eligible individuals to purchase Marketplace coverage without subsidies regardless of immigration status to 2028 due to changes in the 2025 reconciliation law that will require additional administrative resources to implement.

State-Funded Coverage for Adults Regardless of Immigration Status as of April 2026 (Choropleth map)

Two states (New Mexico and New York) are planning to provide fully state-funded coverage to lawfully present immigrants that will lose Medicaid and ACA Marketplace coverage due to eligibility restrictions in the 2025 reconciliation law. New Mexico plans to use state funds to cover lawfully present immigrants losing Medicaid and ACA Marketplace Coverage in addition to DACA recipients. The New York governor’s 2026-27 budget proposes using state funds to cover lawfully present immigrants losing Medicaid coverage. The state will also use state funds to cover income-eligible lawfully present immigrants losing federally-subsidized health coverage through the Essential Plan. Under a longstanding court ruling, New York is required to provide state-funded coverage to lawfully present immigrants who would be eligible for Medicaid if not for their immigration status. Legislation introduced in New York and several other states, including California, Illinois, and Washington, would expand state-funded health coverage for immigrants to help fill gaps created by the reconciliation law; however, it is uncertain these bills will be enacted.

Data suggest that state coverage expansions for immigrants make a difference in their health coverage and health care access and use. The KFF/New York Times 2025 Survey of Immigrants shows that immigrant adults residing in states with more expansive coverage policies for immigrants are less likely to be uninsured compared to their counterparts living in states with less expansive coverage policies. Other research shows that coverage expansions for immigrant children increase access to health care and are associated with improved health outcomes. A study found that eliminating the five-year wait for Medicaid or CHIP was associated with a decline in uninsured rates among lawfully present foreign-born children in states without state-funded health care programs. California’s 2016 expansion to low-income children regardless of immigration status was associated with a 34% decline in uninsurance rates, and the state’s expansion to all adults was associated with an increase in health coverage among immigrant adults ages 50 and older. Similarly, a study found that children who reside in states that have expanded coverage to all children regardless of immigration status were less likely to be uninsured, to forgo medical or dental care, and to go without a preventive health visit than children residing in states that have not expanded coverage. Another study found that immigrant children residing in states with more expansive health coverage policies were more likely to have uninterrupted health coverage and a usual source of primary care than those residing in states with less expansive health coverage policies. Research has also found that expanding Medicaid coverage to pregnant people regardless of immigration status is associated with higher rates of prenatal care and improved birth outcomes, while more restrictive state coverage policies were associated with reduced postpartum care utilization.

Among immigrants who are eligible for coverage, many remain uninsured because of a range of enrollment barriers, including fears around immigration-status and data privacy. Trump administration immigration policy changes and increased enforcement efforts are contributing to growing fears among immigrant families and increased reluctance to access health coverage and care for themselves and/or their children. The share of immigrant adults who say they personally worry that they or a family member could be detained or deported has increased significantly in 2025 (41%) as compared to 2023 (26%). As of 2025, over one in ten (12%) immigrant adults also report avoiding applying for government assistance as compared to 8% in 2023 and 29% report skipping or postponing health care as compared to 22% in 2023. Further, about half (51%) of immigrant adults overall and about eight in ten (78%) of those who are likely undocumented say they are “somewhat” or “very” concerned about health care providers sharing information about immigration status with immigration enforcement officials, a fear that could be further exacerbated following the public notice of CMS’s new Medicaid data sharing policy with ICE.

Appendix Table A

Lawfully Present Immigrants by Qualified Status as of April 2026

Qualified Immigrant Category

Other Lawfully Present Immigrants

Lawful permanent resident (LPR or green card holder)

Granted Withholding of Deportation or Withholding of Removal, under the immigration laws or under the Convention against Torture (CAT)

Refugee

Individual with Non-Immigrant Status, includes worker visas, student visas, U-visa, and other visas, and citizens of Micronesia, the Marshall Islands, and Palau

Asylee

Temporary Protected Status (TPS)

Cuban/Haitian entrant

Deferred Enforced Departure (DED)

Paroled into the U.S. for at least one year

Deferred Action Status

Conditional entrant granted before 1980

Lawful Temporary Resident

Granted withholding of deportation

Administrative order staying removal issued by the Department of Homeland Security

Battered noncitizen, spouse, child, or parent

Resident of American Samoa

Victims of trafficking and their spouse, child, sibling, or parent or individuals with pending application for a victim of trafficking visa

Applicants for certain statuses

Member of a federally recognized Indian tribe or American Indian born in Canada

People with certain statuses who have employment authorization

Citizens of the Marshall Islands, Micronesia, and Palau who are living in one of the U.S. states or territories (referred to as Compact of Free Association or COFA migrants)

People with certain statuses who have employment authorization

  1. The estimate of the total number of noncitizens in the U.S. is based on the 2024 American Community Survey (ACS) 1-year Public Use Microdata Sample (PUMS). The ACS data do not directly indicate whether an immigrant is lawfully present or not. KFF draws on the methods underlying the 2013 analysis by the State Health Access Data Assistance Center (SHADAC) and the recommendations made by Van Hook et. al. This approach uses the Survey of Income and Program Participation (SIPP) to develop a model that predicts immigration status; it then applies the model to ACS, controlling to state-level estimates of total undocumented population from Pew Research Center. For more detail on the immigration imputation used in this analysis, see Technical Appendix B.  ↩︎
  2. KFF analysis of 2023 Medical Expenditure Panel Survey full-year consolidated data file. ↩︎