KFF designs, conducts and analyzes original public opinion and survey research on Americans’ attitudes, knowledge, and experiences with the health care system to help amplify the public’s voice in major national debates.
Every Friday we’ll recap our new policy analysis, polling, and updates on coronavirus from the past week.
Here are the latest coronavirus stats from KFF’s tracking resources:
Global Cases and Deaths: This week total cases worldwide passed 2.1 million – with approximately 588,700 new cases added between April 9 and April 16. There were approximately 48,300 new confirmed deaths between April 9 and April 16.
U.S. Cases and Deaths: There were approximately 200,000 new cases and 12,500 deaths in the United States between April 9 and April 16.
U.S. Tests: There have been 3,423,034 total COVID-19 tests with results in the United States, with over 1 million added since last week. 19% of the total tests were positive. There were 10.4 tests with results per 1000 people.
Adults at Higher Risk of Serious Illness if Infected with Coronavirus: 38% of all adults are at risk of serious illness if infected with coronavirus (92,560,223 total) due to their age (65 and over) or pre-existing medical conditions. Of those ages 65 and older, 55% are at increased risk of serious illness if infected with coronavirus due to their existing medical conditions such as such as heart disease, diabetes, lung disease, asthma and obesity.
Stay At Home Order: 42 statewide orders, 2 orders for high-risk groups only, other action in 1 state, no action in 6 states
Mandatory Quarantine for Travelers: 14 orders for all travelers, 1 order for all air travelers, 6 for travelers coming from certain states, other action in 1 state, no action in 29 states
Non-Essential Business Closures: 35 orders to close all non-essential businesses; 4 orders to close all non-essential retail businesses, other action in 5 states, no action in 7 states
Large Gatherings Ban: All gatherings prohibited in 18 states, gatherings of 10+ people prohibited in 26 states, other actions in 4 states, no action in 3 states
State-Mandated School Closures: Closures in 49 states, schools effectively closed in 2 states
Bar/Restaurant Limits: Closed except takeout/delivery in 47 states, limited on-site service in 2 states, other action in 1 state, no action in 1 state
Primary Election Postponement: Postponement in 15 states, no postponement in 36 states
Emergency Declaration: There are emergency declarations in all states and D.C.
Waive Cost Sharing for COVID-19 Treatment: 2 states plus D.C. require, state-insurer agreement in 3 states; no action in 45 states
Free Cost Vaccine When Available: 9 states require, state-insurer agreement in 1 state, no action in 41 states
States Requires Waiver of Prior Authorization Requirements: For COVID-19 testing only in 6 states, for COVID-19 testing and treatment in 5 states, no action in 40 states
Early Prescription Refills: State requires in 17 states, no action in 34 states
Premium Payment Grace Period: Grace period extended for all policies in 9 states, grace period extended for COVID-19 diagnosis/impacts only in 5 states, no action in 37 states
Marketplace Special Enrollment Period: Marketplace special enrollment period in 12 states, no special enrollment period in 39 states
Paid Sick Leave: 13 states enacted, 2 proposed, no action in 36 states
Approved Section 1135 Waivers: 49 states have approved waivers
Approved 1915 (c) Appendix K Waivers: 27 states have approved waivers
Approved State Plan Amendments (SPAs)*: 10 states have temporary changes approved under Medicaid disaster relief SPAs, 1 state has an approved traditional SPA
Other State-Reported Administrative Actions: 51 states (all 50 states & DC) report taking other administrative actions in their Medicaid programs to address COVID-19
*The Disaster Relief SPA allows states to make temporary changes to their Medicaid state plans and address access and coverage issues during the COVID-19 emergency. States can also make changes through traditional SPAs and can implement changes under existing authority that do not require SPA approval.
Updated: The U.S. Government and the World Health Organization (Fact Sheet)
COVID-19 Issues and Medicaid Policy Options for People Who Need Long-Term Services and Supports (Issue Brief)
Several G7 Leaders Rebuke Trump Over WHO Funding Suspension; Group Agrees To WHO Review, Reform, Commits To Coordinated Response To COVID-19 (KFF Daily Global Health Policy Report)
How Health Costs Might Change with COVID-19 (Issue Brief)
State Action to Limit Abortion Access During the COVID-19 Pandemic (Issue Brief)
While there is near total agreement that the United States is not carrying out enough SARS-CoV-2 testing to enable it to safely relax social distancing measures, there is no agreed upon benchmark for how much testing we need to do to get there. Rather, several national-level estimates have been put forward based on different assumptions and targets. Here, we briefly review these estimates and compare them to current national and state testing levels. What we find is that while the national estimates vary wildly, the U.S. is still well off the mark no matter which benchmark you use. This is also true for most states, if the benchmark is applied to the state-level.
Existing Benchmarks
We looked at several national estimates, or potential benchmarks, that have been put forward:
A group from Harvard has looked at three scenarios for estimating daily testing capacity:
Using the standard susceptible-infected-recovered model (SEIR)
Using an “equilibrium model”, calibrated to protect hospital capacity
Using the experiences of Taiwan and South Korea, two countries that have had success in controlling spread, to calculate a “best case scenario”
Scott Gottlieb and colleagues at AEI have talked about a roughly 1% of population estimate to derive the number of tests needed on a weekly basis (though have also suggested 750,000 as a minimum threshold once community transmission has been sufficiently reduced)
Paul Romer has estimated that a random selection of 7% of the population should be tested each day.
We summarize these in the table below and also include the share of the U.S. population that would need to be tested under each model (in a given week). As the table indicates, the models vary in their weekly testing target from 3 million to 160 million, accounting for 0.9% of the population for the lowest bound estimate to half of the population in the highest.
Model
Daily Equivalent
Weekly Equivalent
Weekly Equivalent as Share of U.S. Population
Harvard SIER
1-10 million
7-70 million
2.1%-21.3%
Harvard Equilibrium
4 million
28 million
8.5%
Harvard Taiwan/SK
3 million
21 million
6.4%
Gottlieb
430,000
3 million
0.9%
Romer
23 million
161 million
50.0%
Another approach could be to estimate the amount of testing needed to identify all infections, based on reported cases. Currently, there are approximately 25,000 newly reported cases per day in the U.S. (the number reported on April 13, for example). We know that is an underestimate – maybe by a factor of 10, as some have suggested – which would mean that there could be 250,000 new infections per day. If we assume that about 20% of people tested are positive (according to the latest data from the COVID Tracking Project), that would mean conducting 1.25 million tests per day or 8.75 million per week, which is about 2.7% of the U.S. population being tested weekly.
(Note that none of these approaches includes any variation by region or state, positivity rate, doubling rate, or other variables, and is applied uniformly to the U.S. Obviously, these factors are quite important.)
Current Testing Levels Compared to Benchmarks
Now, comparing these ranges to current testing shows that the U.S. tested an additional 1 million people in the last week (April 6 to April 13). This is far below all of the estimated targets above and a smaller share of the population (0.3%) than even the lowest target (0.9%). Applying the population share targets to state testing capacity, we find that this is also the case in all states except one – Rhode Island, which tested 1.1%; Louisiana and New York each had tested 0.8% of their populations in the past week, just below the minimum benchmark. Because testing resources have been limited, the focus has been on people who are sick and hospitalized and frontline health care workers, so it is not surprising that Louisiana and New York have higher rates given the scale of infection in those communities.
Table: Total and Change in Coronavirus Tests from April 6 to April 13, 2020 by State
State
Number of Tests as of April 6
Number of Tests as of April 13
Change in Number of Tests from April 6-13
Tests in Past Week as Share of State Population
US
1,925,000
2,935,000
1,010,000
0.3%
Alabama
15,000
29,000
14,000
0.3%
Alaska
7,000
8,000
1,000
0.1%
Arizona
33,000
43,000
11,000
0.1%
Arkansas
13,000
21,000
8,000
0.3%
California
117,000
191,000
73,000
0.2%
Colorado
26,000
38,000
12,000
0.2%
Connecticut
27,000
44,000
18,000
0.5%
Delaware
7,000
12,000
5,000
0.5%
District of Columbia
7,000
11,000
3,000
0.5%
Florida
123,000
196,000
73,000
0.3%
Georgia
31,000
57,000
26,000
0.2%
Hawaii
14,000
19,000
5,000
0.4%
Idaho
11,000
15,000
4,000
0.2%
Illinois
63,000
106,000
43,000
0.3%
Indiana
26,000
45,000
18,000
0.3%
Iowa
12,000
19,000
7,000
0.2%
Kansas
9,000
14,000
5,000
0.2%
Kentucky
19,000
26,000
7,000
0.2%
Louisiana
69,000
108,000
39,000
0.8%
Maine
7,000
12,000
6,000
0.4%
Maryland
30,000
52,000
22,000
0.4%
Massachusetts
76,000
122,000
46,000
0.7%
Michigan
62,000
83,000
21,000
0.2%
Minnesota
28,000
38,000
10,000
0.2%
Mississippi
20,000
31,000
11,000
0.4%
Missouri
30,000
45,000
16,000
0.3%
Montana
7,000
9,000
2,000
0.2%
Nebraska
7,000
11,000
4,000
0.2%
Nevada
18,000
25,000
8,000
0.3%
New Hampshire
8,000
11,000
3,000
0.2%
New Jersey
89,000
129,000
40,000
0.5%
New Mexico
19,000
31,000
11,000
0.5%
New York
321,000
478,000
158,000
0.8%
North Carolina
41,000
63,000
23,000
0.2%
North Dakota
7,000
11,000
4,000
0.5%
Ohio
48,000
65,000
17,000
0.1%
Oklahoma
3,000
23,000
20,000
0.5%
Oregon
22,000
31,000
9,000
0.2%
Pennsylvania
84,000
130,000
46,000
0.4%
Rhode Island
8,000
21,000
12,000
1.1%
South Carolina
19,000
31,000
12,000
0.2%
South Dakota
6,000
9,000
3,000
0.3%
Tennessee
47,000
76,000
29,000
0.4%
Texas
85,000
133,000
48,000
0.2%
Utah
33,000
46,000
12,000
0.4%
Vermont
7,000
10,000
4,000
0.6%
Virginia
25,000
41,000
17,000
0.2%
Washington
92,000
94,000
2,000
0.0%
West Virginia
10,000
17,000
7,000
0.4%
Wisconsin
29,000
40,000
11,000
0.2%
Wyoming
4,000
6,000
2,000
0.4%
SOURCE: KFF analysis of The COVID Tracking Project data reported April 6 – April 13, 2020. Population totals from the 2019 Population data from Annual Population Estimates by State, U.S. Census Bureau.
There is not yet consensus over what approach to testing is required for social distancing measures to be loosened, or exactly how much capacity is needed. But, by any measure, it is clear that we are far from being able to do enough tests to enable us to move to the next phase of responding to the pandemic in states across the country.
Models have taken center stage in many key policy discussions surrounding COVID-19, largely due to the unprecedented nature of the situation, the many uncertainties about the disease and the way ahead, and the need to make informed policy decisions now on how best to manage that path forward. The White House has used models to initially estimate somewhere between 100,000 and 240,000 Americans may die from coronavirus (more recently the estimates have been revised downward). States and cities are using models to shape their health system responses as the virus spreads in their communities. Researchers are using models to estimate important epidemiological characteristics of the disease such as the incubation period, transmissibility, asymptomaticity, and severity, as well as the likely impacts of different public health interventions such as social distancing, airport screening, travel restrictions, and contact tracing.
While clearly models can be important tools for understanding the disease and policy responses, their approaches and assumptions vary widely, and can give widely divergent results. To their credit, many modelers are transparent about the variables and assumptions used.
In this post, we look at the primary uses for disease models, basic model approaches, and a number of key existing models in the context of COVID-19. We build on many excellentnewsarticles and modelingoverviews that have already been published.
Uses of Models
Models can be helpful as tools to make informed guesses about the disease, its future spread, and effects of different actions and interventions. Models are particularly useful in situations where many data elements are not available or not possible to collect, which is the case now with COVID-19. Some of the information gaps that COVID-19 models can help address include:
describing characteristics of the virus/disease for which there may be a lack information. For example, estimating incubation period or transmissibility (the R0);
forecasting how many cases, deaths, hospitalizations, or other outcomes are likely to occur in a given location over a given time frame; and
Understanding the potential effects of interventions and policies by looking at projections and different scenarios.
Below, we take a closer look at models that try to forecast or make projections about the future.
Model Approaches for Projections and Forecasts
Three key modeling approaches being used for forecasting and projections are:
SEIR/SIR models are a common epidemiological modeling technique that divides an estimated population into different groups (“compartments”) such as “susceptible”, “exposed”, “infected”, and “removed/recovered”, and then applies a set of mathematical rules about how people move from one compartment to another, using assumptions about the disease process, social mixing, public health policies, and other aspects.
Agent-based models create a simulated community and follow the interactions and resulting spread of disease among individuals (“agents”) in that community, based on assumptions and rules about things such as the individuals’ movement and mixing patterns, other behaviors and risks, and the health interventions and policies in place.
Curve-fitting/extrapolation models infer trends about an epidemic in a given location by looking at the current status and then applying a mathematical approximation of the likely future epidemic path, which is drawn from experiences in other locations and/or assumptions about the population, transmission, and public health policies in place.
Table 1: Example Covid-19 Forecast and Projection Models for the U.S.
Forecasts number of hospitalizations and deaths in the U.S. and by state, along with the timing of in the peak of hospitalizations and deaths, through August 2020.
Initially, the model forecast 81,000 deaths in the US by July. Results are updated daily, and as of Apr 12, that deaths estimate has been revised downward, to 61,545 by August 4.
Covid-19 Model from Northeastern University, Fogarty International Center, Fred Hutchison Cancer Center, University of Florida and others
Agent-based
Projects cases and deaths in the U.S. and by state, under no mitigation vs. “stay-at-home” scenario, through April 30, 2020.
As of April 4, model projected U.S. deaths would peak on April 8, and there would be approximately 52,575 COVID-19 deaths (range: 35,381 to 88,269) by April 30, 2020
Provides projections on number of severe cases, hospitalizations, critical care, ICU use, and deaths under different social distancing scenarios, for 3-week and 6-week periods starting April 2.
In different regions of the U.S. anywhere from 33,986 and 185,192 deaths could be averted through social distancing.
Forecasts cases and deaths by U.S. state using assumptions about the growth rate in cases and deaths and the presence of social distancing interventions through May 20.
As an example, model best guess forecast for California as of April 8 is that there would be 138,100 cases and 4,082 deaths.
Model allows users to set inputs and assumptions, then provides forecasts on expected number of hospitalizations, ICU bed demand, ventilator demand, and number of days these demands would exceed capacity at hospitals in a given area based on those inputs, over the next three months.
Using inputs for three University of Pennsylvania Health System hospitals, the model projected best- and worst-case scenarios for total hospital bed capacity needed would reach 3131 – 12,650, including 338 – 1,608 ICU beds and 118 to 599 ventilators.
Limitations, Assumptions, and Uncertainties of Models
All models are going to be simplifications of complex biological and social processes. Outputs, projections, and forecasts can differ significantly depending on the modeling approach used, the assumptions implicit in the model, and the values of the input parameters. The same model can even give very different results if assumptions or input values are changed even slightly.
In some cases, model results may differ bases on assumptions about unknown parameters, like how transmissible the virus is or what share of people who get infected will die. In other cases, models make assumptions about what policy changes political leaders will make. In particular, many Covid-19 models are very sensitive to the degree of social distancing assumed and how long distancing will last. For example, the IHME model assumes stringent social distancing will be in place until deaths drop to below 0.3 per million per capita, which they presently estimate will occur in early May. The model also expects zero deaths in July and August of this year because authors assume “appropriate measures are put in place to guard against the reintroduction of COVID-19.” If either of these assumptions are too optimistic – social distancing is relaxed earlier, or re-introductions of the virus occur, the model will underestimate the burden of disease in the coming months.
Models often present “best guess” or median forecasts/projections, along with a range of uncertainty. Sometimes, these uncertainty ranges can be very large. Looking at the IHME model again, on April 13, the model projected that there would be a 1,648 deaths from COVID-19 in the U.S. on April 20, but that the number of deaths could range from 362 to 4,989.
Conclusion
For these reasons, it is best not to depend on a specific forecast or exact projection coming from a single model as being authoritative. Using multiple models, updating inputs and approaches given new information, and checking models against what real-time information is available can help diminish some of the limitations inherent in modeling. For example, many states, from North Carolina to Illinois to California, are using several different models to inform their decision-making. Most importantly, understanding a model’s assumptions is key. If a model assumes strict social distancing measures will stay in place, and those measures are loosened, you’re going to need a new model.
No model, or set of models, can serve as a crystal ball to predict what will happen in the future, but they can shed light and provide much needed perspective on aspects of the epidemic that might be otherwise unknowable.
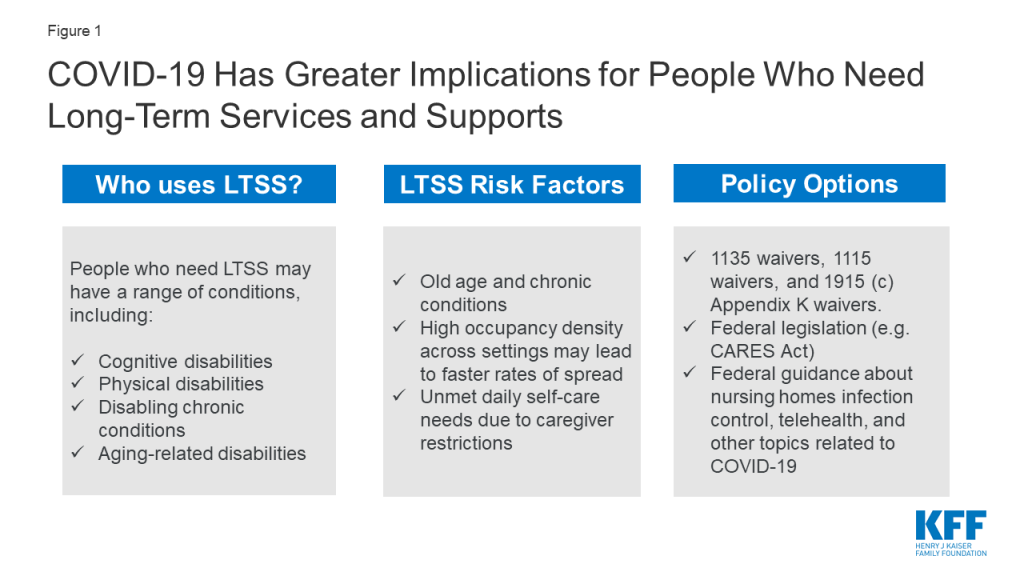
The COVID-19 pandemic has greater implications for people who utilize long-term supports and services (LTSS), including seniors and people with disabilities & chronic illnesses, compared to the general population. This issue brief presents state-level data on LTSS users, including the 2.5 million people who receive HCBS through waivers, 1.3 million people in nursing homes, and 800,000 people in assisted living facilities. This brief also explores key issues and potential state and federal policy responses for LTSS users in light of the COVID-19 pandemic and Medicaid’s role as the primary LTSS payer.
COVID-19 disproportionately impacts the elderly and those with chronic conditions, making the LTSS population particularly vulnerable to severe outcomes if they contract the virus. LTSS populations include elderly and non-elderly people with intellectual and developmental disabilities, physical disabilities, behavioral health diagnoses (such as dementia), spinal cord or traumatic brain injuries, and/or disabling chronic conditions.
People receiving LTSS in nursing homes are at increased risk from coronavirus, and those in home and community-based settings also may be at greater risk of adverse health outcomes and unmet daily self-care needs. Those in other congregate settings, such as assisted living facilities, also may be at increased risk of infection due to occupancy density. Those receiving care in the community from home health aides or personal care attendants may face worker shortages and limited medical supplies.
States have a variety of policy options available to respond to the needs of LTSS users during the COVID-19 emergency, including new options created by recent federal law and policy guidance. States can use various Medicaid authorities to increase and support access to LTSS during public health emergencies, such as expanding eligibility, streamlining enrollment and renewal processes, expanding services, and supporting providers to ensure an adequate workforce. Recent federal legislation provides increased federal matching funds for state Medicaid programs during the emergency and additional money for nursing home inspections. CMS has also released guidance for states on nursing home visitor restrictions, infection control, and segregating coronavirus positive and negative-testing patients as well as options to expand the use of telehealth.
Introduction
While the COVID-19 pandemic is a global crisis, it may have greater implications for people who utilize long-term supports and services (LTSS), including seniors and people with disabilities & chronic illnesses. As the primary payer for LTSS for millions of low-income Americans, Medicaid is poised to play an important role in the nation’s COVID-19 response for vulnerable populations. There is limited coverage for LTSS under Medicare and few affordable options in the private insurance market. State Medicaid programs must cover LTSS in nursing homes, while most home and community-based services (HCBS) are optional and covered through waivers that may target specific populations. This issue brief presents state-level data and explores key issues and potential state and federal policy responses for Medicaid LTSS users in light of the COVID-19 pandemic.
Figure 1: COVID-19 Has Greater Implications for People Who Need Long-Term Services and Supports
Populations at Risk and Key Issues
People who need LTSS are in both institutional and home or other community-based settings and have a range of conditions and needs. LTSS needs arise from a range of conditions, such as cognitive disabilities, like dementia or Down syndrome; physical disabilities, like multiple sclerosis or spinal cord injury; mental health disabilities, like depression or schizophrenia; and disabling chronic conditions, like cancer or HIV/AIDS. While COVID-19 has been shown to primarily impact adults, some children with special health care needs can be at risk of severe infection should they contract the virus, given that many of them have conditions that make them susceptible to compromised immune systems. Children with special health care needs may have asthma, depression, cerebral palsy, cystic fibrosis, diabetes, muscular dystrophy, brain injury, heart conditions, and epilepsy. Appendix Table 1 shows the distribution of LTSS users across institutional and community based settings. In 2016, Medicaid spending on HCBS was 57% of total Medicaid LTSS expenditures, exemplifying states’ gradual shifts away from institutional care over the last two decades.
People receiving LTSS in institutions are at increased risk for adverse health outcomes if infected with coronavirus due to old age, chronic health conditions, and high rates of occupancy density. Institutional LTSS include care provided in nursing homes, intermediate care facilities for people with intellectual and developmental disabilities (I/DD), and institutions for “metal disease.” As of April 10, nearly 2,500 long-term care facilities are battling coronavirus infections, a 522% increase from the 400 facilities reported by the CDC on March 30. There have also been reports of other types of institutions with COVID-19 outbreaks, including a facility in Texas that serves people with intellectual and developmental disabilities. The high rates of infection in these facilities can be attributed to a number of factors, including high rates of occupancy density, which is as high as 90% in some states.1
Nursing home residents may have high levels of need, ranging from respiratory issues to cognitive and behavioral health needs, which contribute to their increased risk due to coronavirus. Sixteen percent of nursing home residents underwent respiratory treatment in 2017, which can be provided through respirators/ventilators, oxygen, or inhalation therapy. Given the implications of this virus on respiratory systems, these residents could be at higher risk of severe outcomes if they were to become infected. Nursing homes’ capacity to care for high-need patients, such as those with coronavirus, varies. Residents in nursing facilities are also at risk of being diagnosed with psychiatric disorders, with nearly 40 percent having experienced symptoms of depression.2 Visitor restrictions in nursing facilities, which are currently being implemented to lower the risk of exposure, may have negative impacts on residents’ mental health and increase the incidence of depressive symptoms. These health problems may be further exacerbated by fear, worry, or social isolation due to COVID-19.
Individuals receiving HCBS may also be at increased risk for adverse health outcomes if infected with coronavirus. HCBS encompass many different types of care, such as home health services, personal care services, and private duty nursing. Some people receive HCBS at home, while others may receive services elsewhere in the community, such as assisted living facilities, adult day health centers, and Program of All-Inclusive Care for the Elderly (PACE) centers, which provide integrated care for people dually eligible for Medicare and Medicaid. HCBS programs serve a range of populations, all of whom have varying levels of need. These include people with I/DD; people with physical disabilities, such as cerebral palsy or multiple sclerosis; seniors with Alzheimer’s disease and physical functional limitations associated with the aging process; and people with chronic illness such as HIV/AIDS. People who receive HCBS in settings with others are at greater risk for coronavirus infection, as there have been reports of outbreaks in settings such as assisted living facilities. Given that some community-based settings share similar characteristics to institutions, including issues related to occupancy density, outbreaks may occur.
LTSS users receiving care in the home and/or community rely on caregivers to help with daily self-care and household activities. LTSS provide assistance with self-care tasks (such as eating, bathing, and dressing), and household activities (such as meal preparation, medication management, and housekeeping). These services are essential to meet LTSS beneficiaries’ daily needs, many of whom often have substantial medical needs as well. In the U.S., the majority of LTSS is provided by unpaid caregivers – relatives and friends – at home.
LTSS may be restricted as caregivers take precautions to limit coronavirus exposure to the individuals they serve. The spread of coronavirus presents three major issues with regards to the LTSS caregiver workforce. First, if LTSS caregivers begin to get ill and are unable to provide care, there may be a severe shortage of LTSS available for those who need it. Secondly, evidence is growing that some people may be unknowingly infected with coronavirus and capable of transmitting the disease to others, while asymptomatic. Therefore, screening of direct care workers, who often must be in close contact with their patients, is important to containing the spread of the virus. This is especially true, given that many people who receive LTSS have chronic conditions and compromised immune systems, placing them at high risk for severe outcomes if infected. The third major issue is that LTSS depend on medical supplies that are currently in short supply. Healthcare settings across the country are running low on critical medical supplies, and healthcare providers are resorting to reusing gloves, gowns, and masks. Those receiving and providing LTSS are at risk from interruptions in access to medical supplies, which can interfere with the ability to manage daily health needs as well as prevent coronavirus infections.
State Policy Options Under Existing Authorities
States can adopt a variety of policy options to increase and support access to Medicaid LTSS during public health emergencies such as COVID-19. Examples of options under the major authorities are described below, and a detailed list is provided in Appendix Table 2. The state examples below are not an exhaustive list, and additional state approvals are regularly updated in our Medicaid emergency authorities tracker.
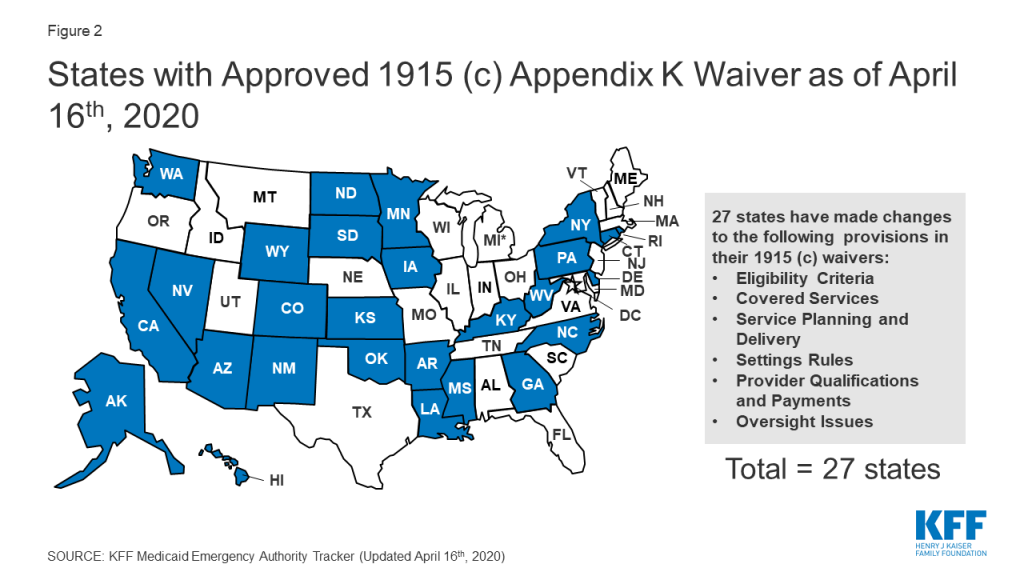
Section 1915 (c) waiver Appendix K enables states to modify policies to expand HCBS eligibility and services and support providers in emergencies (Figure 2). As noted above, most HCBS are provided through waivers. CMS has clarified that Appendix K also can be adopted by states with Section 1115 waivers that authorize HCBS, without an accompanying Section 1915 (c) waiver. Appendix K approvals can be retroactive to HHS’s January 2020 public health emergency declaration and effective for one year.
States can use Appendix K to expand waiver eligibility to a wider population and to offer additional services. For example, a waiver serving individuals with Alzheimer’s disease may be expanded to offer services to a broader aged population to forestall institutionalization in emergencies. States also are adjusting the amount, duration, or scope of regularly covered services to account for increased needs during an emergency.
States can use Appendix K to ensure uninterrupted access to HCBS during an emergency by extending waiver level of care renewals for up to 12 months, temporarily suspending prior authorization requirements, and extending medical necessity authorizations. States also can take steps to ensure that waiver enrollees continue to receive services if their usual setting is disrupted during an emergency. For example, states can temporarily modifying provider requirements to allow for day program services in individual homes if day centers are closed due to outbreak of contagious illness. States can temporarily allow payment for waiver services, such as communication supports and intensive personal care, for enrollees during an acute care hospital or short-term institutional stay.
States can address provider shortages during an emergency by allowing payment to family caregivers or legally responsible relatives and temporarily modifying minimum provider qualifications to allow neighbors or acquaintances to be service providers during the emergency. States also can support providers by temporarily increasing payment rates to attract more providers and/or to account for costs such as personal protective equipment (PPE) for home care workers and temporarily paying retainers to personal care assistants when enrollees are institutionalized up to 30 days.
Figure 2: States with Approved 1915 (c) Appendix K Waiver as of April 16th, 2020
Section 1135 and Section 1115 waivers may provide additional authorities to states in emergencies. Section 1135 authority is tailored to addressing emergency needs, such as sufficient health care items and services. For example, states can use Section 1135 waivers to expand access to HCBS in times of provider shortages caused by emergencies by temporarily suspending requirements for home health and hospice aide supervision by registered nurses or streamlining provider enrollment requirement for HCBS provided in the state plan benefit package. Section 1135 waivers also can allow states to waive fee-for-service prior authorization requirements and extend appeal deadlines for enrollees. On March 28, 2020, CMS issued blanket Section 1135 waivers, which apply throughout the U.S. healthcare system during the emergency that temporarily suspend some nursing facility certification requirements to provide additional surge capacity, free up inpatient hospital beds, and provide space for isolation and treatment of those with coronavirus. The blanket waivers also allow long-term care facilities to transfer residents to separate those with and without COVID-19 to provide care while limiting the spread of infection. Section 1115 waivers have been used in emergencies to expand eligibility for Medicaid LTSS by waiving the 30 day institutional stay requirement or asset transfer rules.
States also can adopt a variety of policies to respond to an emergency without the need for CMS approval. Existing Medicaid regulations allow states to streamline Medicaid enrollment, such as accepting self-attestation to establish spend down eligibility, and to extend renewal timeframes to preserve continuity of coverage. States also can use telehealth instead of in-person meetings for needs assessments for state plan HCBS, such as home health, personal care, or Community First Choice attendant services. States delivering services through MLTSS can use their authority to regulate health plans to ensure that enrollees have access to needed services during an emergency by directing plans to temporarily suspend out of network rules or expedite new prior authorization requests.
New Federal Policy Options and Guidance
Recently enacted federal legislation includes some provisions that can support state responses to the COVID-19 emergency. The Families First Coronavirus Response Act authorizes 6.2% enhanced federal Medicaid matching funds, provided that states meet certain requirements, such as maintaining eligibility standards and enrollment and covering coronavirus related testing and treatment without cost sharing. This enhanced federal funding may help states finance some of the policy options described above to expand HCBS eligibility and services during the emergency. The Coronavirus Aid, Relief, and Economic Security (CARES) Act allows certain providers other than physicians to certify the need for Medicaid home health services.3 The CARES Act also provides additional funding for Money Follows the Person demonstrations that support Medicaid beneficiaries moving from institutions to the community and extends the ACA requirement that states apply the institutional care spousal impoverishment rules when determining Medicaid HCBS eligibility through November 2020. The CARES Act also requires that at least $100,000,000 of a $200,000,000 appropriation to CMS be spent on nursing facility inspection programs, with priority for facilities in localities with community transmission of coronavirus.
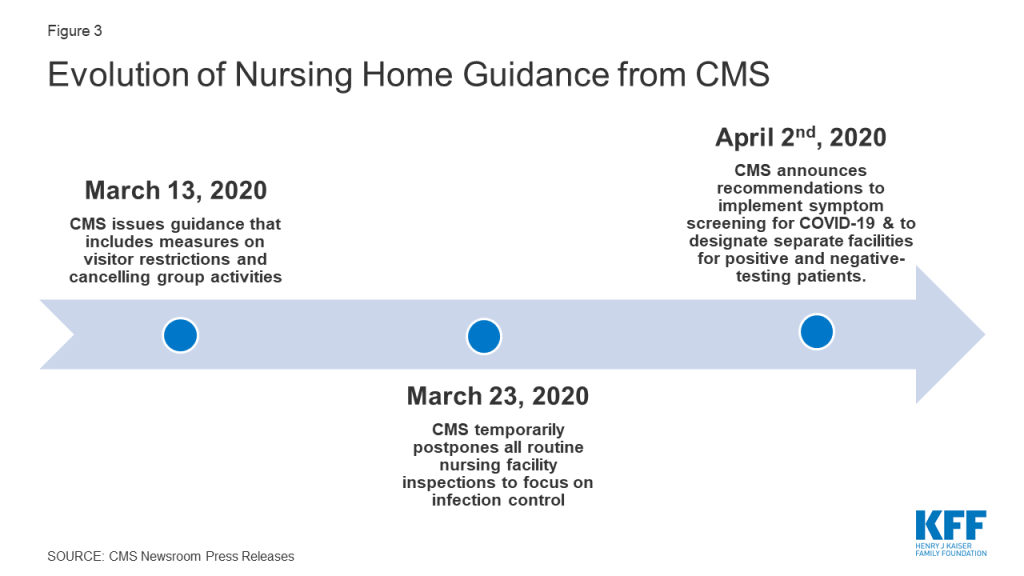
CMS has taken several actions to address the impact of COVID-19 in institutional LTSS facilities. On March 13, 2020, CMS issued a memo to State Survey Agency Directors that provided guidance on infection control and prevention of COVID-19 in nursing homes.4 This guidance included measures that restricted all visitors (with exceptions for compassionate care), volunteers and other nonessential personnel, and implemented active screening of residents and staff for fever and respiratory symptoms. On March 23, 2020, CMS announced that it is temporarily postponing all routine nursing facility inspections to focus solely on infection control and “Immediate Jeopardy” situations, which are situations in which a patient’s safety is placed in imminent danger. CMS also is recommending that 1) facilities administer their own self-assessments to determine whether they are prepared for an outbreak, and 2) residents and families ask facilities for results of the self-assessments. This guidance is based on CMS’s preliminary findings from its inspection of the Kirkland, Washington nursing home, the site of a COVID-19 outbreak affecting many residents and staff.5 CMS released further guidance on April 2nd, 2020 that includes recommendations to implement coronavirus symptom screening for all staff, residents, and visitors; use appropriate PPE when interacting with patients and residents, to the extent that it is available and used within the guidance of PPE conservation; and designate separate facilities for coronavirus negative residents from coronavirus positive residents and individuals with unknown coronavirus status.6 Notably, CMS has not provided guidance to nursing homes about reporting cases and deaths attributed to coronavirus in their facilities, which has led to a lack of reliable data and an inability to capture the extent of the issue.
Figure 3: Evolution of Nursing Home Guidance from CMS
Another high-risk population that the federal government has sought to address with new guidance are those in PACE programs. Nearly 50,000 people dually eligible for Medicare and Medicaid receive integrated care through a PACE organization (Appendix Table 1), prompting CMS to issue guidance on March 17, 2020 that all PACE organizations establish, implement, and maintain a documented infection control plan, and personnel be given and trained on the use of personal protective equipment (PPE).7
CMS also has encouraged and expanded the use of telehealth instead of in-person visits. CMS guidance on how states can use their Medicaid programs to cover telehealth services highlights that states have significant flexibility to deliver covered services through telehealth and provides policy options for states to reimburse Medicaid providers that provide telehealth services.8 On March 13, 2020, CMS also expanded Medicare’s telehealth benefits under Section 1135 waiver authority and as required by the Coronavirus Preparedness and Response Supplemental Appropriations Act to allow beneficiaries to receive healthcare services without having to travel to a healthcare facility. The changes apply to those receiving skilled nursing facility services, home health, and hospice. This expansion of benefits will also allow Medicare beneficiaries to receive care for various services, including common office visits, mental health counseling, and preventive health screenings.9
Looking Ahead
State and federal policymakers are responding to a rapidly changing environment as the COVID-19 emergency progresses. Looking ahead, state budget pressures and a looming recession will present additional financial challenges and pressures for states. In the days and weeks ahead, nursing home capacity also will be challenged to care for patients discharged from hospitals, freeing acute care beds for subsequent patients in need of care while also striving to control the spread of infection. Ongoing challenges likely will result from COVID-19’s impact on direct care workers, which in turn may limit seniors and people with disabilities and chronic illnesses’ ability to receive services on which they depend to meet daily self-care and independent living needs. Greater access to coronavirus testing would allow for the identification of LTSS workers and others who may be asymptomatic but at risk of spreading the virus to vulnerable populations. Additionally, interruptions in access to medical supplies as a result of the COVID-19 emergency can interfere with people with disabilities’ ability to manage their daily health needs. As the pandemic continues, there will be a particular focus on people who need LTSS services — given their heightened risk and high rate of infection, severe illness, and mortality – and on policies to protect them and their caregivers.
Appendix
Appendix Table 1: LTSS Users by State and Setting or Authority
State
Certified Nursing Facility Residents
Assisted Living Facilities
ICF/IDD
Home health
Personal Care Services
Community First Choice
1915 (i)
1915 (c) Waiver
1115 waiver
PACE
Alabama
22,500
6,100
20
5,900
15,100
170
Alaska
600
1,900
<10
300
3,700
4,300
Arizona
11,300
20,330
140
Included in 1115
52,400
Arkansas
17,400
5,300
1,440
5,000
13,700
15,500
290
California
101,000
106,300
7,820
37,500
273,800
228,200
55,800
149,500
474,300
7,690
Colorado
16,100
12,700
170
23,500
100
46,300
4,440
Connecticut
22,700
1,600
430
30,700
3,200
600
28,300
Delaware
4,200
1,600
100
14,000
400
1,200
6,900
250
DC
2,400
320
8,600
6,000
200
6,900
Florida
72,700
70,500
2,710
20,800
3,200
102,500
2,180
Georgia
33,000
22,600
280
6,200
42,600
Hawaii
3,500
2,390
80
Included in 1115
2,900
8,500
Idaho
3,300
6,500
490
1,900
8,500
4,000
20,200
Illinois
66,600
28,600
6,620
14,400
161,600
Indiana
38,700
15,600
3,250
16,300
4,700
49,100
440
Iowa
23,600
1,500
2,010
12,400
7,100
30,400
560
Kansas
14,700
13,500
450
3,300
Included in 1115
28,700
520
Kentucky
22,800
10,100
430
15,400
24,300
Louisiana
26,200
5,200
4,960
6,600
14,200
20,600
460
Maine
5,900
5,800
160
1,900
3,300
7,500
Maryland
24,400
17,100
4,000
1,000
13,500
25,800
150
Massachusetts
38,700
14,900
410
52,200
45,000
30,600
4,690
Michigan
38,100
26,200
3,300
60,700
24,700
3,290
Minnesota
24,800
29,700
1,590
28,900
43,700
81,500
Mississippi
16,000
5,100
1,610
1,400
700
25,800
Missouri
37,900
11,700
440
4,100
65,600
33,900
Montana
4,200
5,000
40
600
500
3,400
5,700
Nebraska
11,400
7,700
390
200
3,800
11,800
200
Nevada
5,300
5,300
90
1,300
10,300
200
5,700
New Hampshire
6,400
4,000
30
1,400
100
9,200
New Jersey
44,000
17,200
1,880
50,300
49,500
10,700
25,000
New Mexico
5,700
3,700
260
4,000
Included in 1115
5,100
28,000
400
New York
101,500
29,500
5,560
101,400
116,200
NR
98,000
NR
5,170
North Carolina
35,800
26,500
3,160
9,900
44,700
25,300
2,120
North Dakota
5,500
4,700
460
1,100
1,300
5,800
180
Ohio
73,800
33,900
6,150
26,900
7,000
111,400
490
Oklahoma
18,400
7,500
3,600
3,800
26,200
540
Oregon
7,300
23,700
300
3,100
36,500
64,200
1,540
Pennsylvania
76,700
43,200
2,990
26,300
119,700
7,060
Rhode Island
7,800
3,100
40
8,800
400
5,500
320
South Carolina
17,000
9,000
1,170
500
35,200
430
South Dakota
6,000
3,800
190
11,200
1,600
5,900
Tennessee
26,500
13,300
940
11,200
7,800
17,500
260
Texas
92,300
32,300
7,890
11,600
369,700
30,000
200
48,100
68,800
1,140
Utah
5,200
6,300
200
3,100
200
9,300
Vermont
2,400
2,500
<10
3,700
1,400
10,600
Virginia
27,600
17,900
470
1,600
51,300
1,400
Washington
16,000
36,200
750
4,600
1,200
77,900
64,500
1,000
840
West Virginia
9,300
2,752
510
8,100
5,700
10,900
Wisconsin
24,200
28,400
790
5,900
17,900
89,900
540
Wyoming
2,400
1,000
70
400
5,300
130
US TOTAL
1,321,700
811,300
74,610
616,800
1,173,900
392,700
81,000
1,806,600
698,500
47,870
NOTES: Data reported ranges from FY 2016 – 2020, based on availability. Enrollment cannot be compared between populations due to different data sources and time periods. Enrollment cannot be summed across settings due to unknown duplication. Blanks mean the state does not serve that population or they did not report data for that year. Assisted Living Facility enrollment also includes other Residential Care Community enrollment.
SOURCES: KFF analysis of FY 2017 CASPER data (nursing facility residents), National Study of Long-Term Care Providers (residential care community residents), University of Minnesota, Institute on Community Integration (ICF/IDD residents), KFF Medicaid HCBS Program Survey, FY 2018 (HCBS enrollment), and February 2020 PACE Enrollment from Integrated Care Resource Center.
Appendix Table 2: Medicaid LTSS Authorities Available in Emergencies
Allowed by Existing Regulations
Allow self-attestation to verify eligibility for all criteria except citizenship and immigration status on a case-by-case basis; verify assets if financial institution unable to verify due to disaster; verify incurred medical expenses for spend down eligibility
Extend renewal timeframes
Temporarily suspend periodic data checks on case-by-case basis
Temporarily delay acting on certain changes in circumstances affecting eligibility
Reinstate services or eligibility if discontinued because whereabouts unknown due to evacuation, after whereabouts become known and if still eligible
Consider people evacuated from state as temporarily absent to maintain enrollment
Suspend adverse actions for those in disaster area where state has completed determination but has not yet sent notice or state believes notice likely not received
Temporarily increase HCBS waiver service payment rates if no change to rate methodology and no impact on cost neutrality
State Plan Amendment – Can be Retroactive to 1st Day of Quarter, and to 1/1/20, using Section 1135 authority
Coverage:
Apply host state’s asset limit, or if less restrictive, asset limit from state where individual evacuated (if statewide rule)
Enrollment::
Extend hospital presumptive eligibility to non-MAGI groups
Benefits:
Offer additional benefits, such as state plan HCBS (if comparable for all categorically needy groups and statewide with free choice of provider, or via alternative benefit plan with free choice of provider)
Change amount, duration, or scope of covered benefits
Amend payment methodology to account for increased cost of personal protective equipment for home care workers
Health Plan Contract/Oversight
Temporarily suspend out of network requirements for managed care enrollees
Require health plans to expedite processing of new prior authorization requests and allow flexibility in documentation (e.g., physician signature)
Section 1115 Waiver – state is deemed to meet budget neutrality if federally declared disaster, waiver can be retroactive to date of Secretary-declared public health emergency, exemptions from public notice in emergencies
Temporarily suspend requirement to be institutionalized at least 30 days and have income below 300% SSI to be eligible for special income group
Temporarily suspend asset transfer rules for those placed in nursing homes
Apply host state’s asset limit, or if less restrictive, asset limit from state where individual evacuated (if less than statewide)
Do not reduce institutional provider payments by post-eligibility treatment of income
Section 1135 Waiver – if President declares national emergency and HHS Secretary declares public health emergency
Benefits:
Temporarily suspend fee-for-service prior authorization requirements and/or require providers to extend prior authorization through the termination of emergency declaration
Covered Providers:
Temporarily waive requirements for out-of-state providers to be licensed in state where they are providing services if provider is licensed by another state Medicaid agency or Medicare
Temporarily waive provider screening requirements, such as application fees, criminal background checks, and site visits, to ensure sufficient number of providers
Temporarily cease revalidation of providers in state or who are otherwise directly impacted by disaster
Temporarily suspend pending enforcement or termination actions or payment denial sanction to specific provider
Allow facilities to provide services in alternative settings such as temporary shelters when provider facility is inaccessible
Provide nursing home care to evacuees in host state for less than 30 days if individual is Medicaid-eligible in home state
Temporarily suspend pre-admission screening and annual resident review assessments for 30 days
Extend minimum data set authorizations for nursing home and skilled nursing facility residents
Temporarily suspend requirement that home health agency aides be supervised for 2 weeks by registered nurse
Temporarily suspend requirement that hospice aides be supervised by registered nurse every 14 days
Modify or suspend certain state survey agency activities
Section 1915 (c) Home and Community-based Services Waiver Appendix K – can be submitted before or during emergency, can be retroactive to date of event
Eligibility:
Increase number of unduplicated waiver enrollees
Temporarily increase individual cost limit to assure health and welfare
Modify eligibility targeting criteria to serve more enrollees and forestall institutionalization in emergency
Extend level of care authorizations for 12 months
Benefits:
Add covered services not expressly authorized in statute if necessary to assist waiver enrollees to avoid institutionalization
Modify scope of covered services and temporarily exceed individual service limits to ensure health and welfare
Institute or expand self-direction
Temporarily suspend prior authorization and extend medical necessity authorizations
Modify person-centered planning process, including qualifications of individuals required to develop plan
Providers:
Temporarily increase payment rates with a temporary change in rate methodology and/or impact on cost neutrality
Amend payment methodology to account for increased cost of personal protective equipment for home care workers
Allow payment for services provided by family caregivers or legally responsible relatives
Temporarily modify provider types, qualifications, and licensure or other setting requirements
Include retainer payments to personal care assistants when waiver enrollee is hospitalized or absent from home up to 30 days
Expand covered settings to include out-of-state
Temporarily allow payment for waiver services up to 30 days to support enrollees in acute care hospital or short-term institutional stay when services are required for communication and behavioral stabilization and not provided by institution
With millions expected to be hospitalized during the COVID-19 pandemic, the U.S. health care system will be tested as it never has been before. In response, Congress has passed the Coronavirus Aid, Relief, and Economic Security (CARES) Act, which allocates $100 billion in assistance for hospitals and other health care providers. The Trump administration has signaled that it will use some of these funds to reimburse hospitals for treating uninsured COVID-19 patients at Medicare payment rates, which the CARES act also increased by 20% for COVID-19 treatment during the crisis. However, some have raised concerns that even these increased Medicare rates may not be sufficient.
Prior to the outbreak, national and state-level policymakers were already debating several proposals that would build on Medicare’s payment structure – including Medicare-for-All and various public option proposals – to establish standardized rates for hospitals, physicians, and other health care providers. While supporters point to potential coverage gains and reductions in national health spending, critics contend that bringing private insurer payments closer to Medicare rates could threaten providers’ financial viability. Once the U.S. overcomes the immediate public health emergency, attention will likely return to underlying questions regarding provider payments, as well as their impact on health expenditures and out-of-pocket costs. To inform both discussions, this issue brief reviews the findings of 19 recent studies comparing Medicare and private health insurance payment rates for hospital care and physician services.
Key Findings
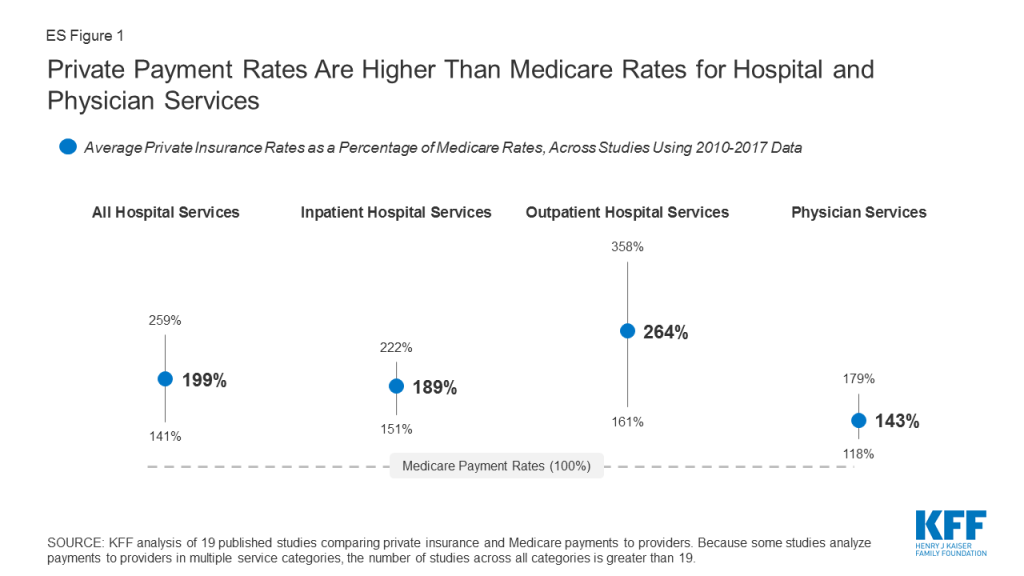
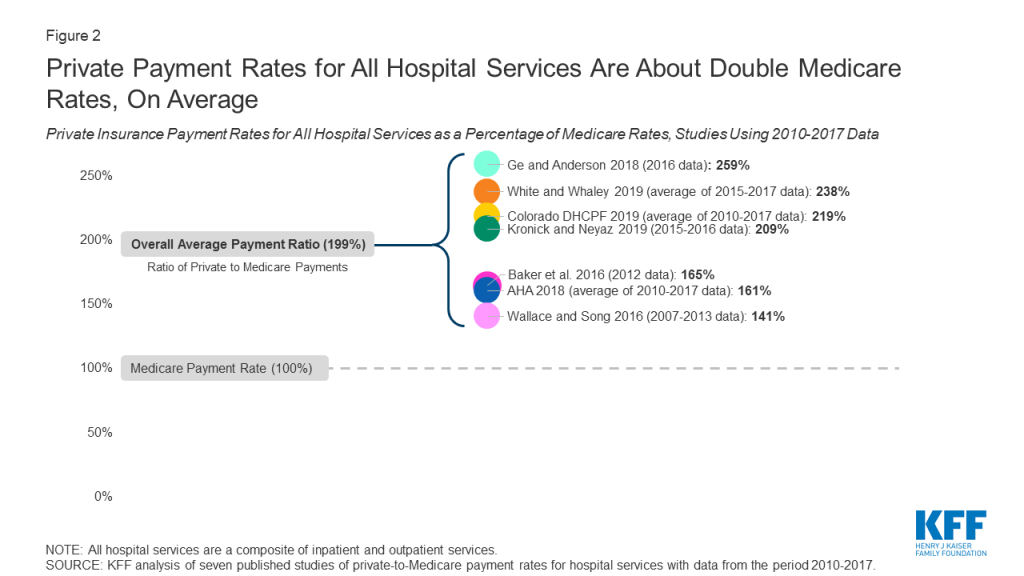
Private insurers paid nearly double Medicare rates for all hospital services (199% of Medicare rates, on average), ranging from 141% to 259% of Medicare rates across the reviewed studies.
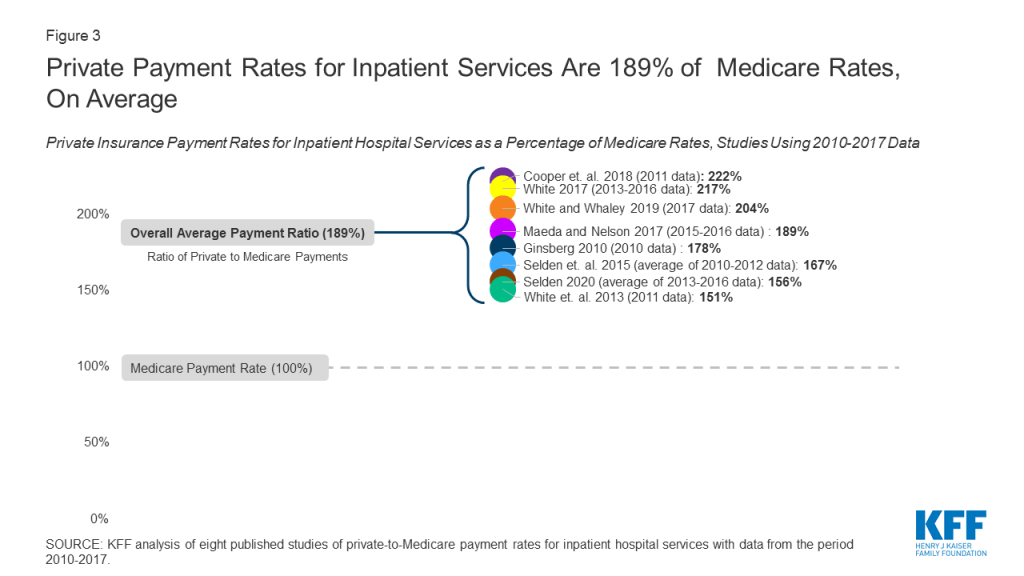
The difference between private and Medicare rates was greater for outpatient than inpatient hospital services, which averaged 264% and 189% of Medicare rates overall, respectively.
For physician services, private insurance paid 143% of Medicare rates, on average, ranging from 118% to 179% of Medicare rates across studies.
Across all studies, payments from private insurers are much higher than Medicare payments for both hospital and physician services, although the magnitude of the difference varies (ES Figure 1). Differences across studies may be due to a number of factors, including the representativeness of hospitals, physicians, and insurers used in the analysis, the data collection period, and the characteristics of the markets examined by each study, with some studies focusing on highly consolidated health care markets where providers have stronger negotiating leverage over insurers. (For study descriptions, see the Appendix Table).
Figure 1: Private Payment Rates Are Higher Than Medicare Rates for Hospital and Physician Services
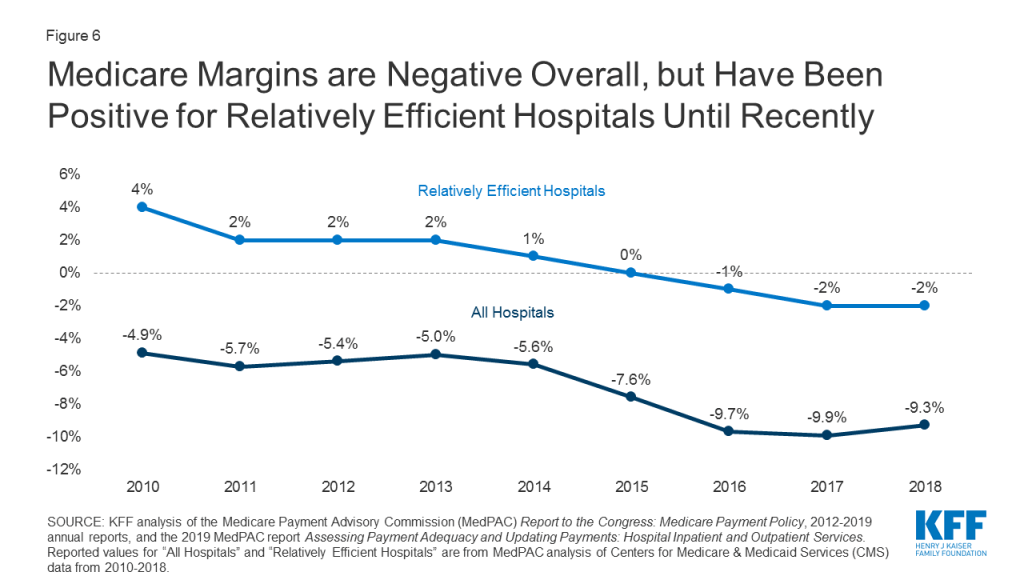
Policymakers and analysts continue to debate whether relatively high payments from private payers are necessary to compensate for lower Medicare payments, and the extent to which providers could operate more efficiently to reduce costs. If provider payments were phased down closer to Medicare levels, providers would have stronger incentives to become more efficient, which could help make health coverage and care more affordable for patients and employers. However, even some relatively efficient providers appear to have been be losing money on Medicare patients over the past few years, prompting some leading public option and Medicare for all proposals to set hospital payments somewhat above current Medicare rates. While providers may be able to operate more efficiently than they do today, a transition period may be needed to give providers and payers time to adapt to lower payments, and to assess the potential implications for the quality and accessibility of care.
Background
Health care spending in the United States is high and growing faster than the economy. In 2018, health expenditures accounted for 17.7% of the national gross domestic product (GDP), and are projected to grow to a fifth of the national GDP by 2027.1 Several recent health reform proposals aim to reduce future spending on health care while also expanding coverage to the nearly 28 million Americans who remain uninsured, and providing a more affordable source of coverage for people who struggle to pay their premiums.2 Some have argued that these goals can be achieved by aligning provider payments more closely with Medicare rates, whether in a public program, like Medicare-for-All, a national or state-based public option, or through state rate-setting initiatives.3,4,5,6,7,89,10,11
Moreover, the global COVID-19 pandemic has heightened the urgency surrounding Medicare provider payments. In response to rising financial strain on hospitals during the crisis, Congress passed the Coronavirus Aid, Relief, and Economic Security (CARES) Act, which allocates $100 billion to assist hospitals and other providers. The Trump administration has signaled that it will use some of this funding to reimburse hospitals for treating uninsured COVID-19 patients at Medicare payment rates. Additionally, the CARES Act temporarily suspended 2% Medicare payment reductions that had been mandated under federal sequestration, and increased Medicare rates for COVID-19 hospitalizations by 20% during the legislation’s emergency period.12 However, some have raised concerns that even these payments may not be sufficient, and that hospitals’ financial viability will become increasingly tenuous throughout the crisis.13 Thus, these two debates over the adequacy of Medicare’s payment structure – to meet the needs of the pandemic response in the short term, and to serve as a basis for broader national or state-level health reform in the long term – merit a close look at how Medicare provider payments fit into the broader U.S. health insurance system.
Private insurers currently play a dominant role in the U.S. In 2018, private insurance accounted for more than 40% of expenditures on both hospital care and physician services. In comparison, Medicare accounted for about one quarter of these expenditures in the same year.14 Consequently, adjustments to private insurers’ provider payment rates could have a profound impact on providers’ revenues, employers’ and privately insured Americans’ health spending, and national health spending overall.
Over the years, Medicare has adopted a number of payment systems to manage Medicare spending and encourage providers to operate more efficiently, which in turn has helped slow the growth in premiums and other costs for beneficiaries. For example, Medicare adopted its prospective payment system in 1983, which sets payment rates for hospitals in advance based on categories of hospital services known as diagnosis-related groups (DRGs). These payments are updated periodically to account for changes in providers’ operating costs, and are adjusted for factors such as direct and indirect expenses for graduate medical education (DGME and IME payments) and whether a disproportionate share of a hospitals’ patients are Medicare beneficiaries (DSH payments).15 Since then, policymakers have made numerous modifications to this methodology, including a change adopted by the ACA in 2010 that adjusts annual updates in Medicare payments to hospitals for assumed productivity increases, resulting in lower payment rates and significant savings for Medicare.16 Medicare has also adopted a number of specific payment systems for virtually every type of health care provider, building in incentives for providers to become more financially efficient.
By contrast, private insurers’ payment rates are typically determined through negotiations with providers, and so vary depending on market conditions, such as the bargaining power of individual providers relative to insurers in a community. Accordingly, Medicare has been able to limit growth in expenditures per enrollee more effectively than private insurers at several points in recent decades.17,18
Proponents of proposals to broaden the use of Medicare rates, or to use a multiplier of Medicare rates as a benchmark, say that such an approach would help make expanding coverage more affordable and reduce excess costs in the U.S. health care system. In an effort to broaden coverage through an affordable public option, Washington State recently adopted a proposal to establish a public option that would set payments at 160% of Medicare rates, and other states – most notably Colorado, which is also considering a public option with payments set at a percentage of Medicare rates – may soon follow Washington’s lead.19,20 Rate-setting programs in Maryland and Vermont do not tie provider payments to an explicit percentage of Medicare rates, but rather their “all-payer” programs allow their respective state governments to set payment rates for hospitals (in Maryland) and for providers in participating Accountable Care Organizations (in Vermont), and have achieved savings on state-level health expenditures by some measures.21
However, some have raised concerns that Medicare payments are not keeping pace with provider costs. For example, following the enactment of productivity adjustments to hospital payments in the ACA of 2010, and further reductions under the Budget Control Act of 2011, the Department of Health and Human Services (HHS) actuaries warned that the reductions in payments could eventually make it difficult for hospitals to operate profitably – a concern amplified by the hospital industry.22,23 Similar red flags were raised with respect to the formula set in law for physician payments, known as the Sustainable Growth Rate, or SGR, which Congress modified repeatedly to avoid annual reductions in Medicare payments. The SGR was ultimately repealed, but left in its wake some concern that future payments would not keep pace with practice costs.24 Citing these issues, some have argued that the financial strain imposed by lower payment rates may render many hospitals and physician practices unsustainable, jeopardizing patient care.25,26 Ultimately, the capacity of providers to operate successfully would likely depend on the magnitude of the gap between private and Medicare rates, and other factors such as how effectively and quickly they are able to respond to reduced payments by improving their efficiency.
To bring together available evidence on these issues, this brief first reviews recent studies comparing private insurers’ and Medicare’s provider payment rates, focusing on studies that examine hospital services and physician services over the period from 2010 to 2017. We summarize the results of studies examining payments for hospital and physician services, and explore methodological factors that may explain variation in estimates across studies. Finally, we review available literature comparing hospitals’ and physician practices’ costs to Medicare payments, and discuss the potential implications of bringing provider payments closer to Medicare rates.
Medicare vs. Private Insurance Rates: Literature Review
This brief reviews findings from studies that compare Medicare and private insurance rates for hospital and physician services. We include studies with data from 2010 onward to reflect changes to Medicare provider payment rates established by the Affordable Care Act, and subsequent policy adjustments over the past decade. We identified 19 relevant studies through keyword searches of academic search engines, as well as the websites of governmental, research, and policy organizations that publish work related to health care and health economics. These studies analyze data reported by the Centers for Medicare and Medicaid Services, private insurers, hospitals, and physician practices.
Of these 19 studies, 14 addressed payments to hospitals, eight of which addressed payments for inpatient hospital services, five addressed payments for outpatient services, and seven reported relative payment rates for both types of hospital services combined, with some overlap across studies. Eight studies addressed payment rates for physician services. The full search methodology is described in the Methods section.
To compare findings across multiple studies, we focus on private insurance payments as a percentage of corresponding Medicare payment rates reported by each study. We calculate the average across all studies, by provider category, such as inpatient hospital care. Due to the relatively small number of studies available, our calculation of an overall average gives each study equal weight, recognizing that each varies substantially in methods, data sources, the number and representativeness of providers and payers examined, and geographic focus (e.g., some studies are based on national data while others are state-specific).
For studies that report private-to-Medicare payment rate ratios for multiple years, we calculate an average across years to create one estimate used for the cross-study average. These included studies by the American Hospital Association (AHA), the Colorado Department of Health Care Policy and Financing (DHCPF), White and Whaley’s 2019 study, and two studies by Selden and colleagues published in 2015 and 2020, respectively. This approach prevents disproportionate weighting of results from studies that reported rates for multiple years. Moreover, we do not weight studies differently based on factors such as their geographic scope; studies that examined nationwide provider markets are given equal weight to those that focused on rates for provider in selected states or smaller markets, which may skew overall averages toward the prevailing private-to-Medicare payment ratios in these particular markets. (See the Appendix Table for methodological details for each study).
INPATIENT AND OUTPATIENT HOSPITAL SERVICES (COMBINED)
Of the eleven studies that examined differences between Medicare and private insurance rates for hospitals, seven did not distinguish between inpatient and outpatient hospital services. Across these seven studies, private insurance rates for inpatient and outpatient hospital services averaged 199% of Medicare rates, but the results varied widely, ranging from 141% (Wallace and Song, using nationwide data) to 259% (Ge and Anderson, using data specific to hospitals in Florida, which the authors note are disproportionately private, for-profit hospitals) of Medicare levels (Figure 2). However, the variation within studies was often substantially wider, as the ratio of private-to-Medicare rates often differed dramatically across markets, services, and even individual hospitals. The greatest variation was observed in Ge and Anderson’s study of Florida hospitals, which found private insurance payments ranging from 170% to over 1400% across Hospital Referral Regions (HRRs) in the state. White and Whaley’s multi-state analysis also found notably large variation at the level of individual hospitals, ranging from approximately 150% to 450% of Medicare rates for the composite of inpatient and outpatient services. These findings suggest that, even within a given health care market, some individual hospitals may be outliers in that they can command extremely high private reimbursements.
Figure 2: Private Payment Rates for All Hospital Services Are About Double Medicare Rates, On Average
INPATIENT HOSPITAL SERVICES
Eight studies compared private insurance and Medicare payment rates for inpatient hospital services. Private insurance payment rates for inpatient hospital services averaged 189% of Medicare rates across studies, ranging from 150% (White and colleagues, 2013 analysis) to 222% (Cooper and colleagues, 2018) (Figure 3). Within studies, the greatest variation was seen in White and Whaley’s analysis, which reported private-to-Medicare payment ratios for inpatient hospital services ranging from 34% to 581% across individual hospital systems. This range was comparable to the variation seen across specific inpatient services in Cooper and colleagues’ study, which ranged from 161% for vaginal deliveries to 400% for lower extremity MRI, as well as the range of 84% to 484% across markets reported by Ginsburg.
Figure 3: Private Payment Rates for Inpatient Services Are 189% of Medicare Rates, On Average
As with the analysis combining inpatient and outpatient services, we averaged estimates for each year in studies that present multiple years of results based on the same methodology and data source. In keeping with this approach, we also averaged results from the 2015 and 2020 studies published by Selden and colleagues, as both studies intentionally used the same data source and methodology.
There is notably less variation in the ratio of private-to-Medicare payments among studies of inpatient hospital payments than studies that examine rates for all hospital services combined, as may be expected since the range of services represented is narrower.
OUTPATIENT HOSPITAL SERVICES
Five of the reviewed studies examined the difference between private insurance rates and Medicare rates for outpatient hospital services. Across these studies, the ratio of private-to-Medicare payment rates fluctuated more than they did for combined hospital services or for inpatient hospital services. Results ranged from a low of 150% of Medicare rates in the final year of Selden’s 2020 study of hospitals nationwide to a high of 358% in White’s 2017 study of Indiana hospitals (Figure 4), averaging 264% of Medicare rates overall. Within studies, the greatest variation was seen in White and Whaley’s analysis, in which private-to-Medicare payment ratios for outpatient services ranged from 50% to as high as 2958%. Notably, Ginsburg also reported a wide range across major metropolitan markets from 158% to 718% of Medicare rates, and Cooper reported a range of 171% to 496% across specific outpatient services.
Figure 4: Private Payment Rates for Outpatient Services Are 264% of Medicare Rates, On Average
The relatively high private-to-Medicare payment ratio reported by White’s 2017 study (358%) is partly attributable to the fact that the analysis was limited to hospitals in Indiana, which, according to White and Whaley in their 2019 multi-state follow-up study, has exceptionally high degree of hospital consolidation compared to other state hospital markets. If this one study is excluded, the overall average for outpatient hospital services drops from 264% to 240% of Medicare payment rates.
FACTORS ASSOCIATED WITH VARIATION ACROSS STUDIES OF HOSPITAL RATES
Several factors may contribute to variations in estimates across studies, including: the representativeness of hospitals and private insurers; the relative market power of hospitals and insurers in the markets included in the analysis; the types of hospital services examined; the components of private insurance and Medicare payments used to calculate their respective payment rates; and the treatment of out-of-network payments. These factors are described in greater detail below and in the Appendix Table.
Hospital and Insurer Market Power. The gap between Medicare and private insurance rates in a given market is a function of the market power of hospitals relative to that of local insurers, as hospitals or hospital systems with more negotiating leverage can generally obtain higher payment rates from insurers.27,28,29,30,31 Studies using data from markets in which hospitals exhibited a relatively high degree of market concentration tended to report higher private insurance payment rates relative to Medicare rates, such as White’s 2017 analysis of hospitals in Indiana, which White and Whaley attribute to the statewide dominance of six large hospital systems in their multi-state follow-up study.32,33 A similar pattern was observed in studies that looked at several different hospital markets. Ginsburg notes that the private-to-Medicare payment ratio was highest in cities with greater hospital concentration (e.g., San Francisco and Richmond) for both inpatient and outpatient hospital services, and White and Whaley report a similar trend across state-level hospital markets.34,35.Conversely, studies in which private insurers had greater market power tended to report lower private insurance payment rates relative to Medicare rates. For example, the 2013 analysis by White and colleagues was limited to hospitals in Michigan, which White and Whaley found to have the lowest average hospital prices across all services among the states included in their 2019 analysis. The authors attribute this to the outsized market share of Blue Cross Blue Shield of Michigan in the statewide insurance market, which, according to the authors, gives this insurer exceptionally strong negotiating power over Michigan hospitals.36,37
Hospital Type. The reviewed studies differ in the extent to which they are representative of all hospitals, which is likely to affect the ratio of private payments to Medicare rates. For example, Ge and Anderson limit their analysis to private, short-term hospitals in Florida, which the authors note has an exceptionally high proportion of for-profit hospitals compared to the national average, potentially contributing to relatively high private insurance payments relative to Medicare rates.38 In contrast, the American Hospital Association (AHA) analyses are based on a data reported by over six thousand hospitals nationwide, including academic medical centers, community hospitals, and non-profit hospitals, which may explain the lower estimates of the private-to-Medicare hospital payment ratio than for-profit hospitals.39
Selection of Insurers. Without comparable, nationally representative private insurance payment data to compare to Medicare payment rates, some researchers have relied on convenience samples to compare the rates paid by private insurers and Medicare. Several studies, for example, use data from only a few large private insurers, which captures payments for a large share of private patients, but excludes payment rates from other insurers who may have less market power. Studies by Baker and colleagues, Cooper and colleagues, and Maeda and Nelson analyze claims provided by the Health Care Cost Institute (HCCI) for three large private insurers (UnitedHealthcare, Humana, and Aetna), and Ginsburg uses data from four payers.40,41,42.In contrast, Wallace and Song use a claims database in which over 300 private payers are represented, reflecting a more diverse array of insurance markets across the U.S.43 Other authors use data from state all-payer claims databases or state hospital financial reports, which encompass private payments for hospital care across all commercial insurers and other private plans.
Types of Hospital Services. The types of hospital services examined by each study may also affect the ratio of private insurance to Medicare payment rates, particularly when either procedural services or routine evaluation and management services are disproportionately represented. For example, Wallace and Song limit their analysis to services for which cost-sharing components for patients are roughly comparable across both Medicare and private insurers, leading them to focus on imaging services and surgical procedures.44 Given the concern of the Medicare Payment Advisory Commission (MedPAC) that these services are reimbursed at disproportionally higher rates by Medicare than routine evaluation and management services, this approach may skew estimated Medicare rates upward and reduce the ratio of private-to-Medicare payments.45 In contrast, studies such as White and Whaley’s analysis that include a higher proportion of claims for non-procedural services likely generate lower estimates of Medicare rates.
Payment Components. While nearly all of the studies calculate private insurance and Medicare payment rates directly from claim reimbursement or hospital payment amounts, studies varied in the types of payments that were included in these amounts. This is particularly important in the estimation of Medicare payment rates due to the variety of hospital payments allowed under the Medicare Prospective Payment System, such as those for hospitals with IME expenses or DSH status.46,47 Baker and colleagues include the majority of these categories of additional Medicare payments, including outlier case payments and one-time payments for capital, which are excluded in most other studies, which as might be expected, contributes to a relatively low ratio of private-to-Medicare payment rates.48.By contrast, the analysis by Kronick and Neyaz relies on cost and charge data reported at the level of specific hospital units (e.g., diagnostic radiology, surgical intensive care, labor and delivery, etc.), and so excludes Medicare payments that cannot be solely attributed to them, such as those for IME.49 Other studies simulate the amounts that Medicare would have paid for the same hospital services reflected in their private claims data. When actual Medicare payment data are used, payment components that are associated with specific claims (such as those for direct medical education and geographic adjustments) are included in the reported rates, which may cause Medicare payments to appear higher relative to private insurance rates..Conversely, simulating Medicare rates based only on claim-level information may result in lower estimates of Medicare payments if some of these payment components are excluded (as in the Maeda and Nelson’s analysis, which excluded IME payments), though the three analyses by White and colleagues address this by simulating these additional payments as well.50,51,52,53.The reviewed studies vary in the payments they incorporate into their calculations of private insurance rates as well. For example, the AHA estimates are based on payment-to-cost ratios for hospital stays for each payer category, which, for private payments, includes stays that were paid by patients out-of-pocket without contributions from insurers.54 As Selden and colleagues note in their 2015 analysis, if hospitals do not ultimately collect as much from uninsured patients as they do from patients with private insurance, this approach would reduce estimates of average private payments, and could explain why the private-to-Medicare payment ratios derived from AHA data are lower than the overall average.55..Selden and colleagues’ 2015 analysis and 2020 follow-up study incorporate some payments by Medicare Advantage plans in their calculation of Medicare rates.56,57 However, available evidence suggests that Medicare Advantage payment rates are comparable to those paid by traditional Medicare for hospital services, so the effect of including these payments is likely minimal.58,59
Out-of-Network Claims. The proportion of out-of-network claims included in each analysis may also affect private insurance rates, as payments for out-of-network services are typically much higher than in-network payments for the same services.60 While the majority of the studies in this brief intentionally exclude out-of-network claims, White and Whaley note that the data used in their 2019 analysis did not contain enough information to reliably determine whether claims were out-of-network or in-network.61 While it is not clear what proportion of claims in this study were out-of-network, these payments may contribute to the relatively high private-to-Medicare ratio that the authors report.
PHYSICIAN SERVICES
Eight studies compared private insurance and Medicare payment rates for physician services. Private insurance rates averaged 143% of Medicare rates overall, ranging from 118% (Ginsburg, 2010) to 179% (Song, 2019) of Medicare levels across studies (Figure 5). Estimates from each year of the MedPAC analysis were averaged to calculate the overall average across the studies. Within studies, the greatest variation was seen in Pelech’s analysis, which reported a range of private-to-Medicare payment ratios for specific physician services from less than 80% for established patient office visits to over 400% for the physician service component of brain MRI. Ginsburg also reported a significant range across major metropolitan markets, ranging from 82% to 251%.
Figure 5: Private Payment Rates for Physician Services Are 143% of Medicare Rates, On Average
Across all studies, private insurance rates for physician services are substantially closer to Medicare levels than private insurance rates for hospital services, which suggests that physician groups generally have less negotiating leverage relative to private insurers than hospital groups. Nonetheless, the reviewed studies still demonstrate pronounced variation overall.
FACTORS ASSOCIATED WITH VARIATION ACROSS STUDIES OF PHYSICIAN PAYMENTS
Much of the variation in reported physician payment rates may be explained by methodological differences, several of which echo those seen among the reviewed studies of hospital payments. The most significant of these include the relative market power of physicians and insurers in the markets being examined, the types of physician services used for the comparison, the components of private insurance and Medicare payments included in the calculation of their respective payment rates, and the authors’ treatment of out-of-network payments.
Physician and Insurer Market Power. The results of the reviewed studies of physician payment rates appear to vary substantially due to differences in the market power of physician practices relative to private insurers. For example, Ginsburg’s analysis found: (1) lower private insurance rates relative to Medicare payments in major metropolitan areas, where physician practices face greater competition and hold less market power relative to insurers; (2) higher physician payment rates relative to Medicare in rural areas, where high demand for scarce physician services appears to give practices stronger negotiating leverage against insurers, and (3) lower private insurance payments for primary care specialties relative to Medicare, noting that specialty physician groups exhibited greater market consolidation than primary care groups in most of the markets studied.62.Pelech’s analysis found substantial variation in the private-to-Medicare payment ratio across geographic markets throughout the U.S. Citing the substantial variation in physician practices’ degree of consolidation and integration with hospitals observed among these markets, Pelech suggests that regions with higher private insurance payments also reflect greater physician market power relative to local private insurers.63
Types of Physician Services. The reviewed studies also differ in the types of services examined, with some emphasizing resource-intensive procedural services such as surgery and imaging, and others focusing on more “cognitive” services such as office visits and routine examinations. The majority of physician services included in Pelech’s analysis are high-RVU procedures or imaging studies, and Pelech reports a substantially higher ratio of private insurance payments relative to Medicare.64 In contrast, studies that limit their analysis to physician office visits (e.g., Biener and Selden, 2017) find relatively low ratios of private-to-Medicare rates compared to the overall average.65 As described above, Ginsburg finds a similar trend by physician specialty across several markets, suggesting that much of the difference in the private-to-Medicare payment ratio across physician services may be better explained by the relative market power of the different physician specialties. Trish and colleagues attempt to address this issue by examining a wide variety of services across several physician specialties, and find private insurance rates very close to the cross-study average.66.Most of the reviewed studies do not distinguish between physician services delivered in non-hospital facilities and those delivered in hospital outpatient departments. Under current Medicare policy, payment rates for some procedures rendered in hospital outpatient departments are often much higher than payments for identical services rendered in physician offices, an approach that MedPAC has recommended against in recent years.67 Consequently, Medicare rates may appear higher in areas where physicians have shifted much of their procedural care delivery to the hospital outpatient setting.
Private Insurance Claims Data. As noted earlier, researchers are typically at a disadvantage without access to comprehensive private insurance payments from all insurers, or a sample that is representative of all private insurance claims to compare with publicly reported Medicare data. Studies that use data from larger insurers that have exceptionally strong market power relative to physicians in many markets, such as the Ginsburg 2010 study, may observe relatively low private payments.68 A similar effect may be seen in the annual analyses conducted by MedPAC, which are based on claims data from only one large commercial PPO that operates nationwide.69 In contrast, Song’s analysis makes use of data from the Truven MarketScan commercial claims database (now known as IBM MarketScan), which reflects over 300 private payers.70 Compared to studies that use data only from a few large insurers, this dataset contains claims paid by several smaller insurers that do not have nationwide market penetration.
Payment Components. As was seen for hospitals, the payment components included in each analysis may also have a modest effect on their reported physician payment rates. The Medicare Physician Fee Schedule allows for several additions to its base payments, such as geographic cost variation, health professional shortage areas, and participation in alternative payment models such as the Merit-Based Incentive Payment System established by the Medicare Access and CHIP Reauthorization Act of 2015.71 Studies that incorporate many of these additional payments (such as those by Trish and colleagues and MedPAC) may produce higher Medicare rates and lower private-to-Medicare ratios.72,73 Studies that simulate how much Medicare would have paid based only on private claims that do not account for non-claim Medicare payment adjustments (such as Ginsburg’s and Song’s analyses) may produce lower estimates, although other studies simulate these additional non-claim payments as well (e.g., White and colleagues, 2013).74,75 The Wallace and Song analysis does not account for any of these Medicare payment adjustments, though the possible effect of these exclusions appears minimal given that their reported ratio of private-to-Medicare rates is near the overall average.76.Finally, the reviewed studies vary in their treatment of non-claim private payments, such as those that reflect capitation payments from private insurers, or additional out-of-pocket payments for balance billing. While most analyses exclude payments made outside of the usual claims process, Biener and Selden’s analysis is based on physician office billing data, so these additional payments are reflected in their estimations of private insurance and Medicare payment rates.77,78,79,80,81,82,83,84
Out-of-Network Claims. The inclusion and proportion of out-of-network claims may also contribute to the ratio of private-to-Medicare rates. For example, out-of-network claims make up a significant proportion of the total claims in Pelech’s analysis, as much as over 30% for some emergency services.85 Inclusion of these payments likely inflates estimates of private insurance rates relative to Medicare levels, which may partially explain why this study’s results are higher than the overall average. In contrast, Ginsburg and other authors exclude out-of-network claims from the source data, which may partially explain why their reported private insurance rate relative to Medicare is lower compared to the overall average across studies.86
Medicare Payments and Provider Costs
To assess the adequacy of Medicare’s hospital payment rates, MedPAC regularly compares the program’s payments to hospitals’ care delivery costs. Their findings show that, across all hospitals over the period from 2010 to 2018, costs for the treatment of Medicare beneficiaries have exceeded Medicare payments, resulting in negative and declining aggregate Medicare margins (Figure 6).87 Both MedPAC and American Hospital Association analyses show aggregate all-payer hospital margins have remained positive between 6% and 8% during the same period due to the contribution of private payers.88,89 Somehospital industry groups and researchers see these data as evidence that higher payment rates from private insurers are necessary to offset the financial strain of Medicare’s relatively low rates.90
Figure 6: Medicare Margins are Negative Overall, but Have Been Positive for Relatively Efficient Hospitals Until Recently
However, MedPAC and other researchers have argued that hospitals could do more to contain their costs.91,92,93,94,95,96,97,98,99,100,101,102,103 They point to the nationwide trend of growing hospital consolidation through mergers and the acquisition of physician practices over the past several decades, which has given hospitals increasingly strong market power relative to insurers.104105,106,107 Consequently, these researchers argue that outsize market power allows hospitals to negotiate increasingly high payment rates from private insurers unrelated to how Medicare’s payments compare to costs, easing the financial pressure on these hospitals to cut costs or improve their efficiency. In this alternative explanation, providers’ costs may grow faster than Medicare payments, and financial losses on Medicare patients steepen over time.108,109,110,111,112,113,114 In other words, they suggest that hospitals do not shift costs to private payers to make up for Medicare losses, but rather charge private payers what the market will bear.
Medicare payments have historically been adequate for many financially efficient providers, defined by MedPAC has separately examined Medicare margins across hospitals it designates as “relatively efficient” (with costs below a defined threshold, among other metrics), finding a consistently positive overall Medicare margin for this subset of hospitals until about 2015. However, even this margin has also been slightly negative since 2016. MedPAC has recommended that previously planned Medicare payment updates should be increased to correct for this, though maintains the view that holding Medicare payments close to efficient hospitals’ costs is desirable because it places pressure on hospitals to improve their efficiency.115
Physician groups have also pointed out discrepancies between their practice costs and Medicare payments.116,117 Because there is no required national cost reporting for physician practices as there is for hospitals, CMS and researchers rely on small, sporadic surveys of physicians and practice managers. These include the Physician Practice Information Survey (PPIS) conducted by the American Medical Association in 2007 and 2008. PPIS data are still used in the calculation of the Medicare Economic Index (MEI), which measures inflation in the prices of goods and services needed to operate a physician practice. CMS uses the MEI as a major factor in the determination of annual payment rate updates to the Medicare Physician Fee Schedule.118 For this reason, MedPAC also tracks changes in the MEI relative to changes in Medicare provider payments as an indirect measure of payment adequacy.
MedPAC analyses from 2010 to 2017 found that payment updates to Medicare’s Physician Fee Schedule increased cumulatively by 11% over that period, while the MEI increased cumulatively by 33%.119 To the extent that the MEI is a reliable indicator of the cost of providing care, this suggests Medicare’s payment updates may not have kept up with growing costs for some physicians. However, there has long been concern that the MEI does not accurately represent modern physician practices’ costs, given limitations in the original PPIS survey data and the fact that they are now over a decade old.120,121,122,123,124125 Physicians and researchers have called for CMS to update its methodology for estimating practice costs.126,127 MedPAC has specifically recommended that CMS use data from a cohort of “relatively efficient” practices as it already does for hospitals, arguing that this would allow for a more accurate – and, likely, more favorable – determination of Medicare payment adequacy.128 MedPAC has also proposed a number of Medicare payment adjustments that would boost payment rates for primary care physicians and increase the relative valuation of routine evaluation and management services, which would likely improve the adequacy of Medicare payments for many primary care practices.129,130 However, as for hospitals, MedPAC maintains that holding Medicare payment rates close to practice costs incentivizes physician practices to become more efficient.131
Discussion
Based on the reviewed studies comparing Medicare and private insurance rates for hospital and physician services, this brief finds that private insurance payments are consistently greater, averaging 199% of Medicare rates for hospital services overall, 189% of Medicare rates for inpatient hospital services, 264% of Medicare rates for outpatient hospital services, and 143% of Medicare rates for physician services. However, there is wide variation across studies due to different market dynamics in different parts of the country and for different types of medical care as well as differences in the studies’ methodology and data sources. Private payment rates for hospitals averaged as high as 358% of Medicare rates in a study of a highly concentrated state-level hospital market, and as low as 151% of Medicare rates in a study of a market with one dominant private insurer, with individual studies demonstrating even greater variation across markets, services, and individual hospitals.
Some providers have argued that Medicare payment rates are too low to cover the reasonable cost of care, and that these shortfalls lead them to raise prices for private payers. However, much of the literature suggests that providers negotiate prices with private insurers irrespective of Medicare rates, and that providers with substantial market power are best positioned to command high prices, allowing them to evade financial pressure to become more efficient.
Moreover, the costs of operating a hospital or physician practice are not fixed, and fluctuate depending on factors such as available revenues. Currently, many hospitals are facing new costs associated with the infrastructure and resources needed to treat COVID-19 patients, which may require transitional funding increases such as those implemented by the CARES Act. However, once the pandemic has passed, an increased role for Medicare reimbursements could lead many hospitals and other health care providers to phase down their operating costs accordingly. Thus, predictions of widespread provider closures under Medicare-based reform proposals may be overstated, particularly for proposals that set rates higher than current Medicare rates. If private insurers’ payments were brought closer to Medicare levels, even providers whose market power has thus far protected them from financial pressure would have a strong incentive to constrain their costs, which may lead to substantial reductions in national health spending on hospital and physician services.
Proposals that would extend Medicare rates, or a multiplier of Medicare rates, to a broader population –such as Medicare-for-All and public option proposals – could also contribute to lower premiums, deductibles, and point-of-care costs for patients. Lower provider payments could lead to lower per capita spending, leading in turn to lower out-of-pocket costs. Employers could also realize savings under proposals that extend Medicare rates to private insurers, which could allow them to redirect some funds currently spent on employee health coverage, including toward wages. Particularly during the current pandemic, it is worth noting that many privately insured patients hospitalized with COVID-19 would have faced lower out-of-pocket costs if their treatment had been reimbursed at Medicare rates.
However, the fact that even some relatively efficient providers are now losing money on Medicare suggests that the capacity of providers to become more efficient will vary substantially. To address these concerns, some states are moving forward with proposals to establish rates that are higher than Medicare rates but lower than rates currently paid by private insurers, and the current Medicare program has increased payments for inpatient COVID-19 care to better meet the needs of the pandemic response. Even after overcoming the current crisis, federal and state policymakers will continue facing difficult choices as they seek to rein in health spending while safeguarding the accessibility and quality of care.
Methods
This literature review summarizes findings from 19 studies that compare payment rates paid by private insurers and Medicare for hospital care and physician services, using data pertaining to the period from 2010 to the present. Studies that only addressed other types of providers such as home health services and long-term care facilities were excluded. The studies reviewed in this brief are limited to those that compare private insurance rates with rates under traditional fee-for-service Medicare; studies that addressed only payments by Medicare Advantage plans were excluded.
To collect relevant studies that met these criteria, the authors conducted keyword searches of PubMed, Google Scholar, EconPapers, and other academic search engines, as well as the websites of governmental, research, and policy organizations that publish work related to health care and health economics. Additional studies found in the reference lists that resulted from the initial search were also included. These included a larger body of supporting research, which is cited throughout this brief to provide additional historical and scientific context to the results presented.
Nineteen studies comparing private and Medicare provider payment rates were identified. Of these, 14 studies addressed payments to hospitals, with eight addressing payments for inpatient services, five addressing payments for outpatient services, and seven reporting relative payment rates for both types of hospital services combined, with some overlap among studies. Eight of the studies identified addressed payment rates for physician services.
Studies reported their results in various formats; for the purposes of this brief, all reported results are expressed in the form of private insurance rates as a percentage of Medicare rates. For each category of study (inpatient and outpatient hospital services combined, inpatient hospital services, outpatient hospital services, and physician services), the overall average private insurance payment rate as a percentage of the Medicare rate was calculated across all studies. In these calculations, each study is given equal weight, and no outliers are removed. For studies that report private-to-Medicare payment rate ratios for multiple years, we calculate an average across years that is used in the calculation of the cross-study average, preventing disproportionate weighting of studies that reported rates for multiple years. Studies were not weighted differently based on factors such as geographic scope or the number of providers, insurers, claims, etc. included in the analysis.
This work was supported in part by Arnold Ventures. We value our funders. KFF maintains full editorial control over all of its policy analysis, polling, and journalism activities.
Eric John Lopez is a KFF-UCSF Health Policy Fellow. Tricia Neuman and Larry Levitt are with the Kaiser Family Foundation. Gretchen Jacobson was at the Kaiser Family Foundation when this report was written.
Appendix Table
Appendix Table: Summary Of The Data Sources And Methodological Details For The Reviewed Studies
Study
Data Year(s)
Payments Addressed
Data Sources, Methodology, and Factors Influencing Results
American Hospital Association Annual Survey 2018
2010-2017
Hospital
Source data: American Hospital Association (AHA) Annual Survey of Hospitals for 2010-2016, including facility-level payment and cost data provided by over 6000 AHA member hospitals nationwide, representing roughly 85% of U.S. hospitals. Respondents are community hospitals, defined by the AHA as all non-federal short-term hospitals, including academic medical centers and teaching hospitals.
Methods: Using hospital-reported payment data for hospitals participating in the AHA annual survey, the authors calculate overall payment-to-cost ratios (PTCRs) for each year. This review further calculates ratios of the PTCR for private payers to the Medicare PTCR, resulting in estimates of the private-to-Medicare payment ratio for each year. Methodology is consistent across years, so changes in the Medicare-private payment differential are likely to reflect true changes over time. The analysis does not control for hospital case mix or patient-specific factors such as medical complexity.
Factors Influencing Reported Rates: The hospitals included in the AHA annual survey include academic medical centers, community hospitals, and non-profit hospitals, which may result in more broadly representative estimates of the private-to-Medicare hospital payment ratio than studies that focus on for-profit hospitals. Medicare PTCRs are based on the amounts that the Centers for Medicare and Medicaid Services (CMS) actually paid, including payments for Disproportionate Share Hospital (DSH) status, indirect medical education (IME), geographic adjustments, pass-through payments including those for direct graduate medical education (DGME), etc., which may result in higher estimates of Medicare rates than studies that exclude these payment components. Self-pay and privately insured patients are not differentiated in the reported private PTCRs, which may skew estimates of private insurance payments downward. However, because the private PTCRs are based on payments rather than claims, out-of-network payments are included, which may result in higher estimates of private insurance rates than studies that exclude out-of-network claims.
Baker et. al. 2016
2012
Hospital
Source data: Health Care Cost Institute (HCCI) claims data for 2012, which includes claims for three large nationwide private insurers – UnitedHealthcare, Humana, and Aetna, representing hospital service claims for approximately 4 million individuals nationwide. Medicare claims were obtained from the Medicare Provider Analysis and Review (MEDPAR) File for 2012, which includes individual hospital price data for all Medicare FFS enrollees.
Methods: Private insurance rates were calculated based on prices for commercial hospital claims for beneficiaries aged 65 and older and their dependents enrolled in HMO, PPO, or POS plans, aggregated to the event level. Medicare rates were calculated based on a 100% sample of Medicare FFS enrollees, aggregated to the event level. Authors compared average commercial and Medicare prices for the top 100 DRGs by volume, at both the CBSA level and nationally. The analysis does not control for patient-specific factors such as medical complexity, though calculating private insurance rates based on claims only for beneficiaries age 65 and older may partially account for differences in medical complexity among privately insured and Medicare beneficiary claims.
Factors Influencing Reported Rates: The specific insurers represented in this dataset may not reflect the national distribution of enrollees in private insurance plans, so the estimates of private insurance rates may not reflect rates negotiated by other insurers, particularly smaller local insurers with less negotiating power relative to providers that may have higher provider payments. Medicare payments are based on the amounts that CMS actually paid, including payments for DSH status, IME, geographic adjustments, pass-through payments, etc., which may result in higher estimates of Medicare rates than studies that exclude these payment components. Claims with zero or negative payments and those in the top and bottom 1% of the payment amount distribution by DRG and insurance type were excluded, reducing the effect of extreme payments relative to studies that do not exclude outliers. The data do not contain information on provider payments made outside of the usual claims process. Out-of-network claims are included, which may result in higher estimates of private insurance rates than studies that exclude out-of-network claims.
Biener and Selden 2017
2014-2015 data consolidated
Physician
Source data: Medical Expenditures Panel Survey (MEPS) Household and Medical Provider components for 2014-2015, which include provider billing records containing full established charges and payments for over 30,000 office-based physician visits, across private insurers, Medicare, and other payers.
Methods: The authors analyze payments associated with all office-based physician visits in the dataset for adults aged 18 and older (excluding visits characterized by the reporting household as emergency visits, as well as visits for counselling only, vision exams, or surgical procedures). Visit payments were regressed on coverage type and several patient and visit characteristics, and mean payments were estimated for private payers and Medicare FFS based on the regression model. The MEPS dataset is not large enough to be representative at the state level, so the authors do not address geographic variation, and report national averages only. The authors do not attempt to control for service intensity or patient-specific factors such as medical complexity.
Factors Influencing Reported Rates: MEPS data contains information on physician office visits, including visit type (PCP, specialist, etc.) and content, allowing the authors to control for factors such as practice setting and physician specialty in their regression model. Payments in the top 1% of visits ranked by charges were excluded for all payment types. Because private rates are calculated based on physician office billing data, payments outside of the claims process are included, as are payments for out-of-network claims, which may result in higher estimates of private insurance rates than studies that exclude these payments. Because the authors exclude procedures rendered in hospital outpatient departments (which are often reimbursed at higher rates than identical procedures rendered in physician offices under current Medicare policy), this analysis may produce lower estimates of average Medicare rates that studies that incorporate additional care settings.
Colorado Department of Health Care Policy and Financing 2019
2010-2017
Hospital
Source data: Colorado Hospital Association’s “DATABANK” database for 2010-2017, which contains aggregated hospital utilization and payment data reported by 67 participating Colorado hospitals representing over 97% of licensed beds in the state.
Methods: The authors calculate aggregate payment-to-cost ratios (PTCRs) for each payer type (e.g. commercial insurance, Medicare) across all hospitals in the dataset. This review further calculates ratios of the PTCR for private payers to the Medicare PTCR, resulting in estimates of the private-to-Medicare payment ratio for each year. Methodology is consistent across years, so changes in the Medicare-private payment differential are likely to reflect true changes over time. The analysis does not control for hospital case mix or patient-specific factors such as medical complexity.
Factors Influencing Reported Rates: Data are specific to participating hospitals in Colorado, so are likely biased toward payment rates prevailing in Colorado hospital markets. White and Whaley (see table entry below) find that hospital prices in Colorado are relatively high compared to those in most of the 24 other states included in their 2019 study, suggesting that Colorado hospitals’ high degree of market power relative to insurers may result in higher estimates of private insurance hospital payment rates. Reported Medicare payments are based on the amounts that CMS actually paid, including payments for DSH status, IME, geographic adjustments, pass-through payments, etc., which may result in higher estimates of Medicare rates than studies that exclude these payment components. Separate PTCRs are reported for self-pay and privately insured patients, so estimates of private insurance rates are not affected by differences between self-pay and privately insured payments, in contrast to the AHA analyses. Out-of-network payments are included in the private insurance PTCR, which may result in higher estimates of private insurance rates than studies that exclude out-of-network claims.
Cooper et. al. 2018
2011
Hospital
Source data: Health Care Cost Institute (HCCI) claims data for 2011, which includes claims for three large nationwide private insurers – UnitedHealthcare, Humana, and Aetna – representing hospital service claims for approximately 4 million individuals nationwide. Medicare claims data were obtained from the Medicare Provider Analysis and Review (MEDPAR) File for 2011, which includes individual hospital price data for all Medicare FFS enrollees.
Methods: The authors calculate mean hospital prices for privately reimbursed and Medicare-reimbursed stays based on approximately 2,400 general medical and surgical hospitals in the dataset for which inpatient stays across both payer types were available. The authors adjust for differences in medical complexity between the privately insured and Medicare populations by risk-adjusting price, for differences in each hospitals’ mix of admission types by adjusting for the relative volume of DRGs, and for differences in care quality by analyzing price variation within each hospital.
Factors Influencing Reported Rates: The specific insurers represented in this dataset may not reflect the national distribution of enrollees in private insurance plans, so the estimates of private insurance rates may not reflect rates negotiated by other insurers, particularly smaller local insurers with less negotiating power relative to providers that may have higher provider payments. Medicare payments are based on the amounts that CMS actually paid, including payments for DSH status, IME, geographic adjustments, pass-through payments, etc., which may result in higher estimates of Medicare rates than studies that exclude these payment components. The data do not contain information on provider payments made outside of the usual claims process, which may underestimate privately reimbursed or Medicare payments that have non-claim components. Out-of-network claims are included, which may result in higher estimates of private insurance rates than studies that exclude out-of-network claims.
Ge and Anderson 2018
2016
Hospital
Source data: Florida Agency for Health Care Administration hospital financial information records for 2010-2016, which includes audited hospital-reported gross revenues, deductions, and net revenues by type of payer (e.g., commercial insurance, Medicare) for 153 private short-term hospitals in Florida.
Methods: The authors calculate net payment ratios (net revenue to gross revenue) for both Medicare and private HMO and PPO plans across all hospitals in the dataset, as well as the ratio of these net payment ratios, yielding an estimated private HMO/PPO-to-Medicare payment ratio, which the authors report for 2016. The authors do not control for hospital case mix or patient-specific factors such as medical complexity.
Factors Influencing Reported Rates: Data are specific to participating hospitals in Florida, so are likely biased toward payment rates prevailing in Florida hospital markets. The authors report that the proportion of for-profit hospitals is much higher in Florida than nationwide, which may result in higher estimates of private insurance payment rates. However, White and Whaley (see table entry below) find that hospital prices in Florida are roughly comparable to those in most of the 24 other states included in their 2019 study. Reported private insurance rates are based on payments from HMO and PPO plans only (excluding other plan types such as POS), which may bias reported payments toward HMO and PPO rates. Medicare payments are based on the amounts that CMS actually paid, including payments for DSH status, geographic adjustments, pass-through payments, etc., which may result in higher estimates of Medicare rates than studies that exclude these payment components. Out-of-network payments are included, which may result in higher estimates of private insurance rates than studies that exclude out-of-network claims.
Ginsburg 2010
2010
Physician and Hospital
Source data: Physician and hospital payment rates directly provided by four large private insurers – Aetna, Anthem Blue Cross Blue Shield, Cigna, and UnitedHealth – for services reimbursed in 2010 in eight diverse health care markets throughout the U.S. (Cleveland, OH; Indianapolis, IN; Los Angeles, CA; Miami, FL; Milwaukee, WI; Richmond, VA; San Francisco, CA; and rural Wisconsin). Medicare payment rates are also provided by the same insurers, based on simulated Medicare equivalent payments for the provided private claims.
Methods: The authors used insurer-provided average private insurance and Medicare payment rates to calculate average private insurance-to-Medicare payment ratios for all inpatient hospital services, all outpatient hospital services, and for physician services across several medical specialties, respectively. Exact calculation methods may have varied for each insurer, though additional information is not available due to the authors’ data-sharing agreement with the participating insurers. Because information on the relative volume of claims in each market is not provided, this brief further calculates unweighted average ratios across all markets.
Factors Influencing Reported Rates: Although only eight markets are represented, the authors specifically chose these markets due to their geographic spread and expected variation in payment rates, which may moderate the effects of nationwide variation in the private-to-Medicare payment ratio. The specific insurers represented in this dataset may not reflect the national distribution of enrollees in private insurance plans, so the estimates of private insurance rates may not reflect rates negotiated by other insurers, particularly smaller local insurers with less negotiating power relative to providers that may have higher provider payments. The insurer-reported “standard” private insurance rates for physician services are derived from a sample in which typically “hospital-based” specialties such as anesthesiologists and radiologists are underrepresented, which may bias private insurance rates downward relative to Medicare levels. The data do not contain information on provider payments made outside of the usual claims process, which may underestimate privately reimbursed or Medicare payments that have non-claim components. The authors requested that participating insurers exclude out-of-network claims from their reported data, which may result in lower estimates of private insurance payments than among studies that include out-of-network claims.
Kronick and Neyaz 2019
2015-2016 data consolidated
Hospital
Source data: California hospitals’ Annual Financial Disclosure Reports filed with the California Office of Statewide Health Planning and Development (OSHPD) for 2015-2016, which includes payment and cost data by type of payer (e.g., commercial insurance, Medicare) for all California hospitals.
Methods: The authors calculate aggregate payment-to-cost ratios (PTCRs) for each payer type (e.g., commercial insurance, Medicare) across all hospitals in the dataset, as well as ratios of the PTCRs for each payer type, yielding an estimated private-to-Medicare charge ratio. Inpatient and outpatient services are aggregated together. The authors limit their analysis to acute care general hospitals, excluding psychiatric, rehabilitation, substance abuse, long-term care, and children’s’ hospitals. The authors do not control for hospital case mix or patient-specific factors such as medical complexity.
Factors Influencing Reported Rates: Data are specific to participating hospitals in California, so are likely biased toward payment rates prevailing in California hospital markets. OSHPD reports only include cost data at the level of hospital units rather than for specific procedures or services, though the authors adapt formulas used by OSHPD to account for indirect hospital payments not associated with specific hospital units, preventing the potential underestimations of private insurance and Medicare rates that might have otherwise been caused by excluding these payments. Specifically, Medicare payments are based on the amounts that CMS actually paid, including payments for DSH status, geographic adjustments, pass-through payments, etc., which may result in higher estimates of Medicare rates than studies that exclude these payment components. Out-of-network payments are included in the private insurance PTCR, which may result in higher estimates of private insurance rates than studies that exclude out-of-network claims.
Maeda and Nelson, CBO 2017
2013
Hospital
Source data: Health Care Cost Institute (HCCI) claims data for 2013, which includes claims for three large nationwide private insurers – UnitedHealthcare, Humana, and Aetna – representing hospital service claims for approximately 4 million individuals.
Methods: The authors aggregate inpatient claims to the level of hospital stays (of which they identify over 620,000 in the dataset), then calculate average overall allowed payment amounts per stay by payer type (e.g., private insurance, Medicare). The authors limit their analysis to stays in acute care hospitals in MSAs only, and exclude stays associated with services that uncommon among Medicare patients such as labor and delivery. The authors simulate Medicare payments based on the same claims used in the calculation of private insurance payments, and include simulated payments for Medicare-allowed cost-sharing, DSH status, geographic adjustments, etc., but not pass-through or IME payments.
Factors Influencing Reported Rates: The specific insurers represented in this dataset may not reflect the national distribution of enrollees in private insurance plans, so the estimates of private insurance rates may not reflect rates negotiated by other insurers, particularly smaller local insurers with less negotiating power relative to providers that may have higher provider payments. Medicare rates are simulated by the authors, including hospital-specific payment adjustments such as those for DSH status, and geographic adjustments, though not IME and pass-through payments; this may result in higher estimates of Medicare rates compared to studies that do not include any of these payments, but relative underestimates of Medicare rates compared to studies that use the amounts that CMS actually paid. The authors focus on hospitals in Metropolitan Statistical Areas (MSAs) only, which may skew the reported rates toward those prevailing in large urban areas. The data do not contain information on provider payments made outside of the usual claims process, which may underestimate privately reimbursed or Medicare payments that have non-claim components. Out-of-network payments are included, which may result in higher estimates of private insurance rates than studies that exclude out-of-network claims.
MedPAC 2012-2019
2010-2017
Physician
Source data: Claims data provided by an undisclosed private insurer that covers a wide geographic area across the U.S., including all paid claims for services covered by the insurer’s PPO plans in 2010-2017, reflecting both the insurer’s allowed amount and patient cost-sharing amounts. Due to MedPAC’s data-sharing agreement with the private insurer, additional information is not available. Medicare beneficiary-level claims data provided directly by CMS for 100% of Medicare beneficiaries in 2010-2017, including Medicare allowed amounts and Medicare’s allowed patient cost-sharing amounts.
Methods: The authors do not report detailed methods for their comparison of private insurance (PPO) payment rates and Medicare payment rates. However, the authors state that the methodology has been consistent across years, so changes in the Medicare-private payment differential are likely to reflect true changes over time.
Factors Influencing Reported Rates: Although the data represent a wide geographic distribution of claims, the fact that only one private insurer’s PPO plans are represented limits the generalizability of the findings, and may skew estimates toward the generally lower payment rates that large insurers are able to negotiate with providers due to their greater bargaining power. Medicare payments are based on the amounts that CMS actually paid, including Medicare-allowed cost-sharing, payments for DSH status, IME, geographic adjustments, pass-through payments, etc., which may result in higher estimates of Medicare rates than studies that exclude these payment components. The data do not contain information on provider payments made outside of the usual claims process, which may result in lower estimates of private insurance rates than studies that include these payment components. The authors do not report whether out-of-network claims are included in the estimation of private insurance payment rates.
Pelech 2018
2014
Physician
Source data: Health Care Cost Institute (HCCI) claims data for 2014, which includes physician service claims for three large nationwide private insurers – UnitedHealthcare, Humana, and Aetna – for approximately 39 million individuals.
Methods: The authors aggregate claims for physician services (of which they identify over 230 million in the dataset, representing services provided to over 19 million patients by over 600,000 physicians), then calculate average overall allowed payment amounts across several services by payer type (e.g., private insurance, Medicare). The authors limit their analysis to 12 physician services that are comparably common among both privately insured and Medicare beneficiaries and delivered in MSAs. The authors simulate Medicare payments based on the same claims used in the calculation of private insurance payments, and include simulated payments for cost-sharing and procedure- and provider-specific adjustments.
Factors Influencing Reported Rates: The majority of physician services included in the analysis are procedural or imaging studies, which may result in higher estimates of private insurance rates than studies focusing on physician services for specialties such as primary care that have relatively low market power compared to procedural specialists and radiologists. The specific insurers represented in this dataset may not reflect the national distribution of enrollees in private insurance plans, so the estimates of private insurance rates may not reflect rates negotiated by other insurers, particularly smaller local insurers with less negotiating power relative to providers that may have higher provider payments. Medicare rates are simulated by the authors, including Medicare-allowed adjustments for bilateral services, performing multiple same-day procedures , etc.; this may result in higher estimates of Medicare rates compared to studies that do not include any of these adjustments. The analysis is limited to MSAs, which may skew the reported rates toward physician prices prevailing in large urban areas. The data do not contain information on provider payments made outside of the usual claims process, which may underestimate privately reimbursed or Medicare payments that have non-claim components. Out-of-network payments are included in varying proportions by service, which may result in higher estimates of private insurance rates than studies that exclude out-of-network claims.
Selden et. al. 2015
2010-2012
Hospital
Source data: Medical Expenditures Panel Survey (MEPS) Household and Medical Provider components for 1996-2012, which include payment data for approximately 39,500 non-maternity hospital stays nationwide, across private insurers, Medicare, and other payers.
Methods: The authors analyze payment-to-charge ratios associated with inpatient hospital stays in the dataset for adults aged 19 and older. Hospital stays were regressed on coverage type and several patient and visit characteristics, and mean payments were estimated for private payers and Medicare based on the regression model. Based on these results, the authors calculated mean private-to-Medicare payment ratios for each year for which data was available. The authors do not address geographic variation, and merely report national averages. Methodology is consistent across years, so changes in the Medicare-private payment differential are more likely to reflect true changes over time. The authors do not control for hospital case mix or patient-specific factors such as medical complexity.
Factors Influencing Reported Rates: The authors compare average inpatient hospital payment rates based on the “full established charge” for entire hospital stays (weighted by volume) rather than charges for specific procedures, which may be influenced more heavily by differences in patient-specific factors such as medical complexity. Some payments made by supplemental managed care plans (Medicare Advantage) are included in the calculation of Medicare rates, though given that Medicare Advantage payments are generally similar to Medicare rates for inpatient hospital services (see e.g., Trish et. al.), the effect of including these payments is likely minimal. Reported Medicare rates include payments for DSH status, IME, and outlier payments, but exclude payments not linked to specific events such as pass-through payments; this may result in higher estimates of Medicare rates compared to studies that do not include any of these payments, but relative underestimates of Medicare rates compared to studies that include all Medicare payment components. The authors exclude hospital stays with payments exceeding three times charges, which may disproportionately exclude exceptionally high private insurance payments and result in lower estimates of the private-to-Medicare payment ratio. Because private rates are calculated based on payment data for hospital stays, payments outside of the claims process are included, as are payments for out-of-network claims, which may result in higher estimates of private insurance rates than studies that do not include these payments.
Selden 2020
2013-2016
Hospital
Source data: Medical Expenditures Panel Survey (MEPS) Household and Medical Provider components for 2013-2016, which include payment data for approximately 48,000 non-maternity inpatient hospital stays and 236,500 non-emergency outpatient visits nationwide across private insurers and Medicare.
Methods: This analysis updates the findings of Selden et. al. 2015 (see table entry above), preserving the same methodology for inpatient services, as well as an additional analysis for outpatient services over the period from 1996-2016. Prices for inpatient stays and outpatient service events were regressed on coverage type and several patient and visit or service characteristics, and mean payments were estimated for private payers and Medicare based on the regression model. Based on these results, the authors calculated mean private-to-Medicare payment ratios for each year. The authors do not address geographic variation, and merely report national averages. Methodology is consistent across years, so changes in the Medicare-private payment differential are more likely to reflect true changes over time. The authors do not control for hospital case mix or patient-specific factors such as medical complexity.
Factors Influencing Reported Rates: The authors compare average inpatient hospital payment rates based on the “full established charge” for entire hospital stays (weighted by volume) rather than charges for specific procedures, which may be influenced more heavily by differences in patient-specific factors such as medical complexity. Average outpatient hospital payment rates are calculated based on event-level data (weighted by volume), which may result in lower estimates of private insurance payments for outpatient services than studies that focus on selections of services that disproportionally represent less common but more highly reimbursed services. Some payments made by supplemental managed care plans (Medicare Advantage) are included in the calculation of Medicare rates, though given that Medicare Advantage payments are generally similar to Medicare rates for inpatient hospital services (see e.g. Trish et. al.), the effect of including these payments is likely minimal. Reported Medicare rates include payments for DSH status, IME, and outlier payments, but exclude payments not linked to specific events such as pass-through payments; this may result in higher estimates of Medicare rates compared to studies that do not include any of these payments, but relative underestimates of Medicare rates compared to studies that include all Medicare payment components. The authors exclude hospital stays with payments exceeding three times charges, which may disproportionately exclude exceptionally high private insurance payments and result in lower estimates of the private-to-Medicare payment ratio. Because private rates are calculated based on payment data for hospital stays, payments outside of the claims process are included, as are payments for out-of-network claims, which may result in higher estimates of private insurance rates than studies that do not include these payments.
Song 2019
2016
Physician
Source data: Truven Health Analytics MarketScan Commercial Claims and Encounters database 2016 claims data, which contains non-facility physician payment information for approximately 350 private payers throughout the U.S.
Methods: The author reports unweighted mean private insurance prices for a selection of 12 physician services for all private insurance plan types other than capitated plans and POS plans with capitation. Medicare prices are simulated based on average non-facility professional fees derived from the 2016 Medicare Physician Fee Schedule for the same set of services, without accounting for geographic adjustments or other payment modifications.
Factors Influencing Reported Rates: The MarketScan dataset includes a diverse mix of private insurers, which may result in lower estimates of private insurers’ physician payment rates than studies that examine payments for only a few large nationwide private insurers that likely have stronger negotiating power relative to providers. The simulated Medicare rates do not include payments for DSH status, IME, and outlier payments, etc., which may result in lower estimates of Medicare rates compared to studies that do account for these payments. The data do not contain information on provider payments made outside of the usual claims process, which may underestimate privately reimbursed or Medicare payments that have non-claim components. The author distinguishes between payments for in-network and out-of-network services; for the purposes of this brief, the author’s average reported in-network rates are used in the calculation of the overall cross-study average, which may result in a lower private-to-Medicare payment ratio than studies that include out-of-network payments.
Trish et. al. 2017
2007-2012 data consolidated
Physician
Source data: Claims data provided directly by an undisclosed private insurer that covers a wide geographic area across the U.S., including over 8.5 million claims for private insurance enrollees from 2007-2012. Due to the authors’ data-sharing agreement with the private insurer, additional information is not available. Medicare claims from a 20% random sample of Medicare beneficiaries for 2007-2012 were provided directly by CMS.
Methods: The authors calculate the mean prices for each type of service by plan type (e.g. private insurance, Medicare), care setting (e.g. physician office, hospital outpatient department, etc.), CBSA, and year, then average these relative mean prices across CBSAs for each year, weighting by the private insurer’s enrollment in each CBSA. Finally, the authors calculate mean private-to-Medicare payment ratios using these averages. The authors do not control for patient-specific factors such as medical complexity.
Factors Influencing Reported Rates: Although the data represent a wide geographic distribution of claims, the fact that only one private insurer is represented limits the generalizability of the findings, and may skew estimates toward the generally lower payment rates that large insurers are able to negotiate with providers due to their greater bargaining power. The authors incorporate a broad variety of physician specialties, which may result in estimates of the private-to-Medicare physician ratio that fall between those reported by studies in which more procedurally-oriented or more cognitively-oriented specialties are disproportionately represented. Medicare payments are based on the amounts that CMS actually paid, including provider-specific and service-specific payment adjustments, which may result in higher estimates of Medicare rates than studies that exclude these payment components. Claims associated with prices more than four standard deviations above or below the mean for each payer were excluded, reducing the effect of extreme payments relative to studies that do not exclude outliers. The data do not contain information on provider payments made outside of the usual claims process, which may underestimate privately reimbursed or Medicare payments that have non-claim components. Out-of-network payments are included, which may result in higher estimates of private insurance rates than studies that exclude out-of-network claims.
Wallace and Song 2016
2007-2013 data consolidated
Physician and Hospital
Source data: Truven Health Analytics Medicare and Commercial Claims and Encounters database for 2007-2013, which contains physician service claims for approximately 350 private payers nationwide, as well as for a convenience sample of Medicare patients, together representing approximately 1.4 million individuals that transitioned from private insurance to Medicare between 2007 and 2013.
Methods: The authors longitudinally follow a cohort of approximately 200,000 individuals in the dataset who retired from employment and transitioned from private insurance to Medicare at age 65. Mean prices by payer type are estimated by aggregating claims from before and after their transition into separate claims samples for private insurance and Medicare, and using a regression discontinuity model to identify the causal effect of entry into Medicare, controlling for a number of individual-specific and time-specific factors. The authors exclude services that do not have cost-sharing requirements for Medicare beneficiaries such as certain primary care and preventive care office visits, instead focusing on a subset of procedural and imaging services that consistently have patient cost-sharing requirements.
Factors Influencing Reported Rates: The authors longitudinally observe a consistent cohort from the year before and after their transition from private to Medicare coverage at age 65, which largely controls for medical complexity and other patient-specific features, and allows the authors to account for possible changes in utilization that would otherwise impact reported rates. The authors focus on a subset of mainly procedural and imaging services, which may result in relatively lower estimates of the private-to-Medicare payment ratio than studies that focus on routine evaluation and management services in the hospital setting, or higher estimates than studies focusing on physician services for specialties such as primary care that have relatively low market power compared to procedural specialists and radiologists. The reported private and Medicare rates are based on author-determined “changes attributable to Medicare entry”, which causes estimates of the private-to-Medicare ratio to be lower than if estimates had been based on only the raw reduction in price. The MarketScan dataset includes a diverse mix of private insurers, which may result in lower estimates of private insurers’ physician payment rates than studies that examine payments for only a few large nationwide private insurers that likely have stronger negotiating power relative to providers. Only private payments made by indemnity plans, PPOs, and POS plans were included, which may bias estimates of private insurance payments toward rates paid by these plan types (as opposed to others such as HMOs). The data do not contain information on provider payments made outside of the usual claims process, which may underestimate privately reimbursed or Medicare payments that have non-claim components. Out-of-network payments are included, which may result in higher estimates of private insurance rates than studies that exclude out-of-network claims.
White et. al. 2013
2011
Physician and Hospital
Source data: Claims data provided by General Motors, Chrysler, Ford, and the United Auto Workers Retiree Medical Benefits Trust across 5 major metropolitan physician and hospital markets in Michigan, for 2011. Provided claims information included amounts paid to the physicians and hospitals, as well as amounts paid by the insurer and enrollee, for approximately 590,000 active and retired non-elderly autoworkers and their dependents under age 65.
Methods: The authors aggregated private insurance claims to the level of DRG codes (for inpatient hospital services) or HCPCS codes (for outpatient hospital services and physician services), and calculated mean provider-level prices for each code. Medicare prices were simulated based on the Medicare IPPS, OPPS, or MPFS, including geographic adjustments, provider-specific adjustments such as IME and DSH payments, and MPFS adjustments. Using these payment estimates, the authors calculated provider-level private-to-Medicare price indices for each hospital (including inpatient and outpatient price indices) and physician practice (for primary care services, medical specialist services, and surgical specialist services). Providers were assigned to markets based on their location, and mean price ratios are reported for each market and overall.
Factors Influencing Reported Rates: Although the data represent a wide geographic distribution of claims, all markets were in Michigan, which the authors note may result in relatively low estimates of private insurance payment rates due to the exceptionally strong statewide market power of Blue Cross Blue Shield Michigan relative to providers. Simulated Medicare rates include payments for DSH status, geographic adjustments, IME, and outlier payments, but exclude payments not linked to specific events such as pass-through payments; this may result in higher estimates of Medicare rates compared to studies that do not simulate any of these payments, but relative underestimates of Medicare rates compared to studies that use the amounts that CMS actually paid. Private claims associated with prices outside the range of 20-1000% of the corresponding Medicare payment were excluded, reducing the effect of extreme payments relative to studies that do not exclude outliers. The data do not contain information on provider payments made outside of the usual claims process, which may underestimate privately reimbursed or Medicare payments that have non-claim components. Out-of-network payments are included, which may result in higher estimates of private insurance rates than studies that exclude out-of-network claims.
White 2017
2013-2016 data consolidated
Hospital
Source data: Claims data provided by the Employers’ Forum of Indiana for 2013-2016 for over a dozen participating employers in Indiana that cover employee health benefits, including prices paid for hospital services for approximately 225,000 covered employees and their dependents under age 65.
Methods: The authors aggregated private insurance claims to the level of DRG codes (for inpatient hospital services) or APC codes (for outpatient hospital services), and calculated mean provider-level prices for each code. Medicare prices were simulated based on the Medicare IPPS or OPPS, including geographic adjustments, and hospital-specific adjustments such as IME and DSH payments. Using these payment estimates, the authors calculated provider-level private-to-Medicare relative prices for each hospital (for both inpatient and outpatient services) and overall.
Factors Influencing Reported Rates: The data are specific to a relatively small population in Indiana, so likely skews estimates of the private-to-Medicare payment ratio to those prevailing in the state; the author notes that the hospital market in Indiana is dominated by 6 large hospital systems, and so may reflect a greater degree of hospital market power relative to insures than in other states. Simulated Medicare rates include payments for DSH status, geographic adjustments, IME, and outlier payments, but exclude payments not linked to specific events such as pass-through payments; this may result in higher estimates of Medicare rates compared to studies that do not simulate any of these payments, but relative underestimates of Medicare rates compared to studies that use the amounts that CMS actually paid. The data do not contain information on provider payments made outside of the usual claims process, which may underestimate privately reimbursed or Medicare payments that have non-claim components. Out-of-network payments are included, which may result in higher estimates of private insurance rates than studies that exclude out-of-network claims.
White and Whaley 2019
2015-2017
Hospital
Source data: Claims data provided by approximately 50 self-insured employers for covered non-elderly employees and their dependents, private claims from statewide all-payer claims databases for New Hampshire and Colorado, and claims from additional undisclosed private health plans. Together, these sources include payment data for about 1,600 hospitals and 4 million patients in 25 states in 2015-2017.
Methods: The authors aggregated private insurance claims to the level of DRG codes (for inpatient hospital services) or APC codes (for outpatient hospital services), and calculated mean provider-level prices for each code. Medicare prices were simulated based on the Medicare IPPS or OPPS, including geographic adjustments, and hospital-specific adjustments such as IME and DSH payments, but excluding pass-through payments. Using these payment estimates, the authors calculated provider-level private-to-Medicare relative prices for each hospital, including relative prices for inpatient and outpatient services. Providers were assigned to states based on their location, and mean price ratios are reported for each state and overall. Methodology is consistent across years, so changes in the Medicare-private payment differential are more likely to reflect true changes over time.
Factors Influencing Reported Rates: The variety of data sources included in the analysis capture a broad range of private insurers, health care markets, and health insurance markets across 25 states, allowing for estimates of the overall private-to-Medicare payment ratio that are more likely to be nationally representative than studies that examine markets in only one state, or only a handful of private insurers, etc. Simulated Medicare rates include payments for DSH status, geographic adjustments, IME, and outlier payments, but exclude payments not linked to specific events such as pass-through payments; this may result in higher estimates of Medicare rates compared to studies that do not simulate any of these payments, but relative underestimates of Medicare rates compared to studies that use the amounts that CMS actually paid. The authors also exclude some Medicare hospital payments for uncompensated care, but substitute their own formula to partially account for them, which may result in lower estimates of Medicare payment rates for hospitals that provide high volumes of uncompensated care. The data do not contain information on provider payments made outside of the usual claims process, which may underestimate privately reimbursed or Medicare payments that have non-claim components. The data do not contain enough information to differentiate between in-network and out-of-network claims, so the latter likely represented substantially in the calculation of private insurance rates, which may result in higher estimates of private insurance rates than studies that exclude out-of-network claims.
NOTES: Abbreviations: AHA – American Hospital Association. CAH – critical access hospital. CBSA – core-based statistical area. CMS – Centers for Medicare and Medicaid Services. DGME – direct graduate medical education. DRG – diagnosis-related group. DSH – disproportionate share hospital. ESRD – end-stage renal disease. FFS – fee-for-service. GAF – Medicare geographic adjustment factor. HCCI – Health Care Cost Institute. HCPCS – healthcare common procedure coding system. HMO – health maintenance organization. HRR – hospital referral region. ICU – intensive care unit. IME – indirect medical education. IPPS – Medicare Inpatient Prospective Payment System. MedPAC – Medicare Payment Advisory Commission. MedPAR – Medicare Provider Analysis and Review. MEPS – Medical Expenditures Panel Survey. MPFS – Medicare Physician Fee Schedule. MSA – metropolitan statistical area. MS-DRG – Medicare-severity diagnosis-related group. OPPS – Medicare Outpatient Prospective Payment System. OSHPD – California Office of Statewide Health Planning and Development. PCP – primary care physician. POS – point-of-service. PPO – preferred provider organization. PPS – Medicare Prospective Payment System. PTCR – payment-to-cost ratio.
Endnotes
Centers for Medicare and Medicaid Services. 2019. National Health Expenditures 2018 Highlights. Washington, D.C.: Centers for Medicare and Medicaid Services. https://www.cms.gov/files/document/highlights.pdf↩︎
Centers for Medicare and Medicaid Services. 2019. National Health Expenditures 2018 Highlights. Washington, D.C.: Centers for Medicare and Medicaid Services. https://www.cms.gov/files/document/highlights.pdf↩︎
Colorado Department of Regulatory Agencies Division of Insurance, Colorado Department of Health Care Policy and Financing. 2019. Draft Report for Colorado’s State Coverage Option. Denver, Colorado: Department of Regulatory Agencies and Department of Health Care Policy and Financing. https://www.colorado.gov/pacific/dora/proposal-state-option-health-care-coverage↩︎
Cooper, Zack et. al. 2018. “The Price Ain’t Right? Hospital Prices and Health Spending on the Privately Insured”. National Bureau of Economic Research, Working Paper 21815. Cambridge, MA: National Bureau of Economic Research. https://www.nber.org/papers/w21815↩︎
Ginsburg, Paul. 2010. “Wide Variation in Hospital and Physician Payment Rates Evidence of Provider Market Power”. Center for Studying Health Systems Change, Research Brief No. 16. http://www.hschange.org/CONTENT/1162/#ib2↩︎
White, Chapin and Whaley, Christopher. 2019. “Prices Paid to Hospitals by Private Health Plans Are High Relative to Medicare and Vary Widely”. Santa Monica, CA: RAND Corporation. https://www.rand.org/pubs/research_reports/RR3033.html↩︎
Ginsburg, Paul. 2010. “Wide Variation in Hospital and Physician Payment Rates Evidence of Provider Market Power”. Center for Studying Health Systems Change, Research Brief No. 16. http://www.hschange.org/CONTENT/1162/#ib2↩︎
White, Chapin et. al. 2013. “High and Varying Prices for Privately Insured Patients Underscore Hospital Market Power”. Center for Studying Health Systems Change, Research Brief No. 27. http://www.hschange.org/CONTENT/1375/1375.pdf↩︎
White, Chapin and Whaley, Christopher. 2019. “Prices Paid to Hospitals by Private Health Plans Are High Relative to Medicare and Vary Widely”. Santa Monica, CA: RAND Corporation. https://www.rand.org/pubs/research_reports/RR3033.html↩︎
Cooper, Zack et. al. 2018. “The Price Ain’t Right? Hospital Prices and Health Spending on the Privately Insured”. National Bureau of Economic Research, Working Paper 21815. Cambridge, MA: National Bureau of Economic Research. https://www.nber.org/papers/w21815↩︎
White, Chapin et. al. 2013. “High and Varying Prices for Privately Insured Patients Underscore Hospital Market Power”. Center for Studying Health Systems Change, Research Brief No. 27. http://www.hschange.org/CONTENT/1375/1375.pdf↩︎
White, Chapin and Whaley, Christopher. 2019. “Prices Paid to Hospitals by Private Health Plans Are High Relative to Medicare and Vary Widely”. Santa Monica, CA: RAND Corporation. https://www.rand.org/pubs/research_reports/RR3033.html↩︎
White, Chapin and Whaley, Christopher. 2019. “Prices Paid to Hospitals by Private Health Plans Are High Relative to Medicare and Vary Widely”. Santa Monica, CA: RAND Corporation. https://www.rand.org/pubs/research_reports/RR3033.html↩︎
Ginsburg, Paul. 2010. “Wide Variation in Hospital and Physician Payment Rates Evidence of Provider Market Power”. Center for Studying Health Systems Change, Research Brief No. 16. http://www.hschange.org/CONTENT/1162/#ib2↩︎
White, Chapin et. al. 2013. “High and Varying Prices for Privately Insured Patients Underscore Hospital Market Power”. Center for Studying Health Systems Change, Research Brief No. 27. http://www.hschange.org/CONTENT/1375/1375.pdf↩︎
Ginsburg, Paul. 2010. “Wide Variation in Hospital and Physician Payment Rates Evidence of Provider Market Power”. Center for Studying Health Systems Change, Research Brief No. 16. http://www.hschange.org/CONTENT/1162/#ib2↩︎
Medicare Payment Advisory Commission. March 2019. Report to the Congress: Medicare Payment Policy. Washington, D.C.: Medicare Payment Advisory Commission. http://www.medpac.gov/-documents-/reports↩︎
Medicare Payment Advisory Commission. March 2019. Report to the Congress: Medicare Payment Policy. Washington, D.C.: Medicare Payment Advisory Commission. http://www.medpac.gov/-documents-/reports↩︎
Dranove, David and Lindrooth, Richard. 2003. “Hospital Consolidation and Costs: Another Look at the Evidence.” Journal of Health Economics. 22: 983-997. https://www.ncbi.nlm.nih.gov/pubmed/14604556↩︎
Feng, Yan et. al. 2015. “Association Between Market Concentration of Hospitals and Patient Health Gain Following Hip Replacement Surgery”. Journal of Health Services Research and Policy. 20(1): 11-17. https://www.ncbi.nlm.nih.gov/pmc/articles/PMC4268175/↩︎
Cooper, Zack et. al. 2018. “The Price Ain’t Right? Hospital Prices and Health Spending on the Privately Insured”. National Bureau of Economic Research, Working Paper 21815. Cambridge, MA: National Bureau of Economic Research. https://www.nber.org/papers/w21815↩︎
Ginsburg, Paul. 2010. “Wide Variation in Hospital and Physician Payment Rates Evidence of Provider Market Power”. Center for Studying Health Systems Change, Research Brief No. 16. http://www.hschange.org/CONTENT/1162/#ib2↩︎
Medicare Payment Advisory Commission. March 2019. Report to the Congress: Medicare Payment Policy. Washington, D.C.: Medicare Payment Advisory Commission. http://www.medpac.gov/-documents-/reports↩︎
Clemens, Jeffrey and Gottlieb, Joshua. 2017. “In the Shadow of a Giant: Medicare’s Influence on Private Physician Payments”. Journal of Political Economy. 125(1): 1-39. https://www.nber.org/papers/w19503↩︎
Ginsburg, Paul. 2010. “Wide Variation in Hospital and Physician Payment Rates Evidence of Provider Market Power”. Center for Studying Health Systems Change, Research Brief No. 16. http://www.hschange.org/CONTENT/1162/#ib2↩︎
Medicare Payment Advisory Commission. March 2019. Report to the Congress: Medicare Payment Policy. Washington, D.C.: Medicare Payment Advisory Commission. http://www.medpac.gov/-documents-/reports↩︎
Government Accountability Office. 2007. Geographic Areas Used to Adjust Physician Payments for Variation in Practice Costs Should Be Revised. Washington, D.C.: United States Government Accountability Office. https://www.gao.gov/new.items/d07466.pdf↩︎
Berenson, Robert and Goodson, John. 2016. “Finding Value in Unexpected Places – Fixing the Medicare Physician Fee Schedule”. New England Journal of Medicine. 374: 1306-1309. https://www.nejm.org/doi/full/10.1056/NEJMp1600999↩︎
The Families First Coronavirus Response Act provides emergency short-term paid sick leave and longer-term paid family leave for workers affected by coronavirus. The new law will assist some workers who are unable to work because of a coronavirus-related quarantine or illness, they are caring for someone who is sick from coronavirus or quarantined, or their child’s school or day care is closed by providing up to 80 hours of paid sick leave at partial or full pay. Separately, eligible workers whose child’s school or day care is closed may receive an additional 10 weeks of paid family leave at partial pay. In addition to the public health benefits of encouraging sick workers to stay home, these paid leave benefits will provide needed financial relief to some people who are unable to work during this pandemic. The law, however, does not address the paid leave needs of workers at businesses with more than 500 employees, federal employees (for paid family leave), and those who could be exempted because they are health care workers, emergency responders, or they work for an employer with fewer than 50 employees (for paid family leave). We take a closer look at how the new benefits could play out for workers at “essential” businesses in the current environment.
How the new paid leave benefits could work for…
A tradesperson at a mid-size company
Julie is an electrician for a facilities maintenance company with 100 employees. Her elderly mother is quarantined due coronavirus and Julie is her only caregiver. Her company does not offer a voluntary paid sick leave benefit to its employees, but they are required to offer emergency paid sick leave under the new law. This means that Julie is able to take two weeks off work at two-thirds of her regular pay, up to $200 per day. Being a moderate-income worker, going without her full pay puts a strain on her finances, but after two weeks, her mother has recovered and Julie returns to work.
A delivery driver for a large company
Marcus is a delivery driver for a business with 5,000 employees. A single father, his 8-year-old daughter’s school has closed and he lacks alternate childcare. Although his employer has more than 500 employees and is not required to offer emergency paid sick or family leave, the company voluntarily provides a paid leave program. He receives his full pay while taking the two weeks that he has accrued, but his daughter’s school is closed for the rest of the school year. As a minimum wage employee, going without a paycheck for an extended period of time puts him in a precarious financial situation. He also risks losing his job if he does not return to work. For now, Marcus is drawing down savings as he searches for someone to care for his young daughter so he can return to work.
A health care worker
Cameron is a respiratory therapist at a community hospital and was diagnosed with COVID-19. Fortunately, he has a mild case, but he cannot go to work and put other people at risk. As a health care worker, he has been exempted from eligibility for emergency paid sick leave; however, the state where he lives requires employers, including the hospital, to provide one week of fully-paid sick leave. After a week, Cameron is recovering, but still can’t work and must take unpaid leave until he’s well enough to return to work.
Where are the gaps?
While the scenarios described here are hypothetical, these situations could reflect the actual experiences of many workers across the nation who are facing the need for paid sick and family leave. While the COVID-19 relief bills offer important financial supports to many workers, gaps in eligibility for emergency paid leave mean that many other workers will not benefit from these new protections. Workers at businesses with fewer than 50 employees (for paid family leave) or more than 500 employees, federal employees (for paid family leave), health care workers, and emergency responders, in particular, could have to go without pay should they need to take time off work because of the pandemic. For some eligible workers, the dollar limits on benefits and the relatively short duration of paid leave will pose financial challenges. In the short run, these new paid leave benefits will provide a baseline level of income stability for some workers and facilitate social distancing so that those who are sick or need to care for a family member can better afford to stay home. However, the emergency paid leave program is temporary, and while the need for paid leave may not be as urgent after the pandemic subsides, absent comprehensive, permanent paid leave legislation, many workers will again lack these wage protections when they need time off work for an illness or to care for a sick family member.
KFF’s Kaiser Health News (KHN) and Guardian US today launched Lost on the Frontline, a special project aiming to document the life of every health care worker in America who dies from COVID-19 during the pandemic. This includes medical professionals like doctors, nurses and paramedics, and others working at hospitals, nursing homes and other medical facilities, including aides, administrative employees and cleaning and maintenance staff.
Lost on the Frontline, a digital memorial, will initially launch on both the Guardian and KHN websites, but the series ultimately will grow into a single interactive site to memorialize the workers. The resulting nationwide resource—the first of its kind— will allow journalists at KHN and the Guardian to identify patterns in how the pandemic impacts health care workers, shedding light on the workings and failings of the U.S. health care system. Dozens of health care workers have already died in the pandemic and that number is expected to climb significantly.
The series launched with a profile of Frank Gabrin, America’s first ER doctor to die on the frontline of the coronavirus battle, as well as profiles of a jail nurse in New Jersey, a surgeon in New York City, a veterans affairs nurse in Detroit, nurses at hospitals in California and Nevada, and a custodian at a hospital in New York state.
Information about health care workers will be crowdsourced from family, friends and colleagues of fallen health care workers, as well as reported through traditional means. The series will feature profiles, photos and other information about those who have lost their lives since the outbreak began.
KHN and The Guardian are inviting news organizations across the country to partner in the effort. The project will link to local news stories on health care worker deaths, and all content from the series will be available free to other news organizations to republish. The project will reflect the rich diversity of the U.S. health care workforce. The lead partners will translate selected stories into multiple languages and make them available for publication by ethnic media outlets to ensure they reach the many communities in America affected by the pandemic.
Elisabeth Rosenthal, Editor-in-Chief of KHN, said:
“With the help of their families and friends, we want to tell the stories of health care workers who have made the ultimate sacrifice in the COVID-19 pandemic: dying from the virus, too often after providing care without adequate equipment or protection. And in doing so, we hope to hold to account an American health care system that failed them.”
John Mulholland, editor of Guardian US said:
“From doctors to hospital cleaners and from nursing home aides to paramedics, this project will capture the diverse range of frontline health workers risking their lives to help others in this fight. A shortage of tests and protective gear is increasing the dangers they face—and some will die trying to save others. We want to celebrate those lives and their heroism, as well as scrutinise the conditions leading to so many tragic outcomes.”
KHN and the Guardian are calling for family members, friends and colleagues of health workers to share information, photos and stories about their loved ones and co-workers who died on the frontlines via this form. If you have a colleague or loved one we should include, you can also email frontline@theguardian.com or covidtips@kff.org.
Because of the scope of the project, and the many categories of workers included, this resource may never be completely comprehensive. It will function as a work in progress – and build over time.
About The Henry J. Kaiser Family Foundation and Kaiser Health News
Filling the need for trusted information on national health issues, KFF (the Henry J. Kaiser Family Foundation) is a nonprofit organization based in San Francisco, California. KHN is an editorially independent program of KFF and is the nation’s leading and largest health and health policy newsroom, producing stories that run on kffhealthnews.org and are published by hundreds of news organizations across the country.
About Guardian News & Media
Guardian US is renowned for its Pulitzer prize-winning investigation into widespread secret surveillance by the National Security Agency, and for other award-winning work including the Paradise Papers. Guardian US has bureaus in New York, Washington DC, Oakland and New Orleans, covering the climate crisis, politics, race and immigration, gender, national security and more.
Guardian News & Media (GNM), publisher of theguardian.com, is one of the largest English-speaking newspaper websites in the world. Since launching its US and Australia digital editions in 2011 and 2013 respectively, traffic from outside of the UK now represents over two-thirds of The Guardian’s total digital audience.
As the coronavirus spreads rapidly across the United States, private health insurers and government health programs could potentially be burdened with higher health care costs. However, the extent to which costs grow, and how the burden is distributed across payers, programs, individuals, and geography are still very much unknown.
A new issue brief, available in full on the Peterson-Kaiser Health System Tracker, explores some of the factors driving health costs upward and downward, as well as some special considerations for private insurers, Medicare, and Medicaid programs.
For more data, analysis, polling and journalism on the COVID-19 pandemic, visit our special resource page on KFF.org.
With health centers playing an important role in the response to the coronavirus pandemic, findings from the KFF/Geiger Gibson 2019 Community Health Center Survey provide important information on health centers’ financial situation and their experiences in a changing policy environment. After years of growth following implementation of the Affordable Care Act (ACA), changes in Medicaid, public charge, and Title X family planning policies, among others, carry important implications for low-income patients as well as health center operations and revenue. While, overall, health center patient growth and revenue remain strong, some health centers had begun to feel the effects of these changes as they were being implemented across the nation. Federal legislation has directed additional resources to health centers in the wake of the current pandemic, but it is unclear what effect the current public health crisis will have on health centers. Findings from the survey include:
Continuing trends following the ACA, most health centers reported patient coverage and patient care revenue remained stable or improved. One-third of health centers reported an increase in Medicaid patients, while 45% said the number had stayed the same in the past year. Similarly, three in ten health centers reported an increase in Medicaid revenue while nearly half reported no change.
However, a growing share of health centers reported coverage and affordability challenges for their Medicaid and privately insured patients. One in five health centers (22%) reported that the number of Medicaid patients served has declined in the past year, and 44% saw an increase in the share of Medicaid/CHIP patients with a lapse in coverage. Nearly half (49%) reported an increase in the share of privately insured patients paying sliding scale fees in the past year in lieu of deductibles and other cost sharing required by their private plan, in effect forgoing use of their insurance. Mirroring the share of health centers reporting a decline in Medicaid patients, 23% reported a Medicaid revenue decrease in the past year, up from 15% in 2018.
There is a great deal of confusion among health center staff about the status of Medicaid work requirement waivers—most of which are on hold pending legal challenges—and health centers perceive many barriers to work and to reporting work activity for their patients. One in five respondents in states with an approved or pending waiver incorrectly identified the status of the state’s waiver or indicated that they did not know if the state had or was considering a waiver. Perceived barriers to work for patients who are not currently working included caring for family members, lack of transportation, mental health or substance use conditions, and lack of skills and education, among others.
Health centers reported limited capacity to expand family planning services as the Title X family planning program’s provider network constricts. Over three-quarters (77%) of health centers said they could increase the number of new family planning patients served by no more than 24%.
The top three challenges facing health centers were workforce recruitment, increasing costs to operate the health center, and inadequate physical space. Health centers in non-expansion states also cited the high number of uninsured patients as a top challenge.
Introduction
Health centers are a significant source of care for low-income, medically underserved communities. They also serve as an essential part of the health care system’s response to public health emergencies and other disasters. They are playing an important role in responding to the current COVID-19 pandemic by providing COVID-19 testing as well as continuing to treat ongoing health needs of their patients. Federal legislation has provided emergency funding to support their response. Health centers experienced significant growth in service sites and patient care capacity following implementation of the ACA, which positions them well to respond to the current crisis; however, leading up to the current crisis, they had been facing more headwinds in their ability to serve patients because of recent federal policy changes.
As key providers of comprehensive primary care services in communities whose residents are more likely to experience poverty and its health effects, along with a shortage of accessible primary health care, health centers feel the effects of policies that limit benefits and services to low-income populations. As a result, changes to federal programs that provide health coverage and promote access to health care services for low-income populations can be expected to have a significant impact on health center patients and operations. Some of the policy changes that are having the biggest effects include: federal support for states interested in testing large-scale Medicaid eligibility and enrollment restrictions such as work requirements, premiums, and other policies; changes to “public charge” policies that expand the programs that can trigger public charge determinations for legal immigrants seeking to adjust to permanent legal status; and new constraints on providers that participate in the Title X family planning program.
This brief presents findings from the 2019 KFF/Geiger Gibson Community Health Center Survey on the experience of health centers in a changing policy environment. This survey was conducted before the current coronavirus crisis, and focused on changes in health center patient coverage and operations during the past year, as well as health centers’ experiences with Medicaid work requirements, and their responses to changes in the Title X program. Where appropriate, the brief also highlights differences in findings across health centers in Medicaid expansion and non-expansion states and those located in urban versus rural areas. The effects of the new public charge policy were described in an earlier brief.1 While the findings do not relate specifically to the coronavirus pandemic, they provide important context for understanding the issues facing community health centers prior to the current crisis.
Key Findings
Health coverage, affordability, and revenue
Five years following the ACA coverage expansions, most health centers reported the number of Medicaid patients had increased or stayed the same over the past year. In contrast to national trends showing Medicaid enrollment declines, one-third of health centers said the number of Medicaid patients had increased in the past year while 45% said the number had stayed the same (Figure 1). Health centers serve as an important source of care for Medicaid patients and as they continue to expand their service capacity, some are likely attracting new Medicaid patients.
Figure 1: Share of Health Centers Reporting Changes in Medicaid Patients and Reasons for Decrease in Medicaid Patients
At the same time, one in five health centers said the number of Medicaid patients had declined. Health centers in non-expansion states were more likely to report their Medicaid patients had decreased (28% vs. 19% in Medicaid expansion states, data not shown). Among health centers reporting a decline, the most commonly reported reason for the decline (68%) was concerns among immigrant families about applying for or keeping Medicaid for themselves or their children. Nearly as common, six in ten health centers attributed the decline to changes in enrollment and renewal processes that make it more difficult for patients to obtain or keep Medicaid coverage, while three in ten cited an overall drop in the number of health center patients. The reasons cited for the decline differed by Medicaid expansion status and urban/rural status. Health centers in Medicaid expansion states were significantly more likely to attribute decreases in Medicaid patients to patients gaining jobs and losing Medicaid coverage due to increased income and/or employer-sponsored insurance (30% vs. 7% for non-expansion states, Appendix Table 1). Urban health centers were significantly more likely than rural health centers to report that concerns from patients in immigrant families about applying for or keeping Medicaid for themselves or their children explained the drop in Medicaid numbers (77% vs. 46%); while rural health centers were significantly more likely to cite declines in overall health center patient numbers (46% vs. 23% for urban) as a reason.
Health centers also reported an increase in coverage lapses among Medicaid and CHIP patients as well as those with private insurance. Over four in ten (44%) health centers reported an increase in coverage lapses for their Medicaid/CHIP patients, while a slightly smaller share of health centers (32%) reported coverage lapses among privately insured patients had increased (Figure 2). There are a number of reasons why people may experience a lapse or break in coverage. For Medicaid patients, the coverage lapses may stem from difficulties in renewing coverage. For privately insured patients, a break in coverage may reflect a change in employment and temporary loss of coverage or an inability to afford the monthly premium, among other reasons.
Figure 2: Changes in Coverage Lapses Among Medicaid or CHIP and Privately Insured Health Center Patients in the Past Year
Health centers reported their privately insured patients face increasing challenges affording coverage. More than six in ten health centers (61%) reported an increase in the past year in the percentage of insured patients who are unable to pay their deductibles and cost-sharing payments, and nearly half (49%) reported an increase in privately insured patients paying sliding scale fees (Figure 3). Health center patients qualify for sliding fee scale payments based on their income. An increase in the number of patients with private insurance who pay the sliding fee scale in lieu of the health plan’s copayments or other cost sharing suggests those payments are unaffordable to the individual.
Figure 3: Change in Inability to Afford Cost-Sharing Among Privately Insured Health Center Patients
Health centers in non-expansion states were more likely to report affordability challenges for their privately insured patients. Health centers in non-expansion states were significantly more likely than health centers in Medicaid expansion states to report increases in the past year in patients’ inability to afford cost-sharing payments and in the percentage of privately insured patients paying sliding-scale fees (Figure 4). These differences may be explained, in part, by the higher rates of marketplace coverage among low-income patients in non-expansion states. In states that have not expanded Medicaid, low-income individuals with incomes above 100% of the poverty level may enroll in marketplace coverage, but will face cost sharing requirements that may be difficult for them to afford. Rural health centers were significantly more likely than urban health centers to report an increase in privately insured patients paying sliding scale fees (55% vs. 44%).
Figure 4: Share of Health Centers Reporting Increases in Insurance Coverage Lapses and Inability to Afford Cost-Sharing, by Medicaid Expansion Status
Health centers’ financial situation remains strong, with most reporting improved or stable financial factors in the past year; however, some health centers reported decreases in key revenue sources. Similar to findings on patient coverage, most health centers continue to benefit financially from the ACA coverage expansions and enhanced federal health center funding. Over half (51%) of health centers reported an increase in federal grant funding from annual appropriated funding, the Community Health Center Fund as well as from targeted grant funding, and three in ten reported an increase in Medicaid revenue (Figure 5). At the same time, a growing share of health centers reported a decrease in Medicaid revenue. In 2019, similar to the share of health centers reporting a drop in Medicaid patients, 23% of health centers reported a decline in Medicaid revenue compared to just 15% in 2018.2 As health centers’ single largest source of operating revenue (44% in 2018),3 Medicaid revenue declines may carry implications for health centers’ ability to add service sites, hire staff, and expand the scope of care they provide. Additionally, over three in ten health centers that received Title X grant funding reported a decrease in their funding in the past year.
Figure 5: Changes in Health Center Financial Factors in the Past Year
Addressing social determinants of health
Health centers provide a range of social and supportive services aimed at addressing social determinants of health. Nearly all health centers reported providing insurance assistance services and case management services on-site (96% and 93%, respectively), and over six in ten health centers said they provided health literacy services (67%) and transportation services (61%) on-site (Figure 6). Nearly half (47%) reported providing healthy foods and veterans’ services. The provision of certain social and supportive services differed by Medicaid expansion status and between urban and rural health centers (Appendix Table 1). Health centers in non-expansion states were significantly more likely to provide veterans’, education, and agricultural worker support services on-site, while health centers in Medicaid expansion states were significantly more likely to provide insurance enrollment assistance services on-site. Urban health centers were significantly more likely to provide on-site transportation, SNAP, WIC, or other nutritional assistance, and refugee services, while rural health centers were significantly more likely to provide on-site agricultural worker support and veterans’ services (Appendix Table 1).
Figure 6: Share of Health Centers Providing Social and Supportive Services On-site
Potential implications of Medicaid work requirements
As of March 2020, the Centers for Medicare & Medicaid Services (CMS) had approved Medicaid Section 1115 waivers to implement work/community engagement requirements for ten states and ten state proposals are pending.4 At the same time, federal courts have set aside four approvals (Arkansas, Kentucky, Michigan, and New Hampshire) and work requirements in another four states with approved waivers—Arizona, Ohio, South Carolina, and Wisconsin—have not yet been implemented. Indiana, which has implemented work requirements, announced that it will temporarily suspend enforcement of the requirements pending the outcome of a legal challenge.5 A work demonstration was in effect and moving forward in Utah but was suspended on April 2, 2020 due to the COVID-19 pandemic.6 However, the future of these demonstrations may be in doubt following a ruling by a federal appeals court upholding a lower court’s decision striking down the work requirements in Arkansas. Before Arkansas’s work requirements program was halted by the court, over 18,000 Medicaid enrollees lost coverage; over 95% of those losing coverage either met the requirements or qualified for an exemption.7
Survey findings revealed a great deal of confusion and lack of information about the status of work requirement waivers and how those work requirements would be implemented. In states with an approved or pending waiver at the time of the survey, one in five respondents incorrectly identified the status of the state’s approved or pending waiver or indicated that they did not know if the state had or was considering a waiver. Among the survey respondents who correctly said that their state had an approved or pending waiver to implement Medicaid work/community engagement requirements or was considering developing a waiver, six in ten said their state had neither provided nor offered to provide training on the work requirements (Figure 7). Despite this lack of training from the state, nearly half (48%) of health centers reported they or their Primary Care Association (PCA) had provided or planned to provide training to their employees.
Most health centers indicated a desire to help patients with work reporting requirements and with obtaining exemptions; however, some health centers said they lacked the resources to do so. While over half (55%) of health centers in states with an approved or pending waiver said they were assisting or planned to assist patients with the new reporting requirements, more than three in ten (32%) said they were not providing or did not plan to provide the assistance (Figure 7). Most states include an exemption from work requirements for medically frail individuals; medical frailty determinations must be made by medical professionals. Although 52% of health center respondents reported state officials had not explained the process for determining patients as medically frail, 41% said they had the resources to conduct the determinations. However, reflecting the resource burden of making medical frailty determinations, six in ten (59%) said they did not have the resources or did not know if they had the resources to make these determinations.
Figure 7: Health Centers’ Experiences Preparing for Implementation of Medicaid Work/Community Engagement Requirements
Health centers perceive that their patients who are not currently working face many barriers to work. All health centers, regardless of their state’s waiver status, were asked about potential barriers to working among their adult, non-elderly, and non-disabled Medicaid patients who are not currently working. They reported a mix of health and mental health-related barriers as well as geographic and economic barriers to work. Over seven in ten health centers reported that many of their patients faced substance use disorders, acute or chronic mental health conditions, and acute or chronic physical health conditions (Appendix Table 1). Similar shares of health centers noted other barriers, such as child caring responsibilities, lack of transportation to jobs, or inadequate skills or education. Compared to health centers in rural areas, urban health centers were more likely to report as barriers preventing patients from working a mismatch between available jobs and patients’ skills and education and family caretaking responsibilities, while rural health centers were more likely than their urban counterparts to report a lack of jobs in the community, and the seasonal nature of many jobs.
Health centers also indicated their patients would likely face many barriers that would make it difficult for them to report work activity. In addition to confusion over reporting rules and deadlines, over half of health centers (57%) reported that lack of access to a computer would be a barrier for many patients and nearly half (47%) reported not having internet service would be a barrier for many patients, which would prevent them from being able to report work activity by phone or online, as required by several states (Appendix Table 2).
Participation in the Title X program and ability to accept new family planning patients
New rules governing the Title X family planning program went into effect on July 15, 2019, imposing new restrictions on grantee activities. These restrictions include blocking participation of program providers that also offer abortion services, barring staff from fully counseling pregnant patients about all options, and requiring mandatory referral of pregnant women for prenatal care regardless of patient choice. Before the restrictions took effect and as of June 2019, 4,008 Title X clinics were in operation. By December 20, 2019, all 410 Planned Parenthood health centers had withdrawn from the program, and an additional 631 Title X clinics, including some community health centers, were no longer participating in Title X.8 The decision to stop participating in Title X means the loss of funding to support family planning services at these clinics and health centers.
As of July 2019, a quarter of health centers reported participating in the Title X program, though that number may have changed following implementation of more restrictive rules. The share of health centers reporting receiving Title X funding was similar to the 26% who said they received Title X funding in 2017.9 Since the survey, which was conducted before the new rules went into effect, a significant number of health centers may have dropped their Title X participation, although a count is not available. Some health centers may perceive a conflict between the Title X counseling and referral ban and its physical and financial separation requirements and health centers’ patient care obligations under their funding authority (Section 330 of the Public Health Service Act).10,11
Health centers reported limited capacity to accept new family planning patients. With hundreds of clinics, including health centers, leaving the Title X program and their ability to serve family planning patients diminishing due to loss of funding, the need for alternative sources of care is expected to rise. Family planning services are part of the comprehensive primary care package that all health centers must furnish under Section 330.12 However, many health centers have limited capacity to expand these services. Over one-third (37%) of health centers reported either they could not expand patient load or they could expand by less than 10% with current staffing and clinic space; another 39% said they could increase the number of family planning patients by less than 25% (Figure 8). Despite limited capacity at some health centers, over one in five (23%) said they could expand capacity by 25% or more, including one in ten who said they could increase the number of family planning patients by 50% or more.
Figure 8: Health Centers’ Capacity to Accept New Family Planning Patients
Challenges facing health centers
Despite ongoing policy challenges, health centers were more likely to report operational issues as top challenges. Over half of health centers (52%) cited workforce recruitment and increasing costs to operate their health center as top challenges, while three in ten (31%) cited inadequate physical space as a top challenge (Figure 9). A quarter of health centers reported workforce retention (25%) and high numbers of uninsured patients (24%) as major challenges. Health centers in Medicaid expansion states were more likely than health centers in non-expansion states to report workforce recruitment as a top-three challenge (55% vs. 43%), while health centers in non-expansion states were more likely than those in expansion states to report high numbers of uninsured patients as a top-three challenge (45% vs. 15%, Appendix Table 1). Rural health centers also face provider shortages and were significantly more likely to report workforce recruitment as a top-three challenge (60%) compared to urban health centers (45%). These ongoing challenges, particularly the workforce and financial challenges, are likely to be exacerbated during the current COVID-19 crisis as frontline workers get sick and others must take time off to care for children and other family members, and as health centers face potentially precipitous declines in patient care revenue.
Figure 9: Share of Health Centers Reporting Selected Factors as their Top Three Challenges
Discussion
As federal policymakers turn to health centers during this time of crisis, they will play an important role in providing access to COVID-19 testing as well as ongoing primary care services for low-income, medically underserved communities. However, even as health centers continue their historic growth brought about by the ACA that may position them well to respond to the crisis, some have encountered limits on their ability to meet the needs of their patients because of recent policy changes, especially those that have resulted in recent declines in Medicaid coverage. While many states and the federal government have temporarily suspended some policies that create barriers to enrolling in Medicaid or to maintaining Medicaid coverage during the emergency, the reinstatement of these policies after the immediate emergency ends could make it harder for health centers to serve their communities in the longer term.
Through coronavirus response legislation, the federal government directed an initial $100 million to health centers13 and later directed over $1.3 billion in emergency grants to health centers to enable them to continue serving their patients during the crisis, and funded the Community Health Center Fund through November 2020.14 Yet, the economic upheaval from this pandemic is likely to persist long after the threat from the virus diminishes. While over half of health centers reported that federal grant funding had increased in the past year, the failure of Congress to pass a long-term extension of the Community Health Center Fund threatens to jeopardize the stable funding health centers have experienced for the past decade. The importance of stable future funding will be even greater in the aftermath of the pandemic as health centers seek to resume normal operations.
Methods
The 2019 Survey of Community Health Centers was jointly conducted by KFF and the Geiger Gibson/RCHN Community Health Foundation Research Collaborative at George Washington University’s Milken Institute School of Public Health. The survey was administered in partnership with the National Association of Community Health Centers (NACHC). The survey was fielded from May to July 2019 and was emailed to 1,342 CEOs of federally-funded health centers in the 50 states and the District of Columbia (DC) identified in the 2017 Uniform Data System (UDS). The response rate was 38%, with 511 responses from 49 states and DC.
The survey data were weighted using 2017 UDS variables for total health center patients, the percentage of patients reported as racial/ethnic minorities, and total revenue per patient. Survey findings are presented for all responding health centers and responses were analyzed using chi-squared tests to compare responses between health centers in Medicaid expansion and non-expansion states and15 health centers in rural and urban locations (based on a UDS variable).State Medicaid expansion status was assigned as of the survey fielding period.
Jessica Sharac, Anne Markus, and Sara Rosenbaum are with the Geiger Gibson Program in Community Health Policy at the George Washington University. Additional funding support for this brief was provided to the George Washington University by the RCHN Community Health Foundation.
Appendices
Appendix A
Appendix Table 1: Health Center Responses to Specific Survey Questions by Medicaid Expansion Status and Urban/Rural Status
All Health Centers
Medicaid expansion States
Non-expansion States
Urban
Rural
Factors Accounting for Decrease in Medicaid Patients
Concerns from immigrant families about applying for or keeping Medicaid for themselves or their children
68%
73%
59%
77%
46%^
Enrollment and renewal process changes have made it more difficult for patients to enroll in Medicaid or renew Medicaid coverage
60%
58%
64%
60%
61%
Overall drop in health center patients
30%
28%
35%
23%
46%^
Patients are gaining jobs and losing Medicaid coverage due to increased income and/or employer-covered insurance
22%
30%
7%*
26%
11%
New Medicaid eligibility requirements (e.g., work requirements, premium and copayment requirements) make it harder for patients to maintain Medicaid coverage
20%
20%
21%
20%
23%
Significant changes in the demographic characteristics of the communities our health center serves
15%
14%
16%
13%
18%
Do not contract with some or all Medicaid managed care plans that operate in our health center’s service area
6%
3%
11%
6%
5%
Fewer Medicaid covered services being offered
6%
3%
11%
6%
6%
All Health Centers
Medicaid expansion States
Non-expansion States
Urban
Rural
Health Centers Providing Social and Support Services On-Site
Insurance Enrollment Assistance
96%
97%
92%*
97%
94%
Case Management Services
93%
93%
95%
93%
94%
Health Literacy
67%
67%
68%
68%
66%
Transportation
61%
59%
66%
65%
55%^
Healthy Foods
47%
49%
43%
51%
42%
Veterans Services
47%
43%
57%*
42%
54%^
SNAP, WIC, or Other Nutritional Assistance Services
40%
41%
39%
47%
31%^
Physical Activity and Exercise
40%
40%
39%
40%
41%
Education
39%
35%
49%*
35%
44%
Domestic Violence
31%
33%
27%
34%
28%
Agricultural Worker Support
18%
13%
29%*
11%
27%^
Housing (includes housing assistance and quality)
18%
18%
16%
20%
14%
Refugee Services
17%
17%
17%
23%
8%^
Criminal Justice/Recidivism
13%
12%
14%
13%
12%
Job Training
12%
12%
11%
11%
12%
Job Search and Placement
8%
7%
12%
7%
10%
Child Care/Head Start
5%
5%
8%
5%
6%
All Health Centers
Medicaid expansion States
Non-expansion States
Urban
Rural
Barriers to Working for Adult Health Center Medicaid Patients Who Are Not Currently Working
Caring for children or other family members
79%
83%
71%*
83%
73%^
Lack of transportation to jobs
78%
78%
80%
78%
79%
Substance use disorders
77%
80%
70%*
77%
77%
Acute or chronic mental health conditions
76%
79%
68%*
78%
72%
Skills and education do not meet requirements for available jobs
76%
79%
69%*
79%
71%^
Acute or chronic physical health conditions
71%
71%
70%
74%
67%
Concerns about losing health coverage if they earn too much money
56%
57%
53%
57%
54%
Lack of job training resources
53%
55%
51%
57%
49%
Lack of jobs in the community
45%
45%
46%
40%
53%^
Many jobs in our community are seasonal
20%
20%
18%
14%
28%^
All Health Centers
Medicaid expansion States
Non-expansion States
Urban
Rural
Top Three Challenges Facing Health Centers
Increasing costs to operate health center
52%
55%
46%
54%
49%
Workforce recruitment
52%
55%
43%*
45%
60%^
Inadequate physical space
31%
30%
34%
27%
36%^
Workforce retention
25%
27%
21%
27%
24%
High number of uninsured patients
24%
15%
45%*
28%
19%^
Insufficient insurance reimbursement
19%
21%
13%
18%
20%
Insufficient grant funding
18%
17%
20%
19%
17%
Competition from other providers
14%
13%
17%
15%
13%
Changes to Medicaid reimbursement
14%
14%
13%
13%
15%
Changes to Medicaid eligibility criteria, including work requirements
10%
9%
13%
9%
11%
Contracting with insurers
9%
8%
10%
9%
9%
Efforts to integrate care provided by your health center with healthcare provided by other providers
Patient confusion regarding eligibility for insurance programs
6%
6%
4%
5%
6%
Efforts to integrate care with social services (e.g., housing, TANF, SNAP)
4%
5%
2%
5%
4%
Increased demand for family planning services
0%
1%
0%
0%
0%
NOTE: * Significantly different from Medicaid expansion at the <0.05 level; ^ Significantly different from Urban at p<0.05 levelSOURCE: KFF and Geiger Gibson/RCHN Community Health Foundation 2019 Survey of Community Health Centers
Appendix Table 2: Share of Health Centers Reporting Barriers to Reporting Work/Community Engagement Activities for their Patients
Potential Barriers to Reporting Work/Community Engagement Activities
Barrier for many patients
Barrier for some patients
Not a barrier
Are unsure of how to request an exemption
76%
23%
1%
Are unsure of reporting deadlines and/or how often they need to report
70%
28%
2%
Have questions about how to report their activity
67%
32%
1%
Are confused about whether the rules apply to them
67%
32%
2%
Face more pressing needs
67%
31%
3%
Have limited understanding of what they need to report
66%
33%
2%
Do not have access to a computer
57%
41%
2%
Lack confidence to report on their own
49%
49%
2%
Do not have access to internet service
47%
51%
2%
Need translation services
32%
57%
11%
Need help because of a disability
15%
82%
3%
Do not have access to a phone
9%
66%
26%
NOTE: Question was asked of all health centers, so responses represent potential barriers. Don’t Know responses were excluded. Totals may not sum to 100% due to rounding. Source: KFF and Geiger Gibson/RCHN Community Health Foundation 2019 Survey of Community Health Centers
Appendix B
2019 Survey of Community Health Centers(Questions 1-7 request survey respondent contact information; questions 18–26 and 28 were released separately)
Q8. Several states have received approval from the federal government to implement work/community engagement requirements in Medicaid and several others are considering such requirements. Is your health center in a state that has an approved or pending waiver or is considering developing a waiver request to require that Medicaid enrollees engage in work/community engagement activities as a condition of enrollment?
Yes, my state has an approved or pending waiver.Yes, my state is considering developing a waiver request.NoDon’t know
Q9. Have state Medicaid officials provided or offered to provide training to health center employees about the new Medicaid work/community engagement requirements?
Yes, state officials have provided the training.Yes, state officials have offered to provide training.No, state officials have not provided nor offered to provide training.Don’t know.
Q10. Has your health center or PCA provided, or does it provide, additional training to health center employees about the Medicaid work/community engagement requirements?
Yes, our health center or PCA has provided training.Yes, out health center or PCA plans to provide training.No, our health center would like to provide training but does not have the resources.No, our health center has not provided training and does not plan to provide training.Don’t know.
Q11. Is your health center assisting or does it plan to assist patients with meeting reporting requirements related to the Medicaid work/community engagement requirements, including explaining the requirements, creating online accounts, reporting monthly work/community engagement activity, or seeking and reporting exemptions?
Yes, we are currently assisting patients.Yes, we plan to assist patients.No, we would like to assist patients but do not have the resources.No, we are not assisting patients and do not plan to assist patients.Don’t know.
Q12. People deemed “medically frail” are excluded from Medicaid work/community engagement requirements. Has your state explained the process for designating patients with physical health conditions or mental health conditions/substance use disorders as medically frail?
Yes, state officials have explained the process.No, state officials have not explained the process.Don’t know.
Q13. Does your health center have the resources to complete the clinician evaluation that is required as part of the medical frailty determination for patients with physical health conditions or mental health conditions/substance use disorders?
YesNoDon’t know
Q14. If Medicaid enrollees were required to report work/community engagement activity online or by phone, please indicate whether the following factors would be a barrier for many patients, some patients, or not a barrier to meeting these reporting requirements among your Medicaid patients.
Do not have access to a computerDo not have access to internet serviceDo not have access to a phoneHave limited understanding of what they need to reportHave questions about how to report their activityAre unsure of reporting deadlines and/or how often they need to reportAre unsure of how to request an exemptionNeed translation servicesNeed help because of a disabilityLack confidence to report on their ownAre confused about whether the rules apply to themFace more pressing needsHave other barrier to reporting (specify)
Q15. Among your health center’s adult Medicaid patients who are non-elderly and non-disabled and who are not currently working, what would you identify as the barriers, if any, that prevent them from working? (Check all that apply).
No barriers (if so, please do not select other options)Acute or chronic physical health conditionsAcute or chronic mental health conditionsSubstance use disordersLack of jobs in the communityLack of job training resourcesSkills and education do not meet requirements for available jobsLack of transportation to jobsCaring for children or other family membersConcerns about losing health coverage if they earn too much moneyMany jobs in our community are seasonalDon’t know
Q16. Over the past year, has your health center noticed any of the following among your immigrant patients and their family members? Please indicate whether the following have been seen among many patients, some patients, a few patients, or no patients. Mark not applicable if these scenarios do not apply to your health center or don’t know if you are unsure.
Patients who refuse to enroll in Medicaid for themselvesPatients who refuse to enroll in Medicaid for their childrenPatients who disenroll or refuse to renew their own Medicaid coveragePatients who disenroll or refuse to renew Medicaid coverage for their childrenA reduction in the number of adult patients seeking care from the health centerA reduction in the number of patients seeking care for their children from the health center
Q17. If your health center has noticed immigrant patients and their family members choosing not to enroll in Medicaid, disenrolling from or not renewing Medicaid, or not seeking care, do you think the following federal policies or actions are a factor?
Recent proposed changes that would permit officials to consider use of Medicaid, SNAP, or other non-cash programs in public charge determinationsEnhanced immigration enforcement activityChanging federal policy limiting immigration pathways (e.g., elimination of protected status for some groups, limiting entry from certain countries, etc.)Other factor (please specify)
Q27. Please indicate whether your health center has experienced changes to the following financial factors in the past year. (Mark no change, increased, decreased, or not applicable for each option).Access to private capital
Federal grantsState and local grantsMedicaid revenuePrivate insurance revenueTitle X family planning grantsPercentage of Medicaid/CHIP patients who have a lapse or break in insurance coveragePercentage of private insurance patients who have a lapse or break in insurance coveragePercentage of insured patients who are unable to pay their deductibles and cost-sharing paymentsPercentage of privately insured patients who pay sliding scale feesFunding for community benefit activities from local hospitals and/or health plans
Q29. Over the past year, would you say the number of patients enrolled in Medicaid at your health center has increased, decreased, or stayed about the same? (If you answer increased or stayed the same, please skip to question 31).
The number of Medicaid patients has increasedThe number of Medicaid patients has stayed about the sameThe number of Medicaid patients has decreased
Q30. What would you say are the factors that likely account for the decrease in Medicaid patients at your health center? (Check all that apply).
Overall drop in health center patientsDo not contract with some or all Medicaid managed care plans that operate in our health center’s service areaSignificant changes in the demographic characteristics of the communities our health center servesPatients are gaining jobs and losing Medicaid coverage due to increased income and/or employer-covered insuranceConcerns from immigrant families about applying for or keeping Medicaid for themselves or their childrenEnrollment and renewal process changes have made it more difficult for patients to enroll in Medicaid or renew Medicaid coverageNew Medicaid eligibility requirements (e.g., work requirements, premium and copayment requirements) make it harder for patients to maintain Medicaid coverageFewer Medicaid covered services being offered
Q31. Does your health center currently receive funding from the Title X Family Planning Program?
YesNoDon’t know
Q32. In the next year, what it the estimated percentage increase in new family planning patients your health center could accept with current staffing and clinic space?
Not applicable, we do not currently have any family planning patientsNoneLess than 10%10-24%25-49%50-74%75-99%100% or more
Q33. How do patients at your health center receive prescription medications? (Check all that apply).
Dispensed by providerThrough an on-site pharmacy (either in-house or contract pharmacy)Through an off-site contract pharmacyThrough an off-site, non-contract pharmacyDon’t know
Q34. Which of the following types of social or support services does your health center provide on-site and/or through referrals to local organizations (Mark provide on-site, provide through referral, provide both on-site and through referral, or do not provide)?
Agricultural worker supportChild care/Head startCriminal justice/recidivismDomestic violenceEducationJob trainingJob search and placementHealthy foodsSNAP, WIC, or other nutritional assistance servicesHousing (includes housing assistance and quality)Health literacyInsurance enrollment assistancePhysical activity and exerciseRefugee servicesTransportationVeterans servicesCase management services
Q35. Please identify the top 3 challenges facing your health center.
Patient confusion regarding eligibility for insurance programsChanges to Medicaid reimbursementChanges to Medicaid eligibility criteria, including work requirementsInsufficient grant fundingInsufficient insurance reimbursementContracting with insurersWorkforce recruitmentWorkforce retentionHigh number of uninsured patientsCompetition from other providersEfforts to integrate care provided by your health center with healthcare provided by other providersEfforts to integrate care with social services (e.g., housing, TANF, SNAP)Increased immigration enforcement and/or policy changes affecting immigrantsIncreased demand for family planning servicesInadequate physical spaceIncreasing costs to operate health centerOther challenge (please specify)
Sharac, J., Shin, P., Rosenbaum, S., & Handarov, T. (2019). Community health centers continue steady growth, but challenges loom. Geiger Gibson/RCHN Community Health Foundation Research Collaborative, George Washington University. Policy Research Brief No. 60. https://www.rchnfoundation.org/?p=8436↩︎
Sommers, B. D., Goldman, A. L., Blendon, R. J., Orav, E. J., & Epstein, A. M. (2019). Medicaid Work Requirements—Results from the First Year in Arkansas. New England Journal of Medicine, 381: 1073-1082. ↩︎
Medicaid expansion status was as of the time of the survey fielding period. Note that Utah and Idaho, which implemented the Medicaid expansion on January 1, 2020, and Nebraska, which has adopted but not yet implemented the expansion, were categorized as non-expansion states in this analysis. ↩︎
More than 16 million workers have already lost their jobs due to the economic disruption caused by COVID-19, and the numbers will continue to rise as the nation struggles to slow the spread of the virus. In addition to the severe economic impacts on these workers and their families, the losses of employment and income affect their access to health coverage both through work as well as through the marketplaces and Medicaid.
As we will illustrate in the following scenarios, most people who are laid off and receive Unemployment Insurance (UI) benefits may become eligible for subsidized coverage either through the marketplace or Medicaid. However, describing how coverage outcomes work is a bit like describing a game of three-dimensional chess. Post-unemployment health coverage options will depend on (1) the worker’s coverage status prior to being laid off, (2) the unemployed worker’s level of state unemployment insurance (UI) benefits (which are counted in determining eligibility for Medicaid and marketplace subsidies) and federal supplemental UI benefits (which are counted in determining eligibility for marketplace subsidies but not Medicaid), and (3) whether the worker’s state has adopted the Affordable Care Act (ACA) Medicaid expansion option and/or has re-opened its marketplace open enrollment period.
For many low-, moderate- and even higher-income families, the income reduction from unemployment can make parents newly eligible for Medicaid if they live in expansion states.
In non-expansion states, some unemployed parents whose income falls well below the federal poverty level (FPL) may qualify for Medicaid through the pre-ACA eligibility pathway for parents of dependent children. However, in most non-expansion states, parents must have income well below 50% FPL to qualify,
No matter where they live, children in unemployed families will likely be newly eligible for Medicaid or the Children’s Health Insurance Program (CHIP), which is open to children with family income at or well above 200% of FPL in nearly all states.
People losing job-based coverage will qualify for a special enrollment period (SEP) in every state marketplace. If their unemployment income is between 100%-400% FPL they can also qualify for subsidies.
People who were uninsured while working will not qualify for a SEP based on coverage loss. However, in most state-run marketplaces they will be able to sign up because their state has re-opened enrollment for all residents.
People who lose job-based coverage who can sign up for marketplace plans generally will qualify for marketplace subsidies thanks to the $600 per week supplemental federal unemployment benefits, assuming they receive this supplement for most of the temporary period when it is offered. Over 17 weeks, this supplement adds $10,200 in unemployment income to state UI benefits, and will generally leave individuals and families with income between 100% and 400% FPL. However, because the federal $600/week supplement ends in July, for lower income families and individuals who lose jobs later in the year, earnings and state UI benefits may not be enough to qualify for marketplace subsidies, and they could find themselves with no affordable options in states that have not expanded Medicaid.
Some very low-income uninsured individuals may become newly eligible for marketplace subsidies. Adults with income below poverty generally are not eligible for marketplace subsidies, and generally won’t qualify for Medicaid in non-expansion states (the so-called coverage gap). However, new federal supplemental UI benefits recently enacted by Congress could lift some poor adults out of the coverage gap, making them newly eligible for Marketplace subsidies. As federal supplemental benefits end in July, this advantage will disappear.
The simplified scenarios shown in this brief do not reflect other variables that could affect health coverage opportunities for individuals. For example, other state unemployment program characteristics may make unemployed workers eligible for lower state benefits or for a shorter period of time. Backlogs at some state offices may delay or deter some unemployed workers from applying at all. Limited access to navigators in many federal marketplace states could also make it harder for some people to apply for health coverage options for which they are eligible.
Background
The recently enacted CARES Act provides much needed help to the unemployed by increasing and supplementing state unemployment benefits with federal funds. In particular, the Act provides a $600 weekly federal supplement (available through July 31) to state unemployment benefits and extends the period for receiving unemployment benefits by up to 13 weeks. The Act also extends benefits to many types of workers (e.g., self-employed) not currently eligible for unemployment benefits under state laws.
The amounts available under the Act have a meaningful impact on family income and affect potential eligibility for premium tax credits for Affordable Care Act (ACA) marketplace coverage and for Medicaid. Unemployment benefits generally are considered income in determining eligibility for these programs. However, under the CARES Act, the $600 federal supplement is considered income for determining eligibility for premium tax credits for marketplace coverage but is not counted as income for determining Medicaid eligibility. The federal Recovery Rebate of $1,200 per adult is not counted as income in determining eligibility for either program.
State unemployment programs vary in many ways; particularly important are differences in the maximum weekly benefits available and in the length of benefit period. We developed a simplified set of scenarios to look generally at how unemployment benefits, as supplemented by the Cares Act, affect family income and eligibility for premium tax credits for marketplace coverage and Medicaid. These scenarios provide examples for families at different income levels, and we look at the impact of different state benefit levels. We address several coverage situations for families where a worker has recently become unemployed:
Families that lost workplace health coverage when a worker lost their job
Families that currently have marketplace coverage but experience a change in income
Families that are currently uninsured
Access to health benefits will vary for some of these families depending on where they live – in particular, whether their state has expanded Medicaid to include all low-income people under the ACA, and whether their marketplace is state-administered or uses Healthcare.gov. Nearly all state-based marketplaces have re-opened Open Enrollment to make it easier for any resident, including the uninsured, to sign up for coverage during the COVID-19 crisis. (Many of these states describe this period as a COVID-19 Special Enrollment Period.) The Trump administration has authority to offer an open enrollment period in the federal marketplace for people who were already uninsured, but has not done so. Instead, in Healthcare.gov states, people are eligible to enroll in coverage only if they qualify for a special enrollment period (SEP). Two qualifying events can trigger an SEP in these scenarios: (1) loss of prior job-based coverage, and (2) being uninsured and living in a non-expansion state and having a change in income from below poverty (i.e., the coverage gap) to above poverty. Other mid-year income changes that make people newly eligible for marketplace subsidies only trigger an SEP if the person is already enrolled in a marketplace plan. (There are other SEPs that may be available for people experiencing other life events, but they are not triggered in these scenarios.) Medicaid is open for enrollment year round.
Data Note
Scenarios and Results
As noted, state unemployment programs vary considerably in detail, so we developed a generalized approach to estimate the impact on family incomes. Our key assumptions are:
The family has one worker who loses her job at the end of March, 2020. We vary the family composition between a three- person family (two dependents) and a single worker.
The worker was employed continuously during the year prior to layoff in a job eligible for unemployment benefits.
The family only has the worker’s earnings, and the annualized earnings in 2020 prior to losing her job were slightly higher (3.5%) than earnings during the prior year base period (the period used in states to determine weekly benefits).
The worker is employed the first 12 weeks in 2020 before being laid off, and begins receiving unemployment benefits the week of April 5th. Later we discuss how results would differ in cases where the worker continues to be employed until later in the year.
The state unemployment program provides weekly benefit equal to 50% of the base period earnings, subject to maximum weekly benefit amounts. We looked at three maximum benefit amounts ($620, $450, $275) roughly reflecting the variation across states. In addition, we assume laid off workers receive the new federal supplemental benefit of $600 per week from April 5 through the end of July (17 weeks).
The state UI benefit period is 26 weeks. Although some states have shorter periods, a few have already extended their periods during the COVID-19 emergency; in some other states benefit periods may be extended in times of high unemployment.
Medicaid eligibility is determined based on monthly income, which is calculated by multiplying the weekly state unemployment benefit by 4.3. This is compared to the 2020 poverty level (divided by 12) to determine the Medicaid poverty level for current monthly income. The $600 weekly federal supplement is not included in the calculation for Medicaid eligibility. In states that have expanded Medicaid under the ACA, people are eligible with income up to 138% of the poverty level. Wisconsin Medicaid covers low-income adults up to 100% FPL. In most other non-expansion states, parents can get Medicaid if income is less than 50% FPL.1
Marketplace subsidies are determined based on annual income, which is calculated by adding income earned in 2020 while employed, state weekly UI benefits multiplied by 39 weeks (the CARES Act provides federal financing for states to expand their UI benefit period by up to 13 weeks), and the federal supplemental UI benefit of $600 per week multiplied by 17 weeks. This total is compared to the 2019 federal poverty level, which is used to determine eligibility for marketplace subsidies in 2020. People are eligible for ACA marketplace subsidies if income is from 100% to 400% of the poverty level. This calculator can be used to estimate eligibility for and amount of marketplace subsidies.
We begin by looking at a moderate-income three-person family with $50,000 in annualized earnings prior to layoff. We then show how the results vary for a higher income ($100,000) and a lower income ($23,000) family and for two single workers, one with lower income ($15,000) and one with poverty-level income ($12,000).
In every scenario, access to new health coverage will depend on coverage status prior to layoff. It will also depend on where people live. State UI programs provide different benefit levels, income-eligibility for adults and children varies across State Medicaid programs, and in most state marketplaces, people can only enroll in coverage now if they are eligible for a SEP.
Moderate Income Family
This scenario illustrates changes in income and eligibility for health coverage for a moderate-income family – a single parent with 2 children – with pre-unemployment annual income of $50,000 for 2020.
This family would have just over $11,500 in earnings for the 12 weeks of work before the job loss. Under our scenario, the family would begin receiving state unemployment benefits for weeks beginning April 5th of $465, subject to state maximum benefit limits. The family would also receive an additional 13 weeks of the state benefit amount (the federal extension) as well as an additional $600 per week for the weeks starting April 5th and ending with the week beginning July 28 (17 weeks). Overall, the federally-supplemented unemployment benefits plus the worker’s prior earnings equal between 65% and 80% of the family’s prior earning level. The results are summarized in Table 1.
Table 1: Moderate Income Three-Person Family
$620 Max Benefit
$450 Max Benefit
$275 Max Benefit
Annualized Income Before Job Loss
$50,000(234% FPL)
$50,000(234% FPL)
$50,000(234% FPL)
Weekly State UI benefit
$465
$450
$275
Federal Supplemental Weekly UI Benefit (stops at end of July)
$600
$600
$600
Monthly Income for Determining Medicaid or CHIP Eligibility (State UI Benefit only)
$2,000(110% FPL)
$1,935(107% FPL)
$1,182(65% FPL)
Annual Income for Determining 2020 Marketplace Subsidies (Earnings + State and Federal UI Benefits)
$39,854(187% FPL)
$39,288(184% FPL)
$32,463(152% FPL)
Access to Coverage
In this scenario, whether the moderate-income family lives in a state with high, moderate, or low state unemployment benefits, under Medicaid’s method of determining income, its new, reduced income would be less than 138% of FPL (and in very low UI benefit states, income could fall below the poverty level); while under the marketplace’s method of determining income, income would fall between 100% and 200% FPL. This consistent result happens because the marketplace will always count the $600/week federal UI supplement and income earned earlier in the year, while Medicaid and CHIP will only consider state UI benefits earned in that month, which constitute half or less of the family’s pre-layoff earnings level.
Families Losing Job-Based Coverage. At this new lower income, access to marketplace or Medicaid coverage for this family would vary across states:
In 36 Medicaid expansion states and DC, the parent would become eligible for Medicaid.
In non-expansion states, the parent generally would not qualify for Medicaid. Even if income falls to 65% FPL, it would still be too high to qualify under the pre-ACA eligibility pathway for parents in most non-expansion states.
In 14 non-expansion states, the parent would be eligible for a special enrollment period in the marketplace coverage (due to loss of job-based coverage.) The parent would qualify for premium tax credits based on her new projected 2020 income, which would fall between 100% and 200% FPL in all states. The parent would also qualify for cost sharing subsidies delivered through CSR silver plans.
Children in the family would be eligible for Medicaid or CHIP in every state, and would have been eligible in most states even pre-layoff.
Families with Marketplace Coverage When Employed. Most marketplace participants today are self-employed or work in jobs that don’t offer them group health benefits. Generally, people are eligible for marketplace subsidies if their 2020 family income is between 100% and 400% of the federal poverty level and if they are not eligible for other coverage, such as through an employer or Medicaid. As a result, the laid-off mother in this scenario could have already been covered under a subsidized marketplace plan.
In Medicaid expansion states, the mother would have earned too much to qualify for Medicaid while working, but once unemployed, would become eligible for Medicaid based on her new lower income.
In most non-expansion states, the parent’s new lower income would not qualify for Medicaid even under the pre-ACA eligibility pathway for parents of dependent children because – even as low as 65% FPL – it would still be too high.
In non-expansion states, her reduced income would make the mother eligible for higher premium tax credits, and she would now qualify for cost sharing subsidies. She would be eligible for a special enrollment period (SEP) of 60 days during which she could switch to a cost sharing reduction (CSR) plan with a lower deductible. On average, silver plan deductibles in Healthcare.gov states are $4,544/person, but people with income 150%-200% FPL qualify for CSR plans with an average deductible of $762.
Children in the family would be eligible for Medicaid or CHIP in every state, and even pre-layoff, children would have been eligible in most states.
Families Uninsured When Working.
In Medicaid expansion states, the parent would become eligible for Medicaid and could enroll.
In most non-expansion states, the parent’s new lower income would not qualify for Medicaid even under the pre-ACA eligibility pathway for parents of dependent children because – even as low as 65% FPL – it would still be too high.
In non-expansion states, the already-uninsured parent would not be eligible for the coverage-loss SEP to enroll in marketplace coverage through Healthcare.gov.
Children in this family would be eligible for Medicaid or CHIP in every state.
Higher Income Family
This scenario is the same as the previous one except that the pre-job loss annualized earnings for 2020 are increased to $100,000.
This family would have just under $23,100 in earnings for the 12 weeks of work before the job loss. Under our scenario, the family would begin receiving state unemployment benefits for weeks beginning April 5th and would receive the maximum amount under all three iterations. The family would also receive an additional 13 weeks of the state benefit amount (the federal extension) as well as an additional $600 per week in federal supplemental UI benefits for the weeks starting April 5th and ending with the week beginning July 28 (17 weeks). Overall, the federally-supplemented unemployment benefits plus the worker’s prior earnings equal between 44% and 58% of the family’s prior earning level. The results are summarized in Table 2.
Table 2: Higher Income Three-Person Family
$620 Max Benefit
$450 Max Benefit
$275 Max Benefit
Annualized Income Before Job Loss
$100,000(469% FPL)
$100,000(469% FPL)
$100,000(469% FPL)
Weekly State UI benefit
$620
$450
$275
Federal Supplemental Weekly UI Benefit (stops at end of July)
$600
$600
$600
Monthly Income for Determining Medicaid or CHIP Eligibility (State UI Benefit only)
$2,666(147% FPL)
$1,935(107% FPL)
$1,182(65% FPL)
Annual Income for Determining 2020 Marketplace Subsidies (Earnings + State and Federal UI Benefits)
$57,457(269% FPL)
$50,827(238% FPL)
$44,002(206% FPL)
Access to Coverage
For higher income families, the income decline following layoff varies more depending on the state UI program benefits. Considering only the state UI benefits, this family with a pre-layoff income of nearly 5 times the poverty level would see income fall dramatically, in some states to below the federal poverty level. Adding in the federal supplemental UI benefits offsets income loss, however; the new post-layoff income falls between 2 and 3 times FPL. Health coverage options will depend on where the family lives.
Families Losing Job-Based Coverage. Access to marketplace or Medicaid coverage for this family would vary across states:
In Medicaid expansion states, the mother would be eligible for Medicaid in the states with mid-range and low levels of maximum state UI benefits. Her monthly income would be too high to qualify for Medicaid in the state with the $620 weekly UI maximum benefit, but she would be eligible for a special enrollment period in the marketplace coverage (due to loss of job-based coverage) and could qualify for premium tax credits based on their new projected poverty level.
In non-expansion states, the parent generally would not qualify for Medicaid even under the pre-ACA eligibility pathway for parents of dependent children; even if income fell to 65% FPL it would still be too high to qualify in most non-expansion states.
In non-expansion states, the mother would be eligible for a special enrollment period in the marketplace coverage (due to loss of job-based coverage) and could qualify for premium tax credits based on their new projected poverty level.
In all states, children in the family would become eligible for Medicaid or CHIP at this new lower household income.
Families with Marketplace Coverage When Employed.
In Medicaid expansion states, the mother would be eligible for Medicaid in states with lower maximum state UI benefits. Her monthly income would be too high to qualify for Medicaid in the state with the $620 weekly UI maximum benefit.
In all states, the mother would be eligible for a different special enrollment period in the marketplace (due to loss of income, because she is already enrolled in a marketplace plan) and could qualify for premium tax credits based on the new projected poverty level.
Children in this family would become newly eligible for Medicaid or CHIP in every state.
Families Uninsured When Working.
In Medicaid expansion states, the mother would be eligible for Medicaid in states with lower maximum state UI benefits. Her monthly income would be too high to qualify for Medicaid in the state with the $620 weekly UI maximum benefit.
In most non-expansion states, the mother would not qualify for Medicaid even under the pre-ACA eligibility pathway for parents of dependent children.
In non-expansion states, all of which are also Healthcare.gov states, the mother would not be eligible for a special enrollment period in the marketplace.
In all states, children in the family would become eligible for Medicaid or CHIP at this new lower household income.
Low Income Family
This scenario is the same as the previous ones except that the pre-job loss annualized earnings for 2020 are $23,000.
This family would have just under $5,308 in earnings for the 12 weeks of work before the job loss. Under our scenario, the family would begin receiving state unemployment benefits for weeks beginning April 5th, and because pre-layoff wages were so low, we estimate state UI benefits would be $214 per week in each of the scenario states (assuming that UI replaces roughly 50% of wages). The family would also receive an additional 13 weeks of the state benefit amount (the federal extension) as well as an additional $600 per week in federal supplemental UI benefits for the weeks starting April 5th and ending with the week beginning July 28 (17 weeks). Overall, the federally-supplemented unemployment benefits slightly increase income for this family. The results are summarized in Table 3.
Table 3: Low Income Three-Person Family
$620 Max Benefit
$450 Max Benefit
$275 Max Benefit
Annualized Income Before Job Loss
$23,000(108% FPL)
$23,000(108% FPL)
$23,000(108% FPL)
Weekly State UI benefit
$214
$214
$214
Federal Supplemental Weekly UI Benefit (stops at end of July)
$600
$600
$600
Monthly Income for Determining Medicaid or CHIP Eligibility (State UI Benefit only)
$920(51% FPL)
$920(51% FPL)
$920(51% FPL)
Annual Income for Determining 2020 Marketplace Subsidies (Earnings + State and Federal UI Benefits)
$23,841(112% FPL)
$23,841(112% FPL)
$23,841(112% FPL)
Access to Coverage
Whether this family lives in a state with high, moderate, or low state unemployment benefits, state UI benefits would only reach about half of pre-layoff earnings in each illustrated state. As a result, the family’s Medicaid income would fall to 51% FPL in each illustrated state. The family would also receive the federal supplemental UI benefit for 17 weeks in every state, which would slightly increase the family’s income for the year, from 108% FPL pre-layoff to 112% FPL in each state.
Families Losing Job-Based Coverage. With this income change, access to marketplace or Medicaid coverage for this family would vary across states:
In 36 Medicaid expansion states and DC, the parent would have been eligible for Medicaid prior to layoff and would continue to be eligible.
In most of the non-expansion states, the mother would not be eligible for Medicaid because her new unemployment income of 51% FPL would still be too high.
In the 14 non-expansion states, the mother would be eligible for a special enrollment period in the marketplace (due to loss of job-based coverage.) The parent would qualify for premium tax credits based on her new 2020 income of 112% FPL. The national average premium after tax credits for the benchmark silver plan is $41 per month at this income. The parent would also qualify for a cost sharing reduction (CSR) with a national average deductible of $209.
Children in the family would be eligible for Medicaid or CHIP in every state, as they would have been prior to layoff.
Families with Marketplace Coverage When Employed. Generally, people are eligible for marketplace subsidies if their 2020 family income is between 100% and 400% of the federal poverty level and if they are not eligible for other subsidized minimum essential coverage, such as Medicaid.
In Medicaid expansion states, the parent would have been eligible for Medicaid, and so not enrolled in marketplace coverage.
In non-expansion states, the mother would have qualified for marketplace subsidies prior to layoff. With her slightly increased income, the mother could update her marketplace application to reduce the monthly premium tax credit paid on her behalf; otherwise, she may have to repay some of the excess tax credit when she files her 2020 income tax return next year.
Children in the family would be eligible for Medicaid or CHIP in every state, and were prior to layoff.
Families Uninsured When Working.
In Medicaid expansion states, the parent would have been eligible for Medicaid prior to layoff and still would be post-layoff.
In most non-expansion states, the parent would not be eligible for Medicaid, even at her new income of 51% FPL.
In non-expansion states, the already-uninsured parent would not be eligible for an SEP to enroll in marketplace coverage through Healthcare.gov.
Children in this family would be eligible for CHIP in every state.
Low Income Single Person
This scenario differs from the previous one, showing a single worker with no dependents and with pre-job loss annualized earnings for 2020 of $15,000.
This worker would have $3,462 in earnings for the 12 weeks of work before job loss. Under our scenario, he would begin receiving state unemployment benefits for weeks beginning April 5th, and because pre-layoff wages were so low, we estimate state UI benefits would be $139 per week in each of the scenario states, far below any state maximum benefit. This worker would also receive an additional 13 weeks of the state benefit amount (the federal extension) as well as an additional $600 per week in federal supplemental UI benefits for the weeks starting April 5th and ending with the week beginning July 28 (17 weeks). Overall, the federally-supplemented unemployment benefits plus the worker’s prior earnings would result in a higher income than her pre-layoff income. Results are summarized in Table 4.
Table 4: Low Income Single Person With No Dependents
$620 Max Benefit
$450 Max Benefit
$275 Max Benefit
Annualized Income Before Job Loss
$15,000(120% FPL)
$15,000(120% FPL)
$15,000(120% FPL)
Weekly State UI benefit
$139
$139
$139
Federal Supplemental Weekly UI Benefit (stops at end of July)
$600
$600
$600
Monthly Income for Determining Medicaid or CHIP Eligibility (State UI Benefit only)
$598(56% FPL)
$598(56% FPL)
$598(56% FPL)
Annual Income for Determining 2020 Marketplace Subsidies (Earnings + State and Federal UI Benefits)
$19,096(153% FPL)
$19,096(153% FPL)
$19,096(153% FPL)
Access to Coverage
No matter the level of state maximum UI benefits, state UI benefits for this low income worker are assumed to be $139 per week in each scenario state. As a result, his Medicaid income would fall to 56% FPL in each state. He would also receive the federal supplemental UI benefit of $600 per week through July, which would raise his annual income to just over $19,000 for 2020, or from 120% FPL to 153% FPL.
Worker Losing Job-Based Coverage. With this income change, access to marketplace subsidies and Medicaid coverage for this worker would vary across states:
In 36 Medicaid expansion states and DC, this worker would have been eligible for Medicaid prior to layoff and would continue to be eligible while unemployed.
In non-expansion states, the worker would not be eligible for Medicaid, except in Wisconsin, the only state that covers childless adults with income up to 100% FPL.
This worker would be eligible for a special enrollment period in the marketplace (due to loss of job-based coverage) and he would qualify for marketplace subsidies with annual income over 100% FPL. The national average premium after tax credits for the benchmark silver plan would be $68 per month at this income level. He would also qualify for a cost sharing reduction (CSR) plan with a national average deductible of $762.
Worker with Marketplace Coverage When Employed. This worker’s income change could change his eligibility for Medicaid or marketplace subsidies, depending on where he lives.
In Medicaid expansion states, he would have been eligible for Medicaid prior to layoff, and so not enrolled in marketplace coverage.
In non-expansion states, the worker would have qualified for marketplace subsidies prior to layoff. However, with unemployment benefits significantly increasing his income, he is not eligible for the same amount of subsidy. At pre-layoff income of level of 120% FPL, he would have had to pay $26/month for the benchmark plan. At 153% FPL, his required premium contribution rises to $63 per month. At the higher income level he also qualifies for a less generous CSR plan. If he does not update his marketplace application, he may have to repay up to $300 in excess premium tax credit when he files his 2020 federal tax return. He would not be required to repay excess CSR subsidy.
Uninsured Worker When Employed
In Medicaid expansion states this worker have been eligible for Medicaid prior to layoff and still would be post-layoff.
In non-expansion states other than Wisconsin, the worker would not be eligible for Medicaid.
In non-expansion states, the already-uninsured worker would not be eligible for an SEP to enroll in marketplace coverage through Healthcare.gov.
Low Income Single Person Below Poverty
This scenario is the same as the previous one, depicting a single worker with no dependents except the pre-job loss annualized earnings for 2020 is $12,000.
This worker would have $2,769 in earnings for the 12 weeks of work before job loss. Under our scenario, she would begin receiving state unemployment benefits for weeks beginning April 5th, and in this case, we estimate she would receive a minimum State UI benefit of $50 per week in each of the scenario states. (In half of states, the minimum weekly benefit is a lower amount, ranging from $5 to $45 per week). This worker would also receive an additional 13 weeks of the state benefit amount (the federal extension) as well as an additional $600 per week in federal supplemental UI benefits for the weeks starting April 5th and ending with the week beginning July 28 (17 weeks). Again in this scenario, the temporary federal supplemental UI benefit can raise this worker’s annual earnings from just below to just above the federal poverty level. Results are summarized in Table 5.
Table 5: Low Income Single Person Below Poverty With No Dependents
$620 Max Benefit
$450 Max Benefit
$275 Max Benefit
Annualized Income Before Job Loss
$12,000(96% FPL)
$12,000(96% FPL)
$12,000(96% FPL)
Weekly State UI benefit
$50
$50
$50
Federal Supplemental Weekly UI Benefit (stops at end of July)
$600
$600
$600
Monthly Income for Determining Medicaid or CHIP Eligibility (State UI Benefit only)
$215(20% FPL)
$215(20% FPL)
$215(20% FPL)
Annual Income for Determining 2020 Marketplace Subsidies (Earnings + State and Federal UI Benefits)
$14,919(119% FPL)
$14,919(119% FPL)
$14,919(119% FPL)
Worker Losing Job-Based Coverage.
In 36 Medicaid expansion states and DC, this worker would have been eligible for Medicaid prior to layoff and would continue to be eligible while unemployed.
In non-expansion states other than Wisconsin, the worker would not be eligible for Medicaid.
In non-expansion states, he would be eligible for a special enrollment period in the marketplace (due to loss of job-based coverage.) With income of 119% FPL, he would qualify for premium and cost sharing subsidies. The national average premium after tax credits for the benchmark silver plan would be $68 per month at this income level. He would also qualify for a cost sharing reduction (CSR) plan with an average deductible of $762.
Worker with Marketplace Coverage When Employed.
In Medicaid expansion states, he would have been eligible for Medicaid prior to layoff, and so not enrolled in marketplace coverage.
In non-expansion states, the worker would not have qualified for marketplace subsidies prior to layoff because his income was below the poverty level, so he probably would not have been enrolled.
Uninsured Worker When Employed
In Medicaid expansion states this worker have been eligible for Medicaid prior to layoff and still would be post-layoff.
In non-expansion states other than Wisconsin, the worker would not be eligible for Medicaid.
In non-expansion states, the uninsured worker would be eligible for an SEP to enroll in marketplace coverage through Healthcare.gov. This is because his higher unemployment income lifts him out of the Medicaid coverage gap and makes him newly eligible for marketplace subsidies.
What Happens to People Laid Off Later This Year?
Our scenarios look at simplified cases where people were laid off at the end of March and then qualify for unemployment benefits for the remainder of the year. The federal extension and supplement payments authorized under the CARES Act also help people who may have lost their job earlier or later in 2020, but because the $600 supplemental payment is available only through July 31, people losing their jobs later in 2020 may lose some or all of that additional stimulus. For example, a worker who was employed until the end of June would receive at most 4 weeks of the $600 federal supplement.
Some people who lose jobs with job-based coverage later 2020 may have difficulties gaining access to affordable coverage in states that have not expanded Medicaid. While those with sufficient incomes may be able to afford coverage through COBRA or the marketplace, some with lower incomes would see their projected annual income fall below the poverty level, which would mean that they are not eligible for premium tax credits to help them afford marketplace coverage.
To illustrate, consider the low income family shown above in Scenario 3, a single mother with 2 children working in a job that pays $23,000 per year, If she is laid off at the end of June instead of at the end of March, her pre-layoff earnings would be $11,058. Her weekly state UI benefits would be the same once she begins receiving them, but she would only receive the federal $600 weekly supplement for 4 weeks. As a result, her 2020 income including earnings plus state and federal supplemental UI benefits would fall to just over $19,000. See Table 6.
Table 6: Low Income Three-Person Family, Job Loss in End of June
$620 Max Benefit
$450 Max Benefit
$275 Max Benefit
Annualized Income Before Job Loss
$23,000(108% FPL)
$23,000(108% FPL)
$23,000(108% FPL)
Weekly State UI benefit
$214
$214
$214
Federal Supplemental Weekly UI Benefit for 4 weeks (stops at end of July, )
$600
$600
$600
Monthly Income for Determining Medicaid or CHIP Eligibility (State UI Benefit only)
$920(51% FPL)
$920(51% FPL)
$920(51% FPL)
Annual Income for Determining 2020 Marketplace Subsidies (Earnings + State and Federal UI Benefits)
$19,013(89% FPL)
$19,013(89% FPL)
$19,013(89% FPL)
Access to Coverage
As we showed in an earlier scenario, this low income family would experience substantial income loss following layoff that occurs later in the year. Throughout the year, Medicaid would consider only state UI benefits for this family and determine monthly income to be at 51% FPL. With a layoff in late June, however, this family would only benefit from the supplemental federal UI benefit of $600/week for 4 weeks. So total 2020 income would fall to 89% FPL.
Families Losing Job-Based Coverage.
In 36 Medicaid expansion states and DC, the parent would have been eligible for Medicaid prior to layoff and continue to be eligible.
In most of the 14 non-expansion states, the mother would not qualify for Medicaid under the pre-ACA eligibility pathway for parents of dependent children because, at 51% FPL, her income would still be too high.
In non-expansion states, the mother would be eligible for a special enrollment period in the marketplace (due to loss of job-based coverage) but with estimated annual income of 89% FPL, she would not qualify for marketplace subsidies.
Children in the family would be eligible for Medicaid or CHIP in every state, as they would have been prior to layoff.
Families with Marketplace Coverage When Employed.
In Medicaid expansion states, the entire family would have been eligible for Medicaid, and so not enrolled in marketplace coverage.
In non-expansion states, the mother would have qualified for marketplace subsidies prior to layoff. Even though her projected annual income has fallen mid-year and will end up below poverty level, she can remain in her already-subsidized marketplace plan, and when she files her 2020 federal tax return next year, can claim additional credit that will be refunded to her. This is an exception to the general rule that requires people receiving premium tax credit during the year are ineligible for credits if their income rises above 400% FPL, and must repay the entire amount of premium tax credit they received.
Children in the family would be eligible for Medicaid or CHIP in every state, and were prior to layoff.
Uninsured Families When Employed.
Families in Medicaid expansion states would have been eligible for Medicaid prior to layoff and still would be post-layoff.
In non-expansion states, the already-uninsured parent would not be eligible for an SEP to enroll in marketplace coverage through Healthcare.gov.
In most non-expansion states, the parent would not be eligible for Medicaid.
Children in this family would be eligible for Medicaid or CHIP in every state.
Other Issues
These simplified scenarios do not show all of the possible variations across state unemployment insurance programs. The maximum UI benefit in a given state may be higher or lower than amounts shown in our scenarios. Our scenarios assume workers will be eligible for 26 weeks of regular state UI benefits; however in some states the benefit period is shorter. Unemployed people whose prior work history was shorter than 12 months may qualify for lower state UI benefits than shown in these scenarios, or not qualify at all,
In addition, not all workers who lose their jobs will receive unemployment benefits. State unemployment offices reportedly have been overwhelmed by the high volume of recent applications, and this could delay or deter some people from applying.
Further, people who lose eligibility for one source of health coverage may not be aware of alternative coverage sources or how to apply. People whose eligibility shifts between Medicaid and marketplace subsidies may find the application process especially challenging for several reasons, including that these two programs treat new federal supplemental UI benefits differently in determining income eligibility. Immigrants may also face challenges as their eligibility for Medicaid and CHIP and marketplace coverage and subsidies may be different than for citizens.
Finally, in Healthcare.gov states, funding for navigator enrollment assistance for the 2020 plan year was cut by more than 80% on average. Navigators play a key role in helping consumers apply for marketplace plans as well as Medicaid. Consumers who need help applying for new coverage or a change in financial assistance may have difficulty finding it, particularly in counties where no federal navigator funding was made available.
Discussion
Job loss during the coronavirus crisis can trigger substantial changes in income as well as loss of health insurance coverage. The ACA greatly expanded coverage options for people losing coverage today. Expanded Medicaid eligibility in most states will be newly available to many laid-off adults. Medicaid is open for enrollment year round. With few exceptions it does not charge monthly premiums and requires only modest copays for covered services.
ACA reforms in the non-group market make this coverage option available to many more people as well. Applicants will not be denied or charged higher premiums based on health status and all plans must cover essential benefits. The marketplace also subsidizes plans for people with income between 100% and 400% FPL. As job loss reduces family incomes, marketplace subsidies will make coverage more affordable than it would have been prior to the ACA.
The temporary $600/week federal supplement to state UI benefits, enacted in the CARES Act, can help lift some very low income workers out of the Medicaid coverage gap, and make them newly eligible for marketplace subsidies. Workers who are laid off closer to or after July, when temporary federal UI benefits stop, may not be helped in this way.
However, the $600/week UI supplement could create new challenges for others. Low-wage workers who already had subsidized marketplace coverage prior to layoff, and whose income increases even somewhat during unemployment, should adjust their monthly premium tax credit; otherwise, they could be required to repay excess premium tax credit next year.
These scenarios illustrate not only the different outcomes and options people may face, but the challenge they may also face in identifying the coverage option for which they are eligible and correctly completing an application within any applicable deadlines.
Endnotes
Four states make parents of dependent children eligible for Medicaid at monthly income of 50% FPL or higher:u00a0 Wyoming (53% FPL), Nebraska (63% FPL), South Carolina (67% FPL) and Tennessee (94% FPL).u00a0 In addition, Wisconsinu2019s Medicaid program covers low-income parents and other adults up to 100% FPL. ↩︎