Preparing for COVID-19 in Low- and Middle-Income Countries: Leveraging U.S. Global Health Assets

Published: Apr 24, 2020

As the COVID-19 pandemic continues to worsen, there is growing concern about its impact in low- and middle-income countries (LMICs), particularly those in sub-Saharan Africa, home to more than one billion people. Cases have now been reported in many LMICs and are rising rapidly in some. Should coronavirus spread even more significantly in sub-Saharan Africa and elsewhere, the impact could be extreme, given already low-resourced health systems and multiple other health challenges.

The United States has begun to respond, with Congress appropriating more than $2 billion in emergency funding to address COVID-19 in LMICs and the State Department and USAID providing resources to a growing list of countries. This data note updates an earlier analysis that examined where the U.S. government already had existing global health assets that could be mobilized to address COVID-19. It includes the latest case numbers, expands beyond health to identify countries where the U.S. also provides (non-health) development assistance, and identifies the most recent list of countries receiving COVID-19 assistance from the U.S. In addition, it indicates the level of COVID-19 preparedness in each country, based on the World Health Organization’s country preparedness and readiness assessment index (which rates countries from Level 1, least prepared to Level 5, most prepared).

Table 1 provides a regional summary of where the U.S. supports global health programs and/or provides COVID-19 assistance. Table 2 provides a full list of all countries identified, including reported cases of COVID-19 (as of April 21, 2020), total bilateral U.S. funding for global health programs, country-level U.S. COVID-19 funding, and COVID-19 preparedness capacity level.1  It also indicates whether the U.S. provides other (non-health) development assistance. Key findings are as follows:

  • There are a total of 108 countries that received either U.S. bilateral global health assistance in FY 2018 (64 countries) and/or are receiving U.S. COVID-19 assistance (102 countries).2 
  • Almost all of these countries (105 of 108) had reported COVID-19 cases as of April 21, 2020.
  • Of the 102 countries receiving U.S. COVID-19 funding, 52 are also countries that received U.S. global health assistance in FY 2018.
  • Almost all of these countries (103 of 108) receive other, non-health, U.S. development assistance, which may include assistance for agriculture, education, peace and security, etc.
  • Most of the countries receiving U.S. assistance are in Africa, followed by Asia and Latin America and the Caribbean. Most of the reported cases in these countries are in Latin America and the Caribbean, followed by South/Central Asia.
  • PEPFAR and the maternal and child health program, respectively, operate in the greatest number of countries (38 each), followed by the family planning and reproductive health program (36). Most countries (over 90%) in each of these program areas are also receiving U.S. COVID-19 funding.
  • Of the 107 countries assigned a COVID-19 preparedness capacity level by WHO, almost all (94) are at Level 3 or below, with more than half (57) designated as Level 3 (capacity is ≤60%), a third (36) as Level 2 (capacity is ≤40%), and one as Level 1 (capacity is ≤20%). The remaining 13 include 11 countries designated as Level 4 (capacity is ≤80%) and two designated as Level 5 (capacity is >80%).

Overall, we found much overlap between the countries being provided with COVID-19 support by the U.S. and those with existing U.S. global health assets, suggesting an opportunity to leverage longstanding programs and expertise. At the same time, however, it is highly likely that many other LMIC countries not currently receiving U.S. COVID-19 funding will experience growing numbers of cases and require enhanced assistance. Further, it remains unclear how ongoing U.S. global health efforts will be impacted, including whether some will be scaled back as resources, including personnel, are diverted to address COVID-19 and/or if country health systems become overwhelmed by COVID-19, undermining their ability to continue. Through two of the three emergency supplemental bills for the coronavirus response passed thus far, the U.S. has allocated approximately $2.4 billion in funding specifically for U.S. global health and other assistance for the global outbreak, although it is likely that additional funding will be needed. Still, given the need for the U.S. (and other donors) to confront their own COVID-19 epidemics, any additional foreign assistance may face stiff competition with growing domestic demands, including for stimulating the economy.

Table 1: COVID-19 in Countries Receiving Bilateral U.S. Global Health and/or COVID-19 Assistance, by Region
RegionCountries Receiving U.S. Global Health and/or COVID-19 Assistance
# of Countries:# of COVID-19 Cases(as of 4/21/20)
OverallReceiving U.S. Global Health AssistanceReceiving U.S. COVID-19 AssistanceWith COVID-19 Cases (as of 4/21/20)With Low COVID-19 Preparedness Capacity Level(Levels 1-3*)
Africa453441444224,088
East Asia/Pacific11101111822,621
Europe/Eurasia171171711321,552
Latin America/Caribbean17915171596,420
Near East626663,216
South/Central Asia12812101238,741
TOTAL1086410210594506,638
NOTES: Reflects countries receiving bilateral assistance through USAID and the Department of State in FY 2018 except NTD countries, which reflect information available on Nov. 13, 2019, and GHS countries, which reflect FY 2019 presence. Reflects all countries receiving COVID-19 assistance from the U.S. government as announced as of April 16, 2020 and includes some high-income countries. * WHO-designated level of a country’s ability to respond to COVID-19 based on capacity and risk assessments: Level 1 indicates that the country’s health system is ≤20% prepared, Level 2 is ≤40%, Level 3 is ≤60%, Level 4 is ≤80%, and Level 5 is >80%. # of cases includes confirmed and presumed positive cases.SOURCES: KFF analysis of data from U.S. Foreign Assistance Dashboard (foreignassistance.gov, accessed 11-12-19); USAID NTD Program website (NeglectedDiseases.gov, as of 11-13-19); KFF personal communication with USAID, 12-19; U.S. Department of State, “UPDATE: The United States Is Continuing to Lead the Humanitarian and Health Assistance Response to COVID-19,” fact sheet, April 16, 2020; WHO, COVID-19 Strategic Preparedness and Response Plan: Country Preparedness and Response Status for COVID-19 as of 13 April 2020; Johns Hopkins University, Coronavirus Resource Center, accessed: https://coronavirus.jhu.edu/map.html, as of April 21, 2020.
Table 2: COVID-19 in Countries Receiving Bilateral U.S. Global Health and/or COVID-19 Assistance
RegionCountry# of COVID-19 Cases (as of 4/21/20)U.S. Global Health Assistance(FY 2018^)# of U.S. Global Health ProgramsGlobal Health Program Presence*U.S. COVID-19 Assistance^(as of 4/16/20)COVID-19 Preparedness Capacity Level+Recipient of Other U.S. Foreign Assistance(FY 2018)
Family Planning/ Reproductive HealthPEPFAR (HIV)MalariaMaternal & Child HealthNutritionTuberculosisGlobal Health SecurityNTDs/Other PH Threats
South/Central AsiaAfghanistan1,092$39,500,0003XXX$18,000,0002X
Europe/EurasiaAlbania609 — —$1,200,0003X
AfricaAlgeria2,811 — —$500,0004X
AfricaAngola24$37,418,0003XXX$570,0003X
Europe/EurasiaArmenia1,401 — —$1,700,0003X
Europe/EurasiaAzerbaijan1,480 — —$1,700,0003X
South/Central AsiaBangladesh3,382$66,000,0006XXXXXX$9,600,0003X
Europe/EurasiaBelarus6,723 — —$1,300,0003X
Latin America/CaribbeanBelize18 — —$300,0003X
AfricaBenin54$24,000,0004XXXX —2X
South/Central AsiaBhutan 6 — —$500,0003 –
Latin America/CaribbeanBolivia598 — —$750,0002 –
Europe/EurasiaBosnia and Herzegovina1,342 — —$1,200,0002X
AfricaBotswana20$64,764,0001X$1,500,0002X
Latin America/CaribbeanBrazil43,079$300,0002XX —4X
Europe/EurasiaBulgaria975 — —$500,0004X
AfricaBurkina Faso600$29,000,0005XXXXX$6,000,0002X
East Asia/PacificBurma121$30,482,0004XXXX$7,300,0003X
AfricaBurundi5$31,340,0004XXXX —2X
East Asia/PacificCambodia122$33,911,0008XXXXXXXX$4,000,0003X
AfricaCameroon1,163$63,674,0004XXXX$8,000,0003X
AfricaCentral African Republic14 — —$5,200,0001X
AfricaChad33 — —$3,000,0002X
Latin America/CaribbeanColombia4,1491X$10,400,0003X
AfricaCôte d’Ivoire916$135,876,0006XXXXXX$1,600,0003X
AfricaDem. Rep. of the Congo350$181,458,0008XXXXXXXX$14,400,0003X
AfricaDjibouti945$300,0001X$500,0002X
Latin America/CaribbeanDominican Republic5,044$13,901,0001X$1,400,0003X
Latin America/CaribbeanEcuador10,3981X$2,000,0003X
AfricaEgypt3,490$10,050,0002XX —4X
Latin America/CaribbeanEl Salvador225 — —$2,600,0003X
AfricaEswatini31$65,768,0001X$750,0003X
AfricaEthiopia114$204,363,0008XXXXXXXX$9,000,0003X
Europe/EurasiaGeorgia408 — —$1,700,0003X
AfricaGhana1,042$68,233,0007XXXXXXX$1,600,0003X
Europe/EurasiaGreece2,401 — —$500,0004X
Latin America/CaribbeanGuatemala294$13,000,0004XXXX$2,400,0002X
AfricaGuinea688$23,000,0005XXXXX$500,0003X
Latin America/CaribbeanGuyana811X —3X
Latin America/CaribbeanHaiti57$123,586,0005XXXXX$13,200,0002X
Latin America/CaribbeanHonduras494 — —$2,400,0002X
South/Central AsiaIndia20,080$66,216,0005XXXXX$5,900,0003X
East Asia/PacificIndonesia7,135$35,962,0005XXXXX$5,000,0003X
Near EastIraq1,602 —$25,600,0002X
Europe/EurasiaItaly183,957 — —$50,000,0005 –
Latin America/CaribbeanJamaica223 — —$700,0003X
Near EastJordan428$21,000,0002XX$8,000,0003X
South/Central AsiaKazakhstan1,995 —$1,600,0003X
AfricaKenya296$523,112,0007XXXXXXX$4,500,0003X
Europe/EurasiaKosovo510 — —$1,100,000 —X
South/Central AsiaKyrgyzstan590$4,300,0001X$900,0002X
East Asia/PacificLaos19$3,500,0002XX$3,500,0002X
Near EastLebanon677 — —$13,300,0003X
AfricaLesotho$79,574,0001X$750,0002X
AfricaLiberia101$34,500,0005XXXXX$1,000,0003X
AfricaLibya51 — —$6,000,0002X
AfricaMadagascar121$52,000,0004XXXX$2,500,0002X
AfricaMalawi18$194,893,0006XXXXXX$4,500,0003X
East Asia/PacificMalaysia5,4821X$200,0005X
AfricaMali258$66,300,0007XXXXXXX$5,700,0003X
AfricaMauritania7 — —$250,0002X
AfricaMauritius328 — —$500,0004X
Latin America/CaribbeanMexico8,7721X$500,0004X
Europe/EurasiaMoldova2,614 — —$1,200,0003X
East Asia/PacificMongolia34 — —$1,200,0003X
Europe/EurasiaMontenegro313 — —$300,0003X
AfricaMorocco3,209 — —$1,700,0003X
AfricaMozambique39$427,685,0007XXXXXXX$5,800,0003X
AfricaNamibia16$66,879,0001X$750,0002X
South/Central AsiaNepal43$43,866,0006XXXXXX$1,800,0003X
AfricaNiger657$22,000,0004XXXX$4,000,0003X
AfricaNigeria665$398,561,0007XXXXXXX$21,400,0003X
Europe/EurasiaNorth Macedonia1,231 — —$1,100,0003 –
South/Central AsiaPakistan9,565$7,000,0001X$9,400,0002X
Latin America/CaribbeanPanama4,658 — —$750,0002X
East Asia/PacificPapua New Guinea7$5,474,0001X$1,200,0002X
Latin America/CaribbeanParaguay208 — —$1,300,0002X
Latin America/CaribbeanPeru17,837 — —$2,500,0003X
East Asia/PacificPhilippines6,599$28,500,0003XXX$6,000,0003X
AfricaRepublic of Congo165 — —$250,0003X
Europe/EurasiaRomania9,242 — —$800,0004X
AfricaRwanda150$114,591,0006XXXXXX$2,000,0003X
AfricaSenegal412$59,035,0007XXXXXXX$3,900,0003X
Europe/EurasiaSerbia6,630 — —$1,200,0003X
AfricaSierra Leone50$19,500,0006XXXXXX$400,0003X
AfricaSomalia286 — —$12,500,0002X
AfricaSouth Africa3,465$580,905,0002XX$8,400,0003X
AfricaSouth Sudan 4$36,545,0003XXX$13,100,0002X
South/Central AsiaSri Lanka310 — —$1,300,0003X
AfricaSudan107 — —$13,700,0003X
Near EastSyria 42 — —$18,000,0002 –
South/Central AsiaTajikistan$7,750,0003XXX$866,0002X
AfricaTanzania254$480,839,0008XXXXXXXX$1,400,0003X
East Asia/PacificThailand2,8111X$2,700,0004X
East Asia/PacificTimor-Leste  23$2,000,0002XX$1,100,0002X
AfricaTogo861X —2X
AfricaTunisia884 — —$600,0003X
Europe/EurasiaTurkey95,591 — —$800,0004X
South/Central AsiaTurkmenistan —$920,0003X
AfricaUganda61$463,396,0008XXXXXXXX$3,600,0003X
Europe/EurasiaUkraine6,125$34,644,0003XXX$9,100,0002X
South/Central AsiaUzbekistan1,678$4,000,0001X$848,0002X
Latin America/CaribbeanVenezuela2851X$9,000,0002X
East Asia/PacificVietnam268$31,349,0004XXXX$4,500,0004X
Near EastWest Bank/ Gaza466 — —$5,000,0002X
Near EastYemen1$3,500,0001X$500,0002X
AfricaZambia70$415,961,0006XXXXXX$3,400,0002X
AfricaZimbabwe28$170,107,0005XXXXX$3,000,0003X
Number of Countries108 506,638cases$5,765,368,000643638273820232632$463,054,000(102 countries)107103
NOTES: # of cases includes confirmed and presumed positive cases. ^ Total does not include some country-level funding (i.e., NTD and global health security program funding) that is not available on ForeignAssistance.gov; it also does not include funding for regional or “worldwide” program efforts that may reach additional countries. NTDs are neglected tropical diseases. * X indicates country receiving bilateral assistance through USAID and the Department of State in FY 2018 except NTD countries, which reflect information available on Nov. 13, 2019, and GHS countries, which reflect FY 2019 presence. ^ U.S. COVID-19 Assistance reflects all countries receiving COVID-19 assistance from the U.S. government and includes some high-income countries. Does not include funding specified for regional programs that may reach additional countries. + The COVID-19 Preparedness Capacity Level indicates the WHO-designated level of that country’s ability to respond to COVID-19 based on capacity and risk assessments: Level 1 indicates that the country’s health system is ≤20% prepared, Level 2 is ≤40%, Level 3 is ≤60%, Level 4 is ≤80%, and Level 5 is >80%. “–” indicates no cases have been reported, country-level funding is not specified for this country, country does not have a USG program that is supported by country-level funding available on ForeignAssistance.gov, or COVID-19 preparedness capacity level not specified for country.SOURCES: Johns Hopkins University, Coronavirus Resource Center, accessed: https://coronavirus.jhu.edu/map.html, as of April 21, 2020; KFF analysis of data from U.S. Foreign Assistance Dashboard (foreignassistance.gov, accessed 11-12-19); USAID NTD Program website (NeglectedDiseases.gov, as of 11-13-19); KFF personal communication with USAID, 12-19; U.S. Department of State, “UPDATE: The United States Is Continuing to Lead the Humanitarian and Health Assistance Response to COVID-19,” fact sheet, April 16, 2020; WHO, COVID-19 Strategic Preparedness and Response Plan: Country Preparedness and Response Status for COVID-19 as of 13 April 2020; KFF analysis of data from U.S. Foreign Assistance Dashboard (foreignassistance.gov, accessed April 6, 2020).
  1. The preparedness and response categorization (Levels 1-5) is based on the country’s 1) operational readiness capacities based on the International Health Regulations (IHR) State Parties Annual Reporting self-assessment tool and 2) position on a continuum of response scenarios including country preparedness, risk of imported cases, number of imported cases, and localized and community transmission. This categorization will be updated regularly based on each country’s COVID-19 situation as the epidemic evolves. Level 1 indicates that the country’s health system is ≤20% prepared; Level 2 is ≤40%; Level 3 is ≤60%; Level 4 is ≤80%; and Level 5 is >80%. WHO, COVID-19 Strategic Preparedness and Response Plan: Country Preparedness and Response Status for COVID-19 as of 30 March 2020. ↩︎
  2. Two of the 102 countries receiving U.S. COVID-19 assistance are high-income countries that are facing particularly significant outbreaks – Greece and Italy. ↩︎
News Release

Poll: Just Over Half of the Nation’s Workforce Have Lost a Job or Income Due to Coronavirus, though Most of Them Believe They Will Get Their Job and Income Back Within Six Months

Most of the Public Overall Say Worry and Stress Related to the Pandemic is Causing Ill Effects, Including Lost Sleep, Loss of Appetite or Overeating, and Difficulty Controlling Temper

Published: Apr 24, 2020

With many businesses shut down and job losses mounting nationwide, just over half of the nation’s workers (55%) now say they have lost a job or had their incomes reduced as a result of the health and economic crises sparked by the novel coronavirus pandemic, the latest KFF Health Tracking poll finds.

This includes a quarter (26%) of all those who were working on Feb. 1 who say they lost a job and another 7% who say they got furloughed, as well as those who say their work hours have been reduced (21%) or that they have had to take a pay cut (13%).

Among those who were working part-time in February, three-quarters (76%) report a lost job or income. The shares are also higher-than-average among those who are paid by the hour or the job (68%) and those with low (65%) or moderate (62%) incomes.

In addition to those who personally experienced a coronavirus-related job or income loss, 16% say they have a spouse or partner who has lost their job, had hours reduced, took pay cut, or been furloughed. In total, 42% of all U.S. adults say they or their spouse or partner has been affected in such ways.

For many, the loss of a job and income is affecting the ability to keep up with their bills.

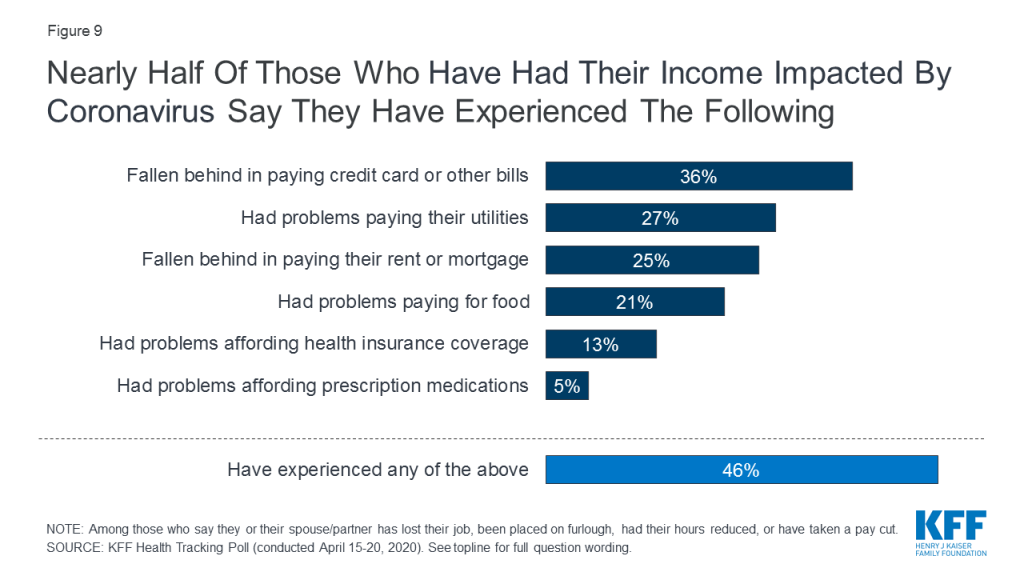
Among affected workers, more than a third (36%) say they have fallen behind in paying their credit card and other bills. About a quarter say they have had problems paying their utility bills (27%) or fallen behind on their rent or mortgage (25%), and one in five report problems paying for food (21%). Smaller shares say they have had trouble affording health insurance (13%) or prescription drugs (5%).

“The economy right now is crushing workers, and many are piling up bills and debts,” KFF President and CEO Drew Altman said. “Their optimism that things will turn around by the Fall may be wishful thinking.”

Nearly half (46%) of those in households that had a job or income loss since February say they have experienced at least one of those financial difficulties since then.

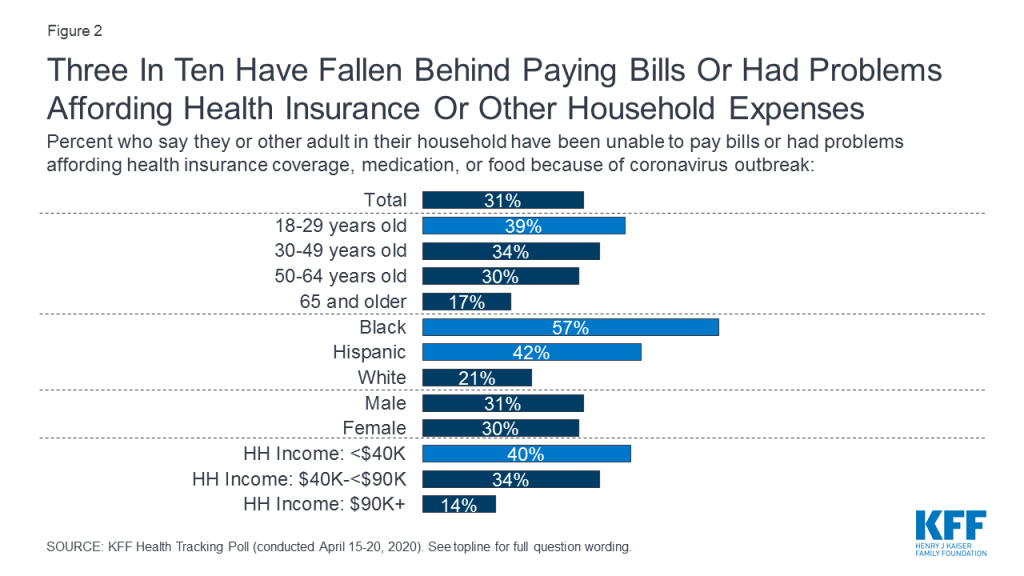
Among the public at large, three in 10 (31%) report at least one of those financial difficulties as a result of the coronavirus pandemic. Those most likely to report such problem include black (57%) and Hispanic (42%) adults, those with low annual incomes at or below $40,000 (40%), and younger adults ages 18-29 (39%).

Most Affected Workers Expect Their Situations to Improve Within the Next Six Months

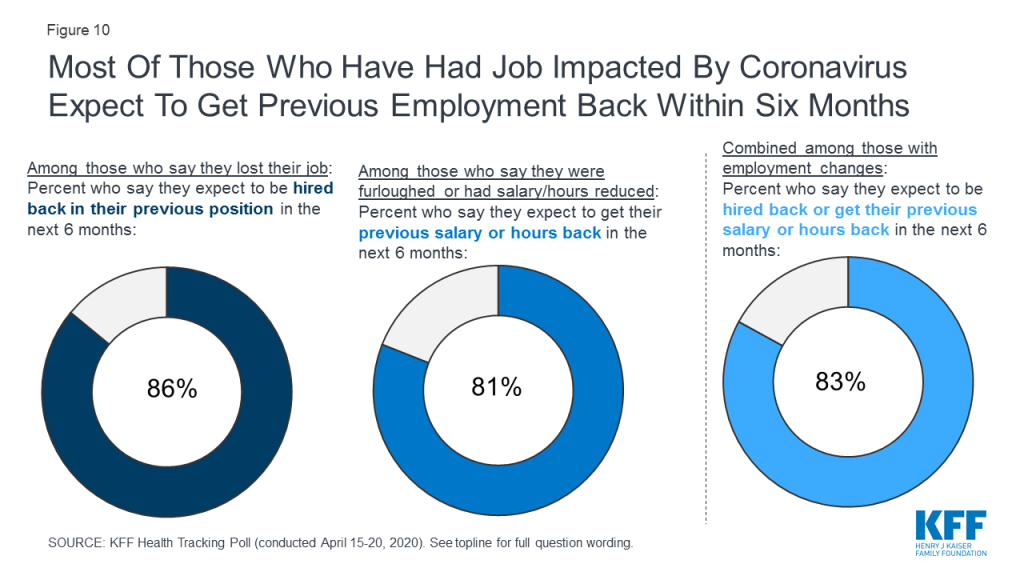
In spite of these job setbacks and financial troubles, affected workers are mostly optimistic that things will return to normal for them this year. Eight in 10 (83%) of those affected say they expect to be hired back, return to their previous salary or income, or get their hours back in the next six months.

Less than half of those who lost their job or were laid off say their former place of employment is still open for business (39%) while most say it is closed temporarily (56%). Just 2% say their former place of employment has closed permanently.

Worry and Stress Related to Coronavirus are Affecting Most People’s Mental and Physical Health

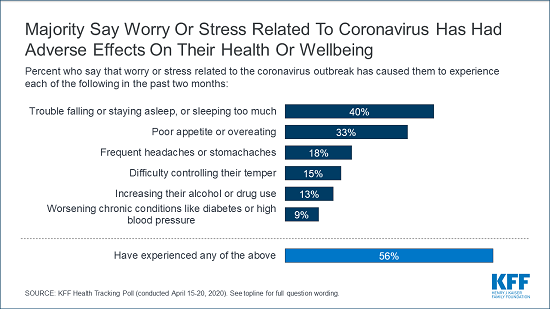
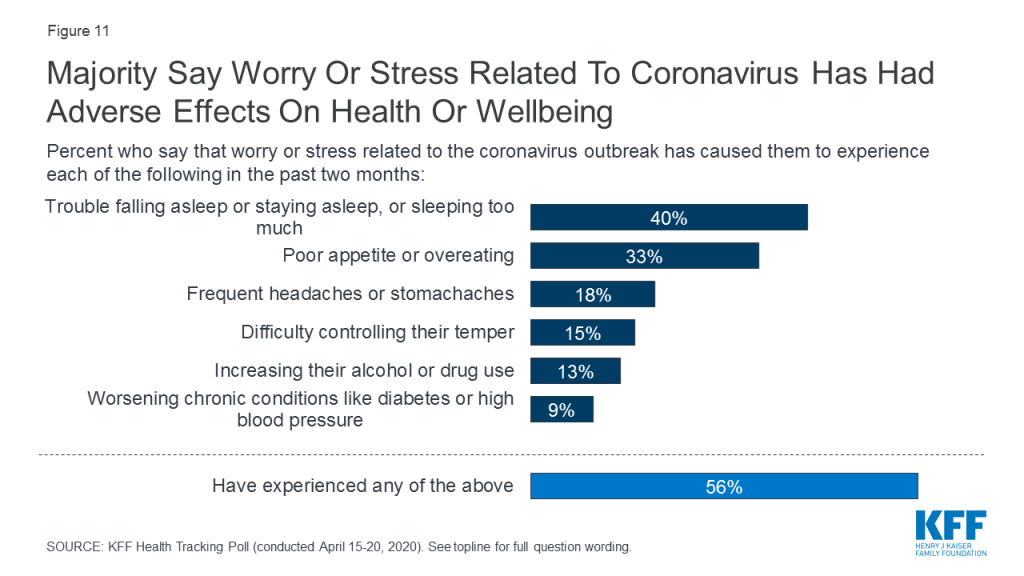
Among the public overall, more than half (56%) say that worry and stress related to the coronavirus situation are leaving some marks on their mental and physical well-being.

This includes four in 10 who cite problems with their sleep and one in three who report overeating or a loss of appetite. Smaller shares say coronavirus worry or stress is causing frequent headaches or stomachaches (18%), difficulty controlling their temper (15%), increased alcohol or drug use (13%), or worsening chronic health conditions (9%).

The coronavirus outbreak’s impact on mental health and well-being also seems to be affecting a larger share of those who experienced a loss of employment income.

Two-thirds of those who say they or their spouse have lost their job or income (65%) say that worry or stress related to the coronavirus outbreak has caused them to experience at least one adverse effect on their mental or physical health in the past two months.

Designed and analyzed by public opinion researchers at KFF, the poll was conducted April 15-20, 2020 among a nationally representative random digit dial telephone sample of 1,202 adults. Interviews were conducted in English and Spanish by landline (261) and cell phone (941). The margin of sampling error is plus or minus 3 percentage points for the full sample. For results based on subgroups, the margin of sampling error may be higher.

KFF Health Tracking Poll – Late April 2020: Coronavirus, Social Distancing, and Contact Tracing

Authors: Ashley Kirzinger, Liz Hamel, Cailey Muñana, Audrey Kearney, and Mollyann Brodie
Published: Apr 24, 2020

Social Distancing And Contact Tracing

Key Findings:

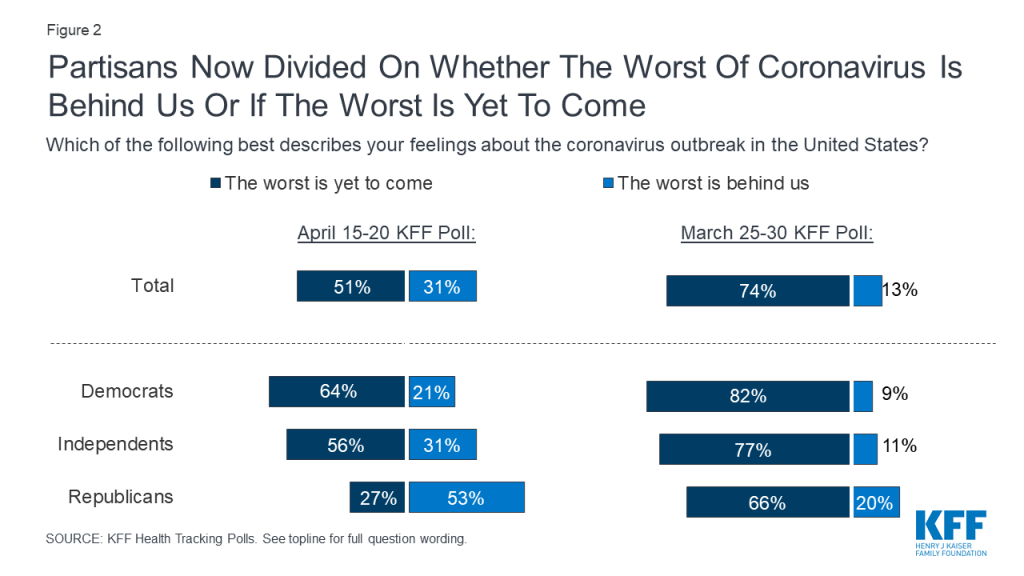
  • The latest KFF Health Tracking Poll conducted April 15-20th finds about half the public (51%) now saying that when it comes to the coronavirus outbreak in the U.S., “the worst is yet to come.” This is down 23 percentage points from the share who said the same (74%) in the Early April KFF Health Tracking Poll conducted less than three weeks ago. Majorities of Democrats (64%) and independents (56%) continue to say “the worst is yet to come,” but now twice as many Republicans say “the worst is behind us” (53%) as say “the worst is yet to come” (27%).
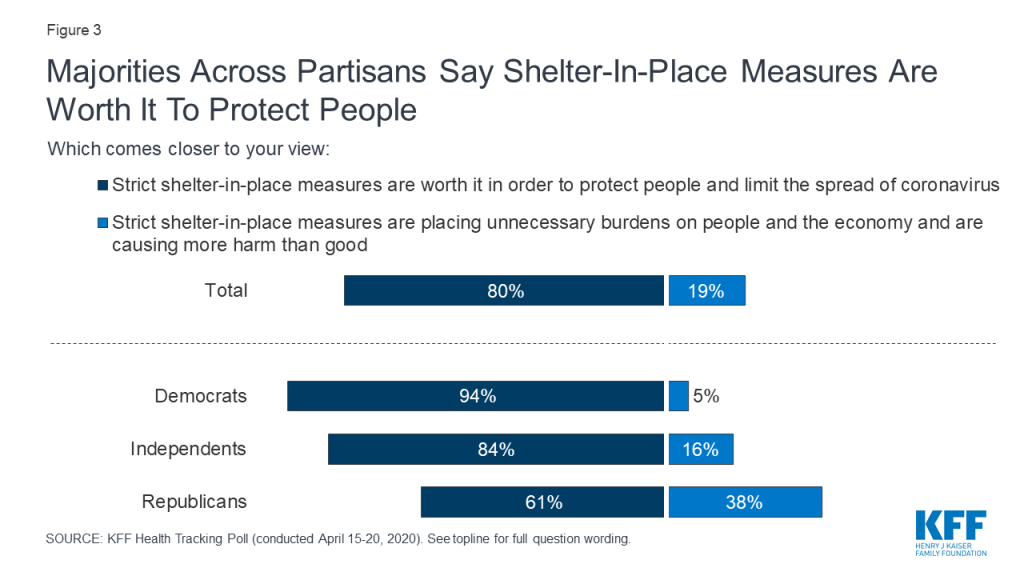
  • While an increasing share of the public now say the worst of the outbreak is behind us, most Americans (80%) say strict shelter-in-place measures are worth it in order to protect people and limit the spread of coronavirus. Fewer (19%) say the strict shelter-in-place measures are placing unnecessary burdens on people and the economy and causing more harm than good. Majorities also say they can continue following strict social distancing and shelter-in-place guidelines for more than another month while less than one in five say they either cannot follow the guidelines at all (3%) or say they can follow the guidelines for less than a month (14%). While a majority of Republicans say they can follow social distancing guidelines for a month or longer, three in ten Republicans say they can either follow them “less than one month” or “not at all.”
  • The severity of an outbreak in one’s area appears to be related to behaviors around visiting friends and family outside the home. Among those living in counties with 5 or fewer COVID-19 deaths, 36% say they have left their home at least once in the last week to visit with friends or family, compared with 21% of those living in counties with more than 25 deaths.
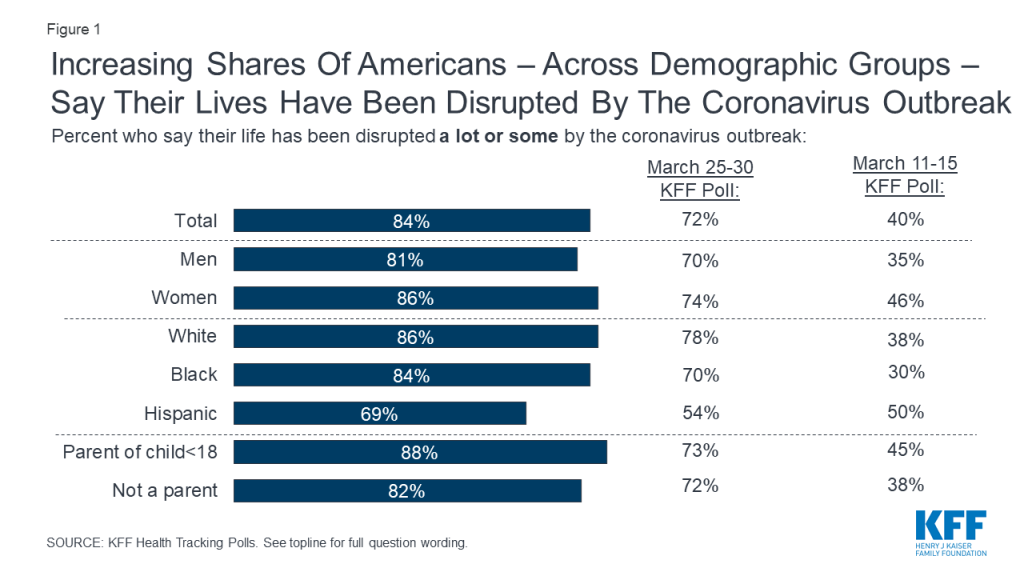
  • The vast majority of adults (84%) say their lives have been disrupted at least some by the coronavirus outbreak in the U.S. This is up 12 percentage points from the KFF Health Tracking Poll conducted March 25-30 and up 44 percentage points from the March 11-15 poll.
  • While the public is divided in their willingness to download apps for their phones as a way to trace and monitor the contacts of people infected with coronavirus, support increases to as high as 66% once people hear the argument that this could allow for many schools and businesses to reopen. Republicans are less willing to download and use a contact tracing app than Democrats and independents.

Over the past two months, the coronavirus outbreak has drastically changed the way of life in the U.S. With nearly 800,000 reported cases of the novel coronavirus in the U.S. and more than 42,000 reported deaths, many in the country are wondering when, if ever, normal life will return. When coronavirus led to the closing of schools and businesses in early March, the KFF March Tracking Poll found four in ten adults already reporting that their lives had been disrupted either “a lot” or “some” as a result of the virus. Now, five weeks later, the latest KFF Health Tracking Poll finds the share who say their life has been disrupted has more than doubled to 84%. This includes large majorities across race and ethnicity, gender, and parental status.

Figure 1: Increasing Shares Of Americans – Across Demographic Groups –Say Their Lives Have Been Disrupted By The Coronavirus Outbreak

At least eight in ten Republicans (82%), independents (81%), and Democrats (89%) now say their lives have been disrupted. This is more than a 50 percentage point increase from the far smaller share of Republicans (30%) who initially reported disruption back in early March, and a larger share of both independents (up 41 percentage points) and Democrat (up 40 percentage points) also now report their lives have been disrupted at least some by coronavirus.

Partisans Differ On U.S. Future Outlook and Support For Shelter-In-Place Measures

While the partisan divide on whether their lives have been disrupted by coronavirus has largely dissipated, there are now substantial partisan differences in people’s outlook on how coronavirus will impact the U.S. in the coming months.

In late March, a majority of the public said that when it came to the coronavirus outbreak in the U.S., “the worst was yet to come” (74%), while few (13%) said the “worst is behind us.” This included majorities of Democrats (82%), independents (77%), and Republicans (66%) saying “the worst is yet to come.” The latest KFF Tracking Poll now finds about half of the public (51%) saying the “worst is yet to come,” down 23 percentage points in less than three weeks. Majorities of Democrats (64%) and independents (56%) continue to say the “worst is yet to come,” but now one-fourth (27%) of Republicans say “the worst is yet to come” (down 39 percentage points from the March 25-30 KFF Poll). A slight majority (53%) of Republicans say “the worst is behind us,” while far fewer, but still twice as many who said this less than three weeks ago, independents (31%) and Democrats (21%) now say the same.

Figure 2: Partisans Now Divided On Whether The Worst Of Coronavirus Is Behind Us Or If The Worst Is Yet To Come

This partisan divide may reflect the mixed messages from governors, President Trump, and public health officials. While public health officials are warning about the possible impacts of relaxing social distancing measures, three Republican governors announced this week that some non-essential businesses will be allowed to re-open.

Despite this, a large majority of adults (80%) say strict shelter-in-place measures are worth it in order to protect people and limit the spread of coronavirus. Fewer (19%) say the strict shelter-in-place measures are placing unnecessary burdens on people and the economy and causing more harm than good. While majorities across partisans say these measures are worth it, a larger share of Republicans (38%) compared with independents (16%) and Democrats (5%) say they are causing more harm than good.

Figure 3: Majorities Across Partisans Say Shelter-In-Place Measures Are Worth It To Protect People

Some Republican governors have been among the strongest voices for re-opening businesses and lifting strict shelter-in-place orders sooner rather than later. However, even among Republicans living in states with Republican governors, a larger share say the strict measures are worth it (63%) than say they are causing more harm than good (36%).

Table 1: Majorities Across Partisans Living In Republican-Led State Support Strict Shelter-in-place Measures
Which comes closest to your view?Living in a state with a Republican Governor
TotalDemocratsIndependentsRepublicans
Strict shelter-in-place measures are worth it in order to protect people and limit the spread of coronavirus79%96%83%63%
Strict shelter-in-place measures are placing unnecessary burdens on people and the economy and are causing more harm than good2041636

Social Distancing and Sheltering-in-Place

Residents in most parts of the U.S. have been engaging in social distancing or sheltering-in-place for several weeks and all states, including Washington D.C., have issued mandates either restricting businesses, travel, or the activities of their residents. To see a complete list, see State Data and Policy Actions to Address Coronavirus.

Most adults (84%) say they have been sheltering-in-place because of the coronavirus outbreak and only leaving their home for essential services such as food, medicine, and health care – a similar share who reported this in the KFF Early April Tracking Poll (82%). Three-fourth of adults (76%) say they have bought or made a protective mask to wear in public, consistent with many social distancing guidelines issued by states. Those living in counties where more than 25 people have died from COVID-19 are more likely than those in counties with 5 or fewer deaths to report using a mask (82% vs. 69%).1 

On April 16th President Trump announced guidelines for states to begin lifting shelter-in-place and social distancing restrictions in order to reopen businesses and get the economy going again2  but many states have announced that it could be weeks or even months until many shelter-in-place restrictions are lifted. With all of this uncertainty, the majority of Americans say they can continue following strict social distancing and shelter-in-place guidelines in order to limit the spread of coronavirus in their communities.

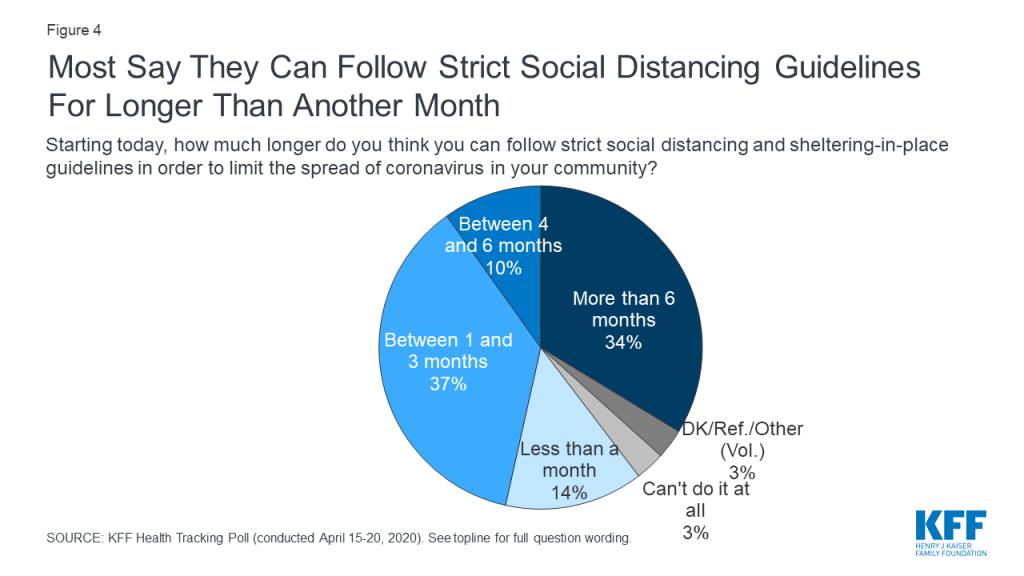
Eight in ten say they can follow strict social distancing and shelter-in-place guidelines for more than another month, including 37% who say they can follow the guidelines between 1 and 3 months, and one in ten who say they can follow them between 4 and 6 months. An additional one-third (34%) say they can follow them for more than 6 months longer, indicating there is a group of Americans who are willing to follow the guidelines as long as it takes to limit the spread of coronavirus.

Figure 4: Most Say They Can Follow Strict Social Distancing Guidelines For Longer Than Another Month

On the other hand, there is a segment of the population who either isn’t willing to social distance for much longer or even at all. Nearly one-fifth say they can follow these strict guidelines for less than a month (14%) or say they are not willing to do it any longer (3%).

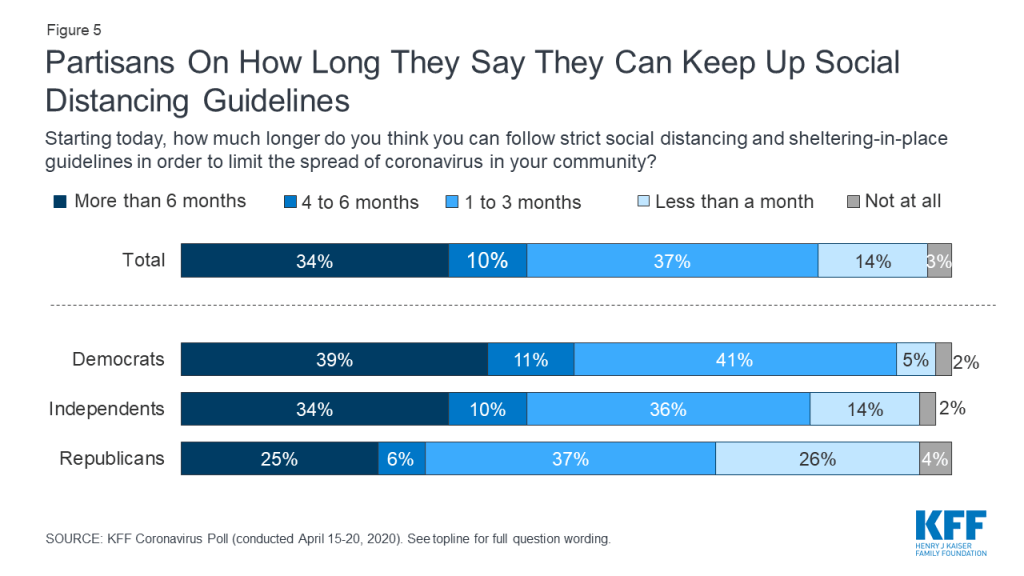
Majorities of Democrats (92%), independents (80%), and Republicans (68%) all say they can follow strict social distancing and sheltering-in-place guidelines for a month or longer, though Republicans are less likely than others to say they can sustain this practice for more than three months (31% compared to half of Democrats and 44% of independents).Three in ten Republicans say they can only follow strict social distancing and sheltering-in-place guidelines for less than another month (compared to seven percent of Democrats and 17% of independents).

Figure 5: Partisans On How Long They Say They Can Keep Up Social Distancing Guidelines

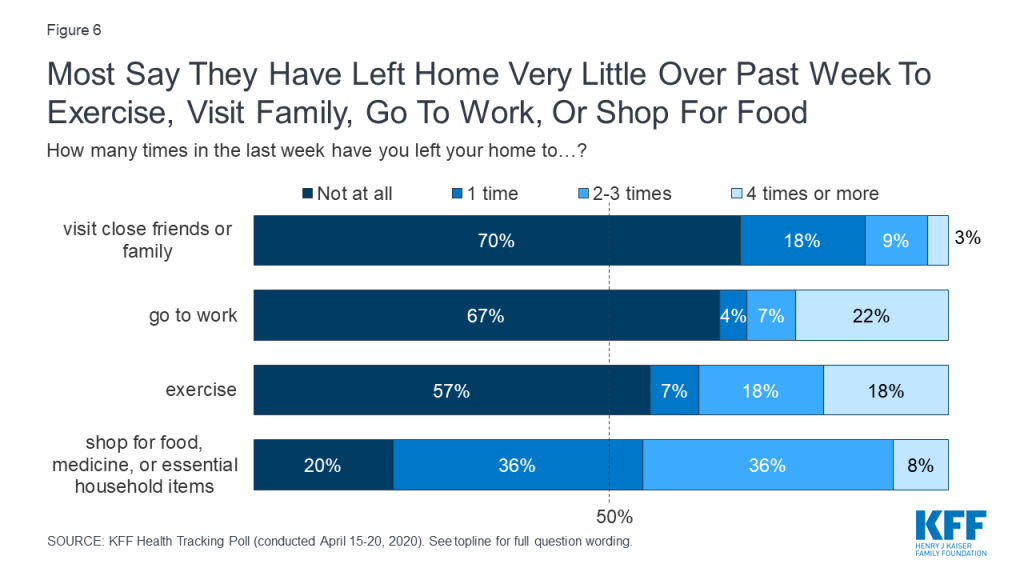
With all states issuing either shelter-in-place or some social distancing restrictions (i.e., restricting the size of gatherings or closing schools), the majority of adults say they have not left their home at all during the last week either to visit close friends or family (70%), go to work (67%), or exercise (57%). About one in five (20%) say they haven’t left their home to shop for food, medicine, or essential household items but an additional 36% say they have only left their home once to do this.

Figure 6: Most Say They Have Left Home Very Little Over Past Week To Exercise, Visit Family, Go To Work, Or Shop For Food

A small share (10%) of adults say they have left their home 4 or more times in the past week to either shop for food, medicine, or essential household items, or to visit close friends and family – activities that all leaders are encouraging people, even those who are essential workers, not to engage in or at least not often. This includes 7% of adults 60 and older who either have a chronic condition themselves or lives in a household with someone who has one, a group most at-risk for complications of coronavirus, who say they have left their home 4 or more times.

The severity of an outbreak in one’s area appears to be related to behaviors around visiting friends and family outside the home. Among those living in counties with 5 or fewer COVID-19 deaths, 36% say they have left their home at least once in the last week to visit with friends or family, compared with 21% of those living in counties with more than 25 deaths.

Essential Workers

While one-fifth of Americans say they have left their home 4 or more times in the past week in order to go to work, this is largely driven by those who have been deemed “an essential worker.” One-third (34%) of all adults say they have been deemed an “essential worker,” meaning they are still required to work outside their home during the coronavirus outbreak in the U.S. Three in ten adults earning less than $40,000 annually say they are essential workers compared to about four in ten of those earning between $40,000 and $89,999 (41%) or $90,000 or more annually (36%). A substantial share of essential workers (39%) say they or someone in their household has a serious health condition that could put them at higher risk of complications from COVID-19 and 13% of essential workers are over the age of 60.

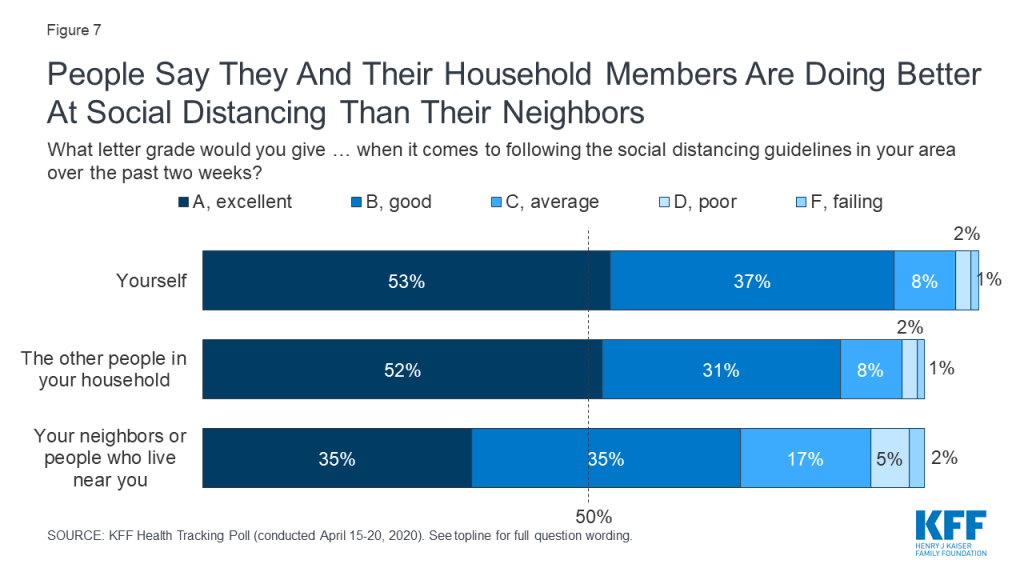
Overall, most adults give themselves and the people in their household either an “A, excellent” for following the social distancing guidelines in their area over the past two weeks (53% and 52%, respectively) or a “B, good” (37% and 31%, respectively). A smaller share, but still a majority, give their neighbors or people who live near them either an “A” (35%) or a “B” (35%).

Figure 7: People Say They And Their Household Members Are Doing Better At Social Distancing Than Their Neighbors

Contact Tracing and Testing

One of the key elements in any plan to reopen businesses and restart the U.S. economy is widespread contact tracing, which is the ability to trace and monitor the contacts of infected people.3  One way to track the spread of coronavirus in communities is through people’s smart phones. Using smart phones for contact tracing is being widely discussed by public health officials and experts The latest KFF Health Tracking Poll finds the public divided on whether they would be willing to download an app for these purposes, but support increases once people hear the argument that this could help allow for many aspects of daily life to resume. Yet, the public is largely skeptical of the role of tech companies in managing this data and would like to see the data controlled by public health agencies.

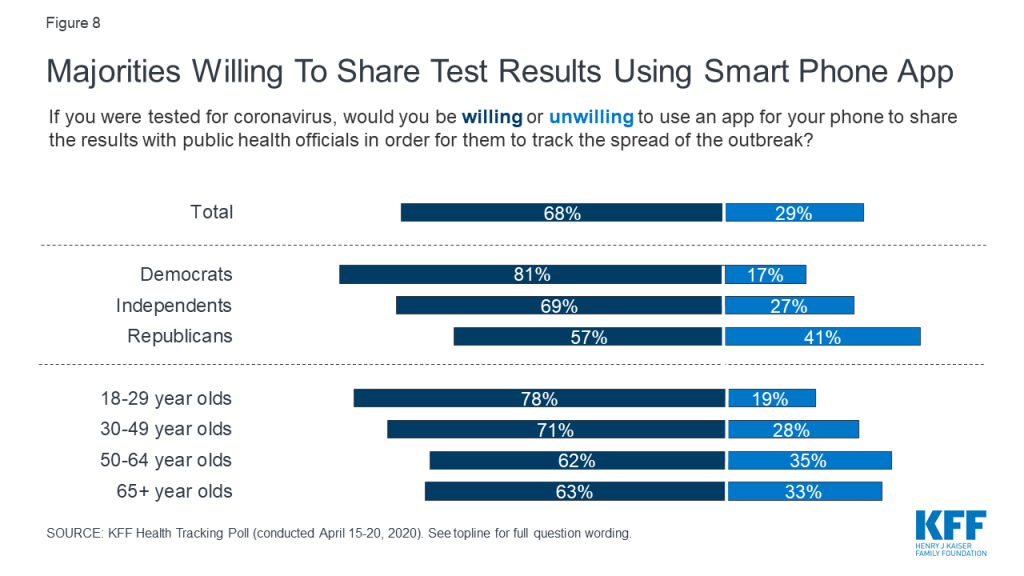
Overall, a majority of the public (68%), are willing to use an app on their phone to share results from a coronavirus test in order to allow public health officials to track the spread of the outbreak. Majorities across age groups and party identification, say they are willing to use an app for these purposes.

Figure 8: Majorities Willing To Share Test Results Using Smart Phone App

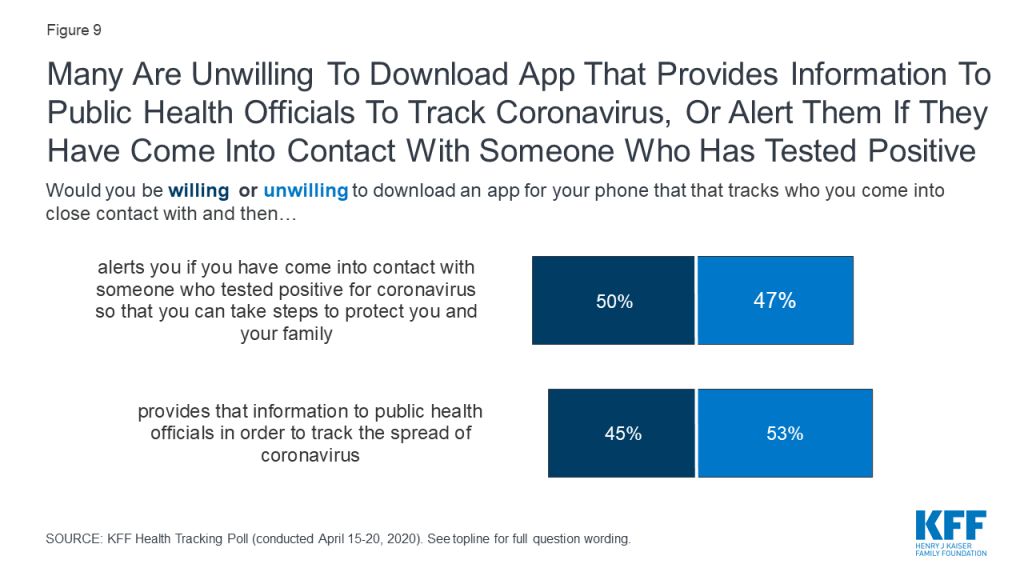
The public is more divided in their willingness to download an app for their phone that uses Bluetooth and GPS technology to track who they come into close contact with. Half of the public are “willing” to download an app that alerts them if they have come in contact with someone who has tested positive for coronavirus so that they can take steps to protect them and their family while a similar share (47%) say they are “unwilling” to download such an app. The public are somewhat more “unwilling” than “willing” to download the app if they are told the app would provide information to public health officials in order to track the spread of coronavirus (53% who say they are “unwilling” to download the app compared to 45% who are “willing”).

Figure 9: Many Are Unwilling To Download App That Provides Information To Public Health Officials To Track Coronavirus, Or Alert Them If They Have Come Into Contact With Someone Who Has Tested Positive

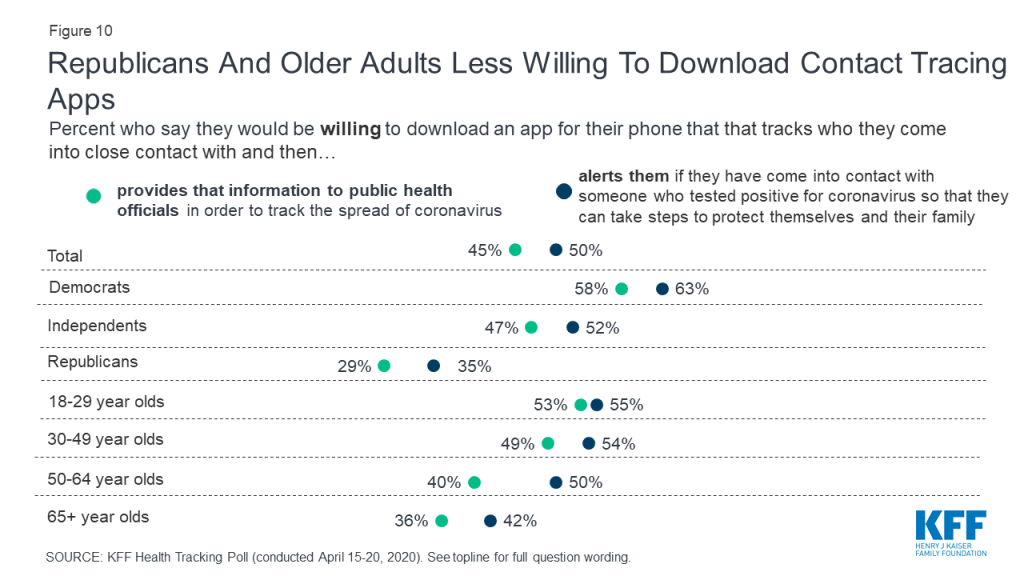
There are large differences across age groups and partisans in willingness to download contact tracing apps. While slightly more than half of 18-29 year olds saying they are willing to download an app that provides information to public health officials (53%) or alerts them if they have come into contact with someone who has tested positive for coronavirus (55%), smaller shares of older adults (65 and older) say they are willing to download an app for either of these purposes (36% and 42%, respectively).

Additionally, while about one-third of Republicans saying they are “willing” to download an app to help public health officials track the spread of the outbreak (29%) or alerts them if they have come into contact with someone who tested positive for coronavirus (35%), majorities of Democrats say they are “willing” to download an app for any of the mentioned contact tracing purposes (63% and 58%, respectively).

Figure 10: Republicans And Older Adults Less Willing To Download Contact Tracing Apps

Some attitudes Change After Hearing Messages About Contact Tracing Apps

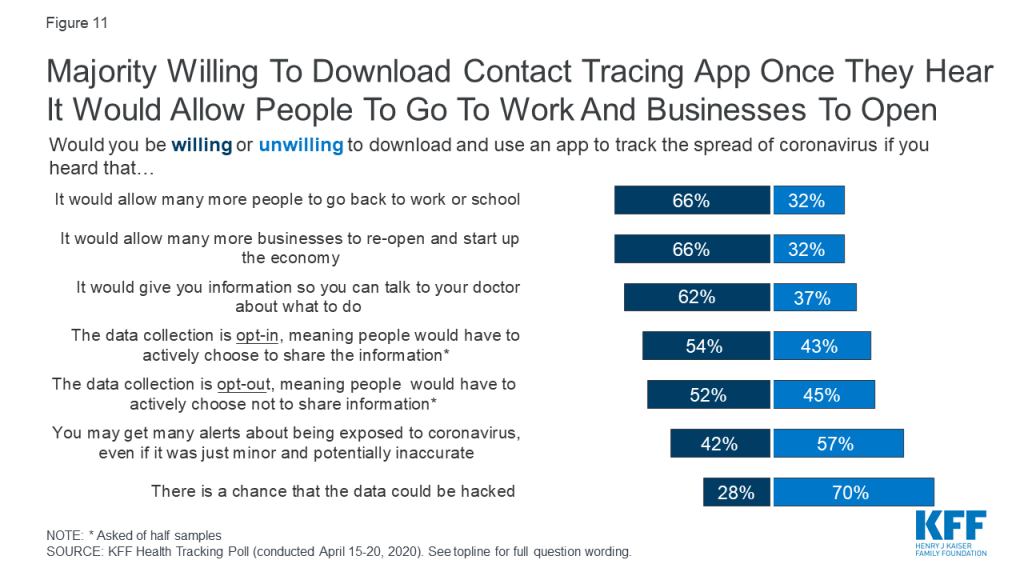
While initially divided on whether they would download an app for contact tracing, some may be willing to download the app once they hear that it would allow for many aspects of daily life to get back to normal. Two-thirds are willing to download and use the app once they hear that using such an app could allow more people to go back to work or school (66%) or that it would allow many businesses to re-open and start up the economy (66%). A smaller share, but still a majority, are willing to download the app once they hear that the app would give them information so they can talk to their doctor about what to do if they come into close contact with someone who has tested positive for coronavirus (62%) or that the data collection is “opt-in,” meaning people would have to actively choose to share the information (54%). About half (52%) are willing to download the app if the data collection is “opt-out,” meaning people would have to actively choose not to share information. Fewer are willing to download the app if they hear that they may get many alerts about being exposed to coronavirus, even if the exposure was only minor or the data could be potentially inaccurate (42%) or that there is a chance that data from the app could be hacked (28%).

Figure 11: Majority Willing To Download Contact Tracing App Once They Hear It Would Allow People To Go To Work And Businesses To Open

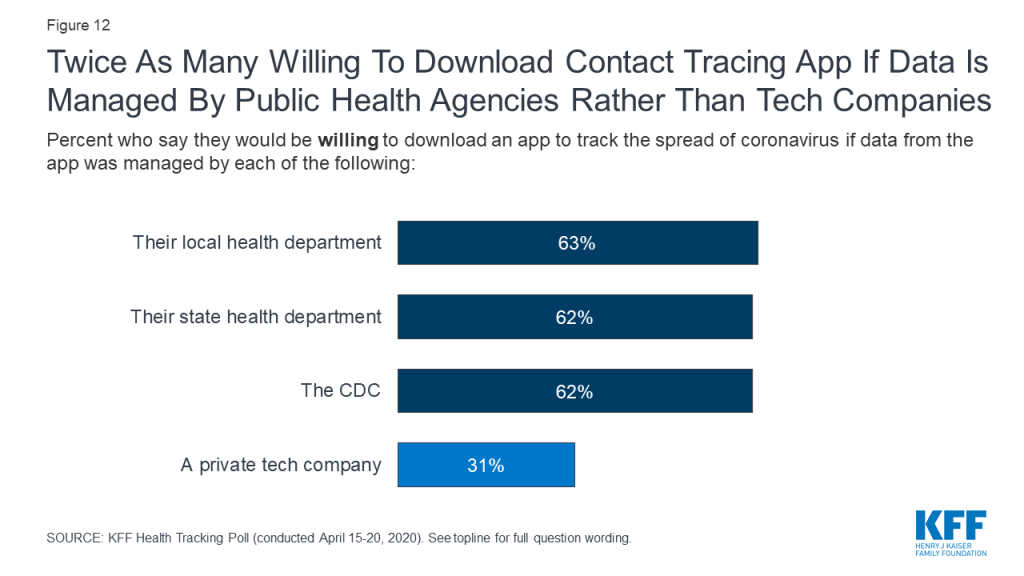
Who manages the data also affects peoples’ willingness to download an app for contact tracing. Six in ten saying they are “willing” to download an app to track the spread of coronavirus if data from the app was managed by their state health department (63%), the federal Centers for Disease Control and Prevention (62%), or their local health department (62%). Far fewer (31%) are willing to download the app if the data was managed by a private tech company.

Figure 12: Twice As Many Willing To Download Contact Tracing App If Data Is Managed By Public Health Agencies Rather Than Tech Companies

While majorities of Democrats and independents and about half of Republicans are willing to download a contract tracing app if the data was managed by the CDC or their state or local health department, fewer than four in ten Democrats (37%), one-third of independents, and one-fourth of Republicans say they are willing to download such an app if the data was managed by a private tech company.

Table 2: Who Partisans Trust To Manage Data From Contact Tracing Apps
Percent who say they would be willing to download an app to track the spread of coronavirus if data from the app was managed by:Party ID
DemocratsIndependentsRepublicans
Their state health department80%64%46%
The federal Centers for Disease Control and Prevention (CDC)756447
Their local health department786348
A private tech company373326

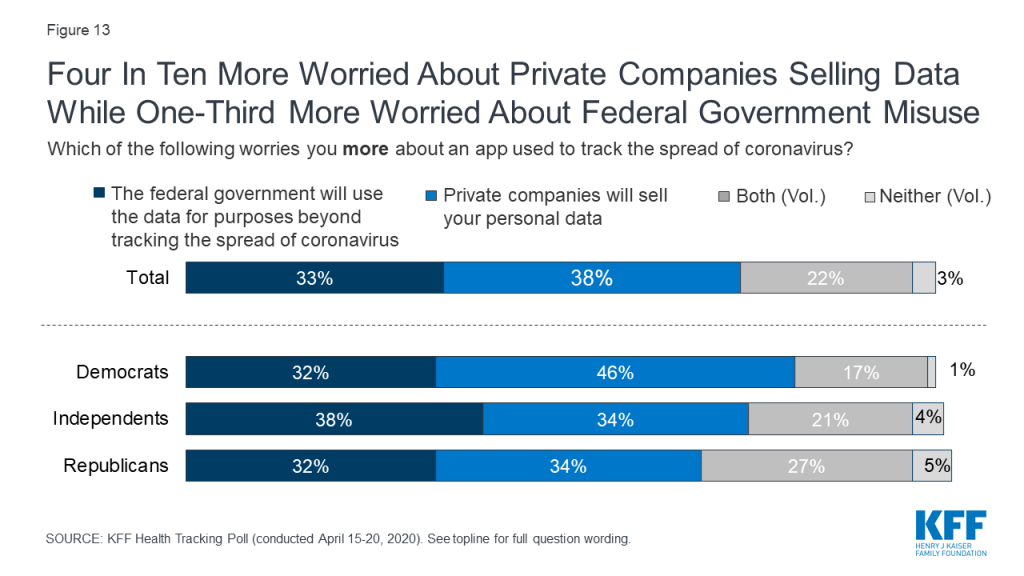
This may be due to the fact that nearly four in ten (38%) say they are more worried private companies will sell their personal data from the app while one-third (33%) say they are more worried the federal government will use the data for purposes beyond tracking the spread of coronavirus. About one-fourth (22%) volunteer that they are equally worried about both of these things.

Figure 13: Four In Ten More Worried About Private Companies Selling Data While One-Third More Worried About Federal Government Misuse

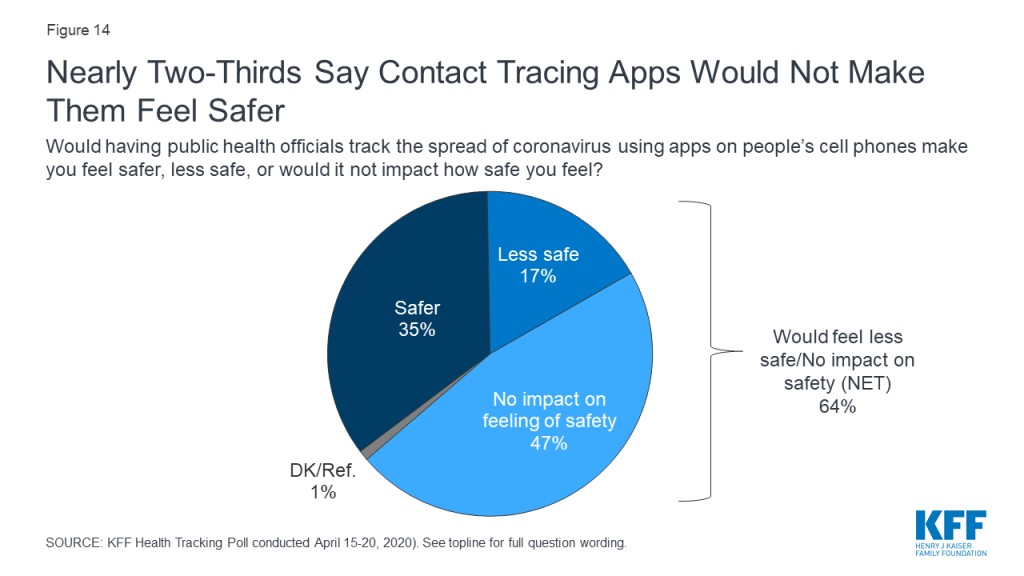
Nearly two-thirds of the public say the use of contact tracing apps either wouldn’t have any impact on how safe they feel or say they would make them feel less safe. Half of the public (47%) say having public health officials track the spread of coronavirus using apps on people’s cell phones would have “no impact on how safe they feel,” while one-third (35%) say it would make them feel “safer” and one in five (17%) say it would make them feel “less safe.”

Figure 14: Nearly Two-Thirds Say Contact Tracing Apps Would Not Make Them Feel Safer

At-Home Testing

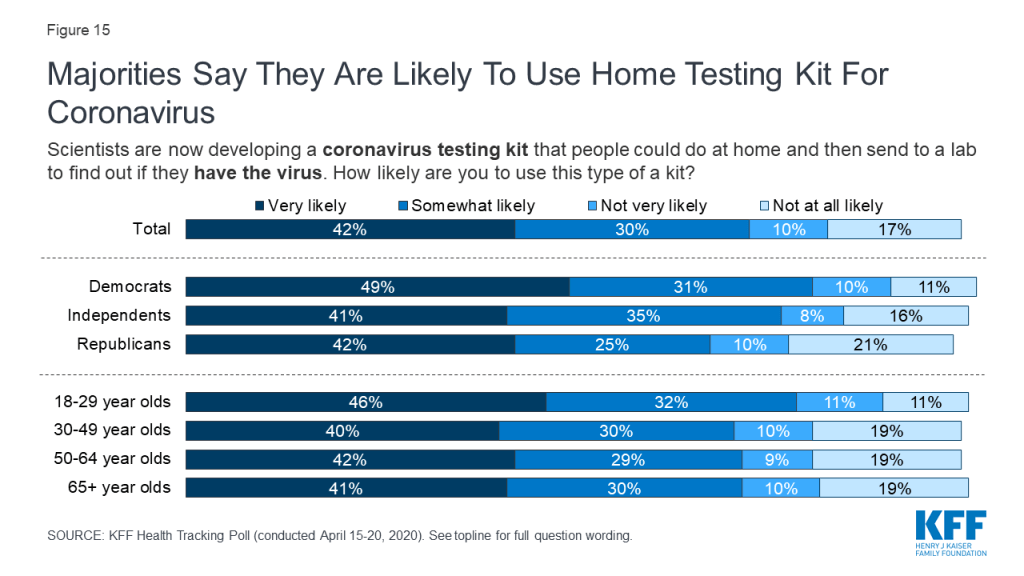
There has been discussion about the developments of a potential at-home testing kit for coronavirus with possible public availability. Seven in ten (72%) say they are either “very likely” or “somewhat likely” to use a coronavirus testing kit that they could do at their home and then send to a lab to find out if they have the virus. Unlike contact tracing apps, majorities across age groups and partisans say they are likely to use in-home testing kits.

Figure 15: Majorities Say They Are Likely To Use Home Testing Kit For Coronavirus

Personal Experience with Coronavirus

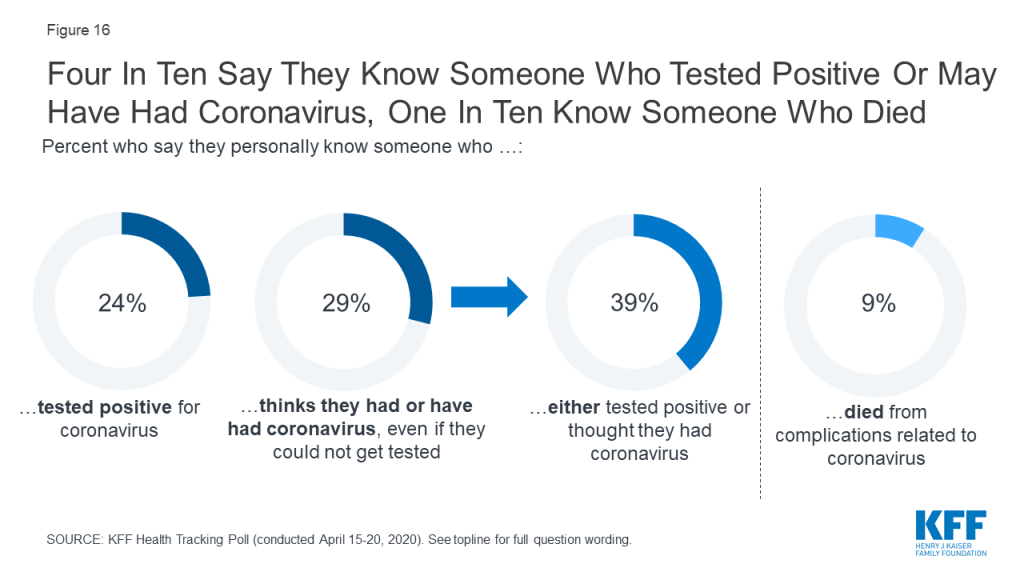
Four in ten now say they either they personally know someone who has “tested positive for coronavirus” (24%) or personally know someone who thinks they had or have coronavirus, even if they couldn’t get tested (29%). One in ten (9%) now say they personally know someone who has died from complications related to coronavirus.

Figure 16: Four In Ten Say They Know Someone Who Tested Positive Or May Have Had Coronavirus, One In Ten Know Someone Who Died

Knowing someone who has either died from complications from coronavirus, tested positive, or had coronavirus does not lead to larger support for using smart phone technology for contact tracing.

Table 3: Direct Experience With Coronavirus and Support for Contact Tracing Apps
Percent who say they would be willing to download/use an app for their phone …Know someone who tested positive/had symptoms/died of coronavirusDo not know someone who tested positive/had symptoms/died of coronavirus
… that tracks who you come into close contact with and then alerts you if you have come into contact with someone who tested positive for coronavirus so that you can take steps to protect you and your family53%49%
.. that tracks who you come into close contact with and then provides that information to public health officials to track the spread of coronavirus4942
… to share the results of your coronavirus test with public health officials in order for them to track the spread of the outbreak6868

Economic And Mental Health Impacts

Key Findings:

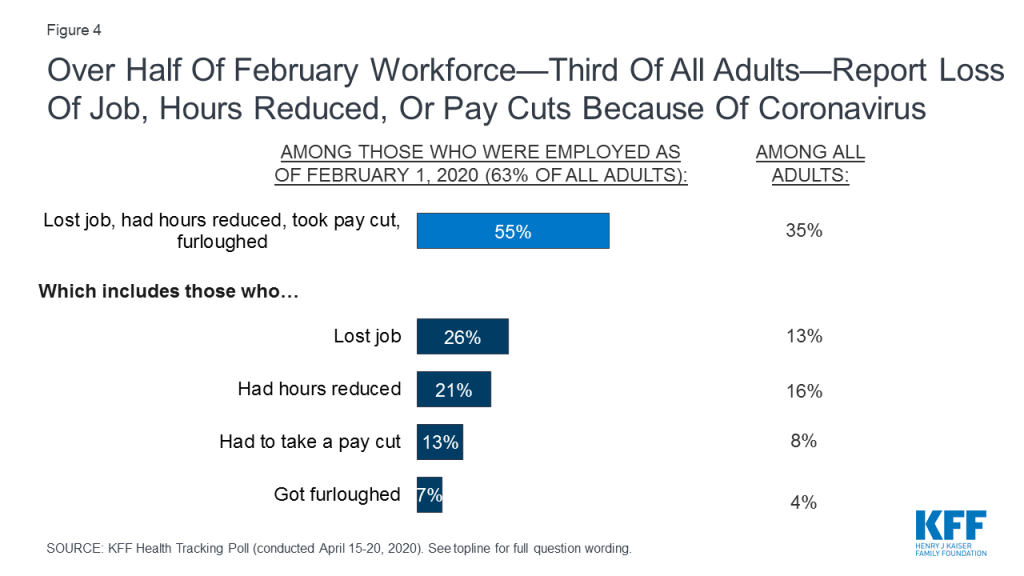
  • The latest KFF Health Tracking Poll finds just over half of the February workforce (35% of all adults) say they either have lost their job (26%), had hours reduced (21%), taken a pay cut (13%) or been furloughed (7%) as a result of the coronavirus outbreak. This includes three-fourths (76%) of those who were employed part-time, and about two-thirds of hourly or contract workers (68%), and workers from lower-income households (65% of those earning less than $40,000 annually).
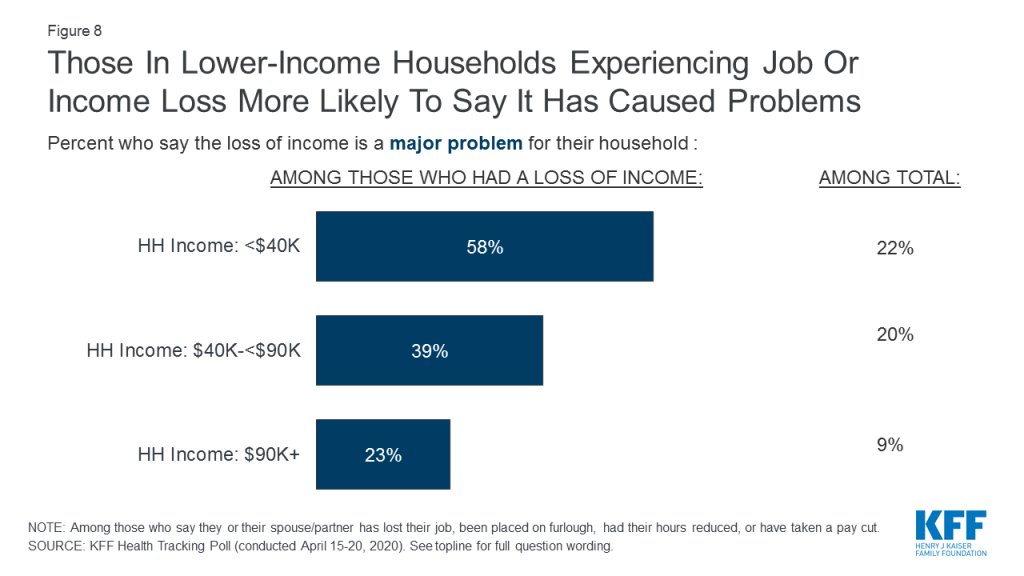
  • Four in ten (42%) of all adults say that either they or their spouse or partner experienced a job loss or a cut in salary or hours due to the coronavirus. Among this group, most say the loss of income is either a “major problem” (41%) or “minor problem” (32%) for their household. The loss of income is a bigger problem for those in lower-income households with most of those earning less than $40,000 annually (58%) saying the loss of income is a “major problem” for their household.
  • Overall, three in ten adults (29%) say they have fallen behind in paying bills or had problems affording household expenses like food or health insurance coverage since February due to the coronavirus outbreak. This rises to about four in ten among younger adults ages 18-29, those with household incomes of $40,000 or less annually, and Hispanic adults. More than half (56%) of Black adults say they have had problems paying these bills in the last two months specifically because of coronavirus. Nearly half (46%) of those who had an income loss due to coronavirus say they have had difficulty paying bills or affording household expenses since the outbreak.
  • Many of the potential impacts of the loss of a job have not yet been fully realized by those affected by the coronavirus outbreak. Most say they have not yet applied for unemployment benefits (69%), and that they think that they will get their previous job or salary back within six months (83%). Less than half of those who lost their job or were laid off say their former place of employment is still open for business (39%) while most say it is closed temporarily (56%). Only 2% say their former place of employment has closed permanently.
  • Over half of U.S. adults (56%) report that worry or stress related to the coronavirus outbreak has caused them to experience at least one negative effect on their mental health and wellbeing, such as problems with sleeping or eating, increased alcohol use, or worsening chronic conditions. Stress and worry around the coronavirus also seems to be affecting larger shares of frontline health care workers and their families (64%) as well as those who experienced an income loss (65%).

The Economic Impact of Coronavirus on U.S. Families

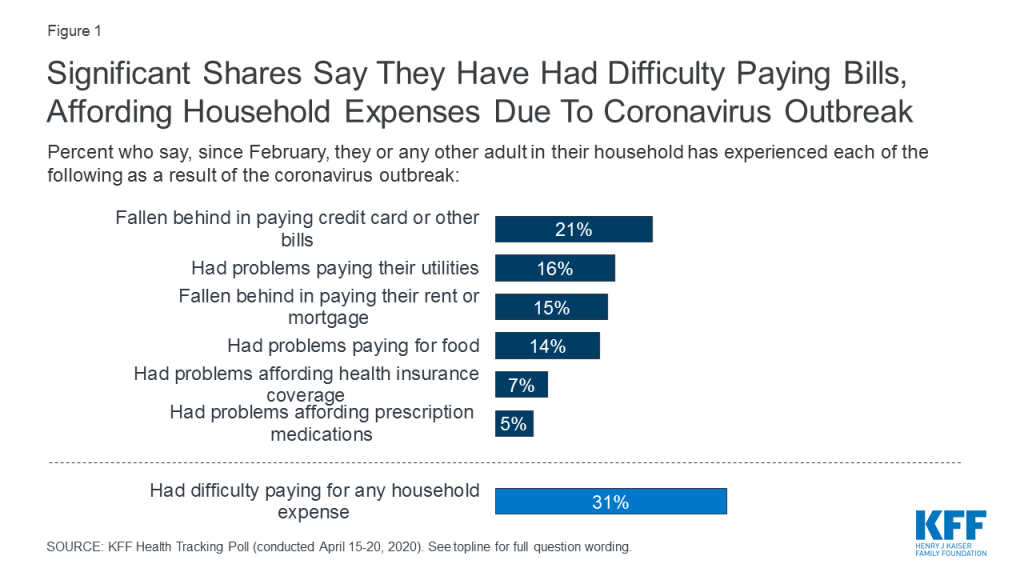
Many U.S. adults say they have had difficulty paying household expenses because of the coronavirus outbreak. About one in five say they have fallen behind in paying credit card or other bills (21%), while one in seven have had problems paying their utilities (16%), fallen behind in paying their rent or mortgage (15%), or had problems paying for food (14%) as a result of the coronavirus outbreak. An additional one in ten say they have had problems affording their health coverage (7%) or their prescription medications (5%).

Figure 1: Significant Shares Say They Have Had Difficulty Paying Bills, Affording Household Expenses Due To Coronavirus Outbreak

Overall, three in ten adults say they have fallen behind in paying bills or had problems affording household expenses like food or health insurance coverage since February due to the coronavirus outbreak. This rises to four in ten among younger adults (18-29), those with household incomes of $40,000 or less annually, and Hispanic adults. More than half (57%) of Black adults say they have had problems paying these bills in the last two months.

Figure 2: Three In Ten Have Fallen Behind Paying Bills Or Had Problems Affording Health Insurance Or Other Household Expenses

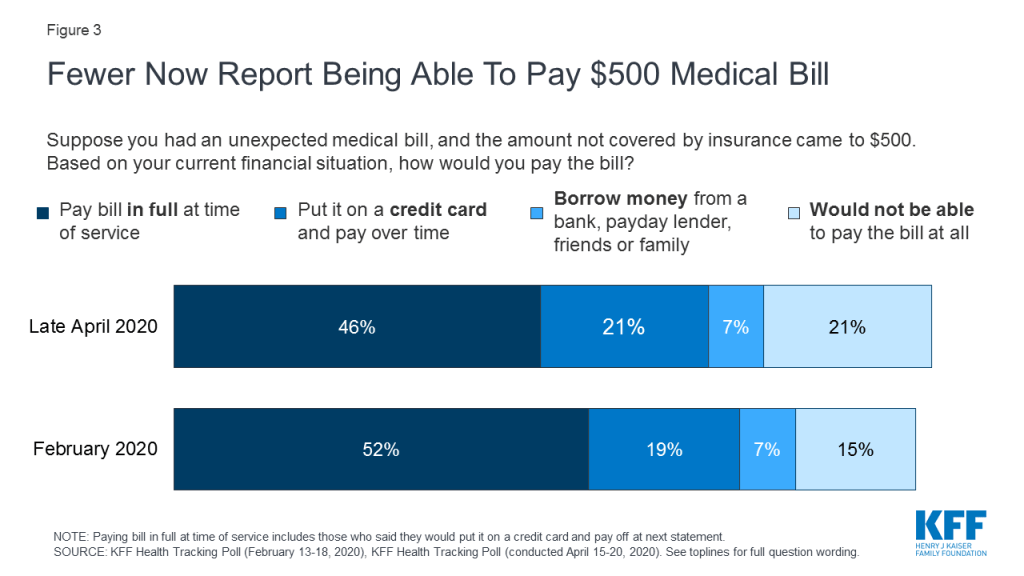
Prior to the outbreak of coronavirus and the closing of non-essential businesses across the U.S., the February 2020 KFF Health Tracking Poll found about half of adults (52%) said they could pay a $500 unexpected bill in full at the time of service. Now, 2 months later, the share who say they could pay this bill in full at time of service is down 6 percentage points to 46%, with one in five (21%) now saying they would not be able to pay the bill at all and 28% saying they would put it on a credit card and pay it off over time or borrow money to cover the costs. Additionally, the share who say they wouldn’t be able to pay the bill at all has increased 6 percentage points over the past two months.

Figure 3: Fewer Now Report Being Able To Pay $500 Medical Bill

Large Shares Report Loss of Job or Wages

The U.S. Labor Department reported on April 23rd that more than 26 million Americans have filed unemployment claims in the past four weeks, marking the greatest increase in unemployment in this century.1 The latest KFF Health Tracking Poll finds just over half (55%) adults who were employed as of February 1, 2020 (63% of total) say they either have lost their job (26%), had hours reduced (21%), taken a pay cut (13%) or been furloughed (7%) as a result of the coronavirus outbreak. This equates to more than one-third (35%) of all U.S. adults who say they have lost their jobs or had a reduction in hours or pay as a result of the coronavirus outbreak.

Figure 4: Over Half Of February Workforce—Third Of All Adults—Report Loss Of Job, Hours Reduced, Or Pay Cuts Because Of Coronavirus

Three-fourths (76%) of those who were employed part-time as of February 1st report either having their hours reduced, a pay cut, or a job loss because of the coronavirus outbreak, compared to 52% of those were employed full-time. Twice as many hourly or contract workers report loss of a job or income related to coronavirus compared to salaried workers (68% vs. 30%). Workers from lower-income households are also more likely to report having an employment-related loss due to coronavirus compared to households earning $90,000 or more annually.

Table 1: Many Of Those Who Were Employed As February 1 Now Report Employment-Related Loss Related To Coronavirus
Total EmployedAs Of Feb. 1(66% of all adults)HoursCompensationHousehold income
Full-timePart-timeSalaryHourly/By the job<$40K$40 to <$90K$90K+
Percent who say they …
Had hours reduced21%20%26%13%25%23%23%17%
Lost job262341934313013
Had to take a pay cut131315915131414
Been placed on furloughed768381053
Any of the above5552763068656238
NOTE: Individuals could say yes to both taken a pay cut or had hours reduced.

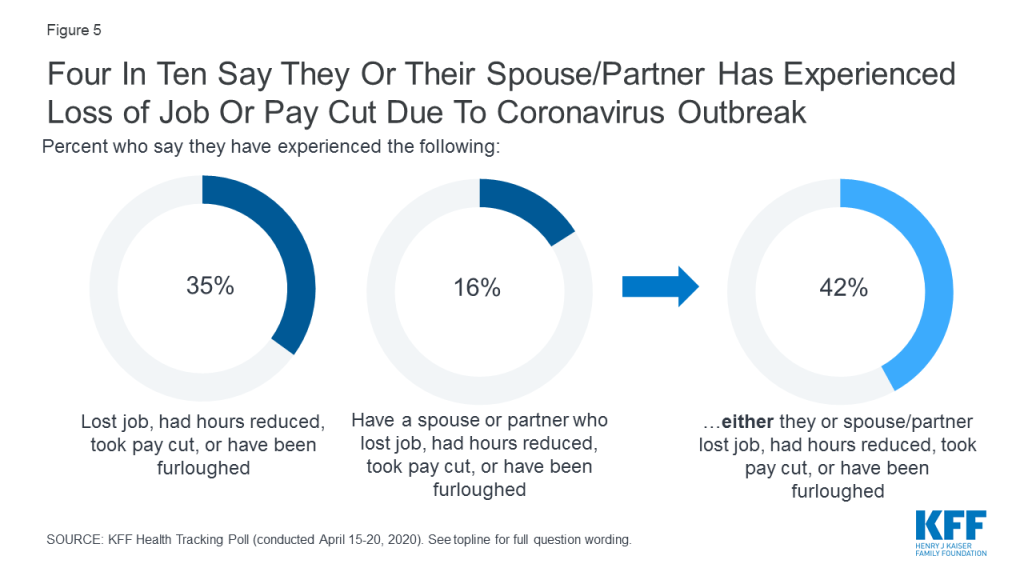
In addition to those who personally experienced a coronavirus-related job or income loss, 16% say they have a spouse or partner who has lost their job, had hours reduced, took pay cut, or been furloughed. In total, 42% of all U.S. adults say they or their spouse or partner has had their income or employment impacted by the coronavirus outbreak.2

Figure 5: Four In Ten Say They Or Their Spouse/Partner Has Experienced Loss of Job Or Pay Cut Due To Coronavirus Outbreak

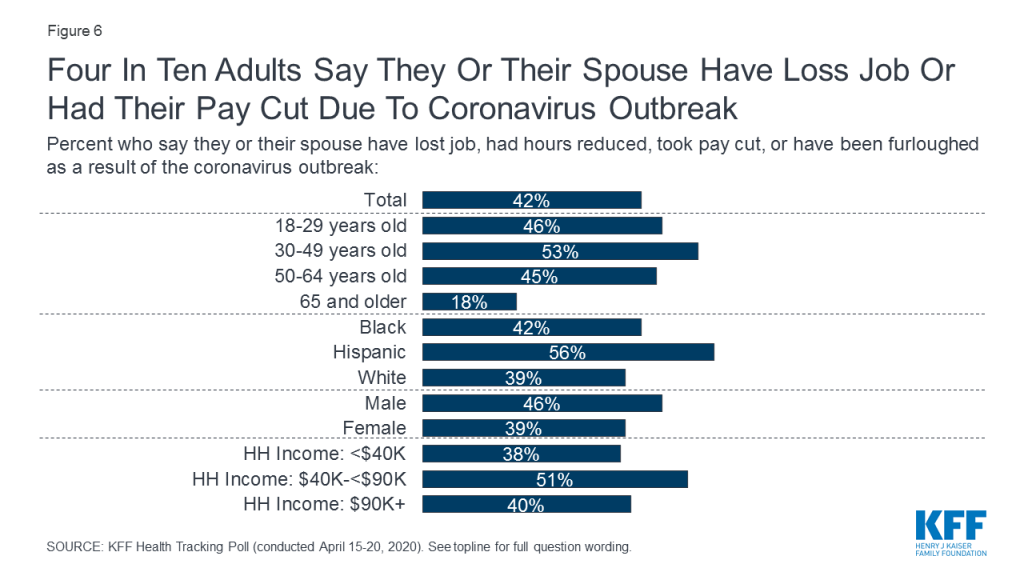
At least four in ten across most demographic groups, including more than half of Hispanic adults (56%), between the ages of 30 and 49 (53%), and those with household incomes between $40,000 and $89,999 (51%), report that either they or their spouse/partner have either lost their job, had hours reduced, took a pay cut, or have been furloughed as a result of the coronavirus outbreak. A smaller share of older adults, 65 and older, report a loss of employment-related income (18%).

Figure 6: Four In Ten Adults Say They Or Their Spouse Have Loss Job Or Had Their Pay Cut Due To Coronavirus Outbreak

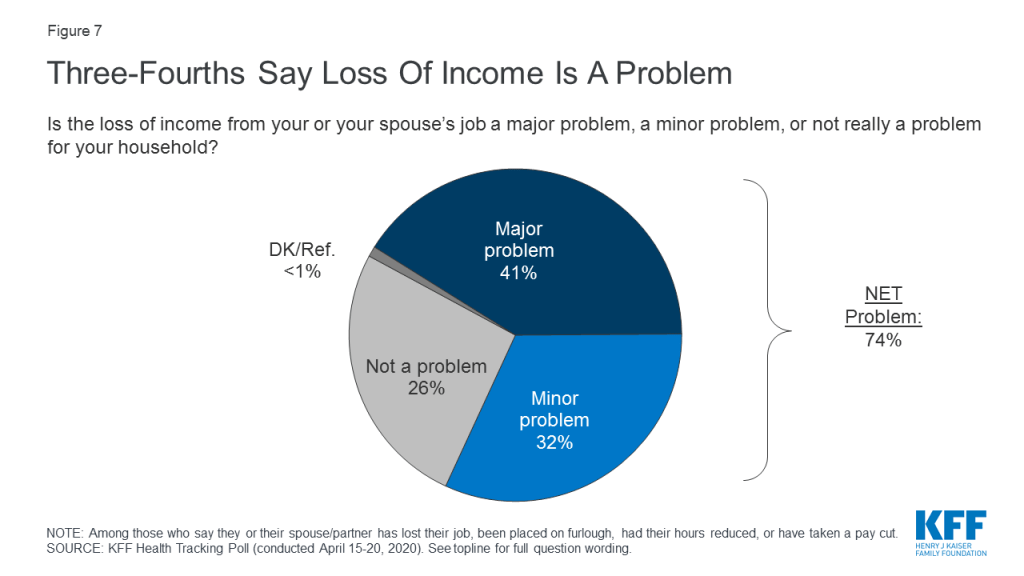
Three in four (74%) of those who have experienced a loss of income (either themselves or a spouse) say it is a problem for their household including four in ten (41%) who say the loss of income is a “major problem” for their household. An additional one-third (32%) say the loss of income is a “minor problem.” About one-fourth say the loss of income is “not a problem” for their household.

Figure 7: Three-Fourths Say Loss Of Income Is A Problem

The loss of employment is a major problem for the lowest income households (less than $40,000 annual income), but a significant share of those living in households earning $40,000 to $89,999 also report the loss of income will be a problem for their household. Among those who say their household experienced a loss of job or income, six in ten (58%) of those earning less than $40,000 annually say the loss of income is a “major problem,” as do 39% of those earning between $40,000 and $89,999.

Figure 8: Those In Lower-Income Households Experiencing Job Or Income Loss More Likely To Say It Has Caused Problems

Nearly half (46%) of those who had an income loss due to coronavirus say they have had difficulty paying bills or affording household expenses since the outbreak (compared to three in ten among the public overall).

Figure 9: Nearly Half Of Those Who Have Had Their Income Impacted By Coronavirus Say They Have Experienced The Following

Most Who Have Experienced Employment Loss Say They Expect To Get Their Jobs Back

Among those who had lost their job or had their pay reduced as a result of the coronavirus (35% of the total population), eight in ten (83%) say they expect to be either hired back, get their previous salary or hours back in the next six months. This includes 86% of those who had a job loss or were furloughed who say they expect to be hired back and 81% of those who had a pay cut or their hours reduced who say they expect to get their previous salary or hours back in the next six months.

Figure 10: Most Of Those Who Have Had Job Impacted By Coronavirus Expect To Get Previous Employment Back Within Six Months

Less than half of those who lost their job or were laid off say their former place of employment is still open for business (39%) while most say it is closed temporarily (56%). Only 2% say their former place of employment has closed permanently.

The Uncertain Future

There are significant disagreements among policymakers and public health officials on when the U.S. economy will open back up. Some states are re-opening non-essential businesses in the coming weeks while other states warn it may be weeks or months until shelter-in-place restrictions are loosened and businesses can open up. The latest KFF Health Tracking Poll finds many Americans have already experienced an impact on either their own employment or their household income due to coronavirus. But it is also clear that many are unsure of how long this may last. About half of those who lost their job entirely say they have applied for unemployment benefits but smaller shares of those who have either been furloughed or had salary or hours reduced say the same. Additionally, only four in ten (37%) of households earning less than $40,000 annually say they have applied for these benefits. And while only 2% of those who lost their job know their businesses is closed permanently, it is unclear on what share of businesses will be able to re-open and re-hire their former employees in the next six months.

The Impacts of Coronavirus on Health Insurance Coverage, Mental Health, and Wellbeing

Changes in employment status could have serious implications for access to health insurance coverage for adults in the U.S. The latest KFF Health Tracking Poll finds that among those who lost a job or had a reduction in salary or hours (either themselves or a spouse), most report no change in their health insurance status at this point.

About eight in ten of those who say they or their spouse lost a job or were laid off (77%) or had hours or income reduced (82%) say they are still currently insured. Few (9% and 2%, respectively) say they are newly insured because they lost employer-sponsored coverage or another form of coverage. It is unclear whether those who so far have remained insured in the face of job loss will be able to retain their coverage, or whether the share losing such coverage may rise over the course of the outbreak.

Table 2: Health Insurance Coverage Among Those Who Say They Or Their Spouse/Partner Experienced A Loss Of Employment
Percent who say they are:Self or spouse experienced any type of income or job loss (42% of total)Self or spouse lost a job or were laid off (23% of total)Self or spouse furloughed or had hours or income reduced (23% of total)
Currently insured79%77%82%
Currently uninsured (NET)192215
Newly uninsured (lost ESI or other coverage)692
Uninsured before loss of job or income131313

The Impact On mental health and wellbeing

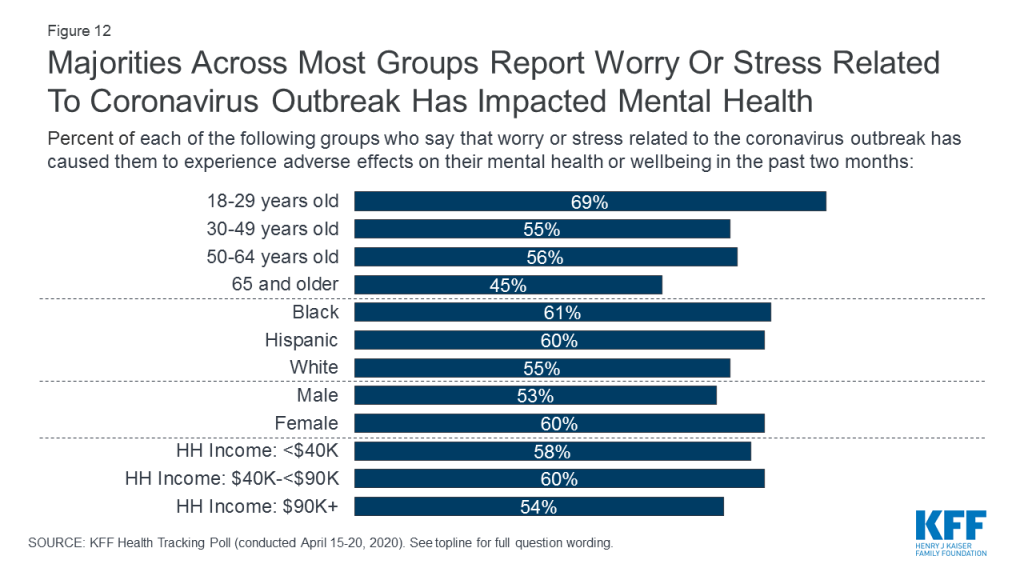
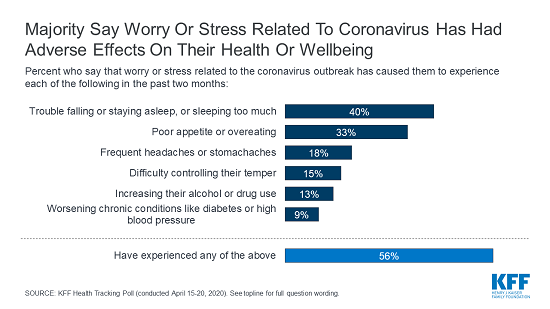
Adults in the U.S. report that worry and stress related to the coronavirus outbreak is affecting their mental health and wellbeing in various ways. Four in ten say such worry or stress has led to problems with their sleep, while one-third say they either have had a poor appetite or have been over-eating. Some also say worry or stress related to the coronavirus outbreak has caused them to experience frequent headaches or stomachaches (18%), difficulty controlling their temper (15%), or increasing their alcohol or drug use (13%). About one in ten (9%) say coronavirus-related stress has led to worsening chronic health conditions. Over half of U.S. adults (56%) report that worry or stress related to the coronavirus outbreak has affected them in at least one of these ways.

Figure 11: Majority Say Worry Or Stress Related To Coronavirus Has Had Adverse Effects On Health Or Wellbeing

Majorities across most demographic groups including race and ethnicity, gender, and income report that worry or stress related to coronavirus has caused adverse effects on their mental health or wellbeing in the past two months. To see more on the implications of COVID-19 for mental health, see this KFF analysis.

Figure 12: Majorities Across Most Groups Report Worry Or Stress Related To Coronavirus Outbreak Has Impacted Mental Health

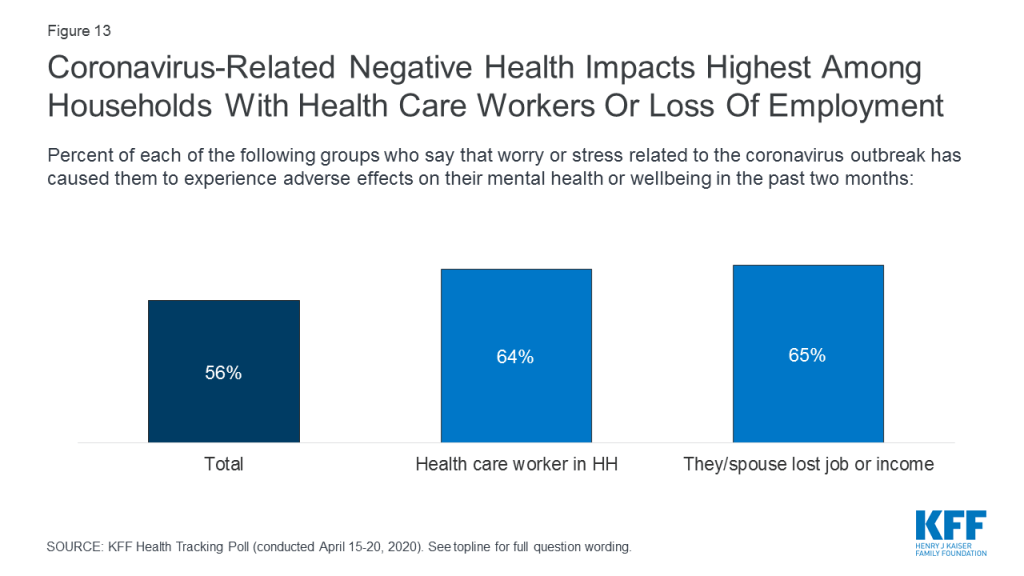
The coronavirus outbreak’s impact on mental health and wellbeing also seems to be affecting large shares of frontline health care workers and their families, as well as those who experienced a loss of employment income. About two-thirds of those living in a household with a health care worker (64%) and a similar share of those who have lost their job or income (65%) say that worry or stress related to the coronavirus outbreak has caused them to experience at least one adverse effect on their mental health or wellbeing in the past two months.

Figure 13: Coronavirus-Related Negative Health Impacts Highest Among Households With Health Care Workers Or Loss Of Employment

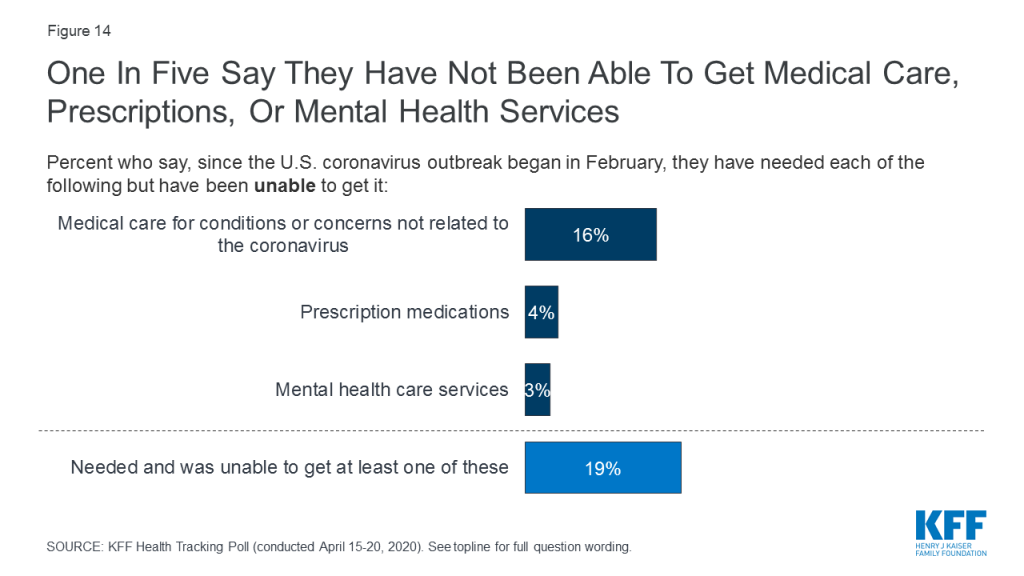
Since the coronavirus outbreak one in five (19%) say they have needed but been unable to get some type of medical care or prescription medications. This includes 16% who say they were unable to get medical care for conditions or concerns unrelated to coronavirus, 4% who say they were unable to get prescription medications, and 3% who say they were unable to get needed mental health services.

Figure 14: One In Five Say They Have Not Been Able To Get Medical Care, Prescriptions, Or Mental Health Services

Endnotes

1 –  “Jobless claims: Another 4.427 million Americans file for unemployment beenfits.” Yahoo! Finance (April 23, 2020). https://finance.yahoo.com/news/coronavirus-covid-weekly-initial-jobless-claims-april-18-165759755.html

2 – This is consistent with the KFF Early April Health Tracking Poll that found four in ten (39%) adults reporting they had already either lost their job, lost income, or had their hours reduced without pay because of the coronavirus outbreak.

Methodology

This KFF Health Tracking Poll was designed and analyzed by public opinion researchers at the Kaiser Family Foundation (KFF). The survey was conducted April 15th – 20th, 2020, among a nationally representative random digit dial telephone sample of 1,202 adults ages 18 and older, living in the United States, including Alaska and Hawaii (note: persons without a telephone could not be included in the random selection process). The sample included 290 respondents reached by calling back respondents that had previously completed an interview on the KFF Tracking poll at least nine months ago. Computer-assisted telephone interviews conducted by landline (261) and cell phone (941, including 661 who had no landline telephone) were carried out in English and Spanish by SSRS of Glen Mills, PA. To efficiently obtain a sample of lower-income and non-White respondents, the sample also included an oversample of prepaid (pay-as-you-go) telephone numbers (25% of the cell phone sample consisted of prepaid numbers) as well as a subsample of respondents who had previously completed Spanish language interviews on the SSRS Omnibus poll (n=10). Both the random digit dial landline and cell phone samples were provided by Marketing Systems Group (MSG). For the landline sample, respondents were selected by asking for the youngest adult male or female currently at home based on a random rotation. If no one of that gender was available, interviewers asked to speak with the youngest adult of the opposite gender. For the cell phone sample, interviews were conducted with the adult who answered the phone. KFF paid for all costs associated with the survey.

The combined landline and cell phone sample was weighted to balance the sample demographics to match estimates for the national population using data from the Census Bureau’s 2018 American Community Survey (ACS) on sex, age, education, race, Hispanic origin, and region along with data from the 2010 Census on population density. The sample was also weighted to match current patterns of telephone use using data from the July-December 2018 National Health Interview Survey. The weight takes into account the fact that respondents with both a landline and cell phone have a higher probability of selection in the combined sample and also adjusts for the household size for the landline sample, and design modifications, namely, the oversampling of prepaid cell phones and likelihood of non-response for the re-contacted sample. All statistical tests of significance account for the effect of weighting.

The margin of sampling error including the design effect for the full sample is plus or minus 3 percentage points. Numbers of respondents and margins of sampling error for key subgroups are shown in the table below. For results based on other subgroups, the margin of sampling error may be higher. Sample sizes and margins of sampling error for other subgroups are available by request. Note that sampling error is only one of many potential sources of error in this or any other public opinion poll. Kaiser Family Foundation public opinion and survey research is a charter member of the Transparency Initiative of the American Association for Public Opinion Research.

GroupN (unweighted)M.O.S.E.
Total1,202± 3 percentage points
Party Identification
Democrats348± 6 percentage points
Republicans341± 6 percentage points
Independents347± 6 percentage points
Age
18-39314± 6 percentage points
40-59384± 6 percentage points
60-74353± 6 percentage points
75 and older132±10 percentage points
60 and older485±5 percentage points

Endnotes

  1. Counties were classified by their confirmed number of coronavirus deaths as of April 17, 2020. Data for deaths attributed to coronavirus by county were taken from the Coronavirus (Covid-19) Data in the United States repository maintained by the New York Times (downloaded on April 18th). ↩︎
  2. “Trump says states can start reopening” (April 16, 2020) The New York Times. https://www.nytimes.com/2020/04/16/us/politics/coronavirus-trump-guidelines.html ↩︎
  3. Centers for Disease Control and Prevention, Coronavirus Disease 2019, Contact Tracing. https://www.cdc.gov/coronavirus/2019-ncov/php/open-america/contact-tracing.html ↩︎
News Release

More than 10,000 People in Long-Term Care Facilities Have Died Due to COVID-19

KFF Data Note Presents State-Level Cases and Deaths in Such Facilities

Published: Apr 23, 2020

More than 10,000 residents and staff in long-term care facilities across the U.S. have died from COVID-19 infections, according to a KFF analysis of state data. That number is an undercount since not all states are currently reporting such data.

Among those reporting data, the largest death tolls as of April 23 were in several Northeastern states, including New York (3,505 deaths), New Jersey (2,050), Massachusetts (1,205) and Pennsylvania (845). The data also show that there have been nearly 51,000 infections with COVID-19 at more than 4,000 long-term care facilities in the 36 states reporting such data. New Jersey reported the highest number of cases (11,608) and North Dakota the least (61).

Residents of long-term care facilities are among the most vulnerable to infection and serious illness from COVID-19, given the population density in such facilities and residents’ underlying health conditions. Moreover, nearly 40 percent of nursing homes in the U.S. had infection control deficiencies in 2017, a problem that may contribute to high numbers of cases and deaths.

Long-term care facilities account for a notable share of all COVID-19 cases and deaths in many states. In six states – Colorado, Delaware, Massachusetts, Oregon, Pennsylvania and Utah – such deaths account for over 50 percent of all COVID-19 deaths. Overall, cases in long-term care facilities make up 11 percent of all coronavirus cases in the 29 states that report cases. Deaths in long-term care facilities account for 27 percent of all deaths in the 23 states that report deaths.

“The situation in many nursing homes is an emergency. It may be time to consider sending military health response teams to nursing homes and temporarily moving nursing home residents who are able to community and rural hospitals where there is room,” said Drew Altman, KFF’s President and CEO.

Until recently, there was no federal requirement for nursing homes to report coronavirus outbreaks and COVID deaths, leading to an information gap for families, residents, and policymakers. On April 19, the Centers for Medicare and Medicaid Services released guidance that would require nursing homes to report cases of coronavirus directly to the Centers for Disease Control and Prevention (CDC). This data is not yet available.

KFF is gathering data obtainable through state COVID reporting or state press releases. We include all available long-term care facility data reported by state, including cases among both residents and staff, where available. Definition of long-term care facility differs by state, but data reflects a combination of nursing facilities, residential care communities, adult care centers, intermediate care facilities, and/or other congregate settings.

Donor Funding for the Global Novel Coronavirus Response

Author: Kellie Moss
Published: Apr 23, 2020

First reported at the end of December 2019, the coronavirus disease (COVID-19) pandemic shows no sign of abating, as spread continues around the world. While donors are providing support to the World Health Organization (WHO), other multilateral organizations, and directly to address needs in low- and middle-income countries, there is currently no centralized repository for this information. This tracker provides an accounting of publicly available information on donor funding to date; estimates should be treated as a floor. Not included is funding from governments for their own domestic response efforts or commitments focused on economic stimulus or recovery efforts related to the outbreak (such as an $8 billion commitment from the World Bank’s International Finance Corporation or a $100 billion commitment to its emergency rapid-disbursing capacity1  from the International Monetary Fund).2  This tracker will be updated as needed. Data are provided in the table below, including by donor, funding amount, purpose or recipient, and source. Key highlights are as follows.

  • As of April 21, 2020, donors (including governments, multilateral organizations, and private funders) have pledged or distributed an estimated $19.3 billion in overall financial support for the COVID-19 response. This includes donor assistance provided directly to countries as well as their contributions to the World Health Organization (WHO).
  • The vast majority (85%) was provided by donor governments (including the U.S.), the World Bank, and other multilateral organizations. The remainder (15%) came from non-profits, foundations, and businesses.
  • The largest donor to date is the World Bank3  ($6 billion), followed by the Asian Development Bank ($4.87 billion), the United States ($2.39 billion), Start Small LLC/Start Small Foundation (up to $1.21 billion), and the Global Fund to Fight AIDS, Tuberculosis and Malaria (up to $1 billion). This makes the U.S. the largest donor government.

Know about other donor funding? Contact us.

Table 1: Pledged Donor Funding for the Global Response to the Novel Coronavirus (COVID-19), Jan. – April 21, 2020
DonorEstimated Funding(in US$ millions) Purpose or RecipientData Source
TOTAL19,292.736
Donor Governments and Multilateral Organizations16,469.695
Asian Development Bank4,869.100Coronavirus relief efforts in Asia, UNICEFAsian Development Bank, OCHA, UNICEF
Australia          4.186WFP, UNICEF, WHO’s Pacific regional coronavirus response planOCHA, WHO, Australia
Austria          2.205WHOOCHA
Azerbaijan          5.000WHOWHO, OCHA
Canada55.530FAO, Intl. Committee of the Red Cross, Intl. Federation of Red Cross and Red Crescent Societies, IOM, PAHO, UNICEF, UNHCR, UNFPA, UNRWA, WFP, WHOOCHA, Canada, WHO
China20.100WHOWHO, China, OCHA
Czech Republic            0.258WHOWHO, Czech Republic, OCHA
Denmark58.917Adventist Development and Relief Agency, Danish People’s Aid, Intl. Committee of the Red Cross, Intl. Federation of Red Cross and Red Crescent Societies, Save the Children, UNICEF, UNHCR, UNFPA, WFP, WHOOCHA
Estonia          0.137Intl. Federation of Red Cross and Red Crescent Societies, WHO, ChinaOCHA
European Union544.996WHO, UNICEF, coronavirus relief activities in Africa and elsewhereEuropean Commission, European Commission/2, WHO, OCHA
Finland          2.195WHO, Intl. Federation of Red Cross and Red CrescentOCHA, WHO
France165.02619 priority countries for French aid in Africa, in the ocean basins (Madagascar, Comoros, Haiti) as well as in the Middle East; WHOFrance, OCHA, WHO, WHO/Tedros (France)
Gavi, the Vaccine AllianceUp to 200.000A subset of lower-income countries to quickly respond to the pandemicGavi
Germany54.973WHO, World Relief, IOM, World ReliefGermany, WHO, OCHA
Global Fund to Fight AIDS, TB and MalariaUp to 1,000.000Global Fund recipientsGlobal Fund
Holy See            0.112WHOWHO, OCHA
Ireland            5.181WHO, UNICEFWHO, Ireland, OCHA
Italy            0.455WHOWHO, OCHA
Japan        138.914WHO, UNICEF, UNHCR, UNOPS, WFP, IOM, Intl. Federation of Red Cross and Red Crescent SocietiesOCHA, WHO
Kuwait          60.000WHOWHO, OCHA
Liechtenstein            0.423WHO, WFPOCHA
Lithuania            0.113International Federation of Red Cross and Red Crescent SocietiesOCHA
Luxembourg            0.392WHO, UNICEFOCHA, WHO
Malta            0.011UNICEFUNICEF
New Zealand            0.649WHOWHO, OCHA
Norway            7.341WHO, WFPOCHA, WHO, Norway
Organization of Petroleum Exporting Countries Fund*            0.500WHOOCHA
Qatar            5.000WHOWHO, OCHA
Russia            1.000WHOOCHA
Saudi Arabia350.000WHO, Gavi, international and regional health organizations and programs, coronavirus relief efforts in specific countriesSaudi Arabia, OCHA, WHO, WHO/Tedros (Saudi Arabia), WHO/Tedros (Saudia Arabia/2)
Singapore            0.500WHOWHO, OCHA
Slovakia            0.221WHOWHO, Slovakia, OCHA
Slovenia            0.068WHOWHO, OCHA
South Korea5.800WHO, UNICEFOCHA, WHO/Tedros (South Korea)
Sweden6.973UNICEF, UNHCROCHA
Switzerland            1.999Intl. Federation of Red Cross and Red Crescent Societies, WHO, China, North KoreaOCHA, Switzerland, WHO
U.N. Central Emergency Response Fund (CERF)*95.000WHO, UNICEF, UNFPA, IOM,  UNHCR, UNDP, FAO, UN-Habitat, WFPCERF, WHO, WHO release, OCHA
UNDP Multi-Partner Trust Fund*1.498WHOWHO
United Kingdom337.476WHO, International Federation of the Red Cross and Red Crescent Societies, UNICEF, UNHCR, UNFPA, WFP, British Red Cross, other coronavirus relief efforts in vulnerable countriesUnited Kingdom (4/12), OCHA, WHO, United Kingdom (3/26), United Kingdom (3/6), United Kingdom (2/8)
United States2,394.000Prevent, prepare for, and respond to coronavirus abroad, WHO, UNICEF, China, other impacted countries (both directly and through multilateral orgs)H.R. 748, H.R. 6074, State Dept, USAID, WHO, OCHA
U.N. Office for the Coordination of Humanitarian Affairs (OCHA)*          64.545WHO, UNICEF, specific country responsesOCHA, WHO
WHO Contingency Fund for Emergencies (CFE)*8.900WHOWHO/CFE
World Bank6,000.000WHO; help developing countries (prioritizing the poorest countries and those at high risk with low capacity) strengthen health systems, including better access to health services to safeguard people from the epidemic, strengthening disease surveillance, bolstering public health interventionsWorld Bank (3/17), World Bank, WHO, OCHA
     International Development Association (IDA)3,300.000will provide grants and low-interest loans for low-income countries World Bank
     International Bank of Reconstruction and Development (IBRD)up to 2,700.000will provide loans for middle -income countriesWorld Bank
Non-Profits, Foundations, and Businesses2,823.040 
Adani Foundation13.116India/PM’s Citizen Assistance and Relief in Emergency Situations Fund (PM CARES Fund)Gautam Adani
Alibaba144.000Coronavirus relief efforts in Wuhan and Hubei province, ChinaAxios
Align Technology, Inc.0.143Chinese Red Cross FoundationU.S. Chamber Foundation
Aliko Dangote Foundation5.200Coronavirus relief efforts in NigeriaForbes
Allianz/Allianz China Insurance Holding0.570Coronavirus relief efforts in ChinaU.S. Chamber Foundation
American Express/American Express Foundation3.753WHO, Hubei Red Cross Foundation, Give2Asia, The Resource Foundation for relief organizations in Mexico and South America, various government relief funds at the central and state level in IndiaU.S. Chamber Foundation
Amgen/Amgen FoundationUp to 12.500Global and U.S. coronavirus relief effortsAmgen
Anta Sports1.446Chinese Charity FederationFDRA
Apple15.000Coronavirus relief efforts in China, globallyApple, Reuters
Applied Materials and Applied Materials Foundation0.574Coronavirus relief efforts in ChinaU.S. Chamber Foundation
Baidu43.377Coronavirus relief efforts in ChinaBaidu
Bayer0.660Coronavirus relief efforts in Wuhan, ChinaBayer
BD1.100Coronavirus relief efforts in China, U.S., and elsewhere through Direct Relief, the International Medical Corps, Americares, WHO, Project HOPE, the CDC Foundation, and the Wuhan Red CrossBD
BHP0.100Coronavirus relief efforts in MexicoBHP
Bill and Melinda Gates Foundation190.000WHO, coronavirus relief efforts in sub-Saharan Africa and South Asia, Chinese frontline responders, others at the global and national levelsGates Foundation, Gates Foundation/2
Binance1.440Coronavirus relief effortsU.S. Chamber Foundation
Bloomberg40.000WHO, coronavirus relief efforts in low- and middle-income countries,Bloomberg press release, OCHA
Boehringer Ingelheim0.144Chinese Red Cross FoundationBoehringer Ingelheim
BUA Cement0.772Coronavirus relief efforts in NigeriaForbes
ByteDance28.918Chinese Red Cross FoundationChina Daily
Cargill0.288Chinese Red CrossU.S. Chamber Foundation
Caterpillar Foundation8.750WHO, China Women’s Development Foundation, other organizations and COVID-19 funds around the world, including the U.S.Caterpillar
Chevron/Chevron Global Community Fund0.300China Women’s Development FoundationU.S. Chamber Foundation
China Merchants Bank28.918Coronavirus Infection Pneumonia Epidemic Prevention and Control Headquarters in WuhanChina Merchants Bank
Chubb Charitable Foundation9.000Organizations around the world that are providing essential resources immediately in areas facing the most acute need from the COVID-19 pandemicChubb
Cisco8.000WHO, global coronavirus responseCisco
Citadel and Citadel Securities7.500Hubei Xinhua Hospital in Wuhan, China; coronavirus relief efforts in Hubei province, China, and in U.S.; assisting affected familiesCitadel
Citi Foundation10.000WHO, international country-specific efforts in places that are severely impactedU.S. Chamber Foundation
Clara Lionel Foundation6.000WHO, International Rescue Committee, Direct Relief, Feeding America, Partners in Health, Medecins Sans FrontieresClara Lionel Foundation, Clara Lionel Foundation/2
Clorox Company Foundation4.000Direct Relief, CDC FoundationU.S. Chamber Foundation
Coca-Cola Foundation5.350Amref Health Africa, International Federation of Red Cross and Red Crescent Societies, Shenzhen One Foundation, U.P. Medical Foundation, UNDP country programs, various Red Cross societies, and other organizationsCoca-Cola Foundation
Conrad N. Hilton Foundation/King Baudouin Foundation United States5.250Coronavirus relief efforts in the African region through WHO/AFRO, UNICEF, Shining Hope for Communities (Kenya)Hilton, Hilton/2, WHO, OCHA
Dalio Philanthropies/Bridgewater Associates LP10.000Peking University First Hospital, Union Hospital for Clinical Care, three medical teams led by academics in Wuhan, ChinaBloomberg (2/17)
Dell, Inc.0.288Chinese Red CrossU.S. Chamber Foundation
Denso Group0.145Red Cross Society of ChinaU.S. Chamber Foundation
Dow Company Foundation2.000WHO, Direct Relief, local and regional non-profit organizations around the globeDow
Education Cannot Wait Fund0.500Plan InternationalOCHA
Estée Lauder Companies and MAC Cosmetics VIVA GLAM Fund14.200Medecins Sans Frontieres, coronavirus relief efforts in China and other regions and countriesEstee Lauder
Federation Internationale de Football Association (FIFA)10.000WHOOCHA
FUZAMEI0.014Coronavirus relief effortsU.S. Chamber Foundation
Galaxy Entertainment Group Foundation2.500Coronavirus relief effortsU.S. Chamber Foundation
General Motors0.715Chinese Red Cross FoundationU.S. Chamber Foundation
Google.org50.000Coronavirus relief efforts, Hubei Red Cross FoundationU.S. Chamber Foundation
Henderson Land Development Co.1.400Anti-epidemic foundationBloomberg (2/10)
Hewlett Packard Foundation1.000Direct ReliefU.S. Chamber Foundation
Hispanics in Philanthropy0.200Frontline organizations responding to the immediate needs of migrants and refugees to respond to the COVID-19 pandemic along the Central America, Mexico and U.S. migrant corridorHIP
Honda Motor Company, LTD.& Honda Motor (China) Investment Co., Ltd.1.431Red Cross in Hubei province, ChinaU.S. Chamber Foundation
Huami1.500Coronavirus relief efforts in Wuhan, ChinaU.S. Chamber Foundation
iFlyTek1.400Coronavirus relief effortsU.S. Chamber Foundation
Intel/Intel Foundation5.000International Red Cross, coronavirus relief efforts in U.S., Costa Rica, India, Ireland, Israel, Malaysia, Mexico and VietnamIntel
J.P. Morgan1.000China Foundation for Poverty AlleviationU.S. Chamber Foundation
JSPL3.300India/PM CARES FundForbes
JSW Group13.200Coronavirus relief efforts in IndiaForbes
Kering1.100Red Cross in Hubei province, ChinaU.S. Chamber Foundation
Kimberly-Clark and the Kimberly-Clark Foundation5.000UNICEF, International Federation of Red Cross and Red Crescent Societies, American Red CrossU.S. Chamber Foundation
Kotak Mahindra Bank5.000Coronavirus relief efforts in India, India/PM CARES FundForbes
Kuaishou14.459Wuhan, China, municipal governmentKuaishou
Las Vegas Sands Corporation2.500Coronavirus relief effortsU.S. Chamber Foundation
Li Ka Shing Foundation13.000Red Cross Society of ChinaBloomberg (2/10)
Lilly China0.150Red CrossU.S. Chamber Foundation
Lilly Foundation0.250Coronavirus relief efforts in China by Direct Relief and Project HOPEU.S. Chamber Foundation
L’Oreal0.720Coronavirus relief efforts in ChinaU.S. Chamber Foundation
LVMH2.300Coronavirus relief effortsU.S. Chamber Foundation
Lysol2.000CDC FoundationU.S. Chamber Foundation
Mastercard0.300China Development FundU.S. Chamber Foundation
Medtronic/Medtronic Foundation1.500Coronavirus relief effortsU.S. Chamber Foundation
Meituan Public Welfare Foundation28.918Coronavirus relief efforts in ChinaMeituan-Dianping
Melco Resorts & Entertainment2.600Coronavirus relief effortsU.S. Chamber Foundation
Merck1.120WHO, CDC Foundation, Direct Relief, Project HOPE, Given2Asia, Chinese Red Cross FoundationU.S. Chamber Foundation
MGM Resorts International/MGM China Holdings2.500Coronavirus relief effortsU.S. Chamber Foundation
Michael and Susan Dell Foundation80.000Coronavirus relief efforts across the world, other effortsDell Foundation
Micron Foundation0.143Give2Asia for support of frontline health workers and hospitalsU.S. Chamber Foundation
Microsoft0.144Coronavirus relief efforts in Wuhan and Hubei province, ChinaU.S. Chamber Foundation
Midea Group14.375Red Cross Society of Hubei provision, ChinaU.S. Chamber Foundation
Mike Adenuga Foundation4.095Coronavirus relief efforts in NigeriaGuardian Nigeria
Mondelez International/Mondelez International Foundation15.000Coronavirus relief efforts in China and other countries, including the U.S.U.S. Chamber Foundation, Mondelez
Moody’s Corporation0.600WHO, Direct Relief, Medecins Sans Frontiers, Save the Children, Give2Asia, coronavirus relief efforts in U.S.U.S. Chamber Foundation
Morgan Stanley8.500WHO, CDC Foundation, coronavirus relief efforts in Wuhan, China, and elsewhereMorgan Stanley
Muyuan Group/Qin Yinglin and Qian Ying28.918Coronavirus relief efforts in ChinaMuyuan Group
New World Development Group7.000Coronavirus relief efforts in Greater ChinaForbes
New York Life0.450Center for Disaster Philanthropy’s Covid-19 Response Fund, CDC FoundationU.S. Chamber Foundation
Nike3.100WHO, China Youth Development Foundation, community partners across Europe, Middle East and AfricaU.S. Chamber Foundation
PepsiCo Foundation17.000Coronavirus relief efforts in Latin America, Africa, the Middle East, South Asia, Asia Pacific, Australia, New Zealand, and ChinaU.S. Chamber Foundation
Pfizer Foundation0.500Coronavirus relief efforts in China by Direct Relief and Project HOPEU.S. Chamber Foundation
Poul Due Jensen/Grundfos Foundation4.145Emergency relief funding, including for WASH effortsU.S. Chamber Foundation
Procter & Gamble1.144Direct Relief, coronavirus relief efforts in ChinaProcter & Gamble
Prudential Financial1.500UNICEF, Fosun Foundation (China)Prudential
PUBG0.430Chinese Red CrossKorea Herald
Qualcomm1.000WHO, Chinese Red CrossU.S. Chamber Foundation
Ralph Lauren Corporate Foundation10.000WHO, Council of Fashion Designers of America (CFDA) / Vogue Fashion Fund for COVID-19 relief, support for people with cancer, support for employeesU.S. Chamber Foundation
Reliance Foundation66.700Coronavirus relief efforts in IndiaReliance Foundation, Business Insider
S&P Global Foundation2.000UNICEF, Direct Relief, Give2Asia, other nongovernmental organizations (NGOs) focused on supporting food scarcity, medical supplies and broad COVID-19 responseU.S. Chamber Foundation
Salesforce3.000CDC Foundation, San Francisco’s Give2SF Fund,  UCSF’s COVID-19 Response FundU.S. Chamber Foundation
Sawiris Foundation for Social Development6.400Coronavirus relief efforts in EgyptForbes
SC Johnson1.143CDC Foundation, Chinese Red CrossU.S. Chamber Foundation
Semiconductor Manufacturing International Corporation (SMIC)1.429Shanghai Charity Foundation, coronavirus relief efforts in ChinaSMIC
Shimao Property Holdings Ltd3.900Coronavirus relief effortsBloomberg (2/10)
Shiseido1.578Shanghai Charity Foundation, Charity Federation of WuhanShiseido
SJM Holdings Ltd2.500Coronavirus relief efforts in Hubei province, ChinaSJM Holdings
Smilegate Group1.430Chinese authorities to combat the coronavirusSmilegate Foundation
Sony10.000WHO, Medecins Sans Frontieres, UNICEF, UNHCRU.S. Chamber Foundation
Stanley Black & Decker4.000COVID-19 focused nonprofit organizationsU.S. Chamber Foundation
Starbucks0.432Chinese Red Cross FoundationU.S. Chamber Foundation
Start Small LLC/Start Small Foundation ^Up to 1,209.441Global COVID-19 reliefJack Dorsey
Suncity Group3.800Coronavirus relief effortsU.S. Chamber Foundation
Swarovski0.434Coronavirus relief effortsU.S. Chamber Foundation
TE Connectivity/TE Foundation1.175Direct Relief, Americares, Shanghai Charity Federation, identification and production of treatments for COVID-19U.S. Chamber Foundation
Tencent Charity Foundation214.715Fund for coronavirus relief efforts in Hubei province, China, and other affected areas, Tsinghua University Education Foundation, Global Health Drug Discovery InstituteTencent
Texas Instruments0.300China Youth Development FoundationU.S. Chamber Foundation
The Hartford1.000CDC Foundation, Center for Disaster Philanthropy’s COVID-19 Response Fund, other coronavirus relief effortsThe Hartford
Tiffany & Co.0.750WHOU.S. Chamber Foundation
TikTok150.000WHO, CDC Foundation, global coronavirus relief effortsTikTok
Twilio0.500WHOU.S. Chamber Foundation
UBS1.000“Frontline responders” in ChinaU.S. Chamber Foundation
UNICEF National Committee/Canada            0.345UNICEFOCHA
UNICEF National Committee/Denmark            1.449UNICEFOCHA
UNICEF National Committee/Sweden            0.211UNICEFOCHA
Unilever          50.000Global hygiene campaign to help stop the spread of the coronavirusU.S. Chamber Foundation
U.S. Fund for UNICEF            0.366UNICEFOCHA
Vedanta Group          26.500Coronavirus relief efforts in India, India/PM CARES FundForbes
Varian Medical Systems1.000Coronavirus prevention and relief effortsU.S. Chamber Foundation
Verizon7.000Center for Disaster Philanthropy’s COVID-19 Response Fund, Direct Relief, WHOVerizon, Verizon/2
Versace0.143Chinese Red Cross FoundationU.S. Chamber Foundation
Visa10.000Coronavirus relief effortsU.S. Chamber Foundation
Vital Strategies/Resolve to Save Lives0.750WHO for readiness scale-up for COVID-19 in African region and selected countriesOCHA, WHO
Walmart/Walmart Foundation5.000WHOWalmart
WeMade0.143Hubei Charity FederationKorea Herald
Wilbur-Ellis0.100Red Cross, directed to U.S., Canada, and Asia-PacificU.S. Chamber Foundation
Wynn Macau2.500Coronavirus relief effortsU.S. Chamber Foundation
Xilinx1.100WHO, UCSF’s COVID-19 Response Fund, other effortsU.S. Chamber Foundation
Xylem Watermark3.000Coronavirus relief effortsU.S. Chamber Foundation
Zhejiang Geely Holding Group/Li Shufu Public Welfare Foundation28.380Coronavirus relief efforts in Hubei, Guangdong, Zhejiang and Henan provinces, as well as other areas around the ChinaZhejiang Geely Holding Group
NOTES: Amounts may not sum to subtotals/total due to rounding. * Multiple countries contribute to these pooled funding mechanisms. U.N. is United Nations. WHO is World Health Organization. UNICEF is United Nations Children’s Fund. WHO has issued a strategic response plan that enumerates resource needs for global COVID-19 response activities from February through April 2020, focusing largely on those of low- and middle-income countries, and OCHA has issued a global humanitarian response plan that enumerates resource needs for the U.N. coordinated effort to address the needs provided by the COVID-19 pandemic for the most vulnerable. WHO is also reporting funding it has received specifically for WHO activities. A small portion of funding may be donated to U.S. relief, but where included, the amount could not be disaggregated. ^ The value of this funding fluctuates on a daily basis; this was the value on April 22, 2020.

Funding in this table is attributed:

  • to donor governments for novel coronavirus when designated for this purpose, whether provided bilaterally to China or another country, non-profit organizations, or others, or provided multilaterally through a multilateral organization or instrument;
  • to a multilateral organization where that multilateral organization specifically designated general funds for this purpose;
  • to other organizations, such as non-profit organizations, foundations, and businesses, when designated for this purpose.

We did not include funding spent by countries on domestic responses to novel coronavirus, in-kind contributions, matching campaigns, or funding predominantly focused on research. The estimate is a floor, as funding from some donors, particularly private sector companies, is not easily identifiable.

  1. Includes funds to its Rapid Credit Facility that provides zero-interest loans for low-income countries. ↩︎
  2. If additional details become available that show any of this funding will be provided on concessional terms for the health response, this data note and funding totals within it will be updated. ↩︎
  3. Specifically, its International Development Association (IDA) and International Bank for Reconstruction and Development (IBRD). ↩︎

A Look at Online Platforms for Contraceptive and STI Services during the COVID-19 Pandemic

Published: Apr 23, 2020

Introduction

As the nation grapples with the onslaught of COVID-19 cases, basic needs for contraceptive services and supplies have not diminished. Most family planning clinics and health centers remain open because they are considered essential health providers, but some have had to scale back staff or hours. Many clinics are looking to telemedicine services to find ways to ensure patients continue to have access to contraception and STI services. There has been a proliferation of online services in recent years that seek to offer individuals that cannot make it to a clinic or do not have an established source of care access to some contraceptive methods and STI testing through a telemedicine platform, usually a website or a smartphone application. This data note provides an overview of options available for the online management of sexual and reproductive health services during the current global pandemic and discusses the opportunities and limitations of these platforms in terms of availability and cost.

Family Planning Clinics

Providers and clinicians are still the front lines for provision of family planning services for most individuals. The majority of clinics remain open as essential health care providers and are still serving patients for family planning and STI services. Many clinics are now using telehealth services or are quickly working to implement telehealth as a way to continue providing contraceptive care without the need for an office visit. Individuals who are able can still contact their usual provider for contraceptive refills and receive their prescriptions through their provider or a local pharmacy, which may have home delivery or drive-through pick up options. When possible, clinics are providing a 12-month supply of contraceptive methods, prescribing Depo-SubQ Provera 104 for self-injection of Depo shots which can be administered at home, and using quick start protocols for all methods to begin contraception on the day of the visit rather than wait until the next period to initiate a new method, removing the need for subsequent visits. These services are still available without cost sharing for those covered by Medicaid or private insurance, and on a sliding fee scale for low-income and uninsured people seeking care at Title X-supported family planning clinics, Planned Parenthood clinics, and Federally Qualified Health Centers.

Because of staffing shortages or concerns about infection, however, some clinics and providers have been forced to reduce hours and limit in-person visits to patients with urgent needs. Some sites may also limit services that require specific staff (with specialized training) or personal protective equipment, such as long-acting reversible contraceptive (LARC) insertions and removals.

Online Platforms for Contraception

For individuals who cannot leave their home or get their method through their usual provider or pharmacy, an increasing number of online telemedicine platforms are available for obtaining hormonal contraceptives (the pill, patch, ring, and emergency contraception) outside of traditional health care settings. Most online platforms determine a client’s eligibility and prescribe contraception in a similar manner to a clinic. Using an online questionnaire or video consultation, the provider determines a patient’s medical eligibility for contraception by obtaining their health history, including a recent blood pressure reading, and evaluating potential risk factors including history of stroke, liver or gallbladder problems, a recent pregnancy, current breastfeeding and smoking status. After assessing the patient’s medical history and contraceptive preferences, the patient is either mailed their contraceptives or their prescription is sent to a nearby pharmacy for pick-up. Most platforms will send one to three packs of pills at a time, with a few offering six to twelve packs per delivery. In addition to the cost of the contraception, many online platforms charge a consultation fee or yearly membership that ranges from $15 to $99 and typically covers the medical evaluation and customer support for the duration of the prescription. This fee is not usually billed to or covered by insurance and is instead paid out-of-pocket by the patient.

Some companies can only prescribe to individuals in certain states, though they may be able to mail contraceptives to people who already have a prescription. For instance, Pandia Health will deliver to all 50 states, but can only currently prescribe in California, Florida, and Texas; while The Pill Club can prescribe in 37 states and DC, and delivers to all 50 states. Many of these platforms require individuals to be at least 18 years old, but some provide services to younger people with parental consent.

There is considerable variation in contraceptive costs, method availability, and Medicaid and private insurance acceptance by vendor (Table 1). The price of contraception offered by these platforms varies by method and by brand. While some online platforms accept private insurance, the majority do not accept Medicaid, which may limit low-income women’s access to these services. While most offer low-cost generic contraceptives, the cost of contraceptives on platforms that do not accept insurance can range from $10 to $225 a month, which can be unaffordable for many individuals.

It is important to note that these services and methods are covered at no cost for people covered by Medicaid or most private insurance or on a sliding fee scale at a Title X clinic, Planned Parenthood, or Federally Qualified Health Center for uninsured people. Emergency contraception is available over the counter, but is also available through many of these platforms for a similar price ($20-$45). AfterPill is an online platform that specializes in emergency contraception and charges $25/pill or $65 for three pills. For faster shipping, AfterPill can be purchased through Amazon Prime.

Online Platforms for STI Testing

In addition to contraception, some of these platforms provide at-home sexually transmitted infection (STI) testing. Some platforms require a virtual consultation and charge a fee, but most allow the individual to purchase an STI test or testing kit with multiple STI tests without a consultation. STI testing kits have options for genital, oral, and rectal chlamydia and gonorrhea testing, as well as syphilis, HIV, and trichomoniasis testing. Depending on the type of kit, individuals collect either urine samples, finger prick blood samples, or vaginal, rectal, or oral swabs, and mail them back for testing. Rather than providing at-home test kits, some entities, like Lemonaid and STDcheck.com, will order lab tests and individuals can get tested at a local clinic or lab.

If the test results are positive, a medical provider will either contact the individual or the individual can schedule a telemedicine physician consultation to discuss treatment options. Many will prescribe treatment for chlamydia, gonorrhea, trichomoniasis, and herpes simplex virus 2 that can be picked up at a local pharmacy. The physician consultation is usually provided at no additional cost, but the cost of the treatment depends on an individual’s insurance. STDcheck.com charges $95 for a physician consultation and written prescription for treatment. They will also provide a prescription for an individual’s partner for an additional $95. Lemonaid also charges a separate visit fee to assess the individual for treatment that is not included in the price of the test. Most online platforms offering STI testing do not state whether they offer expedited partner therapy (EPT). EPT is when a provider prescribes treatment for the sex partner(s) of the diagnosed patient, without first examining the partner(s). EPT is typically used in cases of chlamydia or gonorrhea, and sometimes trichomoniasis, in order to prevent reinfection by the same sex partner(s). EPT helps ensure a patient’s partner receives treatment and is a best practice in clinical settings, but many of these online platforms require an individual’s partner to set up their own account and purchase their own testing kit, which is not EPT.

These at-home tests and test kits can range in cost from $39 to $522 (Table 1). Many platforms do not accept private insurance or Medicaid, which can make this service cost prohibitive for many people. Nurx is the only platform offering at-home STI testing that accepts Medicaid, but only in California, Illinois, and Texas. The cost of their STI testing kits ranges from $75 for individuals with insurance coverage to $150 to $220 for individuals who are uninsured. Alpha Medical, PlushCare, and Virtuwell also accept private insurance, but not Medicaid. Alpha Medical, PlushCare, and Virtuwell all require a consultation fee and provide online primary care, offering more than just at-home STI testing. Usually, the most affordable way to get STI testing and treatment is to use private insurance or Medicaid at a clinic and under the ACA some STI screenings are covered without cost-sharing. Low-income and uninsured individuals can also go to a Title X clinic, a Federally Qualified Health Center, or a public health department for no-cost or low-cost testing based on a sliding fee scale, but this may be challenging when services are scaled back and travel options limited.

Opportunities and Limitations for Online Platforms

While these online platforms may offer convenience and the ability to stay home, there are tradeoffs to consider. One significant limitation is affordability. The majority of online platforms do not accept insurance or Medicaid and do not offer sliding fee scale options for uninsured individuals. In 2018, 59% of women of reproductive age (15-49) had employer-sponsored insurance coverage, 19% had Medicaid coverage, and 12% were uninsured. Most women with insurance coverage can access contraceptives at low to no cost. The Affordable Care Act requires most private health insurance plans to cover at least one form of each of the 18 FDA-approved contraceptive methods for women as prescribed without cost-sharing, and Medicaid programs are also required to cover family planning services with no cost sharing. The relatively high cost of some contraceptives available on online platforms can put them out of reach for many low-income women. In 2018, 21% of low-income women were uninsured, 42% had Medicaid coverage, and 28% had employer-sponsored coverage.

While most hormonal contraceptive methods are available through these online platforms, some of the longer-acting, most effective methods such as IUDs and contraceptive implants still require a visit to a clinic for insertion. The same is true for most DMPA contraceptive injections. Only Nurx offers the Depo-SubQ Provera 104 injection, which is developed for self-administration, at $285/shot. Other limitations include limited availability of certain brands, age restrictions for teens, and the need for a credit or debit card for payment.

While these platforms may be an attractive option for some to secure prescription contraceptive methods and STI services during the COVID-19 outbreak without leaving home, family planning providers are ramping up their telemedicine practices to make these methods available and affordable to their teen and adult clients. Unless individuals find a platform that accepts their insurance or Medicaid, they can expect to spend considerably more for contraceptive services and STI treatment than they would have if they sought care from a provider that accepts private insurance or Medicaid or participates in a family planning clinic or health center that receives federal funding to provide care. While these online platforms offer great potential to expand access to prescription contraceptive methods and STI testing, cost will continue to be a barrier for consumers until the services broaden their participation in Medicaid and private insurance so that women can receive no-cost coverage just like they do when they obtain services and supplies in clinical settings.

News Release

Online Contraceptive and STI Services During COVID-19: What are the options?

Published: Apr 23, 2020

A new KFF issue brief provides an overview of online options for contraceptive and STI services during the COVID-19 pandemic. This resource also includes an interactive table that shows which platforms are available in each state and which accept private insurance or Medicaid.

The majority of traditional family planning clinics are still open for in-person care or are moving to telehealth services – but some clinics and providers have reduced hours and limited in-person visits to patients with urgent needs only. There are dozens of online platforms for contraception and STI management, which offer an alternative for obtaining care as clinics face staffing shortages and take measures to scale back in-person visits to reduce the risk of coronavirus transmission.

While they may offer access to contraception through a phone app or online platform, there are significant limitations – especially when it comes to affordability and coverage.  Many online platforms do not accept insurance or Medicaid and do not offer sliding fee scale options for the uninsured. Unless individuals can find a platform that accepts their insurance or Medicaid, they can expect to pay considerably more for contraceptive services and STI treatment than they would for care obtained in clinical settings, which is typically covered without cost-sharing.

News Release

Interactive Maps Highlight Urban-Rural Differences in Hospital Bed Capacity

Rural Areas Have Fewer ICU Beds and Populations at Greater Risk for COVID-19 Complications

Published: Apr 23, 2020

As the U.S. coronavirus outbreak spreads beyond densely populated metropolitan areas, a new KFF analysis finds that rural areas typically have fewer intensive care hospital resources than their urban counterparts, and populations at greater risk of developing serious illness and complications from COVID-19.

While metro and non-metro areas have similar numbers of hospital beds per capita (23.5 vs 23.8 beds per 10,000 people), non-metro areas have fewer intensive care (ICU) beds – about 1.7 per 10,000 people, compared to 2.8 in urban areas. When adjusted for age, non-metro areas have only 1.6 ICU beds per 10,000 age-adjusted population, compared to 2.9 ICU beds in metro areas. Since older adults with COVID-19 are both more likely to require hospitalization and more likely to require intensive care while hospitalized, outbreaks in rural communities could strain the already limited capacity of their health systems.

The analysis includes interactive maps that enable users to explore estimates of hospital bed capacity by area, and to adjust those estimates based on the age of the population.

On average, residents of rural areas tend to be older and sicker than people who live in urban areas. 20% of people living in non-metro areas are age 65 or older, and 26% of residents under age 65 have health conditions that put them at a higher risk of developing serious COVID-19 complications. Many may already face challenges accessing health care services due to factors like provider shortages and longer travel times to reach hospitals.

The analysis is part of the Peterson-KFF Health System Tracker, an online information hub dedicated to monitoring and assessing the performance of the U.S. health system. For more data, analysis, polling and journalism on the COVID-19 pandemic, visit our special resource page on kff.org.