KFF designs, conducts and analyzes original public opinion and survey research on Americans’ attitudes, knowledge, and experiences with the health care system to help amplify the public’s voice in major national debates.
More recent data on COVID-19 in rural America is available here.
While the earliest cases of coronavirus in the United States were reported primarily in urban areas, which still remain hardest hit, there is increasing concern about the impact of the pandemic in rural America. To the extent that rural areas face an increasing impact, they could experience particular challenges given their relative lack of hospital capacity, older average age, and higher shares of their populations with underlying health conditions.
In this analysis, we compare coronavirus cases and deaths in metropolitan and non-metropolitan counties in the United States. We find that while metro counties still have significantly higher cases and deaths per capita, non-metro counties are experiencing faster growth rates, potentially signaling challenges ahead. Some counties with the highest rates of cases and deaths are located in Georgia, where the state has moved to significantly ease social distancing measures.
Differences in Coronavirus Cases and Deaths in Metro and Non-Metro Counties
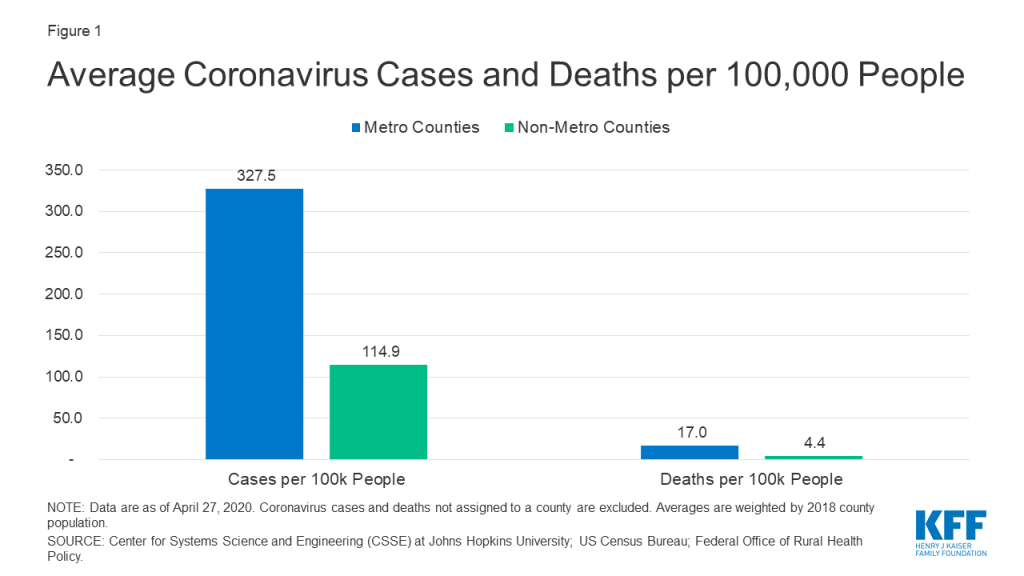
In the United States, about 86% of the population lives in more densely populated metro counties, while 14% lives in non-metro (largely rural) counties. Even adjusting for population size, metro counties have nearly three times as many confirmed coronavirus cases as non-metropolitan counties, and nearly four times as many deaths from COVID-19 as of April 27 (Figure 1), similar to findings in other recent analyses. The general pattern holds true whether we include counties in or around New York City, which has seen the largest number of infections and deaths in the country.
Figure 1: Average Coronavirus Cases and Deaths per 100,000 People
The death rate (COVID-19 deaths per confirmed coronavirus case) is only slightly higher in metro compared to non-metro counties (4.2% compared to 3.8%), meaning that differences in deaths are largely due to differences in infection rates.
The county with the most cases per capita (Lincoln County, Arkansas) is a metro county, while the county with the most deaths per capita (Randolph County, Georgia) is a non-metro county (Table 1).
Table 1: Top Counties by Coronavirus Cases and Deaths (as of April 27)
County
Cases per 100k People
Deaths per 100k People
Top 5 Metro Counties by Cases per 100k People
Lincoln County, Arkansas*
5,634
0
Rockland County, New York
3,490
148
Pickaway County, Ohio
2,923
9
Westchester County, New York
2,894
99
Nassau County, New York
2,567
119
Top 5 Metro Counties by Deaths per 100k People
Terrell County, Georgia
1,939
209
Bronx County, New York
2,472
177
Queens County, New York
2,123
157
St. John the Baptist County, Louisiana
1,739
148
Rockland County, New York
3,490
148
Top 5 Non-Metro Counties by Cases per 100k People
Bledsoe County, Tennessee*
3,985
0
Marion County, Ohio
3,353
6
Cass County, Indiana
2,701
3
Louisa County, Iowa
2,391
18
Randolph County, Georgia
2,283
278
Top 5 Non-Metro Counties by Deaths per 100k People
Randolph County, Georgia
2,283
278
Early County, Georgia
1,971
146
Mitchell County, Georgia
1,320
126
Toole County, Montana
598
124
Greer County, Oklahoma
1,099
103
* High case rates per 100,000 reflect recent testing increases in prisons in these counties.
The map below shows the per capita number of coronavirus cases and deaths across metro and non-metro counties.
–
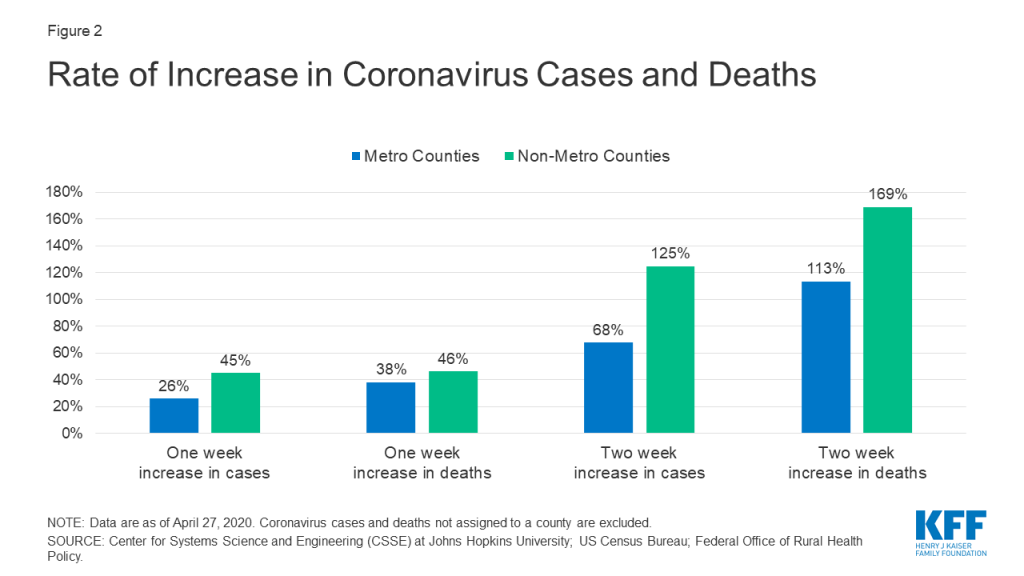
While non-metro areas currently have fewer coronavirus cases per capita, both cases and deaths are growing at a faster rate compared to metro counties (Figure 2). In the two-week period between April 13 and April 27, non-metro counties saw a 125% increase in coronavirus cases (from 51 cases per 100,000 people to 115), on average, and a 169% increase in deaths (from 1.6 deaths per 100,000 people to 4.4). Meanwhile, metro counties saw a 68% increase in cases (from 195 cases per 100,000 people to 328) and a 113% increase in deaths (from 8.0 deaths per 100,000 people to 17.0).
Figure 2: Rate of Increase in Coronavirus Cases and Deaths
Discussion
Less densely populated rural areas initially saw slower spread of the new coronavirus, and both cases and deaths remain lower in non-metro areas than metro areas. However, there are troubling signs that the rates of growth in both cases and deaths are increasing more rapidly in rural areas, where the population tends to be older, younger people are more likely to have-risk health conditions, and hospitals have fewer ICU beds per capita.
Due to concerns over the economic effects of stay-at-home orders, some states have started to ease social distancing measures previously put in place. For example, Georgia has started to reopen certain businesses and allow limited dine-in at restaurants, despite some of its counties rising toward the top of this list of U.S. metro and non-metro counties with the highest numbers of COVID-19 deaths per capita. Similarly, Oklahoma and Montana have also begun easing restrictions, despite each having a county among the top five for non-metro COVID-19 deaths per capita. The findings presented here suggest that there may be particular challenges in these states and others, given recent case and death trends in their rural counties.
Methods
Data are current as of April 27, 2020.
We used the Federal Office of Rural Health Policy definitions of metro and non-metro counties, and then compared their reported case and death rates, as well as recent changes in cases and deaths.
This analysis does not include up to 6,971 confirmed COVID-19 cases and 503 COVID-19 deaths for which an associated county cannot be identified.
Medicaid covers 70 million Americans, many with chronic conditions who may be at increased risk for COVID-19. Medicaid beneficiaries, particularly those with chronic conditions, will need access to medications even during social distancing and their ability to meet with providers to obtain refills may be hindered. States are updating policies to allow beneficiaries to access medications during this public health emergency. States can allow beneficiaries to have more of their medication on hand and reduce the barriers to receiving medication by eliminating cost sharing, changing administrative requirements and reducing the need for in-person contact by encouraging mail delivery or eliminating signatures.
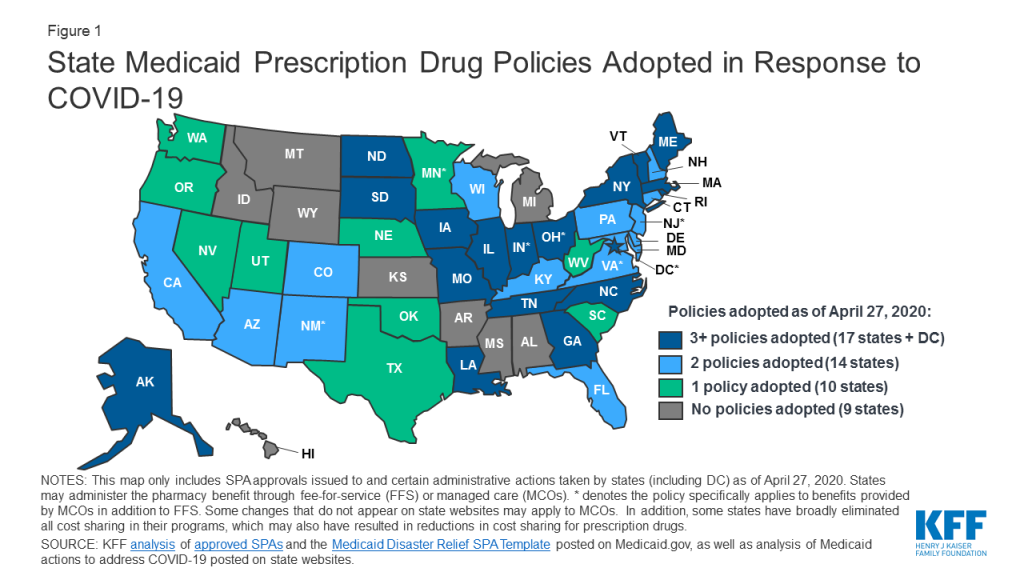
States can use many of the toolstraditionally used to manage prescription drug utilization to increase beneficiary access to medications during an emergency, like COVID-19. These tools include prior authorization (PA) requirements, use of preferred drug lists (PDLs), quantity limits and restrictions on refill frequency. States have flexibility in how they administer their programs and can make a number of changes without the need for approval from CMS. We are tracking state changes to the pharmacy benefit in response to COVID-19 on our SPA and Other Administrative Actions Tracker (Figure 1). We also just posted a comprehensive surveyof how states administer the Medicaid pharmacy benefit, which can serve as benchmark going forward.
Figure 1: State Medicaid Prescription Drug Policies Adopted in Response to COVID-19
Most of the changes states are making apply to the fee-for-service (FFS) benefit but some apply more broadly to managed care plans as well and are noted as such in the tracker. In response to COVID-19, states are:
Relaxing restrictions on quantity limits. Quantity limits set the amount of a particular prescription that a beneficiary can have on hand as well as the total number of prescriptions they can access in a month without PA. Most states are allowing beneficiaries to have up to a 90 day supply of maintenance medications. Other states are lifting any limits on the number of drugs a beneficiary can receive at one time or increasing the amount of emergency medication supply allowed. Thirty-two states have either increased quantity amounts or reduced limits on prescriptions.
Allowing early refills. States typically set a certain percentage of the medication that must be used before a refill is allowed but many are relaxing these limits and allowing beneficiaries to refill their prescriptions sooner. So far at least thirty-three states have taken action to relax policies around refills.
Suspending prior authorization. Prior authorization requires prescribers to obtain approval from the state Medicaid agency before a particular drug can be dispensed. At least nineteen states are suspending prior authorization requirements for specific drugs or extending prior authorization for drugs that have already been authorized. Eleven states have changed the status of certain drugs to “preferred” on their PDLs, like asthma medications, which make them easier for beneficiaries to access. At least five states have eliminated cost-sharing specifically for medications (others have eliminated cost-sharing more broadly in Medicaid).
Increasing mail delivery. To assist beneficiaries with social distancing and those in quarantine, states are encouraging mail delivery and relaxing restrictions for delivery. At least eight states have eliminated the need for a signature to show receipt of a prescription.
Our pharmacy benefits survey reports on state management of the pharmacy benefit prior to the COVID-19 emergency, providing context for state policy changes. According to our survey, 46 states maintain a PDL of outpatient prescription drugs, which is a list of drugs states encourage providers to prescribe over others. Prior authorization is also widely used: forty-six states reported that new drugs are “always” or “sometimes” subject to prior authorization. Thirteen states set limits on prescription amounts and total number of prescriptions a beneficiary can have on hand. States may also charge nominal cost-sharing; 37 states require pharmacy copayments for certain adults. Because states can operate prescription drug programs in fee-for-service (FFS) or managed care, rules and policies may differ based on how the state administers their program – in some cases MCOs must follow rules set by the state for FFS, but in other states MCOs may have more flexibility to manage most of the prescription drug program and assume the risk. Thirty-five states carve prescription drugs into managed care.
State pharmacy benefit decisions will be important to watch going forward as cases of COVID-19 grow and impact more communities across the US. Medicaid will be a major source of health coverage as individuals lose income and become unemployed. For current and any new enrollees, ensuring access to prescription drugs will be important to manage on-going chronic conditions, particularly as the health system is strained dealing with COVID-19. We are continuing to update our tracker with the latest information from states and are watching for federal policy and legislative changes.
Medicaid provides health coverage for millions of Americans, including many with substantial health needs who rely on Medicaid drug coverage for both acute problems and for managing ongoing chronic or disabling conditions. Though the pharmacy benefit is a state option, all states provide pharmacy benefit coverage. States administer the benefit in different ways but within federal guidelines regarding, for example, pricing, utilization management, and rebates. Due to federally required rebates, Medicaid pays substantially lower net prices for drugs than Medicare or private insurers. After a sharp spike in 2014 due to specialty drug costs and coverage expansion under the Affordable Care Act (ACA), Medicaid drug spending growth has slowed, similar to the overall US pattern; however, state policymakers remain concerned about Medicaid prescription drug spending as spending is expected to grow in future years. Due to Medicaid’s role in financing coverage for high-need populations, it pays for a disproportionate share of some high-cost specialty drugs. In addition, Medicaid is required to cover the “blockbuster” drugs increasingly entering the market as a result of the structure of the pharmacy benefit. Policymakers’ actions to control drug spending have implications for beneficiaries’ access to needed prescription drugs.
To better understand how the Medicaid pharmacy benefit is administered across the states, KFF and Health Management Associates conducted a survey of all 50 states and the District of Columbia (DC) in 2019. Highlights from the full survey are below (ES Figure 1).
Figure ES-1: Medicaid pharmacy policy areas and key issues to watch based on findings from a 50-state survey
What entities play a role in administering Medicaid pharmacy benefits?
States may administer the Medicaid pharmacy benefit on their own or may contract out one or more functions to other parties. The administration of the pharmacy benefit has evolved over time to include delivery through managed care organizations (MCOs) and increased reliance on pharmacy benefit managers (PBMs). In addition, drug utilization review (DUR) boards and pharmacy and therapeutics (P&T) committees play oversight and administrative roles in Medicaid pharmacy benefits.
All but one state reported outsourcing some or all functions to one or more vendors as of July 1, 2019. The most commonly outsourced functions reported were claims payment, utilization management, and drug utilization review. Of the 44 states that reported outsourcing the claims payment function, 23 reported that their fiscal intermediary processes pharmacy claims.
States are exploring pharmacy policy reforms to adapt to the growth in managed care and the growing role of pharmacy benefit managers (PBMs). States reported enacting or considering policy changes such as drug carve-outs, PBM pass-through pricing, and transparency reporting requirements. While most states that contract with MCOs reported that the pharmacy benefit was carved in to managed care coverage, two states reported plans to carve out the pharmacy benefit in FY 2020, one state has announced that a carve-out would be effective in FY 2021, and other states reported carve-outs were under consideration. Fifteen states also reported carving out one or more drugs or drug classes, often as part of a fiscal risk mitigation strategy.
States are taking action to prevent or monitor spread pricing within MCO-PBM contracts. State use of external vendors for administering the pharmacy benefit, particularly the use of pharmacy benefit managers (PBMs), has generated considerable policy debate about costs and prices in Medicaid, particularly as it relates to oversight and regulation. Spread pricing refers to the difference between the payment the PBM receives from the MCO and the reimbursement amount it pays to the pharmacy. In the absence of oversight, some PBMs have been able to keep this “spread” as profit. As of July 1, 2019, 11 MCO states prohibited PBM spread pricing and five states reported plans to eliminate spread pricing in FY 2020. One state also reported that a spread pricing prohibition would take effect in January 2021. Twenty-six MCO states also reported they will have transparency reporting requirements in place in FY 2020.
How are states managing use and cost in their programs?
Managing the Medicaid prescription drug benefit and pharmacy expenditures remains a policy priority for state Medicaid programs, and state policymakers remain concerned about Medicaid prescription drug spending growth. Because state Medicaid programs are required to cover all drugs from manufacturers that have entered into a federal rebate agreement (in both managed care and FFS settings), states cannot limit the scope of covered drugs to control drug costs. Instead, states use an array of payment strategies and utilization controls to manage pharmacy expenditures.
Most states (46 of 50 reporting states) reported having a preferred drug list (PDL) in place for fee-for-service (FFS) prescriptions as of July 1, 2019. PDLs allow states to drive the use of lower cost drugs and offers incentives for providers to prescribe preferred drugs. In recent years, a growing number of MCO states have adopted uniform PDLs requiring all MCOs to cover the same drugs as the state. Sixteen MCO states reported having a uniform PDL for some or all classes and eight states plans to establish or expand a uniform PDL in FY 2020.
Most states reported that prior authorization (PA) was always (16 states) or sometimes (30 states) imposed on new drugs. Over two-thirds of the responding states (35) report reviewing comparative effectiveness studies when determining coverage criteria, and the vast majority of responding states (45 of 50) require biosimilar drugs to undergo the same review process as other drugs. While states often impose PA on high-cost specialty or non-preferred drugs, a number of states have legislation protecting drug classes or categories from the use of these tools in some or all circumstances.
How are states addressing payment for prescription drugs?
Medicaid payments for prescription drugs are determined by a complex set of policies at both the federal and state levels that draw on price benchmarks to set both ingredient costs and determine rebates under the federal Medicaid drug rebate program (MDRP). States set policies on dispensing fees paid to pharmacies and beneficiary cost-sharing within federal guidelines, while federal regulations guide payment levels for ingredient costs. The final cost to Medicaid is then offset by any rebates received under the federal MDRP. In addition, states or managed care plans may negotiate with manufacturers for supplemental rebates on prescription drugs or form multi-state purchasing pools when negotiating supplemental Medicaid rebates to increase their negotiating power.
Forty-six states report negotiating for supplemental rebates in addition to federal statutory rebates. Approximately two-thirds of these states (30 states) have entered into a multi-state purchasing pool to enhance their negotiating leverage and collections.
A small, but growing number of states are employing alternative payment methods to increase supplemental rebates through value-based arrangements (VBAs) negotiated with individual pharmaceutical manufacturers. States are pursuing these alternative payment methods as a response to high-cost, breakthrough therapies. Two states reported having a VBA in place as of July 1, 2019 and an additional eight states reported plans to submit a VBA State Plan Amendment to CMS or implement a VBA in FY 2020.
States reported a variety of strategies to avoid receiving duplicate discounts on 340B drugs dispensed by safety net providers. The 340B program offers discounted drugs to certain safety net providers that serve vulnerable or underserved populations, including Medicaid beneficiaries. States cannot receive Medicaid rebates for drugs acquired through the 340B program. Strategies to avoid duplicate discounts include relying on the Medicaid exclusion file, prohibiting contract pharmacies and using claims indicators.
States reported continued challenges related to new, expensive breakthrough drugs, particularly those approved on an accelerated pathway. More than two-thirds of the responding states reported that developing policies and strategies related to new high-cost therapies was a top priority. Because of the structure of the MDRP, states are required to cover all drugs approved by the FDA, even if the drug demonstrates limited clinical efficacy.
Looking ahead
States’ management of the pharmacy benefit in FYs 2019 and 2020 reflects efforts to respond to an increasingly changing prescription drug landscape within the flexibility of federal guidelines. Drug pricing has been prominent in national policy debates and lawmakers at both the state and federal levels continue to show interest in efforts to control costs that may have implications for the Medicaid program.
Federal prescription drug policy changes have implications for states. States reported concerns related to enacted legislation such as the SUPPORT and 21st Century Cures Acts as well as monitoring proposed federal statutory and regulatory efforts related to drug pricing, drug reimportation, gene and cell therapies, and PBM contracting reforms. Some federal efforts propose policy changes to Medicaid while others focus on Medicare and commercial insurance but may have implications for Medicaid.
States continue to explore MCO pharmacy policy reforms and view them as a high priority. State priorities include a focus on increasing oversight, implementing uniform PDLs and improving data collection related to managed care.
States remain concerned about prescription drug spending growth and continue to explore policies to ensure fiscal sustainability. States reported developing PA policies for gene and cell therapies, exploring value-based arrangements, and carving out high-cost drugs from managed care.
Report: Introduction
Medicaid provides health coverage for millions of Americans, including many with substantial health needs who rely on Medicaid drug coverage for both acute problems and for managing ongoing chronic or disabling conditions. (Medicaid beneficiaries who also have Medicare receive drug coverage through Medicare). Though optional, all states provide pharmacy benefit coverage and administer the benefit in different ways within federal guidelines regarding, for example, pricing and rebates. To better understand how the Medicaid pharmacy benefit is administered across the states, KFF and Health Management Associates conducted a survey of all 50 states and the District of Columbia (DC) in 2019. The survey was designed to capture information on state policies and strategies for managing the pharmacy benefit as well as planned changes for FY 2020 and future priorities and challenges.
Methods
Report findings are drawn from a survey of Medicaid officials in all 50 states and the District of Columbia conducted by KFF and Health Management Associates (HMA). The survey was conducted from June through December 2019 via a survey sent to each state Medicaid director in June 2019. The survey instrument is included as an appendix to this report. The District of Columbia is counted as a state for the purposes of this report; the counts of state policies or policy actions that are interspersed throughout this report include survey responses from 50 states (including DC). Utah did not respond. This report examines Medicaid pharmacy policies in place or implemented in FY 2019, policy changes implemented at the beginning of FY 2020, and policy changes for which a definite decision has been made to implement in FY 2020 (which began for most states on July 1, 2019). Policies adopted for the upcoming year are occasionally delayed or not implemented for reasons related to legal, fiscal, administrative, systems, or political considerations, or due to delays in approval from CMS.
Report: Pharmacy Benefit Administration
What entities are responsible for administering the Medicaid drug benefit?
States may administer the Medicaid pharmacy benefit on their own or may contract out one or more functions to other parties. The administration of the pharmacy benefit has evolved over time to include delivery through managed care (MCOs) and more reliance on pharmacy benefit managers (PBMs). In addition, drug utilization review (DUR) boards and pharmacy and therapeutics (P&T) committees play an oversight and administrative role in Medicaid pharmacy benefits. State contracts with MCOs, PBMs, or other vendors may have important implications for Medicaid enrollees and providers who are sometimes challenged by the administrative processes they must navigate to access or be reimbursed for medically necessary drugs. MCO subcontracts with PBMs are also under increasing scrutiny as more states recognize a need for more stringent oversight and management of these subcontract arrangements.
Managed Care’s Role in Administering Pharmacy Benefits
Managed care plans play a major role in administering Medicaid pharmacy benefits, with a majority of states using comprehensive managed care arrangements that include prescription drugs as a covered benefit. As of July 1, 2019, 40 states had comprehensive, risk-based contracts with one or more managed care organization (MCOs).1 States with MCOs may opt to “carve in” the pharmacy benefit by including it as a covered benefit and placing the MCO at risk for costs, “carve out” the pharmacy benefit by excluding it from the MCO contract and covering drugs in FFS, or carve in some drugs and carve out others. Changes made to the rebate program by the Affordable Care Act (ACA) have encouraged more states to carve in the pharmacy benefit, allowing states to increase budget predictability and leave the MCO accountable for drug costs.2,3 States that include pharmacy as an MCO-covered benefit may also build administrative and clinical pharmacy requirements into the MCO contract, as discussed in more detail later in this report.
Carve-out vs. Carve-in of the Pharmacy Benefit
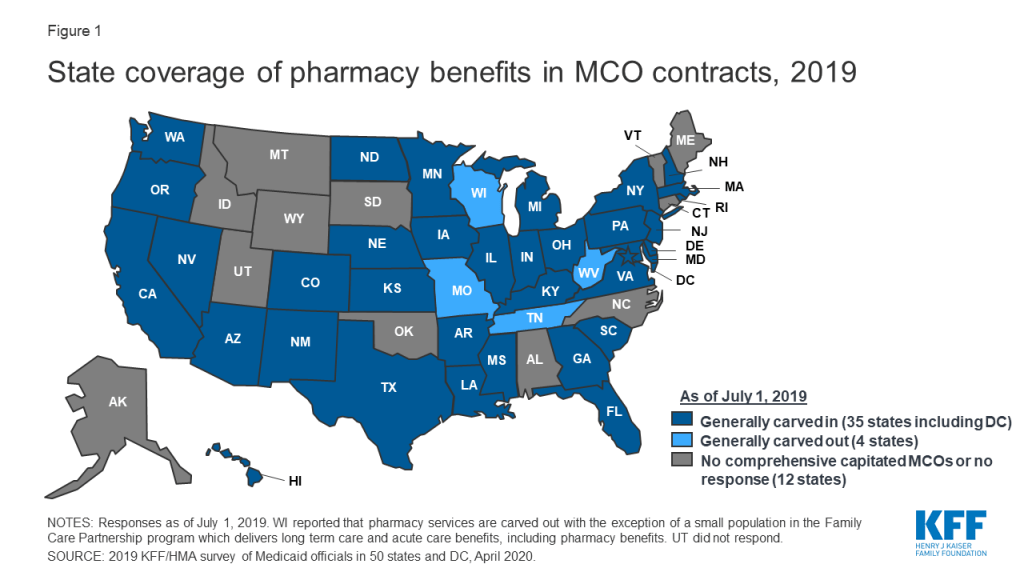
In general, carving the pharmacy benefit into the MCO benefit remains the prevalent approach for managing the prescription drug program for MCO enrollees. Of the 39 MCO states that responded to this survey question, only four states – Missouri, Tennessee, West Virginia, and Wisconsin4 – reported that pharmacy benefits were generally carved out (with possible exceptions) as of July 1, 2019, while the remaining 35 states reported that pharmacy benefits were generally carved in (Figure 1).
Figure 1: State coverage of pharmacy benefits in MCO contracts, 2019
However, more states are making or considering carve-out changes. Two states reported planned changes for 2020: North Dakota intends to carve out the pharmacy benefit in 2020 and Wisconsin reported plans to carve the pharmacy benefit out of its Family Care Partnership MCO contracts (serving a small number of frail elderly and persons with disabilities) resulting in a full carve-out. Several other states reported that potential FY 2020 changes were “undetermined” or that pharmacy benefit delivery system options were currently under review. Illustrating the dynamic nature of this area, in the period since the survey was originally issued, California issued an RFP for a carve-out of its pharmacy benefit, to be effective January 1, 2021,5 and the Michigan Department of Health and Human Services announced its intent to carve out the pharmacy benefit.6
States are more likely to carve out certain subsets of drugs than to carve out the full benefit. We asked states about their use of carve-outs for certain high-cost drug groups/classes: 15 states report carving out one or more of these classes (Table 1 and Appendix Table 1). Of those states, 12 (California, DC, Iowa, Indiana, Maryland, Michigan, Mississippi, New Hampshire, Ohio, Oregon, South Carolina, Washington) report using the class carve-outs as part of a risk mitigation strategy, as discussed in more detail below.
Table 1: Drug Classes Carved Out of MCO Benefit, July 1, 2019
Drug Class
# of States
States(35 MCO Carve-in States Responding)
Hemophilia
9
AZ, CA, FL, IN, MI, MS, NH, NJ, WA
Hepatitis C
4
IN, MI, SC, WA
HIV/AIDS
4
CA, DC, MD, MI
Mental Health
4
CA, MD, MI, OR
Medication Assisted Therapy
3
CA, MD, MI
Oncology
1
MI*
Other
8
AZ, IA, IN, MD, NH, OH, TX, WA
NOTES: *MI reported it carves out select oncology drugs but not the entire class.SOURCE: 2019 KFF and Health Management Associates (HMA) survey of Medicaid officials in 50 states and DC, April 2020.
States are planning additional drug carve-outs for specialty or “blockbuster” drugs. For FY 2020, three states (North Dakota, Nevada, and Washington) reported plans to carve out additional drugs (with North Dakota intending to carve out the full pharmacy benefit), and Maryland reported plans to implement both carve-in and carve-out strategies. The most commonly mentioned drugs carved out or considered for carve-out strategies are Zolgensma and Spinraza, gene therapy treatments for spinal muscular atrophy. Other agents mentioned include CAR-T therapies,7 cystic fibrosis, and muscular dystrophy drugs. Washington indicated it will take a drug-specific approach to new carve-outs, reviewing specifically for impacts to the actuarial soundness of rates or for the likelihood that the financial impact of the new drug will not be spread equally across Medicaid plans. While carving specialty drugs out of the pharmacy benefit is a more common strategy, two states reported an intention to carve drugs back into the managed care benefit in FY 2020: Maryland will carve in HIV/AIDS drugs and Michigan will carve in hemophilia and oncology drugs and select drugs used to treat rare metabolic diseases.
Risk Mitigation Strategies
States that use MCOs to deliver some or all pharmacy benefits to Medicaid enrollees may use risk mitigation strategies to curb plans’ financial risk. As of July 1, 2019, states reported deploying a variety of financial risk mitigation strategies in their MCO contracts, with drug carve-outs and risk corridors being the most common (Table 2). For drug carve-outs, hepatitis C and hemophilia drugs were those most commonly mentioned among states with risk mitigation strategies in place. Six states reported planned changes for FY 2020: Maryland, Nevada, and Washington are carving out additional drugs; Kansas is implementing different reimbursement methods for high-cost drugs; Ohio is removing the hepatitis C risk pool in 20208 ; and Michigan reported a plan to implement high-cost drug kick payments for certain drugs being carved in as of October 1, 2019.
Table 2: Risk Mitigation Strategies used in MCO Pharmacy Contracts, July 1, 2019
Strategy
# of States
States (35 MCO Carve-in States Responding)
Drug Carve-outs
12
CA, DC, IA, IN, MD, MI, MS, NH, OH, OR, SC, WA
Risk Corridors
10
AZ, HI, KY, LA, MA, NE, NJ, NV, OR, RI
Kick Payments
4
CA, KS, MD, MI
Risk Pools
4
DE, FL, NE, OH
Reinsurance
3
AZ, NV, VA
Other
2
MA, PA
None
8
AR, GA, IL, MN, ND, NM, NY, TX
SOURCE: 2019 KFF and Health Management Associates (HMA) survey of Medicaid officials in 50 states and DC, April 2020.
The Role of PBMs and Other Vendors in Administering Pharmacy Benefits
State use of external vendors to administer the pharmacy benefit, particularly the use of PBMs, has generated considerable policy debate about costs and prices in Medicaid. While the relationship between state Medicaid programs and PBMs is not new, the extent to which states rely on PBMs has grown significantly in the past ten years. PBMs may perform a variety of financial and clinical services for Medicaid programs, including adjudicating claims, administering rebates, monitoring utilization, supporting DUR processes, and overseeing and formulating preferred drug lists (PDLs).9 States may utilize PBMs in both managed care and FFS settings. The financial responsibilities PBMs take on, including negotiating prescription drug rebates with manufacturers and dispensing fees with pharmacies, have led to closer scrutiny of these arrangements and changing state policies governing PBM functions.
Fee-for-Service (FFS) Vendors
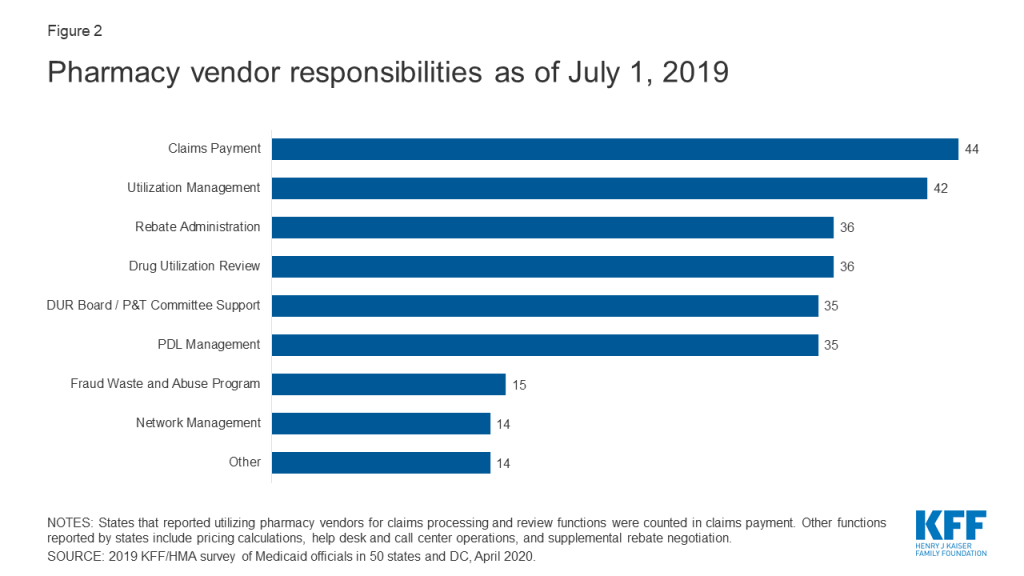
Within FFS delivery of pharmacy benefits, states have historically outsourced some or all of the administrative functions of the benefit and continue to do so. All responding states except one (California) reported outsourcing some or all FFS functions to one or more PBMs or other vendors as of July 1, 2019.10 The most commonly outsourced functions reported were claims payment and utilization management (Figure 2 and Appendix Table 2). Other outsourced functions mentioned by more than one state included provider call centers (Arkansas, Oklahoma, South Dakota, and Vermont) and determining AAC11 or MAC12 pricing (Indiana, Michigan, and Montana).
Figure 2: Pharmacy vendor responsibilities as of July 1, 2019
In recent years, a number of states have consolidated pharmacy administration into more streamlined contracts with a single vendor. These contracts resemble PBM contracts where the vendor has direct management responsibilities over the network, reimbursement rates, and rebate negotiations.13 Of the 44 states that reported outsourcing the claims payment function, 23 reported that their fiscal intermediary, a vendor who handles administrative functions on behalf of the state, processes pharmacy claims14 with the remaining 21 respondents reporting outsourcing to Magellan, Change Healthcare, or OptumRx to process claims.
MCO Vendors and State requirements
States are taking action to prevent or monitor spread pricing within MCO-PBM contracts. Thirty-four MCO carve-in states15 responded to survey questions about spread pricing. When the payment the PBM receives from the MCO and the reimbursement amount it pays to the pharmacy differ, some PBMs have opted to keep this “spread” as profit, an issue which has generated a significant amount of political attention to MCO oversight.16 Eleven states prohibited spread pricing as of July 1, 2019; five states (Arkansas, Kentucky, Nebraska, New York and Washington) reported plans to eliminate spread pricing in FY 2020; and Maryland indicated that a spread pricing prohibition would take effect in January 2021 (Figure 3 and Appendix Table 3). Also, Pennsylvania reported plans to require MCOs to develop a process that ensures pharmacy reimbursement is sufficient to cover acquisition costs plus the cost of professional services and the cost to dispense. Twenty-six MCO states reported they will have transparency reporting requirements in place in FY 2020, including 16 states that require MCOs to provide reports to the Medicaid agency.
Figure 3: States reporting spread pricing prohibitions as of July 1, 2019
Outside of contractual prohibitions on spread pricing, very few states reported imposing other restrictions or limitations on the MCO relationship or contract with their PBM. States noted the following alternative actions:
In Delaware, two legislative task forces are reviewing PBM sub-contracting practices.
Indiana is considering the level of reporting to be required in 2021. While not contractually required, Indiana indicates that all MCOs have moved to pass-through PBM pricing.
Kentucky’s MCO contract language includes an annual PDL review, uniform alignment at the discretion of the agency, and mandatory pass-through models; prohibits retroactive clawbacks of payments to pharmacies or imposition of fees, and removes contractual barriers to receiving claim or summary level information from the MCOs.
Michigan reported plans to impose additional disclosure requirements as of October 1, 2019.
Nebraska MCOs must obtain state approval of their choice of PBM
On January 1, 2020, Washington will prohibit retroactive payment adjustments (except by the MCO or in the event of an improper payment).
Drug Utilization Review Board (DUR Board) and Pharmacy and Therapeutics (P&T) Committee Policies
External boards and committees also play a role in overseeing and administering the Medicaid pharmacy benefit. Section 1927 of the Social Security Act requires states to operate a DUR Board to guide drug utilization review (DUR) activities including retrospective review, application of DUR standards, and pharmacy and prescriber interventions. DUR programs also include evaluation for problems like duplicate prescriptions, incorrect dosage, and clinical misuse. Data reported to CMS shows that 48 states have conducted a review of estimated cost savings or cost avoidance of their DUR program, and CMS estimates that DUR programs save about 20%.17 States may also institute a P&T Committee to review therapeutic drug classes for PDL placement and coverage decisions, and 39 of the 50 responding states reported doing so as of July 1, 2019.18 Arizona, which operates its Medicaid program under a Section 1115 waiver, reported having only a P&T committee, but no DUR Board. MCOs may also use their own DUR Board rather than utilize the same board as the FFS agency. Federal data for federal fiscal year 2018 shows that 28 states of 36 states with pharmacy benefits carved in (including Utah which did not participate in this survey) report that at least one of their MCOs has its own DUR Board.19
Conflict-of-interest policies for DUR Boards and P&T committees are left to the states, and 10 states reported not having such a policy in place for at least one of these entities. Federal requirements for P&T committees specify they must consist of pharmacists, physicians and other “appropriate” individuals, but otherwise leave states with flexibility for determining committee operations. Of the 50 responding states, 40 reported having a conflict of interest policy for the DUR Board.20 Of the 39 states that reported having a P&T committee, 36 had in place a conflict of interest policy. Three states had no conflict-of-interest policy for either entity (Kentucky, Missouri, North Carolina).21
States vary in what functions DUR Boards and P&T committees play in administering Medicaid pharmacy benefits. DUR Boards and P&T committees may play a role in setting or reviewing utilization management tools. With the exception of review of new drugs for PDL placement which was carried out by a P&T committee in more than half the states, other activities were more evenly divided across the various entities (Table 3 and Appendix Table 4). Most states that reported “other” entities were responsible for one or more of the activities commented that more than one entity was responsible for reviews. However, Connecticut reported that step therapy criteria are developed in legislation, Louisiana reported that its DUR Board reviews prior authorization (PA) criteria developed by the University of Louisiana Monroe’s Office of Outcomes Research and Evaluation, and New Hampshire indicated that an independent medical review contractor was responsible for reviewing orphan/expedited review drugs.
Table 3: Responsible Entity for Reviewing New PDL Drugs, Step Therapy Criteria, PA Criteria andOrphan/FDA Expedited Review Drugs, July 1, 2019(50 States Reporting)
Entity
New PDL Drugs
Step Therapy Criteria
PA Criteria^
Orphan/Expedited Review Drugs
DUR Board
6
14
15
12
P&T Committee
29
12
9
10
Medicaid agency
7
14
16
17
Other
4
5
9
11
N/A
4*
5+
0
0
NOTES: *States that reported they had no PDL. +States that reported they had no step therapy.^HI did not respond.SOURCE: 2019 KFF and Health Management Associates (HMA) survey of Medicaid officials in 50 states and DC, April 2020.
Most states reported that DUR Boards and/or P&T committees incorporate comparative effectiveness studies in coverage decisions. Over two-thirds of the responding states (35 states) report reviewing comparative effectiveness studies when determining coverage criteria. The most commonly cited studies come from the Institute for Clinical Economic Review (ICER) and the Drug Effectiveness Review Project (DERP). However, states also report reviewing other drug effectiveness studies and compendia to determine effectiveness and several states use local universities and their DUR Board/P&T support vendor for research.
Report: Cost Containment And Utilization Control Strategies
How are states managing use and costs in their programs?
Managing the Medicaid prescription drug benefit and pharmacy expenditures remains a policy priority for state Medicaid programs, and state policymakers remain concerned about Medicaid prescription drug spending growth. Because state Medicaid programs are required to cover all drugs from manufacturers that have entered into a federal rebate agreement (in both managed care and FFS settings), states cannot limit the scope of covered drugs to control drug costs. Instead, states use an array of payment strategies and utilization controls, discussed below, to manage pharmacy expenditures.
Preferred Drug Lists (PDLs)
Most state Medicaid programs maintain a preferred drug list (PDL), a list of outpatient prescription drugs the state encourages providers to prescribe over others. A state may require prior authorization for a drug not on a preferred drug list or attach a higher copayment, creating incentives for a provider to prescribe a drug on the PDL when possible. In this way, a PDL allows a state to drive utilization to lower-cost drugs, including drugs for which the state has negotiated a supplemental rebate with the manufacturer. With the exception of four states (Hawaii, New Jersey, New Mexico, and South Dakota), all other responding states (46 of 50 states) reported having a PDL in place for FFS prescriptions as of July 1, 2019, and also negotiating supplemental rebates for preferred agents.
Most state P&T committees are responsible for determining PDL placement for new drugs (29 states). A small number of states reported that either the Medicaid agency (7 states) or the DUR board (6 states) is responsible for the review of new drugs for inclusion on the PDL.
Most state DUR Boards and/or P&T Committees review PDLs at least annually. For PDL reviews, 20 of 50 responding states reported annual reviews, and 10 of the 17 states that reported other review periods review their PDLs quarterly, with an additional three states reviewing bi-annually (Appendix Table 5).
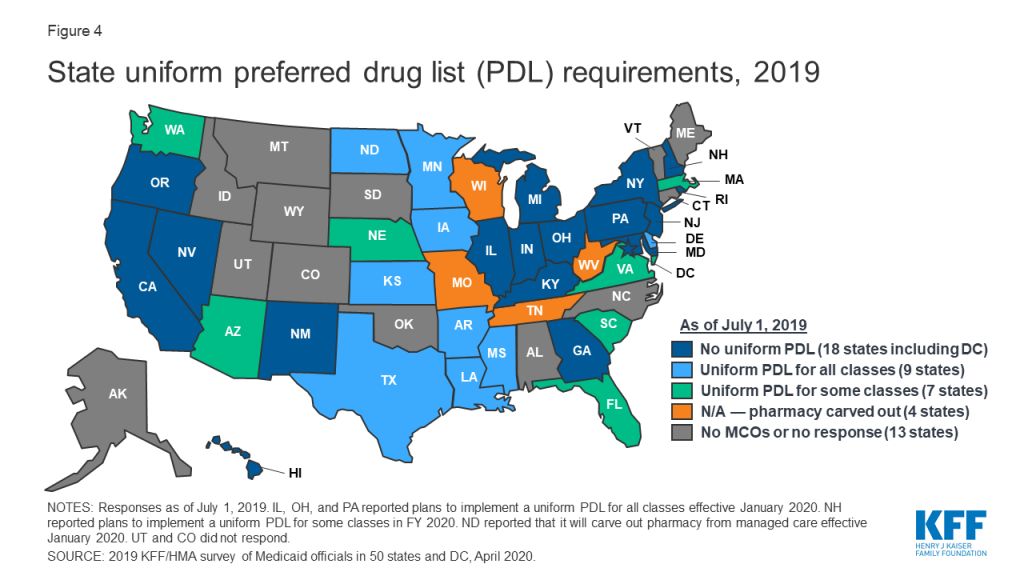
In recent years, a growing number of MCO states have adopted uniform PDLs requiring all MCOs to cover the same drugs as the state. In a previous survey of state Medicaid programs, just nine states reported having a uniform PDL across FFS and managed care in FY 2015.22 In this survey, 16 MCO states reported having a uniform PDL for some or all classes as of July 2019, 18 states reported no uniform PDL requirement (Figure 4). Eight states, however, reported plans to establish (Illinois, Ohio, New Hampshire, and Pennsylvania) or expand (Arizona, Massachusetts, Nebraska, and Washington) a uniform PDL in FY 2020. Several states noted that possible future changes were under consideration. Notably, Washington is considering including the physician-administered drugs on the PDL.
Figure 4: State uniform preferred drug list (PDL) requirements, 2019
Though not all states utilize a uniform PDL, many states do review and approve MCOs’ PDL changes. More than half of the MCO states reported that the DUR Board, P&T Committee, or other state entity reviews and/or approves MCO PDL changes.
Prior Authorization and Step Therapy
States varied in what entity is responsible for developing prior authorization (PA) or step therapy criteria. One of the primary tools that almost all states have long used to manage drug utilization is prior authorization (PA), which requires prescribers to obtain approval from the state Medicaid agency (or its contractor) before a particular drug can be dispensed. States may also use step therapy, a type of PA for drugs that requires beneficiaries to begin treatment for a medical condition with a specific drug therapy, usually a lower-cost drug or generic, and progress to other therapies only if medically necessary. Sixteen states reported that the Medicaid agency is the entity responsible for setting PA criteria while 15 states reported that the DUR board sets PA criteria and the remaining states reported that the P&T committee (9 states) or other entities (9 states) fill this role (Table 3). Fourteen states reported the Medicaid agency develops step therapy criteria and 14 states reported that the DUR Board fills this role. The remainder of states reported utilizing either the P&T committee (12 states) or other entities (5 states).
Most states review PA and step therapy criteria on a less frequent basis than PDLs. The majority of states reported that both step therapy (24 states) and PA criteria (32 states) are reviewed “as needed” (Figure 5 and Appendix Table 5). The most common response for other review frequencies for both step therapy and PA criteria was quarterly.
Figure 5: State review frequency of PDLs, step therapy, and PA criteria as of July 1, 2019
Most states report that new drugs are subject to PA before undergoing initial review by the DUR Board and/or P&T committee. Four states without a PDL (Hawaii, New Jersey, New Mexico, and South Dakota) reported no PA requirement for new drugs while all other responding states reported that PA was always (16 states) or sometimes (30 states) required. For states answering “sometimes,” states identified reasons related to the new drug’s PDL status, cost and class as conditions for PA prior to review (Table 4). As one state noted, not requiring PA for a new drug could have a detrimental impact on supplemental rebates earned on existing PDL-preferred agents.
Table 4: New Drug PA Reasons*, July 1, 2019
Condition for PA
# of States
States(30 States Responding )
Drug is in a current PDL class
12
AL, DC, DE, IN, LA, MT, NY, OH, PA, TN, VA, WV,
Cost threshold
6
DC, DE, MD, ND, NV, WV
Temporary PA required until full DUR BOARD and/or P&T Committee review
5
AK, FL, KS, OR, RI
PA always required except for protected drug classes (oncology, HIV, etc.)
4
CA, MI, MO, OR
Drug is in a PDL/therapeutic class that requires PA
4
DE, NC, TX, WY
Other^
6
CO, MD, NE, OK, OR, WI
NOTES: *Responses were collected for the 30 states that reported not automatically subjecting all drugs to PA before initial review. States may have reported more than one condition for PA. ^Other reasons include statutorily required PA time limits, the drug not falling within a PDL class, the drug label having restrictive criteria, and other reasons as determined by the Medicaid agency.SOURCE: 2019 KFF and Health Management Associates (HMA) survey of Medicaid officials in 50 states and DC, April 2020.
While states often impose PA on high-cost specialty or non-preferred drugs, a number of states have legislation protecting drug classes or categories from the use of these tools in some or all circumstances. Nearly half of the responding states (24) reported one or more state statutory limits in place on the Medicaid agency’s ability to subject a drug or drug class to FFS utilization controls such as PA or step therapy requirements (Table 5). In some cases, states noted that the statutory prohibition applied to PDL placement but did not prevent the Medicaid agency from imposing quantity limits. Of the 24 states with a statutory limit on utilization controls, 17 included pharmacy as a covered benefit under an MCO arrangement. All but five of these states (Maryland, Michigan, North Dakota, Rhode Island, and Virginia), also applied the statutory limits to MCOs.23
Table 5: State Statutory Limits on Utilization Controls, July 1, 2019
NOTES: *Other drugs reported include antihemophilic medications, organ transplant drugs, multiple sclerosis drugs, brain disorder drugs, therapeutic classes with only one drug, or drugs with very low utilization.SOURCE: 2019 KFF and Health Management Associates (HMA) survey of Medicaid officials in 50 states and DC, April 2020.
States are active in their management of MCO clinical protocols, or medical necessity criteria, with 28 states reporting that they require uniform clinical protocols for some or all drugs with clinical criteria. Only six states reported no uniform clinical criteria (Figure 6). In addition, five states report that they plan to impose uniform protocols on at least one drug in 2020 (Arizona, Louisiana, Ohio, Pennsylvania, and Washington). No states reported plans to remove any uniform clinical protocols.
Figure 6: State uniform clinical protocols for managed care as of July 1, 2019
Most states that use MCOs to deliver pharmacy benefits require plans’ PA policies to be no more restrictive than or the same as state rules in FFS. Of the 34 responding states24 that included pharmacy as a covered benefit under an MCO arrangement as of July 1, 2019, nearly two-thirds of these states (22) required MCO policies to be no more restrictive than FFS policies (Table 6).
Table 6: Limits on MCO PA and Step Therapy Criteria, July 1, 2019
Drug/Drug Classes Protected
# of States
States(34 MCO States Responding)
Required to be no more restrictive
22
AR, CO, DC, DE, FL, GA, IL, KY, LA, MA, MS, ND, NE, NH, NY, OH, OR, PA, RI, TX, VA, WA
Varies
4
HI, MN, NJ, SC
Required to be the same
2
IA, KS
Required to be no less restrictive
2
NM, NV
Permitted to be more restrictive
2
CA, MD
Other
2
IN*, MI+
NOTES: *IN reported that MCO contracts requirements are being transitioned to require “no more restrictive” policies as contracts come up for renewal. +MI reported that MCO policies can only be less restrictive than the PA and step therapy criteria outlined in the MCO common formulary.SOURCE: 2019 KFF and Health Management Associates (HMA) survey of Medicaid officials in 50 states and DC, April 2020.
Similar to their oversight of PDL changes, some states report oversight of MCO PA and step therapy criteria regardless of their uniform requirements for these rules, with the majority of those responding indicating that the state oversees either step therapy, PA/utilization management criteria, or both.
Prescription Limits
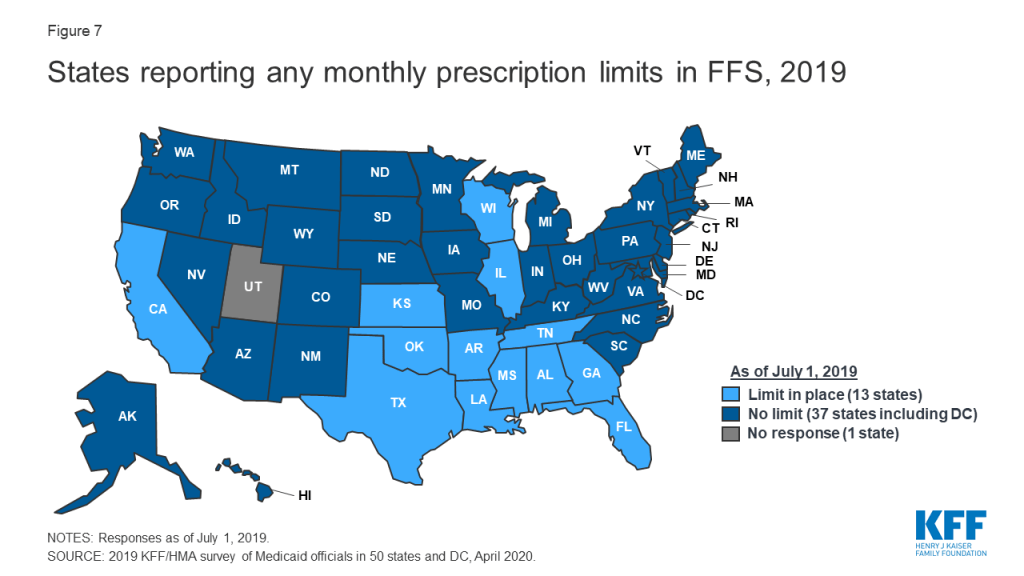
Some states report imposing limits on the number of total and/or brand prescriptions a beneficiary may access in a month without PA. States may limit the number of prescriptions a beneficiary may access without prior authorization,25 but prescribers and pharmacists may submit requests to override these limits when medically necessary or under other specific circumstances. About one-quarter of the 50 responding states26 (13 states) reported imposing a monthly limit on FFS prescriptions (Figure 7 and Appendix Table 6). Nine of these 13 states reported that the limit could be overridden using PA or other appeals process.27 Three states reported applying monthly prescription limits only to narcotics and seven of the remaining 10 states with limits noted a number of excluded drugs or drug classes such as HIV antiretrovirals (6 states), cancer drugs (5 states), family planning products (5 states), mental health drugs (4 states), and tobacco cessation products (3 states). Six of the 13 states reported applying the limits only to adults, and four states noted specific exemptions for persons receiving long term services and supports.
Figure 7: States reporting any monthly prescription limits in FFS, 2019
Prescription limits were less likely to be uniform across FFS and MCOs as other utilization management tools. States imposing monthly limits were also asked to indicate if MCOs were required to apply the same limits, PA/appeals processes, and exemptions. Four of the 13 states had no MCOs (Alabama and Oklahoma) or did not include pharmacy as an MCO-covered benefit (Tennessee and Wisconsin). Of the remaining nine states, only one (Mississippi) required MCOs to apply the same limits and two states (Florida and Louisiana) noted that MCOs could be less restrictive, but not more restrictive, than the state’s FFS policy. Only one state reported a planned change for FY 2020: Mississippi increased the number of drugs covered in its monthly prescription limit to six from five effective July 1, 2019.
Generic Drug Policies
Almost all states have policies or tools in place to promote generic utilization. As shown in Table 7 and Appendix Table 7, the most common policy reported was a mandatory generics policy (41 states). Only three states (California, New Hampshire, and Nevada) reported having no policies or tools in place. No state reported planned changes to their policies for generic utilization for FY 2020, although one state noted that where applicable, the state will switch from a preferred brand to a preferred generic if the generic becomes less expensive.
Table 7: Policies/Tools in Place to Promote Generic Utilization, July 1, 2019(50 states responding)
Policy/Tool
# of States
Mandatory generics
41
Lower copayment requirement for generics
17
Provider education
13
PDL placement
5
Higher point of sale dispensing fee for generic substitution
3
Tiered dispensing fee based on pharmacy’s generic drug utilization rate
1
Other*
3
No policies or tools
3
NOTES: *Other policies and tools reported were a requirement to cover drugs with the lowest net costs, which could be either a brand or a generic (ID and ME), and a lower required copayment for selected generics treating specific conditions (MA).SOURCE: 2019 KFF and Health Management Associates (HMA) survey of Medicaid officials in 50 states and DC, April 2020.
In contrast, states are less likely to require biosimilar substitution, though most allow it. No state reported requiring pharmacists to substitute a biosimilar for a prescribed biologic, but over two-thirds of responding states (34 of 48 states)28 indicated that biosimilar substitution was allowed (Figure 8).
Figure 8: State policy on biosimilar substitution in Medicaid, 2019
The vast majority of responding states (45 of 50) require biosimilar drugs to undergo the same DUR Board/P&T committee review process as other drugs. Five states, however, reported a different process: Arizona’s P&T Committee reviews biosimilars only if the branded product is available within 180 days of when the biosimilar becomes available in the market; Montana will use the same criteria as the original product, unless the DUR Board requests a separate review; New Mexico reported covering biosimilars based on FDA approval and a CMS rebate agreement; Rhode Island indicated that the Medicaid agency reviews biosimilars; and Vermont reported performing a financial analysis in place of a full new drug review.
About half of MCO states align some or all FFS and MCO generic substitution policies. Of the 34 responding states that include pharmacy as an MCO covered benefit, 12 reported that MCOs were required to follow the state’s FFS generic policies,29 while three MCO states (Minnesota, New York, and Washington) reported that MCOs were required to following MCO policies in part.
Report: Payment, Supplemental Rebates And Rebate Management
How are states addressing payment for prescription drugs?
Medicaid payments for prescription drugs are determined by a complex set of policies, at both the federal and state levels, that draw on price benchmarks to set both ingredient costs and determine rebates under the federal Medicaid drug rebate program (MDRP). States set policies within federal guidelines on beneficiary cost-sharing while federal regulations guide the payment methodology for prescription drug ingredient cost reimbursement and professional dispensing fees. The final cost to Medicaid is then offset by any rebates received under the federal MDRP. In addition to federal statutory rebates under MDRP, most states negotiate with manufacturers for supplemental rebates on prescription drugs, frequently using placement on a PDL as leverage. States have also formed multi-state purchasing pools when negotiating supplemental Medicaid rebates to increase their negotiating power. In addition, most MCO states allow their MCOs to negotiate their own supplemental rebate agreements with manufacturers. A few states have also used their supplemental rebate authority to negotiate alternative payment models with manufacturers, and states continue to show interest in these arrangements.
Supplemental Rebates
Most states use competitive procurement to select an entity to negotiate supplemental rebates, and a majority of states with supplemental rebate programs rely on a purchasing pool to negotiate the rebates. Of the 46 states reporting supplemental rebate programs, 24 states reported that a purchasing pool handled negotiations, six states indicated a PBM, five states indicated the state Medicaid agency, seven states indicated another vendor, and four states reported that more than one entity was responsible for negotiations (Appendix Table 8). Three-quarters of the states (35) reported that the negotiating entity was selected through a competitive procurement.
Approximately two-thirds of the states with supplemental rebate programs (30 of 46 states) have entered into multi-state purchasing pools to enhance their negotiating leverage and collections. As shown in Table 8, as of July 1, 2019, 30 states reported participating in three different multi-state purchasing pools. Two states (Louisiana and Maine) also reported participating in an intrastate purchasing pool, where multiple agencies within the state consolidate their purchasing,30 and one other state (Nevada) reported new state legislation, effective January 1, 2020, allowing state agencies and non-profits to “pool” their pharmacy expenditures with Medicaid FFS for rebate purposes.
Table 8: Multi-State Purchasing Pool Participation, July 1, 2019
Pool
# of States
States(50 States Responding)
National Medicaid Pooling Initiative (NMPI)
11
AK, DC, KY, MI, MN, MT, NC, NH, NY, RI, SC
Sovereign States Drug Consortium (SSDC)
10
DE, IA, ME, MS, ND, OH, OK, OR, VT, WY
Top Dollar Program (TOP$)
9
CT, ID, LA, MD, NE, TN, WA, WI, WV
None
20
AL, AR, AZ, CA, CO, FL, GA, HI, IL, IN, KS*, MA, MO, NJ, NM, NV, PA, SD, TX, VA
NOTES: *KS reported that contract with a multi-state pool was in place but not used.SOURCE: 2019 KFF and Health Management Associates (HMA) survey of Medicaid officials in 50 states and DC, April 2020.
Most states anticipate supplemental rebates to remain steady or increase as a share of pharmacy expenditures. Of the 46 responding states with supplemental rebate programs, nearly three-quarters (34) expected rebates to remain “about the same” in FY 2020 compared to FY 2019, while 11 states expected higher rebates.31 Only one state (Tennessee) projected lower rebate collections due to patent expirations and orphan drug approvals.
Most states with managed care allow MCOs to negotiate supplemental rebates beyond the state supplemental rebate. Twenty-seven of the 34 responding non-carve-out MCO states32 reported allowing MCOs to negotiate supplemental rebates (Figure 9 and Appendix Table 9). Of these 27 states, eight reported having a uniform PDL for one or more classes and that MCOs were not permitted to negotiate supplemental rebates for uniform classes. One MCO state with a uniform PDL (Kansas) reported that it allowed MCOs to negotiate rebates for all classes of drugs, even for classes that are governed by a universal PDL. Seven MCO states reported that MCOs were not permitted to negotiate rebates for any drugs. About one-third of the MCO states that allow MCOs to negotiate supplemental rebates (9 of 25 reporting) indicated that the MCOs’ PBMs were required to pass through supplemental rebate collections to the MCO and nearly two-thirds (16 of 24 reporting states) required MCOs to report aggregate supplemental rebate collections to the state Medicaid agency.
Figure 9: States allowing MCOs and PBMs to negotiate supplemental rebates as of July 1, 2019
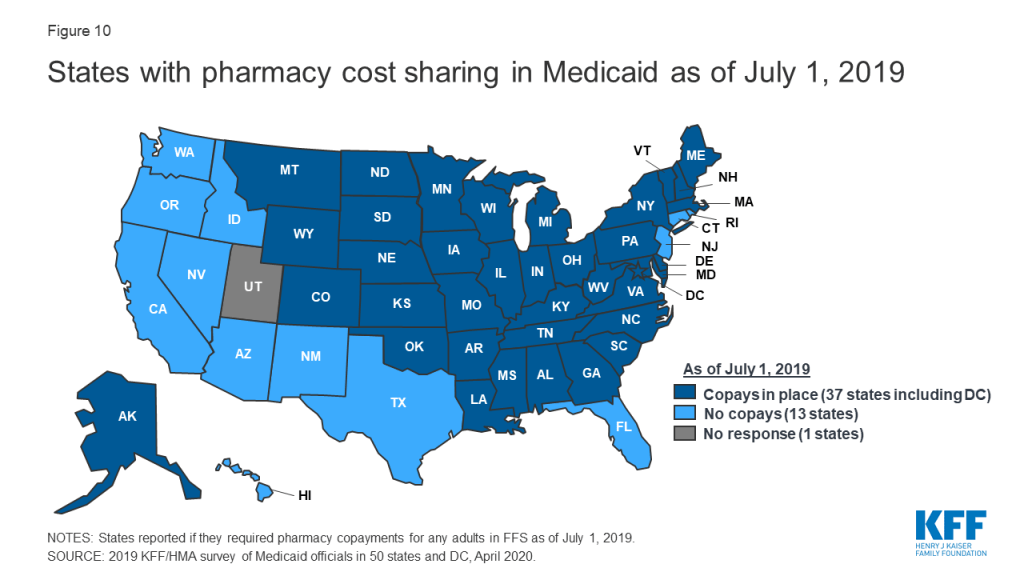
Pharmacy Copays
Most states impose pharmacy cost sharing, and many structure copayment requirements to favor lower-cost generic and preferred brands. As of July 1, 2019, nearly three-quarters of the 50 responding states (37 states) reported requiring FFS pharmacy copayments for non-exempt adults (Figure 10 and Appendix Table 10). All but four of these 37 states (Kentucky, Maine, Missouri, and Ohio) reported that reimbursement to the pharmacy provider was decreased by the copayment amount. Also, 17 states reported lower copays for generics compared to brands, 11 states reported uniform copays for generics and brands, eight states reported that copay amounts varied based on the cost of the drug, and one state reported copays varied based on PDL placement. A few states also mentioned copay exemptions for selected therapeutic classes.
Figure 10: States with pharmacy cost sharing in Medicaid as of July 1, 2019
Most of the responding states with copay requirements that had implemented the ACA Medicaid expansion as of July 1, 2019 (20 of 24 states) reported that copayment requirements for the expansion population were the same as for non-expansion adults. Only four expansion states reported different requirements: two states reported no copay requirements (Arkansas and Iowa) and two states reported higher copay requirements (Indiana and Michigan). Also, of the 24 responding states that imposed FFS copayments and included pharmacy as a covered benefit under an MCO arrangement as of July 1, 2019, 13 reported no difference in the pharmacy copayment requirement applicable to MCOs, and 11 reported that MCOs either charged no copays or had flexibility to charge or waive copays. A few states reported plans to implement copayment changes in FY 2020: DC and Ohio reported plans to remove copay requirements for selected drugs; Louisiana indicated plans to increase copays to the maximum amount allowed based on household income; North Dakota reported plans to eliminate required copays; and Montana reported plans to eliminate copays for Medicaid expansion adults.
Medication Therapy Management (MTM)
Few states are reimbursing pharmacists for medication therapy management (MTM) services in their FFS programs. MTM, often provided by pharmacists, is intended to ensure the best therapeutic outcomes for patients by addressing issues of polypharmacy, preventable adverse drug events, medication adherence, and medication misuse. MTM typically includes five core elements: medication therapy review, a personal medication record, a medication-related action plan, intervention or referral, and documentation and follow-up.33 Only 9 of 49 responding states34 reported the state paid pharmacists to provide MTM services in the FFS program as of July 1, 2019 (Table 9).
Table 9: Medication Therapy Management Programs, July 1, 2019
State
MTM Conditions/Enrollees
MCOs Required to Cover Same MTM services?
Colorado
Drug-drug interactions, drug duplication, adverse reactions and to improve overall patient outcomes
Asthma, COPD, Diabetes, compliance, transitions of care, high-risk use medications
No
New Mexico
Medication overutilization including narcotic overutilization and use with benzodiazepines and/or antipsychotics, and antipsychotic use by children and those specifically in foster care
Yes
Oregon
Clozapine monitoring, birth control prescribing, must include covered services on the prioritized list and be a collaboration
No^
Wisconsin
The member takes four or more prescription medications to prevent two or more chronic conditions, one of which must be hypertension, asthma, chronic kidney disease, CHF, dyslipidemia, COPD, or depression. Also, diabetes would qualify a member for MTM eligibility.
N/A – pharmacy carved out of MCO contract
NOTES: *MTM services in MI are carved out and paid in FFS. +MCOs in MN must provide at least the same benefit as FFS. ^Most MCOs in OR have the capability to cover MTM services if they choose.SOURCE: 2019 KFF and Health Management Associates (HMA) survey of Medicaid officials in 50 states and DC, April 2020.
Value-Based Arrangements
A small, but growing number of states are employing alternative payment methods to increase supplemental rebates through “value-based arrangements” (VBAs) negotiated with individual pharmaceutical manufacturers. Two states reported having a VBA in place as of July 1, 2019: Oklahoma reported having four VBAs covering two long-acting injectable antipsychotics, and an epilepsy drug, and an antibiotic used mainly in the emergency room;35 and Washington reported having a modified subscription model VBA (also known as the “Netflix model”) for hepatitis C antiviral drugs.36,37 An additional eight states (Arizona, Arkansas, Colorado, Georgia, Indiana, Louisiana, Massachusetts, and Michigan) reported plans to submit a VBA State Plan Amendment to CMS or implement a VBA in FY 2020, and eight states (Connecticut, DC, Idaho, Kentucky, New Jersey, North Carolina, South Carolina, and Virginia) indicated VBAs were under consideration or being explored.
States cited a range of barriers or challenges to implementing VBAs. The most frequently cited barrier or challenge, cited by 10 states, was the administrative resources needed to develop and negotiate VBAs. Eight states indicated that the CMS approval process was a challenge; eight states commented on the data collection and measurement requirements associated with VBAs; five states noted the time needed for implementation and to measure value; five states cited the lack of willing manufacturers; and four states mentioned the risk to the state or challenge of calculating a return on investment. Other challenges mentioned by two states included: the need to obtain stakeholder agreement; the inability to include 340B-eligible drugs; the overall complexity; and limited feasibility for smaller states with smaller volume/utilization.
Other Payment Initiatives
A small number of states use limited pharmacy networks for specialty drugs. Unlike MCOs that sometimes limit the size of provider networks, including retail pharmacy networks (when permitted by the state), to achieve better pricing or higher quality, Medicaid FFS programs typically enroll “any willing,” qualified, and appropriately credentialed provider. Three states, however, reported selective contracting or limited network arrangements for FFS specialty pharmacy drugs in place as of July 1, 2019: Arizona competitively procured a vendor to provide specialty pharmacy services for anti-hemophilic product and other blood disorder medications; Pennsylvania competitively procured two preferred vendors to provide specialty pharmacy drugs, ancillary items and services and clinical supports; and DC created a mental health specialty pharmacy network in 2010 to allow selected physician-administered injectable antipsychotics to be billed as a pharmacy benefit through the pharmacy point-of-sale system. Pharmacies interested in dispensing these medications directly to physician offices or other healthcare facilities may opt in as a provider for this pharmacy network. No state reported having a limited FFS network for non-specialty drugs.
Some states have mandated dispensing fees for MCOs. As described in Table 10 below, nine states (Arizona, Iowa, Kansas, Kentucky, Louisiana, Mississippi, North Dakota, Nebraska, and New Mexico) reported having have some form of mandated dispensing fee in place as of July 1, 2019. Two states (Illinois and Ohio), plan to add a mandated fee requirement in 2020: Illinois will require MCOs to pay the Department’s dispensing fee for Critical Access Pharmacies, which are, generally, independent pharmacies located in counties with less than 50,000 residents, and Ohio reported plans to implement a supplemental dispensing fee pilot to support independent pharmacies and small chains, especially those who serve a large number of Medicaid beneficiaries.38
Table 10: Mandated Dispensing Fees, July 1, 2019
State
Description of Fee
AZ
Must pay FQHCs a $8.75 dispensing fee
IA
Must pay same dispensing fee as FFS
KS
Must pay $0 for Usual and Customary claims and Medicare Part D copay assistance and $10.50 for all other claims, unless there is third party liability, which may have an impact
KY
Must pay $2 more in dispensing fees paid to pharmacies by MCOs 39
LA
Must pay non-chain pharmacies (local) at the same rate as FFS
MS
Must pay the same as FFS, $11.29 for brand/generic; $61.14 for specialty drugs on state’s Specialty Drug List
ND
Must pay FFS rates as of January 1, 2019
NE
Minimum dispensing fee defined for independent pharmacies of 6 or fewer
NM
Must pay $2.00 in addition to contracted dispensing fee
SOURCE: 2019 KFF and Health Management Associates (HMA) survey of Medicaid officials in 50 states and DC, April 2020.
Some, but not all, states have policies in place to manage medical benefit drugs, or drugs delivered outside of Medicaid’s pharmacy benefit. Some drugs covered by Medicaid are paid through the medical benefit rather than the pharmacy benefit. These drugs are sometimes not in a PDL or managed by PBMs; rather, they are approved through the medical management department. These drugs are often high-cost drugs administered in physician offices, infusion suites, or hospitals. There can be wide variability on how these drugs are authorized, and states continue to seek utilization controls. Over half of responding states reported having policies or tools in place to ensure that drugs are paid at the lowest cost benefit including prior authorization, paying for all drugs through the pharmacy benefit, prohibitions on “white bagging,”40 and delegating policy making to MCOs.
Report: State Strategies To Manage 340b Programs
As a condition of participation in the MDRP, manufacturers also must participate in the federal 340B program. The 340B program offers discounted drugs to certain safety net providers (known as covered entities, or CEs) that serve vulnerable or underserved populations, including Medicaid beneficiaries, in order to “stretch scarce federal resources as far as possible.”41,42 Additionally, CEs sometimes elect to contract with non-affiliated retail pharmacies to provide pharmacy services to their patients. These are known as contract pharmacy arrangements.
States are prohibited from invoicing manufacturers for Medicaid rebates when a drug is acquired through the 340B program; this is known as the “duplicate discount” prohibition. While it is the responsibility of the Medicaid agency to ensure that 340B claims are excluded from rebate billings to manufacturers, it is the responsibility of the CE to ensure that claims are properly identified during claims billing, including claims billed by contract pharmacies. The use of contract pharmacies has come under scrutiny for complicating the oversight of duplicate discounts.43 States have struggled to ensure compliance with the duplicate discount prohibition and, with the federal government and the National Council for Prescription Drug Programs (NCPDP), have developed processes to identify 340B claims both at the claims level and administrative level. On January 8, 2020, CMS issued an informational bulletin outlining best practices for states to consider employing to avoid duplicate discounts.44
340B Management Strategies to Avoid Duplicate Discounts
Most states report multiple strategies to manage 340B claims from covered entities (CEs). Most commonly, states rely on the Medicaid Exclusion File published by the federal government to exclude claims from CEs who have indicated that they are participating in the Medicaid program (Table 11 and Appendix Table 11). Many states also prohibit the use of contract pharmacies in FFS (36 states) or managed care (19 states) to fill prescriptions. States also report use of claims indicators to flag 340B claims when they are submitted to the Medicaid agency for payment (31 states). Fewer states reported carving out 340B entities entirely from managed care (6 states) or FFS (2 states).45 Despite the reported challenges of the 340B program, only five states (California, Michigan, Mississippi, New Mexico, and Rhode Island) reported issues with duplicate discounts on this survey.
Table 11: 340B Management Strategies
Strategy
# of States
Use of the Medicaid Exclusion File (MEF)
38
Prohibition on contract pharmacies in FFS
36
Use of NCPDP fields* to identify 340B claims
31
Prohibition on contract pharmacies in managed care
18
340B entities not allowed to carve into managed care
5
Use of medical claims modifiers to identify 340B claims
7
340B entities not allowed to carve into FFS
2
NOTES: *NCPDP fields allow pharmacies to indicate on a claim that a drug was purchased through the 340B programSOURCE: 2019 KFF and Health Management Associates (HMA) survey of Medicaid officials in 50 states and DC, April 2020, and NCPDP Reference Guide.46
340B Reimbursement Models
Most states do not have specific requirements for 340B dispensing fees or MCO payment levels for 340B claims. Federal rules issued in 2016 require that payments to pharmacies for drug costs be based on the actual cost of acquiring the drug. For drugs acquired under 340B, this acquisition cost cannot exceed the 340B ceiling price.47 Federal rules also require that states pay a fee for the pharmacist’s professional services and costs to dispense the drug to Medicaid beneficiaries. States are allowed flexibility in establishing their professional dispensing fees, with some states choosing to segment pharmacies by prescription volume, number of locations or other factors, including 340B status. Forty-two states (of 49 states) indicated they did not have a dispensing fee for 340B programs that was different from the FFS professional dispensing fee, while seven did (Arizona, Illinois, Maryland, North Carolina, Oregon, South Carolina, and Tennessee). Three states (Arizona, Iowa, and Mississippi) mandate that MCOs reimburse 340B claims at the FFS rate.
Report: Challenges And Priorities In Fy 2020 And Beyond
Impact of Federal Reforms
CMS Medical Loss Ratio (MLR) Bulletin
Recent MLR guidance will have implications for states that cover drugs through managed care. CMS issued sub-regulatory guidance in May 2019 on Medical Loss Ratio (MLR) reporting for managed care contracts when the managed care entity uses a third-party vendor in a subcontracted arrangement, including PBM subcontracts.48 States’ responses on whether there would be a fiscal impact with implementing the MLR bulletin varied: states that required PBM transparency reporting and/or contracting as of July 2019 reported no fiscal impact because the actual drug ingredient costs and dispensing fees were factored into capitation rates. States with no PBM reporting requirements or that allowed spread pricing reported that capitation rates were likely overstated and would be adjusted in future rate setting periods.49
The 21st Century Cures Act
A number of states cited the 2016 21st Century Cures Act’s expansion of drugs eligible for the FDA expedited review process as a concern. New drugs eligible for an expedited review include cell and gene therapies that are typically high cost and other medications for rare diseases. There are reduced efficacy study requirements for expedited review, which means that a new drug that may not be more effective than a preexisting therapy may be priced many times more. Some of the states commenting on the Cures Act expressed a desire for more flexibility on covering these drugs — even with the MDRP in place — when clinical trials and independent efficacy studies do not support increased effectiveness or equivalent effectiveness at the higher price.
The Substance Use-Disorder Prevention that Promotes Opioid Recovery and Treatment (SUPPORT) for Patients and Communities Act
Several states reported that implementation of the 2018 SUPPORT Act could affect Medicaid drug spending in their state. In particular, states reported that open access to substance use disorder (SUD) agents without prior authorization and without respect to PDL and supplemental rebate strategies has the potential to increase costs for SUD agents considerably.
The Prescription Drug Pricing Reduction Act of 2019
Several areas of this Act were noted as consequential for states, especially reforms to the MDRP, including increasing the amount of the rebate to exceed 100% of the Average Manufacturer Price (AMP). A number of states welcomed this reform, particularly for drugs that increase prices beyond the Consumer Price Index for All Urban Consumers (CPI-U) and those that come with very expensive launch prices. As of February 2020, the legislation has been passed out of committee but has not been voted on by the Senate. There remains significant interest at the federal level to address drug prices and the President has signaled his support for bipartisan legislation.
Other Potential Federal Reform Areas
Other potential federal reform areas that states reported watching include repeal efforts of the entire Accountable Care Act, drug reimportation, CMS guidance on CAR-T therapies, modifications to DUR requirements, and PBM contracting reforms.
State Priorities for the Next Two Years
Over two-thirds of the responding states reported that developing policies and strategies related to new high-cost therapies was a top priority. Significant advancements in gene and cellular therapies like CAR-T50 to treat cancer and rare diseases in recent years come with high price tags but are often curative. With more of these costly therapies in the drug development pipeline, states are struggling to adequately budget for current and future therapies. Twenty-three of the 45 states responding to an open-ended question about gene and cell therapies reported that their medical and pharmacy teams have put risk mitigation policies in place, such as PA, risk corridors, or MCO carve-outs, or that an exploration of policy options was underway. Twelve states also reported pursuing or considering State Plan Amendments to enter into value-based arrangements.51
Nearly one-third of the MCO states that carve-in the pharmacy benefit reported that MCO pharmacy policy reforms were a high priority. This included increasing oversight controls, implementing uniform PDLs, and carving the benefit out of managed care. States also reported that they are focusing on improving data collection, implementing new managed care programs, and improving managing medical benefit drugs.
Several states stated that addressing the opioid epidemic, including implementing the SUPPORT Act, is a priority. As noted above, some states are concerned that the SUPPORT Act restrictions on imposing PA on SUD medications will raise costs in those classes of drugs.
Conclusion
States’ management of the Medicaid pharmacy benefit in FY 2019-2020 reflects ongoing state efforts to adapt and respond to the ever-changing prescription drug landscape within the limits of federal law. In response to the increasing roles played by MCOs and PBMs in managing the Medicaid pharmacy benefit, states are increasingly expanding the scope of their clinical and administrative oversight by imposing greater controls over MCO PDL and PA policies and the pricing and reporting arrangements MCOs negotiate with their PBM subcontractors. Conversely, a few states have recently chosen to carve pharmacy benefits out of their managed care arrangements entirely or are considering doing so. A small but growing number of states are also looking to negotiate value-based arrangements with manufacturers to increase supplemental rebates. Looking ahead, states remain concerned about new, high-cost therapies and are prioritizing further reforms to MCO pharmacy policy. Drug pricing has been prominent in national policy debates and lawmakers at both the state and federal levels continue to show interest in efforts to control costs that may have implications for the Medicaid program.
This work was supported in part by Arnold Ventures. We value our funders. KFF maintains full editorial control over all of its policy analysis, polling, and journalism activities.
NOTES: States that cover pharmacy through managed care were asked to report drug classes that were carved out as of July 1, 2019. “NR” = Not Reporting; “DF” = dispensing fee. *MD reported planned implementation of carve-out in January 2020.SOURCE: KFF / Health Management Associates 2019 Survey of Medicaid Officials in 50 states and DC conducted by Health Management Associates, April 2020.
Appendix Table 2: Pharmacy Vendor Responsibilities, July 1, 2019
State
Utilization Management
Claims Payment
DUR
Rebate Admin
PDL Management
DUR Board/P&T Committee Support
Fraud, Waste, Abuse
Network Management
Other
Alabama
X
X
X
X
Alaska
X
Arizona
X
X
X
X
X
Arkansas
X
X
X
X
X
X
X
California
Colorado
X
X
X
X
X
Connecticut
X
X
X
X
X
X
X
Delaware
X
X
X
X
X
X
X
DC
X
X
X
X
X
X
X
Florida
X
X
X
X
X
Georgia
X
X
X
X
X
X
Hawaii
X
X
X
Idaho
X
X
X
X
X
X
Illinois
X
X
X
X
Indiana
X
X
X
X
X
X
X
X
X
Iowa
X
X
X
X
X
X
X
Kansas
X
X
X
X
X
X
X
X
Kentucky
X
X
X
X
X
X
X
Louisiana
X
X
X
X
X
X
X
Maine
X
X
X
X
X
Maryland
X
X
X
X
X
X
X
Massachusetts
X
X
X
Michigan
X
X
X
X
X
X
X
X
Minnesota
X
X
X
X
Mississippi
X
X
X
X
Missouri
X
X
X
X
X
Montana
X
X
X
X
X
X
Nebraska
X
X
X
X
X
X
Nevada
X
X
X
X
X
X
New Hampshire
X
X
X
X
X
X
New Jersey
X
X
X
X
New Mexico
X
X
X
New York
X
X
X
X
X
X
X
North Carolina
X
North Dakota
X
X
X
X
X
Ohio
X
X
X
X
X
X
X
Oklahoma
X
X
X
X
X
X
Oregon
X
X
X
Pennsylvania
X
X
X
Rhode Island
X
X
X
X
X
X
South Carolina
X
X
X
X
X
X
X
South Dakota
X
X
X
Tennessee
X
X
X
X
X
X
X
X
X
Texas
X
X
X
X
X
X
X
Utah
NR
NR
NR
NR
NR
NR
NR
NR
NR
Vermont
X
X
X
X
X
X
X
Virginia
X
X
X
X
X
X
Washington
X
West Virginia
X
X
X
X
X
X
X
Wisconsin
X
X
X
X
X
X
Wyoming
X
X
X
X
X
X
X
X
Totals
42
44
36
36
35
35
15
14
14
NOTES: States that reported contracting with a vendor to administer the FFS pharmacy benefit were asked to report which services were provided by a vendor as of July 1, 2019. “NR” = Not Reporting.SOURCE: KFF / Health Management Associates 2019 Survey of Medicaid Officials in 50 states and DC conducted by Health Management Associates, April 2020.
Appendix Table 3: PBM Transparency Requirements in Place, July 1, 2019
State
Spread Pricing Arrangements Prohibited as of 7/1/2019?
PBM Transparency/Reporting Requirements in Place FY 2020?
FY 2020 Comments
Alabama
N/A
N/A
Alaska
N/A
N/A
Arizona
No
Yes
MCOs will report the amount paid by the PBM to the network pharmacy in FY 2020.
Arkansas
No
Yes
Legislation effective 7/24/19 to prevent spread pricing. Spread pricing currently reported and attested to each month.
California
No
No
Colorado
NR
NR
NR
Connecticut
N/A
N/A
Delaware
No
Yes
MCO must report actual paid amout to provider on submitted encounter claim.
DC
No
No
Florida
No
Yes
PBM financial records are inspected and audited regarding all financial terms and arrangements with the PBM. Pharmacies have encounter claim submission requirements. MCOs must submit compliance reports.
Georgia
Yes
Yes
State legislature requires aggregrate reporting of pharmacy expenditures.
Hawaii
No
No
Idaho
N/A
N/A
Illinois
No
Yes
New statutory regulatory transparency requirements on PBMs are effective 07/01/2020.No changes to MCO contracts/requirements.
Indiana
No
Yes
Annually, MCOs are required to provide the Medicaid agency with the aggregate amount paid to pharmacies.
Iowa
Yes
No
Kansas
Yes
Yes
Pass-through pricing on encounters with requirement for a basis of cost determination and a reimbursement policy give specific reimbursement direction to the MCO and PBM, which therefore limits spread pricing. The state fiscal agent also system checks all MCO encounters based on state policy.
Kentucky
No
Yes
MCOs are required to submit aggregated data via template to the department on a monthly basis.
Louisiana
Yes
Yes
MCOS are legislatively mandated to submit transparency reports.
Maine
N/A
N/A
Maryland
No
Yes
Effective 2021, MCOS must eliminate spread pricing from contracts. The state is adding the requirement to contracts effective 1/1/2020, allow one year to come into compliance.
Massachusetts
No
Yes
MCOs have a reporting requirement.
Michigan
Yes
Yes
PBM spread pricing prohibition reporting will be expanded and inclusion of PBM contract disclosure provisions was added.
Minnesota
Yes
Yes
A new PBM licensure law was passed during the 2019 legislative session.
Mississippi
Yes
Yes
MCOs have a monthly reporting requirement to Division of Medicaid.
Missouri
N/A
N/A
Montana
N/A
N/A
Nebraska
No
Yes
MCOs must submit monthly PDL load report, pharmacy claims report, and quarterly PDL compliance report.
Nevada
No
No
New Hampshire
No
Yes
MCOs must report encounter data and claims payment data to the Department.
New Jersey
Yes
No
New Mexico
No
Yes
MCOs are required to report quarterly to our State Medicaid Agency.
New York
No
Yes
MCOs (and their subcontracted PBMs) will be subject to quarterly reporting, which will require the disclosure of all sources and amounts of income, payments and financial benefits paid to the PBM for PBM services rendered on behalf of the MCO. This includes all rebates, clawbacks, credits, manufacturer fees, administrative payments, and other income streams or benefits received by the PBM.
North Carolina
N/A
N/A
North Dakota
Yes
No
Ohio
Yes
Yes
MCOs have financial reporting requirements, etc.
Oklahoma
N/A
N/A
Oregon
No
Yes
Additional MCO requirements were written into the 2020 MCO contracts.
Pennsylvania
No
Yes
The 2019 MCO Agreement requires quarterly transparency reporting as well as ongoing transparent outpatient drug encounters submission. The encounters must include the ingredient cost and dispensing fee paid to the dispensing provider.
Rhode Island
No
No
South Carolina
No
Yes
MCO contracts require MCOs to provide claim-level pharmacy reimbursement detail, reflecting the amount paid by the PBM to the pharmacy provider.
South Dakota
N/A
N/A
Tennessee
N/A
N/A
Texas
Yes
Yes
There are multiple accounting and financial reporting requirements in the Uniform Managed Care Contract. This includes financial disclosures for pharmacy services.
Utah
NR
NR
NR
Vermont
N/A
N/A
Virginia
No
Yes
MCOs must submit to the Agency,the PBM paid amount to the pharmacy for the drug and the dispensing.
Washington
No
Yes
Plans are required to report the spread kept by the PBM to the Agency.
West Virginia
N/A
N/A
Wisconsin
N/A
N/A
Wyoming
N/A
N/A
NOTES: States were asked to report if spread pricing arrangements in MCO subcontracts with PBMs were prohibited and if MCOs are subject to other PBM transparency requirements as of July 1, 2019. Spread pricing refers to the difference between the payment the PBM receives from the MCO and the reimbursement amount it pays to the pharmacy dispensing to the beneficiary.“NR” = Not Reporting.SOURCE: KFF / Health Management Associates 2019 Survey of Medicaid Officials in 50 states and DC conducted by Health Management Associates, April 2020.
Appendix Table 4: State Entity Responsible for Review, July 1, 2019
State
New PDL Drugs
Step Therapy Criteria
PA Criteria
Orphan/Expedited Review Drugs
Alabama
P&T Committee
Medicaid agency
Medicaid agency
Medicaid agency
Alaska
P&T Committee
DUR Board
DUR Board
Medicaid agency
Arizona
P&T Committee
P&T Committee
Other
P&T Committee
Arkansas
Other
N/A — No Step Therapy
DUR Board
DUR Board
California
Medicaid agency
Medicaid agency
Medicaid agency
Medicaid agency
Colorado
P&T Committee
DUR Board
DUR Board
DUR Board
Connecticut
P&T Committee
Other
Medicaid agency
Other
Delaware
P&T Committee
DUR Board
Medicaid agency
Medicaid agency
DC
P&T Committee
DUR Board
DUR Board
DUR Board
Florida
P&T Committee
DUR Board
Medicaid agency
Medicaid agency
Georgia
DUR Board
Medicaid agency
Medicaid agency
DUR Board
Hawaii
N/A — No PDL
N/A — No Step Therapy
NR
Medicaid agency
Idaho
P&T Committee
Medicaid agency
Medicaid agency
P&T Committee
Illinois
P&T Committee
DUR Board
Medicaid agency
P&T Committee
Indiana
Other
Other
Other
Other
Iowa
P&T Committee
P&T Committee
DUR Board
Other
Kansas
Medicaid agency
Medicaid agency
Other
Other
Kentucky
P&T Committee
P&T Committee
P&T Committee
P&T Committee
Louisiana
P&T Committee
N/A — No Step Therapy
Other
P&T Committee
Maine
P&T Committee
P&T Committee
P&T Committee
DUR Board
Maryland
P&T Committee
Medicaid agency
Medicaid agency
Other
Massachusetts
Medicaid agency
Medicaid agency
Medicaid agency
Medicaid agency
Michigan
Other
Other
Other
Other
Minnesota
P&T Committee
N/A — No Step Therapy
P&T Committee
P&T Committee
Mississippi
P&T Committee
Other
Other
Other
Missouri
Medicaid agency
Medicaid agency
Medicaid agency
Medicaid agency
Montana
Medicaid agency
DUR Board
DUR Board
DUR Board
Nebraska
P&T Committee
Other
Other
Medicaid agency
Nevada
P&T Committee
Medicaid agency
DUR Board
DUR Board
New Hampshire
Medicaid agency
Medicaid agency
Medicaid agency
Other
New Jersey
N/A — No PDL
DUR Board
DUR Board
Medicaid agency
New Mexico
N/A — No PDL
N/A — No Step Therapy
Other
Other
New York
DUR Board
DUR Board
DUR Board
Other
North Carolina
P&T Committee
Medicaid agency
Medicaid agency
P&T Committee
North Dakota
DUR Board
DUR Board
DUR Board
Medicaid agency
Ohio
P&T Committee
P&T Committee
P&T Committee
Medicaid agency
Oklahoma
DUR Board
DUR Board
DUR Board
DUR Board
Oregon
P&T Committee
P&T Committee
P&T Committee
P&T Committee
Pennsylvania
P&T Committee
P&T Committee
DUR Board
DUR Board
Rhode Island
P&T Committee
P&T Committee
P&T Committee
Other
South Carolina
P&T Committee
Medicaid agency
Medicaid agency
Medicaid agency
South Dakota
N/A — No PDL
P&T Committee
P&T Committee
P&T Committee
Tennessee
P&T Committee
P&T Committee
P&T Committee
P&T Committee
Texas
DUR Board
DUR Board
DUR Board
Medicaid agency
Utah
NR
NR
NR
NR
Vermont
DUR Board
DUR Board
DUR Board
DUR Board
Virginia
P&T Committee
P&T Committee
Other
DUR Board
Washington
Other
Medicaid agency
Medicaid agency
Medicaid agency
West Virginia
P&T Committee
DUR Board
DUR Board
DUR Board
Wisconsin
Medicaid agency
Medicaid agency
Medicaid agency
Medicaid agency
Wyoming
P&T Committee
P&T Committee
P&T Committee
Medicaid agency
NOTES: States were asked to indicate the entity reponsible for new drugs for PDL placement, step therapy criteria, PA criteria and orphan/expedited review drugs as of July 1, 2019. Pharmacy and therapeutics (P&T) committees or drug utilization review (DUR) board are committees of physicians and pharmacists that help inform the development of the PDL, review drugs, and develop coverage decisions. “NR” = Not Reporting. This table has been modified for states that say “other” and don’t have have PDL Committee, Step Therapy, and PA criteriaSOURCE: KFF / Health Management Associates 2019 Survey of Medicaid Officials in 50 states and DC conducted by Health Management Associates, April 2020.
Appendix Table 5: Frequency of Reviews, July 1, 2019
State
New PDL Drugs
Step Therapy Criteria
PA Criteria
Comments
Alabama
Other
As needed
As needed
Quarterly PDL meetings
Alaska
Annually
As needed
As needed
Arizona
Annually
Annually
As needed
Arkansas
Other
N/A — no step therapy
As needed
PDL or DRC meets and reviews quarterly
California
As needed
As needed
As needed
Colorado
Other
Other
Other
PDL drug classes at least annually; non-PDL varies
Connecticut
Annually
As needed
As needed
Delaware
Annually
As needed
As needed
DC
Other
As needed
As needed
Quarterly PDL meetings
Florida
Annually
As needed
As needed
Quantity and age limitation recommendations are reviewed as needed.
Georgia
Other
Other
Other
PDL reviewed quarterly; completion of entire PDL review yearly
Hawaii
N/A — no PDL
N/A — no step therapy
As needed
Idaho
Annually
Other
Other
Department creates all step edits and criteria.The P&T committee suggests changes for specific drugs during PDL review of that drug.
Illinois
As needed
As needed
As needed
Indiana
Other
As needed
As needed
Therapeutics Committee reviews PDL biannually
Iowa
Annually
Annually
Annually
Kansas
As needed
As needed
As needed
Kentucky
Annually
As needed
As needed
Louisiana
Annually
N/A — no step therapy
As needed
Maine
Other
Other
Other
Quarterly meetings and an annual meeting
Maryland
Annually
As needed
As needed
Only drugs from PDL classes reviewed by P&T Committee. Internal agency process for clinical criteria review for most drugs (95%+). The internal agency committee meets monthly and is comprised of physicians and pharmacists.
Massachusetts
As needed
As needed
As needed
Therapeutic classes reviewed when new drugs enter the class or as needed (at least bi-annually).
Michigan
Annually
Annually
Annually
Minnesota
As needed
N/A — no step therapy
As needed
Mississippi
Other
As needed
Annually
Quarterly PDL reviews
Missouri
Annually
Annually
As needed
Montana
Annually
As needed
As needed
Nebraska
Other
As needed
As needed
PDL reviewed biannually
Nevada
Other
NR
Other
The PDL and PA criteria are reviewed by each Board on a quarterly basis.
New Hampshire
Other
As needed
As needed
The PDL reviewed at each DUR Board Meeting.
New Jersey
N/A — no PDL
As needed
As needed
New Mexico
N/A — no PDL
N/A — no step therapy
As needed
New York
As needed
As needed
As needed
North Carolina
Annually
Other
Other
Step therapy and PA criteria are reviewed monthly by the P&T Committee
North Dakota
Annually
Annually
Annually
Ohio
Other
Other
Other
Quarterly reviews
Oklahoma
As needed
Annually
Annually
Every category reviewed annually for changes
Oregon
As needed
As needed
As needed
Pennsylvania
Annually
NR
As needed
Rhode Island
Annually
As needed
As needed
South Carolina
As needed
As needed
As needed
South Dakota
N/A — no PDL
Annually
Annually
Tennessee
Other
Other
Other
The P&T Committee meets once per quarter to address PDL, Step therapy, and/or PA criteria for established classes and new drugs to market.
Texas
Other
NR
Other
The DUR Board meets quarterly to develop and submit recommendations for the Texas Medicaid preferred drug list and clinical prior authorizations on outpatient prescription drugs.
Utah
NR
NR
NR
Vermont
Other
Other
Other
Class reviews occur at least every 2 years. Meetings are about every six weeks.
Virginia
Annually
Annually
Annually
Washington
Other
Other
Other
Intent to review all at least annually
West Virginia
Annually
Annually
As needed
Wisconsin
Other
As needed
As needed
The PDL is reviewed on a semi-annual basis
Wyoming
Annually
As needed
As needed
NOTES:States were asked how often PDLs, step therapy criteria and PA criteria are reviewed by DUR boards and/or P&T committees as of July 1, 2019. Pharmacy and therapeutics (P&T) committees or drug utilization review (DUR) board are committees of physicians and pharmacists that help inform the development of the PDL, review drugs, and develop coverage decisions. “NR” = Not Reporting.SOURCE: KFF / Health Management Associates 2019 Survey of Medicaid Officials in 50 states and DC conducted by Health Management Associates, April 2020.
Appendix Table 6: States Limiting Number of FFS Prescriptions, July 1, 2019
Limit of 3 presciptions per month for adults with extension of benefits for up to 6 prescriptions maximum.
No
Medications for tobacco cessation, family planning
California
Limit of 6 prescriptions per month.
Yes
Nursing facility patients, adult and pediatric subacute care patientsFamily planning drugs, drugs for the treatment of Acquired Immune Deficiency Syndrome (AIDS) or AIDS-related conditions, cancer drugsClaims for newborns when the baby uses the mother’s identification number, claims that must be submitted on paper (claims with required attachments)
Florida
Limit on controlled substances of 4 fills per month for all recipients excluding recipients with a diagnosis of sickle cell or cancer.
Yes
Recipients with sickle cell or cancer recipients may receive 6 fills per month.
Georgia
Limit of 5 narcotic prescriptions per month.
Yes
None
Illinois
Limit of 4 presciptions per month,additional prescriptions require review.
EPSDT beneficiaries, antiretroviral drugs, preferred PDL drugs, anti-rejection drugs used for transplant patients, state specified anti-emetics and chemotherapy drugs, interferons, immune globulins, antihemophilic drugs, mental health drugs, all contraceptives
Louisiana
Limit of 4 prescriptions per month.
Yes
Beneficiaries under 21, beneficiaries in Long Term Care, pregnant women
Mississippi
Limit of 6 prescriptions per month with no more than 2 brand-name drugs.
No
Preferred brands on the PDL do not count toward the 2 brand limit. Limit does not apply to beneficiaries in a LTC facility. EPSDT beneficiaries may receive prescriptions beyond the limit with prior authorization.
Oklahoma
Limit of 6 prescriptions per month with no more than 2 brand-name drugs. For HCBS waiver recipients, limit of 3 brand-name drugs and 10 generic drugs per month.
Limit of 5 prescriptions per month with no more than 2 brand-name drugs for adults 21 and over who are not in an institution or HCBS waiver.
Yes
Antidepressants, antineoplastics, antiparkinsonian agents, antitubercular agents,antivirals and antiretrovirals, cardiovascular agents, clotting factor, contraceptives, insulins, oral hypoglycemics, dialysis medications, flu vaccine, hematopoietic agents, Hepatitis C drugs, immunosuppressives, iron preparations, lipotropics, long-acting antipsychotics, respiratory drugs, smoking cessation products, thyroid hormones, transplant agents, and other miscellanious agents (MAT therapy, narcan, asthma and diabetics supplies, inhaled antibiotics, and pancreatic enzymes)
Texas
Limit of 3 prescriptions per month for adults.
No
No
Wisconsin
Limit of 5 opioid prescription fills per month.
Yes
Schedule II – V opioids are included, with the exception of suboxone film and tablet, buprenorphine tablet, methadone solution, and opioid antitussive liquid
NOTES: ‘NOTES: States were asked if there is a monthly or other limit on the number of FFS prescriptions an enrollee may receive as of July 1, 2019. “NR” = not reporting; “HCBS waiver” = Section 1915(c) Home and Community based Services waiver.SOURCE: KFF / Health Management Associates 2019 Survey of Medicaid Officials in 50 states and DC conducted by Health Management Associates, April 2020.
Appendix Table 7: FFS Policies/Tools to Promote Generic Utilization, July 1, 2019
State
Mandatory Generics
Lower Copays for Generics
Provider Education
PDL Placement
Higher DF for Generic Substitution
Tiered DF Based on Generic Util.
Other
No Policies or Tools
Alabama
X
Alaska
X
X
Arizona
X
Arkansas
X
X
X
X
California
X
Colorado
X
Connecticut
X
X
Delaware
X
DC
X
X
Florida
X
Georgia
X
Hawaii
X
X
Idaho
X
Illinois
X
X
X
Indiana
X
Iowa
X
Kansas
X
Kentucky
X
X
Louisiana
X
X
X
Maine
X
X
Maryland
X
X
Massachusetts
X
X
Michigan
X
X
Minnesota
X
X
Mississippi
X
X
Missouri
X
X
Montana
X
X
Nebraska
X
X
Nevada
X
New Hampshire
X
New Jersey
X
New Mexico
X
X
New York
X
X
X
North Carolina
X
X
North Dakota
X
X
Ohio
X
X
Oklahoma
X
X
Oregon
X
Pennsylvania
X
X
Rhode Island
X
South Carolina
X
X
South Dakota
X
X
Tennessee
X
X
X
Texas
X
X
Utah
NR
NR
NR
NR
NR
NR
NR
NR
Vermont
X
Virginia
X
X
Washington
West Virginia
X
Wisconsin
X
X
Wyoming
X
X
Totals
41
17
13
5
3
1
3
3
NOTES: States were asked to report policies or tools used to promote generic drug utilization as of July 1, 2019. “NR” = Not Reporting; “DF” = dispensing feeSOURCE: KFF / Health Management Associates 2019 Survey of Medicaid Officials in 50 states and DC conducted by Health Management Associates, April 2020.
Appendix Table 8: Supplemental Rebate Programs, July 1, 2019
State
Supplemental Rebate Program in Place?
Supplemental Rebate Negotiator
Negotiator Competively Procured?
Alabama
Yes
Medicaid Agency
No
Alaska
Yes
Other Vendor
Yes
Arizona
Yes
Multiple Entities
Yes
Arkansas
Yes
Other Vendor
Yes
California
Yes
Medicaid Agency
No
Colorado
Yes
PBM
Yes
Connecticut
Yes
Purchasing Pool
Yes
Delaware
Yes
Purchasing Pool
Yes
DC
Yes
Purchasing Pool
Yes
Florida
Yes
Other Vendor
Yes
Georgia
Yes
Multiple Entities
Yes
Hawaii
No
N/A
N/A
Idaho
Yes
Purchasing Pool
Yes
Illinois
Yes
Medicaid Agency
No
Indiana
Yes
PBM
Yes
Iowa
Yes
Purchasing Pool
Yes
Kansas
Yes
Medicaid Agency
No
Kentucky
Yes
Purchasing Pool
Yes
Louisiana
Yes
Purchasing Pool
Yes
Maine
Yes
Purchasing Pool
Yes
Maryland
Yes
Purchasing Pool
No
Massachusetts
Yes
Medicaid Agency
No
Michigan
Yes
PBM
Yes
Minnesota
Yes
Purchasing Pool
Yes
Mississippi
Yes
Purchasing Pool
Yes
Missouri
Yes
Other Vendor
Yes
Montana
Yes
Purchasing Pool
Yes
Nebraska
Yes
Purchasing Pool
Yes
Nevada
Yes
PBM
No
New Hampshire
Yes
Purchasing Pool
Yes
New Jersey
No
N/A
N/A
New Mexico
No
N/A
N/A
New York
Yes
PBM
Yes
North Carolina
Yes
Purchasing Pool
No
North Dakota
Yes
Purchasing Pool
Yes
Ohio
Yes
Purchasing Pool
No
Oklahoma
Yes
Purchasing Pool
No
Oregon
Yes
Purchasing Pool
Yes
Pennsylvania
Yes
Other Vendor
Yes
Rhode Island
Yes
Purchasing Pool
No
South Carolina
Yes
Purchasing Pool
Yes
South Dakota
No
N/A
N/A
Tennessee
Yes
Multiple Entities
Yes
Texas
Yes
Other Vendor
Yes
Utah
NR
NR
NR
Vermont
Yes
Purchasing Pool
Yes
Virginia
Yes
PBM
Yes
Washington
Yes
Multiple Entities
Yes
West Virginia
Yes
Other Vendor
Yes
Wisconsin
Yes
Purchasing Pool
Yes
Wyoming
Yes
Purchasing Pool
Yes
NOTES:States were asked if they have supplemental rebate agreements in place, what entity negotiates supplemental rebates and if the state’s negotiator is selected through competitive procurement as of July 1, 2019. “NR” = Not Reporting.SOURCE: KFF / Health Management Associates 2019 Survey of Medicaid Officials in 50 states and DC conducted by Health Management Associates, April 2020.
Appendix Table 9: MCO Rebate Requirements, July 1, 2019
State
MCOs permitted to negotiate rebates?
PBM required to pass-through supplemental rebates?
MCO required to report aggregate rebates?
Alabama
N/A — no MCOs
N/A — no MCOs
N/A — no MCOs
Alaska
N/A — no MCOs
N/A — no MCOs
N/A — no MCOs
Arizona
Yes — for other PDL drugs but not uniform classes
Yes
Yes
Arkansas
No — not for any drugs
N/A
N/A
California
Yes
Yes
Yes
Colorado
NR
NR
NR
Connecticut
N/A — no MCOs
N/A — no MCOs
N/A — no MCOs
Delaware
Yes — for other PDL drugs but not uniform classes
No
No
DC
Yes
No
No
Florida
No — not for any drugs
N/A
N/A
Georgia
Yes
No
No
Hawaii
Yes
Yes
Yes
Idaho
N/A — no MCOs
N/A — no MCOs
N/A — no MCOs
Illinois
Yes
No
No
Indiana
Yes
No
No
Iowa
No — not for any drugs
N/A
N/A
Kansas
Yes — for uniform classes and other PDL drugs
Yes
Yes
Kentucky
Yes
No
Yes
Louisiana
No — not for any drugs
N/A
N/A
Maine
N/A — no MCOs
N/A — no MCOs
N/A — no MCOs
Maryland
Yes
No
Yes
Massachusetts
Yes — for other PDL drugs but not uniform classes
No
Yes
Michigan
Yes
No
No
Minnesota
Yes — for other PDL drugs but not uniform classes
Yes
Yes
Mississippi
No — not for any drugs
N/A
N/A
Missouri
N/A — full Rx Carve-out
N/A — full Rx Carve-out
N/A — full Rx Carve-out
Montana
N/A — no MCOs
N/A — no MCOs
N/A — no MCOs
Nebraska
No — not for any drugs
N/A
N/A
Nevada
Yes
Yes
Yes
New Hampshire
Yes
Yes
Yes
New Jersey
Yes
No
Yes
New Mexico
Yes
NR
NR
New York
Yes
No
Yes
North Carolina
N/A — no MCOs
N/A — no MCOs
N/A — no MCOs
North Dakota
Yes — for other PDL drugs but not uniform classes
No
No
Ohio
Yes
Yes
Yes
Oklahoma
N/A — no MCOs
N/A — no MCOs
N/A — no MCOs
Oregon
Yes
No
No
Pennsylvania
Yes
NR
NR
Rhode Island
Yes
No
NR
South Carolina
Yes — for other PDL drugs but not uniform classes
No
Yes
South Dakota
N/A — no MCOs
N/A — no MCOs
N/A — no MCOs
Tennessee
N/A — full Rx Carve-out
N/A — full Rx Carve-out
N/A — full Rx Carve-out
Texas
No — not for any drugs
N/A
N/A
Utah
NR
NR
NR
Vermont
N/A — no MCOs
N/A — no MCOs
N/A — no MCOs
Virginia
Yes — for other PDL drugs but not uniform classes
No
Yes
Washington
Yes — for other PDL drugs but not uniform classes
Yes
Yes
West Virginia
N/A — full Rx Carve-out
N/A — full Rx Carve-out
N/A — full Rx Carve-out
Wisconsin
N/A — full Rx Carve-out
N/A — full Rx Carve-out
N/A — full Rx Carve-out
Wyoming
N/A — no MCOs
N/A — no MCOs
N/A — no MCOs
NOTES:States were asked if they have supplemental rebate agreements in place, what entity negotiates supplemental rebates and if the state’s negotiator is selected through competitive procurement as of July 1, 2019. “NR” = Not Reporting.SOURCE: KFF / Health Management Associates 2019 Survey of Medicaid Officials in 50 states and DC conducted by Health Management Associates, April 2020.
Appendix Table 10: FFS Pharmacy Copayment Requirements for Non-Exempt Adults, July 1, 2019
State
Required for Non-exempt Adults?
FFS Rx Reimbursement Decreased by Copay Amount?
Copay Requirement for Non-Expansion Adults
Copay Requirement for Expansion Adults
MCO Copay Requirements Differ?
Alabama
Yes
Yes
$0-$3.90 based on drug cost
Non-expansion state
N/A ‒ No MCOs
Alaska
Yes
Yes
$0.50/$3.50 for under/over $50 drug cost
Same
N/A ‒ No MCOs
Arizona
No
N/A
N/A
N/A
N/A
Arkansas
Yes
Yes
Sliding scale based on drug cost
None
Yes ‒ No copays
California
No
N/A
N/A
N/A
N/A
Colorado
Yes
Yes
$3 generic and brand; some $0 exceptions apply
Same
No
Connecticut
No
N/A
N/A
N/A
N/A ‒ No MCOs
Delaware
Yes
Yes
$0.50-$3.00 based on drug cost; 30-day max of $15
Same
No
DC
Yes
Yes
$1 brand and generic
Same
Yes ‒ No copays
Florida
No
N/A
N/A
Non-expansion state
N/A
Georgia
Yes
Yes
$0.50 preferred; $3 non-preferred
Non-expansion state
No
Hawaii
No
N/A
N/A
N/A
N/A
Idaho
No
N/A
N/A
Non-expansion state
N/A ‒ No MCOs
Illinois
Yes
Yes
$2 generic; $3 brand
Same
Yes ‒ MCO option up to FFS amount
Indiana
Yes
Yes
$3 brand and generic
$4 preferred; $8 non-preferred
No
Iowa
Yes
Yes
$1 brand and generic
None
Yes ‒ No copays
Kansas
Yes
Yes
$3 brand and generic
Non-expansion state
Yes ‒ No copays
Kentucky
Yes
No
$1 generic and preferred brand on formulary over generic equivalent; $4 brand
Same
No
Louisiana
Yes
Yes
$0.50-$3.00 based on drug cost
Same
No
Maine
Yes
No
$3 generic and brand (except tobacco cessation), not to exceed $30 PMPM
Same
N/A ‒ No MCOs
Maryland
Yes
Yes
$1 generic and preferred brand; $3 other brand
Same
Yes ‒ MCO option
Massachusetts
Yes
Yes
$3.65 all drugs except $1 for generic, anti-hypertensives, diabetes, and hypercholesterolemia drugs
Same
No
Michigan
Yes
Yes
$1 for generic and preferred brand, $3 non-preferred brand
$4 for generic and preferred brand, $8 non-preferred brand
Yes ‒ No copays except for ACA expansion population
Minnesota
Yes
Yes
$1 generic; $3 brand
Same
No
Mississippi
Yes
Yes
$3 brand and generic
Non-expansion state
Yes ‒ No copays
Missouri
Yes
No
$0.50-$2 based on drug cost
Non-expansion state
N/A ‒ Rx Carve-out
Montana
Yes
Yes
$4 preferred brands; $8 non-preferred and non-PDL brands; no copays generics and select therapeutic classes
Same
N/A ‒ No MCOs
Nebraska
Yes
Yes
$2 generic; $3 brand
Non-expansion state
Yes ‒ MCOs may waive
Nevada
No
N/A
N/A
N/A
N/A
New Hampshire
Yes
Yes
$1 brand and generic
Same
No
New Jersey
No
N/A
N/A
N/A
N/A
New Mexico
No
N/A
N/A
N/A
N/A
New York
Yes
Yes
$1 generic, preferred brand, and brand less than generic; $3 non-preferred brand; $0.50 OTC
Same
No
North Carolina
Yes
Yes
$3 brand and generic
Non-expansion state
N/A ‒ No MCOs
North Dakota
Yes
Yes
$0 generic; $3 brand
Same
No
Ohio
Yes
No
$3 for drugs that require PA; $2 for selected brands
Same
Yes ‒ No copays
Oklahoma
Yes
Yes
$4 brand and generic
Non-expansion state
N/A ‒ No MCOs
Oregon
No
N/A
N/A
N/A
N/A
Pennsylvania
Yes
Yes
$1 generic; $3 for brands; many drug classes are copay exempt
Same
No
Rhode Island
No
N/A
N/A
N/A
N/A
South Carolina
Yes
Yes
$3.40 brand and generic
Non-expansion state
No
South Dakota
Yes
Yes
$1 generic; $3.30 brand
Non-expansion state
N/A ‒ No MCOs
Tennessee
Yes
Yes
$1.50 generics and plan-preferred brands (brand as generics); $3.00 for brands
Non-expansion state
N/A ‒ Rx Carve-out
Texas
No
N/A
N/A
Non-expansion state
N/A
Utah
NR
NR
NR
NR
NR
Vermont
Yes
Yes
$1-$3 depending on drug cost
Same
N/A ‒ No MCOs
Virginia
Yes
Yes
$1 generic; $3 for brands
Same
Yes ‒ No copays
Washington
No
N/A
N/A
N/A
N/A
West Virginia
Yes
Yes
$0-$3 depending on drug cost
Same
N/A ‒ Rx Carve-out
Wisconsin
Yes
Yes
$.050 OTCs and diabetic supplies; $1 generics and compunds; $3 brands; not to exceed $12 PMPM per provider
Non-expansion state
N/A ‒ Rx Carve-out
Wyoming
Yes
Yes
$0.65 generics; $3.65 brands
Non-expansion state
N/A ‒ No MCOs
NOTES: States were asked to report if pharmacy copayments were required for adults and any differences for adults covered by the Medicaid expansion as of July 1, 2019. States were also asked if MCO copayments differ from those in FFS as of July 1, 2019. “Non-expansion state” = state has not implemented ACA Medicaid expansion as of Juy 1, 2019; “NR” = not reporting; “OTC” = over the counter drug.SOURCE: KFF / Health Management Associates 2019 Survey of Medicaid Officials in 50 states and DC conducted by Health Management Associates, April 2020.
Appendix Table 11: 340B Policies in Place, July 1, 2019
State
340B Entities Carved Into Medicaid FFS?
340B Entities Carved Into Managed Care?
340B Entites Allowed to Contract with Outside Pharmacies (FFS)?
340B Entities Allowed to Contract with Outside Pharmacies (Managed Care)?
Alabama
Yes
N/A — No MCOs
No
N/A — No MCOs
Alaska
Yes
N/A — No MCOs
No
N/A — No MCOs
Arizona
Yes
Yes
No
No
Arkansas
Yes
Yes
No
No
California
Yes
Yes
Yes
Yes
Colorado
Yes
Yes
No
No
Connecticut
Yes
N/A — No MCOs
Yes
N/A — No MCOs
Delaware
Yes
Yes
Yes
Yes
DC
Yes
Yes
No
Yes
Florida
Yes
Yes
No
No
Georgia
Yes
Yes
No
No
Hawaii
Yes
Yes
Yes
Yes
Idaho
Yes
N/A — No MCOs
No
N/A — No MCOs
Illinois
Yes
Yes
No
No
Indiana
Yes
Yes
No
Yes
Iowa
Yes
Yes
No
No
Kansas
Yes
Yes
No
No
Kentucky
Yes
Yes
No
No
Louisiana
Yes
No
No
Yes
Maine
Yes
N/A — No MCOs
No
N/A — No MCOs
Maryland
Yes
Yes
Yes
Yes
Massachusetts
Yes
Yes
Yes
Yes
Michigan
Yes
Yes
Yes
Yes
Minnesota
Yes
Yes
No
No
Mississippi
Yes
Yes
No
No
Missouri
Yes
N/A — Full Rx Carve-out
No
N/A — Full Rx Carve-out
Montana
Yes
N/A — No MCOs
Yes
N/A — No MCOs
Nebraska
Yes
No
No
No
Nevada
Yes
Yes
Yes
Yes
New Hampshire
No
No
No
No
New Jersey
Yes
Yes
No
Yes
New Mexico
Yes
Yes
Yes
Yes
New York
Yes
Yes
Yes
Yes
North Carolina
Yes
N/A — No MCOs
Yes
N/A — No MCOs
North Dakota
Yes
No
No
No
Ohio
Yes
Yes
No
No
Oklahoma
Yes
N/A — No MCOs
Yes
N/A — No MCOs
Oregon
Yes
Yes
No
Yes
Pennsylvania
Yes
Yes
No
No
Rhode Island
Yes
Yes
No
Yes
South Carolina
Yes
Yes
No
Yes
South Dakota
No
N/A — No MCOs
No
N/A — No MCOs
Tennessee
Yes
N/A — Full Rx Carve-out
No
N/A — Full Rx Carve-out
Texas
Yes
Yes
Yes
Yes
Utah
NR
NR
NR
NR
Vermont
Yes
N/A — No MCOs
No
N/A — No MCOs
Virginia
Yes
Yes
No
No
Washington
Yes
No
No
No
West Virginia
Yes
N/A — Full Rx Carve-out
No
N/A — Full Rx Carve-out
Wisconsin
Yes
N/A — Full Rx Carve-out
No
N/A — Full Rx Carve-out
Wyoming
Yes
N/A — No MCOs
No
N/A — No MCOs
NOTES: States were asked about their policies related to 340B entities as of July 1, 2019; carve in to FFS or managed care means that drugs purchased under the 340B program are used for Medicaid beneficiaries. Contract pharmacies refer to pharmacy arrangements with 340B entities to provide pharmacy services to their patients. NR” = Not Reporting.SOURCE: KFF / Health Management Associates 2019 Survey of Medicaid Officials in 50 states and DC conducted by Health Management Associates, April 2020.
The ACA extended federal statutory rebates to prescription drugs provided under Medicaid managed care arrangements. Prior to the ACA, manufacturers only had to pay rebates for outpatient drugs purchased on a fee-for-service basis, not those purchased through managed care. ↩︎
Wisconsin reported that pharmacy services are carved out for most MCO enrollees with the exception of a small population in the Family Care Partnership program which delivers long term care and acute care benefits, including pharmacy benefits. ↩︎
Chimeric antigen receptor T-cell (CAR-T) therapy is a type of immunotherapy that uses a patient’s own genetically modified T-cells to find and kill cancer. ↩︎
The state has likely determined that the risk pool is no longer needed as the cost for these agents has decreased significantly since their introduction and these costs are also now adequately reflected in capitation rates. ↩︎
Since California responded to the survey, the state has awarded a multi-year contract to Magellan for claims processing, utilization management, and rebate administration. See California Department of Health Care Services, “Notice of Intent to Award,” (November 7, 2019), https://www.dhcs.ca.gov/provgovpart/rfa_rfp/Documents/MCRx-NOIA.pdf. ↩︎
Actual Acquisition Cost (AAC): The state Medicaid agency’s determination of the actual price pharmacies paid for an outpatient prescription drug. ↩︎
Maximum Allowable Cost (MAC): The maximum reimbursement rates, set by the state Medicaid agency, for generic drugs and brand name drugs with generic versions available. ↩︎
This is based upon a review of 2018-2019 Medicaid pharmacy benefit administration RFPs (CA, IN, MI, and TN) and RFIs (NE, NV, and OH). ↩︎
States that reported that their fiscal intermediary (generally, Conduent, DXC, or Wipro) processes claims: AK, AL, CT, DE, HI, KS, LA, MA, MD, MO, MS, MT, NC, ND, NJ, NM, OR, PA, RI, TX, WI, and WV. Florida reported that its PBM is subcontractor of DXC. ↩︎
According to CMS, “spread pricing occurs when health plans contract with pharmacy benefit managers (PBMs) to manage their prescription drug benefits, and PBMs keep a portion of the amount paid to them by the health plans for prescription drugs instead of passing the full payments on to pharmacies.” See Centers for Medicare and Medicaid Services, “CMS Issues New Guidance Addressing Spread Pricing in Medicaid, Ensures Pharmacy Benefit Managers are not Up-Charging Taxpayers,” CMS Newsroom (May 15, 2019), https://www.cms.gov/newsroom/press-releases/cms-issues-new-guidance-addressing-spread-pricing-medicaid-ensures-pharmacy-benefit-managers-are-not. ↩︎
States that reported having no DUR Board conflict of interest policy: AZ, HI, ID, KY, LA, MO, NC, NJ, OK, and RI. ↩︎
Hawaii, New Jersey, and Oklahoma reported that there was no conflict-of-interest policy for their DUR boards and that they did not have a P&T committee. ↩︎
A few states reported changes to the statutory limits in FY 2020: three states (Arkansas, Iowa, and Oregon) added PA prohibitions or limits on Medication Assisted Treatment (MAT) drugs or drugs used to treat substance use disorders; Arkansas will also prohibit PA on cancer therapies; and North Dakota’s statutory limit will be eased by allowing Medicaid to place PA on drugs prescribed by severe outlier prescribers. ↩︎
States that reported that MCOs were required to follow the state’s FFS generic policies: AZ, DE, FL, IA, KS, LA, MA, MS, ND, NE, NM, and TX. ↩︎
Louisiana reported entering into an agreement with Asegua Therapeutics, as of July 15, 2019, for the state’s hepatitis C subscription model project. ↩︎
Five states (Illinois, Louisiana, New Hampshire, Ohio, and Pennsylvania) reported that a planned move to a single, unified PDL across FFS and managed care was expected to increase rebate collections; two states (Connecticut and Washington) reported plans to add additional therapeutic classes to their PDLs; two states (North Carolina and Washington) mentioned enhanced collections attributable to hepatitis C antiviral drugs; Massachusetts reported new direct negotiation state authority and CMS approval to enter into value-based agreements with manufacturers; Missouri indicated that grandfathering will be eliminated for most PDL classes; and West Virginia reported that the recent managed care pharmacy carve-out was expected to improve rebate collections. ↩︎
Oklahoma’s VBAs relate to financial outcomes, including adherence, costs and hospitalizations. If the drug fails to meet certain benchmarks, the manufacturer will make additional payments to the state in the form of a supplemental rebate. ↩︎
Under Washington’s VBA, the state has negotiated a guaranteed net unit price up to a certain threshold after which the cost to the state of the drug is nominal. ↩︎
Louisiana is also implementing a modified subscription model for hepatitis C antiviral drugs in FY 2020 in which the state pays the manufacturer a set amount for drugs, beyond which the state will continue to receive drugs at no additional cost. The state considers this policy to be an intrastate purchasing pool and did not report it as a VBA. ↩︎
“White bagging” refers to the practice of physicians ordering specialty drugs from a pharmacy to administer and billing the drugs under the pharmacy benefit rather than the medical benefit. ↩︎
Eligible covered entities include the following: federally qualified health centers (FQHCs), federally qualified health center look-alikes, native Hawaiian health centers, tribal/urban Indian health centers, Ryan White HIV/AIDS Program grantees, children’s hospitals, critical access hospitals, disproportionate share hospitals, freestanding cancer hospitals, rural referral centers, sole community hospitals, black lung clinics, comprehensive hemophilia diagnostic treatment centers, Title X family planning clinics, sexually transmitted disease clinics, and tuberculosis clinics. See MACPAC, The 340B Drug Pricing Program and Medicaid Drug Rebate Program: How They Interact (MACPAC, May 2018), https://www.macpac.gov/wp-content/uploads/2018/05/340B-Drug-Pricing-Program-and-Medicaid-Drug-Rebate-Program-How-They-Interact.pdf. ↩︎
Several states reported additional strategies to help remove 340B claims from files submitted to manufacturers for rebates: Kansas cross-references CE National Provider Identifiers (NPIs) and addresses to provide added assurance of billing accuracy along with performing batch invoice testing; Maryland requires 340B entities to notify the Medicaid agency finance division of their 340B status; entities are then confirmed on the HRSA file and the NPI is hard-coded into the MMIS to prevent rebate claims extraction; Massachusetts requires separate NPI numbers for 340B providers; Vermont performs a monthly manual claims reconciliation with CEs; Oklahoma invoices the CEs on a quarterly basis for the amount of rebates that would have been received. ↩︎
States are challenged by this requirement as the ceiling price is not available to them for claims processing, although it can be approximated through CMS rebate files. See 42 CFR § 447.502. ↩︎
As of July 1, 2019, only 11 of 34 non-carve-out MCO states responding to the survey prohibited spread pricing. (Colorado and Utah did not respond.) Of the states that allow spread pricing, only California, DC, Hawaii, Nevada, and Rhode Island did not have reporting requirements to identify the amount of the spread in their FY 2020 MCO contracts. California will be carving the pharmacy benefit out of MCOs in 2021; therefore, the requirement will not impact them in the future. ↩︎
Chimeric antigen receptor T-cell (CAR-T) therapy is a type of immunotherapy that uses a patient’s own genetically modified T-cells to find and kill cancer. ↩︎
Twelve states reported considering outcomes-based value-based arrangements (VBAs), though they also report challenges with VBAs (DC, IL, LA, ME, MI, MS, NC, NV, OK, OR, VA, and VT.) Other state strategies include MCO carve-outs (IN, TX), risk corridors (NJ), paying at invoice price (MA), and establishing a rare disease council, P&T subcommittee, or emerging therapies workgroup (MO, WA, and WY.) ↩︎
The nation’s low-wage workers face a particular kind of bind.
They tend to work in service industries — such as the restaurant, hospitality and retail sectors – that are especially at risk for loss of income during the COVID-19 pandemic, or in jobs such as health care workers, grocery store workers and delivery drivers, where they may continue to work but face a higher risk of contracting the disease.
According to a new KFF analysis, over 25 million nonelderly adults worked in low-wage jobs in 2018, putting them among the bottom 20 percent of earners. Such workers will have limited ability to absorb income declines or afford health care costs, finds the analysis, which examines the characteristics of such workers and the implications of the pandemic for their jobs, health, and financial security.
Key findings of the analysis include:
Most recent unemployment claim filings are for people who worked in service industries. Workers in these industries are disproportionately likely to be low-wage, with about a fifth of low-wage workers employed in each of the entertainment/accommodation/food services (20%) and retail (19%) industries, and another tenth in service (5%) or construction (5%).
Many low-wage workers are engaged in positions that are likely involved with delivery of goods and services to people who remain at home under stay at home orders (e.g., laborers/freight, stock and material movers, stockers/order fillers, and drivers/truck drivers).
5 million low-wage workers are in the health and social services industry, with the greatest number of those (1.3 million) working as aides or personal care workers (e.g., nursing assistants or personal care aides) whose jobs will bring them into frequent, close contact with patients.
A majority of low-wage workers are female (58% vs 47% of all workers), 57 percent are between the ages of 19 and 34, and a disproportionate share are Black and Hispanic.
One in five low-wage workers lacked health coverage in 2018, and the share likely is higher now amid the economic downturn. Even before the pandemic, many low-wage workers reported problems affording needed health care. Nearly one in ten (9%) low-wage workers reports that they are in fair or poor health, possibly putting them at increased risk for serious illness if they contract COVID-19.
For the full analysis, as well as other data and analyses related to the COVID-19 pandemic, visit kff.org.
The public health crisis caused by the coronavirus pandemic carries both health and economic implications. In addition to widespread illness and high death rates, social distancing policies required to address COVID-19 have led many businesses to cut hours, cease operations, or close altogether. People who work in certain industries, such as restaurant, hospitality, retail, and other service industries, are particularly at risk for loss of income. Those who maintain jobs amid the coronavirus outbreak, such as health care workers, grocery store workers, and delivery drivers, are at increased risk of contracting coronavirus since they remain exposed to other individuals. Many of these workers are low-wage workers and will have limited ability to absorb income declines or afford health care costs. Over 25 million nonelderly adults worked in low-wage jobs in 2018, meaning they were among the bottom 20% of earners among working nonelderly adults.1 This brief analyzes data on low-wage workers in the context of COVID-19 and discusses the implications of the pandemic for their jobs, health, and financial security.
What risks do low-wage workers face?
Low-wage workers are employed in jobs that are at high risk for loss of income. Recent unemployment filing data indicates that millions have filed for unemployment benefits in recent weeks, reflecting widespread layoffs. State comments on data filings indicate that most claims are for people previously employed in service industries, particularly accommodation and food services, with an increasing rate for people in retail, wholesale trade, and construction industries. Workers in these industries are disproportionately likely to be low-wage, with about a fifth of low-wage workers employed in each of the entertainment/accommodation/food services (20%) and retail (19%) industries, and another tenth in service (5%) or construction (5%) (Appendix Table 1).2 Low-wage workers who remain employed may be marginally employed or experience a loss of income. Data from another source3 indicates that a third of low-wage workers were employed part time (defined in this analysis as fewer than 35 hours per week) and may therefore be working fewer hours if hours were cut. The vast majority of low-wage workers (80%) were paid hourly, meaning if their hours are scaled back they lose pay directly. A large share (43%) of low-wage workers are employed in firms with fewer than 25 people, and small firms may be less able to weather the financial crisis.4
Low-wage workers who are still employed may face health risks due to the nature of their jobs. Common occupations for low-wage workers include cashiers and retail salespersons, many of whom may not be working as businesses have closed (Table 1); however, those who are working in “essential businesses” that remain open (such as grocery stores) are still in close contact with the public. Other top occupations, such as cooks and waiters/waitresses, may similarly still be working as restaurants move to delivery and take-out options, putting these workers in contact with colleagues and perhaps the public. A notable number of low-wage workers are engaged in positions that are likely involved with delivery of goods and services to people who remain at home under stay at home orders (e.g., laborers/freight, stock and material movers, stockers/order fillers, and drivers/truck drivers). Nearly one in ten (9%) low-wage workers reports that they are in fair or poor health,5 possibly putting them at increased risk for serious illness if they contract coronavirus.
Table 1: Top 10 Occupations Among Low-Wage Workers, 2018
Occupation
Number of Low-Wage Workers
Cashiers
1,660,200
Retail Salespersons
1,112,700
Cooks
1,083,900
Waiters and Waitresses
1,008,800
Customer Service Representatives
798,000
Laborers & Freight, Stock, and Material Movers
790,200
Janitors and Building Cleaners
756,400
Stockers and Order Fillers
652,800
Drivers/Sales Workers and Truck Drivers
550,200
Teaching Assistants
535,400
Figure 3: Financial Insecurity Among Low-Wage Workers, 2018Notes: Low-Wage Workers defined as those in bottom quintile of people who earned at least $1000 in past year and worked at least 20 hours in usual week working.Source: KFF analysis of 2018 American Community Survey, 1-Year Estimates.
A large number of low-wage workers are working directly in the health care workforce. 3.5 million low-wage workers are in the health and social services industry, with the greatest number of those (1.3 million) working as aides or personal care workers (e.g., nursing assistants or personal care aides) whose jobs will bring them into frequent, close contact with patients (Table 2). Nearly a million more work as direct contact support workers—jobs such as maids/janitors, housekeeping and laundry, or food service workers—whose jobs also will bring them into direct contact with others. Within these two occupation groups, a third or more of workers are low-wage. Many of these workers are “essential workers” who likely are still employed but facing substantial health risks due to the nature of their jobs.
Table 2: Workers in Health and Social Services Industry, by Occupation and Wage Group, 2018
Occupation
Total Workers
Low-Wage Workers
Number
Share of Total Workers Who are Low-Wage Within Occupation
All Occupations
19,479,000
3,455,000
18%
Aides and Personal Care Workers
4,164,000
1,322,000
32%
Direct Contact Support Workers
2,396,000
922,000
39%
Other Support Workers & Managers
5,383,000
658,000
12%
Health Care Providers
6,530,000
439,000
7%
Social Workers and Behavioral Health Providers
1,006,000
114,000
11%
NOTE: Workers includes nonelderly adults earning at least $1,000 in past year and working at least 20 hours per week in a usual week working. Low-Wage Workers defined as those in the bottom earnings quintile among all workers.SOURCE: KFF analysis of 2018 American Community Survey, 1-Year Estimates.
Who works in low-wage jobs?
Women, young adults, and groups of color are particularly likely to be low-wage workers. Reflecting the fact that people who more recently entered the workforce are likely to earn less, over a third (35%) are young adults aged 19-25—representing half of all workers in this age group— and another 22% are aged 26-34. Low-wage workers are also more likely to be female (58%, versus 47% for all workers). Although most low-wage workers are White, they are disproportionately Hispanic or Black Non-Hispanic race/ethnicity (Figure 1). While higher rates of underlying health conditions partially explains the disproportionate impact that the pandemic is having on groups of color in the United States, other risk factors such as type of employment and ongoing exposure may also explain disparities in cases and deaths.
Figure 1: Demographics of Low-Wage Workers Compared to All Workers, 2018
What other risks do low-wage workers face due to COVID-19?
Medicaid plays a key role in providing health coverage to low-wage workers, covering more than one in five (22%) low-wage workers in 2018 (Figure 2), and is likely to continue to be an important source of coverage for this group. Most low-wage workers who had Medicaid while working are likely to remain eligible for Medicaid even if their income drops due to lost hours or employment, since there is no lower floor on Medicaid eligibility. Some people who lose their jobs—especially those who live in states that expanded Medicaid under the ACA— may become newly eligible for Medicaid if their income (calculated based on other income in the family plus any state unemployment benefit they receive) falls below state eligibility limits (138% of poverty in states that expanded under the ACA).
Figure 2: Health Insurance Coverage Among Low-Wage Workers, 2018
Nearlyhalf of low-wage workers relied on an employer for health coverage (45%) in 2018, putting this coverage at risk if they lose their jobs or income. Many people in this income range will not be able to afford COBRA coverage, if it is available to them, as the cost is on average over $600 a month for an individual plan and more than $1,700 for family coverage. Many people who lose job-based coverage and receive unemployment insurance (UI) benefits would become eligible for either Medicaid coverage or ACA marketplace subsidies, which are available to people who do not qualify for Medicaid and have income between 100% and 400% of poverty, calculated based on other family income plus any state and new federal unemployment benefit received.6 People who lose employment-based coverage due to job loss qualify for a special enrollment period for marketplace coverage. However, some people newly-eligible for Marketplace coverage may face challenges in navigating the application and enrollment process.
One in five low-wage workers lacked health coverage in 2018 (Figure 2), putting them at high risk for out-of-pocket costs or access barriers if they become ill. Some of these workers who are still employed may in fact be eligible for Medicaid or for subsidies for Affordable Care Act (ACA) marketplace coverage but not enrolled. Others may fall into the “coverage gap” that exists for adults with incomes above Medicaid limits but below poverty in states that have not expanded Medicaid under the ACA. Uninsured workers who lose jobs or income may become newly eligible for Medicaid or marketplace subsidies. Nearly all state-run marketplaces have re-opened enrollment to allow residents to obtain marketplace coverage if eligible. However, people who were uninsured while working and live in one of the 32 states that uses the federal marketplace do not qualify for a “special enrollment period” to enroll in coverage through the federal marketplace. Thus, if their unemployed family income puts them above Medicaid eligibility, they will remain uninsured.Many low-wage workers were already living in precarious financial situations before the pandemic and may not be able to absorb loss of income or pay health care costs if they become ill. Over a quarter (28%) of low-wage workers live in a household without a full-time worker in the family, and more than half (53%) were in a family with total family income below 200% of poverty ($26,200 for a family of four in 2020).7 Reflecting their more limited incomes, high shares of low-wage workers reported day-to-day financial concerns (on top of concerns over affording health care) even before COVID-19, with over a third saying they were very or moderately worried about paying monthly bills; three in ten expressing worry over paying rent or mortgage; and nearly one in six saying they were worried about meeting minimum payments on credit cards (Figure 3). Low-wage workers also were likely to experience food insecurity, with 15% meeting federal definitions of low (9%) or very low (6%) food security.8 Many lower income households do not have sufficient savings for long periods of unemployment: half of multi-person households at or below 150% of poverty have $492 or less in liquid assets.
Figure 3: Financial Insecurity Among Low-Wage Workers, 2018
Beyond their own personal risk, many people working in low-wage jobs have living situations that could put them or their household at additional risk. Low-wage workers are more likely than all workers to live in large households and more likely to have an older adult living in the house. Specifically, 22% live in a household of at least five people (compared to just 13% of those in the highest wage quintile),9 and a quarter live with someone over the age of 60 in the household (13% live with someone over age 65).10 Nearly one in five (17%) live in a household in which someone has a personal care need (versus just 7% of those in the highest quintile)11 , indicating poor health or functioning and possible need for ongoing long-term services and supports.
Even before the pandemic, many low-wage workers reported problems affording needed health care.12More than one in ten (12%) low-wage workers said they could not afford needed care in the past year, and a similar share (10%) said they did not get the needed care due to affordability. Higher shares report family-level problems with medical bills, with nearly one in five (18%) reporting that someone in their family had a problem paying medical bills in the past year and a quarter (25%) saying someone in their family was paying off a medical bill. While recent legislation aims to protect people from out-of-pocket costs due to coronavirus testing and many insurers are waiving cost sharing for COVID-related services, some people who seek care for symptoms or illness will face out-of-pocket costs for that care. Prior problems affording care may lead some to hesitate due to fear of taking on additional medical debt.
Looking Ahead
As of April 18, nearly than 27 million people had filed for unemployment insurance since March 14, an unprecedented loss of employment. Actual loss of jobs and income is likely even higher, as some people may be marginally employed or may not have filed for benefits, and further loss of jobs is expected. Others continue to work and face personal and family risks to their health. Low-wage workers are particularly affected by these trends.
In response to the health and economic crisis, Congress has passed a series of laws to assist people facing health and economic strain due to the pandemic. The Families First Coronavirus Response Act expanded food and nutrition assistance and required paid family or medical leave for many workers, among other provisions. The more recently enacted CARES Act builds on these actions, further addressing food security and paid leave policies. It also provides assistance to small businesses to help them weather or recover from the crisis and assists unemployed individuals directly by increasing and supplementing state unemployment benefits with federal funds. In particular, the Act provides a $600 weekly federal supplement (available through July 31) to state unemployment benefits and extends the period for receiving unemployment benefits by up to 13 weeks. The Act also extends benefits to many types of workers (e.g., self-employed) not currently eligible for unemployment benefits under state laws.
While these actions provide some relief to low-wage workers, the health and financial crisis is still causing major burden on the nation, with those in the lowest income group likely to be the hardest hit. In addition, it is too early to determine how well actions taken will address need. To access unemployment benefits, people need to navigate outdated state unemployment systems, and backlogs at some state offices due to high demand may delay or deter some unemployed workers from applying for benefits. Further, financial assistance may not always be paired with health coverage, particularly for low-wage workers who were uninsured even prior to the pandemic. Others may have difficulty navigating or affording health insurance options, as evidenced by the number of people who were eligible for ACA coverage but unenrolled in the past. Health coverage is particularly important to protect against financial burden due to treatment costs or facilitate access to care in the midst of a public health crisis. As policy makers continue to take action to address the coronavirus pandemic, understanding the implications for those most affected, including low-wage workers, can help target responses and resources.
Appendix
Appendix Table 1: Low-Wage Workers by State and Industry, 2018
Low Wage Workers By Industry
State
All Workers
Low-WageWorkers
Retail
Health Care
Ent/Acc./Food
Other
Alabama
1,863,000
448,500
19%
10%
20%
51%
Alaska
316,300
60,500
20%
9%
17%
54%
Arizona
2,848,400
572,200
18%
8%
20%
53%
Arkansas
1,141,000
254,300
17%
11%
18%
54%
California
16,441,200
3,166,400
17%
7%
19%
56%
Colorado
2,624,000
431,800
19%
8%
20%
53%
Connecticut
1,550,700
248,300
18%
12%
17%
53%
Delaware
405,500
81,200
24%
10%
20%
46%
DC
350,500
40,800
12%
5%
25%
58%
Florida
8,552,300
1,885,700
20%
8%
21%
50%
Georgia
4,414,900
921,700
19%
7%
20%
53%
Hawaii
574,400
91,000
18%
8%
25%
50%
Idaho
705,100
171,000
21%
9%
17%
53%
Illinois
5,572,900
1,019,800
18%
10%
20%
53%
Indiana
2,870,300
581,800
17%
11%
19%
53%
Iowa
1,386,100
244,000
17%
9%
21%
54%
Kansas
1,235,100
258,000
17%
9%
19%
55%
Kentucky
1,771,900
402,200
19%
10%
18%
53%
Louisiana
1,794,400
439,900
19%
12%
23%
46%
Maine
568,100
98,000
16%
12%
19%
53%
Maryland
2,721,000
417,300
18%
10%
22%
50%
Massachusetts
3,101,700
435,400
19%
9%
20%
52%
Michigan
4,170,200
901,500
19%
10%
20%
51%
Minnesota
2,592,700
415,000
19%
13%
17%
51%
Mississippi
1,103,000
285,200
18%
12%
21%
49%
Missouri
2,586,200
527,200
20%
12%
19%
49%
Montana
440,200
94,200
17%
8%
25%
50%
Nebraska
840,100
155,400
19%
9%
19%
54%
Nevada
1,292,100
258,400
19%
5%
28%
48%
New Hampshire
613,900
93,300
27%
8%
19%
46%
New Jersey
3,956,800
634,800
20%
9%
17%
54%
New Mexico
771,400
207,500
17%
9%
23%
51%
New York
8,331,500
1,421,500
19%
12%
18%
52%
North Carolina
4,301,100
911,800
19%
8%
21%
52%
North Dakota
342,400
52,500
20%
11%
18%
50%
Ohio
4,989,400
1,005,300
18%
12%
21%
50%
Oklahoma
1,568,300
367,400
21%
10%
19%
50%
Oregon
1,761,000
334,900
18%
9%
20%
53%
Pennsylvania
5,461,800
1,034,700
19%
11%
19%
51%
Rhode Island
463,300
74,800
20%
12%
21%
48%
South Carolina
2,038,500
455,400
19%
9%
22%
50%
South Dakota
375,800
77,500
18%
9%
19%
53%
Tennessee
2,752,600
613,500
19%
8%
20%
52%
Texas
11,903,600
2,580,700
19%
9%
20%
52%
Utah
1,322,900
277,300
17%
9%
16%
58%
Vermont
268,200
43,600
17%
9%
17%
58%
Virginia
3,690,700
655,500
19%
8%
20%
53%
Washington
3,293,800
537,700
18%
9%
19%
54%
West Virginia
665,400
148,200
22%
13%
23%
42%
Wisconsin
2,619,600
446,500
18%
11%
17%
54%
Wyoming
251,500
55,600
19%
9%
23%
49%
Note: “Workers” includes nonelderly adults earning at least $1000 in past year and working at least 20 hours per week in a usual week working. “Low Wage Workers” includes workers in bottom quintile of earners.Source: KFF analysis of 2018 American Community Survey, 1-Year Estimates.
Endnotes
This analysis limits u201cworkersu201d to people who earned at least $1,000 during the past year and worked at least 20 hours in a typical week when working. ↩︎
KFF analysis of 2018 American Community Survey, 1-Year Estimates. ↩︎
KFF analysis of 2018 National Health Interview Survey. ↩︎
KFF analysis of 2019 Current Population Survey. ↩︎
Notably, eligibility for marketplace subsidies (but not Medicaid) includes the new federal supplemental unemployment insurance benefits recently enacted by Congress for people affected by COVID-19. This supplemental benefit could lead some unemployed low-wage workers who previously were in the u201ccoverage gapu201d (income below poverty but above state Medicaid limits) to have income above poverty, making them newly eligible for Marketplace subsidies. ↩︎
KFF analysis of 2018 American Community Survey, 1-Year Estimates. ↩︎
KFF analysis of 2018 National Health Interview Survey. ↩︎
While every state in the nation is dealing with coronavirus cases, different counties in states across the country are experiencing disparate impact of the outbreak. The latest KFF Health Tracking Poll finds that there is some variation in Americans’ attitudes and views on the outbreak based on whether or not they live in an area that was harder hit by the pandemic, but these differences are not as large as some might expect, and in some cases are smaller than divisions by partisan identification.
To examine geographic variation, we matched respondent data from the Late April KFF Health Tracking Poll fielded April 15-20 with coronavirus incidence rates at the county level as of April 17, 2020, as reported by The New York Times. Perhaps not surprisingly, adults in counties with a high number of coronavirus cases (2000 or more cases) are more likely than those in counties with a low number of cases (under 100 cases) to say their life has been disrupted “a lot” by the coronavirus outbreak (60% vs. 49%). Likewise, when measuring affected counties by number of confirmed deaths instead of confirmed cases, those in counties with a high number of confirmed coronavirus deaths (26 or more deaths) are more likely than those in counties with a low number of coronavirus deaths (5 or fewer) to say their lives have been disrupted “a lot” (61% vs. 50%).
Table 1: Adults in most affected counties are more likely than those in least affected countiesto say their life has been disrupted “a lot”.
How much, if at all, has your life been disrupted by the coronavirus outbreak?
Cases in county (as of 4/17)
Deaths in county (as of 4/17)
Low
Medium
High
Low
Medium
High
Counties with fewer than 100 cases
Counties with 100-1,999 cases
Counties with 2000 or more cases
Counties with fewer than 6 deaths
Counties with 6-25 deaths
Counties with 26 or more deaths
A lot
49%
58%
60%
50%
58%
61%
Some
31
27
27
31
25
26
Just a little
14
11
9
13
12
9
Not at all
6
5
4
6
6
4
When it comes to strict shelter-in-place measures that have been put in place across most of the country, large shares say these shelter-in-place measures are “worth it in order to protect people and limit the spread of coronavirus” and say that they can continue adhering to these measures for at least another month. There is some geographic variation, with those in counties that have been most affected by the outbreak being somewhat more likely than those in the least affected counties to say that strict sheltering-in-place measures are worth it in order to protect people and limit the spread of coronavirus (85% in counties with 2000 or more cases vs. 73% in counties with under 100 cases; 85% in counties with high number of deaths and 75% in counties with low number of deaths). Similarly, while most Americans say they are able to continue to adhere to strict social distancing guidelines for at least another month, those in counties that have been most affected by the outbreak are somewhat more likely than those in the least affected counties to say they are able to do so (86% in counties with 2000 or more cases vs. 76% in counties with under 100 cases).
Figure 1: Majorities In Highly Affected And In Less Affected Areas Say Shelter-In-Place Measures Are Worth It, Can Keep It Up For Another Month
As public officials explore ways to trace and contain the outbreak so that they can start easing social distancing and sheltering-in-place restrictions, adults in counties that have been harder hit by coronavirus are somewhat more likely than those in less affected areas to say they are willing to download and use a contact tracing app. For example, about half of those in counties with the highest numbers of cases (53%) and the highest numbers of deaths (50%) say they’d be willing to use an app that tracks who they come into close contact with and then provides that information to public health officials, compared to about four in ten in lower-incidence counties (39% whether counted as cases or deaths).
However, partisanship appears to be a bigger driver than location when it comes to people’s willingness to use such apps. While a majority of Democrats (58%) say they would be willing to use an app that tracks who they come into close contact with and then provides that information to public health officials, about half as many Republicans (29%) say they would be willing to do so.
Figure 2: Half Of Those In Most Affected Counties Are Willing To Use Contract Tracing App That Shares Data With Public Health Officials
Indeed, partisan divides in willingness to use a contact tracing app are wide, irrespective of whether individuals live in an area highly affected by coronavirus. In counties that have had few or no deaths, 51% of Democrats and Democratic-leaning independents say they would be willing to use a contact-tracing app that shares information with public health officials, compared with a much smaller 33% of Republicans and Republican-leaning independents, a gap of 18 percentage points. In counties with 26 or more deaths, the gap in willingness between Democrat-leaners and Republican-leaners is a similar 24 percentage points (60% vs. 36%).
Table 2: Even in the hardest hit counties, there are large partisan gaps in willingness to use a contact tracing app.
Would you be willing or unwilling to download and use an app for your phone that tracks who you come into close contact with and then provides that information to public health officials?
Counties withfewer than 6 deaths
Counties with6-25 deaths
Counties with26 or more deaths
Democrats and Democratic-leaning independents
Republicans and Republican-leaning independents
Democrats and Democratic-leaning independents
Republicans and Republican-leaning independents
Democrats and Democratic-leaning independents
Republicans and Republican-leaning independents
Willing
51%
33%
58%
29%
60%
36%
Unwilling
48
66
41
70
38
63
Don’t know/Refused
2
1
1
1
2
1
Notably, many of the counties with high numbers of coronavirus cases and deaths to date are in large, metropolitan, urban, and Democratic-leaning areas. As more coronavirus cases occur in counties that have yet to be hard hit by the outbreak, many of which are more rural and Republican-leaning areas, the KFF Health Tracking Poll will continue to gauge and measure changes public attitudes and behaviors.
Every Friday we’ll recap our new coronavirus policy analysis, polling, and updates from the past week.
Here are the latest coronavirus stats from KFF’s tracking resources:
Global Cases and Deaths: This week, total cases worldwide passed 2.7 million – with approximately 556,000 new cases added between April 17 and April 23. There were approximately 47,000 new confirmed deaths worldwide between April 17 and April 23.
U.S. Cases and Deaths: There were approximately 200,000 new cases and 17,000 deaths in the United States between April 17 and April 23.
U.S. Tests: There have been 4,493,106 total COVID-19 tests with results in the United States — with over 1 million added since last week. 18% of the total tests were positive. There were 13.7 tests with results per 1000 people.
Adults at Higher Risk of Serious Illness if Infected with Coronavirus: 38% of all U.S. adults are at risk of serious illness if infected with coronavirus (92,560,223 total) due to their age (65 and over) or pre-existing medical condition. Of those at higher risk, 45% are at increased risk of serious illness if infected with coronavirus due to their existing medical condition such as such as heart disease, diabetes, lung disease, uncontrolled asthma or obesity.
States Easing Social Distancing Measures: Eight states – Alaska, Georgia, Michigan, Oklahoma, South Carolina, Tennessee, Vermont, and Wisconsin – have eased some social distancing measures.
Stay At Home Order: 42 statewide orders, 2 orders for high-risk groups only, other action in 1 state, no action in 6 states
Mandatory Quarantine for Travelers: 14 orders for all travelers, 1 order for all air travelers, 6 for travelers coming from certain states, other action in 1 state, no action in 29 states
Non-Essential Business Closures: 28 orders to close all non-essential businesses; 4 orders to close all non-essential retail businesses, 12 to close certain non-essential businesses, no action in 7 states
Large Gatherings Ban: All gatherings prohibited in 18 states, gatherings of 10+ people prohibited in 26 states, other actions in 4 states, no action in 3 states
State-Mandated School Closures: Closed in 15 states, closed for school year in 29 states, recommended closure in 1 state, recommended closure for school year in 6 states
Bar/Restaurant Limits: Closed except takeout/delivery in 45 states, limited on-site service in 4 states, other action in 1 state, no action in 1 state
Primary Election Postponement: Postponement in 15 states, no postponement in 36 states
Emergency Declaration: There are emergency declarations in all states and D.C.
Waive Cost Sharing for COVID-19 Treatment: 3 states require, state-insurer agreement in 3 states; no action in 45 states
Free Cost Vaccine When Available: 9 states require, state-insurer agreement in 1 state, no action in 41 states
States Requires Waiver of Prior Authorization Requirements: For COVID-19 testing only in 6 states, for COVID-19 testing and treatment in 5 states, no action in 40 states
Early Prescription Refills: State requires in 18 states, no action in 33 states
Premium Payment Grace Period: Grace period extended for all policies in 11 states, grace period extended for COVID-19 diagnosis/impacts only in 5 states, no action in 35 states
Marketplace Special Enrollment Period: Marketplace special enrollment period in 12 states, no special enrollment period in 39 states
Paid Sick Leave: 13 states enacted, 2 proposed, no action in 36 states
Approved Section 1115 Waivers to Address COVID-19: 1 state has an approved waiver
Approved Section 1135 Waivers: 51 states have approved waivers
Approved 1915 (c) Appendix K Waivers: 34 states have approved waivers
Approved State Plan Amendments (SPAs)*: 15 states have temporary changes approved under Medicaid disaster relief SPAs, 1 state has an approved traditional SPA
Other State-Reported Medicaid Administrative Actions: 51 states report taking other administrative actions in their Medicaid programs to address COVID-19
*The Disaster Relief SPA allows states to make temporary changes to their Medicaid state plans and address access and coverage issues during the COVID-19 emergency. States can also make changes through traditional SPAs and can implement changes under existing authority that do not require SPA approval.
KFF Health Tracking Poll – Late April 2020: Coronavirus, Social Distancing, and Contact Tracing (News Release, Poll Findings)
State Reporting of Cases and Deaths Due to COVID-19 in Long-Term Care Facilities (News Release, Issue Brief)
The Implications of COVID-19 for Mental Health and Substance Use (News Release, Issue Brief)
How Many Adults Are at Risk of Serious Illness If Infected with Coronavirus? Updated Data (Issue Brief)
COVID-19 and Workers at Risk: Examining the Long-Term Care Workforce (Issue Brief)
Urban and Rural Differences in Coronavirus Pandemic Preparedness (Issue Brief)
A Look at Online Platforms for Contraceptive and STI Services during the COVID-19 Pandemic (Data Note, News Release)
Addressing the Justice-Involved Population in Coronavirus Response Efforts (News Release, Issue Brief)
The National Disaster Medical System (NDMS) and the COVID-19 Pandemic (Issue Brief)
Updated: State Action to Limit Abortion Access During the COVID-19 Pandemic (Issue Brief)
Global COVID-19 Response:
Preparing for COVID-19 in Low- and Middle-Income Countries: Leveraging U.S. Global Health Assets (Issue Brief)
Donor Funding for the Global Novel Coronavirus Response (Issue Brief)
KFF and Global Health Council Present a Virtual Town Hall on COVID-19 Response in Low- and Middle-Income Countries (Event)
World Food Programme Head Warns U.N. Security Council Of Looming ‘Hunger Pandemic’ Amid COVID-19 Threat; Global Network Against Food Crises Releases Annual Report (KFF Daily Global Health Policy Report)
Trackers:
COVID-19 Coronavirus Tracker – Updated as of April 24, 2020 (Interactive)
State Data and Policy Actions to Address Coronavirus — Updated as of April 23, 2020 (Issue Brief)
Medicaid Emergency Authority Tracker: Approved State Actions to Address COVID-19 – Updated as of April 23, 3030 (Issue Brief)
Americans of all ages are increasingly worried about their finances now that the coronavirus has infected the economy. So far, the media coverage has focused more on the fallout for working families who are struggling to make ends meet, after losing their jobs, and income, as businesses shutter for the foreseeable future. There’s been far less attention to the financial impact on older adults, who are not only at higher risk of serious illness if they get the coronavirus, but also financially vulnerable if the pandemic leads to a sustained drop in their income and retirement savings. Seniors already face significant out-of-pocket costs for their health care and as a share of their income.
It doesn’t take much to imagine how the coronavirus economy could lead to a drop in both income and retirement savings for seniors for an unknown period of time. Older adults 50 and older who lose their jobs in the wake of the pandemic may find it more difficult than younger workers to get jobs and comparable compensation when the economy begins to recover. And, while some of the 12 million adults ages 65 and older choose to work mainly for professional or personal fulfillment, others do so to pay their bills, often to help support their children and grandchildren. More than 4 million adults ages 65 or older who worked at some time during the year were in families with incomes below 400% of poverty, including a disproportionate share of black and Hispanic seniors, according to an unpublished KFF analysis. Older adults who decide to collect Social Security to compensate for lost earnings, but before their full retirement age, will get lower monthly payments than they would have for the rest of their lives.
We recently released new data that paints a fairly dim picture of seniors’ financial resources in 2019 — before the coronavirus pandemic. These 2019 estimates are likely to be a high-water mark for older adults, at least for the foreseeable future, given relatively high unemployment among older workers and volatility in the stock market, which can affect retirement savings.
In 2019, as in prior years, the distribution of savings among seniors is highly skewed: the top five percent of seniors had savings of more than $1.4 million per person. However, even before the economy started to falter, half of all seniors had savings of $83,850 or less, a quarter had less than $9,650, and about one in ten (12%) no had no savings at all. Median savings among adults ages 65 and older were substantially lower for black and Hispanic than white seniors, and lower for older women than older men (Figure 1).
Among Adults Ages 65+, Median Savings Are Significantly Lower For Black And Hispanic Than White Seniors And Lower For Women Than Men
For older adults with some or all of their retirement savings invested the stock market, the recent volatility raises uncertainty, more for some than others. The average age 65 and older household with any savings invested about one fifth (18%, on average) of total savings in the stock market in 2016; the share was very low among older households with savings in the bottom savings quintile (<1%, on average) but much higher (36%, on average) among older households in the top savings quintile. The volatility in the stock market raises particular concern for older retirees who have fewer years than younger adults to recover lost retirement savings from a downturn in the economy.
The recently enacted CARES Act aims to mitigate the immediate impact of economic losses on Americans, including older Americans, such as direct payments of up to $1,200 to individuals and more generous unemployment benefits. However, these are short-term solutions to what appears to be a long-term problem. The economic impact of the coronavirus economy on older Americans has important implications for the current response to COVID, and future policy discussions pertaining to Medicare, Medicaid and Social Security.
The rising number of people in the U.S. with coronavirus is having a widespread impact on the health and economic security of people of all ages, including older Americans. Adults ages 65 and older are not only at higher risk of serious illness if they get infected, but at risk of losing their retirement security. Nearly half of older Americans (48 percent) say they are worried that their investments will be negatively affected by coronavirus disease and the spillover effects of ongoing market volatility on their economic security.
The CARES Act aims to provide relief in the short-term by extending and enhancing unemployment benefits, and by providing up to $1,200 in payments to individuals, including Medicare beneficiaries who receive Social Security payments, but the longer-term impact on retirement income is unclear. Both provisions should help older adults who live on relatively modest incomes, including seniors who have continued to work to supplement their Social Security income. However, the volatility in the stock market could have a significant impact on the retirement savings that older adults accumulate over the course of their lives to cover big expenses, including out-of-pocket health costs, especially the cost of long-term care.
This analysis looks at the income, assets and home equity of Medicare beneficiaries prior to coronavirus outbreak, using data from the Dynamic Simulation of Income Model (DYNASIM) for 2019 (See Methodology for details). We look at the overall population and variations by age, gender, and race/ethnicity. Because the analysis is based on information available prior to the pandemic, the estimates do not reflect the impact that the coronavirus economy has had, or will have, on Medicare beneficiaries’ income and savings.
Key Findings
Even before the effects of the coronavirus pandemic are fully realized, our analysis finds many Medicare beneficiaries lived on limited incomes and modest, if any, savings, with wide disparities by age, gender and race/ethnicity.
Half of all Medicare beneficiaries lived on incomes below $29,650 per person in 2019; one in four had incomes below $17,000 per person (ES Figure 1).
Figure ES-1: Before The Coronavirus Pandemic, Many Medicare Beneficiaries Lived On Limited Income And Had Modest Savings
Half of all Medicare beneficiaries had savings below $73,800 per person in 2019; one fourth had less than $8,500 per person in savings, and 12% had no savings or were in debt.
Half of all Medicare beneficiaries had home equity below $73,350 per person in 2019, and one fourth (27%) had no home equity at all.
Income among Medicare Beneficiaries
In this analysis, the income of the Medicare population takes into account Social Security, pensions, earnings, and other income sources, including income from assets (e.g., stocks and bonds), rental income, and retirement account (IRA) withdrawals. Income is presented on a per person basis; for married people, income is divided equally between spouses to calculate per capita income. All dollar amounts are in 2019 per capita dollars.
In 2019, half of all Medicare beneficiaries had incomes below $29,650 per person in 2019, while one quarter of all Medicare beneficiaries lived on incomes below $17,000 per person (Figure 1). At the higher end of the income distribution, five percent of Medicare beneficiaries had incomes exceeding $117,700 per person, including the top one percent who had incomes exceeding $205,500, in 2019. Half of all individuals ages 65 and older, who are at or near retirement, had incomes below $31,450 per person in 2019, while one in four beneficiaries ages 65 and older had incomes below $18,150 (Table 2).
Figure 1: Half Of All Medicare Beneficiaries Lived On Incomes Under $29,650 Per Person; One In Four Lived On Incomes Under $17,000 In 2019
Per person estimates of income among beneficiaries vary dramatically by age, race/ethnicity and gender (Figure 2 and Table 1):
Figure 2: Median Income Declines With Age Among Older Adults, Is Lower For Women And Lower For Black And Hispanic Medicare Beneficiaries
Age: Among people ages 65 and older, median per capita income declined steadily with age, dropping from $35,200 between ages 65 to 74 to $22,750 at ages 85 and older. Across the entire Medicare population, median per capita income was considerably lower for beneficiaries under age 65 with permanent disabilities ($19,550) than among seniors. In 2018, about one in seven (15%) Medicare beneficiaries were under age 65 and generally eligible for Medicare due to a long-term disability. Median income for individuals ages 65 and older was $31,450 per person in 2019, while one in four beneficiaries ages 65 and older had incomes below $18,150 (Table 2).
Race/Ethnicity: Median per capita income was substantially higher for beneficiaries who were white ($33,700) than for those who were black ($23,050) or Hispanic ($15,600). Due to small sample sizes, we are unable to provide estimates for Asian, American Indian or other racial or ethnic groups of beneficiaries. The difference in median income by race/ethnicity is attributable to many factors, including education, job opportunities, health status, marital status, and other determinants of wealth, the net effect of which is that people of color disproportionately have lower earnings during their working years than white people, which affects their income and how much they are able to save for retirement.
Gender: Median per capita income in 2019 was lower among women with Medicare than men ($27,750 vs. 32,050, respectively). Because women have lower paying jobs than men during their working years, and because many work part-time or leave the workforce for periods of time to raise families or care for aging family members, many women receive lower average Social Security and pension benefits than men.
Marital Status: Married beneficiaries had higher median per capita incomes ($35,250) than those who were divorced, widowed or single ($27,000; $26,450; and $17,000, respectively).
Education: Median per capita income varied by years of education and was more than three-times higher among beneficiaries with college degrees ($53,250) than among those with less than a high school education ($15,250) in 2019.
Savings among Medicare Beneficiaries
In addition to income, we examine the total savings for Medicare beneficiaries. Savings include retirement account holdings (such as IRAs or 401Ks) and other financial assets, including savings accounts, bonds and stocks. Savings are presented on a per person basis; for married people, savings are divided equally between spouses to calculate per capita savings.
The majority of Medicare beneficiaries (88%) had some savings in 2019; however, the value of their savings varied widely.
Half of all Medicare beneficiaries had less than $73,800 in savings per person in 2019, and one quarter of all beneficiaries had savings below $8,500 per person (Figure 3). More than one in ten Medicare beneficiaries (12%) had no savings at all or were in debt. Among the wealthiest Medicare beneficiaries, five percent had more than $1.4 million in per capita savings, including the top one percent who had more than $3.3 million in savings in 2019.
Figure 3: Half Of All Medicare Beneficiaries Had Savings Below $73,800 Per Person; One In Ten Had No Savings Or Were In Debt In 2019
Among Medicare beneficiaries ages 65 and older, half had savings below $83,850 per person in 2019, a quarter of all older adults with Medicare had savings below $9,650 per person in 2019, and 12 percent had no savings at all (Table 1;Table 2). The average household ages 65 and older with any savings invested about one fifth (18%, on average) of their total savings in the stock market in 2016; the share was lower among older households with savings in the bottom savings quintile (<1%, on average) but much higher (36 percent, on average) among older households in the top savings quintile. The volatility in the stock market raises particular concern for the financial security of seniors who have fewer years than younger adults to recover lost savings from a downturn in the economy (Table 3).
Median per capita savings among Medicare beneficiaries varies across demographics (Figure 4 and Table 1):
Figure 4: Median Savings Declines With Age Among Older Adults, Is Lower For Black & Hispanic Medicare Beneficiaries, And Lower For Women
Age: Among Medicare beneficiaries ages 65 and older, median per capita savings dropped steadily with age from $117,150 among people ages 65-74 to $18,800 per person ages 85 and older. Relatively low savings present clear challenges for adults at older ages who are more likely to incur high health and long-term care expenses. Median savings were considerably lower among beneficiaries with disabilities younger than age 65 ($34,050) than among seniors overall ($83,850).
Race/Ethnicity: Median per capita savings among white beneficiaries ($117,800) were nearly eight times higher than among black beneficiaries ($14,500) and nearly twelve times higher than among Hispanic beneficiaries ($9,650). Notably, one in four black (25%) and Hispanic (27%) Medicare beneficiaries had no savings in 2019, compared to nearly one in ten (8%) white Medicare beneficiaries. This disparity in savings by race and ethnicity persists among adults ages 65 and older: the median per capita savings among white beneficiaries was $131,650 in 2019, compared to $15,400 among black beneficiaries, and $8,400 among Hispanic beneficiaries (Table 2). The difference in savings by race/ethnicity is the result of many factors, including education, health status, marital status, income, periods of unemployment, access to employer retirement benefits, and inherited wealth, the net effect of which is that people of color also are less likely to have pensions and lower retirement savings.
Gender: Median per capita savings were substantially lower for women than men on Medicare, a difference of $25,000 per person ($63,350 vs. $88,250, respectively). Among women ages 65 and older, the gap in per capita median savings was even wider ($68,450 for women vs. $105,000 for men).
Marital Status: Median per capita savings among Medicare beneficiaries who were divorced ($43,500), widowed ($41,300) or single ($17,700) were much lower than those among people who were married ($132,700).
Education: Median per capita savings were higher among beneficiaries with more years of education; the median savings of college-educated beneficiaries ($275,000) was more than 57-times higher than the median savings among beneficiaries with less than a high school education ($4,800).
Home Equity among Medicare Beneficiaries
As with income and savings, this analysis divides home equity values equally between spouses to calculate per capita home equity. The estimates account for any decrease in home equity values that occurred as a result of the mortgage crisis; it has been estimated that more than 1.5 million Americans over age 50 lost their homes between 2007 and 2011.
In 2019, half of all Medicare beneficiaries had less than $75,350 in home equity per person in 2019. One quarter (27%) of all Medicare beneficiaries had no home equity at all (Figure 5). At the higher end of the distribution, five percent of Medicare beneficiaries had more than $488,200 per person in home equity, including one percent who had more than $861,250 in home equity.
Figure 5: Half Of All Medicare Beneficiaries Had Home Equity Below $75,350 Per Person; One In Four Had No Home Equity In 2019
Estimates of home equity varied dramatically by demographic characteristics (Figure 6 and Table 1):
Figure 6: Median Home Equity Rises With Age, But Is Much Lower For Under-65 Beneficiaries & For Black And Hispanic Beneficiaries
Age: Per capita median home equity increased with age. The oldest Medicare beneficiaries, those ages 85 and older, had higher median per capita home equity ($107,350) than individuals ages 65-74 ($81,650). Medicare beneficiaries under the age of 65 had substantially lower median per capita home equity in 2019 ($11,650) than beneficiaries ages 65 and older ($87,850). Rising home equity with age reflects the natural growth in home equity as homeowners increasingly reduce and pay off mortgage debt over time. Unlike financial assets that decline with age as seniors spend accumulated savings to fund their retirement spending, homes typically store and accumulate equity over time.
Race/Ethnicity: Hispanic and black Medicare beneficiaries had substantially lower rates of home ownership than their white counterparts (55% and 56% vs. 80%, respectively). This racial disparity in home ownership rates persisted among adults age 65 and older with Medicare.
Gender: Median per capita home equity was somewhat higher among women than men on Medicare ($79,500 vs. $71,100). Among adults age 65 and older with Medicare, median per capita home equity was similarly somewhat higher among women than men ($89,700 vs. $85,900). Because home equity rises with age, the higher home equity of female Medicare beneficiaries reflects the higher share of women who survive to older ages than men, and therefore accrue more home equity and increasingly own the full share of their homes.
Marital Status: Medicare beneficiaries who were widowed had higher median per capita home equity than those who were married or divorced ($123,250 vs. $88,300 and $29,900).
Education: Median per capita home equity increased with more years of education. Medicare beneficiaries who were college graduates had the highest median per capita home equity ($136,650 vs $12,550 among those without a high school education).
Discussion
In 2019, prior to the coronavirus pandemic and its impact on the economy, the majority of Medicare beneficiaries lived on limited incomes and modest savings, with limited cushion to absorb unanticipated health expenses, and significant disparities by age, gender, and race/ethnicity. Our analysis raises questions about the extent to which Medicare beneficiaries will be able to bear additional, unanticipated costs that are likely to arise from the coronavirus pandemic, given the likely prospect of declining retirement resources. It also highlights the wide variation in Medicare beneficiaries’ financial resources, which is important context for near-term policies pertaining to the costs associated with COVID-19 treatment, and longer-term policies pertaining to Medicare reforms.
Wyatt Koma and Tricia Neuman are with KFF. Karen Smith is with the Urban Institute. Gretchen Jacobson was with KFF at the time this brief was written.
Methods
Asset and income projections are based on the Urban Institute’s Dynamic Simulation of Income Model (DYNASIM4). DYNASIM4 is a dynamic microsimulation model that projects the population and analyzes the long-run distributional consequences of retirement and aging issues. The model starts with a representative sample of individuals and families and ages the data year by year, simulating demographic and economic events including all key components of retirement income. The model integrates many important trends and differences among groups in life course processes, including birth, death, schooling, leaving home, first marriage, remarriage, divorce, disability, work, retirement, and earnings. Projections of fertility, disability, mortality, net immigration, employment, average earnings, and price changes are aligned to be consistent with 2019 OASDI Trustees intermediate cost projections. Projections of assets are aligned to the Health and Retirement Survey (HRS) for people ages 50 and older, and the Survey of Consumer Finances (SCF) for people under age 50. This brief uses data from DYNASIM4; many significant changes were made to the microsimulation model, and the findings therefore cannot be trended from previous analyses, which used DYNASIM3 (See below for more information).
Comparison of Current Data to Past Data
DYNASIM4 is an update to its predecessor, DYNASIM3. It includes a more recent starting sample, updated demographic and labor market modules, and revised asset alignment targets. DYNASIM4 starts with pooled 2004 and 2008 SIPP data and projects data from 2007 to 2093. DYNASIM3 started with pooled 1990 to 1993 SIPP data and projected data from 1993 to 2087. Compared to DYNASIM3, DYNASIM4 updated the demographic projections to add cohabitation and same-sex marriage, and updated education and labor market modules using more recent data. The SIPP data significantly underreports financial and retirement account assets (Czajka, Jacobson, Cody 2003; Smith et al 2005; Smith et al 2010). Both DYNASIM3 and DYNASIM4 adjusted SIPP self-reported assets. DYNASIM3 aligned SIPP asset distributions to the 1992 Survey of Consumer Finances (SCF) data. DYNASIM4 aligns SIPP asset distributions to the 2006 Health and Retirement Study (HRS) (age 50 and older) and 2007 SCF (under age 50) data. DYNASIM projects changes in assets after age 50, so its projections are sensitive to the adjusted SIPP starting values. The HRS asset distributions are typically lower than the SCF asset distributions, but the HRS has a significantly larger sample size for older households than the SCF. The HRS also includes older individuals living in institutions and with non-spouse family members who are not included in the SCF; these individuals tend to have lower incomes and assets than other people on Medicare.
Tables
Table 1
Per Capita Income, Savings, and Home Equity of Medicare Beneficiaries by Selected Demographic Characteristics, 2019
Income
Savings
Home Equity
Median
Median among all beneficiaries
% with savings
Median among those with savings
Median among all beneficiaries
% with home equity
Median among home owners
Total
$29,650
$73,800
88%
$107,750
$75,350
73%
$125,900
Race/Ethnicity
White
$33,700
$117,800
92%
$146,200
$95,000
80%
$132,500
Black
$23,050
$14,500
75%
$35,250
$18,450
56%
$87,150
Hispanic
$15,600
$9,650
73%
$27,800
$16,500
55%
$90,950
Age
<Age 65
$19,550
$34,050
85%
$52,500
$11,650
54%
$68,150
Total, 65+
$31,450
$83,850
88%
$119,700
$87,850
76%
$132,500
65–74
$35,200
$117,150
90%
$154,100
$81,650
76%
$128,550
75–84
$29,700
$61,700
86%
$97,450
$92,200
78%
$130,900
85 and older
$22,750
$18,800
85%
$37,150
$107,350
76%
$159,000
Gender
Female
$27,750
$63,350
87%
$97,300
$79,500
73%
$131,800
Male
$32,050
$88,250
89%
$121,050
$71,100
73%
$120,150
Marital Status
Married
$35,250
$132,700
94%
$155,750
$88,300
86%
$109,850
Divorced
$27,000
$43,500
82%
$78,850
$29,900
58%
$125,750
Widowed
$26,450
$41,300
86%
$67,400
$123,250
77%
$180,400
Single
$17,000
$17,700
75%
$52,100
$0
38%
$140,900
Education
Less than High School
$15,250
$4,800
71%
$17,800
$12,550
54%
$79,500
High School
$24,750
$45,700
87%
$66,000
$61,150
72%
$106,550
Some College
$32,600
$92,300
91%
$118,100
$80,250
76%
$122,550
College Graduate
$53,250
$275,000
96%
$301,600
$136,650
84%
$176,850
Federal Poverty Level
<200% FPL
$13,650
$8,400
74%
$22,150
$8,350
52%
$92,400
200-399% FPL
$28,800
$68,950
92%
$82,600
$79,300
79%
$114,100
400% FPL or more
$65,050
$324,300
98%
$337,200
$134,200
89%
$155,650
Note: Total household income, savings, and home equity for couples are split equally between couples for per capita estimates for married beneficiaries. Source: Urban Institute / KFF analysis of DYNASIM data, 2019.
Table 2
Distribution of Medicare Beneficiaries’ Per Capita Income, Savings, and Home Equity by Age, 2019
Overall
Age 65 and Older
Under Age 65
Distribution of per capita income
Top ten percent
$89,050
$91,750
$63,500
Top 25 percent
$54,300
$56,700
$35,850
Median
$29,650
$31,450
$19,550
Bottom 25 percent
$17,000
$18,150
$12,000
Bottom 10 percent
$10,350
$10,900
$9,000
Distribution of per capita savings
Top ten percent
$839,600
$892,550
$435,150
Top 25 percent
$324,400
$355,450
$145,100
Median
$73,800
$83,850
$34,050
Bottom 25 percent
$8,500
$9,650
$4,250
Bottom 10 percent
$0
$0
$-750
Distribution of per capita home equity
Top ten percent
$358,450
$371,950
$191,300
Top 25 percent
$192,200
$205,400
$75,300
Median
$75,350
$87,850
$11,650
Bottom 25 percent
$0
$6,100
$0
Bottom 10 percent
$0
$0
$0
Distribution of Medicare beneficiaries’ median income, savings, and home equity by age
Median per capita income, 2019
Age
Under Age 65
$19,550
N/A
$19,550
Total, Age 65+
$31,450
$31,450
N/A
65–74
$35,200
$35,200
N/A
75–84
$29,700
$29,700
N/A
85 and Older
$22,750
$22,750
N/A
Race/Ethnicity
White
$33,700
$35,550
$21,500
Black
$23,050
$24,900
$16,500
Hispanic
$15,600
$15,700
$15,200
Gender
Female
$27,750
$29,000
$19,250
Male
$32,050
$34,650
$19,900
Median per capita savings, 2019
Age
Under Age 65
$34,050
N/A
$34,050
Total, Age 65+
$83,850
$83,850
N/A
65–74
$117,150
$117,150
N/A
75–84
$61,700
$61,700
N/A
85 and Older
$18,800
$18,800
N/A
Race/Ethnicity
White
$117,800
$131,650
$49,800
Black
$14,500
$15,400
$11,900
Hispanic
$9,650
$8,400
$15,400
Gender
Female
$63,350
$68,450
$39,450
Male
$88,250
$105,000
$28,600
Median per capita home equity, 2019
Age
Under Age 65
$11,650
N/A
$11,650
Total, Age 65+
$87,850
$87,850
N/A
65–74
$81,650
$81,650
N/A
75–84
$92,200
$92,200
N/A
85 and older
$107,350
$107,350
N/A
Race/Ethnicity
White
$95,000
$105,600
$22,400
Black
$18,450
$31,950
$0
Hispanic
$16,500
$21,800
$0
Gender
Female
$79,500
$89,700
$21,050
Male
$71,100
$85,900
$0
Note: Total household income, savings, and home equity for couples are split equally between couples for per capita estimates for married beneficiaries. Source: Urban Institute / KFF analysis of DYNASIM data, 2019.
Table 3
Average Equity Share Among Households Ages 65 And Older With Any Savings, 2016
Equity share of total savings
Average
18.4%
Bottom savings quintile
0.8%
2nd savings quintile
9.9%
Middle savings quintile
17.8%
4th savings quintile
28.2%
Top savings quintile
35.5%
Note: Equity share among households ages 65 and older with any savings. Source: Urban Institute analysis of the 2016 Survey of Consumer Finances.
Update on COVID-19 Funding for Hospitals and Other Providers
The Department of Health and Human Services released new details this week on the $100B in funding for providers (the Relief Fund) that was in the Coronavirus Aid, Relief, and Economic Security (CARES) Act. Additionally, the President is poised to sign a bill that adds $75 billion more to this fund. With this week’s announcement, HHS has now released information on how $70.4 billion from the Relief Fund will be distributed and provided further clarification on how some of the remaining money would be used to reimburse providers for treating COVID-19 patients who are uninsured. This blog updates a previous blog and highlights questions that remain regarding the protections for the uninsured and for patients at risk of being balanced billed.
Overview of Funds Allocated to Providers for Coronavirus Expenses and Lost Revenue
$50 billion general allocation: In early April, HHS allocated $30 billion to providers based on 2019 Medicare fee-for-service revenue. On April 22, HHS announced that another $20 billion of this general allocation would be given out so that the total $50 billion is distributed based not just on Medicare revenue but instead on each providers’ share of total 2018 net patient revenue from all sources. Since Medicaid typically reimburses at lower rates than other providers, this methodology could disadvantage providers who see a high proportion of Medicaid patients. The Terms and Conditions state that this money can be used for “health care related expenses or lost revenues that are attributable to coronavirus.”
$10 billion for high-impact areas: HHS also announced that $10 billion would be targeted to hospitals in areas particularly impacted by COVID-19 and stated that New York hospitals “are expected to receive a large share of the funds.” This more targeted funding will help address concerns from hospitals in the hardest-hit areas that they had not gotten sufficient funds to help them manage a surge in COVID-19 patients. To help HHS determine which facilities will qualify for this targeted distribution, each hospital must submit the number of ICU beds it has and its total COVID-19 admissions as of April 10, 2020. HHS also stated that this money will be distributed to provide extra funding for hospitals that see a higher share of low-income patients, as reflected by their Medicare Disproportionate Share Hospital (DSH) Adjustment. The Medicare DSH calculation is based on a hospital’s share of Medicaid and low-income Medicare inpatient days. Azar stated that this extra funding was intended to “to help address areas with greatest financial need and the disproportionate burden of the virus on minority communities.”
$10 billion for rural providers: HHS will be distributing $10 billion to rural providers, which Secretary Azar said “will go to the approximately 2,000 rural hospitals across the country, including their 1,100 affiliated Rural Health Clinics, and to the more than 1,300 freestanding Rural Health Clinics.”
$400 million for the Indian Health Service: HHS announced that it is allocating $400 million for Indian Health Service (IHS) facilities. Due to preexisting disparities in health, social, and economic factors, American Indians and Alaska Natives are at higher risk for health and economic challenges due to COVID-19, including increased risk of serious illness if infected with coronavirus. Access to services through IHS varies significantly across locations, and there have been longstanding gaps in access to care for American Indians and Alaska Natives who rely on IHS for care. Moreover, not all individuals who identify as American Indian or Alaska Native are eligible to receive services through IHS.
Additional allocations: HHS stated that additional money from the Relief Fund will be made available to other providers, including skilled nursing facilities, dentists, and providers that only treat Medicaid beneficiaries. There are currently no details available about the amount of money for these providers or when these funds will be distributed. The number of COVID-19 related deaths in long-term care facilities, including skilled nursing facilities, has been on the rise, raising concerns about resources for testing, personal protective equipment and staff screening.
Questions about surprise billing protections:
HHS is requiring that providers who receive a payment from the general Relief Fund must agree to not “surprise bill” insured patients with a presumptive or actual case of COVID-19. While patients in traditional Medicare are not at risk of balance billing for covered services and Medicare Advantage plans are required to consider all COVID-19 treatment as in-network, people with private insurance are at risk of surprise bills if meaningful protections are not put in place. Many important questions remain about HHS’s new requirement. Without further guidance, it is unclear what the impact of this requirement will be for patients.
This provision applies to a “presumptive” or actual case of COVID-19. However, a “presumptive case” is not defined. Will HHS issue any guidance on this issue? Will a patient with a suspected case of COVID-19 who subsequently tests negative qualify as a “presumptive” case?
Under the Terms and Conditions, providers cannot collect cost sharing in excess of what a patient would have to pay for in-network care, but providers are not required to bill insurers for out-of-network care directly. How will providers know each patient’s in-network cost sharing amount if the provider is not required to bill insurers directly?
Can out-of-network providers bill patients who are covered by HMOs or other closed network plans that do not provide any coverage for non-emergency out-of-network claims other than COVID-19 testing?
How will patients be notified about this new protection and how to file a complaint if their provider does not comply?
More details on HHS reimbursement for care for the uninsured
On April 22, HHS released guidance detailing how money from the Relief Fund would be used to reimburse providers for treating uninsured patients with COVID-19, a policy that had previously been offered up by President Trump but with few details. This new guidance provides some clarity on which providers are eligible to receive payments for treating uninsured patients for COVID-19, how they will be reimbursed, and what services will be covered.
Timeline: Providers that agree not to balance bill patients can begin signing up for the program on April 27, with payments beginning mid-May. Reimbursement will be available for services provided on or after February 4,
Scope of reimbursed providers and services: Along with testing (diagnostic and antibody) and testing-related visits, the guidance specifies reimbursement will be provided for treatment for patients with a primary diagnosis of COVID-19 in a variety of settings, including office visits (including telehealth), emergency room, hospital inpatient and outpatient, and both emergency and non-emergency transportation, and for post-acute care. A few services are excluded from coverage, including hospice and outpatient prescription drugs. While the broad range of covered treatment settings reduces the likelihood that uninsured patients will receive bills for services not covered by the program, the larger number of providers and services will drain available funds more quickly. The guidance does not address the issue of hospital-based physicians who bill separately. If these physicians choose not to participate in the program, they may continue to bill uninsured patients.
Funding: The guidance does not indicate how much money will be set aside to reimburse these claims. KFF has estimated that hospital costs alone could run between $13.9 billion to $41.8 billion – not taking into account costs incurred for services provided in other settings Further, the guidance specifies reimbursement will be subject to available funding, meaning once the funding runs out, providers will no longer get paid and uninsured patients may face tens of thousands of dollars in health care bills.
Future outlook
The new details released by HHS and an additional $75 billion to be added to the Relief Fund help to give a fuller picture of the resources that will be available to support providers during the coronavirus pandemic. While the administration has taken steps to protect uninsured patients and those at risk of being balanced billed, additional policies will be needed to fully protect patients during this pandemic.
This work was supported in part by Arnold Ventures. We value our funders. KFF maintains full editorial control over all of its policy analysis, polling, and journalism activities.