KFF designs, conducts and analyzes original public opinion and survey research on Americans’ attitudes, knowledge, and experiences with the health care system to help amplify the public’s voice in major national debates.
Historically, the LGBT+1 community has faced mental health and substance use problems at higher rates than their non-LGBT+ peers. The COVID-19 pandemic, which has disrupted the lives of people across the globe, has negatively impacted LGBT+ people’s mental health in disproportionate ways. In this data note, we pull together data from nationally representative surveys, adding to a small but growing evidence base on the impact of the pandemic on LGBT+ people.
LGBT people reported the COVID-19 pandemic negatively impacted their mental health both more widely and more severely than their non-LGBT peers. They report that their sleep, appetite, and temper were negatively impacted at higher rates than non-LGBT people. They also report that they were more likely to seek out mental health care during the pandemic than non-LGBT people, including via telemedicine.
A range of factors may contribute to these mental health disparities among LGBT+ people during the COVID pandemic, including different work, life, and health care experiences. LGBT+ people more commonly report quitting a job because of COVID-19, taking time off work because of becoming ill with COVID-19 or quarantining, or taking time off work to care for a family member who was sick with COVID-19 or quarantining than non-LGBT+ people. Given that LGBT+ have lower-incomes than their non-LGBT+ peers, disruptions in employment could be especially challenging for families and harmful to mental health.
Another factor that may drive these disparities is LGBT+ people’s higher rates of mental health and substance use problems pre-pandemic, including those related to more common experiences of stigma and discrimination compared to their non-LGBT+ peers. These underlying experiences could have made LGBT+ people more vulnerable to stress during the pandemic.
Despite LGBT+ people reporting accessing mental health care at higher rates than non-LGBT+ people, many still face barriers, particularly financial ones, to getting the care that they need. LGBT+ people are more likely to report they could not afford mental health care and say they face challenges with medical bills than their non-LGBT peers. Other reported roadblocks include problems getting appointments and negative provider experiences.
Taken together, these findings may help to identify and inform opportunities to address and mitigate mental health disparities among LGBT+ people. These could include adopting culturally appropriate policy solutions and approaches to engaging the community, as well as efforts to address wider, systemic factors that drive stigma and discrimination.
Introduction
Historically, the LGBT+ community has faced mental health and substance use problems at higher rates than their non-LGBT+ peers and experiences during the COVID-19 pandemic have been no exception. The pandemic has negatively impacted LGBT+ people’s mental health in disproportionate ways. Pulling together data from three nationally representative surveys in this area, we explore a range of factors related to LGBT+ people’s mental health during the pandemic including assessment of mental health, access to and affordability of mental health services, and underlying experiences of stigma, discrimination, and negative encounters with health care providers.
The Impact of COVID-19 on LGBT People’s Mental Health and Care Seeking
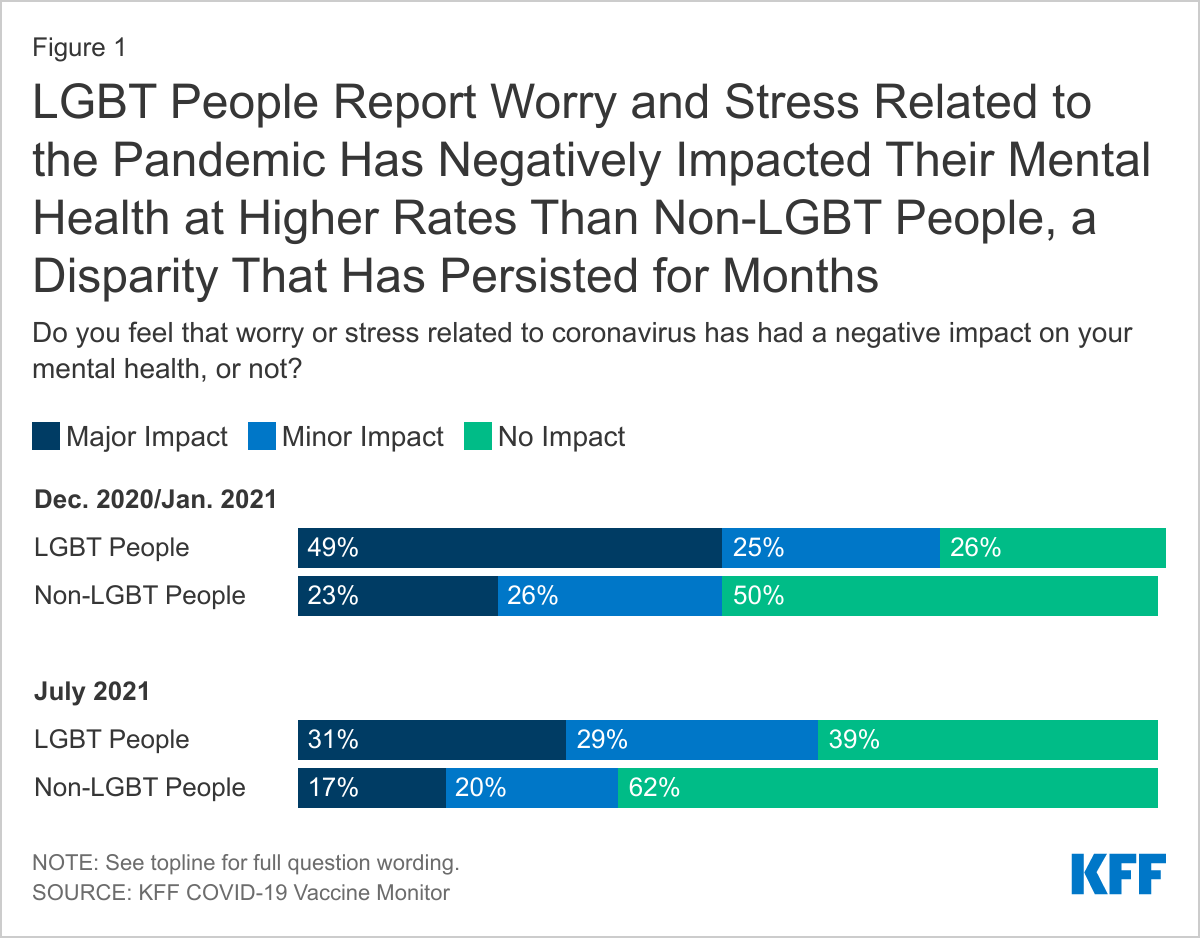
LGBT individuals report that worry and stress related to the COVID-19 pandemic negatively impacted their mental health more often and more severely than non-LGBT people. These negative mental health impacts were especially pronounced for all people before vaccines were widely available. The KFF COVID-19 Vaccine Monitor found that in the December 2020/January 2021 period, three-quarters of LGBT people (74%) reported that worry and stress from the pandemic negatively impacted their mental health compared to half (49%) of non-LGBT people. This includes about half of LGBT people (49%) who said the coronavirus was having a “major impact” on their mental health, twice the share of non-LGBT individuals who reported the same (23%) (Figure 1).
While the share reporting negative mental health impact of the pandemic fell for both groups in July 2021, a time of widely available vaccination and partial reopening, LGBT people continue to report the pandemic has negatively impacted their mental health both more widely and more severely than non-LGBT people. In July, six in ten LGBT people reported that the pandemic negatively impacted their mental health, about half (31%) of whom say that the impact has been major. By comparison, 37% of non-LGBT people reported a negative mental health impact in this period, 17% of whom say that the impact was major (Figure 1).
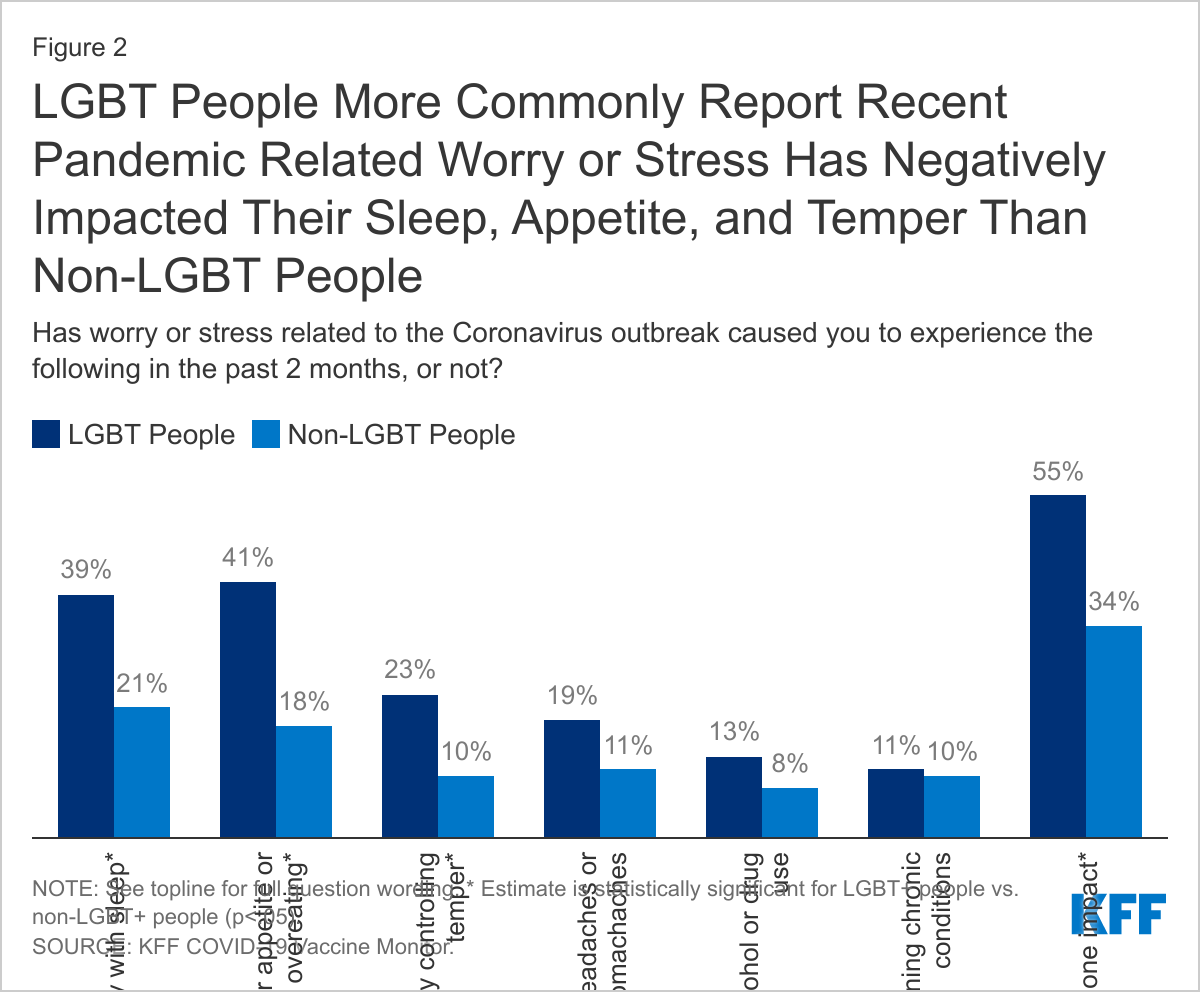
Specifically, compared to non-LGBT people, larger shares of LGBT people say worry or stress related to the coronavirus caused them to experience difficulty with sleep (39% v. 21%), problems with their appetite (41% v. 18%), and difficulty controlling their temper (23% v. 10%) in the past two months. They report similar rates of headaches or stomachaches, worsening chronic conditions (e.g. blood pressure or diabetes), and increased alcohol or drug use. LGBT people are more likely to report that they have experienced at least one of these impacts than non-LGBT people (55% v 34%) (Figure 2).
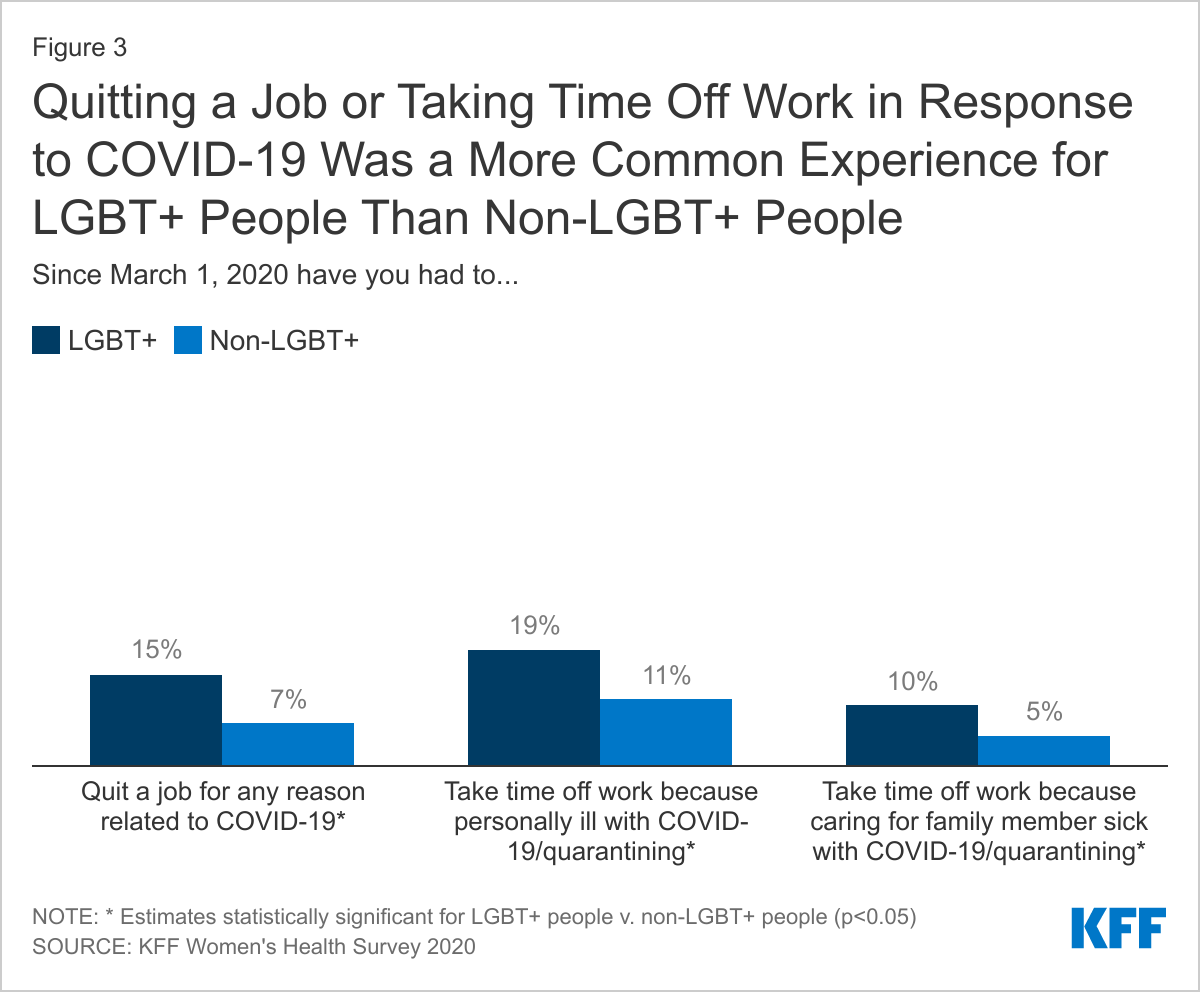
A range of factors may contribute to these mental health disparities among LGBT+ people, including their different circumstances during the pandemic. For example, the 2020 KFF Women’s Health Survey found larger shares of LGBT+ people reported having to quit a job for a reason related to COVID-19 compared to non-LGBT+ individuals (15% v. 7%). Additionally, 19% of LGBT+ people report taking time off work because of personally becoming ill with COVID-19 or quarantining, compared to 11% of non-LGBT+ individuals. One in ten (10%) LGBT+ people report taking time off work to care for a family member who was sick with COVID-19 or is quarantining (v. 5% of non-LGBT people) (Figure 3). While these factors could be stressful for any individual, given that LGBT+ people tend to be lower income than their non-LGBT+ peers, disruptions in employment could be especially challenging for families and harmful to mental health.
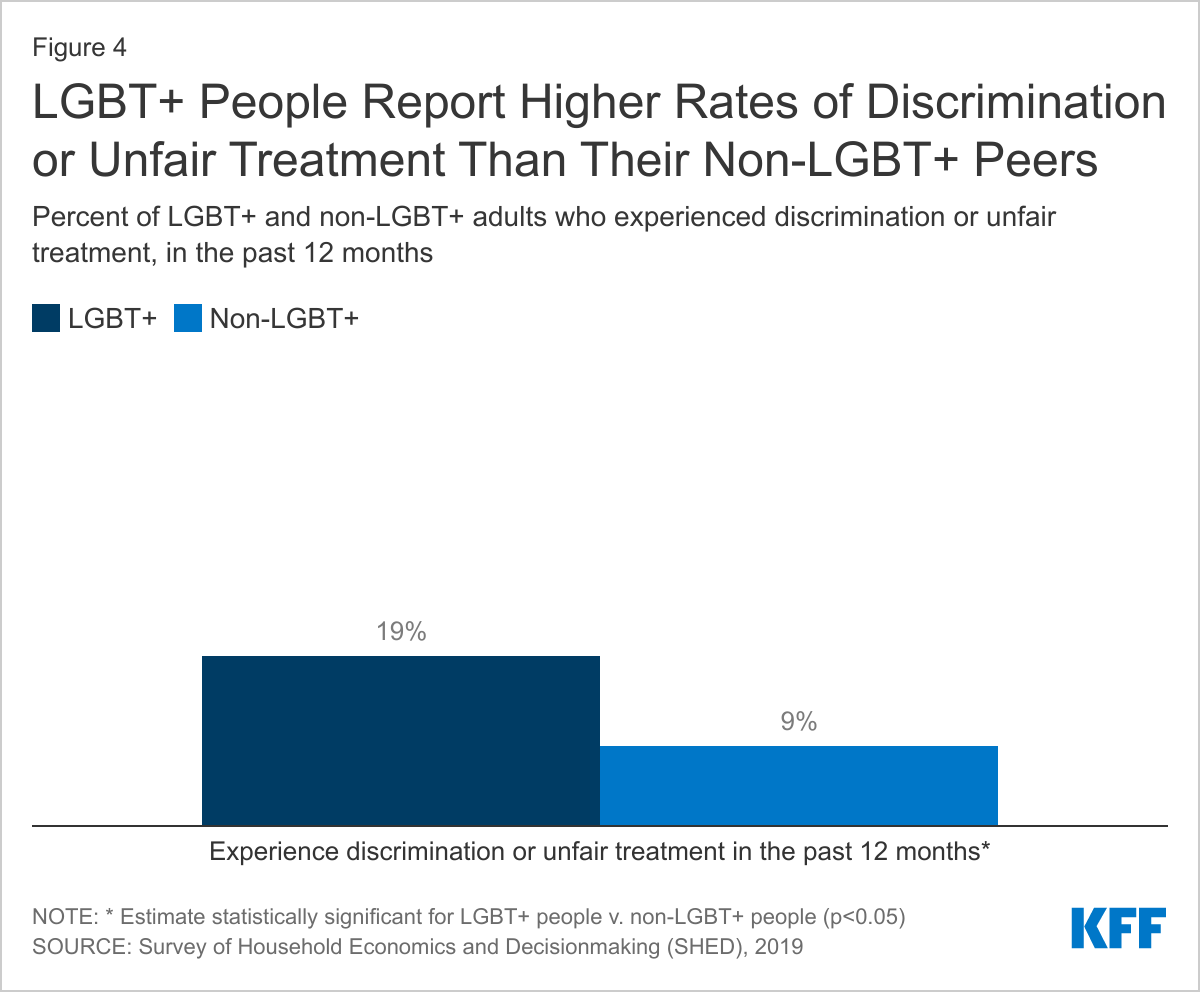
In addition, LGBT+ people faced higher rates of mental health and substance use problemspre-pandemic, which may be related to common experiences with stigma and discrimination. KFF analysis of 2020 Survey of Household and Economics and Decisionmaking (SHED) data reveal that 19% of LGBT+ people report experiencing discrimination or unfair treatment in the past 12 months versus 9% of non-LGBT+ people (Figure 4). These experiences with unfair treatment and discrimination were similar prior to and during the pandemic but the underlying stress associated with them could have made LGBT+ people more vulnerable to pressures related to the pandemic.
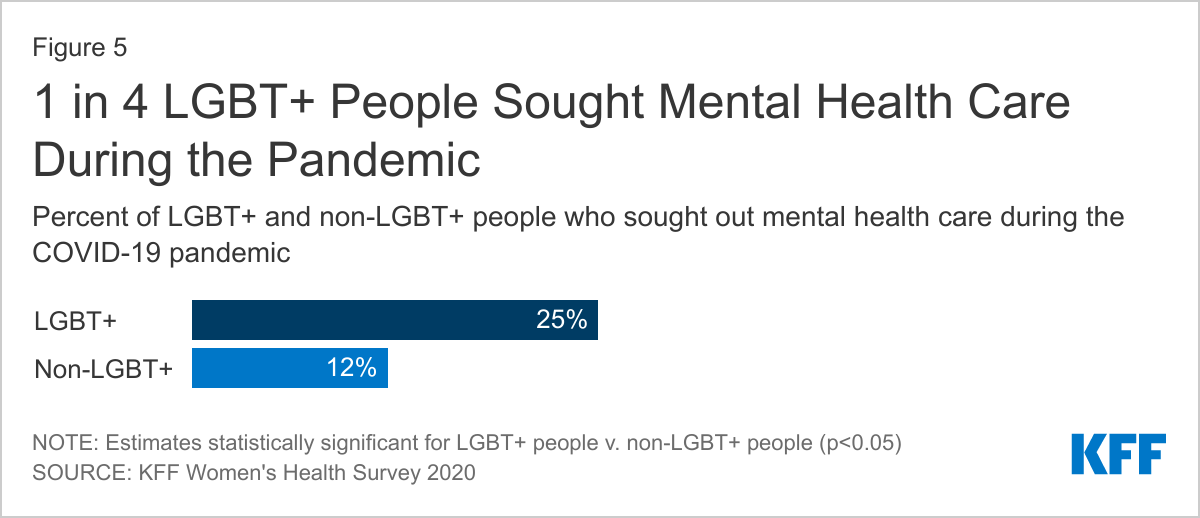
LGBT+ people also report seeking mental health care during the pandemic more than non-LGBT+ people. One in four (25%) LGBT+ people report seeking mental health care because of the pandemic, compared to 1 in 10 (12%) non-LGBT+ people, potentially reflecting their higher reported needs in these domains (Figure 5).
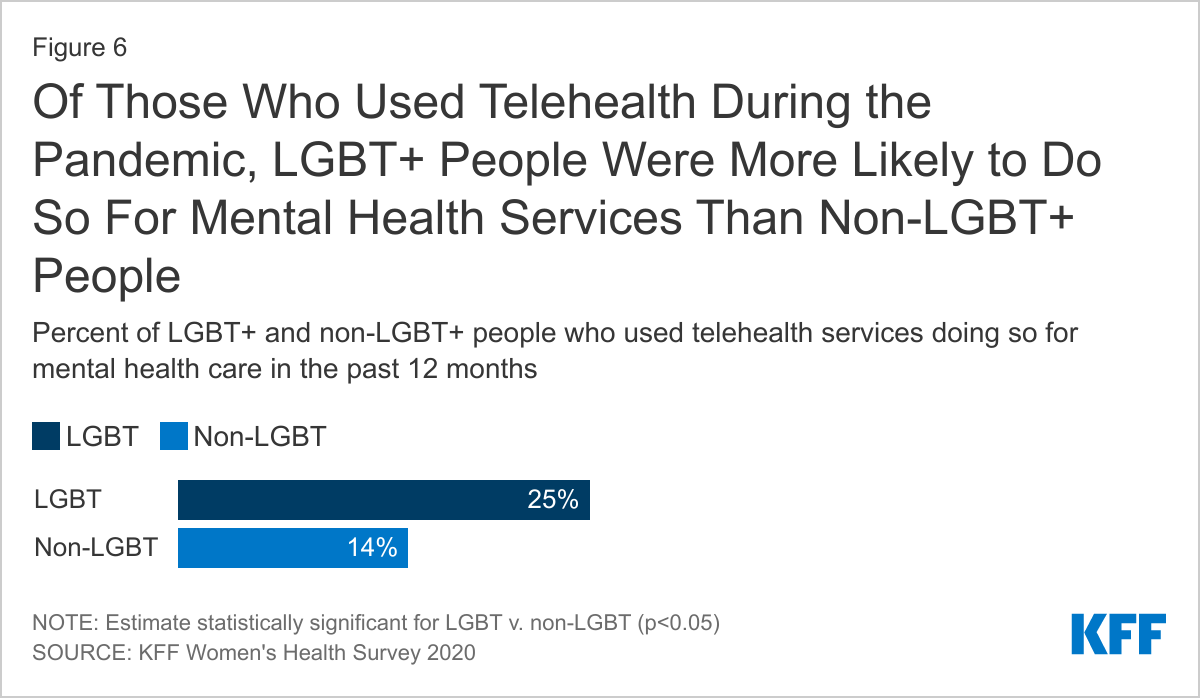
Additionally, LGBT+ people reported using telehealth more widely since the pandemic began than non-LGBT+ people (49% v. 34%) and among LGBT+ people who reported COVID era telehealth use, 25% say it was for mental health services, a higher share than non-LGBT+ telehealth users (14%) (Figure 6).
Barriers to Mental Health Care
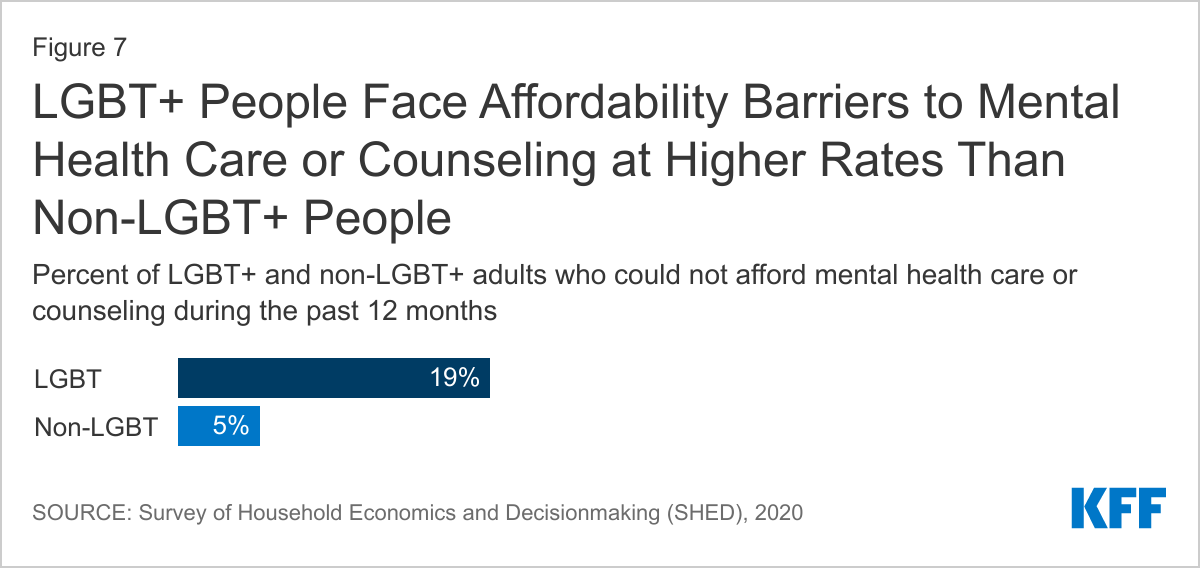
Even as LGBT people have a greater need for mental health care during the pandemic, and report seeking such care at higher rates, all those who require mental health services may not be receiving them. SHED data reveal that in 2020, one-in-five (19%) LGBT+ people say they could not afford mental health care or counseling during the past 12 months compared to a smaller share of non-LGBT people (5%) (Figure 7). LGBT+ people’s lower income levels and higher rates of pandemic related employment disruptions compared to non-LGBT+ peers could make accessing and affording mental health care especially difficult for this group.
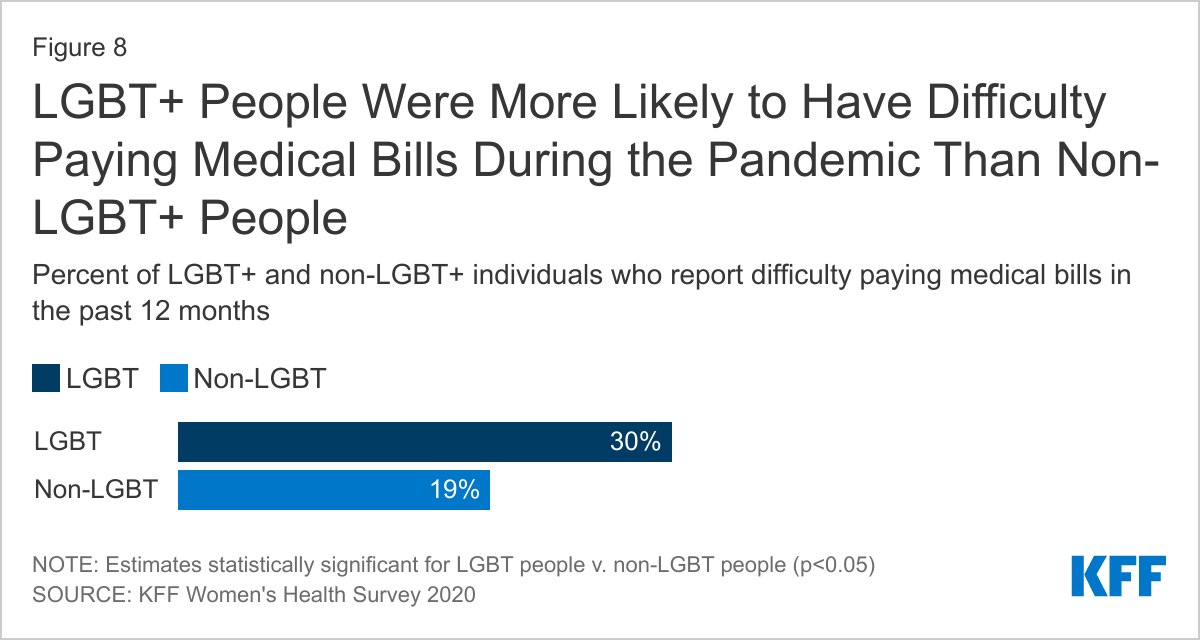
Indeed, 30% of LGBT individuals report trouble paying medical bills in the past year, compared to 19% of non-LGBT individuals (Figure 8). Of LGBT people who had trouble paying medical bills over half (58%) attributed that trouble, at least in part, to the COVID-19 pandemic.
In addition to financial challenges, difficulty in obtaining appointments during the pandemic may also present a barrier. Nearly one-third (29%) of LGBT+ people said they were unable to get a health care appointment during the pandemic (not limited to mental health services), similar to the share among non-LGBT+ people (25%).
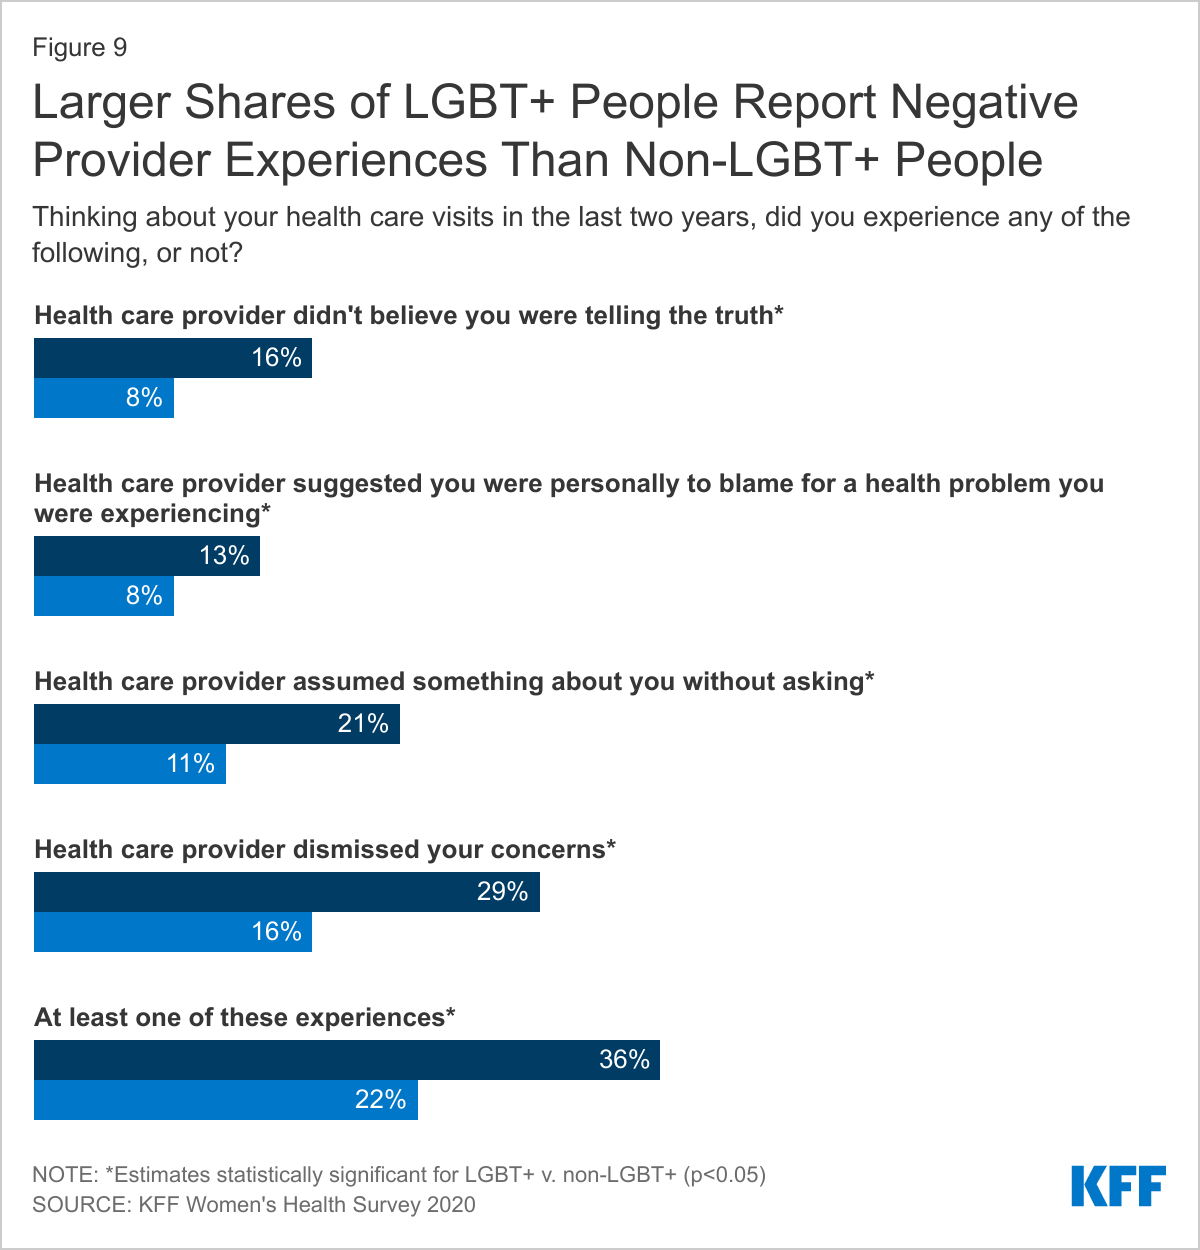
Negative provider experiences may also deter LGBT+ people from getting the care they need. Compared to non-LGBT people, LGBT+ people are more likely to report a provider has not believed they were telling the truth (16% v. 8%), suggested they were to blame for a health problem (13% v. 8%), assumed something without asking (21% v. 11%), and dismissing their concerns (29% v. 16%). Altogether, over one-third (36%) of LGBT+ people reported at least one of these negative experiences with a provider, compared to fewer than one in five (22%) non-LGBT+ people. (Figure 9)
Implications
Larger shares of LGBT+ people experienced negative mental health effects from the COVID-19 pandemic than non-LGBT people. While LGBT+ people were more likely to report seeking mental health care during the pandemic, not all those who need services are obtaining them. Many report barriers to receiving care, particularly related to affordability. However, difficulty getting appointments during the pandemic may also play a role, as might negative past provider experiences. Experiences of stigma and discrimination were widespread among LGBT+ people prior to the pandemic and these underlying disparities could make weathering pandemic related stress more challenging. These findings are important both given the mental health disparities LGBT+ populations have traditionally faced and as the pandemic created new stressors disproportionately impacting the community. As such, targeted and culturally appropriate policy solutions and approaches to engaging the LGBT+ community would be beneficial. Additionally, addressing the wider, systemic factors that drive stigma and discrimination may help to mitigate these disparities.
This work was supported in part by the Elton John AIDS Foundation. We value our funders. KFF maintains full editorial control over all of its policy analysis, polling, and journalism activities.
Methodology
COVID-19 Vaccine Monitor DataMethodology and toplines can be found here for Dec. 2020/Jan. 2021 data and here for July. In addition to the detail provided in the link, the July COVID-19 Vaccine Monitor is a nationally representative random digit dial telephone sample of 1,557 adults, including 95 adults who identified as lesbian, gay, bisexual, or transgender. The margin of sampling error is plus or minus 13 percentage points for the full LGBT sample and 3 percentage points for the non-LGBT sample.
Women’s Health Survey DataMethodology and topline can be found here.
Survey of Household Economics and Decisionmaking (SHED)The Survey of Household Economics and Decisionmaking (SHED) is an annual survey of adults conducted by the Federal Reserve Board. The survey is based on the Ipsos KnowledgePanel, a nationally representative probability-based online panel. Ipsos selected respondents for KnowledgePanel based on address-based sampling (ABS). The questions asked of the panel are intended to gather information from the individual about how they make household economic decisions. All data is the most current available. The data presented here are from the 2020 survey with the exception of the estimates of being a victim of violence which is from the 2019 survey. SHED survey finishes data collection in October and then releases the report and public use file in May of the following year. LGBT+ adults include those who self-identify as lesbian, gay, bisexual, transgender, or something else (other than straight or cisgender).
Endnotes
Where possible in this analysis we use the inclusive term LGBT+. LGBT+ includes people who identify as lesbian, gay, bisexual, transgender, or another sexual orientation or gender identity aside from heterosexual or cisgender. When LGBT is used, the more limited term describes the population a particular survey reflects. ↩︎
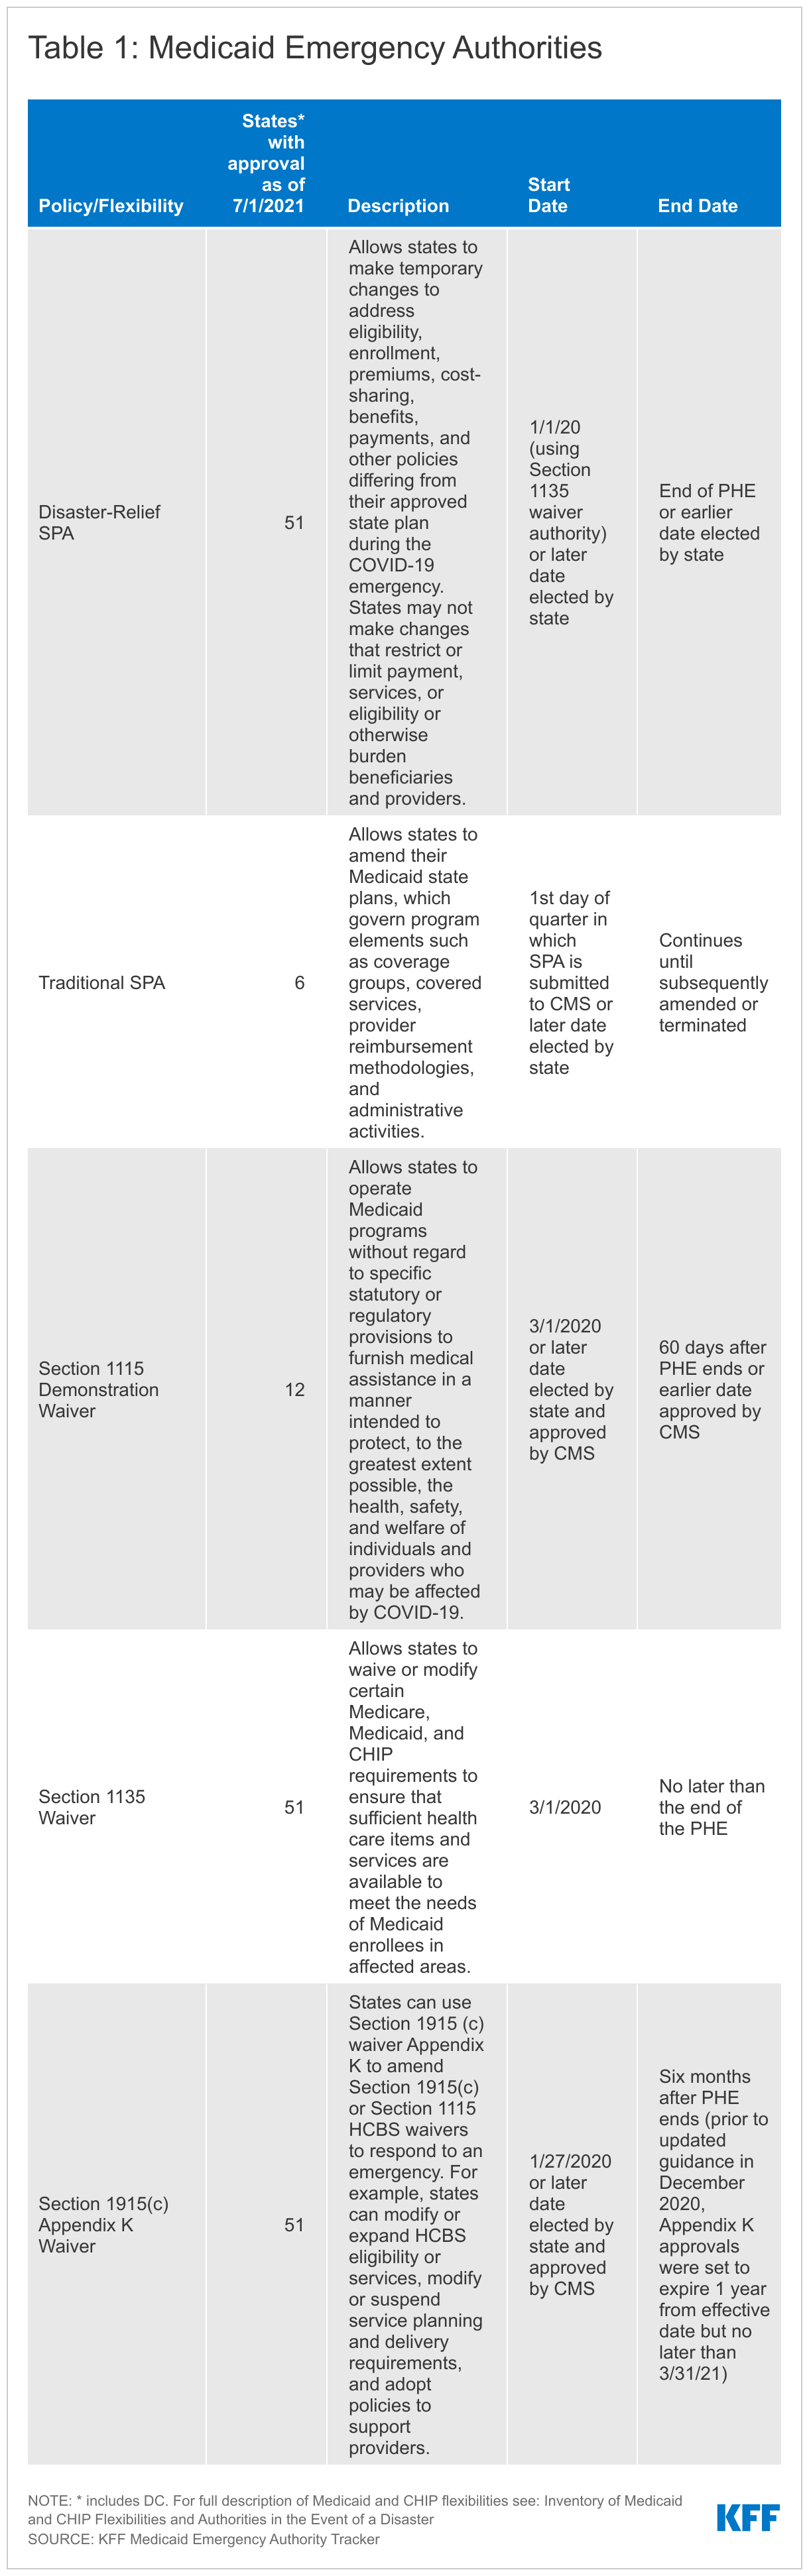
In response to the COVID-19 public health emergency, states and the federal government took a range of actions in Medicaid to enhance capacity to respond to the public health and economic crises. The COVID-19 pandemic had wide ranging effects across Medicaid, impacting providers, beneficiaries, and long-term services and supports (LTSS). States were able to use Medicaid emergency authorities to address specific challenges and make necessary changes as circumstances evolved and new challenges emerged.
Although the federal public health emergency (PHE) remains in place, as vaccine rates increased and COVID-19 cases declined earlier this year, many state-level emergency declarations expired and states started to terminate some Medicaid flexibilities beginning in late Spring and early Summer of 2021. However, the Delta variant and low vaccination rates in some areas may present additional challenges. The Biden Administration has indicated it intends to extend the public health emergency until at least the end of calendar year 2021, but a continued wave of infections, hospitalizations, and deaths could lead to further extensions and continued emergency authorities in Medicaid.
This brief summarizes how states have used Medicaid emergency authorities related to the COVID-19 PHE, providing potential lessons for future public health and economic crises.
The declarations of a national disaster and a public health emergency allow for the use of a range of Medicaid emergency authorities. These authorities include Disaster-Relief state plan amendments (SPAs), Section 1135 waivers, Section 1915(c) Appendix K waivers, and Section 1115 waivers. States can also make Medicaid program changes during a PHE using existing administrative authorities and traditional SPAs. In addition, Congress enacted major federal legislation to respond to the COVID-19 emergency, including funding to support Medicaid and increase access to Medicaid coverage. The PHE began on January 27, 2020, and the most recent declaration extended the PHE through October 18, 2021, however; the Biden administration has indicated it will continue to renew the PHE through the end of 2021 and that states will receive 60 days’ notice prior to its expiration or termination.
The unprecedented nature of the COVID-19 pandemic resulted in wide adoption by states of available Medicaid emergency authorities to expand Medicaid capacity and target services, providers, and enrollees that were impacted by the coronavirus emergency. Based on our tracking between March 2020 and July 2021, all 50 states and DC received approval to make changes through Disaster-Relief state plan amendments (SPAs), Section 1135 waivers and Section 1915(c) Appendix K waivers. Additionally, twelve states received approval for changes through a Section 1115 waiver and six states made changes through regular SPAs. States adopted many policies through these existing authorities similar to previous disasters, including to connect individuals to coverage more quickly and to address needs of affected populations.
States used Medicaid emergency authorities to make changes across a number of policy areas during the COVID-19 PHE to address the effects of the emergency. We analyzed specific state actions in more detail in a series of briefs, linked below. State actions included:
Facilitating access to Medicaid and/or CHIP coverage. As people lost jobs and income due to the COVID-19 emergency and associated economic downturn, a growing number became eligible for Medicaid. To make it easier for individuals to enroll, states made changes to expand eligibility and/or modify eligibility rules, eliminate or waive premiums, and streamline application and enrollment processes. Federallegislation also created a new optional Medicaid eligibility pathway available to all states, with 100% federal matching funds, for states to cover coronavirus testing and testing-related services for uninsured individuals. However, only about a third of states adopted this eligibility group and some states rescinded the policy later after adoption.
Expanding LTSS eligibility and benefits. The COVID-19 pandemic had a disproportionate impact on nursing homes, congregate settings, and other LTSS providers and services. In response, states expanded eligibility criteria for seniors and people with disabilities, reduced premium and/or cost-sharing requirements for these populations, and provided new LTSS benefits to meet enrollee needs during the emergency.
Supporting providers across service type and authority, most commonly by increasing payment rates and making retainer payments.The coronavirus pandemic resulted in financial strain for Medicaid providers. Forty-one states increased provider payment rates for state plan services through Disaster-Relief SPA or other administrative authority, 40 states did so for home and community-based services (HCBS) waiver services specifically using Appendix K, and two states received approval for Section 1115 waivers that increased payment rates for HCBS.
Increasing beneficiary access to medications. Medicaid beneficiaries with chronic conditions faced barriers to obtaining needed medications during social distancing and stay-at-home orders. To allow beneficiaries to have more of their medication on hand and reduce the barriers to receiving medication, states relaxed restrictions on quantity limits, allowed early refills, suspended prior authorization requirements and increased the availability of mail delivery.
Increasing access to telehealth. To increase health care accessibility and limit risk of viral exposure, states took steps to expand coverage and access to services delivered via telehealth. For example, states newly allowed certain services to be delivered via telehealth and established payment parity for these services as compared to face-to-face services. States also broadened the provider types that may provide services via telehealth, including by adding new providers and waiving licensing requirements.
Use of Medicaid emergency Section 1115 authority differed from previous emergencies. Historically, states have used Section 1115 authority to expand coverage and/or provide uncompensated care to address the direct impact of natural disasters and public health emergencies (like New York City after 9/11, Hurricane Katrina, and Flint Michigan) on state Medicaid and Children’s Health Insurance Program (CHIP) programs. In response to the COVID-19 PHE, however, CMS targeted the emergency Section 1115 waiver demonstration opportunity to HCBS flexibilities. While states initially submitted Section 1115 waivers with a broader approach, CMS approved few waivers and mostly limited the scope to authorities in the application template.
Medicaid emergency authorities related to the PHE expire at different times, but states can choose to continue some of these changes even after the PHE ends (Table 1). The PHE ends when the Secretary declares that the emergency no longer exists, or after 90 days from the last PHE extension, whichever happens first. As noted above, the Biden Administration has indicated the PHE will last at least through 2021. Policy changes such as streamlining eligibility and enrollment, adding benefits and increasing provider rates that were made through Disaster-Relief SPAs can be continued after the emergency through regular SPA authority. Similarly, states may submit 1915(c) waiver amendment requests to continue some Appendix K options (such as expanded telehealth, new services, and increased ability to pay family caregivers) after the PHE. States may also submit Section 1115 requests to continue some emergency flexibilities.
Lessons learned from Medicaid’s response to the COVID-19 PHE can inform continued pandemic response and recovery as well as future emergencies. To facilitate states’ adoption of emergency authorities during the COVID-19 PHE, the federal government issued templates, guidance documents and held state calls to communicate with states. These weekly state calls helped to provide timely guidance and to answer emerging questions as the federal government and states were moving quickly to implement new legislative provisions as well as emergency authorities designed to facilitate enrollment, access to care and reimbursement for providers. Preprint templates allowed states to quickly apply for and adopt flexibilities specifically addressed to COVID-19 challenges, especially given that states faced staffing shortages due to social distancing and illness. Once adopted, states and the federal government communicated with providers and enrollees to inform those impacted by the policy changes and to ensure that additional resources were utilized. Policy flexibilities during the COVID-19 PHE strengthened Medicaid’s ability to serve as a safety net during the pandemic and economic downturn by providing coverage to individuals who lost their jobs and supporting providers who experienced reduced income. The Biden Administration has indicated a continued focus on Medicaid as a key part of the social safety net during the COVID-19 recovery and beyond, including increasing support for HCBS services and increasing adoption of the Medicaid expansion. Going forward, understanding how the process of adopting and implementing changes during the pandemic worked and what could be improved will be important in continuing to respond to the current emergency and the Delta variant as well as future emergencies.
Looking ahead, some states had begun to unwind emergency authorities and were planning for a return to normal operations; however, they mayface challenges due to rising cases as a result of the Delta variant and low vaccination rates in some areas. The Biden Administration recently updated previous guidance to states on the end of the PHE on transitioning to normal operations, allowing additional time for states to complete renewals and redeterminations once the PHE ends. States began to roll back emergency authorities and plan for normal operations beginning in late Spring and early Summer of 2021 as vaccination levels increased and cases declined. More recently, however, states are again seeing increased cases due to the Delta variant. States with areas of low vaccination rates in particular may face challenges and disruptions similar to those experienced earlier in the pandemic. If states have terminated emergency Medicaid flexibilities that increased access to coverage and care, they may have reduced ability to address the effects of the Delta variant on providers and individuals. Increased case levels due to coronavirus variants may result in the Biden Administration continuing to extend the PHE into 2022, which would also have implications for maintenance of effort requirements for states, further extending the time which they must provide continuous Medicaid coverage and keeping many emergency authorities in place longer.
Vaccine safety, efficacy and potential side effects, as well as the need for vaccinations among children, are among issues highlighted in the new FAQ video series, which addresses both the currently available COVID vaccine for 12 and older as well as status of vaccines for younger children. Comedian and parent, W. Kamau Bell appears in an anchor video in conversation with pediatricians about some of the most common questions asked by parents and caregivers in KFF research.
Children 12 and older are currently eligible to get the COVID vaccine. Clinical trials with children under 12 are underway with authorization expected to come later this fall. With the Delta variant resulting in increasing COVID cases among children, along with adults, and rising hospitalizations among those unvaccinated, there is growing urgency to get children vaccinated when eligible.
“As a pediatrician, I am very concerned about the rapid increase in children who are being infected and hospitalized with COVID due to the Delta variant,” said AAP President, Lee Savio Beers, MD, FAAP. “Vaccination is the best way to protect children 12 and older. And for those children who are not yet eligible to be vaccinated, families can protect them by getting vaccinated themselves. This is part of a layered approach that includes hand washing, physical distancing and wearing masks as kids return to school.”
According to a data analysis by the AAP, as of August 19, nearly 4.6 million children have tested positive for COVID-19 since the onset of the pandemic. Over 180,000 cases were added from the week prior, a continuing substantial increase. After declining in early summer, child cases have steadily increased since the beginning of July.
“The surge in COVID cases as children return to school has many parents anxious about how best to protect their families. Parents trust pediatricians more than everyone else when it comes to information on vaccinating their kids. This campaign provides resources that build on that trust,” said KFF President and CEO Drew Altman.
According to recent findings from the KFF COVID Vaccine Monitor, pediatricians are the top trusted source of information on COVID-19 for parents. Among parents of teens who discussed the vaccine with their pediatrician, most say the doctor recommended their child get vaccinated, and three-quarters of those whose pediatrician recommended vaccination say their child has received at least one shot.
“Children across the country are returning to in-person learning at a time when the dominant strain of COVID is more contagious than ever. So many parents and caregivers are rightfully concerned about how to protect their kids,” said Rhea Boyd, MD, MPH, pediatrician and public health advocate, who co-developed THE CONVERSATION / LA CONVERSACIÓN with KFF and appears in the current messaging about kids and the COVID vaccines. “In this video series, parents and caregivers can hear directly from us, pediatricians who know the science and can share the information they need to feel comfortable getting their kids vaccinated when eligible.”
“I’ve been working with pediatric vaccines my whole career, including in pediatric COVID-19 vaccine trials here at Stanford Medicine. There is no doubt in my mind that we absolutely need vaccines for children. We know that vaccines are the most effective public health intervention to keep all populations safe and healthy,” says Yvonne “Bonnie” Maldonado, MD, Stanford Medicine Epidemiologist and Pediatric Infectious Disease Specialist, who appears in the campaign.
THE CONVERSATION / LA CONVERSACIÓN offers an expansive, living video library featuring doctors, nurses, researchers and community health workers dispelling myths and providing credible facts about the COVID-19 vaccines. The campaign debuted in March with an initial series focused on Black communities presented with the Black Coalition Against COVID. Additional content was added in May for Latinx and Spanish-speaking communities with UnidosUS. To date, the videos have been viewed more than 82.7 million times on digital and social media.
All content is available rights-free and designed to be shared on social media and can be easily embedded on websites. A community toolkit provides additional graphics and promotions to extend reach of the messaging.
The California Health Care Foundation, California Community Foundation, California Endowment, Commonwealth Fund, Sierra Health Foundation and Walgreens have provided funding in support of THE CONVERSATION / LA CONVERSACIÓN campaign. YouTube, Google, Facebook, Twitter and Pinterest are promoting the messaging on their platforms as part of efforts to amplify trusted voices on COVID-19.
For more information about THE CONVERSATION / LA CONVERSACIÓN go to:
The American Academy of Pediatrics is an organization of 67,000 primary care pediatricians, pediatric medical subspecialists and pediatric surgical specialists dedicated to the optimal health and well-being for all infants, children, adolescents and young adults. For more information, visit www.aap.org.
Greater Than COVID is a public information initiative from KFF to help individuals take charge of their health during the evolving COVID-19 public health crisis. Tailored media messages and community tools address information needs about the vaccines.
Continuing its expansion into audio storytelling, KFF’s Kaiser Health News examines the rising suicide rates among Black, Hispanic and other communities of color in its first collaboration with Science Friday, the award-winning producer of high-quality, trustworthy science news and educational programming.
The storytelling highlights tragic cases like that of 19-year-old Jamal Clay, who killed himself in his family’s garage in May 2020. Rafiah Maxie, Clay’s mom and herself a social worker, recounts her difficulties in getting her son the mental-health care he needed and her efforts since his death to help others affected by violence, suicide and trauma in her community outside Chicago.
Reported by KHN correspondent Aneri Pattani, the package includes Pattani’s digital story, and a radio segment airing today with longtime SciFri guest host John Dankosky and voices of families and experts. In their conversation, Dankosky and Pattani discuss socioeconomic factors linked to suicide risk and the community-level fixes that might reverse its rise among people of color in the U.S.
KHN’s initial collaboration with Science Friday builds on a strong tradition of audio journalism — including KHN’s longtime partnership with NPR and dozens of its member stations to report on health and health policy issues from across the country, and the crowdsourced investigative series with NPR and CBS, “Bill of the Month.”
KHN’s family of podcasts includes What the Health?, An Arm and a Leg and Where It Hurts, a co-production with St. Louis Public Radio. In other recent audio collaborations, KHN has partnered with This American Life and Reveal from the Center for Investigative Reporting.
KHN (Kaiser Health News) is a national newsroom that produces in-depth journalism about health issues. Together with Policy Analysis and Polling, KHN is one of the three major operating programs at KFF (Kaiser Family Foundation). KFF is an endowed nonprofit organization providing information on health issues to the nation.
About Science Friday
The Science Friday Initiative, a nonprofit, is dedicated to increasing the public’s access to science and scientific information. WNYC Studios distributes the radio show, which airs on over 400 public radio stations across the U.S. The initiative produces a sweeping array of educational and entertaining science experiences including videos, podcasts and live events that serve hundreds of thousands of lifelong learners every year.
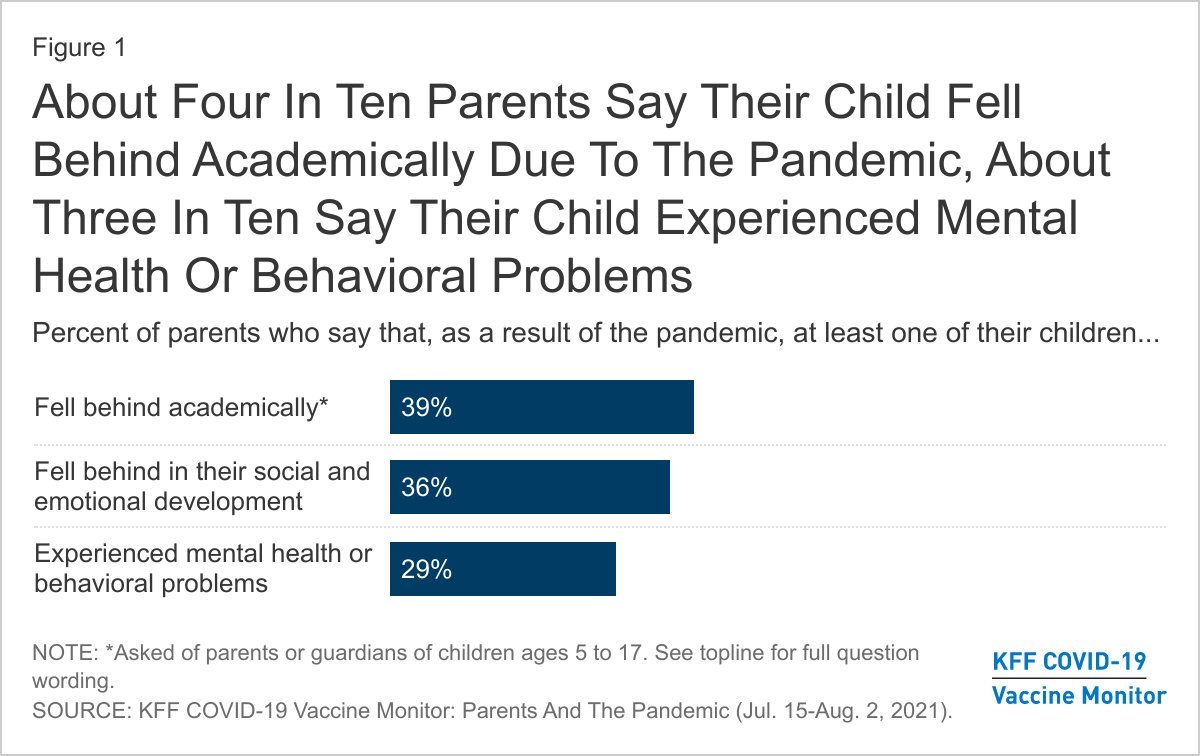
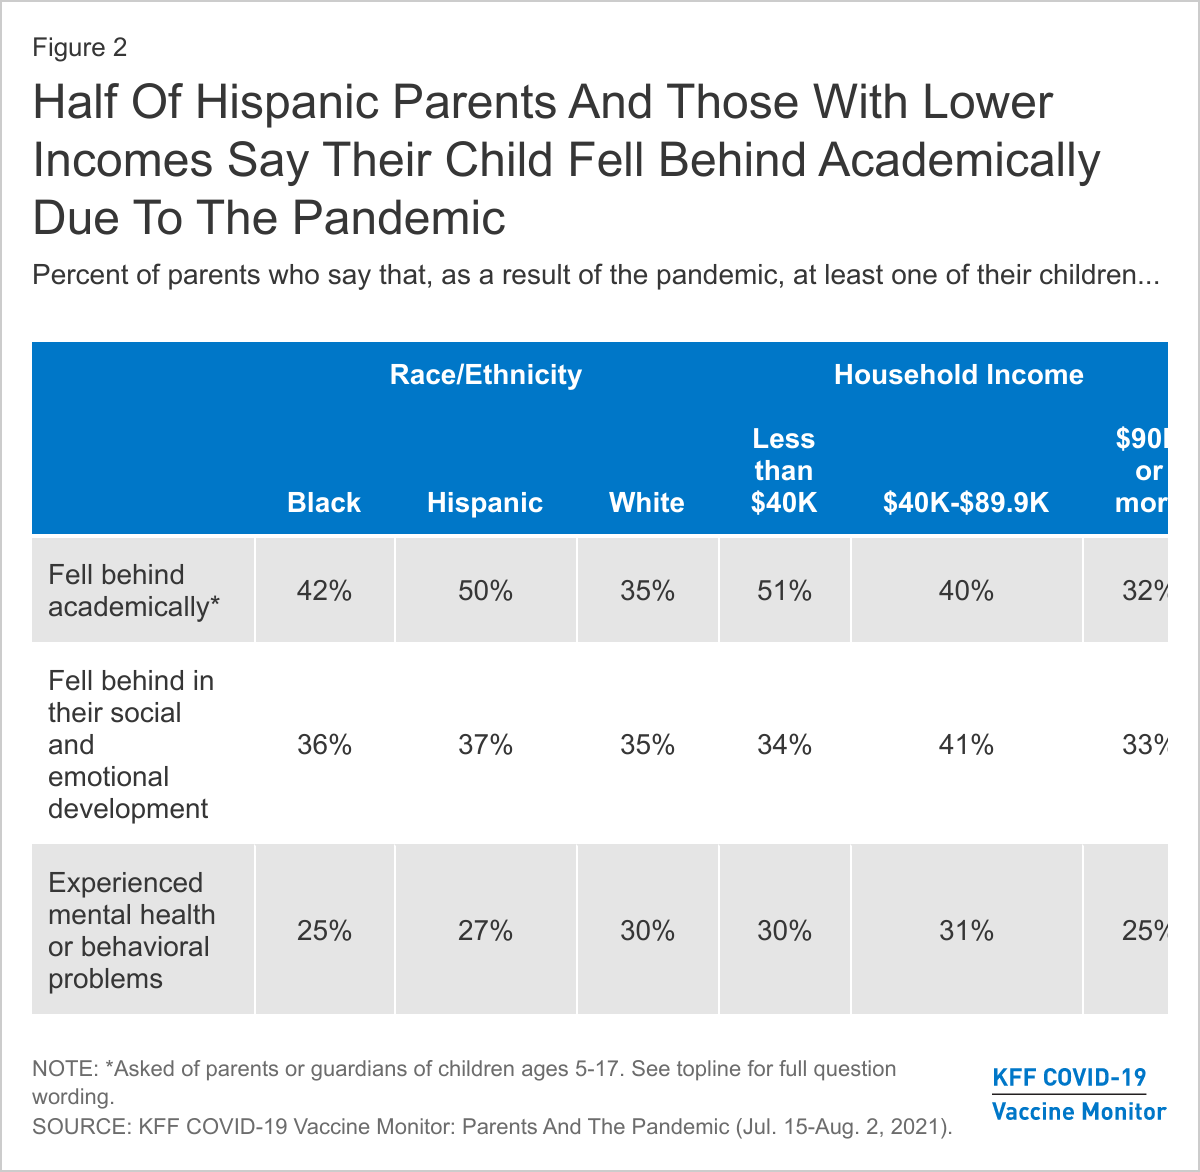
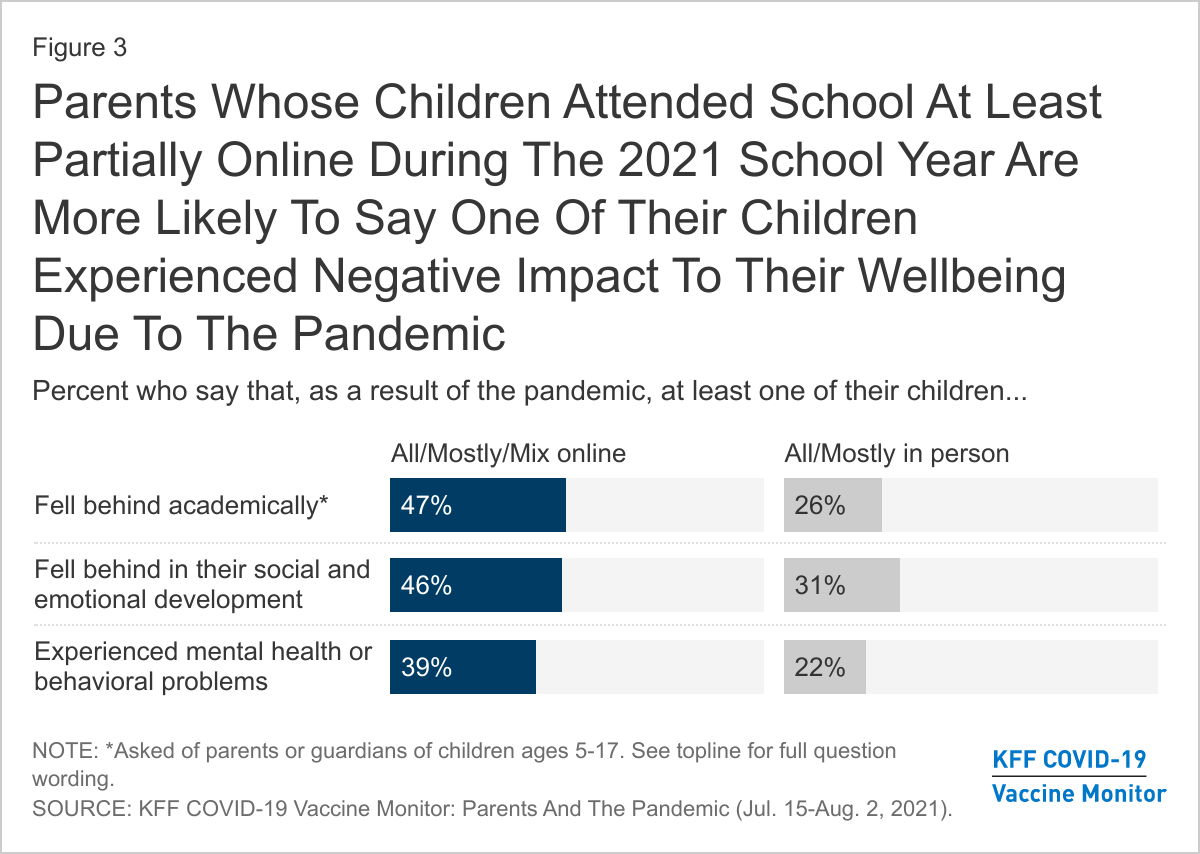
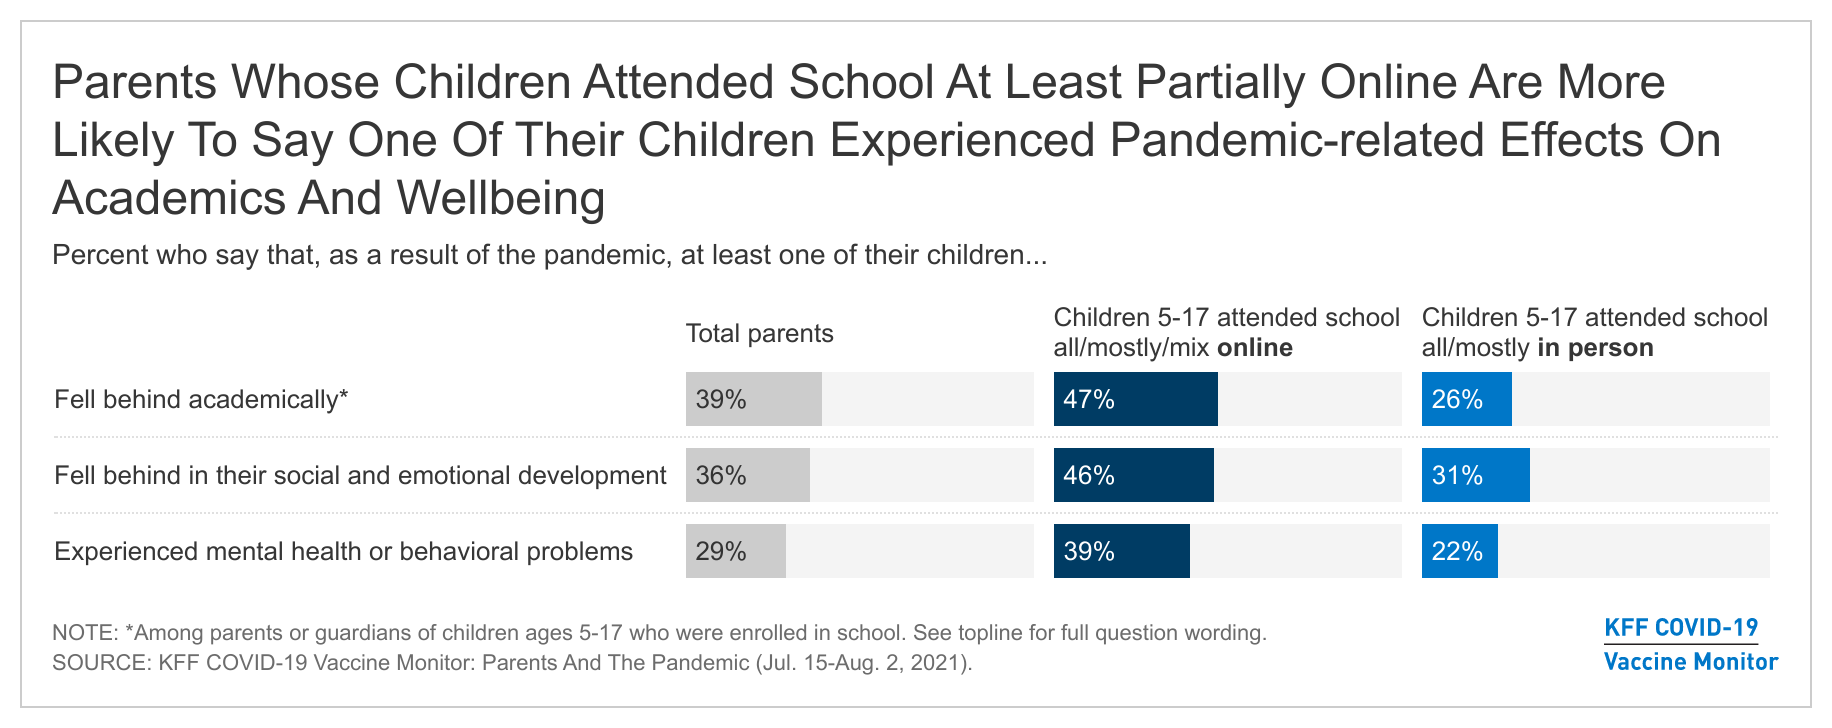
As students head back to school amid uncertainty caused by the coronavirus pandemic, the latest report from the KFF COVID-19 Vaccine Monitor finds parents reporting notable adverse impacts of the pandemic on children’s academic and social development. About four in ten parents of children ages 5 and over say at least one of their children fell behind academically (39%), rising to half of Hispanic parents (50%) and those with lower household incomes (51%). More than a third (36%) of parents say their child fell behind in their social and emotional development and about three in ten (29%) say their child experienced mental health or behavioral problems due to the pandemic. Notably, parents whose children attended school all or mostly online, or who had a mix of online and in-person schooling were more likely than parents whose child attended school all or mostly in-person to say they had a child who had these adverse effects even after controlling for other demographic factors and type of school.
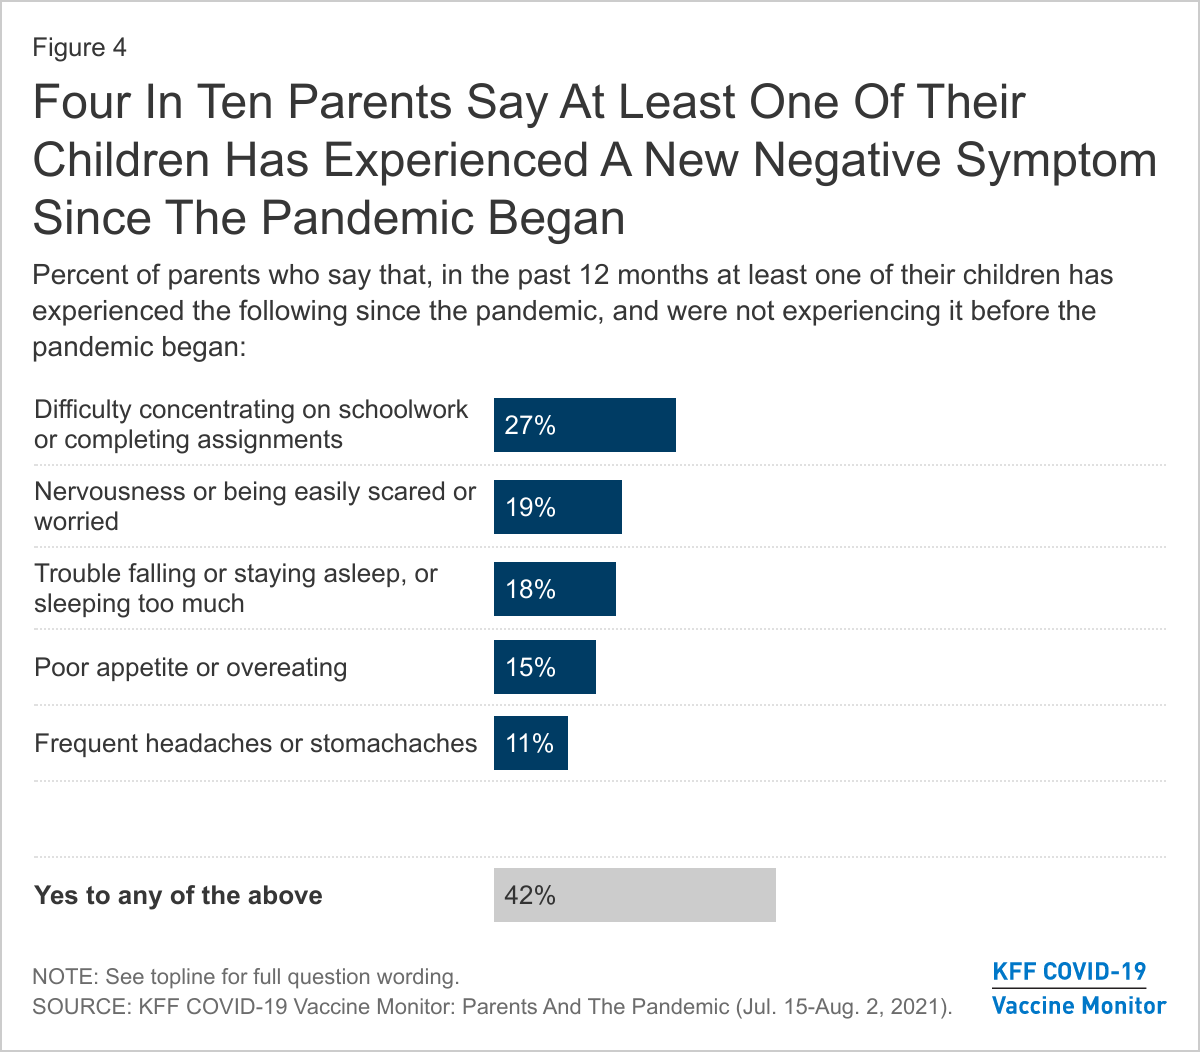
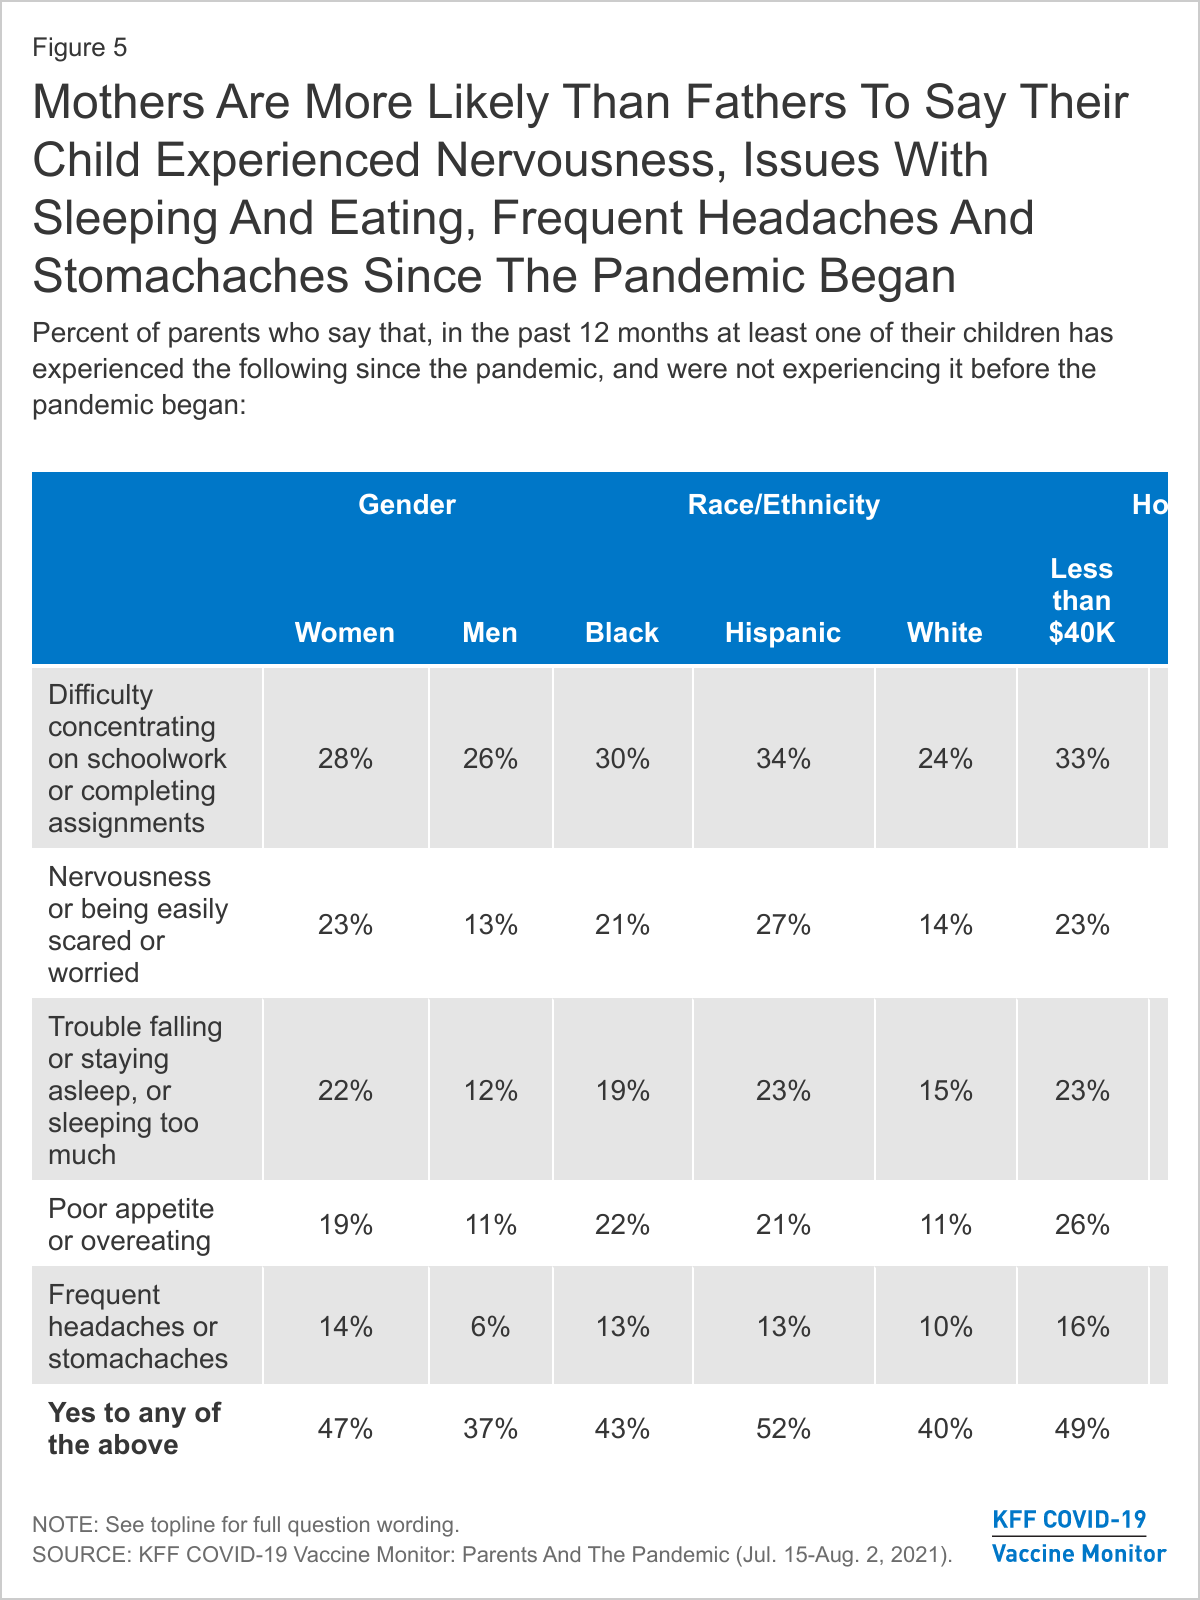
When asked about more specific problems that may indicate mental health concerns among children, about four in ten parents (42%) report that at their children experienced at least one new mental health symptoms in the past 12 months that they had not been experiencing them before the pandemic including difficulty concentrating on schoolwork (27%), problems with nervousness or being easily scared or worried (19%,) trouble sleeping (18%), poor appetite or overeating (15%), and frequent headaches or stomachaches (11%). Mothers – who tend to take on greater responsibilities for childcare and are often the primary health care decision makers in a family– are more likely than fathers to say one of their children experienced most of the symptoms since the pandemic began.
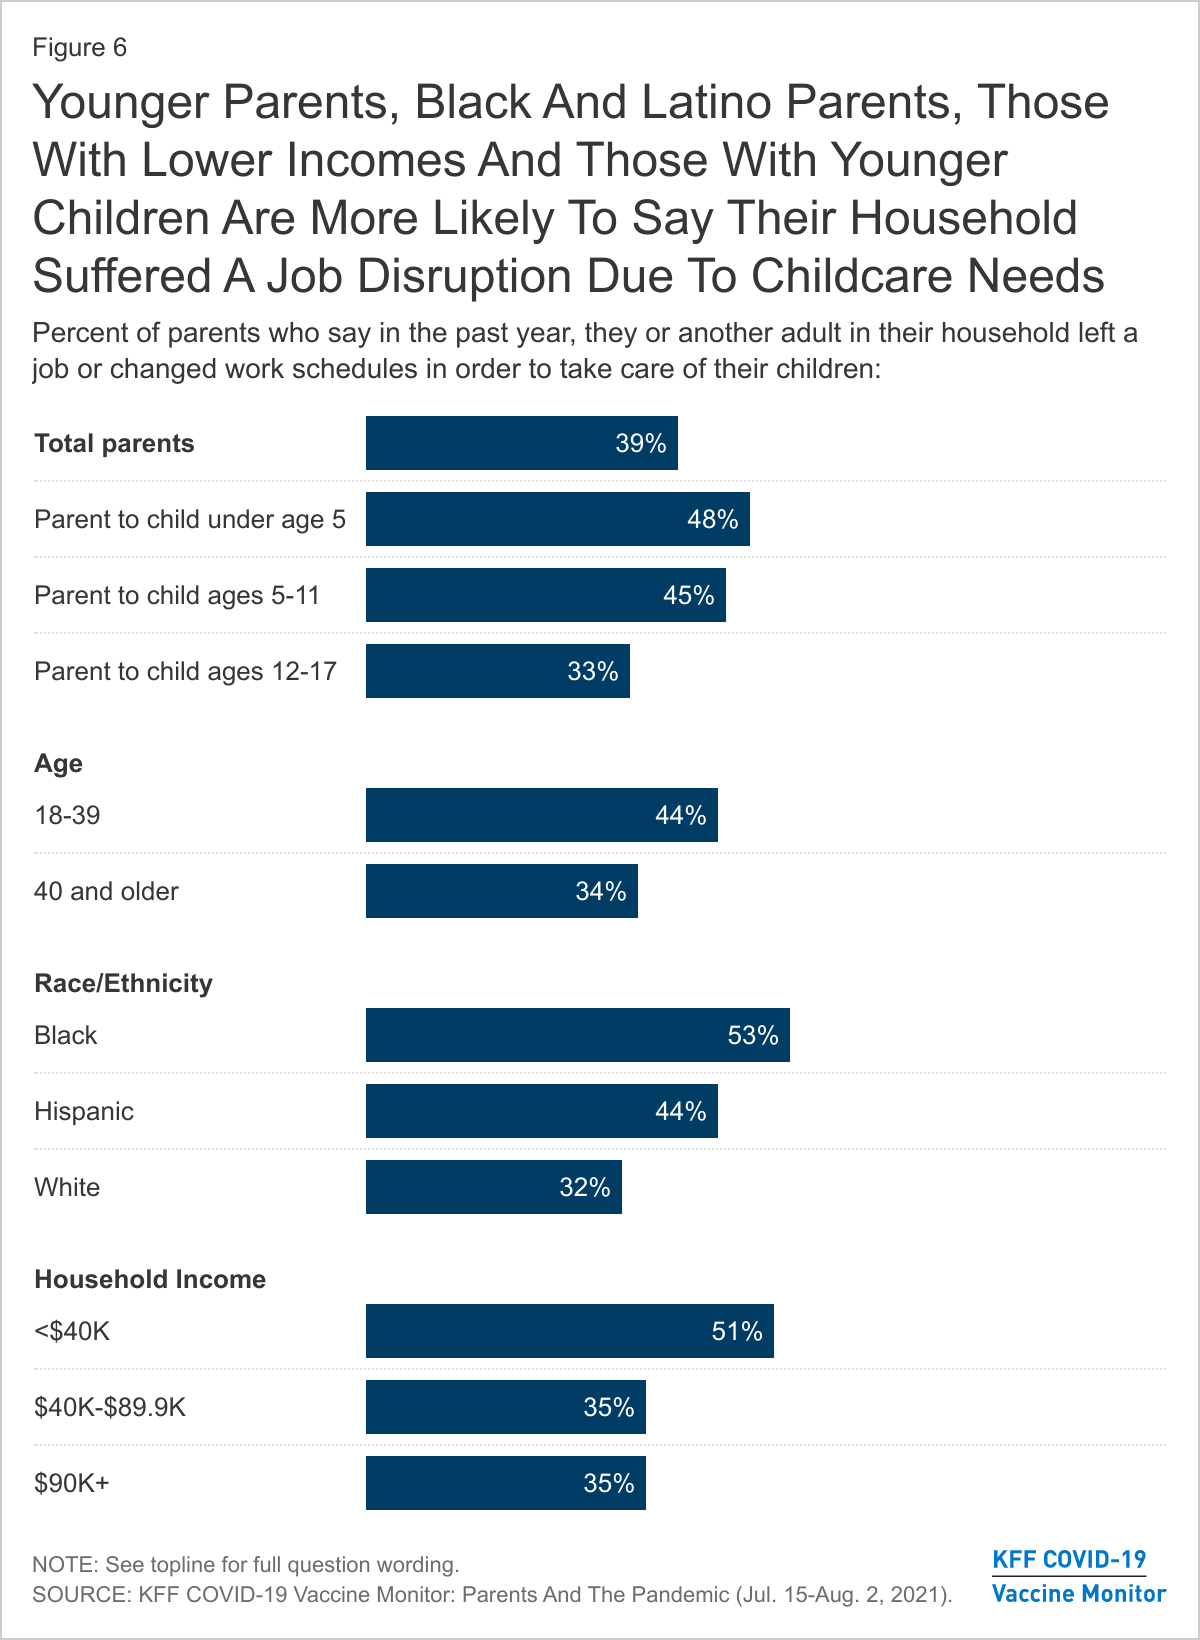
The KFF COVID-19 Vaccine Monitor finds that nearly four in ten parents say they or another adult in their household left a job or changed work schedules to care for their children in the past year. Notably, more than half of Black parents (53%) and parents with lower household incomes (51%) say they or another adult in their family left a job or changed schedules in order to care for their children. One in five parents overall say the person in their household who left a job or changed their work schedule is still not working or continues to work reduced hours, rising to one-third of Black parents and nearly four in ten lower-income parents.
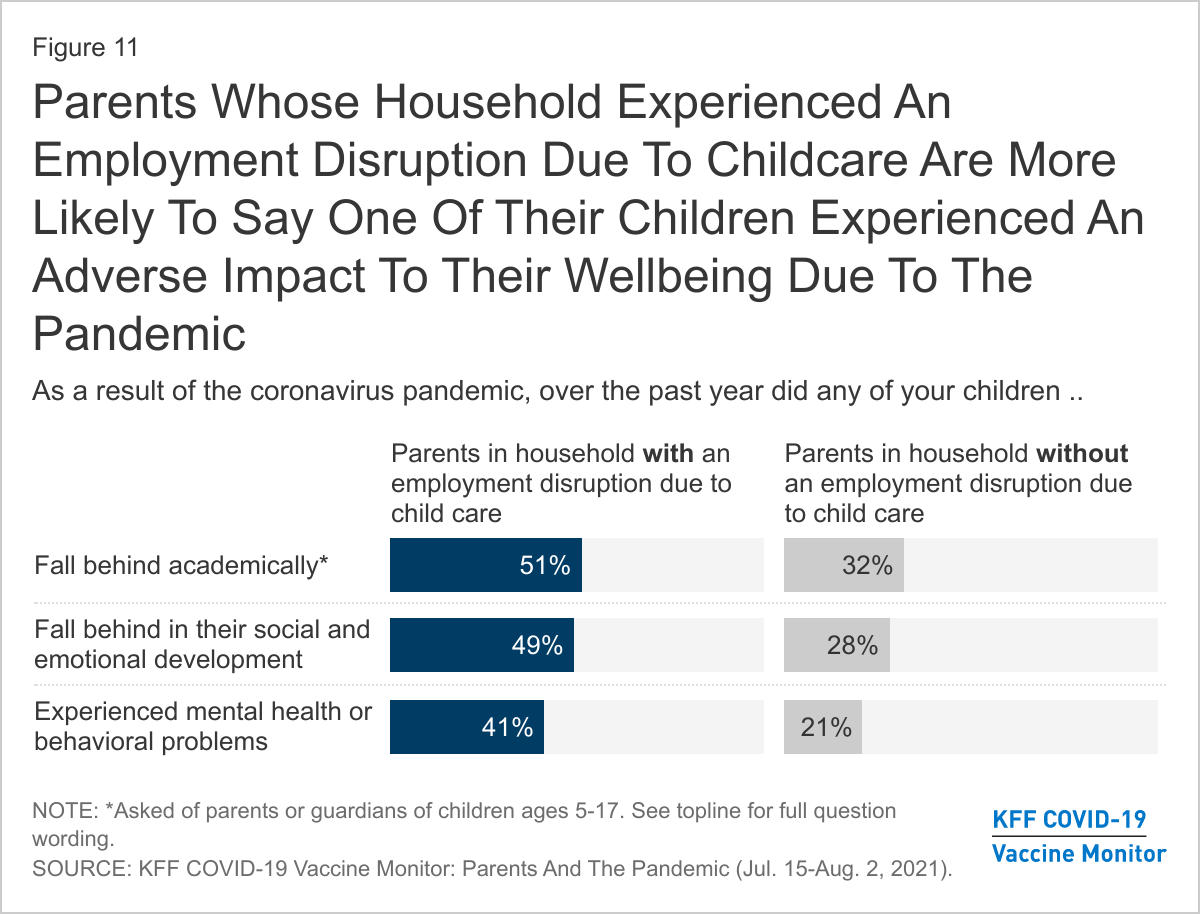
Household employment disruptions may also be related to children’s wellbeing. Parents in a household with an employment disruption are more likely than those who didn’t experience a disruption to say their fell behind academically (51% vs. 32%), fell behind in their social or emotional development (49% vs. 28%), or experienced mental health or behavioral problems (41% vs. 21%). Parents in a household with an employment disruption are also more likely than those who did not experience a disruption to say their child has developed a new mental health symptom since the pandemic began (56% vs. 33%).
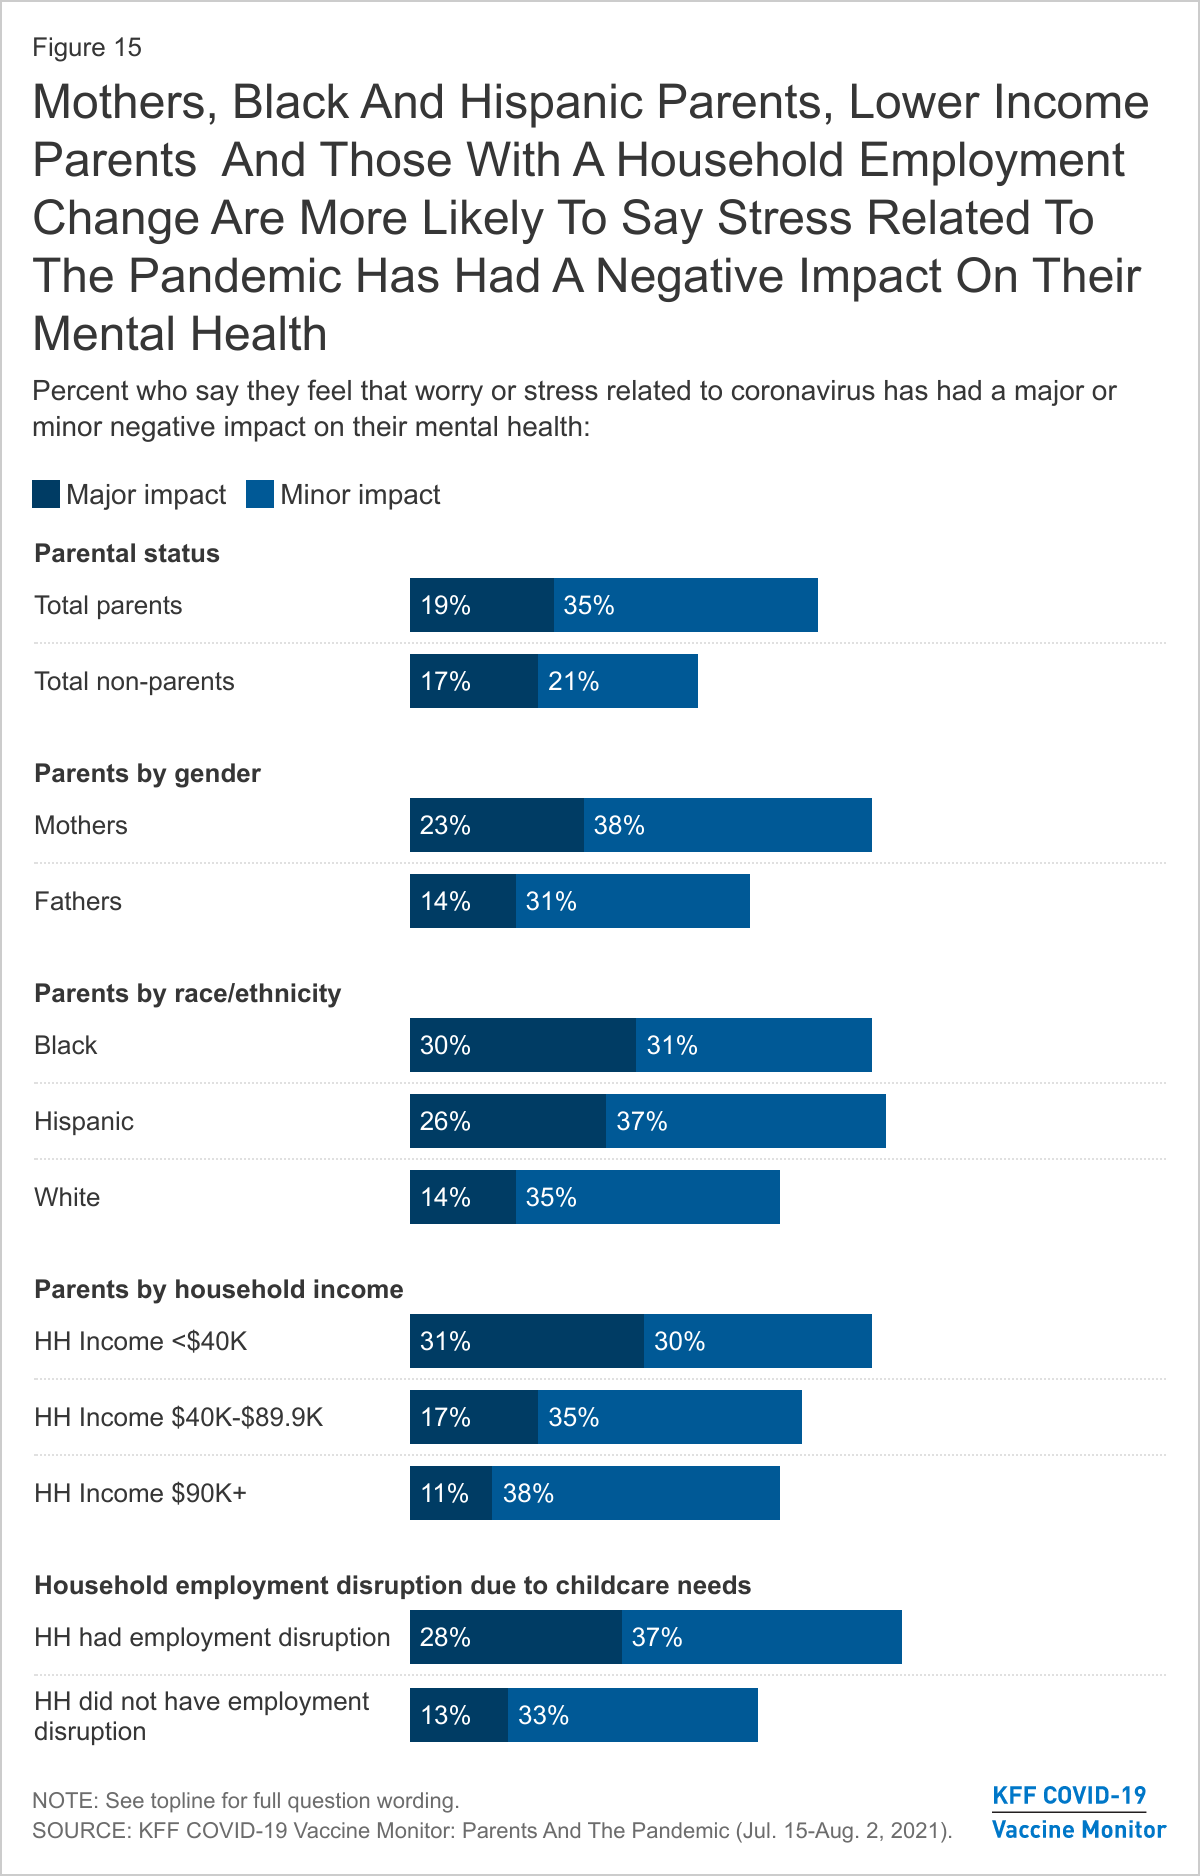
Along with negative impact on children’s mental health, the pandemic appears to have taken a mental health toll on parents. A majority (54%) of parents say the pandemic has had a negative impact on their mental health, compared to 39% of adults overall who say the same. Mothers, Black and Hispanic parents, those with lower incomes, and parents whose household experienced a work disruption due to increased childcare needs have been particularly affected with at least six in ten in each of these groups saying it the pandemic had a negative impact on their mental health.
Effects of the pandemic on children’s academic and emotional development
As students head back to school amid uncertainty caused by the coronavirus pandemic, this new report from the KFF COVID-19 Vaccine Monitor examines parents’ assessment of the toll the pandemic has taken on their children and on their own mental health and financial wellbeing over the past 18 months. When asked about specific ways the pandemic may have affected their children, about four in ten parents of children ages 5 and over say at least one of their children fell behind academically (39%), while more than a third (36%) of parents of children of any age say their child fell behind in their social and emotional development and about three in ten (29%) say their child experienced mental health or behavioral problems due to the pandemic.
Notably, half of Hispanic parents say one of their children fell behind academically as a result of the pandemic compared to about a third of White parents (35%) who say the same. Across income groups, half (51%) of parents with a household income under $40,000 say their child fell behind academically compared to about a third (32%) of those with incomes of $90,000 or more.
The coronavirus pandemic caused a tremendous amount of disruption to the 2020-2021 school year. Across the country, millions of students and teachers had to transition to online learning. Previous KFF research at the beginning on the 2020-2021 school year found that about two-thirds of parents were worried about their child falling behind academically or in their social and emotional development if they did not return to in-person school. Indeed, most students were not able to attend in-person school fulltime during this past school year. KFF’s most recent COVID-19 Vaccine Monitor finds that a majority of parents say their child attended school at least partially online during the previous school year (72% of parents of 12-17 year-olds and 62% of parents of 5-11 year-olds). Notably, we find that parents of children whose school was at least partially online are more likely than those whose kids attended school mostly or completely in-person to report that one of their children have experienced a negative impact to their wellbeing1 . These differences may be at least partially due to differences in other demographic characteristics of parents whose child’s schools offered in-person schooling compared to those who did not. However, using a statistical technique called multivariate regression, we find that even after controlling for parent’s race and ethnicity, gender, income, region, age, educational attainment, and party identification and whether they had a child attending private or public school, parents with a child who attended school at least partially online are more likely than those whose children attended school all or mostly in person to report their child experienced a negative impact to their wellbeing due to the pandemic.
Parents whose children attended school all or mostly online, or who had a mix of online and in-person schooling were more likely than parents whose child attended school all or mostly in-person to say they had a child who fell behind academically (47% vs. 26%), fell behind in their social or emotional development (46% vs. 31%), or experienced mental health or behavioral problems (39% vs. 22%).
When asked about more specific problems that may indicate mental health concerns among children, about one in four parents (27%) say their children had difficulty concentrating on schoolwork or completing assignments and that this was a new problem they were experiencing since the pandemic began. About one in five say a child experienced new problems with nervousness or being easily scared or worried (19%) or trouble falling or staying asleep or sleeping too much (18%). In addition, 15% of parents say their children exhibited poor appetite or overeating (15%) and about one in ten say they experienced frequent headaches or stomachaches (11%). Overall, four in ten parents (42%) report that their children experienced at least one of these symptoms in the past 12 months and had not previously been experiencing them before the pandemic.
With the exception of difficulty concentrating on schoolwork, mothers – who tend to take on greater responsibilities for childcare and are often the primary health care decision makers in a family– are more likely than fathers to say one of their children experienced each of the symptoms since the pandemic began. Overall, about half (47%) of mothers report that their child experienced a new problem compared to about to four in ten fathers (37%).
Notably, half of Hispanic parents (52%) and lower-income parents (49%) say one of their children exhibited one of these mental health symptoms in the past 12 months which were not present before the pandemic. In addition, parents of children who attended school at least partially online are more than twice as likely as parents whose children attended school all or mostly in person to say their child experienced new problems concentrating on schoolwork or completing assignments in the past 12 months (41% vs. 17%).
Childcare Needs And Employment Disruptions
In this past year, the pandemic not only affected children, but has also had an impact on working parents and families across the country. A recent KFF analysis of the Census Household Pulse Survey shows that households with children were more likely to have experienced employment loss. The most recent KFF COVID-19 Vaccine Monitor finds that nearly four in ten parents say they or another adult in their household left a job or changed work schedules to care for their children in the past year. As one might expect, parents of younger children are more likely than those of children ages 12 and older to say their household had an employment disruption due to childcare needs in the past year. In addition, Black parents (53%) and Hispanic parents (44%), those with a household incomes under $40,000 (51%), and parents under age 40 (44%) are more likely than their counterparts to say they or another adult in their family left a job or changed schedules in order to care for their children.
Notably, one in five parents of kids ages 5 and over say at least one of their children had to take on new duties helping to care for siblings or other family members as a result of the pandemic, including 28% of Black parents and 26% of Hispanic parents compared to 15% of White parents.
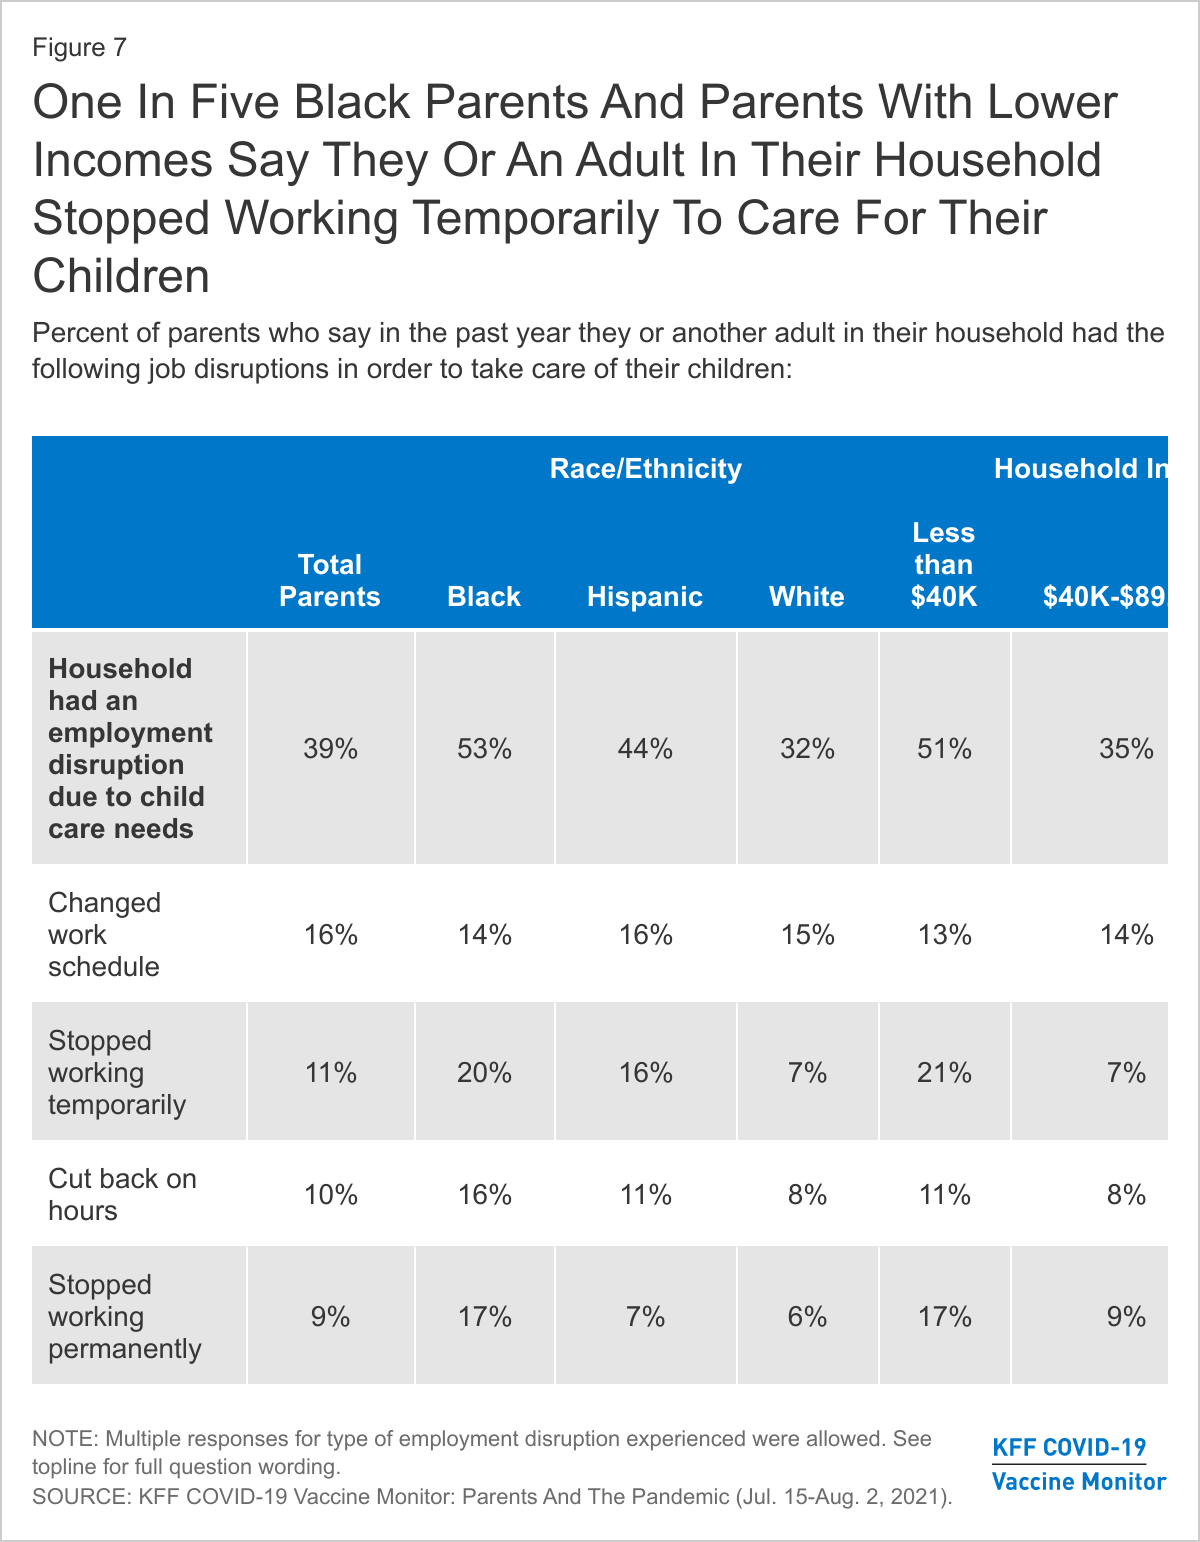
When asked more specifically how their work arrangements changed to accommodate for increased childcare needs during the pandemic, 16% of parents say they or another adult in their household changed their work schedule and a further 10% say they cut back on hours. About one in ten parents (11%) say they or another adult in their household stopped working temporarily in order to care for their children, rising to one in five among Black parents (20%) and parents with a household income under $40,000 (21%). A further 9% of parents say in the past year they or another adult in their household stopped working permanently in order to care for their children, rising to 17% among Black parents and those with lower household incomes.
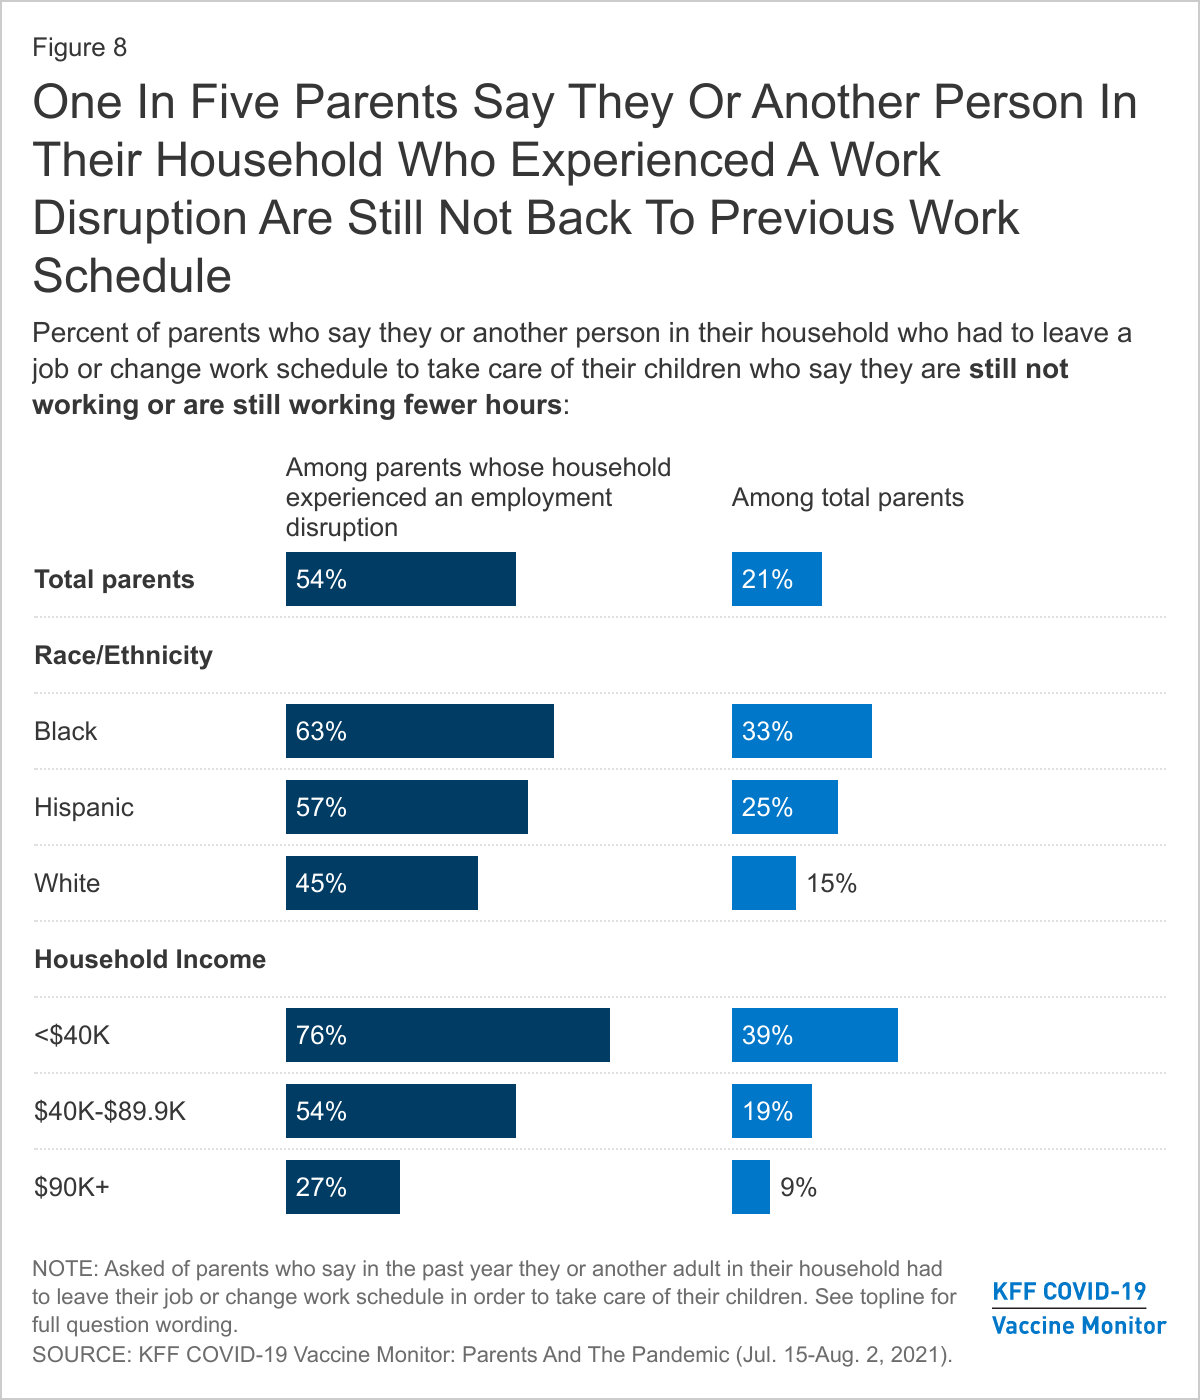
Many parents who stopped working or adjusted their work schedules to take care of children during the pandemic have still not returned to work or to their previous schedules. Overall, about half (54%) of parents who report a work disruption due to childcare needs (21% of parents overall) say the person in their household who left a job or changed their work schedule is still not working or continues to work reduced hours. Overall, one-third of Black parents and one in four Hispanic parents say their household has not resumed their previous employment hours after having a childcare-related employment change during the pandemic. Low-income parents are particularly hard-hit, with roughly four in ten parents (39%) with a household income under $40,000 saying their household has not resumed their previous employment hours.
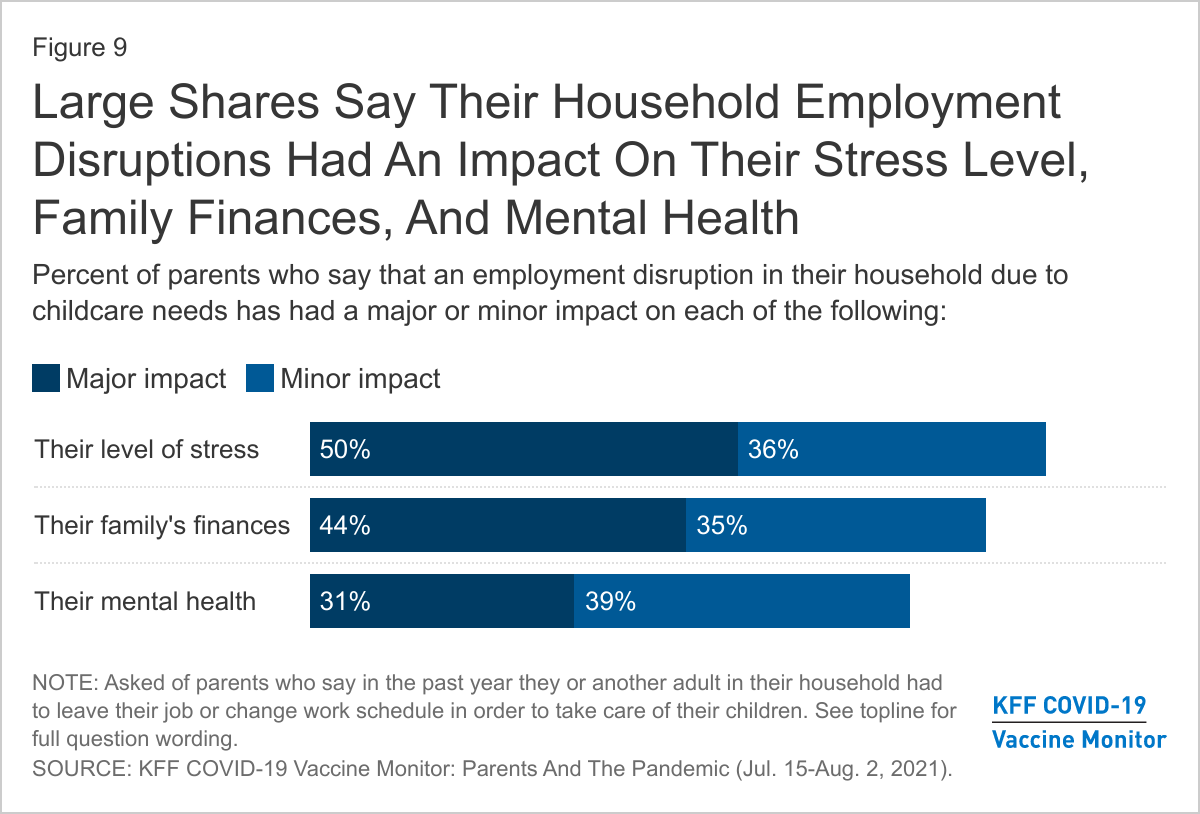
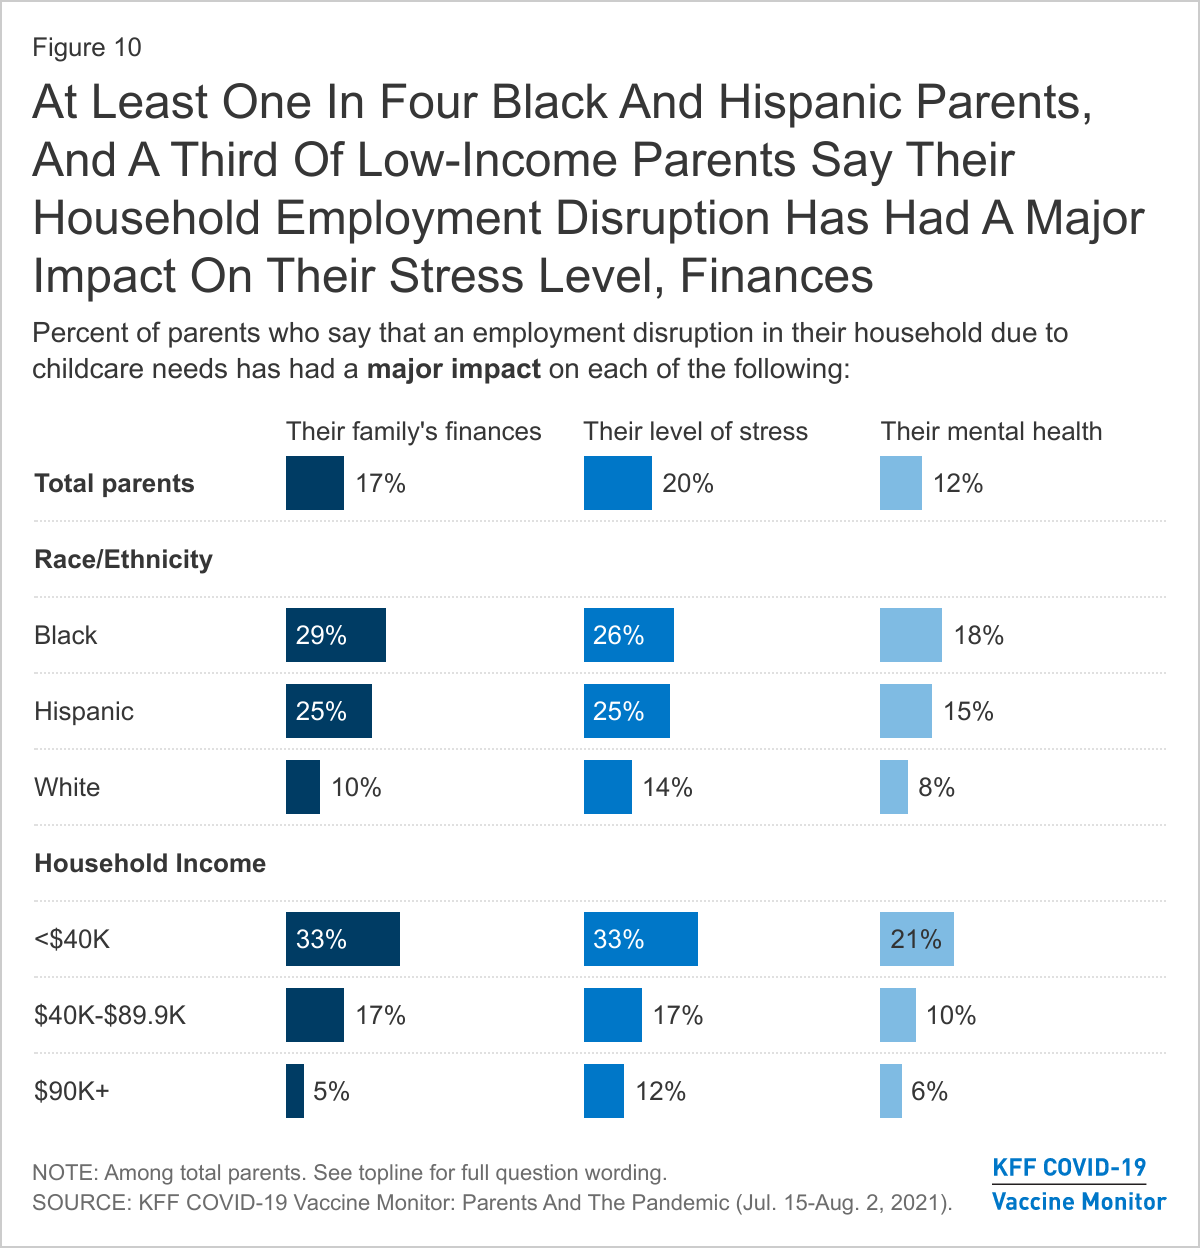
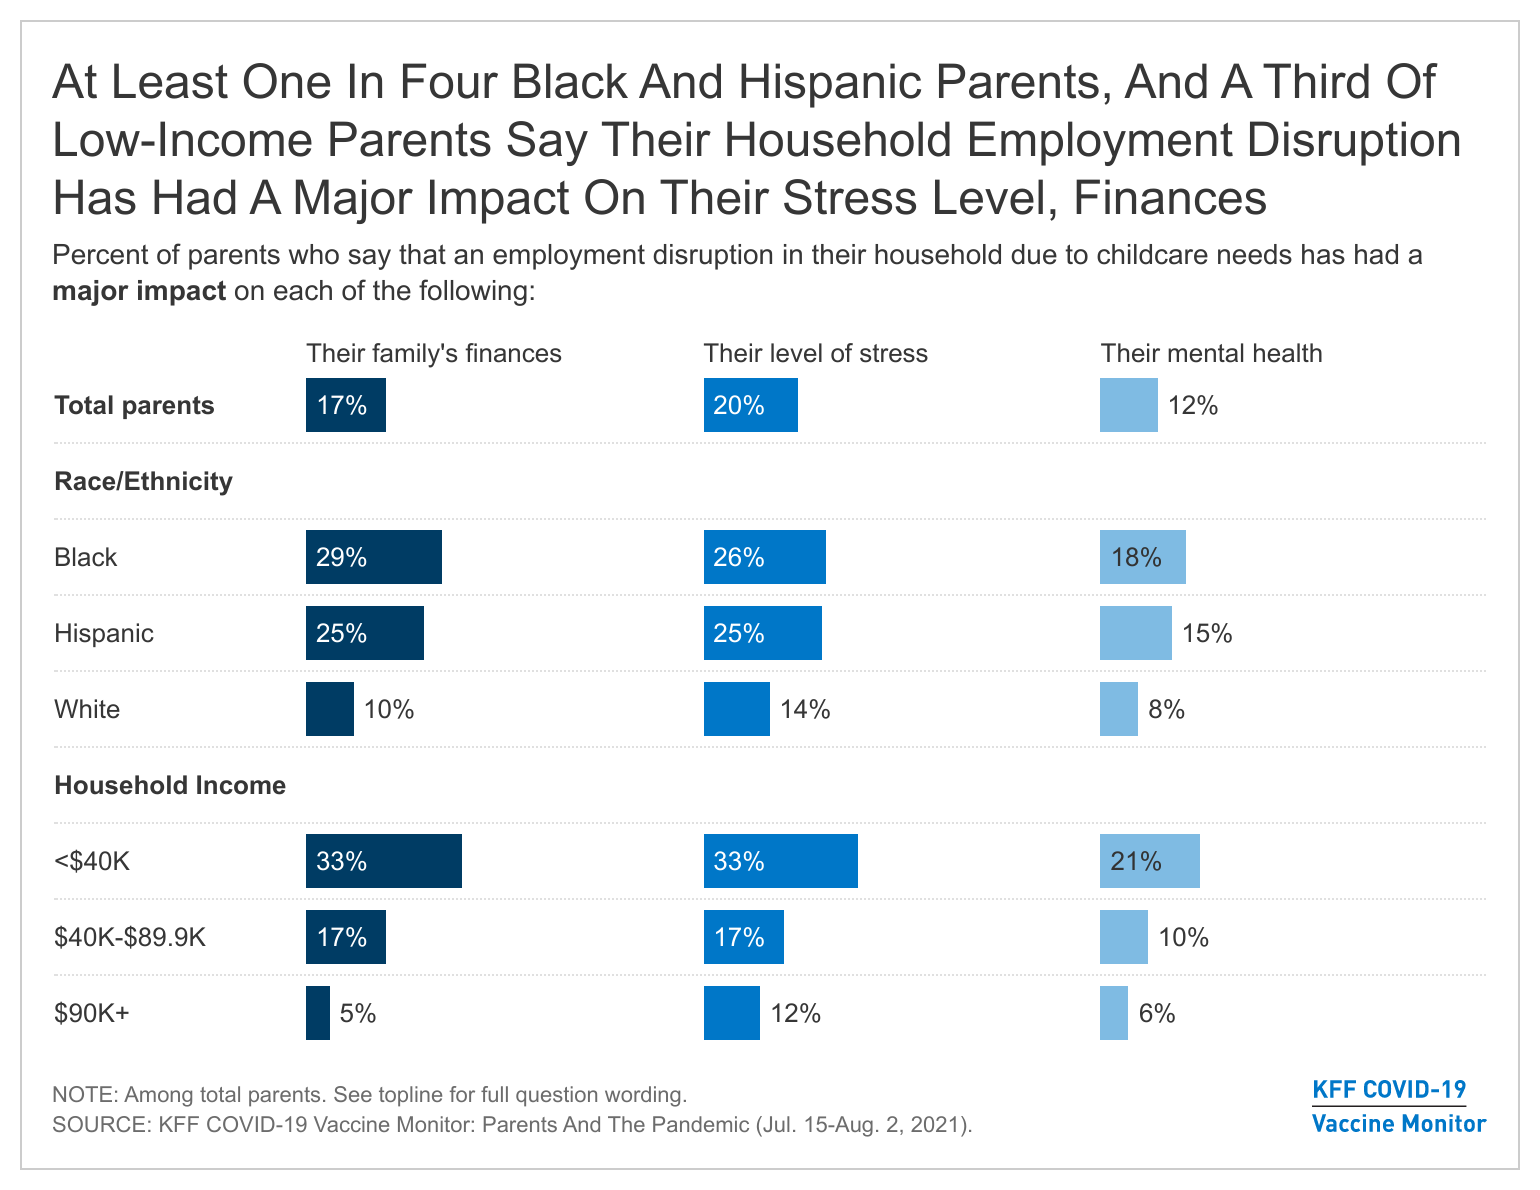
These employment disruptions have added an additional burden to what has already been a difficult year for many parents across the country. Large majorities say their household employment disruption due to childcare needs has had an impact on their stress level (50% say it has had a major impact, 36% a minor impact), their family finances (44% major, 35% minor), and their own mental health (31% major, 39% minor).
Again, Black and Hispanic parents are particularly impacted with about one in four saying their household experienced an employment disruption and that it has had a major impact on their family’s finances and on their stress level. Among lower-income parents, one-third say report experiencing a household employment disruption that has had a major impact on their stress level (33%), and on their family finances (33%) and one in five (21%) report such a disruption has had a major impact on their mental health.
The Impact Of Employment Disruption On Children
When parents experience disruptions in their employment due to increased childcare needs, this may also have an impact on the wellbeing of their children. When assessing the impact of the pandemic on their children, parents in a household that experienced an employment disruption are more likely than those whose household did not experience a disruption to say their child fell behind academically (51% vs. 32%), fell behind in their social or emotional development (49% vs. 28%), experienced mental health or behavioral problems (41% vs. 21%), or had to take on new care duties for siblings or other family members (33% vs. 11%). Overall, about seven in ten parents in households that experienced an employment disruption say one of their children has experienced at least one of these things compared to 44% of those who did not experience a disruption.
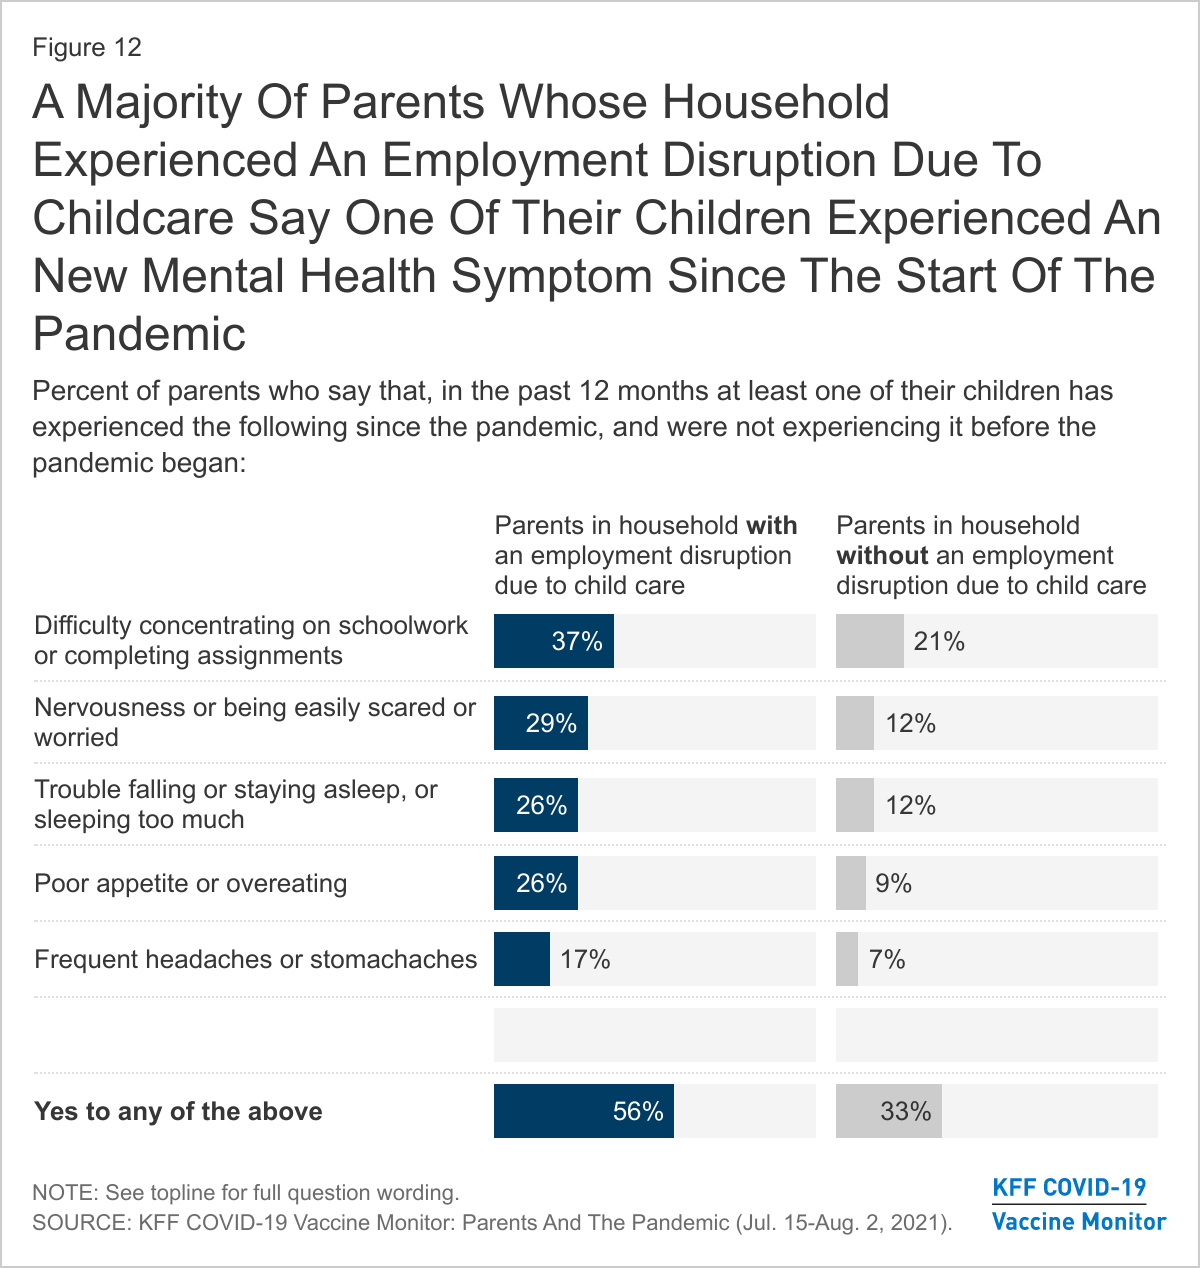
Similarly, parents who experienced a household employment disruption are also more likely than those who did not experience a disruption to say their child has developed a new mental health symptom since the pandemic began (56% vs. 33%). Nearly four in ten parents in households that experienced an employment disruption say their child has had difficulty concentrating on schoolwork (37%), about three in ten say their children have exhibited nervousness or being easily scared or worried (29%), and about one in four say they had sleeping disturbances (26%) or issues with eating (26%). One in six say their child experienced frequent headaches or stomachaches (17%).
Mental Health Of Children And Their Parents
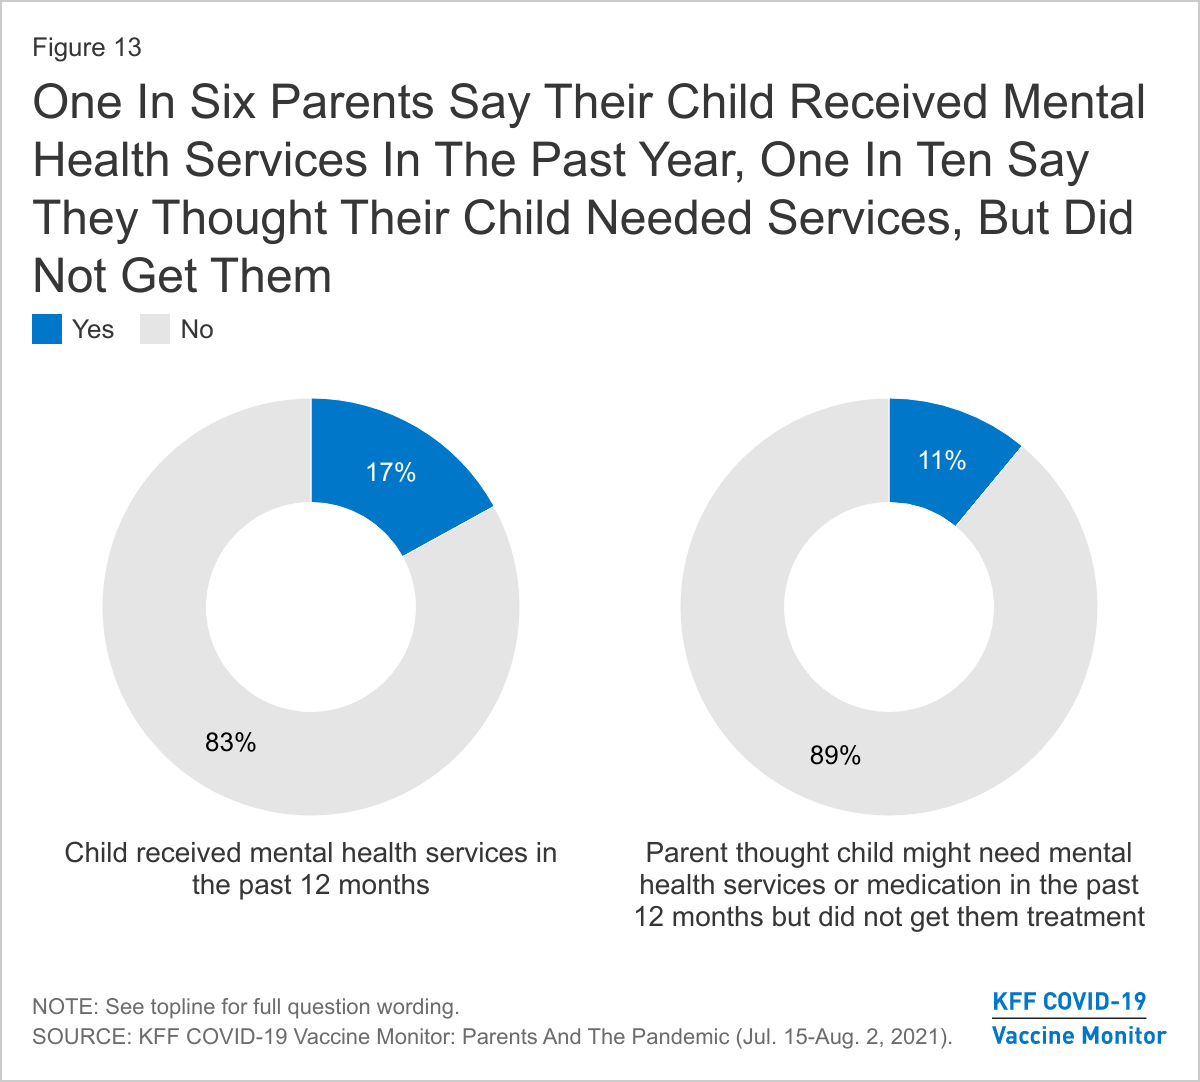
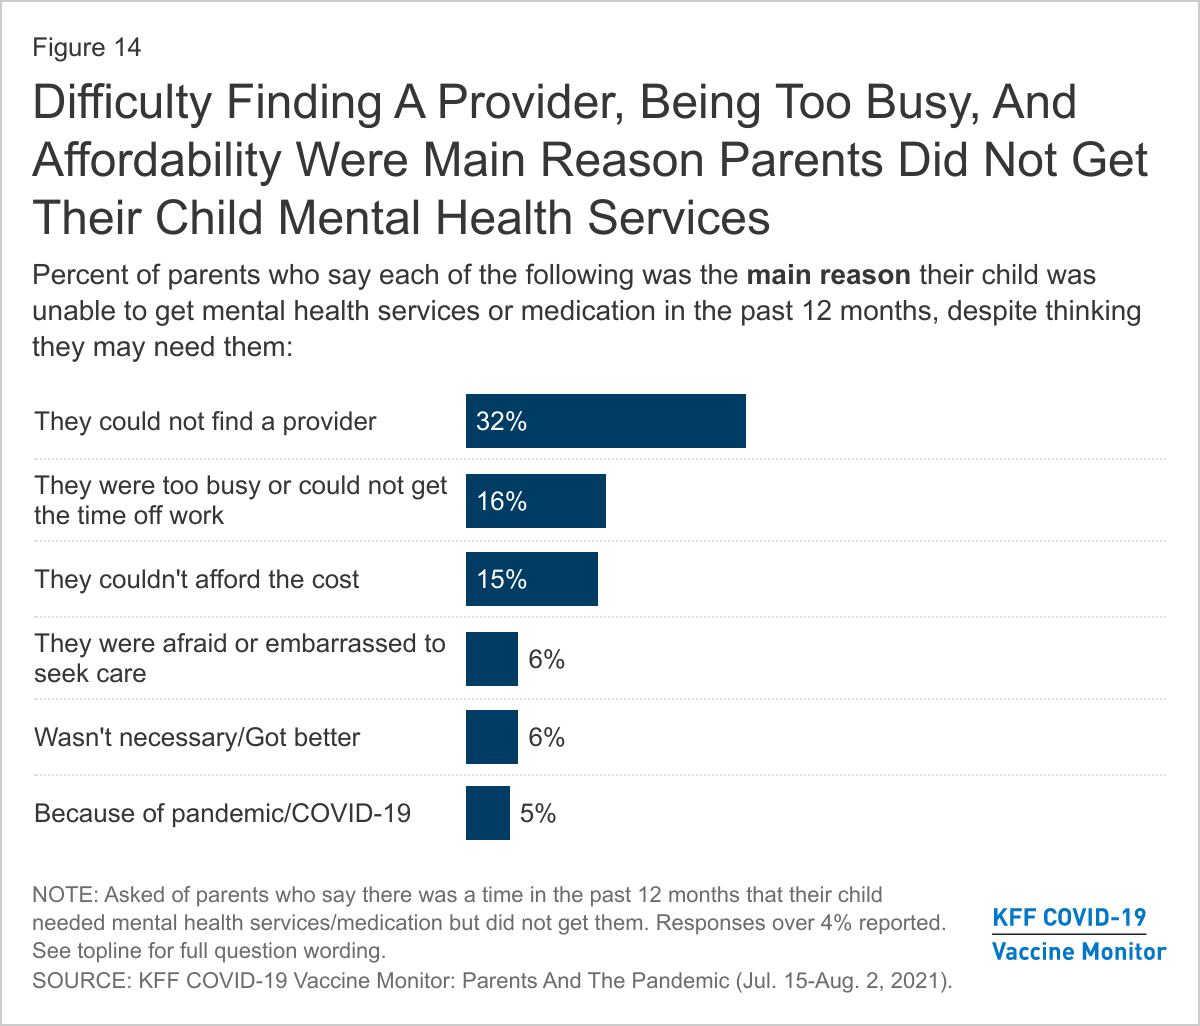
Previous KFF research has shown the even before the pandemic, many children in the U.S. were experiencing mental health problems and there was some evidence last year that the pandemic may have been exacerbating the issue. While three in ten parents report that their children experienced mental health or behavioral problems as a result of the pandemic and an even larger share say their children have experienced new symptoms in the past 12 months that may be associated with mental health concerns, a much smaller share (17%) report that their children received mental health services in the past 12 months. One in nine parents overall (11%) say there was a time in the past 12 months when they thought their child may have needed mental health services or medication but didn’t get them.
Access to mental health services appears to be an issue for those parents who say they thought their child might need mental health care but they were unable to get it. The main reasons parents cite for why their child was unable to get needed mental services include that they could not find a provider (32%), that they were too busy or could not get the time off work (16%), and that they could not afford the cost (15%).
In addition to the effects on children’s mental health, parents themselves are disproportionately likely to say the pandemic has had a negative impact on their own mental health. About four in ten adults overall (39%) report that stress and worry related to coronavirus has had a negative impact on their mental health, a share that rises to 54% among parents (compared to 37% of adults without children at home). The stress and worry over the pandemic has especially affected mothers, Black and Hispanic parents, those with household incomes under $40,000, and parents whose household experienced a work disruption due to increased childcare needs, with at least six in ten in each of these groups saying it has had a negative impact on their mental health.
Mental Health Impacts Over The Course Of The Pandemic
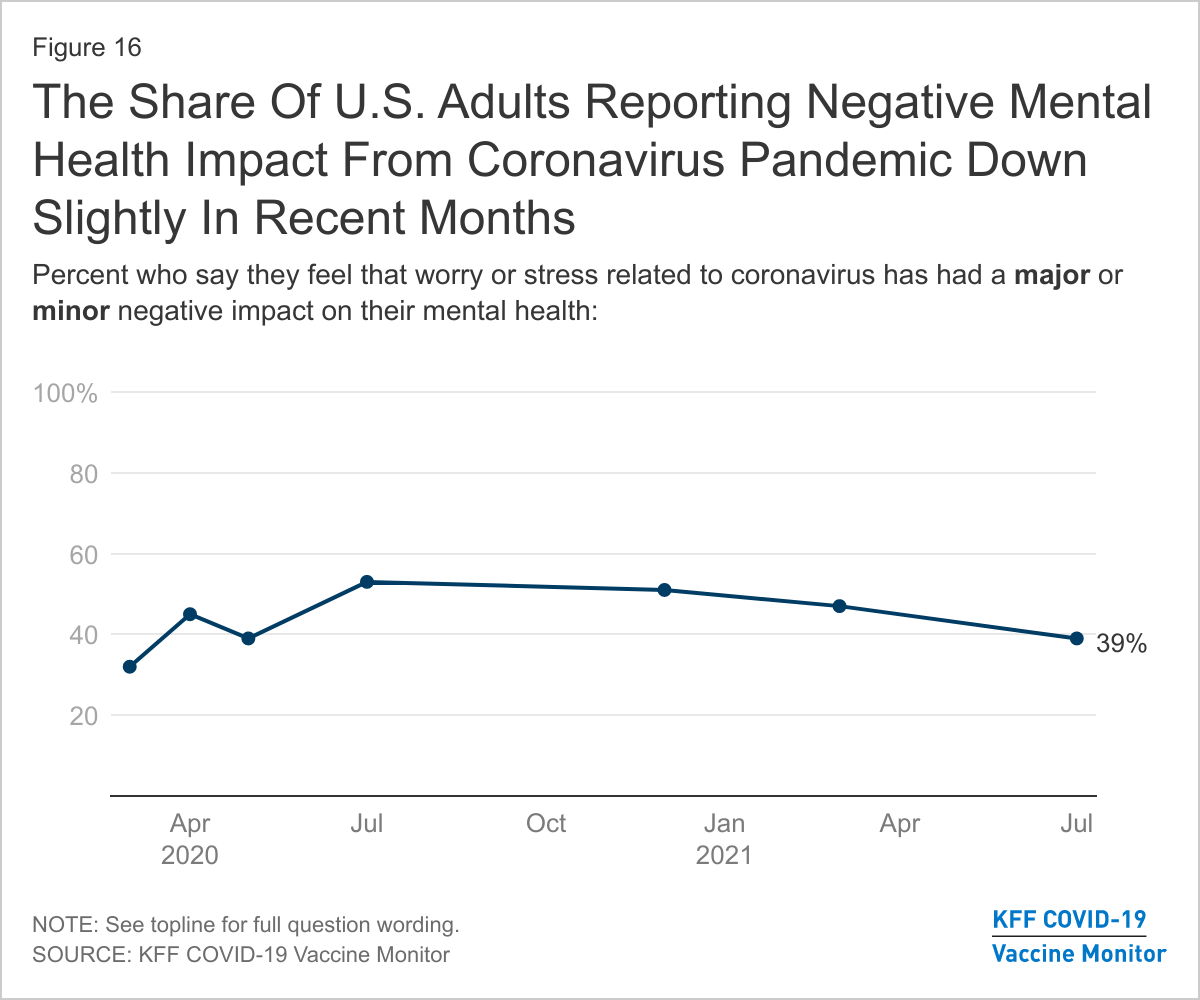
Previous KFF research has found that the share of adults reporting symptoms of anxiety or depressive disorder rose to about four in ten during the pandemic, up from about one in ten who reported these symptoms in 2019. While still large share of adults say the stress and worry due to the pandemic has had a negative impact on their mental health, it has decreased slightly from March 2021 (47%) to 39% in the July KFF COVID-19 Vaccine Monitor, and is down considerably from 53% a year ago. While the share of adults in the U.S. who are reporting negative mental health impacts from the coronavirus is down slightly, the survey was fielded largely before the news of the increased threat of the Delta variant.
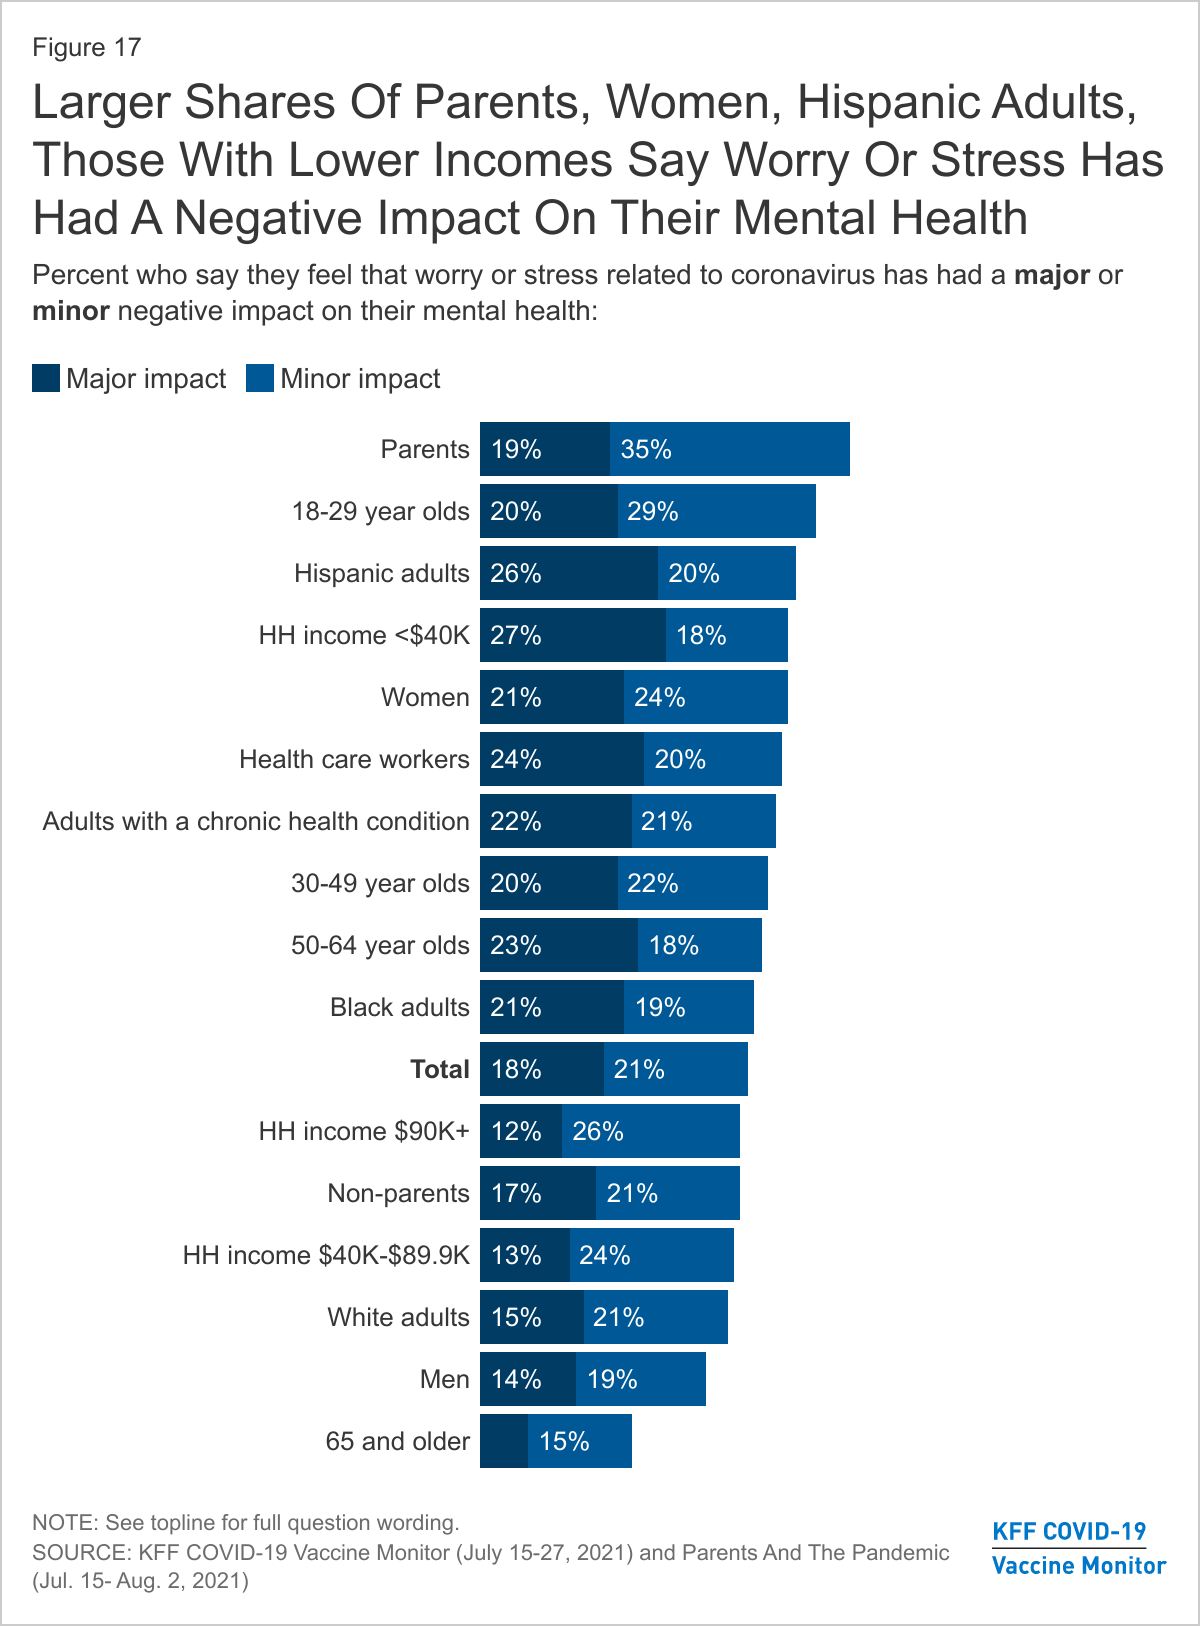
A majority of parents and more than four in ten Hispanic adults, women, those with a chronic health condition, and health care workers say stress and worry related to coronavirus has had a negative impact on their mental health. Smaller shares of non-parents, adults ages 65 and older, men, and those with higher incomes say they have experienced mental health impact from the coronavirus. Previous studies have shown that men, older adults, and Black adults may be less likely to report mental health difficulty and more likely to face challenges accessing mental health care.
Methodology
This KFF COVID-19 Vaccine Monitor – Parents and the Pandemic was designed and analyzed by public opinion researchers at the Kaiser Family Foundation (KFF). The survey was conducted July 15-August 2, 2021 via telephone and online among a nationally representative sample of 1,259 adults who are the parent or guardian of a child under the age of 18 living in their household. The sample includes 351 parents reached through the July 2021 KFF COVID-19 Vaccine Monitor and 908 who were reached online through a probability-based online panel (SSRS Opinion Panel). The Vaccine Monitor respondents were reached through a random digit dial telephone sample of adults ages 18 and older (including interviews from 101 Hispanic parents and 64 non-Hispanic Black parents), living in the United States. Phone numbers used for the telephone component were randomly generated from cell phone and landline sampling frames, with an overlapping frame design, and disproportionate stratification aimed at reaching Hispanic and non-Hispanic Black respondents as well as those living in areas with high rates of COVID-19 vaccine hesitancy. The sample also included 43 parents by calling back respondents that had previously competed an interview on a KFF poll (n=11) or SSRS omnibus poll (n=32). The comparison sample of non-parents was also drawn from the July 2021 KFF COVID-19 Vaccine Monitor. See the July 2021 KFF COVID-19 Vaccine Monitor for further details on the telephone component.
For the online component, invitations were sent to panel members who previously identified as the parent of a child ages 5 to 17. As with the telephone component, Hispanic and Black respondents were oversampled. The SSRS Opinion Panel is a nationally representative probability-based web panel. SSRS Probability Panel members are recruited randomly in one of two ways: (a) Through invitations mailed to respondents randomly sampled from an Address-Based Sample (ABS). ABS respondents are randomly sampled by MSG through the U.S. Postal Service’s Computerized Delivery Sequence (CDS). (b) from a dual-frame random digit dial (RDD) sample, through the SSRS Omnibus survey platform. Sample for the SSRS Omnibus is obtained through Marketing System Groups (MSG).
The combined telephone and online parent samples were weighted to match the sample’s demographics to the national parent population using data from the Census Bureau’s 2019 U.S. American Community Survey (ACS). Weighting parameters included sex, age, education, marital status, child age, and region, within racial/ethnic groups. The weights take into account differences in the probability of selection for each sample type (phone and web). This includes adjustment for the sample design and geographic stratification of the telephone sample, within household probability of selection, and the design of the panel-recruitment procedure.
The margin of sampling error including the design effect for the full sample of parents is plus or minus 4 percentage points. Numbers of respondents and margins of sampling error for key subgroups are shown in the table below. For results based on other subgroups, the margin of sampling error may be higher. Sample sizes and margins of sampling error for other subgroups are available by request. Sampling error is only one of many potential sources of error and there may be other unmeasured error in this or any other public opinion poll. Kaiser Family Foundation public opinion and survey research is a charter member of the Transparency Initiative of the American Association for Public Opinion Research.
This work was supported in part by grants from the Chan Zuckerberg Initiative DAF (an advised fund of Silicon Valley Community Foundation), the Ford Foundation, and the Molina Family Foundation. We value our funders. KFF maintains full editorial control over all of its policy analysis, polling, and journalism activities.
Group
N (unweighted)
M.O.S.E.
Total parents/guardians of children under 18 in household
1,259
± 4 percentage points
Parent Race/Ethnicity
White, non-Hispanic
399
± 6 percentage points
Black, non-Hispanic
372
± 7 percentage points
Hispanic
429
± 6 percentage points
Child Age Groups
Parents of children under age 5
523
± 7 percentage points
Parents of children ages 5-11
674
± 6 percentage points
Parents of children ages 12-17
728
± 5 percentage points
Comparison sample of non-parents (adults who are not parents or guardians of children under 18) from July 2021 KFF COVID-19 Vaccine Monitor
1,166
± 4 percentage points
Endnotes
Parents who said they had at least one child who attended school all or mostly online, or a mix of online and in-person were coded as All/Mostly/Mix Online. ↩︎
Four in Ten Parents Say Someone in Their Household Left a Job or Worked Fewer Hours to Care for Their Children, Including Higher Shares of Black, Hispanic, and Lower-income Parents
As a result of the pandemic, about four in ten (39%) parents of school-aged children (ages 5-17) say at least one of their children fell behind academically, rising to half among parents with household incomes below $40,000 (51%) and Hispanic parents (50%), a new KFF Vaccine Monitor report shows.
Among parents of children under age 18, more than a third (36%) say at least one of their children fell behind in social and emotional development because of the pandemic and about three in ten (29%) say a child experienced mental health or behavioral problems.
Parents whose children attended school at least partially online in the previous school year are more likely than parents whose child attended school all or mostly in-person to say they had a child who fell behind academically (47% vs. 26%) or in their social or emotional development (46% vs. 31%), or experienced mental health or behavioral problems (39% vs. 22%). These differences persist even after controlling for demographic differences including gender, race/ethnicity, income, parents’ education level, and whether children attended a public or private school.
Parents Report Pandemic-Related Emotional and Mental Health Problems for Both Their Children and Themselves
In the past 12 months, about four in ten parents (42%) say their children experienced a new mental health symptom that they did not experience prior to the pandemic, including difficulties concentrating on schoolwork (27%), nervousness or being easily scared (19%), sleeping problems (18%), poor appetite or overeating (15%), or frequent headaches or stomachaches (11%).
A smaller share (17%) of parents say their children received mental health services in the past 12 months and 11% say there was a time they thought their child needed mental health services or medication but did not get them. The main reason parents cite for why their children were unable to receive mental health services was that they could not find a provider (32%).
Many parents themselves report experiencing negative mental health impacts as a result of the pandemic. A majority of parents (54%) say that worry and stress related to the pandemic has had a negative impact on their mental health. Mothers, Black and Hispanic parents, lower income parents, and parents with recent employment changes are among the groups most likely to report experiencing mental health challenges.
More Than Half of Black Parents and Low-Income Parents Left a Job or Changed Schedules to Care for Their Children During the School Year
About four in ten parents say that they or someone else in their household left a job or changed work schedules in the past year in order to care for their children. Black (53%) and Hispanic (44%) parents are more likely than White parents (32%) to say their household suffered a job disruption due to childcare needs, as are parents with lower incomes (51% of parents with household incomes under $40,000) compared to those with higher incomes (35% of those with incomes of $40,000 or more).
Among parents who say they left a job or changed their work schedule to care for their children during the pandemic, over half (54%) say they still have not returned to a pre-pandemic work schedule, representing one in five (21%) of all parents. Roughly four in ten lower-income parents (39%), one-third of Black parents, and one-quarter of Hispanic parents say their household had a work disruption and has still not returned to their pre-pandemic job or hours.
Many parents report that these employment disruptions due to childcare needs have had a negative impact on their stress level, family finances, and mental health, including larger shares of Black and Hispanic parents and those with lower incomes. About one in four Black and Hispanic parents say their household experienced a childcare-related employment disruption that has had a major impact on their family’s finances and on their stress level. Among parents with household incomes under $40,000, one-third report a household employment disruption that has had a major impact on their stress level (33%) or their family finances (33%) and one in five (21%) report such a disruption has had a major impact on their mental health. The shares reporting these impacts are much lower among White parents and those with higher incomes.
The new report shows that parents who experience household employment disruptions due to childcare are more likely to report that their children fell behind academically (51% vs. 32%), fell behind in social and emotional development (49% vs. 28%), or experienced mental health problems (41% vs. 21%) compared to those that did not have an employment disruption during the pandemic.
Designed and analyzed by public opinion researchers at KFF, the KFF Vaccine Monitor: The Impact of The Coronavirus Pandemic On The Wellbeing Of Parents And Children was conducted from July 15-August 2 among a nationally representative probability-based sample of 1,259 parents with a child under age 18 in their household. Interviews were conducted in English and Spanish, online (908) and via telephone (351). The margin of sampling error is plus or minus 4 percentage points for the full sample. For results based on subgroups, the margin of sampling error may be higher.
The KFF COVID-19 Vaccine Monitor is an ongoing research project tracking the public’s attitudes and experiences with COVID-19 vaccinations. Using a combination of surveys and qualitative research, this project tracks the dynamic nature of public opinion as vaccine development and distribution unfold, including vaccine confidence and acceptance, information needs, trusted messengers and messages, as well as the public’s experiences with vaccination.
Early in the pandemic, many insurers waived cost-sharing requirements for people hospitalized with COVID-19, and the vast majority of people enrolled in fully-insured plans would have had their out-of-pocket costs waived in such circumstances.
With safe and effective vaccines now widely available, this new analysis finds that that 72% of the two largest insurers in each state and DC (102 health plans) are no longer waiving these costs, and another 10% of plans are phasing out waivers by the end of October.
The analysis is available on the Peterson-KFF Health System Tracker, an online information hub dedicated to monitoring and assessing the performance of the U.S. health system.
SAN FRANCISCO, Calif. — The Radio Television Digital News Association today awarded KFF’s Kaiser Health News a national Edward R. Murrow Award for Excellence in Diversity, Equity and Inclusion for a series of stories by Midwest Correspondent Cara Anthony on the hidden burdens of systematic racism.
Anthony’s stories examine the coping mechanisms many Black Americans use to survive society’s systemic racism with its day-to-day threats of violence.
The Radio Television Digital News Association has been honoring outstanding achievements in electronic journalism with the Edward R. Murrow Awards since 1971. A list of all of this year’s national winners is available here.
About KFF and KHN
KHN (Kaiser Health News) is a national newsroom that produces in-depth journalism about health issues. Together with Policy Analysis and Polling, KHN is one of the three major operating programs at KFF (Kaiser Family Foundation). KFF is an endowed nonprofit organization providing information on health issues to the nation.
The federal government spent $321 more per person for beneficiaries enrolled in Medicare Advantage plans than for those in traditional Medicare in 2019, a gap that amounted to $7 billion in additional spending on the increasingly popular private plans that year, finds a new KFF analysis.
The Medicare Advantage spending includes the cost of extra benefits, such as vision, dental and hearing coverage that are funded by rebates and not covered for beneficiaries in traditional Medicare. The extra benefits have likely contributed to years of steady increases in Medicare Advantage enrollment, which reached 22 million in 2019 (36% of all beneficiaries) and 26 million this year (42%).
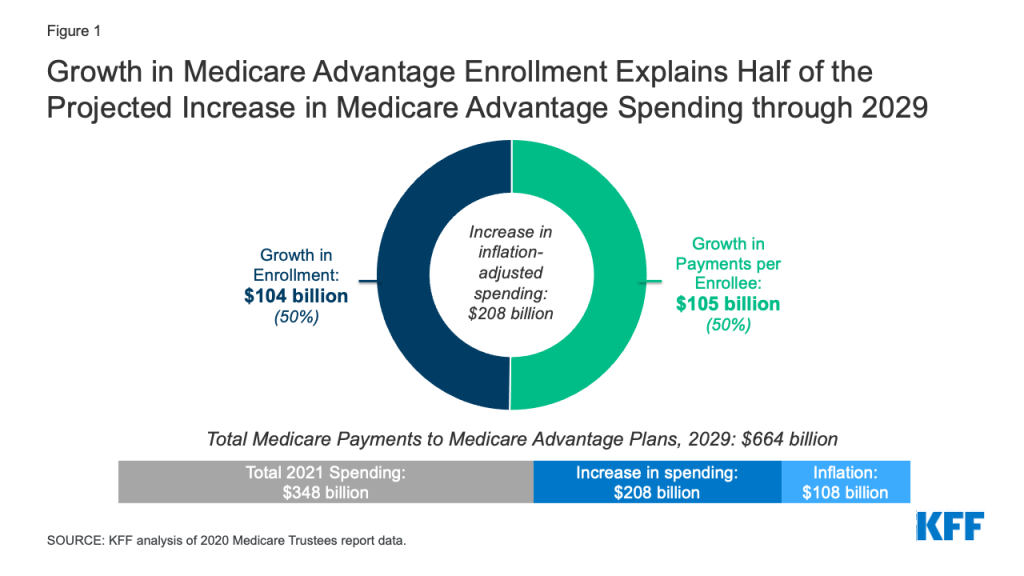
At the same time, Medicare Advantage spending has risen steadily, and is projected to rise to $664 billion by 2029, up from $348 billion this year. Half of the projected increase is due to growth in enrollment, while the remaining half is attributable to growth in federal payments per enrollee, after accounting for inflation. The projected growth in spending per Medicare Advantage enrollee is driven in part by the expectation that federal bonus payments that plans receive based on their quality ratings will continue to rise.
The higher payments for Medicare Advantage — $11,844 per person in Medicare Advantage vs. $11,523 in traditional Medicare in 2019 — have led to higher federal spending than would have occurred under traditional Medicare and higher Medicare Part B premiums paid by all beneficiaries, including those in traditional Medicare.
The higher spending is attributed to features of the Medicare Advantage payment system, including how benchmarks for plan payments are set, as well as the risk adjustment process, that is intended to compensate plans more for higher cost enrollees. That has attracted the attention of the Biden Administration, which in its 2022 budget expressed support for reforming payments to private plans as part of efforts to extend the solvency of the Medicare Hospital Insurance Trust Fund and improve affordability for beneficiaries. Additionally, Medicare Advantage plans have come under scrutiny over inaccurate coding practices that contribute to higher risk scores for their enrollees, and higher payments from Medicare.
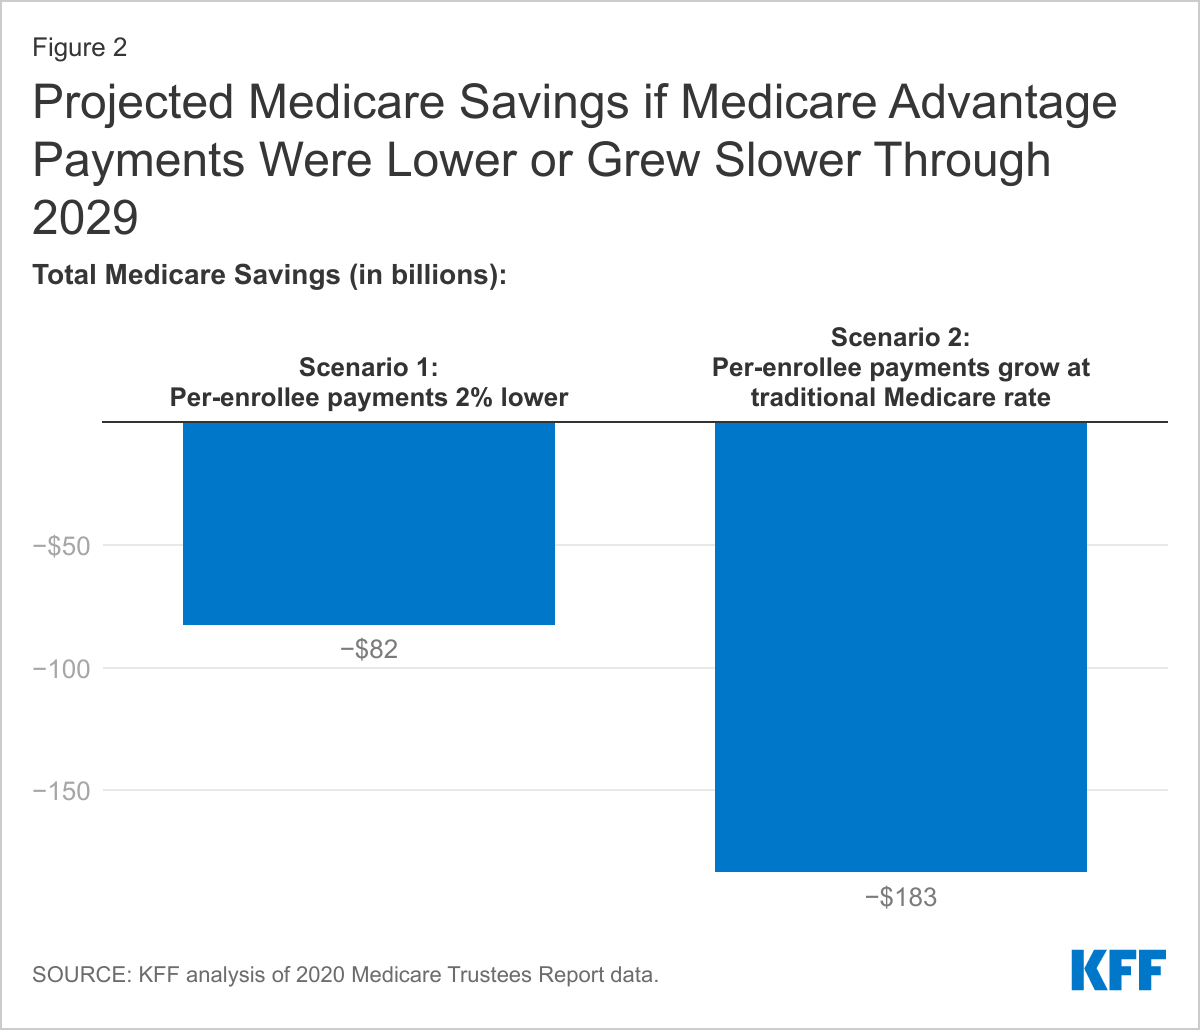
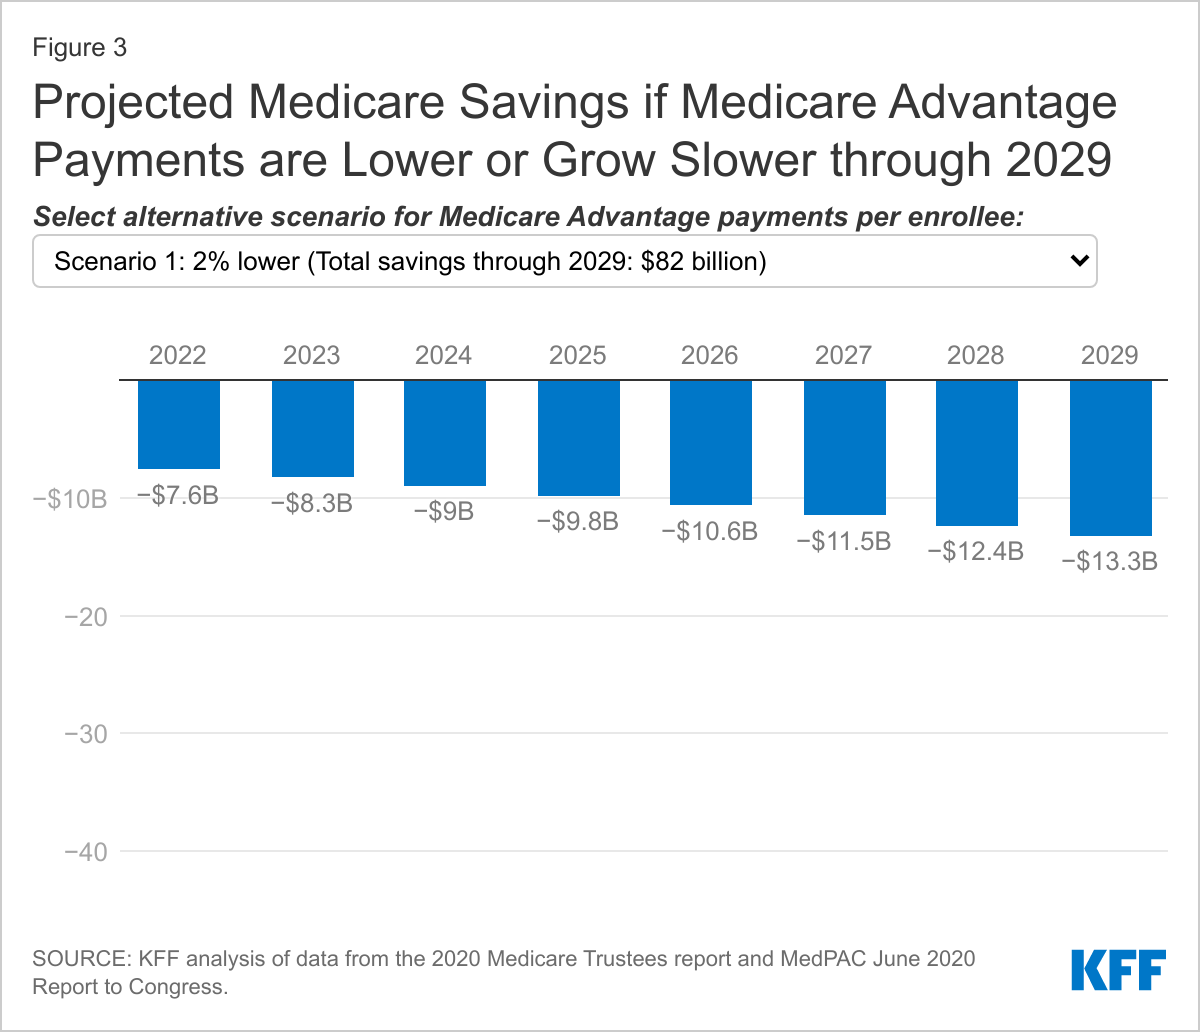
The new KFF analysis finds that if spending per Medicare Advantage enrollee were 2 percent less each year than the amount projected by the Medicare actuaries – a scenario similar to a recommendation made by the federal Medicare Payment Advisory Commission (MedPAC) — then total Medicare spending would be $82 billion lower than projected between 2021 and 2029.
Under a different scenario, if the growth in per person spending on beneficiaries in Medicare Advantage were held to the same rate of growth in spending on beneficiaries in traditional Medicare, then total Medicare program spending would be $183 billion lower than projected between 2021 and 2029, the analysis finds.
Reducing Medicare Advantage payments from their projected amounts could have uncertain effects on the availability of plans that offer extra benefits for Medicare Advantage enrollees, or plan profits, unless plans are able to lower administrative costs and operate more efficiently.The full analysis, Higher and Faster Growing Spending Per Medicare Advantage Enrollee Adds to Medicare’s Solvency and Affordability Challenges, as well as other data and analyses about Medicare Advantage, can be found at kff.org.
The number of people enrolled in Medicare has increased steadily in recent years, and along with it, Medicare spending. In particular, enrollment in Medicare Advantage, the private plan alternative to traditional Medicare, has more than doubled over the last decade. Notably, Medicare spending is higher and growing faster per person for beneficiaries in Medicare Advantage than in traditional Medicare. As enrollment in Medicare Advantage continues to grow, these trends have important implications for total Medicare spending, and costs incurred by beneficiaries. In its 2022 budget, the Biden Administration expressed support for reforming payments to private plans as part of efforts to extend the solvency of the Medicare Hospital Insurance (HI) Trust Fund and improve affordability for beneficiaries.
This analysis examines Medicare spending per person for beneficiaries in Medicare Advantage, relative to traditional Medicare. We build on prior work published by the Medicare Payment Advisory Commission (MedPAC) and the Centers for Medicare and Medicaid Services (CMS) Office of the Actuary (OACT) to provide estimates of the amount Medicare would have spent for Medicare Advantage enrollees had they been covered under traditional Medicare in 2019 (the most recent year for which data are available). We use publicly available data from CMS that includes spending for people who were enrolled in both Part A and Part B of traditional Medicare, by category of service, as well as information on average risk scores and enrollment by county. This allows us to calculate per-person spending for beneficiaries in traditional Medicare on a basis comparable to federal payments per enrollee in Medicare Advantage. We also examine the extent to which the projected growth in Medicare Advantage spending is attributable to the growth in enrollment and the increase in spending per person. We then illustrate potential savings to the Medicare program between 2021 and 2029 under two alternative scenarios where Medicare Advantage spending per person is lower or grows slower than under current projections. (See Methodology for more details on the data and analytic approach.)
Our analysis finds:
Medicare spending for Medicare Advantage enrollees was $321 higher per person in 2019 than if enrollees had instead been covered by traditional Medicare. The Medicare Advantage spending amount includes the cost of extra benefits, funded by rebates, not available to traditional Medicare beneficiaries.
The higher Medicare spending per Medicare Advantage enrollee, compared to spending for similar beneficiaries under traditional Medicare, contributed an estimated $7 billion in additional spending in 2019.
Growth in Medicare Advantage enrollment explains half of the projected increase in total Medicare Advantage spending between 2021 and 2029 and half is attributable to growth in Medicare payments per Medicare Advantage enrollee, after accounting for inflation.
If spending per Medicare Advantage enrollee was 2 percent less each year than projected by the Medicare actuaries, similar to the projected impact of a recommendation made by MedPAC, total Medicare spending would be $82 billion lower between 2021 and 2029. If instead Medicare payments per Medicare Advantage enrollee grew at the same rate as is projected for spending per person in traditional Medicare (4.4% vs 5.3%), total Medicare spending would be $183 billion lower between 2021 and 2029.
Background on Payments to Medicare Advantage Plans
Medicare beneficiaries have the option to receive their Medicare benefits through either the traditional Medicare program or by enrolling in a private health plan, such as an HMO or PPO, that contracts with Medicare, called Medicare Advantage. Medicare pays Medicare Advantage plans a set amount for each enrollee. The payment is determined through an annual process in which plans submit “bids” for how much they estimate it will cost to provide benefits covered under Medicare Parts A and B for an average beneficiary. The bids submitted by each plan are compared to a benchmark, which is an amount based on a set percentage of the projected average spending for beneficiaries in traditional Medicare in the same county. The benchmarks range from 95 percent in high spending counties to 115 percent in low spending counties. The benchmarks are subject to caps, meaning they cannot exceed the benchmarks that were in place before the Affordable Care Act. In addition, the benchmarks are increased by 5 percent for plans that receive at least 4 out of 5 stars under the quality bonus program, and 10 percent in certain “double bonus” counties.
Plans that bid below the benchmark receive a portion of the difference between the bid and the benchmark as a “rebate” (50 percent for plans with 3 or fewer stars, 65 percent for plans with 3.5 or 4 stars, and 70 percent for plans with 5 stars). Rebates must be used to reduce cost sharing, subsidize the standard Part B and/or Part D premium, or pay for supplemental benefits (such as vision, dental, and hearing). A portion of the rebate may also be used for administrative costs or retained as profit. Plans that bid above their benchmark receive the benchmark amount, and enrollees pay an additional premium equal to the difference between the bid and benchmark. The payments to plans are risk adjusted, based on the health status and other characteristics of enrollees, including age, sex, and Medicaid enrollment. Medicare payments are higher for plans with higher average risk scores because their enrollees are expected to incur higher costs.
While traditional Medicare spending is used to establish benchmarks, actual payments to Medicare Advantage plans can be higher or lower than spending for comparable beneficiaries in traditional Medicare. Changes in the Affordable Care Act initially reduced Medicare Advantage benchmarks. However, since 2017, benchmarks have risen on average, which increases the maximum possible payment a plan can receive. When benchmarks increase, plans that bid below the benchmark may be able to retain the same amount of rebate dollars, and thus offer the same level of extra benefits, while increasing their bid for Part A and B services. Alternatively, these plans could bid the same (or even slightly less) and receive higher rebate payments as the difference between the benchmark and bid widens because the benchmark is higher. Either response increases the payment Medicare Advantage plans receive as benchmarks increase. One reason for the recent increase in benchmarks is that more plans are in bonus status, and thus have 5 percent (or 10 percent in double bonus counties) added to their benchmark. In 2021, 81 percent of Medicare Advantage enrollees are in plans that receive a bonus payment. Similarly, rebates increase as star ratings increase, because plans with higher star ratings retain a larger percent of the difference between the benchmark and bid as a rebate.
In addition, risk adjustment can lead to higher payments for Medicare Advantage enrollees than would have been spent in traditional Medicare. This is because risk scores are largely based on diagnoses, and more diagnoses generally increase a beneficiary’s risk score, providing an incentive for diagnoses to be coded more comprehensively for Medicare Advantage enrollees than occurs for traditional Medicare beneficiaries. MedPAC estimates that this more comprehensive coding of diagnoses in Medicare Advantage increased risk scores 9.1 percent relative to traditional Medicare in 2019. There is also some concern that Medicare Advantage plans submit inaccurate diagnoses that increase risk scores and result in overpayments. The Health and Human Services Office of the Inspector General is currently conducting a targeted review of documentation submitted by Medicare Advantage organizations to determine whether diagnoses and associated risk scores comply with federal regulations. And in July, the Department of Justice announced that they were intervening in a False Claims Act lawsuit alleging that Kaiser Permanente had submitted inaccurate diagnoses codes for Medicare Advantage enrollees.
Findings
Spending per person
Medicare spent $321 more per person for Medicare Advantage enrollees than it would have spent for the same beneficiaries had they been covered under traditional Medicare in 2019. After adjusting for differences in health status and the geographic distribution of Medicare Advantage enrollees and traditional Medicare beneficiaries, spending per person for services covered under Parts A and B totaled $11,523 in 2019 for beneficiaries in traditional Medicare. This estimate for traditional Medicare reflects the categories of spending that are covered by Medicare payments to Medicare Advantage plans, and so excludes spending on hospice and payments for graduate medical education but includes administrative expenses. In addition, it adjusts for the impact of more intense coding of diagnoses in Medicare Advantage relative to traditional Medicare, as estimated by MedPAC, which makes Medicare Advantage enrollees look like they are in worse health. (See Methodology for additional discussion.)
In the same year, federal payments to Medicare Advantage plans were $11,844 per enrollee, or $321 more per person than Medicare would have spent if these beneficiaries had instead been covered by traditional Medicare. In other words, Medicare Advantage payments were about 103 percent of spending for comparable traditional Medicare beneficiaries. The higher spending occurred despite changes in law made by the Affordable Care Act that reduced payments to plans over time (which MedPAC estimated at 114 percent of traditional Medicare beneficiary spending in 2009).
As described above, Medicare payments per Medicare Advantage enrollee include two components: bid-based expenditures, which reflect the plan’s expected costs for providing services covered under Medicare Parts A and B (adjusted for health risk), and rebates, which pay for the cost of benefits not available to traditional Medicare beneficiaries, including reduced cost sharing, subsidized Part B and Part D premiums, and coverage of additional benefits, such as vision, dental and hearing. In 2019, the bid-based portion of the Medicare Advantage payment was $10,848 and the rebate portion was $996.
Higher Medicare payments per Medicare Advantage enrollee increased total Medicare spending by an estimated $7 billion in 2019. Across the approximately 22 million people enrolled in Medicare Advantage in 2019, higher spending of $321 per person led to about $7 billion in additional spending in that year. That is equal to about 3 percent of all Medicare Advantage spending in 2019.
Projected growth in Medicare Advantage spending
Growth in Medicare Advantage enrollment explains half of the projected growth in Medicare Advantage spending between 2021 and 2029, after adjusting for inflation. Between 2021 and 2029, federal spending on payments to Medicare Advantage plans is projected to increase by $316 billion, from $348 billion to $664 billion. After accounting for inflation (which represents $108 billion of this increase), the remaining $208 billion is explained by growth in payments per person ($105 billion, or 50 percent) and growth in enrollment ($104 billion, or 50 percent) (Figure 1).
Figure 1: Growth in Medicare Advantage Enrollment Explains Half of the Projected Increase in Medicare Advantage Spending through 2029
Notably, the rebate portion of Medicare Advantage payments, which must be used to cover the cost of additional benefits not available to traditional Medicare beneficiaries, is projected to grow between 2021 and 2029. Rebates account for about 10 percent of Medicare Advantage payments in 2021 ($35 billion of $348 billion) and are projected to rise to 12 percent ($80 billion of $664 billion) in 2029.
Medicare spending is projected to grow faster for Medicare Advantage enrollees than traditional Medicare beneficiaries. Spending per person in Medicare Advantage is projected to grow 5.3 percent a year on average between 2021 and 2029, an amount which is similar across plan types (based on KFF analysis of data from the 2020 Medicare Trustees Report). The projected growth in Medicare Advantage spending per person is somewhat higher than the 4.4 percent average annual growth projected for beneficiaries in traditional Medicare (see Methodology for details on data and methods).
According to the Medicare actuaries, the higher projected growth in Medicare payments per Medicare Advantage enrollee are in part explained by faster projected growth in the rebate portion of the payment. Rebates are projected to grow nearly 8 percent a year on average, which the actuaries attribute to “assumed increases in quality bonus payments and increases in benchmarks.”
It is also possible that the faster expected increase in spending per person in Medicare Advantage compared to traditional Medicare through 2029 is due in part to an assumption that sicker and higher cost beneficiaries, such as those dually eligible for Medicare and Medicaid, will enroll in Medicare Advantage at a higher rate than in traditional Medicare. For example, the number of Medicare Advantage enrollees in special needs plans (SNPs), which included just over half of all dually eligible beneficiaries in Medicare Advantage in 2019, is expected to increase slightly by 2029. However, the change is relatively small, and even if it represents only half of the total increase in Medicare Advantage enrollment by dually eligible beneficiaries, it suggests the projected increase in spending per Medicare Advantage enrollee is being driven by other factors, such as Medicare Advantage payment methodology. Additionally, starting in 2021, all Medicare beneficiaries with end-stage renal disease (ESRD) are eligible to enroll in a Medicare Advantage plan. Though beneficiaries with ESRD have substantially higher costs than the average Medicare beneficiary, they represent less than 1 percent of all Medicare beneficiaries, and so increased enrollment by beneficiaries with ESRD is likely to explain a relatively small portion of the growth in per-person spending in Medicare Advantage.
Alternative projections for Medicare Advantage spending
If Medicare Advantage spending per person was 2 percent less a year than projected, similar to the simulated effect of recommended payment changes from MedPAC, total Medicare spending would be $82 billion lower through 2029. MedPAC has proposed changes to how Medicare Advantage benchmarks are calculated and estimate these changes would result in a 2 percent reduction in Medicare Advantage payments in a single year. Applying this payment reduction to the projected Medicare Advantage payments per enrollee in each year between 2022 and 2029, total Medicare Advantage spending would be $82 billion lower through 2029 (Figure 2). The decrease is approximately 1 percent of total Medicare benefit spending over these years (and 2 percent of Medicare Advantage spending).
Even with the reduction in aggregate spending under this scenario where Medicare Advantage payments are reduced by 2 percent per year, projected Medicare spending per Medicare Advantage enrollee would still be higher and grow faster than projected spending per person in traditional Medicare. MedPAC expects implementing changes to the benchmark policy that result in a 2 percent reduction in payments in a given year would have only a modest effect on access to plans with lower cost sharing and reduced Part B and D premiums. For example, in their simulations, the vast majority (over 95 percent) of Medicare beneficiaries would continue to have access to Medicare Advantage plans that offer reduced cost sharing and Part B and/or D premium reductions. The number of plan sponsors and plan choices would vary across geographic areas, as they do under current policy, but would be somewhat reduced. In the quartile of counties with the lowest traditional Medicare spending per person, MedPAC estimates an average of 5 plan sponsors would offer 12 different plans (compared to 6 plans sponsors who offered 22 different plans in 2020). In the quartile of counties with the highest spending per person in traditional Medicare, an average of 8 plan sponsors would offer 22 different Medicare Advantage plans (compared to the same number of sponsors who offered 27 plans in 2020).
Under an alternative, illustrative scenario, where Medicare Advantage spending per person grew at the same rate as is projected for traditional Medicare, spending would be $183 billion lower between 2021 and 2029. For this scenario, we calculated the difference in projected Medicare spending if Medicare payments per person to Medicare Advantage plans grew at the same rate as spending per person in traditional Medicare (4.4 percent) between 2021 and 2029, rather than the higher 5.3 percent growth rate projection. While this approach is not directly pegged to a specific policy proposal, it illustrates the potential for savings, of, for example, a cap on the growth in total Medicare Advantage payments per enrollee. To adjust to such a cap, plans could find additional efficiencies in the coverage of Part A and B services, reduce supplemental benefits, restrict the future growth in supplemental benefits, lower administrative costs, reduce profits, or some combination of each. Limiting the growth in Medicare payment per Medicare Advantage enrollee directly or indirectly could also be achieved through other payment reforms.
Under the scenario where per-person spending growth in Medicare Advantage and traditional Medicare is equivalent, total Medicare Advantage spending over 2021 to 2029 would be $183 billion lower (Figure 2). For context, the savings under this scenario represents 4 percent of projected Medicare Advantage spending over this time period (and 2 percent of total Medicare benefit spending). That compares to an expected reduction in Medicare Advantage spending of 8.9 percent between 2010 and 2019 due to changes in the Affordable Care Act (based on CBO’s estimate of the health care law and its March 2009 baseline). While spending per person would grow at the same rate in both Medicare Advantage and traditional Medicare under this scenario, payments per Medicare Advantage enrollee would be higher than spending per beneficiary in traditional Medicare because of higher projected spending per person in Medicare Advantage in 2021.
Comparing the two alternative scenarios, the reduction in Medicare Advantage spending is similar in the initial years of the time period. However, the Medicare savings accrue more rapidly under the scenario where growth in payments per Medicare Advantage enrollee is equal to the rate of growth in spending per person in traditional Medicare. This is because savings from lower growth compound over time. (Toggle between the two scenarios to see the year-by-year savings under each scenario in Figure 3).
These estimates assume no changes to projected enrollment, which may occur if supplemental benefits, cost sharing, or other features of Medicare Advantage plans change in response to lower payments from the federal government. However, while it is not possible to know exactly how plans will respond to lower payments, previous analyses of past payment changes demonstrate that plans have found savings elsewhere in order to maintain rebate dollars to fund supplemental benefits that may appeal to enrollees. For example, MedPAC examined the response of Medicare Advantage plans that lost bonus status between 2018 and 2019 and found that these plans reduced their profits and administrative costs, and had lower growth in their projected Part A and B costs compared to other plans. This allowed the plans to continue to provide similar levels of supplemental benefits. Further, despite predictions by CBO, Medicare actuaries, and others that enrollment in Medicare Advantage would fall following the reductions in payment to Medicare Advantage plans enacted as part of the Affordable Care Act, enrollment never declined and has instead risen rapidly. Plans offer more generous supplemental benefits in 2021 than at any other point in the program’s history and Medicare Advantage markets are robust, with the average Medicare beneficiary having more than 30 Medicare Advantage plans to choose from in 2021.
Conclusion
Historically, one goal of the Medicare Advantage program was to leverage the efficiencies of managed care to reduce Medicare spending. However, the program has never generated savings relative to traditional Medicare. In fact, the opposite is true. As a result, Medicare Advantage plans have been able to offer an increasingly robust set of extra benefits not available to beneficiaries in traditional Medicare. The annual cost of the rebate dollars used to pay for the extra benefits – $1,680 per Medicare Advantage enrollee for non-employer, non-SNP plans in 2021 – more than offset any savings that Medicare Advantage plans generate by bidding below the benchmark set by CMS for covering Part A and B services. The extra benefits improve coverage for beneficiaries who choose Medicare Advantage plans and have likely contributed to the substantial increase in Medicare Advantage enrollment. But the higher payments have also led to higher Medicare spending than would have occurred under traditional Medicare and higher Medicare Part B premiums paid by all beneficiaries, including those in traditional Medicare.
Our analysis finds that Medicare Advantage payments per enrollee in 2019 were approximately 103 percent of spending per person for comparable beneficiaries covered by traditional Medicare, consistent with estimates based on data submitted by private plans as part of the bidding process and concurrent projections by CMS of future spending in traditional Medicare. MedPAC’s most recent analysis of the relationship between Medicare Advantage payments and spending in traditional Medicare suggests that the difference has widened, with 2021 payments per Medicare Advantage enrollee estimated to total 104 percent of spending in traditional Medicare. That trend is in part attributed to the rise in the rebate component of Medicare Advantage payments, which increased 14 percent between 2020 and 2021. While part of the increase in rebates stems from a decrease in how much private plans bid to provide coverage of Part A and B services, other features of the Medicare Advantage payment methodology, including the quality bonus program payments and benchmark policy contribute to both the recent and projected growth in rebates, and in turn, total Medicare Advantage spending. For example, under the quality bonus program, payments from the federal government to Medicare Advantage plans will total $11.6 billion in 2021, at least a portion of which was paid as the rebate.
MedPAC recently recommended changes to how plan payments are calculated, observing that because most plans currently bid well below the cost of providing Part A and B services in traditional Medicare, there is an opportunity for the Medicare program to share in these efficiencies. Their simulations indicate that a 2 percent reduction in payments would not significantly affect access to private plans or supplemental benefits. A reduction in Medicare Advantage payments consistent with the simulated effect of MedPAC’s recommendations, would result in Medicare program payments per enrollee that would remain higher and still grow faster than spending under traditional Medicare. Alternatively, bringing Medicare Advantage spending growth in line with projected growth in traditional Medicare would achieve more than twice as much savings. Under that scenario, the absolute level of payments per enrollee to private plans would still be higher than spending per person for beneficiaries in traditional Medicare. Reduced federal payments could mean Medicare Advantage enrollees see fewer extra benefits and higher cost sharing and premiums compared to today (but still lower costs than compared to traditional Medicare without supplemental coverage), but plans could also reduce profits or administrative costs to make up the difference. Further, savings of this magnitude would be less than half of those included in the Affordable Care Act, which were followed by a period of robust Medicare Advantage growth.
Over the next decade, Medicare Advantage enrollment is expected to continue to grow. As more Medicare beneficiaries enroll in private plans, differences in Medicare payments across Medicare Advantage and traditional Medicare will lead to even higher Medicare spending, and more generous benefits for beneficiaries in Medicare Advantage than traditional Medicare. That higher spending increases Part B premiums paid by all Medicare beneficiaries, including those who are not in a Medicare Advantage plan, and contribute to the financing challenges facing the Medicare HI Trust Fund. Further, these projections raise questions of equity between Medicare Advantage and traditional Medicare because the faster growth in spending per Medicare Advantage enrollee, compared to traditional Medicare beneficiaries, is in part due to rising rebates to private plans, which cover the cost of benefits not available to traditional Medicare beneficiaries. Although taking steps to address the fiscal challenges facing Medicare are not front and center in current Medicare policy discussions, policymakers may soon be on the lookout for options to achieve Medicare savings to fund other spending priorities or extend the solvency of the Medicare HI Trust Fund. This analysis suggests that reducing the difference in payments between Medicare Advantage and traditional Medicare would generate savings, with the potential for reductions in extra benefits for Medicare Advantage enrollees.
This work was supported in part by Arnold Ventures. We value our funders. KFF maintains full editorial control over all of its policy analysis, polling, and journalism activities.
Methodology
Per-person spending
The Medicare Trustees’ report includes data on spending per enrollee in private plans, including the bid component, rebate component, and total amount by plan type and overall, since 2010. We use the 2019 total per enrollee in this analysis.
To calculate what Medicare Advantage enrollees would have spent if they had remained in traditional Medicare we start with total spending for Medicare beneficiaries enrolled in both Part A and Part B reported in the CMS Geographic Variation PUF, excluding hospice. We subtract spending on direct and indirect graduate medical education (estimated using data from CMS FFS Data file). Next, we calculate county-level per-person spending in traditional Medicare for this group. We adjust those estimates to account for the health status of Medicare Advantage enrollees compared to traditional Medicare beneficiaries in the same county, using the Geographic Variation PUF data, CMS Plan Payment Data and MedPAC estimates of unadjusted coding intensity. Our estimate of the national average per person spending in traditional Medicare is then calculated as the Medicare Advantage enrollment-weighted county average per person spending and administrative expenses are added. Each step is described in more detail below.
Note, we are unable to compare projected Medicare payments per Medicare Advantage enrollee to future spending per person in traditional Medicare for comparable beneficiaries. This is because detailed information about key inputs into our calculation are not available, specifically: expected health status and risk score information for Medicare Advantage enrollees and traditional Medicare beneficiaries, the geographic distribution of Medicare Advantage enrollees, and county level spending projections
Total Part A and Part B Spending: Part A spending is the sum of spending in the following service categories: Inpatient, PAC: SNF, PAC: IRF, and PAC: LTCH. Part B spending is the sum of Outpatient, Ambulatory Surgical Center, E&M, Procedures, Tests, Imaging, DME, Outpatient Dialysis Facility, FQHC/RHC, Ambulance, Part B Drugs, Other Services, and PAC: HH spending. In addition, Total Population Based Payment Reduction Costs are added to total spending. This category includes payments made to ACOs and other population-based-payment program payments. Note, we do not exclude disproportionate share hospital (DSH) program spending because the funding formula for Medicare Advantage plans includes an amount to cover these payments and may influence the prices negotiated between private plans and hospitals.
GME and IME: To estimate the amount of GME and IME spending to subtract, the GME and IME Part A spending shares in the FFS data are applied to Part A spending in the Geographic Variation file.
County Per Person Spending: The per person spending for traditional Medicare beneficiaries is calculated by dividing the sum of total spending, as described above, by the number of beneficiaries enrolled in Part A and Part B in the county.
Health Status and Unadjusted Coding Intensity: CMS provides the average risk score by county and plan type through 2017. We use these data and the Medicare Advantage enrollment data to calculate an enrollment weighted county average risk score for 2017. We then calculate the ratio between the Medicare Advantage risk scores and the average HCC score for traditional Medicare beneficiaries in each county. Since plan payment data are not available for 2019, we take the 2017 risk ratio and increase by the growth in the ratio of Medicare Advantage to traditional Medicare risk scores reported by MedPAC (2.0 percentage points between 2019 and 2017). To account for unadjusted coding intensity in 2017, we reduce the risk ratios by the Medicare Advantage coding impact on payment reported by MedPAC (1.4 percentage points in 2017, 3.2 percentage points in 2019) (Figure 12-7). There is some disagreement about the level of upcoding in Medicare Advantage. By using MedPAC’s estimates, we incorporate the more conservative estimates of coding intensity. For comparison, a recent brief by the Center for a Responsible Federal Budget suggests that coding intensity increased risk scores by 15.4 percent in 2017, more than twice MedPAC’s estimate (which was 7.1 percent in 2017, including the statutory adjustment of 5.7 percent in that year, which is reflected in the Medicare Advantage payment data in the Trustees report). The adjusted risk score ratio and the county per person spending estimate are then multiplied to get the county per-person spending for traditional Medicare beneficiaries.
National Average Per Person Spending: The contribution of each county to the national average is equal to its share of total Medicare Advantage enrollment in the analysis sample. The county per person spending amounts are multiplied by their county’s respective weight and summed. Note, we do not have complete information for counties with fewer than 11 traditional Medicare beneficiaries or fewer than 11 Medicare Advantage enrollees, and so these counties are excluded in our calculations. We also exclude counties where any category of spending is not reported due to too few beneficiaries contributing to that category of spending in the county.
Administrative Expenses: Private plans use payments received by Medicare to cover their administrative expenses, as well as the cost of Part A and B services and supplemental benefits. The data used to calculate spending among traditional Medicare beneficiaries does not include administrative expenses. We account for this by assuming that administrative expenses for the subset of beneficiaries enrolled in both Part A and Part B of traditional Medicare was the same share of Part A and B spending as it was for the full population of beneficiaries enrolled in either Part A or Part B, or 2.8 percent in 2019.
Decomposing projected growth in Medicare Advantage spending
To determine the drivers of Medicare Advantage spending growth, we first converted the Medicare actuaries’ projections of Medicare Advantage spending to 2021 dollars using the gross domestic product implicit price deflator. We then decomposed the change in annual spending into two components: growth in enrollment and growth in spending per person. Those are defined as follows.
Total spending: TSt = St * EtWhere,
t is the year
S is average spending per person, and
E is total enrollment
The change in total spending in two consecutive years:
TSt – TSt-1 = St * Et – St-1 * Et-1= St-1*(Et – Et-1)+ (St-St-1)*Et-1+ (St – St-1)*(Et – Et-1)
-Where, the first term is the change due to the change in enrollment, the second term is the change due to the change in spending per person, and the third term is the combined effect of enrollment and spending per person. In each year, we allocated the combined effect to either enrollment or spending per person, based on the relative share of the first and second components. To calculate the cumulative impact of each component through 2029, we added the annual estimates together.
To calculate projected growth in spending per person for traditional Medicare we first calculate Part A spending per beneficiary in traditional Medicare by dividing Part A fee-for-service spending from table IV.A3 of the Medicare Trustees Report, less hospice, by the number of Part A enrollees, less part C enrollees, in table V.B3. We then calculated Part B spending per beneficiary in traditional Medicare by dividing Part B fee-for-service spending from table IV.B6 by the number of Part B enrollees, less part C enrollees, in table V.B3. Projected spending per traditional Medicare beneficiary is the sum of these two numbers. We then calculated the average growth rate between 2021 and 2029. Note, these per-person spending amounts are not directly comparable to the amounts we estimated for 2019 using the geographic variation public use file data, because they do not adjust for the distribution of Medicare Advantage enrollment or differences in health status between traditional Medicare beneficiaries and Medicare Advantage enrollees. We calculate growth in payments per Medicare Advantage enrollee using the data in table IV.C3. Data on private health plan enrollment by plan type comes from table IV.C1.
Compared to the Medicare actuaries’ most recent 2020 projections, the Congressional Budget Office (CBO) March 2020 Medicare baseline assumed that approximately 5 million more beneficiaries will be enrolled in Medicare Advantage in 2029. The CBO and OACT have similar estimates of Medicare payments per enrollee. As a result, Medicare Advantage spending is projected to grow more by 2029 under CBO’s baseline than the Medicare actuaries projected in 2020, due to higher enrollment growth. In its most recent July 2021 Medicare baseline, CBO increased its Medicare Advantage enrollment projections, and now expects 8 million more beneficiaries to be enrolled in Medicare Advantage by 2029 than was projected for that year in the 2020 Medicare Trustees Report. CBO did not, however, provide updated estimates of Medicare Advantage spending. Assuming no changes to spending per enrollee, higher enrollment growth would lead to even higher Medicare Advantage spending.