KFF designs, conducts and analyzes original public opinion and survey research on Americans’ attitudes, knowledge, and experiences with the health care system to help amplify the public’s voice in major national debates.
The Biden administration this fall announced a set of vaccination requirements for workers aimed at helping to bring the COVID-19 pandemic under control. While many states and private businesses have implemented similar and sometimes tougher mandates, Republican officials have broadly criticized the administration’s policies as an overreach of federal power.
Twenty-seven Republican-controlled states have joined lawsuits challenging at least two aspects of the Biden administration’s vaccination requirements, while the vast majority are part of three lawsuits, according to our updated State COVID-19 Data and Policy Actions tracker. Each of the 27 states are suing to block required vaccinations or weekly testing for workers at companies with at least 100 workers, 24 states are challenging mandated vaccinations for federal contractors without a testing option, and 23 states are challenging a similarly strict vaccination mandate for most health care facilities. Twenty-one states are challenging all three requirements.
A federal appeals court earlier this month halted the vaccine or test requirement for larger employers, but the legal battle over this policy and the others will continue in the coming weeks. The Biden administration has sought to make its vaccine requirements effective Jan. 4.
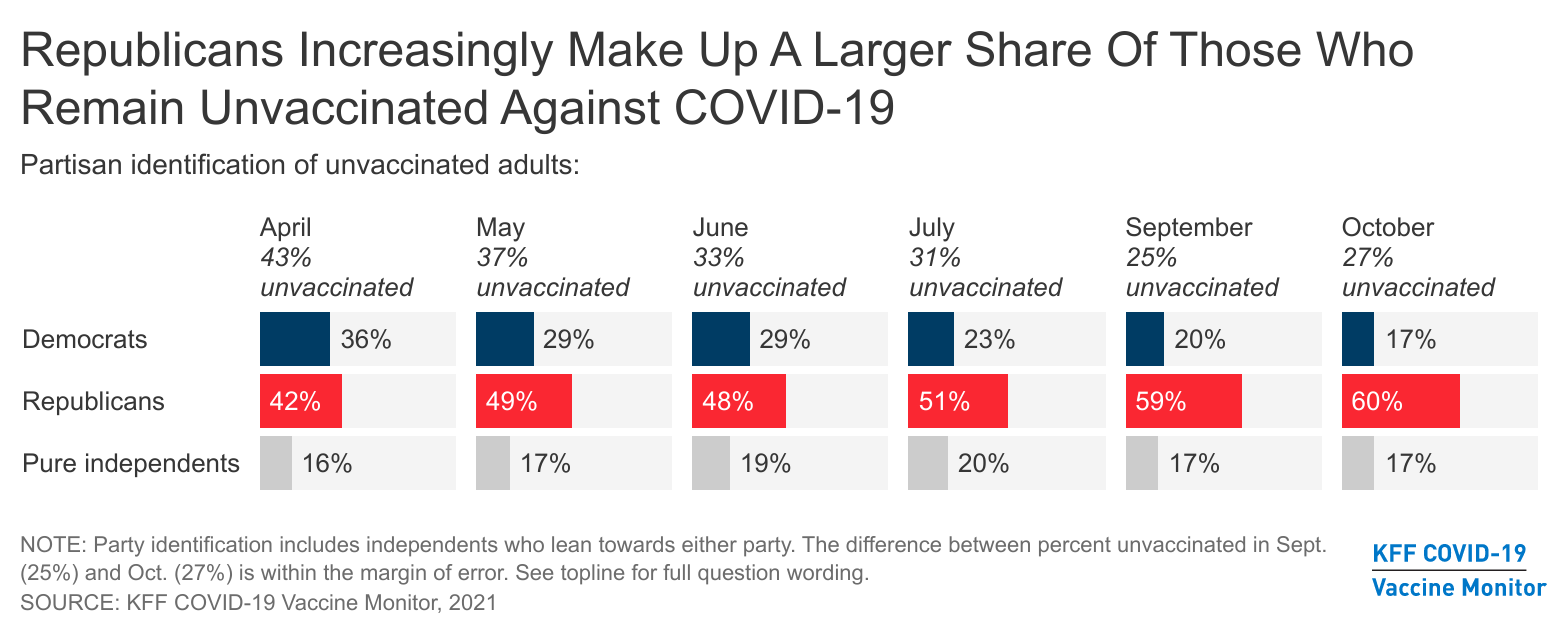
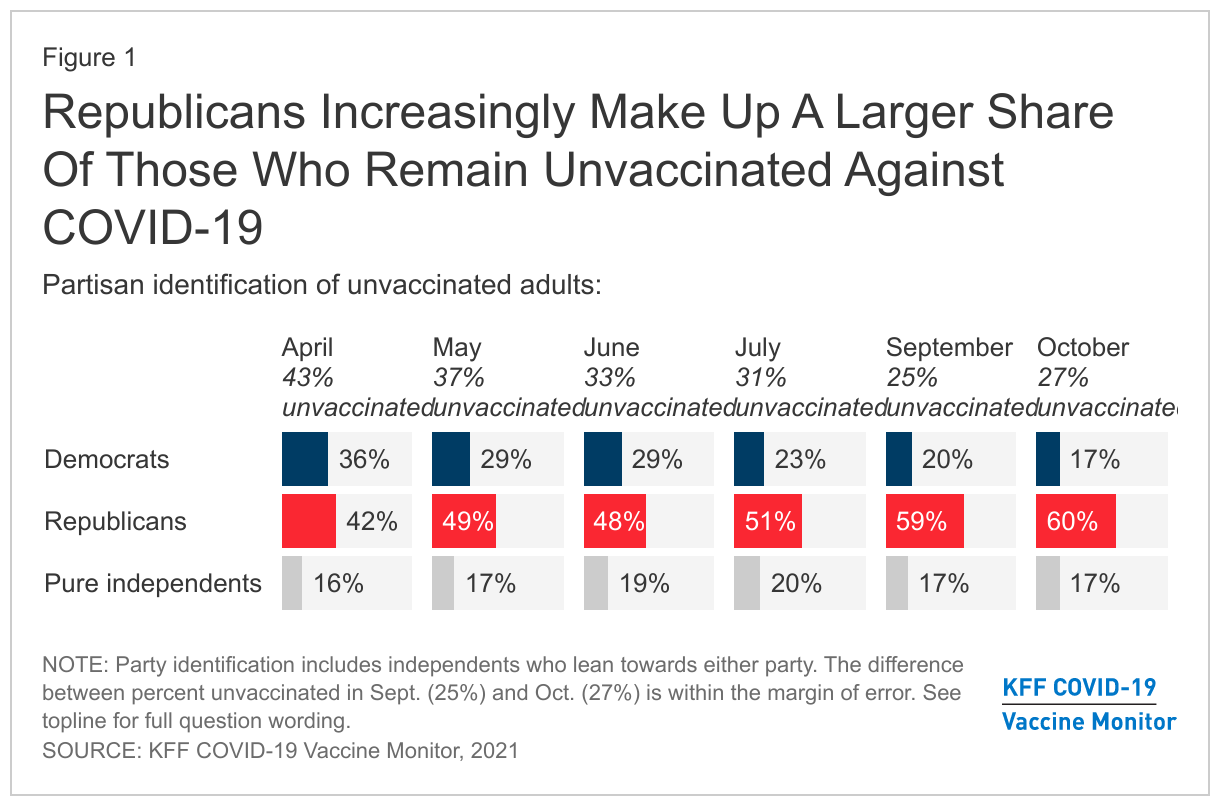
A new KFF COVID-19 Vaccine Monitor analysis finds that Republicans and Republican leaning independents, who represent 41% of adults, now make up 60% of the adult unvaccinated population across the country and that political partisanship is a stronger predictor of whether someone is vaccinated than any demographic factor measured.
While COVID-19 vaccination rates have risen significantly since the spring across all groups, uptake has been slower among those who are or lean Republican. As a result, the shrinking unvaccinated population has become increasingly Republican over time, with unvaccinated adults now more than three times as likely to lean Republican than Democratic.
The analysis examined differences across a range of demographic factors, including racial and ethnic identity, age, education, geographic density, and insurance status.
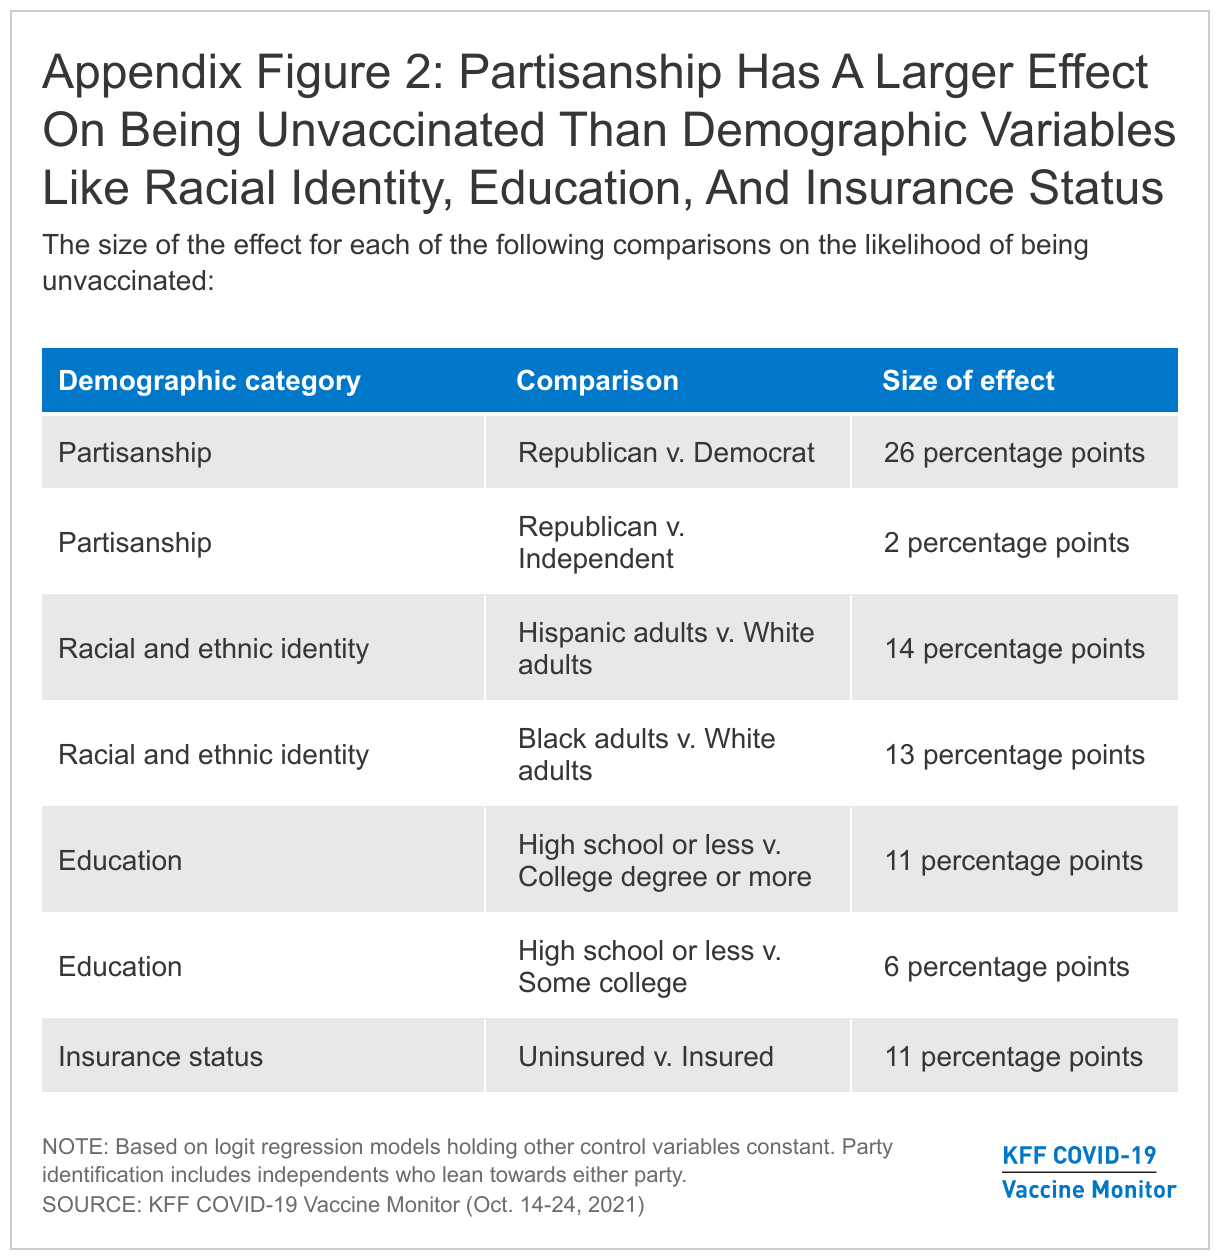
Controlling for other factors, a Republican is 26 percentage points more likely than a Democrat to remain unvaccinated. This gap is greater than the gaps between racial and ethnic groups, people with varying education levels, people who are insured and uninsured, different age groups, or people who live in rural versus urban areas.
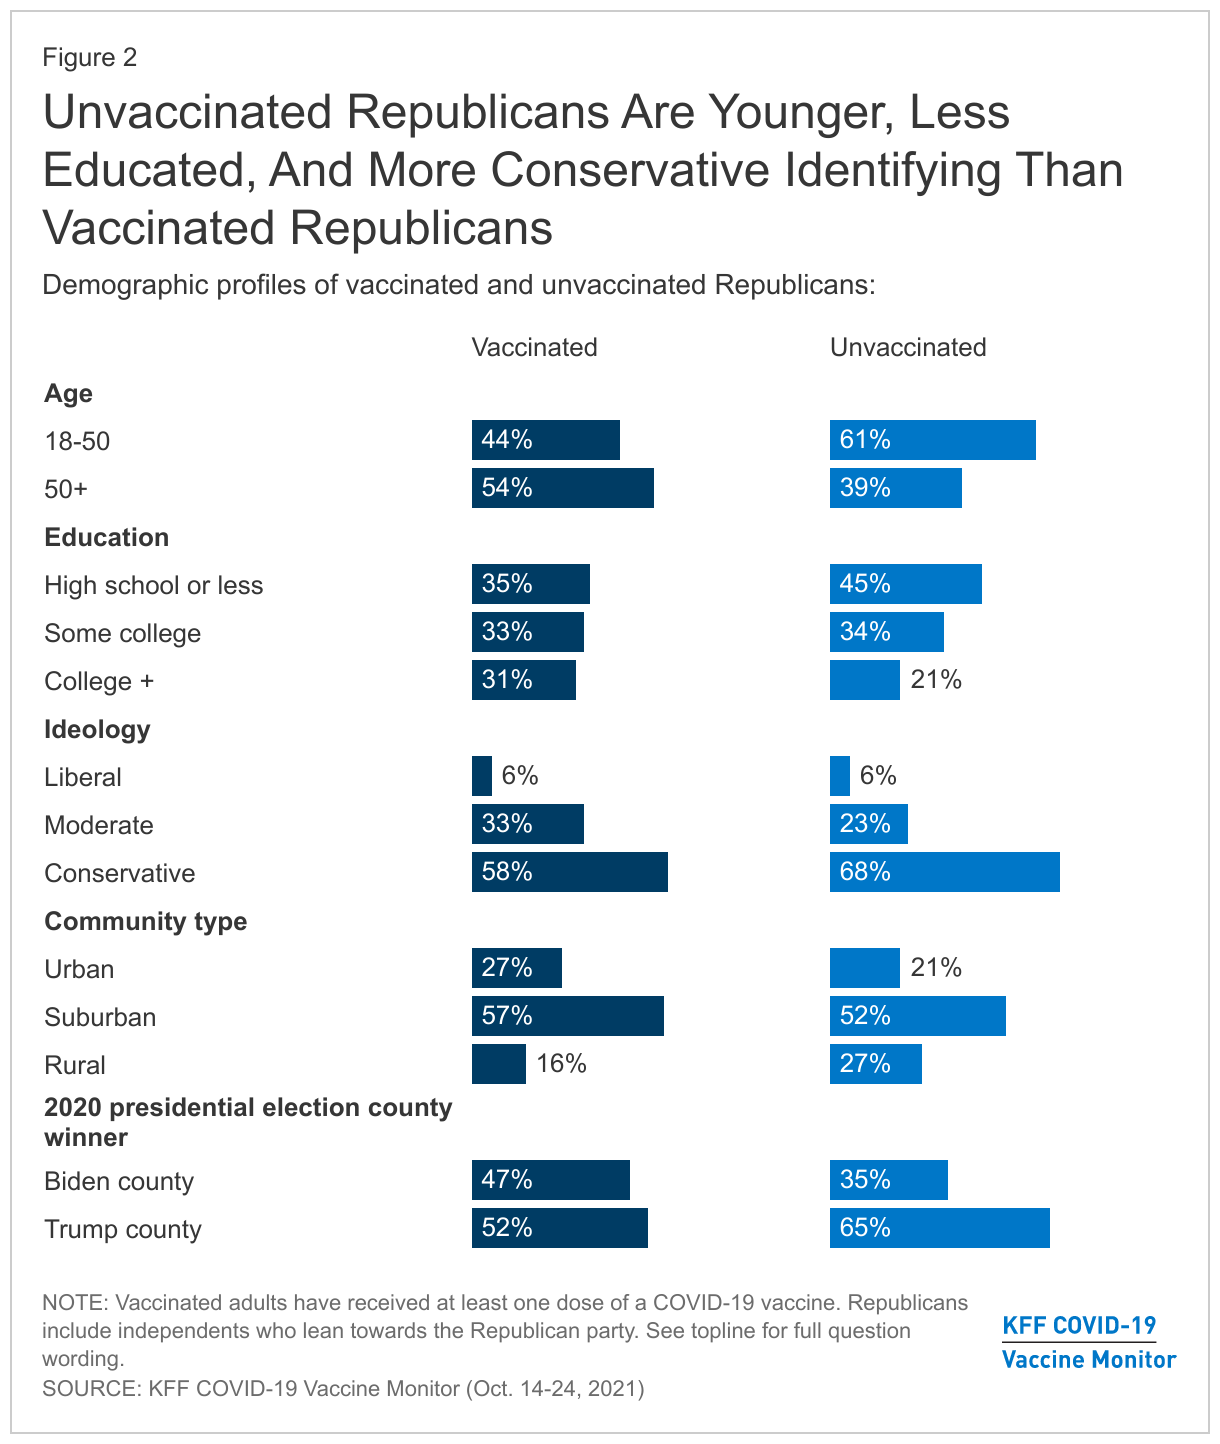
The analysis also examines differences between vaccinated and unvaccinated Republicans. Unvaccinated Republicans are more likely than vaccinated ones to believe that the news exaggerates the seriousness of the pandemic (88% v. 54%) and that getting vaccinated is a personal choice (96% v. 73%).
Such views pose substantial challenges for efforts to further increase vaccine uptake among U.S. adults, and potentially the acceptance of booster shots and vaccines for children as eligibility expands, the analysis suggests.
The KFF COVID-19 Vaccine Monitor is an ongoing research project tracking the public’s attitudes and experiences with COVID-19 vaccinations. Using a combination of surveys and qualitative research, this project tracks the dynamic nature of public opinion as vaccine development and distribution unfold, including vaccine confidence and acceptance, information needs, trusted messengers and messages, as well as the public’s experiences with vaccination.
The data for this analysis comes from the October 2021 KFF COVID-19 Vaccine Monitor. See the initial report for the survey’s full methodological details.The KFF COVID-19 Vaccine Monitor and other surveys have consistently shown a strong relationship between partisan identification and how individuals view and experience the COVID-19 pandemic, on questions ranging from worries about getting infected, to self-reported behaviors like mask-wearing and social distancing, to views on vaccinations. This new analysis shows that although COVID-19 vaccination rates have increased over time with majorities across partisan groups reporting being vaccinated, Republicans make up an increasingly disproportionate share of those who remain unvaccinated and political partisanship is a stronger predictor of whether someone is vaccinated than demographic factors such as age, race, level of education, or insurance status. These results suggest substantial challenges for any efforts to further increase vaccine uptake among U.S. adults, which may also affect acceptance of booster shots and COVID-19 vaccines for children as eligibility expands.
A Large And Growing Share Of Unvaccinated Adults Identify As Republicans Or Lean That Way
Partisanship has been a strong predictor of views on coronavirus from the early days of the pandemic. For example, KFF polling in May 2020 found that Republicans were less likely than Democrats to report wearing masks and practicing social distancing. Early views of the COVID-19 vaccine were similarly divided along party lines with a majority of Republicans saying they would not get vaccinated in September 2020 (compared to Democrats who were more equally divided in whether they would or would not get a COVID-19 vaccine once it became available).
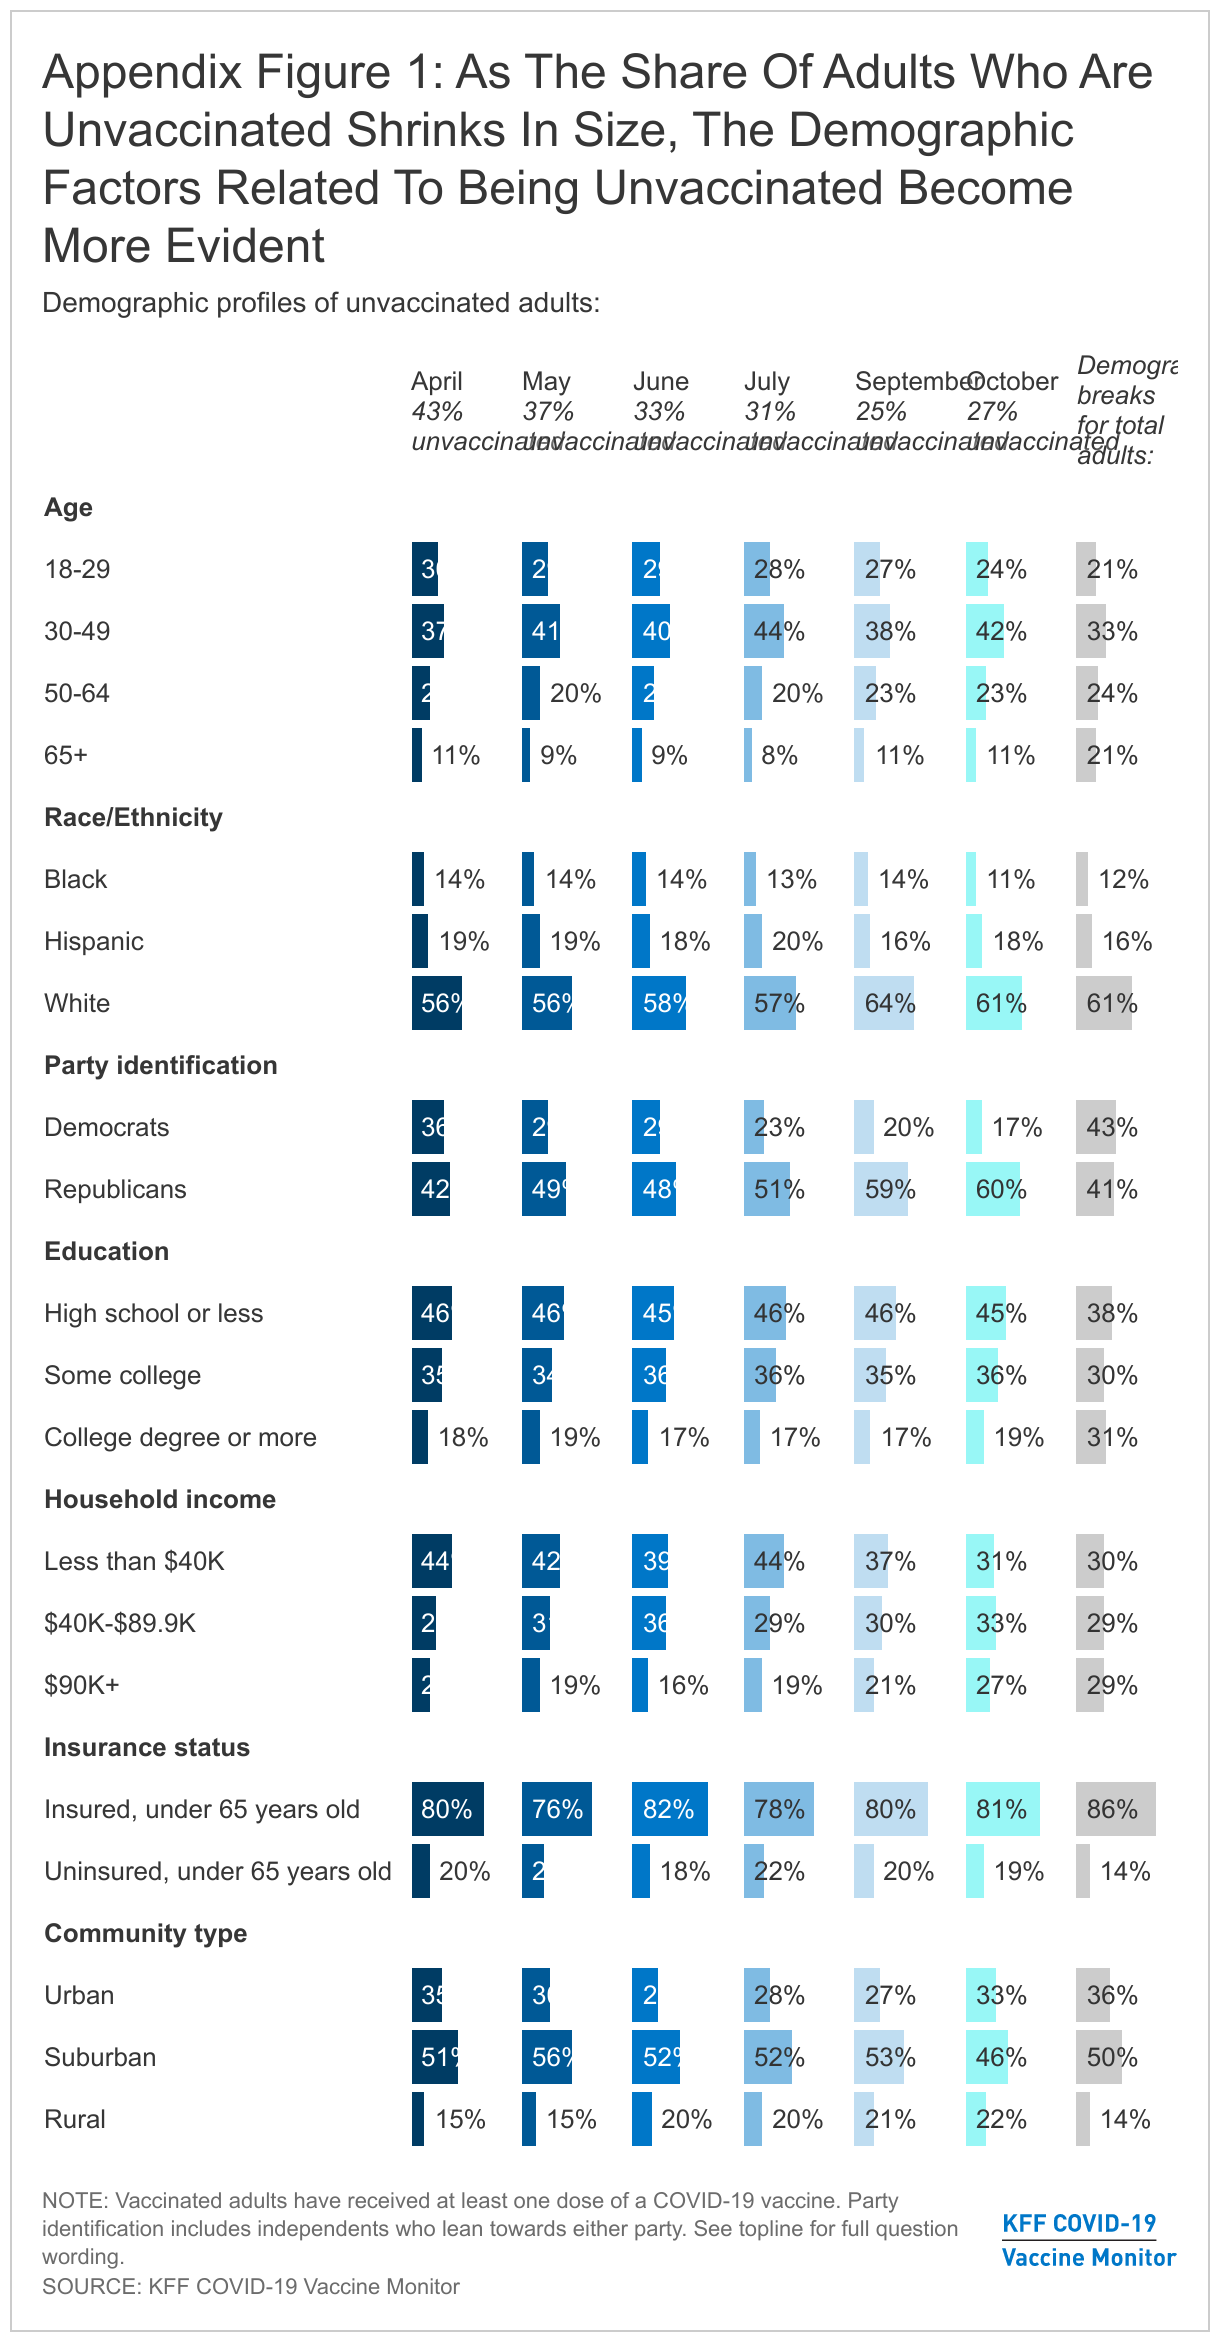
By April 2021, a majority of U.S. adults (56%) self-reported they had already received at least one dose of a COVID-19 vaccine. Among the 43% of adults who said at that time that they had not yet been vaccinated, about four in ten (42%) identified as Republicans or Republican-leaning independents and about one-third (36%) identified as Democrats or leaned that way, while 16% identified as independents who didn’t lean toward either party. The partisan divide between vaccinated and unvaccinated adults became even more evident as larger shares of the population received COVID-19 vaccines. Now, six months later, in October 2021, one-quarter (27%) of U.S. adults say they have not gotten a COVID-19 vaccine, but the unvaccinated population is now disproportionately made up of those who identify as Republican or Republican-leaning, with six in ten (60%) identifying as Republican or Republican-leaning (compared to about four in ten of the U.S. total adult population1 ) and just one in six (17%) calling themselves Democrats or Democratic-leaning. See Appendix figure 1 for a full demographic profile of unvaccinated adults from April to October 2021.
At the same time that the role of partisanship in predicting vaccination status has increased, our surveys and other KFF research have shown that racial and ethnic gaps in vaccine uptake have narrowed over time. And while other groups such as the uninsured, younger adults, rural residents, and those with lower levels of education continue to be vaccinated at lower rates than their counterparts, multivariate analysis – a statistical model that separates out the influence of these different factors – indicates partisanship stands out as the strongest single identifying predictor of vaccine uptake.2 See Appendix figure 2 for regression analysis results displaying the relative size of the effects of education, race and ethnicity, and partisanship, while holding other variables (such as age, rurality, income, ideology) constant based on average population.
Demographic And Attitudinal Differences Between Vaccinated And Unvaccinated Republicans
While self-identifying as a Republican or leaning Republican is one of the strongest identification predictors of remaining unvaccinated, it is important to note that a majority (59%) of this group (Republican and Republican-leaners) does report receiving at least one dose of a COVID-19 vaccine.
Similar to the overall differences between unvaccinated and vaccinated adults, unvaccinated Republicans are younger and report lower levels of educational attainment than their vaccinated counterparts. Larger shares of unvaccinated Republicans identify as conservative (68% v. 58%) and live in counties where former President Trump received more votes during the 2020 election (65% v. 52%), although this difference is not dramatic.3 Another geographic characteristic – urbanicity – distinguishes the two groups, with 27% of unvaccinated Republicans living in rural areas compared to 16% of vaccinated Republicans (similar to the urban-rural divide found in the overall vaccination rates).
Exploring attitudinal differences by both partisanship and vaccination status reveals that there are some minor differences between vaccinated and unvaccinated Republicans in how they think about the seriousness of the pandemic, their own personal risk, and how personal choice vs. collective responsibility factors into vaccination decisions. However, vaccinated Republicans’ attitudes look much closer to those of unvaccinated Republicans than they do to vaccinated Democrats, highlighting the strong correlation between these attitudes and partisanship, regardless of vaccination status.4
For example, vaccinated Republicans are somewhat less likely than unvaccinated Republicans to say the seriousness of the pandemic has been exaggerated in the news (88% vs. 54%), but both groups contrast with vaccinated Democrats, most of whom say the news is generally correct (56%) or underestimates the seriousness of the pandemic (31%). An overwhelming majority of unvaccinated Republicans (96%) and a somewhat smaller but still substantial majority of vaccinated Republicans (73%) say getting vaccinated against COVID-19 is a personal choice, while a large majority of vaccinated Democrats (81%) see it as everyone’s responsibility to protect the health of others. And while vaccinated Republicans are about twice as likely as unvaccinated Republicans to worry that they will personally get sick from COVID-19 (25% vs. 11%), the share that is worried is still substantially less than it is among vaccinated Democrats (46%).
Implications
The increasing role of partisanship in determining individuals’ COVID-19 vaccination status presents a challenge for public health officials and messaging related to any efforts to further increase vaccine uptake among adults. The group that remains to be convinced of the importance of receiving a COVID-19 vaccine is disproportionately represented by those who identify as or lean Republican. Compared to their vaccinated counterparts, these unvaccinated Republicans are distinguished by the voting behavior of their neighbors, their sense that the pandemic is being over-stated, and their lack of a sense of personal risk: factors that may be extremely difficult to overcome in gaining acceptance of COVID-19 vaccines. These findings may also have implications as the vaccine rollout expands to younger children and the CDC recommends booster shots for some adult populations. With most vaccinated Republicans saying they’re not worried about getting sick and 38% of fully vaccinated Republicans saying they do not plan to get a booster shot when eligible, it seems likely that partisanship will continue to play a role in the vaccine rollout beyond the initial effort to vaccinate the adult population.
Appendix
Endnotes
The share of Republicans and Republican-leaning independents in the most recent KFF COVID-19 Vaccine Monitor is at 41% of the U.S. adult population, which is similar to the share reported by Gallup and Pew Research Center during the same time period. ↩︎
In addition to the analysis included in this research brief, we also used ordinary least squares regression models (OLS) and logit regressions with each cross-sectional survey predicting being unvaccinated to produce predicted probabilities. The independent variables include gender, race/ethnicity, age, education, partisanship, income, urbanicity, LGBT identity, ideology, health care worker status, and health insurance coverage when available in the month’s survey. Predicted probabilities from the logit regression models from the September data is displayed in Appendix figure 2. ↩︎
This is consistent with recent academic research that suggests that views of all COVID-19 related health behaviors, including vaccine intentions, is correlated with Trump favorability. Previous KFF analysis found a similar vaccination gap between counties that voted for President Biden compared to President Trump ↩︎
The sample size of unvaccinated Democrats is too small for analysis. ↩︎
The U.S. Congress, the legislative body of the U.S. government (USG), plays an important role in determining and shaping the government’s global health policy and programs. Although only one of many USG entities involved in global health, its engagement has been particularly notable over the last 20 years, which have been marked by unprecedented bipartisan support for U.S. global health efforts and resulted in the authorization of the U.S. President’s Emergency Plan for AIDS Relief (PEPFAR), the U.S. government’s coordinated response to global HIV and the largest program focused on a single global health issue in the world, as well as the appropriation of significantly increased funding. It has also played a key role in the U.S. response to recent global health emergencies, including Ebola, Zika, and COVID-19 as well as increasing U.S. support for global health security and pandemic preparedness and response efforts. Indeed, Congress fulfills a key role in U.S. global health policy by setting the broad parameters and priorities of U.S. global health programs, determining their funding levels, and overseeing the implementation and effectiveness of supported efforts. Its activities in this area are complemented and influenced to varying degrees by those of numerous stakeholder groups and individuals that, while not examined in this primer, are key actors in the policymaking process. Such stakeholders include: advocates, the private sector, think tanks, academic institutions, religious communities and organizations, people directly affected by global health issues (such as people living with HIV), and others.
To help shed light on Congress’ role in global health, this primer provides an overview of its engagement in this area, aiming to provide a basic framework with which congressional efforts may be understood. First, it examines the structure of Congress and its role and key activities in global health, which range from authorizing the creation of and providing funding for U.S. global health programs to engaging in program oversight and confirming presidential appointees to lead these efforts. It then illustrates these by examining selected legislative activities for two global health examples: the creation and evolution of PEPFAR and the 2014/2015 Ebola outbreak in West Africa. Finally, it discusses opportunities and challenges related to congressional engagement in global health going forward.
Structure
Congressional engagement in global health is carried out by the two chambers of Congress – the U.S. House of Representatives and the U.S. Senate – and their members, committees, and caucuses. This work is supported by a cadre of congressional staff as well as legislative branch agencies and offices (e.g., the Congressional Budget Office (CBO), the Government Accountability Office (GAO), and the Congressional Research Service (CRS)).
Chambers
The U.S. House of Representatives (the House) and the U.S. Senate (the Senate) debate and vote on legislation, including legislation related to global health, among other activities. The House is the larger body, whose members represent 435 congressional districts, which are distributed across states based on population during the most recent census; House members are up for re-election every two years. The Senate has 100 members, two from each state, who are up for re-election every six years.
Members
Each chamber is made up of individuals who have been elected to serve as members of Congress for certain periods of time (see Box 1). Members’ engagement in global health may include a variety of actions, such as: sending official correspondence (e.g., to the Executive Branch or to congressional colleagues individually or via “Dear Colleague” letters1 ), speaking publicly and/or privately, participating in congressional delegations to the field, issuing press releases, introducing or co-sponsoring legislation, and, most importantly, voting on legislation. (It is important to keep in mind that legislation may be a product of negotiations with the Executive Branch.)
Box 1: The 117th Congress
Every two years, a new term of Congress is convened, initiating a new two year period of legislative activity. Each year within this period is a congressional session. The current Congress, known as the 117th Congress, was convened on January 3, 2021, and will end on January 3, 2023. Its membership is made up of the following:
Representatives: 435 elected members2 of the House who serve two–year terms; all are up for election every two years.
Senators: 100 members of the Senate who serve six-year terms; a third of senators are up for election every two years.
Democratic majority in House and Senate: The House has 212 Republicans and 220 Democrats.* The Senate has 50 Republicans, 48 Democrats, and 2 Independents who caucus with the Democrats; Democrats hold the majority due to the tie-breaking vote of the Vice President, a Democrat.
Members who are: women (147); African-Americans (57); Hispanic or Latino (54); of Asian, South Asian, or Pacific Islander ancestry (21); American Indian (Native American) (5).*
Members who served or are serving in the U.S. military: 91.*
NOTES: * As of Aug. 5, 2021; at that time, there were three vacant seats in the House, and additionally, four delegates are Democrats, and one delegate and the Resident Commissioner of Puerto Rico are Republicans.SOURCE: CRS, Membership of the 117th Congress: A Profile, Aug. 5, 2021 update.
Committees
Within each chamber, the work of Congress is generally performed by smaller groups of members, known as committees. Committees examine issues under their jurisdiction and may also consider and vote on legislation. Passage of a piece of legislation by a committee allows it to be brought before the chamber as a whole. Currently, the Senate has 16 standing (permanent) committees and four select and special committees, which may be permanent or temporary and typically “examine emerging issues that do not fit clearly within existing standing committee jurisdictions or cut across jurisdictional boundaries.” The House has 20 standing committees and five select committees.3 Additionally, there are four joint committees of the House and Senate, which are permanent, bicameral entities that do not consider legislation but rather carry out studies and certain administrative functions for Congress. Although the organization of committees in each chamber is rooted in a 1946 law that originally laid out similar committees in each chamber, the committee structure has evolved over time, leading to more variation across committees and chambers.4
There are more than ten congressional committees whose work relates to global health,5 although a smaller subset of six committees has primary jurisdiction over most global health programs and funding. These six are: the House Committee on Foreign Affairs (HFAC), the Senate Committee on Foreign Relations (SFRC), the House Committee on Energy and Commerce (E&C Committee), the Senate Committee on Health, Education, Labor, and Pensions (HELP Committee); and the House and Senate Committees on Appropriations (Approps. Committees). See Table 2 for an overview of jurisdiction by committee. Also see Appendix A for an overview of key committees and subcommittees’ leadership as well as a listing of members serving on these during the 117th Congress.
Caucuses
Members of Congress may also establish formal or informal groups of members, known as caucuses, focused on specific topics.6 Caucuses may be bipartisan (drawing their membership from both Democrats and Republicans) and bicameral (including members from both chambers), but they do not have to be. Among current caucuses, there are nearly 10 related to global health, including: the Congressional Global Health Caucus, the Congressional HIV/AIDS Caucus, the Tuberculosis Elimination Caucus, the Congressional Caucus on Malaria and Neglected Tropical Diseases, the Senate Caucus on Malaria and Neglected Tropical Diseases, the House Hunger Caucus, the Senate Hunger Caucus, and the COVID-19 Global Vaccination Caucus. See Appendix B for a listing of global health-related caucuses and their leadership during the 117th Congress.
Role and Key Activities
Congress is responsible for determining the broad outlines and priorities of U.S. global health efforts, providing funding for USG agencies and departments to carry them out, and overseeing the conduct and impact of these efforts. Congress fulfills this role through an array of activities, which generally fall under two broad umbrellas: introducing, considering, and passing legislation and carrying out oversight activities, including confirming presidential appointees to key USG global health positions.
Legislation
Legislation considered by Congress may be either a resolution or a bill, each of which serves different functions.7 These types of legislation are described below, and Table 1 provides several examples of global health-related legislation.
Resolutions
Resolutions often recognize or commemorate a person, day, or issue or express a position on an issue but generally do not become law (i.e., most are non-binding), though there are some that may be more similar to bills. For example, a resolution “recognizing the importance of sustained United States leadership to accelerating global progress against maternal and child malnutrition and supporting the commitment of the United States Agency for International Development to reducing global malnutrition through the Multi-Sectoral Nutrition Strategy” was passed by the Senate in 2020, as was a similar resolution in the House.8
Resolutions are generally one of three types: a simple resolution, a concurrent resolution, and a joint resolution. Simple and concurrent resolutions are used most often with regard to specific global health issues and have similar functions: A simple resolution usually expresses the sentiments of the chamber of Congress that voted for its passage, while a concurrent resolution also serves this function (as well as sometimes being used for congressional administrative matters) but is voted upon by both chambers. For example, the Senate passed a simple resolution on “supporting the goal and ideals of World Polio Day and commending the international community and others for their effort to prevent and eradicate polio” in 2014, while the House and the Senate passed a concurrent resolution to address a matter affecting the operation of both chambers, specifically correcting the enrollment (final agreed form) of a bill addressing U.S. global HIV, TB, and malaria activities.9 On the other hand, unlike the other two types, a joint resolution may have the force of law if it passes both chambers and is subsequently submitted to and signed by the President. In such cases, it is more similar to a bill. Joint resolutions, however, differ from bills in the ways in which they are used and with regard to the content they generally address: joint resolutions are often used to propose changes to current law that are relatively minor, temporary, or short-term in nature, and are also sometimes used to create temporary bodies or commissions. In general, joint resolutions are used less often with specific regard to global health and, rather, are used to address broader matters (like budget matters) that may impact global health.
Bills
Bills, which may become law if they pass both chambers and are subsequently submitted to and signed by the President, usually either function to authorize U.S. funding, programs, and activities or to appropriate U.S. funding for such programs and activities (see below).
Table 1: Examples of Global Health-Related Legislation
Public Health Service Act of 1944 and Foreign Assistance Act of 1961: established the main agencies that carry out global health activities and specified where and how funds should be directed.
International Health Research Act of 1960: provided for international cooperation in health research, research training, and research planning and also authorized the Secretary of the U.S. Department of Health and Human Services (HHS) to enter into international cooperative agreements for biomedical and health activities.
Global AIDS and Tuberculosis Relief Act of 2000: helped lead to the creation of the Global Fund to Fight AIDS, Tuberculosis, and Malaria (an independent, multilateral financing entity designed to raise significant new resources to combat HIV, TB, and malaria in low- and middle-income countries) by directing the Secretary of the Treasury to enter into negotiations with other donors to establish a Trust Fund for AIDS at the World Bank.
U.S. Leadership Against HIV/AIDS, Tuberculosis, and Malaria Act of 2003: authorized the creation of PEPFAR and provided for expanded U.S. government efforts to address global HIV, TB, and malaria by authorizing up to $15 billion in funding over five years (Fiscal Year (FY) 2004 – FY 2008) for efforts to address these diseases and for U.S. contributions to the Global Fund.
Tom Lantos and Henry J. Hyde U.S. Global Leadership Against HIV/AIDS, Tuberculosis, and Malaria Act of 2008: reauthorized PEPFAR and provided for expanded U.S. global HIV, TB, and malaria efforts by authorizing up to $48 billion in funding over five (more) years (FY 2009 – FY 2013) for these efforts and for U.S. contributions to the Global Fund.
PEPFAR Stewardship and Oversight Act of 2013: reauthorized PEPFAR for another five years (FY 2014 –FY 2018).
Senator Paul Simon Water for the World Act of 2014: established the position of the Global Water Coordinator at USAID and outlines priorities for USG efforts that provide first-time or improved access to safe drinking water, sanitation, and hygiene (WASH) in developing countries.
PEPFAR Extension Act of 2018: reauthorized PEPFAR for another five years (FY 2019 – FY 2023).
Department of Defense (DoD) Appropriations Acts: provided funding for the first time to support DoD HIV research efforts in 1986 and DoD HIV prevention efforts among African militaries in 2001, effectively creating new DoD HIV efforts that today have a global reach.
Supplemental Appropriations Act, 2010: provided $2.9 billion in emergency funding to support disaster relief and reconstruction efforts in Haiti after a major earthquake struck there in 2010.
Authorization Bills
An authorization bill may lay out congressional priorities for global health programs, including approaches/strategies, focus countries, target groups (vulnerable populations), and targets (keeping in mind that legislation may be the result of negotiations with the Executive Branch). It may also broadly create and/or modify the policies and organization of USG global health efforts and drive support for the creation/growth of new global health organizations internationally. For example, the U.S. Leadership Against HIV/AIDS, Tuberculosis, and Malaria Act of 2003 (Leadership Act) authorized and institutionalized the President’s Emergency Plan for AIDS Relief (PEPFAR) program by: authorizing the expansion of U.S. global efforts to address HIV, TB, and malaria in low- and middle-income countries through U.S. bilateral assistance as well as U.S. contributions to the Global Fund to Fight AIDS, Tuberculosis and Malaria (Global Fund, which is an independent, multilateral financing entity designed to raise significant new resources to combat HIV, TB, and malaria in low- and middle-income countries); outlining PEPFAR’s organizational structure as a coordinated, whole-of-government response to global HIV, including establishing the position of the U.S. Global AIDS Coordinator; and defining the key priorities and policies of the program. Later, the Tom Lantos and Henry J. Hyde U.S. Global Leadership Against HIV/AIDS, Tuberculosis, and Malaria Act of 2008 (Lantos-Hyde Act) reauthorized these efforts for five more years and redefined the priorities and policies of the PEPFAR program. Additionally, as sometimes happens with legislation, the Act also included provisions (such as codifying the position of the U.S. Global Malaria Coordinator and requiring a five-year global malaria strategy) that had appeared in other proposed legislation.13 See the KFF brief on PEPFAR reauthorization.
An authorization bill may also define the period during which such activities may be operated and provide guidance on the amount of funding to be provided. Still, while specifying an authorized level of funding in an authorization bill may be indicative of congressional intent to appropriate funding at certain levels, funding is actually appropriated through appropriations bills, and Congress is not required to appropriate the level of funding that is authorized for a discretionary program (see Box 2 and further discussion below). In some instances, Congress may appropriate more funding than authorized (see Box 3), while in others, it may appropriate less. For example, in the Leadership Act of 2003, Congress authorized up to $15 billion for U.S. global HIV, TB, and malaria efforts, including bilateral assistance as well as U.S. contributions to the Global Fund, from FY 2004 through FY 2008, but ultimately, it appropriated nearly $19.8 billion for these efforts during that period.14 On the other hand, in the Lantos-Hyde Act of 2008, Congress authorized up to $48 billion for these same efforts from FY 2009 through FY 2013 but, ultimately, appropriated just under $37.2 billion for them during that period.15
Box 2: Discretionary and Direct (Mandatory) Spending
There are two types of spending (funding) that make up the U.S. federal budget: discretionary and direct; each type is subject to different processes and controls in the budget process.
Discretionary spending is provided through the annual appropriations process, which is a legislative process for determining the level of funding to be spent on certain U.S. government activities. Global health funding falls under this type, since U.S. government global health activities are discretionary programs.
Direct spending, also often referred to as mandatory funding, is generally provided outside of the annual appropriations process. This type mostly involves funding for entitlement programs, such as Social Security and Medicare, and interest payments on the U.S. national debt.16
Appropriations Bills
An appropriations bill provides funding for specific programs and activities. Because support for all U.S. global health programs is considered discretionary (versus direct – or mandatory – funding), funding is typically determined (appropriated) on an annual basis by Congress; see Box 2 for more information on these two different kinds of federal spending.
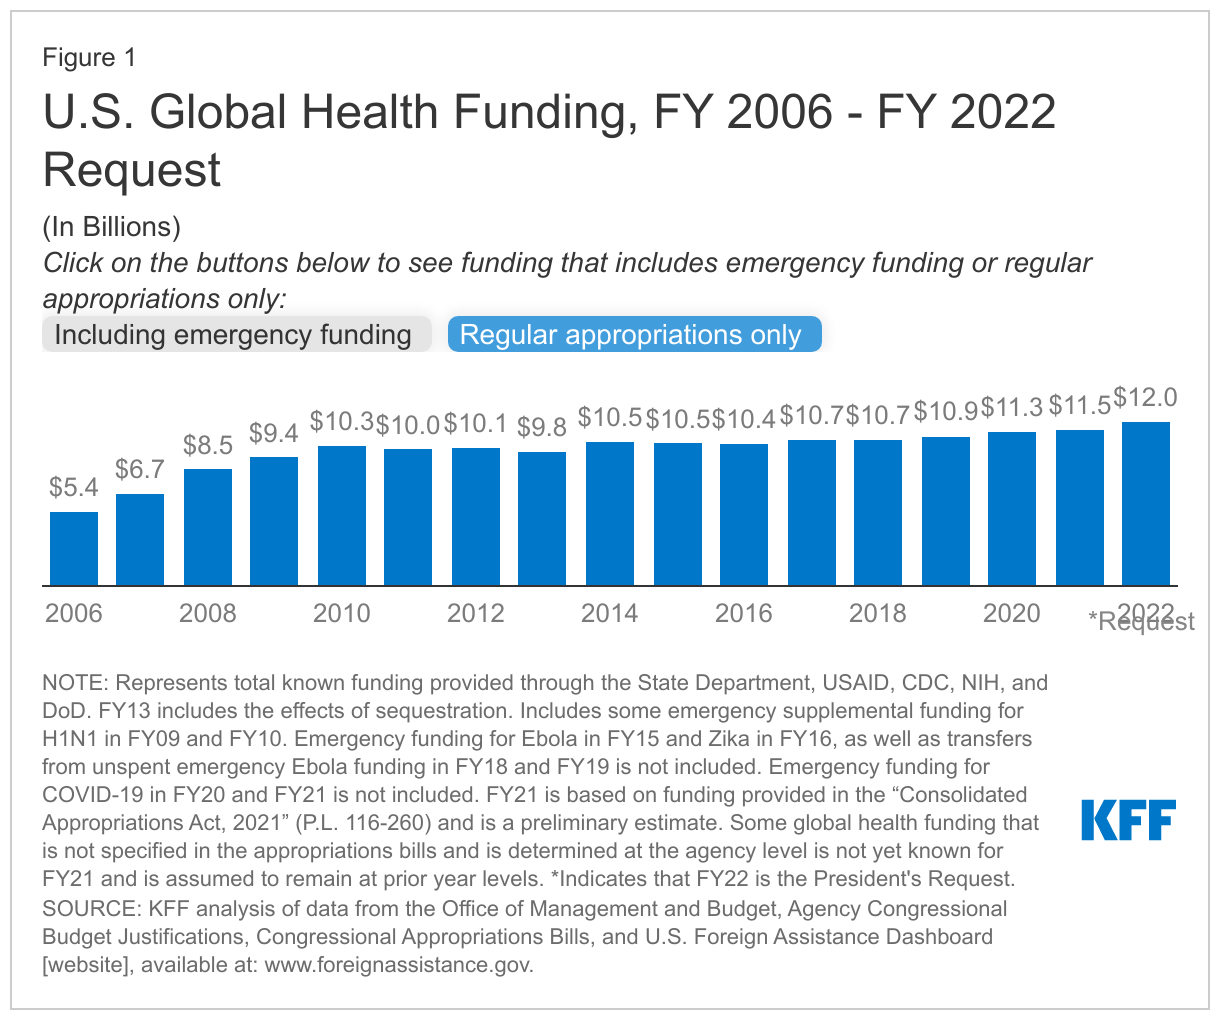
Over time, particularly in the last decade, Congress has increased levels of funding for global health, making the U.S. government the largest donor to global health in the world. However, since FY 2010, non-emergency U.S. funding for global health has remained relatively flat (see Figure 1).17 In recent years, it has provided higher levels than requested in the President’s Budget for regular appropriations, and it has also supported supplemental appropriations for emergency humanitarian, health, and pandemic responses.
Box 3: The Two-Step Process of Authorization/Appropriations
Established by House and Senate rules, the two-step process of authorization/appropriations supports the linkages between the authorizing and appropriating committees of each chamber. Authorizing legislation is “intended to provide guidance to appropriators as to a general amount and under what conditions funding might be provided to an agency or program” before appropriations may be made.18
For foreign assistance specifically – including global health assistance, this two-step process is also required by law. Still, this requirement is often waived by Congress, since it has not passed comprehensive foreign assistance authorization legislation since 1987. (Some instances of limited authorization legislation for specific programs, including global health programs such as PEPFAR, exist, but these are less frequent occurrences than the use of waivers for the process.)
Thus, absent an authorization bill, an appropriations bill can have the effect of authorizing the creation of a new program when providing funding for a specific activity for the first time and/or authorizing the continued operation of an existing program by providing continued funding for its activities.
Regular appropriations. Each year, bills referred to as “regular appropriations bills” outline funding for government programs and activities, including for U.S. global health activities, within specified USG agencies and departments for a single fiscal year. For example, the Department of State, Foreign Operations, & Related Programs Appropriations Act (SFOPS bill) provides funding for USAID, the Department of State, and the Millennium Challenge Corporation (MCC), while the Departments of Labor, Health and Human Services, and Education, & Related Agencies Appropriations Act (Labor/HHS bill) provides funding for CDC, NIH, and FDA, among others. In some years, Congress may pass some or all regular appropriations bills individually or as part of a larger bill that bundles them together during vote consideration (an “omnibus” bill). In others, it may not pass some or all of these bills, instead opting to pass a “continuing resolution” that, generally, maintains U.S. funding at the prior fiscal year’s levels.Typically, at least five regular appropriations bills include components of global health activities carried out by more than 15 USG entities; these bills are the SFOPS bill; Labor/HHS bill; Department of Defense Appropriations Act; Agriculture, Rural Development, Food and Drug Administration, and Related Agencies Appropriations Act; and Financial Services and General Government Appropriations Act.19
Supplemental appropriations. Less frequently, a bill referred to as a “supplemental appropriations bill” may provide additional funding to agencies to support emergency activities or other urgent needs that must be filled before the passage of the next fiscal year’s regular appropriations bills.20 For example, supplemental appropriations that included global health components supported funding for the USG’s response to unforeseen events, crises, and humanitarian disasters, such as the 2009 H1N1 pandemic, the 2010 Haiti earthquake, the 2014-2015 Ebola outbreak in West Africa, the 2015-2016 Zika outbreak, and the ongoing COVID-19 pandemic.21
Key Provisions and Reports
While these two kinds of bills – authorization and appropriations bills – are intended to be interrelated as part of a two-step process where each type fulfills a different function, Congress has increasingly used these bills for similar purposes (with the caveat that appropriations bills remain the only legislative vehicle for providing funding).
As a consequence, Congress now may (and often does) include provisions in both authorization and appropriations legislation that provide specific guidance or requirements for how funding be spent and/or how USG global health programs be implemented. These provisions may include spending directives as well as other legislative requirements and restrictions, which are discussed below.
Spending directives. These may relate to certain bilateral global health programs as well as U.S. contributions to certain multilateral/international organizations. For example, in the Consolidated Appropriations Act of 2021 (which included the SFOPS bill), Congress provided guidance on the amount of funding to be directed to the U.S. contribution to the U.N. Population Fund (UNFPA) by stating that $32.5 million should be made available for this purpose.22
Other legislative requirements and restrictions. These may range from requiring regular reporting to Congress on global health efforts to the development of five-year strategies on a specific global health issue to the conduct of programs to accordance with specific guidelines. For example, Congress requires USG global family planning/reproductive health (FP/RH) funding only be used to support organizations that “offer, either directly or through referral to, or information about access to, a broad range of family planning methods and services” through a provision known as the DeConcini Amendment in the SFOPS bill each year.23
Additionally, congressional committees with jurisdiction over global health-related legislation may also issue reports on legislation. While these reports are not binding and do not have the force of law, they may offer more specific guidance to the Executive and Judicial Branches (and other audiences) about how Congress would like to see a piece of legislation interpreted and more specifics about certain aspects of the legislation.24
Oversight
Congressional oversight of government programs, including for global health, is generally the purview of the committee or committees with responsibility for reviewing the activities and performance of departments and agencies under their jurisdiction (see Table 2 for key committees’ jurisdiction related to global health). Their oversight activities may include the following:
Holding hearings. Hearings can draw public and congressional attention to recent developments and issues as well as inform the legislative process. For example, in the context of global health, Congress held several hearings on malaria in 2004 and 2005 that drew attention to and questioned key aspects of USAID’s approach to addressing malaria, such as the small proportion of U.S. malaria support devoted to buying and distributing commodities (e.g., bed nets and antimalarial drugs) as well as its overall impact and effectiveness.25 Later, in 2006, another congressional hearing reviewed changes that had been made to the USAID malaria program in 2005, when (among other things) the agency began to operationalize the newly-created President’s Malaria Initiative (PMI), which President Bush had launched in 2005 to expand U.S. global malaria efforts, and direct more funding to commodities.26
Reviewing legislatively-mandated reports to Congress. This provides an opportunity for members and their staff to evaluate the status of efforts relative to legislative benchmarks. For example, the Executive Branch submits annual reports to Congress on the PEPFAR program and periodic reports to Congress on USAID health research & development (R&D) activities, among other things.27
Approving changes to program funding allocations through the review of congressional notifications (known as CNs) from USG agencies. CNs provide some flexibility to agencies when circumstances necessitate changes to how funding is to be spent after Congress has already appropriated funding; the CN process provides Congress with a chance to review, evaluate, and approve such changes with regard to certain funding. This could include, for example, a CN requesting a change in the amount of funding planned to support activities related to a particular global health area in a specific country.28
Reviewing the rules, regulations, and policies promulgated by departments and agencies to implement laws, policies, and congressional recommendations.29 Such review may help to influence the final form these implementing mechanisms take. Congress may also exercise its authority to disapprove rules and regulations, though this authority “has been little used by Congress.”30
Issuing congressional reports. Congressional committees may issue reports on issues under their jurisdiction that they are investigating.31 For example, in 2006, the then-House Committee on Government Reform issued a committee report based on a study conducted by its Subcommittee on National Security, Emerging Threats, and International Relations, which examined strengthening disease surveillance. Though the report’s findings and recommendations focused on improving U.S. domestic disease surveillance in order to detect global threats, it also discussed global disease outbreaks and select USG global disease surveillance efforts, such as the Department of Defense’s Global Emerging Infections Surveillance and Response System (GEIS).32
Approving treaties proposed and negotiated by the Executive Branch. Before the U.S. may officially accede to a treaty, the President must submit the treaty to the Senate for its advice and consent; with the Senate’s approval, the President may then proceed with ratifying the treaty.33 For example, the Senate approved the Food Aid Convention (FAC, a treaty negotiated in 1999 that aimed to “ensure that the international community can respond to emergency food situations, as well as ongoing food needs in developing nations” and that also “promotes food security, especially for vulnerable populations”34 ), allowing the U.S. to ratify the treaty in 2001. More recently, the Senate approved the FAC’s successor, the Food Assistance Convention (the FAC expired in 2003), allowing the U.S. to ratify the treaty in 2012, the same year in which it was negotiated.35
Confirming presidential appointees. A function reserved to the Senate, providing advice and consent on the nominations of individuals for certain key global health-related positions within the USG allows the Senate to review and question each nominated individual’s priorities for and approach to their position. See below for further discussion.
Table 2: Jurisdiction of Key Congressional Committees Related to Global Health
House Foreign Affairs (HFAC) and Senate Foreign Relations (SFRC)
Responsible for oversight and legislation relating to foreign assistance, including programs operated by the Department of State, USAID, and the Millennium Challenge Corporation (MCC). SFRC is also responsible for confirmation of presidential appointees at these agencies.
Key HFAC Subcommittees:
Africa, Global Health, and Global Human Rights
International Development, International Organizations, and Global Corporate Social Impact
Key SFRC Subcommittees:
Africa and Global Health Policy (with responsibility for disease outbreak and response)
Multilateral International Development, Multilateral Institutions, and International Economic, Energy, and Environmental Policy (with responsibility for international organizations, including the United Nations and its agencies)
State Department and USAID Management, International Operations, and Bilateral International Development (with responsibility for State, USAID, MCC, Peace Corps)
Western Hemisphere, Transnational Crime, Civilian Security, Democracy, Human Rights, and Global Women’s Issues
House E&C Committee and Senate HELP Committee
Responsible for oversight and legislation related to a number of areas of health care, including biomedical research, public health, and the regulation of drugs. The HELP Committee is also responsible for confirmation of presidential appointees at the Centers for Disease Control and Prevention (CDC), National Institutes of Health (NIH), and Food and Drug Administration (FDA).
Key House E&C Subcommittee:
Health
Key Senate HELP Subcommittees:
Children and Families
Primary Health and Retirement Security
House and Senate Appropriations Committees
Responsible for oversight and appropriation of funds to USG global health efforts.
Key House Appropriations Subcommittees:
Defense
Labor, Health and Human Services, Education, and Related Agencies (with responsibility for CDC and NIH)
State, Foreign Operations, and Related Programs (with responsibility for State and USAID)
Key Senate Appropriations Subcommittees:
Defense
Labor, Health and Human Services, Education, and Related Agencies (with responsibility for CDC and NIH)
State, Foreign Operations, and Related Programs (with responsibility for State and USAID)
NOTES: State means the Department of State, USAID is the U.S. Agency for International Development, MCC is the Millennium Challenge Corporation, CDC is the U.S. Centers for Disease Control and Prevention, NIH is the National Institutes for Health.
Confirmation of Key USG Officials
As required by the U.S. Constitution and law, people appointed by the president to certain positions within the USG may only be confirmed with the advice and consent of the Senate.36 With regard to global health, a number of positions with federal departments and agencies require such confirmation. Some of these positions are mainly or entirely focused on global health (e.g., the U.S. Global AIDS Coordinator, who holds the diplomatic rank of Ambassador-at-Large, at the State Department; the Assistant Administrator for the Bureau for Global Health at USAID), while other positions are generally focused on global development but include global health in their purview (e.g., the Administrator of USAID). Still other positions requiring Senate confirmation have a broader portfolio that includes global health among many other issues (e.g., the Secretary of Health and Human Services).
The confirmation process, which involves both the committee with jurisdiction and the Senate as a whole, proceeds at varying speeds, depending on the nominee, the position for which they are nominated, questions or concerns raised about their nomination by a Senator(s) (if any), and the broader political context and timing of the nomination. Generally, the relevant committee is responsible for gathering information about a nominee, and it may or may not hold a hearing related to the nomination before deciding whether or not to recommend the nominee to the full Senate for a vote.37 (See also the PEPFAR example below.)
Member Engagement
Additionally, members of Congress may individually weigh in on the conduct of USG global health efforts in various ways (e.g., by drafting letters to USG officials about global health issues/programs, as 98 members did in 2009 when they sent a letter to President Obama in which they urged him to request at least $1.75 billion for the U.S. contribution to the Global Fund as part of his FY 2011 budget request38 ), and congressional member and staff delegations may visit sites of USG global health efforts during official visits overseas.
Examples of Congressional Engagement
PEPFAR
Though the history of congressional engagement in global HIV spans several decades, Congress has become substantially more involved in responding to the epidemic over the past 20 years. It has employed a variety of legislative tools and activities – from legislation to hearings to caucuses – in its efforts to shape and reshape the USG response to global HIV, leading up to and through PEPFAR.
Legislation
While PEPFAR is widely seen as a signature initiative of President George W. Bush, some members of Congress had already begun laying legislative groundwork for an expanded U.S. global HIV effort and crafting legislation that served as an early blueprint for PEPFAR. Just four months after President Bush announced his intention to create PEPFAR during his 2003 State of the Union Address, Congress passed legislation authorizing the program at up to $15 billion in funding for U.S. global HIV, TB, and malaria efforts over five years; since then, the program has been reauthorized three times (see Table 1). PEPFAR illustrates how global health endeavors evolve over time, requiring Congress, as well as the Administration and non-government stakeholders, to navigate conflicting approaches, disparate priorities, and changing budget environments; this is reflected, for example, in the evolving content of PEPFAR’s authorizing legislation over time, as well as PEPFAR’s appropriations history. Each authorization has addressed different aspects of policy and programming, with Congress spelling out spending directives as well as other requirements and restrictions for PEPFAR activities through these pieces of legislation. For example, the Leadership Act of 2003 included a spending directive that required not less than 10% of HIV funding be spent on orphans and other children affected by or vulnerable to HIV/AIDS (a provision which remains in force today), and the Lantos-Hyde Act of 2008 required additional PEPFAR reporting to Congress, including a report by the Comptroller General about the coordination of USG global HIV efforts and the impact of PEPFAR funding and programs on other USG global health programming.39 In addition, whereas Congress appropriated substantially more funding in PEPFAR’s first five year period than the $15 billion authorized for the program, it appropriated significantly less than that authorized in its next five years and has essentially flat-funded the program since, reflecting a dramatically changed budget context.
Oversight
Congressional oversight of PEPFAR takes many forms, including: public hearings; review of reports to Congress that describe, for example, how appropriated funding has been spent and documenting progress toward congressionally-mandated targets for PEPFAR efforts; the creation of at least two congressional caucuses focused specifically on global HIV (along with other caucuses addressing broader global health issues that have also worked to address HIV); congressional participation on delegations to the field; and the engagement of individual members in a variety of activities. With regard to the latter, the substantial engagement of a number of members of Congress has, historically, been important in advancing not only related legislation but also in both buttressing as well as challenging USG policy, programming, and goals related to HIV: Over the years, a number of members have written letters to leaders in the Executive Branch about PEPFAR activities, spoken on the floor of the House and Senate at length about HIV, and engaged with the HIV community and, more broadly, the global health community through a variety of fora.
Additionally, of particular importance in the context of PEPFAR oversight is the Senate confirmation of the leader of PEPFAR, known as the U.S. Global AIDS Coordinator. A novel approach to coordinating U.S. global health efforts related to a single issue at the time of the position’s creation, the Coordinator oversees U.S. global HIV efforts across USG departments and agencies but is based at the U.S. Department of State; however, the Coordinator exercises significant authority over HIV funds across USG agencies, which remains a unique attribute of the position relative to leaders of other USG disease-specific programs. While the person who will lead PEPFAR is appointed by the president, the position is among those that must be confirmed with the advice and consent of the Senate.
West Africa Ebola Outbreak
By the latter half of 2014, congressional attention to the then-rapidly-expanding outbreak of Ebola virus disease in West Africa grew quickly, and the ensuing flurry of congressional activity provides a snapshot of the varied ways in which Congress may engage with a global health issue. The Ebola outbreak began to garner more attention in the U.S., and specifically on Capitol Hill, after the infection of two American health workers overseas who were working with Ebola-infected patients was announced in July 2014. At about the same time, the non-governmental organization Medicins San Frontieres (MSF) issued a global call for help, stating that “Ebola is no longer a public health issue limited to Guinea [the country where the outbreak began]. It is affecting the whole of West Africa.”40
In the years following that, congressional efforts were wide-ranging and included public hearings, legislation (both binding and non-binding), and member engagement on the issue (e.g., several members called for more information about and increased USG actions in response to the outbreak). Some key activities are described below.
Legislation
Several pieces of legislation related to the Ebola outbreak, including non-binding resolutions and appropriations bills, were passed by Congress (or in the case of resolutions, by one or more chamber of Congress). For example, in September 2014, the Senate passed a resolution that recognized the outbreak as a “severe threat” to populations, government, and economies across Africa and potentially beyond, and also that month, Congress passed a continuing appropriations resolution that provided continued funding for USG agency efforts, including greater funding for accelerating Ebola research and development activities as well as the USG response to the outbreak.41 Subsequently, in November 2014, President Obama requested $6.18 billion in emergency funding for Ebola.42 Then-Chairwoman of the Senate Appropriations Committee, Senator Barbara A. Mikulski (D-MD) stated at that time, “Ebola, in my mind, meets the criteria for emergency spending. It’s sudden. It’s urgent. It’s unforeseen. And it’s temporary.”43 Shortly thereafter, in December 2014, Congress passed an omnibus appropriations bill that included $5.4 billion in emergency funding for Ebola response and recovery efforts, of which $3.7 billion was specifically designated for international efforts.44 Attention then turned to oversight of this funding, specifically to how agencies planned to spend the funds provided by Congress. As with other USG global health funding, Ebola funding was governed by various spending directives and other congressional guidance, and agencies had to seek congressional approval (through CNs) as their spending plans changed over time.45
Oversight
Congressional efforts to oversee the U.S. government’s response to the West Africa Ebola outbreak were multifaceted and included public hearings, the approval of changes in planned funding allocations across certain agencies, and the engagement of individual members as well as caucuses in a variety of activities. In 2014 alone, five congressional committees (or their subcommittees) convened eight public hearings on the Ebola outbreak, beginning in early August 2014; see Table 3. As the outbreak grew and attention to it increased both within policy circles and in the U.S. more broadly, congressional and public attendance at hearings steadily increased.46 Congress also authorized the repurposing of funds by agencies to respond to the Ebola outbreak, which was accomplished through the CN process when, for example, DoD requested and received congressional approval to spend up to $750 million in previously-appropriated but leftover war funds on its Ebola outbreak response.47 With regard to individual member engagement, various members spoke about Ebola in floor speeches on the House and Senate floors, discussed the need for greater USG resources and an intensified organizational response to the outbreak, and participated in public events that focused on Ebola through caucuses and other organizations.48
Table 3: Congressional Hearings on the West Africa Ebola Outbreak in 2014
“Ebola in West Africa: A Global Challenge and Public Health Threat”
Sept. 17
HFAC subcommittee
“Global Efforts to Fight Ebola”
Oct. 15
House E&C subcommittee
“Examining the U.S. Public Health Response to the Ebola Outbreak”
Nov. 12
Senate Approps.
“ U.S. Government Response: Fighting Ebola and Protecting America”
Nov. 13
HFAC
“Combating Ebola in West Africa: The International Response”
Nov. 18
HFAC subcommittee
“Fighting Ebola: A Ground-Level View”
Dec. 10
SFRC subcommittee
“The Ebola Epidemic: The Keys to Success for the International Response”
Looking Ahead
Congressional engagement has a significant impact on the USG's role in global health. Over the last 20 years alone, bipartisan congressional support for global health has led to expanded U.S. efforts to address global HIV, TB, and malaria, in particular (among other things, such as global health security), including significantly increased funding, and also respond to global health emergencies, such as pandemic influenza, Ebola, Zika, and COVID-19. Congress, through the array of activities carried out by its congressional committees, caucuses, and individual members, has played and will continue to play an important role in shaping and overseeing U.S. global health efforts. Key issues and opportunities going forward include:
educating new and continuing members and staff about USG global health efforts, recent developments, and the role of Congress;
maintaining and strengthening bipartisan support for USG global health programs and funding, given the shifting make-up of Congress over time and in light of current fiscal constraints;
assessing USG support for multilateral engagement, innovative financing mechanisms, and public-private partnerships, given their role in leveraging USG global health funding and resources;
ensuring that the legislative framework for USG global health programs is responsive to an evolving global health environment as well as U.S. interests and considerations; and
providing ongoing oversight, particularly as USG global health efforts are increasingly transitioned to partner countries (i.e., as country ownership is heightened) in order to ensure transparency, accountability, and sustainability in these activities.
Appendices
Appendix A: Key Congressional Committees and Subcommittees Related to Global Health
Table A1: Leadership of Key Congressional Committees and Subcommittees Related to Global Health During the 117th Congress
NOTES: As of Oct. 25, 2021. Chairs and Ranking Members are listed at the top of each listing; they are also indicated in Table A1. In addition to the members identified above, the chair and ranking member of the subcommittee’s respective full committee may also serve as ex officio members of the subcommittee. The Senate Health, Education, Labor, & Pensions (HELP) Committee revamped its subcommittee organization during the 114th Congress to organize around very broad issue areas; since it remains unclear which subcommittee(s) would exercise most jurisdiction over global health issues and since the committee seems to be approaching a number of issues at the full committee level, this table does not include the Senate HELP subcommittees.
Table A3: Members of Selected Key House Subcommittees Related to Global Health During the 117th Congress
Rosa DeLauro (CT)Lucille Roybal-Allard (CA)Barbara Lee (CA)Mark Pocan (WI)Katherine Clark (MA)Lois Frankel (FL)Cheri Bustos (IL)Bonnie Watson Coleman (NJ)Brenda L. Lawrence (MI)Josh Harder (CA)
Tom Cole (OK)Andy Harris (MD)Chuck Fleischmann (TN)Jaime Herrera Beutler (WA)John R. Moolenaar (MI)Ben Cline (VA)
Chris Smith (NJ)Darrell Issa (CA)Greg Steube (FL)Dan Meuser (PA)Young Kim (CA)Ronny Jackson (TX)
NOTES: As of Oct. 25, 2021 Chairs and Ranking Members are listed at the top of each listing; they are also indicated in Table A1. In addition to the members identified above, the chair and ranking member of the subcommittee’s respective full committee may also serve as ex officio members of the subcommittee.
Appendix B: Key Congressional Caucuses Related to Global Health
Table B: Key Congressional Caucuses Related to Global Health During the 117th Congress
NOTES: As of Oct. 25, 2021. A caucus may draw its membership from a single chamber or across both chambers; this table reflects the chamber with which each caucus’ leadership and the majority of its members are associated.
Endnotes
Congressional Research Service (CRS), “Dear Colleague” Letters: Current Practices, RL34636, Nov. 25, 2008. ↩︎
Five non-voting Delegates and one non-voting Resident Commissioner also serve in Congress but are not included in this total. They represent the District of Columbia, Guam, the U.S. Virgin Islands, American Samoa, the Northern Mariana Islands, and Puerto Rico in Congress. ↩︎
KFF, The U.S. Government Engagement in Global Health: A Primer; U.S. Congress: Global AIDS and Tuberculosis Relief Act of 2000 (P.L. 106-264); United States Leadership Against HIV/AIDS, Tuberculosis and Malaria Act of 2003 (P.L. 108-25), Tom Lantos and Henry J. Hyde United States Global Leadership Against HIV/AIDS, Tuberculosis, and Malaria Reauthorization Act of 2008 (P.L. 110-293), PEPFAR Stewardship and Oversight Act of 2013 (P.L. 113-56), and PEPFAR Extension Act of 2018 (P.L. 115-305. ↩︎
Department of Defense Appropriations Act of 1986 (note: effectively authorized the creation of the Military HIV Research Program (MHRP)); Department of Defense Appropriations Act of 2001 (note: effectively authorized the creation of the Defense HIV/AIDS Prevention Program (DHAPP)); KFF, Health in Haiti and the U.S. Government Involvement, fact sheet, Feb. 2010; CRS, FY2010 Supplemental for Wars, Disaster Assistance, Haiti Relief, and Other Programs, Aug. 6, 2010. ↩︎
These two provisions, which were incorporated into the Lantos-Hyde Act, appeared in the Elimination of Neglected Diseases Act of 2005 (S. 950, not enacted). CRS, The President’s Malaria Initiative and Other U.S. Global Efforts to Combat Malaria, R40494, April 6, 2009. ↩︎
U.S. Congress, United States Leadership Against HIV/AIDS, Tuberculosis and Malaria Act of 2003 (P.L. 108-25); CRS, PEPFAR Reauthorization: Key Policy Debates and Changes to U.S. International HIV/AIDS, Tuberculosis, and Malaria Programs and Funding, RL34569, Jan. 29, 2009. ↩︎
U.S. Congress, Tom Lantos and Henry J. Hyde United States Global Leadership Against HIV/AIDS, Tuberculosis, and Malaria Reauthorization Act of 2008 (P.L. 110-293); KFF analysis of data from KFF, U.S. Global Health Budget Tracker, downloaded Nov. 11, 2015. ↩︎
CRS, Introduction to the Federal Budget Process, Report 98-721. ↩︎
U.S. Congress: Supplemental Appropriations Act, 2009 (P.L. 111-32); Supplemental Appropriations Act, 2010 (P.L. 111-212); Consolidated and Further Continuing Appropriations Act, 2015 (P.L. 113-235); Continuing Appropriations and Military Construction, Veterans Affairs, and Related Agencies Appropriations Act, 2017, and Zika Response and Preparedness Act (P.L. 114-223); Coronavirus Preparedness and Response Supplemental Appropriations Act (P.L. 116-123); Coronavirus Aid, Relief, and Economic Security (CARES) Act (P.L. 116-136); Coronavirus Response and Relief Supplemental Appropriations Act, 2021 (P.L. 116-260); American Rescue Plan Act of 2021 (P.L. 117-2). See also KFF, Global Funding Across U.S. COVID-19 Supplemental Funding Bills. ↩︎
U.S. Congress, Consolidated Appropriations Act, 2021 (P.L. 116-260). ↩︎
These may also be referred to as House, Senate, or Conference Reports. U.S. Government Publishing Office, “Congressional Reports,” webpage, https://www.govinfo.gov/app/collection/CRPT/. ↩︎
CRS, The President’s Malaria Initiative and Other U.S. Global Efforts to Combat Malaria, R40494, April 6, 2009. ↩︎
The most recent iterations of these reports are: Department of State/Office of the Global AIDS Coordinator, PEPFAR 2021 Annual Report to Congress, 2021; USAID, USAID Report to Congress on Health-Related Research and Development for Fiscal Year 2019, 2020. ↩︎
The requirements for congressional notification vary based on the type of request, the funding involved, its governing legislation, the committee of jurisdiction, and the requesting agency/department. When congressional notification (CN) is required, a member who has concerns or additional questions about a congressional notification’s reprogramming or transfer request may place a hold on approval of the CN through the committee, which effectively instructs the requesting agency to take no further action with regard to the specified funds until further information is provided to the committee and the hold is lifted. Although such holds do not have the force of law, the use of holds is part of an informal “understanding between congressional committees and agencies under their jurisdiction.” See CRS, The Executive Budget Process: An Overview, R42633, July 27, 2012, and CRS, The Congressional Appropriations Process: An Introduction, R42388, Nov. 14, 2014, for more information about the congressional notification process as well as the reallocation of budget authority through transfers (“a shift of budget resources from one appropriations account to another”) and reprogramming (“a shift of budgetary resources from one project or purpose to another within an appropriations account”). ↩︎
CRS: Counting Regulations: An Overview of Rulemaking, Types of Federal Regulations, and Pages in the Federal Register, R43056, July 14, 2015; Congressional Review of Agency Rulemaking: An Update and Assessment of The Congressional Review Act after a Decade, RL30116, updated May 8, 2008; Disapproval of Regulations by Congress: Procedure Under the Congressional Review Act, RL31160, Oct. 10, 2001. ↩︎
CRS, Congressional Oversight: An Overview, R41079, Feb. 22, 2010. ↩︎
U.S. House of Representatives, Strengthening Disease Surveillance, House Report 109-436, April 25, 2006. ↩︎
CRS, Treaties and Other International Agreements: The Role of the United States Senate, A study prepared for the Committee on Foreign Relations, United States Senate, January 2001. ↩︎
See also CRS, Senate Consideration of Presidential Nominations: Committee and Floor Procedure, RL31980; CRS, Appointment and Confirmation of Executive Branch Leadership: An Overview, R44083, June 22, 2015. ↩︎
Sarah Ferris, “Timeline of Ebola outbreak,” The Hill, Oct. 2, 2014, http://thehill.com/policy/healthcare/219528-ebola-outbreak. The first cases of Ebola Virus Disease occurred in December 2013 in Guinea, a small country in Africa, but these, along with the growing number of cases spreading through the area, were not identified as Ebola until March 2014. Shortly thereafter, a neighboring country, Liberia, reported its first two cases, and there were early reports of possible Ebola cases in Sierra Leone. Reuters, “The Timeline of the Worst Ebola Outbreak Ever,” Oct. 18, 2014, http://www.newsweek.com/timeline-worst-ebola-outbreak-ever-276284. ↩︎
U.S. Senate, S.Res. 541; U.S. Congress, Continuing Appropriations Resolution, 2015 (P.L. 113-164). ↩︎
Statement of Senator Barbara Mikulski during Senate Appropriations Committee hearing, “U.S. Government Response: Fighting Ebola and Protecting America,” Nov. 12, 2014. ↩︎
HFAC, “Combatting the Ebola Threat,” subcommittee hearing, Aug. 7, 2014; Senate HELP and Appropriations Committees, “Ebola in West Africa: A Global Challenge and Public Health Threat,” joint committee hearing, Sept. 16, 2014; HFAC, “Global Efforts to Fight Ebola,” subcommittee hearing, Sept. 17, 2014; House E&C Committee, “Examining the U.S. Public Health Response to the Ebola Outbreak,” subcommittee hearing, Oct. 16, 2014. ↩︎
Approval of these reprogramming/transfer requests allowed DoD to transfer these funds from the Overseas Contingency Operations account and other accounts to the Overseas Humanitarian, Disaster, and Civic Assistance (OHDACA) account and to reprogram other funds in support of related efforts in Ebola-affected countries. In this case, several members in both chambers placed “holds” on their approval of requested funds, in effect instructing DoD to not take further action with the specified funds until their additional questions were answered and other requirements were fulfilled. House Armed Services Committee (HASC), “HASC Update: DOD Response to the Ebola Outbreak in West Africa,” fact sheet, Oct. 9, 2014; Kristina Wong, “House approves $750M in Ebola funding held up in Senate panel,” The Hill, Oct. 9, 2014; Office of Senator James Inhofe, “Inhofe Approves Reprogramming Request for Ebola Response Effort,” press release, Oct. 10, 2014; Kristina Wong, “Inhofe gives approval for $750M in Ebola funds,” The Hill, Oct. 10, 2014; CRS, “Increased Department of Defense Role in U.S. Ebola Response,” IN10152, Oct. 10, 2014; CRS, FY2015 Budget Requests to Counter Ebola and the Islamic State (IS), R43807, Dec. 9, 2014; White House, “U.S. Response to the Ebola Outbreak in West Africa,” fact sheet, Sept. 16, 2014. ↩︎
For example, Senator Patrick Leahy, “The Ebola Crisis,” floor speech, Congressional Record, 113th Congress, 2nd Session, Vol. 160, No. 130: Daily Edition S5550-1, Sept. 11, 2014; Rep. Mike Kelly, “Keeping America Safe From Ebola,” floor speech, Congressional Record, 113th Congress, 2nd Session, Vol. 160, No. 143: Daily Edition H8149-50, Nov. 20, 2014; Reps. Henry Waxman, Frank Pallone, and Diana DeGette, “Letter to Reps. Fred Upton, Joe Pitts, and Tim Murphy about Key Questions on Ebola Outbreak,” correspondence, Oct. 1, 2014; Reps. Betty McCollum and Dave Reichert, “Global Health Caucus invites you to a briefing on the ‘Global Health response to Ebola’,” Dear Colleague letter, Nov. 13, 2014. ↩︎
HFAC Subcommittee on Africa, Global Health, Global Human Rights, and International Organizations, “Combatting the Ebola Threat,” subcommittee hearing, Aug. 7, 2014; Senate HELP and Appropriations Committees, “Ebola in West Africa: A Global Challenge and Public Health Threat,” joint full committee hearing, Sept. 16, 2014; HFAC Subcommittee on Africa, Global Health, Global Human Rights, and International Organizations, “Global Efforts to Fight Ebola,” subcommittee hearing, Sept. 17, 2014; House E&C Committee’s Subcommittee on Oversight and Investigations, “Examining the U.S. Public Health Response to the Ebola Outbreak,” subcommittee hearing, Oct. 16, 2014; Senate Appropriations Committee, “U.S. Government Response: Fighting Ebola and Protecting America,” full committee hearing, Nov. 12, 2014; HFAC, “Combating Ebola in West Africa: The International Response,” full committee hearing, Nov. 13. 2014; HFAC Subcommittee on Africa, Global Health, Global Human Rights, and International Organizations, “Fighting Ebola: A Ground-Level View,” subcommittee hearing, Nov. 18, 2014; SFRC Subcommittee on African Affairs, “The Ebola Epidemic: The Keys to Success for the International Response,” Dec. 10, 2014. ↩︎
While current federal debate over policies to extend health insurance coverage to the remaining uninsured are largely focused on the 2.2 million people in the coverage gap and extension of increased premium help under the Affordable Care Act (ACA), which primarily benefit adults, many children (4.3 million1 ) in the US were uninsured in 2020. Further, the number of uninsured children has been increasing in recent years: after steadily declining in the years prior, the uninsured rate for children increased significantly from 2016 to 2020, growing by 0.7 percentage points or over 450,000 children.2 Most of the changes during this period occurred from 2016 to 2018, with the overall children’s uninsured rate remaining stable from 2018 to 2020. The vast majority of uninsured children are already eligible for Medicaid or CHIP, so policy action to extend children’s coverage largely focuses on enrollment and retention. Outreach to inform children and families about Medicaid/CHIP coverage may facilitate child enrollment, and continuous eligibility requirements for Medicaid/CHIP could prevent loss of coverage. Research also shows that expanding coverage for adults in households with children also can increase children’s coverage, so recent federal efforts to extend coverage for adults in the coverage gap could have spillover effects for children’s coverage.
This brief examines characteristics of uninsured children in 2020 and discusses how current policy proposals, including outreach efforts, continuous eligibility requirements, and closing the coverage gap, could affect children’s health coverage. Recent efforts to expand coverage for adults could benefit children’s coverage, especially for children in non-expansion states if the coverage gap is filled as proposed by the Build Back Better Act (BBBA).
What do we know about uninsured children?
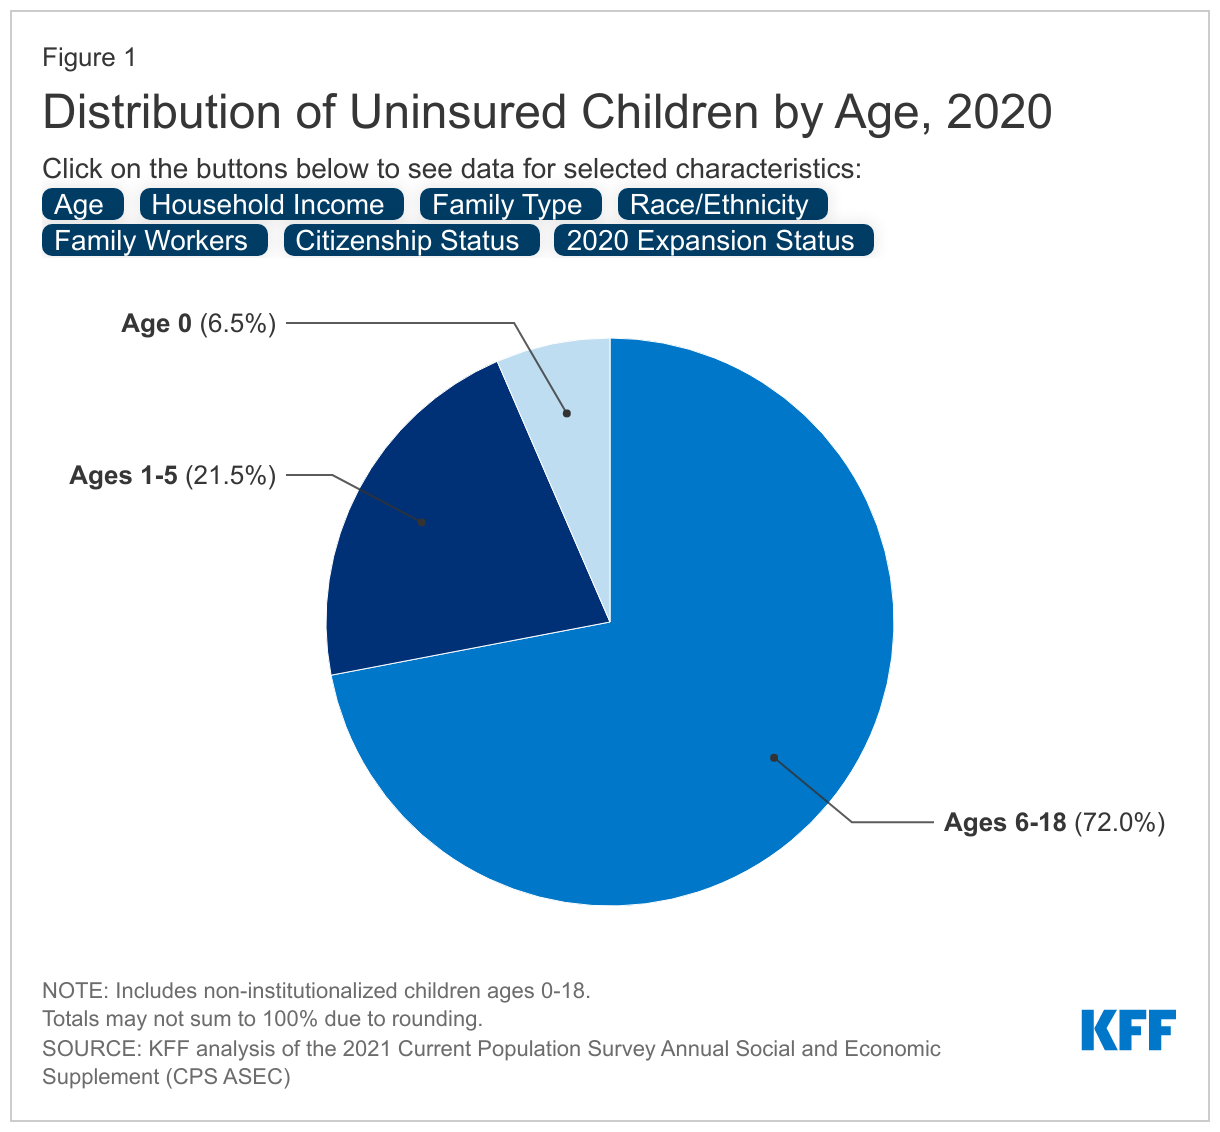
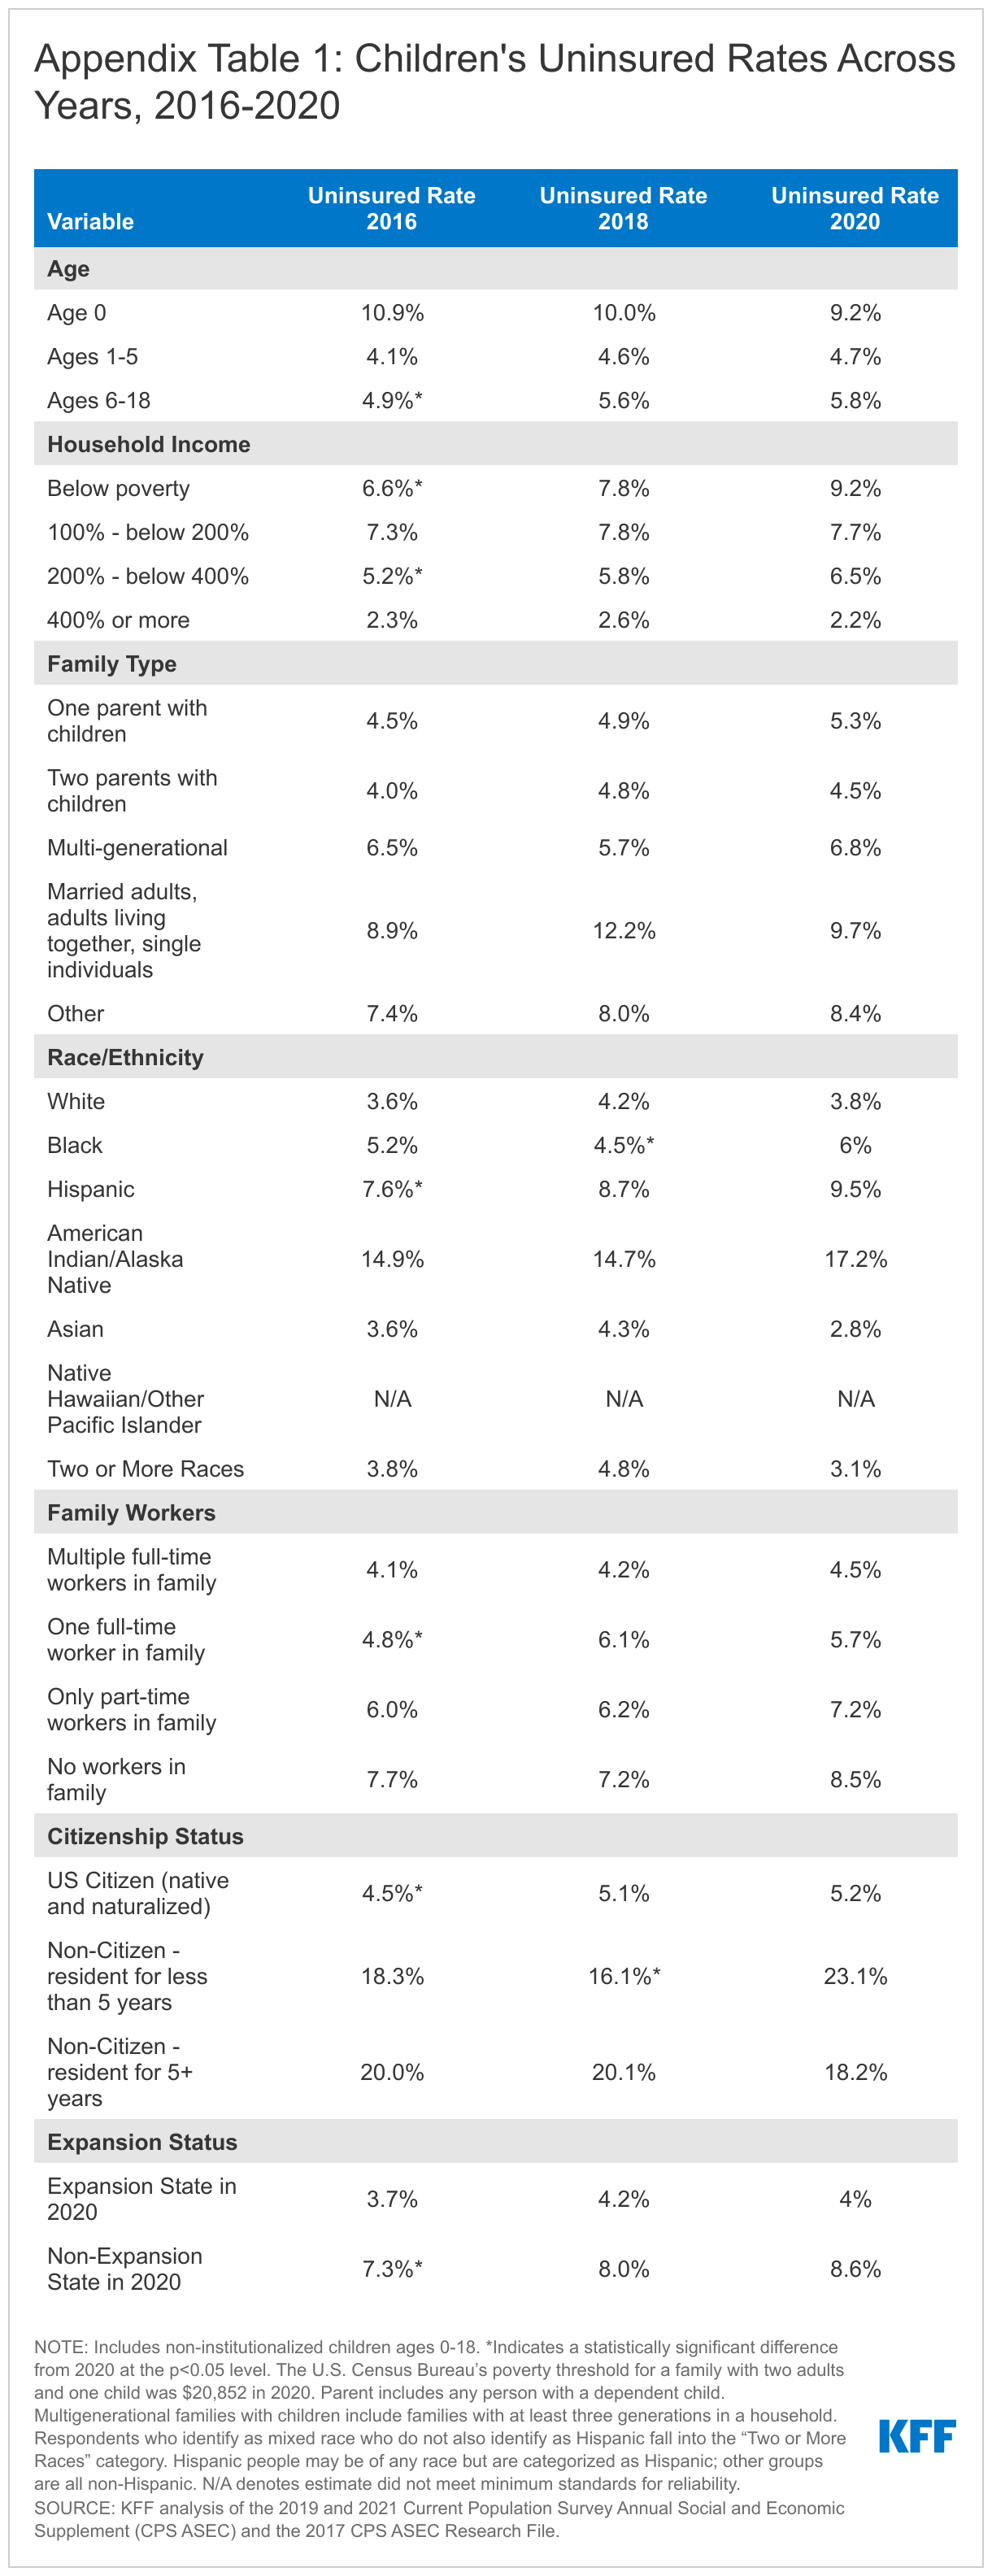
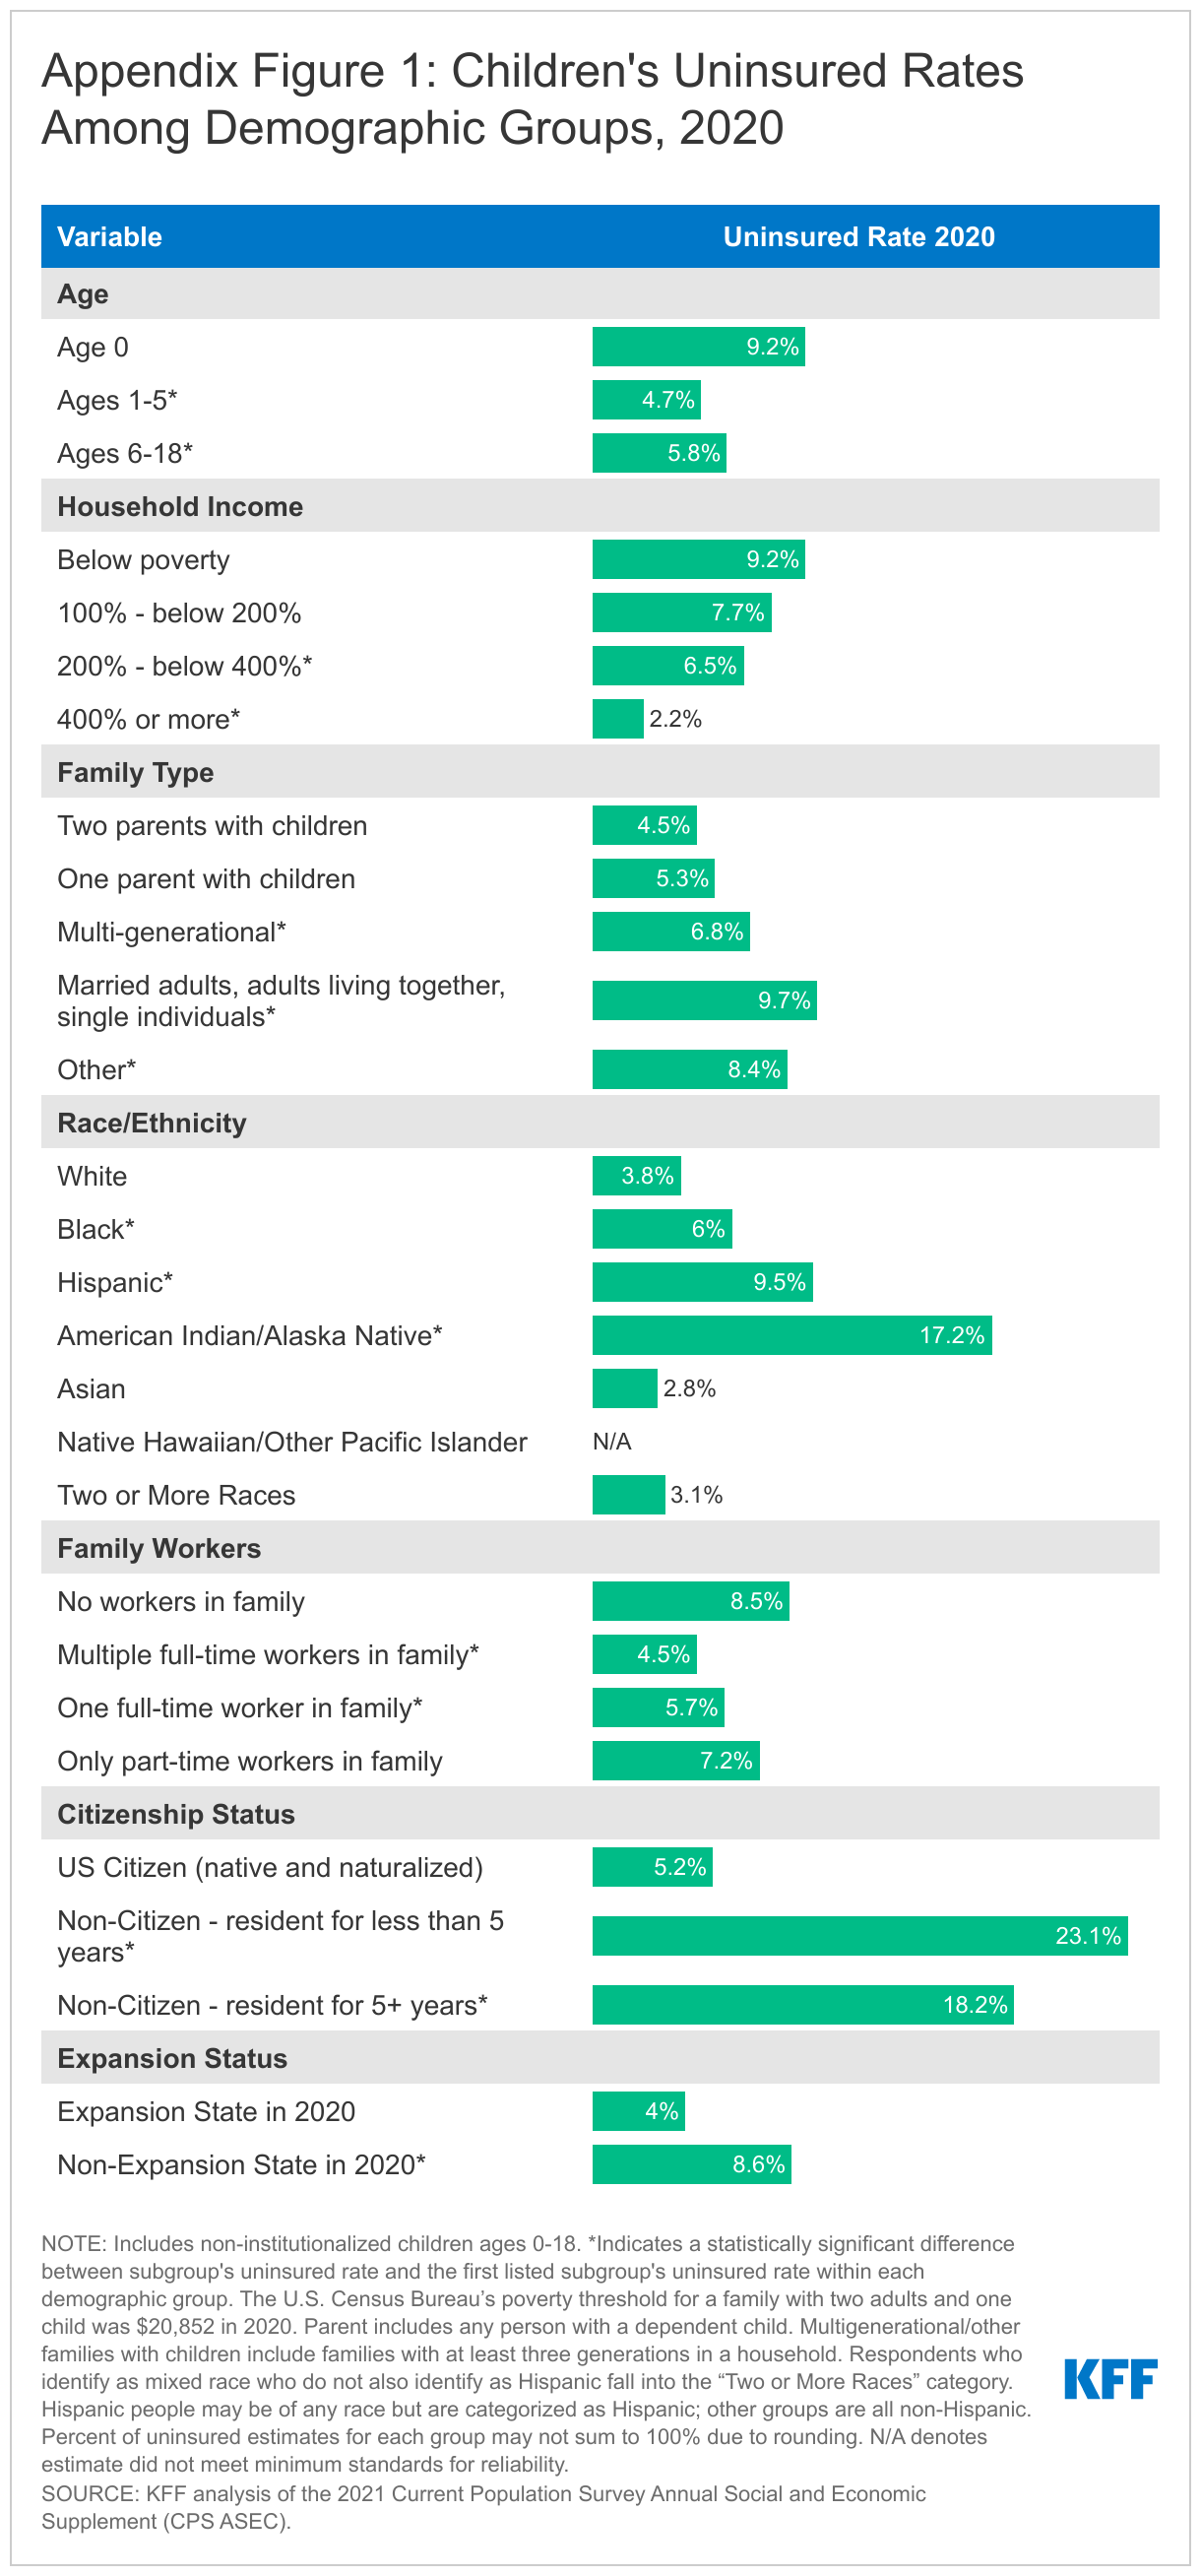
Most uninsured children in the US are school-aged, live in one or two parent families, and are US citizens (Figure 1). School-aged children (ages 6-18) make up almost three-quarters of uninsured children in the US; however, the children’s uninsured rate, or percentage of children with no health coverage, among infants was higher than the uninsured rate for children ages 1-5 and school aged children (Figure 1 and Appendix Figure 1). A majority of uninsured children live in one or two parent families (60.6%), and children in two parent families are less likely to be uninsured than those in multi-generational families, married adults, adults living together, single individual families, and other family types. Though US citizens make up the vast majority (89.7%) of uninsured children, they are less at risk of being uninsured than children who are not US citizens. While the children’s uninsured rate overall and for most demographic groups held steady in recent years, children who are not citizens and have been US residents for less than 5 years did experience significant increases in their uninsured rates from 2018 to 2020 (Appendix Table 1).
Children of color are disproportionately uninsured. Hispanic children make up the largest share (43.0%) of uninsured children (Figure 1). Children of color, together, make up nearly two-thirds of all uninsured children, but only make up 50.5% of all children in the US. Further, Black, Hispanic, and American Indian/Alaska Native children are more likely to be uninsured compared to white children (Appendix Figure 1). Black children experienced significant increases in their uninsured rates from 2018 to 2020 despite stability in the overall children’s uninsured rate (Appendix Table 1).
Children in poverty are more likely to be uninsured and make up a disproportionate share of uninsured children. Children living below 100% of the Federal Poverty Level (FPL; the federal poverty level was $20,852 for a family of two adults and a child in 2020) make up over a quarter of uninsured children, but account for only 16.5% of children in the US (Figure 1). The majority (53.5%) of uninsured children live below 200% FPL, and the vast majority (86.2%) live below 400% FPL. Children living below poverty are more likely to be uninsured compared to children living between 200 – 400% FPL and over 400% FPL (Appendix Figure 1). Further, children with no workers in their family are at more risk of being uninsured than those children with multiple workers or one full-time worker in their family. However, the vast majority (77.9%) of uninsured children have at least one full-time worker in their family, highlighting that many children live in families with lower income workers who likely do not obtain health coverage through their employer.
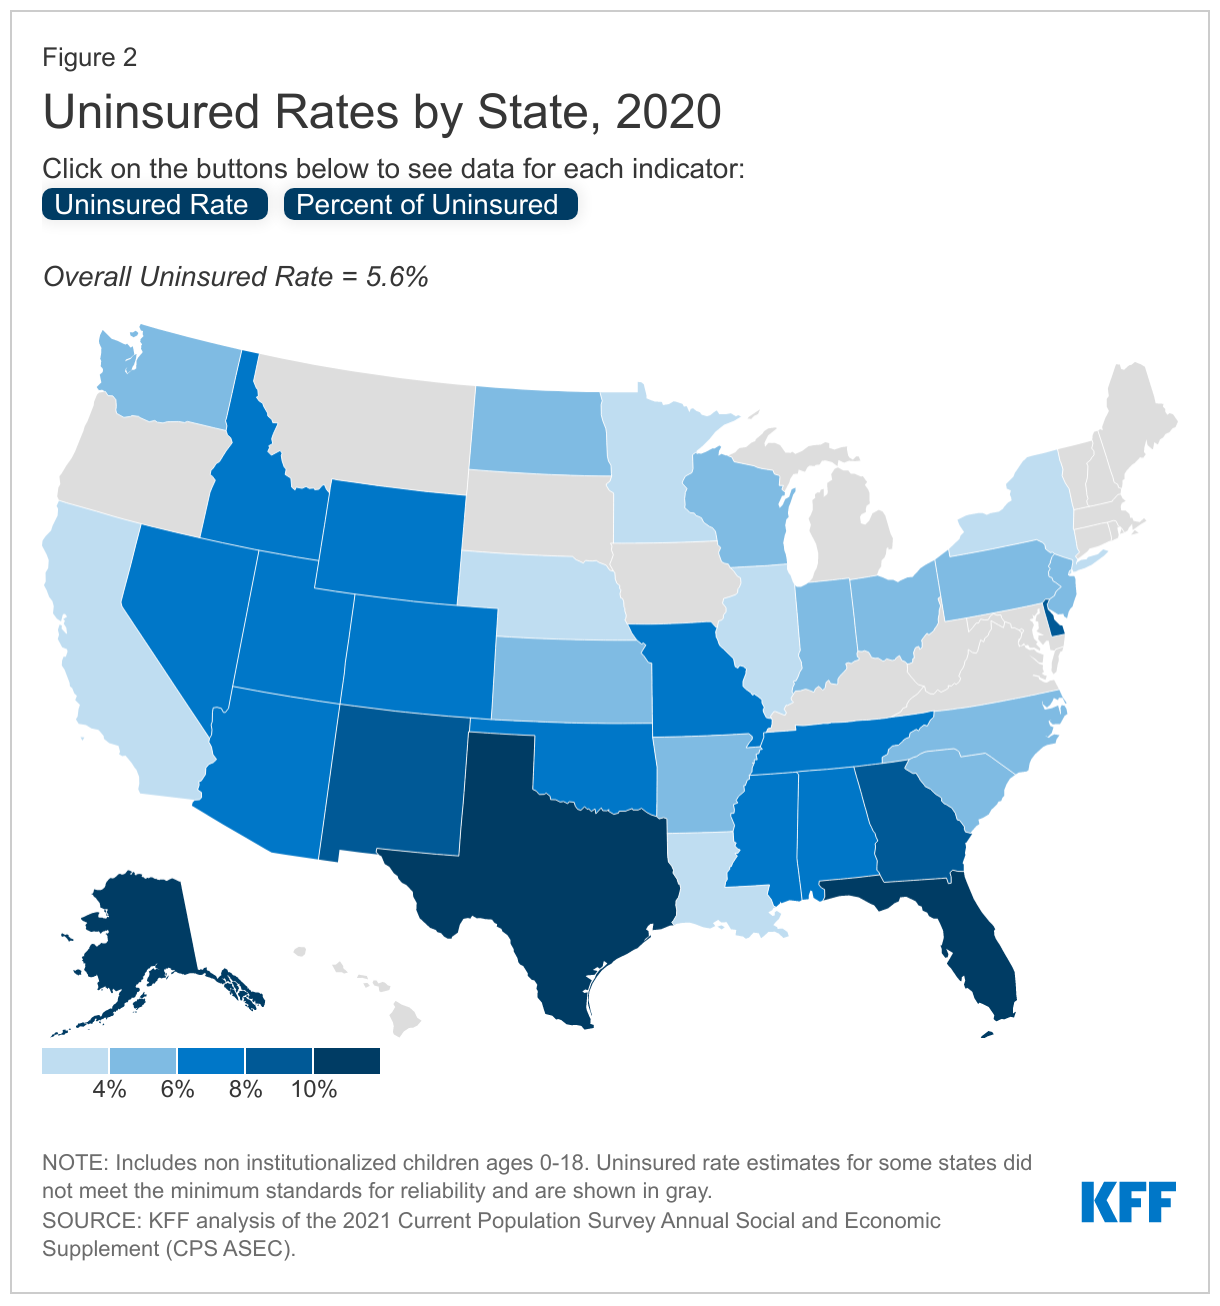
The uninsured rates for children in 2020 varied across states, ranging from 2.3% of children in New York to 12.0% in Alaska (though estimates for some states were not reportable) (Figure 2). Texas and Florida have the largest number of uninsured children, together accounting for almost one third (20.6% in Texas and 10.7% in Florida) of all uninsured children in the US (Figure 2).
How could current policy proposals reach uninsured children?
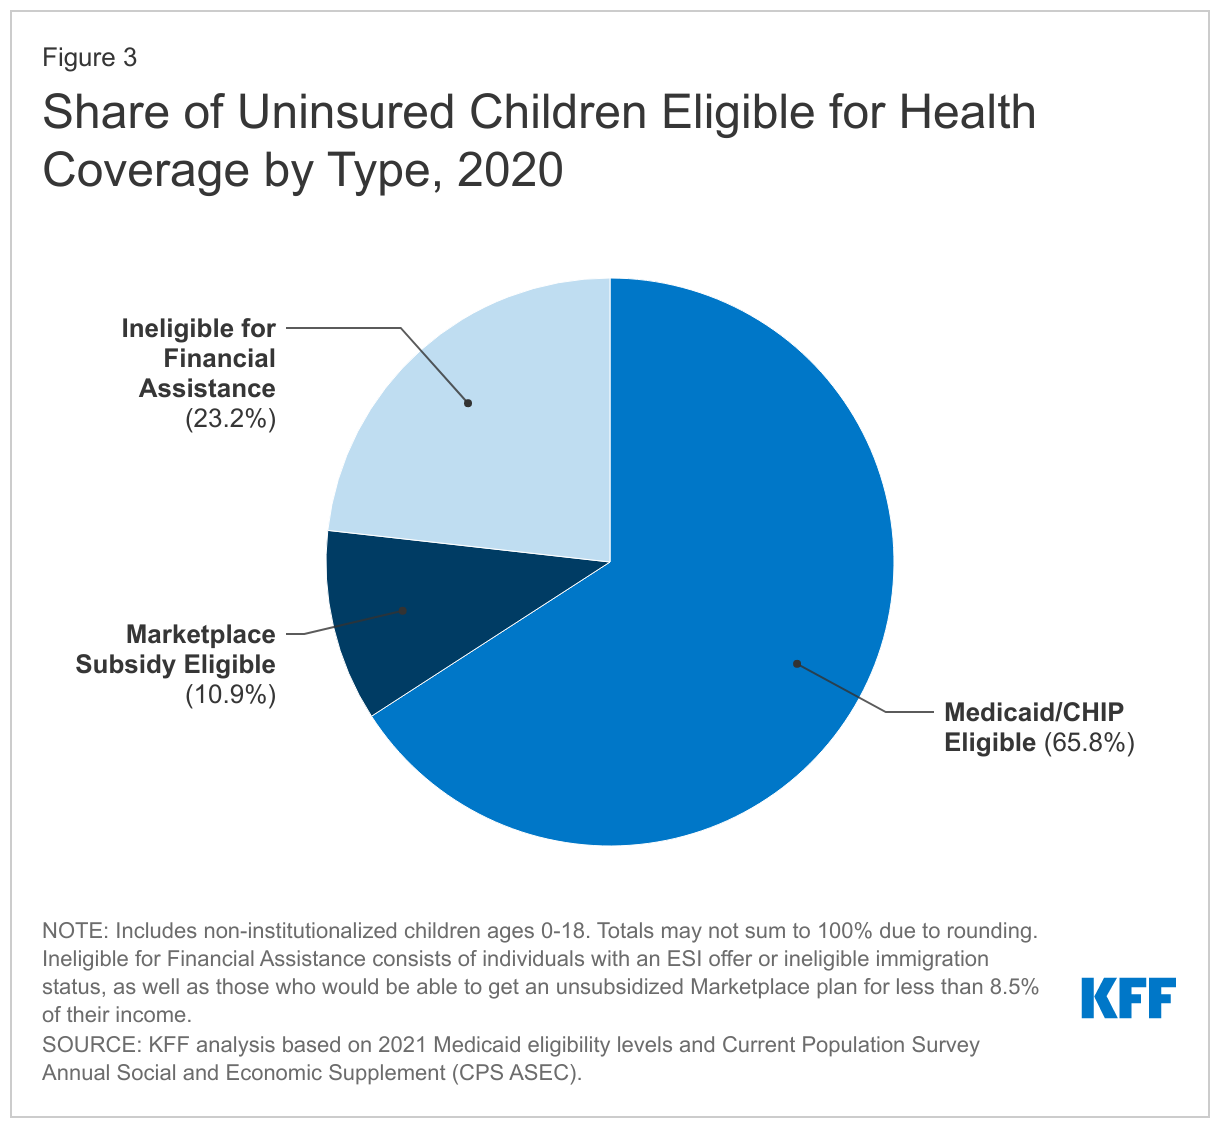
Outreach may improve children’s coverage rates since the vast majority of uninsured children are eligible for Medicaid or subsidized Marketplace coverage. In general, nearly all low-income children in the US are eligible for Medicaid/CHIP, with 49 states covering children at or above 200% FPL and more than a third of states covering children at or above 300% FPL. Two-thirds of all uninsured children are eligible for Medicaid/CHIP, and another 10.9% are eligible for subsidized Marketplace coverage (including those eligible under subsidies available under the American Rescue Plan Act) (Figure 3). Most remaining uninsured children are not eligible for financial assistance for coverage because their family has access to employer-based coverage. Children eligible for coverage may still be uninsured for several reasons including administrative barriers, language barriers and lack of internet access, lack of program knowledge and inadequate outreach, among others. Outreach can connect children to Medicaid/CHIP coverage, with outreach efforts following the implementation of the ACA contributing to children’s coverage gains leading up to 2016 even though the ACA did not materially increase children's eligibility for coverage. The current BBBA budget reconciliation package proposes funding for outreach and enrollment efforts through 2025 to inform individuals of their coverage options. The Biden Administration also recently extended the open enrollment period by 30 days, provided additional funding for Federally-facilitated Marketplace (FFM) Navigators, and re-launched the “Champions for Coverage” initiative in efforts to expand access to health coverage.
Closing the coverage gap could also affect the number of uninsured children. Children living in one of the 12 states that have not expanded Medicaid to adults under the ACA (non-expansion states) were over two times as likely to be uninsured as children in expansion states in 2020 (Appendix Figure 1). The uninsured rate increased significantly by 1.3 percentage points from 2016 to 2020 for children living in non-expansion states, while the uninsured rate held steady for children in expansion states (Appendix Table 1). Uninsured children are disproportionately concentrated in non-expansion states: only 35.2% of US children live a non-expansion state, but a majority of uninsured children (53.8%) live in non-expansion states (Figure 1).
Studies show a link between expanding parent Medicaid eligibility and growth in children’s health coverage.3,4,5,6 While research shows that children are more likely to gain and maintain coverage when parents gain access to the same coverage program, parents also say that affordability is the most important factor they care about in their children’s coverage, and they would be willing to enroll them in separate coverage for a lower cost. Following the implementation of the ACA, expansion states saw growth in children’s health coverage rates even though eligibility for children did not expand. One study estimates 710,000 low-income children gained coverage post ACA implementation and an additional 200,000 children would have gained coverage if all states had expanded Medicaid. Uninsured children are disproportionately concentrated in non-expansion states; thus, expanding access to health coverage to adults in the coverage gap could increase coverage for children.
The current version of the BBBA seeks to temporarily close the coverage gap by allowing people living in states that have not expanded Medicaid to purchase subsidized coverage on the ACA Marketplace through 2025. The proposal also extends provisions in the American Rescue Plan Act (ARPA) passed earlier this year that provide additional financial assistance for low-income people purchasing Marketplace plans through 2025. Parents in the coverage gap seeking Marketplace coverage through the “no wrong door” application process could enroll their eligible children in Medicaid/CHIP coverage. Additionally, there are provisions in the BBBA to increase in the federal Medicaid match rate for the expansion population (from 90% to 93%) through 2025 on top of already passed fiscal incentives in the ARPA. This could discourage states that have already expanded Medicaid from dropping, and could encourage new states to implement Medicaid expansion, particularly after the temporary effort to close the coverage gap expires.
Continuous eligibility for children in Medicaid/CHIP reduces gaps in health coverage. States currently have the option to provide 12 months of continuous coverage, and as of January 2020, 31 states provide 12-month continuous eligibility to children in Medicaid/CHIP. The BBBA includes a requirement for all states to provide 12-months of continuous coverage for children with Medicaid/CHIP, which would allow children to remain enrolled for a full year unless the child withdraws, moves, or turns 19. This provision could reduce children’s health coverage disruptions, which children of color are more likely to experience, and may reduce the number of uninsured children.
Looking Ahead
As congress continues to debate the BBBA, it is uncertain when an agreement will be reached and what provisions impacting children’s health coverage will remain in the final bill. If passed with current provisions, the bill has the potential to improve children’s health coverage.
As COVID-19 vaccines are rolled out for young children, linking children to coverage may be a step in helping children access vaccines. While the vaccine is available at no cost irrespective of insurance status, research shows uninsured children have lower vaccination coverage generally, potentially stemming from difficulties with access to care, information, or transportation. More broadly, children who lack insurance coverage have worse access to health care and face long-term consequences for their health and development. Given the range of challenges children have faced during the pandemic, actions to extend health insurance coverage to those lacking it may address some of the negative consequences.
Methods
This analysis uses data from the 2019 and 2021 Current Population Survey Annual Social and Economic Supplement (CPS ASEC) and the 2017 CPS ASEC Research File. Due to known data quality issues with the 2019 CPS ASEC data, which was collected at the onset of the pandemic in March 2020 and experienced low response rates, we do not to report the 2019 data. We provide trend data for 2016, 2018, and 2020 using the CPS ASEC. Estimates that do not meet the minimum standards for reliability are not shown.
There have been discussions around the inconsistencies between Medicaid administrative data and the CPS insurance coverage estimates for those with Medicaid/CHIP. Medicaid enrollment increases observed in administrative data in recent years are not mirrored in the CPS estimates. Some of the discrepancies may be related to the way in which the survey counts uninsured people or to ongoing challenges with response rates. The CPS counts people as uninsured only if they lack coverage for the full year and thus does not capture those who may have lost insurance during the year.
Appendix
Endnotes
KFF analysis of the 2021 Current Population Survey Annual Social and Economic Supplement (CPS ASEC). ↩︎
KFF analysis of the 2021 Current Population Survey Annual Social and Economic Supplement (CPS ASEC). ↩︎
Adam Sacarny, Katherine Baicker, and Amy Finkelstein, “Out of the Woodwork: Enrollment Spillovers in the Oregon Health Insurance Experiment”, National Bureau of Economic Research, No. w26871 (March 2020), https://www.nber.org/system/files/working_papers/w26871/w26871.pdf. ↩︎
Lisa Dubay and Genevieve Kenney, “Expanding Public Health Insurance to Parents: Effects on Children's Coverage under Medicaid”, Health Services Research: 38,5 (2003): 1283–1301. https://doi.org/10.1111/1475-6773.00177. ↩︎
Jennifer Devoe, Miguel Marino, Heather Angier, et al., “Effect of Expanding Medicaid for Parents on Children’s Health Insurance Coverage: Lessons From the Oregon Experiment”, JAMA Pediatrics, 169,1 (2015). https://doi:10.1001/jamapediatrics.2014.3145. ↩︎
Efforts to address the pandemic remain challenged by widespread misinformation about COVID-19 and vaccines, especially among unvaccinated adults. We report in the latest Vaccine Monitor that unvaccinated adults and Republicans are much more likely to believe or be unsure about false information on COVID-19 when compared to vaccinated adults and Democrats.
We examined which news sources unvaccinated people trust on COVID-19 information. Vaccinated adults are at least twice as likely as unvaccinated adults to say they trust mainstream news sources like local and network TV stations, CNN, MSNBC and NPR for COVID-19 information. And while the unvaccinated are at least as likely as the vaccinated to trust conservative news sources (Fox News, Newsmax, and One America News), the share who trust those sources is relatively low across the board.
The upshot is that across eight news sources tested, fewer than a third of unvaccinated adults trust any of them for information on COVID-19. This, along with the increased political polarization of the public’s trusted news sources in recent years, underscores a huge barrier health officials face in reaching the unvaccinated with reliable information on the pandemic.
Benefits such as sick leave and paid family and medical leave can help workers meet their personal and family health care needs with greater financial security. This issue has gained new urgency during the COVID-19 pandemic as workers needed time off work to recover from the virus and to care for children and other family members who had fallen ill.
Unlike all other wealthy countries, the U.S. does not have a national paid leave mandate. The federal Family and Medical Leave Act (FMLA) requires some employers to provide job-protected, unpaid time off to eligible employees for family caregiving and medical leave, but just over half (56%) of the workforce is eligible. According to the Bureau of Labor Statistics (BLS), eight in ten workers (79%) have access to paid sick leave through their employer and less than one in four (23%) workers have access to paid family leave. Data on the share of workers with access to paid medical leave for a longer, serious illness are limited, although BLS also estimates that 40% of workers have access to short-term disability insurance.
As a result of the COVID-19 pandemic, some employers announced changes to their paid leave policies to ensure more workers have access to paid leave and to reduce the risk of workers coming to work sick. This data note presents findings from the 2021 KFF Employer Health Benefits Survey1 on the share of workers who are employed by firms that began offering or expanded their paid leave benefits since the COVID-19 pandemic began.2
Paid Sick Leave: Paid sick leave can be used to recover from a short-term injury or illness such as a cold or for doctor’s appointments. It is often provided on an accrual basis up to a set number of hours or days per year, such as one hour of leave earned for every 30 hours worked up to seven days per year, and replaces 100% of the worker’s regular wages. The average duration of paid sick leave private sector workers are provided is seven days per year. Paid sick leave benefits are paid by the employer.
Paid Family and Medical Leave: Paid family and medical leave typically provides a set number of weeks or months to be used for a worker’s own serious, longer-term health condition, to care for a family member with a serious health condition or to care for or bond with a new child, and for reasons related to a family’s member’s military service. On average, it provides six to twelve weeks of fully or partially paid leave per year, without the need for accrual. Paid family and medical leave may be insured and is often funded by payroll contributions from the employer and/or the worker.
Findings
In total, nearly four in ten workers are employed at a firm that began offering paid leave during the pandemic or expanded their existing paid leave benefits.
Thirty-seven percent (37%) of workers work at a firm that began offering paid sick leave or paid family and medical leave for the first time or expanded or enhanced those benefits since the COVID-19 pandemic began (Figure 1). This includes 31% of workers at firms that began offering or expanded paid sick leave and 17% of workers at firms that began offering or expanded paid family and medical leave. One percent (1%) of workers are employed at a firm that reduced or eliminated either of their paid leave benefits.
Looking at these changes separately, 4% of workers work at a firm that began offering paid sick leave for the first time since the COVID-19 pandemic began and 27% of workers work at a firm that expanded or enhanced their existing paid sick leave benefit. One percent (1%) of workers are employed at a firm that either reduced or eliminated their paid sick leave benefit.
Three percent (3%) of workers work at a firm that began offering paid family and medical leave for the first time since the COVID-19 pandemic began and 14% work at a firm that expanded or enhanced their existing paid family and medical leave benefit. Fewer than 1% of workers are employed at a firm that either reduced or eliminated their paid family and medical leave benefit.
These shares vary based on firm characteristics. For paid sick leave, workers at small firms (3-199 workers) are more likely than workers at large firms (200 or more workers) to work at a firm that began offering paid sick leave for the first time (6% vs. 2%) (Figure 2). Workers at large firms are more likely to be at a firm that expanded upon their existing paid sick leave benefits (31% vs. 18%). Similarly, workers at firms with few lower-wage workers3 are more likely to work at a firm that began offering paid sick leave for the first time than workers at firms with many lower-wage workers (3% vs. 7%).
Figure 2: 3 in 10 workers work at a firm that began offering or expanded paid sick leave benefits during the COVID-19 pandemic
There is also variation by firm characteristics for paid family and medical leave. For example, workers at small firms are more likely than workers at large firms to work at a firm that began offering paid family and medical leave for the first time (5% vs. 1%) (Figure 3). Workers at large firms are also more likely to be at a firm that expanded upon their existing paid family and medical leave benefits (17% vs. 10%). Similarly, workers at firms with few lower-wage workers are more likely to work at a firm that expanded or enhanced their paid family and medical leave benefits than workers at firms with many lower-wage workers (16% vs. 7%).
Figure 3: Nearly 2 in 10 workers work at a firm that began offering or expanded their paid family and medical leave benefits during the COVID-19 pandemic
In general, workers at small firms are more likely to be employed by a firm that began offering paid leave benefits during the pandemic and those at larger firms are more likely to work at a firm that expanded upon their existing paid leave benefits. These findings reflect priorresearch indicating that paid leave benefits were already more common among larger firms and less common among smaller firms.
Discussion
The COVID-19 pandemic added new urgency to the importance of paid leave. In 2020, the Families First Coronavirus Response Act (FFCRA) temporarily required employers with fewer than 500 workers and all public employers to provide up to two weeks of fully-paid sick leave to workers unable to work due to their own quarantine or symptoms of coronavirus and up to two weeks of partially paid leave to workers who needed time off work to care for someone in quarantine. Those mandatory benefits expired at the end of 2020. (Note that our survey asked changes firms made to regular paid leave benefits; not the temporary FFCRA paid leave benefits.)
Paid leave continues to garner national attention among both the public and policymakers. The 117th Congress continues to debate including a universal paid family and medical leave program as part of the Build Back Better Act. House Democrats initially proposed 12 weeks of paid leave annually for all workers in the U.S. that may be taken to recover from a serious illness, care for a seriously ill family member, and welcome a new child. The proposal currently being debated was reduced to four weeks of paid leave. Whether this proposal becomes enacted remains uncertain. Without congressional action, the availability and generosity of paid leave will continue to depend on decisions made by employers and by state and local policymakers.
While many employers have responded to the need for paid leave during the pandemic, it is unclear whether they will ultimately sustain, continue to strengthen, or scale back these new or enhanced benefits after the pandemic subsides.
Methodology
The annual KFF Employer Health Benefits Survey (EHBS) for 2021 was conducted between January and July of 2021, and included almost 1,700 randomly selected, non-federal public and private firms with three or more employees. The full EHBS, including a detailed methodology section, is available at ehbs.kff.org.
We asked respondents about changes4 to their paid leave benefits they made during the COVID-19 pandemic, beginning in January 2020, that were in effect at the time of the interview. Paid leave programs included a firm’s regular paid sick leave and paid family and medical leave programs, not those made temporarily available during the pandemic. Family medical leave only included paid leave benefits and not an employer’s unpaid leave obligations under FMLA. This survey is unable to separate the robustness of paid leave benefits including whether a firm offered benefits prior to the pandemic or whether changes made to paid leave benefits were already planned prior to the start of the pandemic.
The 2021 KFF Employer Health Benefits Survey report will be published on November 10, 2021, at ehbs.kff.org. ↩︎
Our survey asked firms about changes they made to regular paid leave benefits; not the temporary, federal COVID-19 emergency paid leave program that expired at the end of 2020. ↩︎
Firms with few lower-wage workers are those where at least 35% earn the 25th percentile or less of national earnings ($28,000 in 2021). Firms with many higher-wage workers are those where at least 35% earn the 75th percentile or more of national earnings ($66,000 in 2021). ↩︎
Question wording: Since the COVID-19 pandemic began, has your firm changed its [paid sick leave benefit] [paid family and medical leave] by offering the benefit for the first time, expanding or enhancing this benefit, keeping this benefit the same, reducing this benefit, not applicable/firm doesn’t offer any workers [paid sick leave benefit] [paid family and medical leave], or don’t know. ↩︎
This annual survey of employers provides a detailed look at trends in employer-sponsored health coverage, including premiums, employee contributions, cost-sharing provisions, offer rates, wellness programs, and employer practices. The 2021 survey included 1,686 interviews with non-federal public and private firms.
Annual premiums for employer-sponsored family health coverage reached $22,221 this year, up 4% from last year, with workers on average paying $5,969 toward the cost of their coverage. The average deductible among covered workers in a plan with a general annual deductible is $1,669 for single coverage. Fifty-eight percent of small firms and 99% of large firms offer health benefits to at least some of their workers, with an overall offer rate of 59%. This year’s report also looks at changes employers made to their health benefits due to the COVID-19 pandemic.
Survey results are released in several formats, including a full report with downloadable tables on a variety of topics, a summary of findings, and an article published in the journal Health Affairs.
NEWS RELEASE
A news release announcing the publication of the 2021 Employer Health Benefits Survey is available.
SUMMARY OF FINDINGS
The Summary of Findings provides an overview of the 2021 survey results and is available under the Summary of Findings tab.
FULL REPORT
The complete Employer Health Benefits Survey report includes over 200 exhibits and is available under the Report tab. The “Report” tab contains 13 separate sections. Users can view each section separately or download the section exhibits from the right side of the respective section page.
More than 20 overview slides from the 2021 Employer Health Benefits Survey are available as a slideshow.
ADDITIONAL RESOURCES
Standard errors for selected estimates are available in the Technical Supplement here.
Employer Health Benefits Surveys from 1998–2020 are available here. Please note that historic survey reports have not been revised with methodological changes.
Researchers may request a public use dataset by going to Contact Us and choosing “TOPIC: Health Costs.”
Summary of Findings
Employer-sponsored insurance covers almost 155 million nonelderly people.1 To provide current information about employer-sponsored health benefits, KFF conducts an annual survey of private and non-federal public employers with three or more workers. This is the twenty-third Employer Health Benefits Survey (EHBS) and reflects employer-sponsored health benefits in 2021.
For the second consecutive year, the COVID-19 pandemic has dominated public policy, including health care and employment policy. The survey was fielded from mid-January through July, which means we began collecting data before COVID vaccines were widely available and stopped interviews after a reasonably large share of the population (in at least some places) had been vaccinated. We revised the survey for 2021 to ask about changes employers and health plans made to address potential issues and uncertainties arising from the pandemic.
HEALTH INSURANCE PREMIUMS AND WORKER CONTRIBUTIONS
In 2021, the average annual premiums for employer-sponsored health insurance are $7,739 for single coverage and $22,221 for family coverage [Figure A]. The average single and family premiums increased 4% over the past year. During this period, workers’ wages increased 5% and inflation increased 1.9%.2
The average premium for family coverage has increased 22% over the last five years and 47% over the last ten years [Figure A].
Covered workers in small and large firms have similar premiums for single coverage ($7,813 vs. $7,709) and family coverage ($21,804 vs. $22,389). The average premiums for covered workers in firms with a relatively large share of lower-wage workers (where at least 35% of the workers earn $28,000 annually or less) are lower than the average premiums for covered workers in firms with a smaller share of lower-wage workers for single coverage ($7,156 vs. $7,796) and family coverage ($20,315 vs. $22,407)3. The average premiums for covered workers in high-deductible health plans with a savings option (HDHP/SO) are lower that the overall average premiums for single coverage ($7,016) and family coverage ($20,802) [Figure B]. In contrast, the average premiums for covered workers enrolled in PPOs are higher that the overall average premiums for single ($8,092) and family coverage ($23,312).
Figure A: Average Annual Worker and Employer Premium Contributions for Family Coverage, 2011, 2016, and 2021
Figure B: Average Annual Worker and Employer Premium Contributions for Single and Family Coverage, by Plan Type, 2021
Most covered workers make a contribution toward the cost of the premium for their coverage. On average, covered workers contribute 17% of the premium for single coverage and 28% of the premium for family coverage. Covered workers in small firms on average contribute a higher percentage of the premium for family coverage than covered workers in large firms (24% vs. 37%). Covered workers in firms with a relatively large share of lower-wage workers have higher average contribution rates for family coverage than those in firms with a smaller share of lower-wage workers (35% vs. 27%). Covered workers at private for-profit firms on average contribute a higher percentage of the premium for both single and family coverage than covered workers at other firms, while covered workers in public firms on average contribute a lower percentage of the premium for both single and family coverage. Covered workers in firms with a relatively large share of younger workers (where at least 35% of workers are age 26 or younger) have higher average contribution rates for single coverage (23% vs. 17%) and for family coverage (35% vs. 28%) than those in firms with a smaller share of younger workers.
Twenty-nine percent of covered workers in small firms are in a plan where the employer pays the entire premium for single coverage, compared to only 5% of covered workers in large firms. In contrast, 31% of covered workers in small firms are in a plan where they must contribute more than one-half of the premium for family coverage, compared to 5% of covered workers in large firms [Figure C].
The average annual dollar amounts contributed by covered workers for 2021 are $1,299 for single coverage and $5,969 for family coverage, similar to the amounts last year. The average dollar contribution for family coverage has increased 13% since 2016 and 45% since 2011 [Figure A]. Eight percent of covered workers, including 20% of covered workers in small firms, are in a plan with a worker contribution of $12,000 or more for family coverage.
Figure C: Distribution of Percentage of Premium Paid by Covered Workers for Single and Family Coverage, by Firm Size, 2021
PLAN ENROLLMENT
PPOs are the most common plan type, enrolling 46% of covered workers in 2021. Twenty-eight percent of covered workers are enrolled in a high-deductible plan with a savings option (HDHP/SO), 16% in an HMO, 9% in a POS plan, and 1% in a conventional (also known as an indemnity) plan [Figure D]. These percentages are each similar to the percentages for the corresponding plan type last year.
Figure D: Distribution of Health Plan Enrollment for Covered Workers, by Plan Type and Firm Size, 2016 and 2021
SELF FUNDING
Many firms, particularly larger firms, self fund, or pay for some or all health services for their workers directly from their own funds rather than by purchasing health insurance.Sixty-four percent of covered workers, including 21% of covered workers in small firms and 82% in large firms, are enrolled in plans that are self-funded. The percentage of firms offering health benefits that are self funded in 2021 is similar to the percentage last year.
Forty-two percent of small firms report that they have a level-funded plan, a much higher percentage than the previous two years. These arrangements combine a relatively small self-funded component with stoploss insurance which limits the employer’s liability to low attachment points that transfer a substantial share of the risk to insurers. These arrangements are complex and some small employers may not be entirely certain about the funding status of their plans. The substantial increase for 2021 suggests that that there may be a significant shift in the small group market toward health-status-based rating, so it will be important to monitor this trend over the next several years.
EMPLOYEE COST SHARING
Most covered workers must pay a share of the cost when they use health care services. Eighty-five percent of covered workers have a general annual deductible for single coverage that must be met before most services are paid for by the plan.
Among covered workers with a general annual deductible, the average deductible amount for single coverage is $1,669, similar to last year. The average deductible for covered workers is higher in small firms than large firms ($2,379 vs. $1,397). The average single coverage annual deductible among covered workers with a deductible has increased 13% over the last five years and 68% over the last ten years.
Deductibles have increased in recent years due to both higher deductibles within plan types and higher enrollment in HDHP/SOs. While growing deductibles in PPOs and other plan types generally increase enrollee out-of-pocket liability, the shift to enrollment in HDHP/SOs does not necessarily do so if HDHP/SO enrollees receive an offsetting account contribution from their employers. Twenty-seven percent of covered workers in an HDHP with a Health Reimbursement Arrangement (HRA), and 2% of covered workers in a Health Savings Account (HSA)-qualified HDHP receive an account contribution for single coverage at least equal to their deductible, while another 20% of covered workers in an HDHP with an HRA and 17% of covered workers in an HSA-qualified HDHP receive account contributions that, if applied to their deductible, would reduce their actual liability to less than $1,000.
We can look at the increase in the average deductible as well as the growing share of covered workers who have a deductible together by calculating an average deductible among all covered workers (assigning a zero to those without a deductible). The 2021 value of $1,434 is 17% higher than the average general annual deductible for single coverage of $1,221 in 2016 and 92% higher than the average general annual deductible of $747 in 2011.
Another way to look at deductibles is the percentage of all covered workers who are in a plan with a deductible that exceeds certain thresholds. Over the past five years, the percentage of covered workers with a general annual deductible of $2,000 or more for single coverage has grown from 23% to 29% [Figure E].
Whether or not a deductible applies, a large share of covered workers also pay a portion of the cost when they visit an in-network physician. Most covered workers face a copayment (a fixed dollar amount) when they visit a doctor, although some workers face coinsurance requirements (a percentage of the covered amount). The average copayments are $25 for primary care and $42 for specialty care. The average coinsurance rates are 19% for primary care and 20% for specialty care. These amounts are similar to those in 2020.
Most workers also face additional cost sharing for a hospital admission or outpatient surgery. Sixty-eight percent of covered workers have coinsurance and 12% have a copayment for hospital admissions. The average coinsurance rate for a hospital admission is 20% and the average copayment is $321 per hospital admission. The cost sharing requirements for outpatient surgery follow a similar pattern to those for hospital admissions.
Virtually all covered workers are in plans with a limit on in-network cost sharing (called an out-of-pocket maximum) for single coverage, though the limits vary significantly. Among covered workers in plans with an out-of-pocket maximum for single coverage, 13% are in a plan with an out-of-pocket maximum of less than $2,000, while 27% are in a plan with an out-of-pocket maximum of $6,000 or more.
Figure E: Percentage of Covered Workers Enrolled in a Plan With a General Annual Deductible of $2,000 or More for Single Coverage, by Firm Size, 2009-2021
AVAILABILITY OF EMPLOYER-SPONSORED COVERAGE
Fifty-nine percent of firms offer health benefits to at least some of their workers, similar to the percentage last year. The likelihood of offering health benefits increase with firm size; only 49% of firms with 3 to 9 workers offer coverage, while virtually all firms with 1,000 or more workers offer coverage to at least some workers.
While the vast majority of firms are small, most workers work for large firms that offer coverage. In 2021, 91% of workers are employed by a firm that offers health benefits to at least some of its workers.
Although the vast majority of workers are employed by firms that offer health benefits, many workers are not covered by their own job. Some are not eligible to enroll (e.g., waiting periods or part-time or temporary work status) while others who are eligible choose not to enroll (e.g., they feel the coverage is too expensive or they are covered through another source). In firms that offer coverage, 81% of workers are eligible for the health benefits offered, and of those eligible, 77% take up the firm’s offer, resulting in 62% of workers in offering firms enrolling in coverage through their employer. All of these percentages are similar to those in 2020.
Looking at workers in both firms that offer health benefits and firms that do not, 56% of workers are covered by health plans offered by their employer, similar to the percentage last year.
HEALTH AND WELLNESS PROGRAMS
Most large firms and many small firms have programs that help workers identify health issues and manage chronic conditions, including health risk assessments, biometric screenings, and health promotion programs. Dislocations caused by the COVID-19 pandemic, including job disruptions, remote work, and social distancing, challenged workers’ abilities to participate in some of the activities associated with these programs. Some employers addressed these challenges by adjusting incentives, adding new services, vendors, or digital content, or by expanding service locations. For 2021, we modified our questions to focus on the changes made by employers to address challenges arising from the COVID-19 pandemic.
Biometric Screenings. Among firms offering health benefits, 26% of small firms and 38% of large firms provide workers the opportunity to complete a biometric screening. The percentage of large firms providing workers the opportunity to complete a biometric screening is lower than the percentage last year (50%). Among large firms offering health benefits, 16% not offering a biometric screening opportunity in 2021 reported offering a biometric screening opportunity in 2020.
Firms with at least 50 employees offering a biometric screening opportunity both this year and last year were asked about changes that they have made to their programs since the start of the COVID-19 pandemic. Overall, among firms offering a biometric screening opportunity both this year and last year, 32% of smaller firms (50-199 employees) and 43% of larger firms report making some change in their biometric screening programs since the start of the COVID-19 pandemic [Figure F]. The changes include:
Three percent of smaller firms and 5% of larger firms reduced or eliminated incentives for completing the screening.
Thirteen percent of smaller firms and 23% of larger firms permitted screenings to be completed by a broader set of providers.
Five percent of smaller firms and 15% of larger firms reduced the stringency of screening requirements.
Nineteen percent of smaller firms and 18% of larger firms arranged for biometric screenings to be performed on a digital platform.
Three percent of smaller firms and 5% of larger firms suspended or eliminated the program for at least some workers.
Figure F: Among Firms Which Offered Biometric Screening This Year and Last Year, Changes Firm Made to Biometric Screening Programs Due to the COVID-19 Pandemic, 2021
Health and Wellness Promotion Programs. Most firms offering health benefits offer programs to help workers identify and address health risks and unhealthy behaviors. Fifty-eight percent of small firms and 83% of large firms offer a program in at least one of these areas: smoking cessation, weight management, and behavioral or lifestyle coaching.
Firms with 50 or more employees with a wellness or health promotion program were asked if they made changes to their programs since the beginning of the COVID-19 pandemic. Overall, 50% of smaller firms (50-199 employees) and 68% of larger firms reported some type of change [Figure G].
Three percent of smaller firms and 6% of larger firms reduced or eliminated incentives associated with their program.
Fifteen percent of smaller firms and 21% of larger firms added a new digital program or digital content to their program.
Eight percent of smaller firms and 10% of larger firms increased support for wearable devices.
Seventeen percent of smaller firms and 34% of larger firms expanded or modified the content of their existing programs to better address the health needs of people working from home.
Thirty-eight percent of smaller firms and 58% of larger firms provided or expanded on-line counseling services for emotional or financial distress, relationship issues, or other stressful situations.
Figure G: Among Firms Offering a Specified Wellness Program, Percentage of Firms Which Changed Wellness Programs Due to the COVID-19 Pandemic, by Firm Size, 2021
TELEMEDICINE
Telemedicine is the delivery of health care services through telecommunications to a patient from a provider who is at a remote location, including video chat and remote monitoring. While telemedicine was becoming an increasingly popular benefit prior to the COVID-19 pandemic, its use has increased dramatically since the pandemic began, drawing significant attention from policymakers. In 2021, 95% of firms with 50 or more workers that offer health benefits cover the provision of some health care services through telemedicine in their largest health plan, higher than the percentages last year (85%) and three years ago (67%).
Employers with 50 or more employees offering telemedicine services were asked about changes they made to their programs after the beginning of the COVID-19 pandemic. Among these firms:
Nineteen percent of smaller firms and 35% of larger firms expanded the number of services covered through telemedicine [Figure H].
Nineteen percent of smaller firms and 33% of larger firms expanded the number or type of providers that could provide telemedicine services.
Fifteen percent of smaller firms and 27% of larger firms reduced or eliminated cost sharing for telemedicine services.
Twenty-four percent of employers expanded the settings or locations where enrollees may use telemedicine services.
Thirty-one percent of employers expanded coverage for additional modes of delivering telemedicine, such as by telephone.
Three percent of smaller firms and 10% of larger firms contracted with a new telemedicine service provider, such as a specialized telemedicine vendor.
Forty-seven percent of smaller firms and 66% of larger firms increased promotion or employee communication of telemedicine resources.
Figure H: Among Firms Offering Telemedicine Benefits, Changes the Firm Made to Telemedicine Benefits During the COVID-19 Pandemic, by Firm Size, 2021
CHANGES TO MENTAL AND BEHAVIORAL HEALTH BENEFITS DUE TO COVID-19
The social and economic disruptions caused by the COVID-19 pandemic have placed an unprecedented level of stress on people all over the world. Many employers took steps to assist employees and family members facing these stresses. Employers with at least 50 employees offering health benefits were asked about changes they made to their health plans after the start of the COVID-19 pandemic to support the mental health of their employees.
Sixteen percent of employers developed new resources, such as an employee assistance program [Figure I].
Three percent of employers increased coverage for out-of-network mental health or substance abuse services. Firms with 1,000 or more employees were more likely than smaller firms (50 to 999 employees) to increase coverage for out-of-network services (9% v. 3%).
Six percent of employers, including 16% of employers with 5,000 or more employees, expanded the number of mental health or substance abuse providers in their plans’ networks.
Four percent of employers waived or reduced cost-sharing for mental health or substance abuse services. The percentage of firms waiving or reducing cost sharing for these services increased with firm size.
Thirty-one percent of employers expanded the ways through which enrollees could get mental health or substance abuse services, such as through telemedicine.
Figure I: Among Firms With 50 or More Employees Offering Health Benefits, Changes the Firm Made Since the Beginning of the COVID-19 Pandemic to Meet the Mental Health Needs of Employees, 2021
PRESCRIPTION DRUG MANAGEMENT
Among employers with 500 or more employees offering prescription drug benefits in 2021, 18% have programs that exclude subsidies from prescription drug manufacturers, such as coupons, from counting towards an enrollee’s deductible or out-of-pocket limit. Among these same employers, 13% made a change to their prescription program in the last two years to delay the inclusion of new high-cost drug therapies until the therapy is proven effective.
HEALTH CARE PRICE TRANSPARENCY
New federal rules will require health plans (including self-funded plans) make information available to enrollees about the estimated cost of services and cost sharing on a “real-time” basis. Twenty-six percent of large employers offering health benefits believe that providing employees with additional information about the cost of services will help their health care decision-making “a great deal” and an additional 50% say that it will help their decision-making “somewhat”. Employers were less certain about the impact of health care costs, with only 3% of large employers saying that the new transparency rules will reduce health spending “a great deal”, while 15% say that they will be reduce health spending “not at all.” Thirty-eight percent of these firms say that the new rules will reduce spending “somewhat” and 40% say that they will reduce spending “very little” [Figure J].
Figure J: Among Large Firms Offering Health Benefits, Firms Opinions On Health Transparency Requirements, 2021
DISCUSSION
The COVID-19 pandemic remains the most important story of 2021, and how employers are adapting their benefits to meet the changing needs of employees is the most important health benefit story. Overall market characteristics changed little: premiums continued on a modest growth trend, the share of people offered coverage at their work and the share of those covered by their jobs remained unchanged, as did the average deductible and other cost-sharing levels. While there was a modest amount of coverage loss, likely due to employment disruptions caused by the pandemic, the market was quite stable for the large share of enrollees who retained their coverage.4
Employers did make a number of changes to their benefit programs and how services are delivered in response to COVID-19 challenges. One that has received a good amount of attention is telemedicine. Not only did the percentages of small and large employers with a telemedicine benefit increase again in 2021, but many employers also made the benefit easier to use by expanding the number and types of providers available, expanding the settings or locations where the benefit could be used, supporting additional modes of communicating with providers, or waiving cost sharing for telemedicine services. While some of these actions may change when the pandemic ends, employers appear convinced that telemedicine will continue to be important in the future. Almost half (47%) of employers with 50 or more employees offering health benefits agree that telemedicine will be very important in providing access in the future, while only 4% said that telemedicine would be unimportant in the future.
Another issue that has received a good deal of attention during the pandemic is mental health. The significant economic and social dislocations have placed unprecedented stresses on workers and their families, and some employers took steps to enhance benefits and access to services. Thirty-one percent of employers with 50 or more employees expanded the ways through which enrollees could get mental health or substance abuse services, such as through telemedicine, and sixteen percent developed new resources, such as an employee assistance program. These enhancements were timely, as 12% of employers with at least 50 employees, including 46% of firms with 5,000 or more employees, saw an increase in the share of employees using mental health services since the COVID-19 pandemic began.
Employers also made changes to their health promotion and wellness programs to adapt to the circumstances their workers faced during the pandemic, such as remote work. Fifty-five percent of firms with 50 or more employees made some type of change to their health promotion and wellness programs in response to the COVID-19 pandemic, including 17% that added a new digital program or digital content to their program and 43% that provided or expanded on-line counseling services for emotional or financial distress, relationship issues, or other stressful situations.
Looking ahead to 2022, the pandemic has not ended but the uncertainties seem fewer than at the beginning of 2021. One issue for both employment and health benefits is whether some of the changes brought about by the pandemic will endure. It was already apparent before the pandemic that more of the workforce could do their jobs remotely, but the pandemic proved the point. Whether and how employers structure benefits to support a potentially more far-flung workforce will be an important topic for the next few years. Similarly, it remains to be seen whether telemedicine will continue to grow as a source of access to care, or fade back to a more specialized option that is primarily available in difficult situations and hard to reach locations. During the pandemic, it has been a particularly important source for mental and behavioral heath care, an area of health care where provider access, at least within network, has been a longer-standing issue. This will be an area of particular interest going forward because enhanced access to these benefits may well increase costs. Another issue to watch will be the increase in level-funded premium plans among smaller employers. These plans use health status in underwriting and setting premiums in plans even for very small employers. We saw a large jump in the share of small employers with these plans in 2021, and if this continues, it could disrupt the community-rated pricing structure for ACA compliant small group plans.
The COVID pandemic has asked many questions of employers about their roles in assuring the health of their workers, their customers, and the public at large. Perhaps the most pressing issue currently is how to implement the federal vaccine requirement for employees of large employers, including policies about exceptions and whether or not to have incentives in addition to the requirement. Other complex issues have involved masking requirements, remote work, quarantines, assuring worker safety in interactions with coworkers and the public. Employers also have been challenged to make changes to their benefit plans to address the many health and social issues that have arisen during the pandemic, and many have done so. We can expect that employers will need to continue to adapt their programs as the pandemic continues into 2022.
METHODOLOGY
The KFF 2021 Employer Health Benefits Survey reports findings from a survey of 1,686 randomly selected non-federal public and private employers with three or more workers. Researchers at NORC at the University of Chicago and KFF designed and analyzed the survey. Davis Research, LLC conducted the field work between January and July 2021. In 2021, the overall response rate is 15%, which includes firms that offer and do not offer health benefits. Unless otherwise noted, differences referred to in the text and figures use the 0.05 confidence level as the threshold for significance. Small firms have 3-199 workers unless otherwise noted. Values below 3% are not shown on graphical figures to improve the readability of those graphs. Some distributions may not sum due to rounding. This year, we made several changes to the survey questionnaire in order to reduce the length and burden of the survey. For more information on this change and other information on the survey methodology, see the Survey Design and Methods section at http://ehbs.kff.org/.
Filling the need for trusted information on national health issues, KFF is a nonprofit organization based in San Francisco, California.
This threshold is based on the twenty-fifth percentile of workers’ earnings ($28,000 in 2021). Bureau of Labor Statistics. May 2019 National Occupational Employment and Wage Estimates: United States. Washington (DC): BLS. Available from: http://www.bls.gov/oes/current/oes_nat.htm↩︎
KFF has conducted this annual survey of employer-sponsored health benefits since 1999. KFF works with NORC at the University of Chicago (NORC) and Davis Research LLC (Davis) to field and analyze the survey. From January to July 2021, Davis interviewed business owners as well as human resource and benefits managers at 1,686 firms.
SURVEY TOPICS
The survey includes questions on the cost of health insurance, health benefit offer rates, coverage, eligibility, plan type enrollment, premium contributions, employee cost sharing, prescription drug benefits, retiree health benefits, and wellness benefits.
Firms that offer health benefits are asked about the plan attributes of their largest health maintenance organization (HMO), preferred provider organization (PPO), point-of-service (POS) plan, and high-deductible health plan with a savings option (HDHP/SO).5 We treat exclusive provider organizations (EPOs) and HMOs as one plan type and conventional (or indemnity) plans as PPOs. The survey defines an HMO as a plan that does not cover nonemergency out-of-network services. POS plans use a primary care gatekeeper to screen for specialist and hospital visits. HDHP/SOs were defined as plans with a deductible of at least $1,000 for single coverage and $2,000 for family coverage and that either offer a health reimbursement arrangement (HRA) or are eligible for a health savings account (HSA). Definitions of the health plan types are available in Section 4, and a detailed explanation of the HDHP/SO plan type is in Section 8. Throughout this report, we use the term “in-network” to refer to services received from a preferred provider.
To reduce survey burden, questions on cost sharing for office visits, hospitalization, outpatient surgery and prescription drugs were only asked about the firm’s largest plan type. Firms with sponsoring multiple plan types, were asked for their premiums, worker contribution and deductibles for their two largest plan types. Within each plan type, respondents are asked about the plan with the most enrollment.
Firms are asked about the attributes of their current plans during the interview. While the survey’s fielding period begins in January, many respondents may have a plan whose 2021 plan year lags behind the calendar year [Figure M.1]. In some cases, plans may report the attributes of their 2020 plans and some plan attributes (such as HSA deductible limits) may not meet the calendar year regulatory requirements. Many employers continued to experience significant disruptions from the COVID-19 pandemic. Approximately 60% of the responses (composing 56% of the covered worker weight) were collected between January and March.
Figure M.1: Among Firms Offering Health Benefits, Month in Which Plan Year Begins, 2021
SAMPLE DESIGN
The sample for the annual KFF Employer Health Benefits Survey includes private firms and nonfederal government employers with three or more employees. The universe is defined by the U.S. Census’ 2017 Statistics of U.S. Businesses (SUSB) for private firms and the 2017 Census of Governments (COG) for non-federal public employers. At the time of the sample design (December 2020), these data represented the most current information on the number of public and private firms nationwide with three or more workers. As in the past, the post-stratification is based on the most up-to-date Census data available (the 2018 SUSB). We determine the sample size based on the number of firms needed to ensure a target number of completes in six size categories.
We attempted to repeat interviews with prior years’ survey respondents (with at least ten employees) who participated in either the 2019 or the 2020 survey, or both. Firms with 3-9 employees are not included in the panel to minimize the potential of panel effects. As a result, 955 of the 1,686 firms that completed the full survey also participated in either the 2019 or 2020 surveys, or both. In total, 140 firms participated in 2019, 192 firms participated in 2020, and 623 firms participated in both 2019 and 2020. Non-panel firms are randomly selected within size and industry groups.
Since 2010, the sample has been drawn from a Dynata list (based on a census assembled by Dun and Bradstreet) of the nation’s private employers and the COG for public employers. To increase precision, we stratified the sample by ten industry categories and six size categories. The federal government and business with fewer than three employees are not included. Education is a separate category for the purposes of sampling, and included in Service category for weighting. For information on changes to the sampling methods over time, please consult the extended methods at http://ehbs.kff.org/
RESPONSE RATE
Response rates are calculated using a CASRO method, which accounts for firms that are determined to be ineligible in its calculation. The overall response rate is 15% [Figure M.2].6 The response rate for panel firms is higher than the response rate for non-panel firms. Similar to other employer and household surveys, the Employer Health Benefits Survey has seen a general decrease in response rates over time. Since 2017, we have attempted to increase the number of completes by increasing the number of non-panel firms in the sample. While this generally increases the precision of estimates by ensuring a sufficient number of respondents in various sub-groups, it has the effect of reducing the overall response rate. Over the last two years, we have seen a larger decrease in response rates, in part a result of workplace disruptions accompanying the pandemic.
The vast majority of questions are asked only of firms that offer health benefits. A total of 1,418 of the 1,686 responding firms indicated they offered health benefits. This year we have a smaller number of completes than in previous years (326 fewer respondents). The decrease may be attributed to a combination of factors including changing data collection firms, disruptions from the COVID-19 pandemic and starting the fielding period later into January.
We asked one question of all firms in the study with which we made phone contact but where the firm declined to participate: “Does your company offer a health insurance program as a benefit to any of your employees?”. A total of 4,099 firms responded to this question (including 1,686 who responded to the full survey and 2,413 who responded to this one question). These responses are included in our estimates of the percentage of firms offering health benefits.7 The response rate for this question is 36% [Figure M.2].
Figure M.2: Response Rates for Various Subsets of the Sample, 2021
While response rates have decreased, elements of the survey design limit the potential impact of a response bias. Most major statistics are weighted by the percentage of covered workers at a firm. The most important statistic that is weighted by the number of employers is the offer rate; firms that do not complete the full survey are asked whether their firm offers health benefits to any employees. As noted, this question relies on a wider set of respondents than just those completing the full survey.
FIRM SIZES AND KEY DEFINITIONS
Throughout the report, we report data by size of firm, region, and industry. Unless otherwise specified, firm size definitions are as follows: small firms: 3-199 workers; and large firms: 200 or more workers. [Figure M.3] shows selected characteristics of the survey sample. A firm’s primary industry classification is determined from Dynata’s designation on the sampling frame and is based on the U.S. Census Bureau’s North American Industry Classification System (NAICS), [Figure M.4]. A firm’s ownership category and other firm characteristics such as the firm’s wage level and the age of the work force are based on respondents’ answers. While there is considerable overlap in firms in the “State/Local Government” industry category and those in the “public” ownership category, they are not identical. For example, public school districts are included in the service industry even though they are publicly owned. Family coverage is defined as health coverage for a family of four.
Figure M.3: Selected Characteristics of Firms in the Survey Sample, 2021
Figure M.4: Industries by NAICS code
[Figure M.5] presents the breakdown of states into regions and is based on the U.S Census Bureau’s categorizations. State-level data are not reported both because the sample size is insufficient in many states and we only collect information on a firm’s primary location rather than where all workers may actually be employed. Some mid- and large-size employers have employees in more than one state, so the location of the headquarters may not match the location of the plan for which we collected premium information.
Figure M.5: States by Region, 2021
[Figure M.6] displays the distribution of the nation’s firms, workers, and covered workers (employees receiving coverage from their employer). Among the three million firms nationally, approximately 59.1% employ 3 to 9 workers; such firms employ 7.3% of workers, and 4.2% of workers covered by health insurance. In contrast, less than one percent of firms employ 5,000 or more workers; these firms employ 36.7% of workers and 40.6% of covered workers. Therefore, the smallest firms dominate any statistics weighted by the number of employers. For this reason, most statistics about firms are broken out by size categories. In contrast, firms with 1,000 or more workers are the most influential employer group in calculating statistics regarding covered workers, since they employ the largest percentage of the nation’s workforce. Statistics among small firms and those weighted by the number of firms tend to have more variability.
Figure M.6: Distribution of Employers, Workers, and Workers Covered by Health Benefits, by Firm Size, 2021
The survey asks firms what percentage of their employees earn more or less than a specified amount in order to identify the portion of a firm’s workforce that has relatively lower or higher wages. This year, the income threshold is Categorized Percent Of Workforce Earning $28,000 Or Less or less per year for lower-wage workers and Categorized Percent Of Workforce Earning $66,000 Or More or more for higher-wage workers. These thresholds are based on the 25th and 75th percentile of workers’ earnings as reported by the Bureau of Labor Statistics using data from the Occupational Employment Statistics (OES) (2019).8 The cutoffs were inflation-adjusted and rounded to the nearest thousand.
Annual inflation estimates are calculated as an average of the first three months of the year. The 12 month percentage change for this period was 1.9%.9 Data presented is nominal unless indicated specifically otherwise.
ROUNDING AND IMPUTATION
Some figures in the report do not sum to totals due to rounding. Although overall totals and totals for size and industry are statistically valid, some breakdowns may not be available due to limited sample sizes or high relative standard errors. Where the unweighted sample size is fewer than 30 observations, figures include the notation “NSD” (Not Sufficient Data). Estimates with high relative standard errors are reviewed and in some cases not published. Many breakouts by subsets may have a large standard error, meaning that even large differences between estimates are not statistically different. Values below 3% are not shown on graphical figures to improve the readability of those graphs. The underlying data for all estimates presented in graphs are available in the Excel documents accompanying each section on http://ehbs.kff.org/.
To control for item nonresponse bias, we impute values that are missing for most variables in the survey. On average, 8% of observations are imputed. All variables are imputed following a hotdeck approach. The hotdeck approach replaces missing information with observed values from a firm similar in size and industry to the firm for which data are missing. In 2021, there were twenty-seven variables where the imputation rate exceeded 20%; most of these cases were for individual plan level statistics. When aggregate variables were constructed for all of the plans, the imputation rate is usually much lower. There are a few variables that we have decided not to impute; these are typically variables where “don’t know” is considered a valid response option. Some variables are imputed based on their relationship to each other. For example, if a firm provided a worker contribution for family coverage but no premium information, a ratio between the family premium and family contribution was imputed and then the family premium was calculated. We estimate separate single and family coverage premiums for firms that provide premium amounts as the average cost for all covered workers.
To ensure data accuracy we have several processes to review outliers and illogical responses. Every year several hundred firms are called back to confirm or correct responses. In some cases, answers are edited based on responses to open-ended questions or based on established logic rules.
Figure M.7: Imputation Rates of Premiums, Worker Contributions, and Deductibles, by Plan Type, 2017-2021
WEIGHTING
Because we select firms randomly, it is possible through the use of weights to extrapolate the results to national (as well as firm size, regional, and industry) averages. These weights allow us to present findings based on the number of workers covered by health plans, the number of total workers, and the number of firms. In general, findings in dollar amounts (such as premiums, worker contributions, and cost sharing) are weighted by covered workers. Other estimates, such as the offer rate, are weighted by firms.
Calculation of the weights follows a common approach. The employer weight was determined by calculating the firm’s probability of selection. This weight was trimmed of overly influential weights and calibrated to U.S. Census Bureau’s 2018 Statistics of U.S. Businesses for firms in the private sector, and the 2017 Census of Governments totals. The worker weight was calculated by multiplying the employer weight by the number of workers at the firm and then following the same weight adjustment process described above. The covered-worker weight and the plan-specific weights were calculated by multiplying the percentage of workers enrolled in each of the plan types by the firm’s worker weight. These weights allow analyses of all workers covered by health benefits and of workers in a particular type of health plan.
The trimming procedure follows the following steps: First, we grouped firms into size and offer categories of observations. Within each strata, we calculated the trimming cut point as the median plus six times the interquartile range (M + [6 * IQR]). Weight values larger than this cut point are trimmed. In all instances, very few weight values were trimmed.
To account for design effects, the statistical computing package R version 4.1.1 (2021-08-10) and the library “survey” version 4.0 were used to calculate standard errors.
STATISTICAL SIGNIFICANCE AND LIMITATIONS
All statistical tests are performed at the .05 confidence level. For figures with multiple years, statistical tests are conducted for each year against the previous year shown, unless otherwise noted. No statistical tests are conducted for years prior to 1999.
Statistical tests for a given subgroup are tested against all other firm sizes not included in that subgroup: For example, Northeast is compared to all firms NOT in the Northeast (an aggregate of firms in the Midwest, South, and West). However, statistical tests for estimates compared across plan types (for example, average premiums in PPOs) are tested against the “All Plans” estimate. In some cases, we also test plan-specific estimates against similar estimates for other plan types (for example, single and family premiums for HDHP/SOs against single and family premiums for HMO, PPO, and POS plans); these are noted specifically in the text. The two types of statistical tests performed are the t-test and the Wald test. The small number of observations for some variables resulted in large variability around the point estimates. These observations sometimes carry large weights, primarily for small firms. The reader should be cautioned that these influential weights may result in large movements in point estimates from year to year; however, these movements are often not statistically significant. Standard Errors for most key statistics are available in a technical supplement available at http://ehbs.kff.org/
Due to the complexity of many employer health benefits programs, this survey is not able to capture all the components of any particular plan. For example, many employers have complex and varied prescription drug benefits, premium contributions, and incentives for wellness programs. We attempted to complete interviews with the person who is most knowledgeable about the firm’s health benefits. In some cases, the firm may not know details of some elements of their plan. While we collect information on the number of workers enrolled in health benefits, the survey is not able to capture the characteristics of the workers offered or enrolled in any particular plan.
2021 SURVEY
This year we made several changes to the survey questionnaire in order to reduce the length and burden of the survey; rather than asking benefit managers about the characteristics of up to four plan types, we asked for the premiums and deductibles of the largest two plan types and other cost information for only the largest. We now only about cost-sharing for prescription drugs, hospitalizations, outpatient surgery and office visits for the plan type with the most enrollment. This change mostly impacts the largest firms which are more likely to sponsor multiple plan types. As in prior years, if a firm sponsors multiple plans, of the same plan type, for example, several PPOs across the country, we ask about only the one with the largest enrollment. In 2021, 13% respondents offered three or more plan types – in total the largest plan type accounts for 82% of workers covered by health benefits and the largest two plan types represents 98%. For this reason, this change will only have a minimal impact on most estimates. Furthermore, in prior years we observed no systematic bias in key metrics across the plan type rank at each firm. For example, in 2020, among firms with three or more plan types, the third-largest plan had statistically similar premiums and deductibles to the larger plan types on average. This change did not require a change in how many of the the all firm variables are calculated. To determine the all plan value for categorical variables describing plans, we continue to use the largest type as a proxy. To do so, we identify the plan type that has the largest enrollment within the observation and use data from that plan as a proxy for the all-plan aggregate for that firm. For example, in previous years, we would ask an employer whether their HMO, PPO, POS and HDHP/SO were self-funded, and then report the response from largest plan type as the all firm response.
For the first time, a subset of employers were invited to complete the survey online, though in total 99% of the interviews were completed through computer-assisted telephone interviewing.
OTHER RESOURCES
Additional information on the 2021 Employer Health Benefit Survey is available at http://ehbs.kff.org/, including an article in the Journal Health Affairs, an interactive graphic and historic reports. Standard errors for some statistics are available in the online technical supplement. Researchers may also request a public use dataset here: https://www.kff.org/contact-us/
The survey design and methods section found on our website (http://ehbs.kff.org/) contains an extended methods document that was not included in the portable document format (PDF) or the printed versions of this book. Readers interested in the extended methodology should consult the online edition of this publication.
The authors would like to thank Tricia Neuman, Karen Pollitz, Krutika Amin, Cynthia Cox, Ashley Kirzinger, Carene Clark, Larry Levitt, Craig Palosky and Drew Altman for their many contributions in making this report possible.
Published: November 10 2021. Last Updated: November 01, 2021.
HISTORICAL DATA
Data in this report focus primarily on findings from surveys conducted and authored by KFF since 1999. Between 1999 and 2017, the Health Research & Educational Trust (HRET) co-authored this survey. HRET’s divestiture had no impact on our survey methods, which remain the same as years past. Prior to 1999, the survey was conducted by the Health Insurance Association of America (HIAA) and KPMG using a similar survey instrument, but data are not available for all the intervening years. Following the survey’s introduction in 1987, the HIAA conducted the survey through 1990, but some data are not available for analysis. KPMG conducted the survey from 1991-1998. However, in 1991, 1992, 1994, and 1997, only larger firms were sampled. In 1993, 1995, 1996, and 1998, KPMG interviewed both large and small firms. In 1998, KPMG divested itself of its Compensation and Benefits Practice, and part of that divestiture included donating the annual survey of health benefits to HRET.
This report uses historical data from the 1993, 1996, and 1998 KPMG Surveys of Employer-Sponsored Health Benefits and the 1999-2017 Kaiser/HRET Survey of Employer-Sponsored Health Benefits. For a longer-term perspective, we also use the 1988 survey of the nation’s employers conducted by the HIAA, on which the KPMG and KFF surveys are based. The survey designs for the three surveys are similar.
[Figure M.8] displays the historic sample sizes and weights of firms, workers, and covered workers (employees receiving coverage from their employer).
Figure M.8: Historic Firm Sample Sizes and Weights, 1999-2021
[Figure M.9] displays the historic sample frames and weighting universes.
Figure M.9: Sampling and Weighting Targets, 1999-2021
1999
The Kaiser Family Foundation and The Health Research and Educational Trust (Kaiser/HRET) began sponsoring the survey of employer-sponsored health benefits supported for many years by KPMG Peat Marwick LLP, an international consulting and accounting firm. In 1998, KPMG divested itself of its Compensation and Benefits Practice, and donated the annual survey of health benefits to HRET, a non-profit research organization affiliated with the American Hospital Association. From 1999 until 2017, the survey was conducted under a partnership between HRET and The Kaiser Family Foundation, a health care philanthropy and policy research organization that is not affiliated with Kaiser Permanente or Kaiser Industries. Starting in 1999, survey continued a core set of questions from prior KPMG surveys, but was expanded to include small employers and a variety of policy-oriented questions. Some reports include data from the 1993, 1996 and 1998 KPMG Surveys of Employer-Sponsored Health Benefits. For a longer-term perspective, we also use the 1988 survey of the nation’s employers conducted by the Health Insurance Association of America (HIAA), on which the KPMG, Kaiser/HRET, and Kaiser Family Foundation surveys were based. Many of the questions in the HIAA, KPMG, Kaiser/HRET, and Kaiser Family Foundation surveys are identical, as is the sample design. Since Point-of-Service (POS) plans did not exist in 1988, reports do not include statistics for this plan type in that year. Starting in 1999, Kaiser/HRET drew its sample from a Dun & Bradstreet list of the nation’s private and public employers with three or more workers. To increase precision, Kaiser/HRET stratified the sample by industry and the number of workers in the firm. Kaiser/HRET attempted to repeat interviews with many of the 2,759 firms interviewed in 1998 and replaced non-responding firms with another firm from the same industry and firm size. As a result, 1,377 firms in the 1999 total sample of 1,939 firms participated in both the 1998 and 1999 surveys.
Kaiser/HRET attempted to repeat interviews with many of the 1,939 firms interviewed in 1999 and replaced non-responding firms with other firms of the same industry and firm size. As a result, 982 firms in the 2000 survey’s total sample of 1,887 firms participated in both the 1999 and 2000 surveys. The overall response rate was 45% down from 60% in 1999. Contributing to the declining response rate was the decision not to re-interview any firms with 3-9 workers who participated in the 1999 survey. In 1999, the survey weights had instead been adjusted to control for the fact that firms with 3-9 workers that are in the panel (responded in either 1998 or 1999) are biased in favor of offering a health plan. The response rate in 2000 for firms with 3-9 workers was 30%.
The list of imputed variables was greatly expanded in 2002 to also include self-insurance status, level of benefits, prescription drug cost-sharing, copay and coinsurance amounts for prescription drugs, and firm workforce characteristics such as average income, age and part-time status. On average, 2% of these observations are imputed for any given variable. The imputed values are determined based on the distribution of the reported values within stratum defined by firm size and region.
The calculation of the weights followed a similar approach to previous years, but with several notable changes in 2003. First, as in years past, the basic weight was determined, followed by a nonresponse adjustment added this year to reflect the fact that small firms that do not participate in the full survey are less likely to offer health benefits and, consequently, are unlikely to answer the single offer rate question. To make this adjustment, Kaiser/HRET conducted a follow-up survey of all firms with 3-49 workers that did not participate in the full survey. Each of these 1,744 firms was asked the single question, “Does your company offer or contribute to a health insurance program as a benefit to its employees?” The main difference between this follow-up survey and the original survey is that in the follow-up survey the first person who answered the telephone was asked whether the firm offered health benefits, whereas in the original survey the question was asked of the person who was identified as most knowledgeable about the firm’s health benefits. Conducting the follow-up survey accomplished two objectives. First, statistical techniques (a McNemar analysis which was confirmed by a chi-squared test) demonstrated that the change in method-speaking with the person answering the phone rather than a benefits manager-did not bias the results of the follow-up survey. Analyzing firms who responded to the offer question twice, in both the original and follow-up survey, proved that there was no difference in the likelihood that a firm offers coverage based on which employee answered the question about whether a firm offers health benefits. Second, the follow-up survey demonstrated that very small firms not offering health benefits to their workers are less likely to answer the one survey question about coverage. Kaiser/HRET analyzed the group of firms that only responded to the follow-up survey and performed a t-test between the firms who had responded to the initial survey as well as the follow-up, and those who only responded to the follow-up. Tests confirmed the hypothesis that the firms that did not answer the single offer rate question in the original survey were less likely to offer health benefits. To adjust the offer rate data for this finding an additional non-response adjustment was applied to increase the weight of firms in the sample that do not offer coverage. The second change to the weighting method in 2003 was to trim the weights in order to reduce the influence of weight outliers. On occasion one or two firms will, through the weighting process, represent a highly disproportionate number of firms or covered workers. Rather than excluding these observations from the sample, a set cut point that would minimize the variances of several key variables (such as premium change and offer rate) was determined. The additional weight represented by outliers is then spread among the other firms in the same sampling cell. Finally, a post-stratification adjustment was applied. In the past, Kaiser/HRET was poststratified back to the Dun & Bradstreet frequency counts. Concern over volatility of counts in recent years led to the use of an alternate source for information on firm and industry data. This year the survey uses the recently released Statistics of U.S. Businesses conducted by the U.S. Census as the basis for the post-stratification adjustment. These Census data indicate the percentage of the nation’s firms with 3-9 workers is 59% rather than the higher percentages (e.g., 76% in 2002) derived from Dun & Bradstreet’s national database. This change has little impact on worker-based estimates, since firms with 3-9 workers accounted for less than 10% of the nation’s workforce. The impact on estimates expressed as a percentage of employers (e.g., the percent of firms offering coverage), however, may be significant. Due to these changes, Kaiser/HRET recalculated the weights for survey years 1999-2002 and modified estimates published in the survey where appropriate. The vast majority of these estimates are not statistically different. However, please note that the survey data published starting in 2003 varies slightly from previously published reports.
In 2005, the Kaiser/HRET survey added two additional sections to the questionnaire to collect information about high-deductible health plans (HDHP) that are offered along with a health reimbursement account (HRA) or are health savings account (HSA) qualified. Questions in these sections were asked of all firms offering these plan types, regardless of enrollment. Specific weights were also created to analyze the HDHP plans that are offered along with HRAs or are HSA qualified. These weights represent the proportion of employees enrolled in each of these arrangements.
We updated our data to reflect the 2002 Census of Governments. We also removed federal government employee counts from our post-stratification.
For the first time in 2006, Kaiser/HRET asked questions about the highest enrollment HDHP/SO as a separate plan type, equal to the other plan types. In prior years, data on HDHP/SO plans were collected as part of one of the other types of plans. Therefore, the removal of HDHP/SOs from the other plan types may affect the year to year comparisons for the other plan types. Given the decline in conventional health plan enrollment and the addition of HDHP/SO as a plan type option, Kaiser/HRET eliminated nearly all questions pertaining to conventional coverage from the survey instrument. We continue to ask firms whether or not they offer a conventional health plan and, if so, how much their premium for conventional coverage increased in the last year, but respondents are not asked additional questions about the attributes of the conventional plans they offer. Because we have limited information about conventional health plans, we must make adjustments in calculating all plan averages or distributions. In cases where a firm offers only conventional health plans, no information from that respondent is included in all plan averages. The exception is for the rate of premium growth, for which we have information. If a firm offers a conventional health plan and at least one other plan type, for categorical variables we assign the values from the health plan with the largest enrollment (other than the conventional plan) to the workers in the conventional plan. In the case of continuous variables, covered workers in conventional plans are assigned the weighted average value of the other plan types in the firm.
The survey newly distinguished between plans that have an aggregate deductible amount in which all family members’ out-of-pocket expenses count toward the deductible and plans that have a separate amount for each family member, typically with a limit on the number of family members required to reach that amount.
In 2006, Kaiser/HRET began asking employers if they had a health plan that was an exclusive provider organization (EPO). We treat EPOs and HMOs together as one plan type and report the information under the banner of “HMO”; if an employer sponsors both an HMO and an EPO, they are asked about the attributes of the plan with the larger enrollment.
Kaiser/HRET made a slight change to one of the industry groups: we removed Wholesale from the group that also included Agriculture, Mining and Construction. The nine industry categories now reported are: Agriculture/Mining/Construction, Manufacturing, Transportation/Communications/Utilities, Wholesale, Retail, Finance, Service, State/Local Government, and Health Care.
Starting in 2006, we made an important change to the way we test the subgroups of data within a year. Statistical tests for a given subgroup (firms with 25-49 workers, for instance) are tested against all other firm sizes not included in that subgroup (all firm sizes NOT including firms with 25-49 workers in this example). Tests are done similarly for region and industry: Northeast is compared to all firms NOT in the Northeast (an aggregate of firms in the Midwest, South, and West). Statistical tests for estimates compared across plan types (for example, average premiums in PPOs) are tested against the “All Plans” estimate. In some cases, we also test plan specific estimates against similar estimates for other plan types (for example, single and family premiums for HDHP/SOs against single and family premiums in HMO, PPO, and POS plans). Those are noted specifically in the text. This year, we also changed the type of Chi-square test from the Chi-square test for goodness-of-fit to the Pearson Chi-square test. Therefore, in 2006, the two types of statistical tests performed are the t-test and the Pearson Chi-square test.
Kaiser/HRET drew its sample from a Survey Sampling Incorporated list (based on an original Dun and Bradstreet list) of the nation’s private and public employers with three or more workers.
In prior years, many variables were imputed following a hotdeck approach, while others followed a distributional approach (where values were randomly determined from the variable’s distribution, assuming a normal distribution). This year, all variables are imputed following a hotdeck approach. This imputation method does not rely on a normal distribution assumption and replaces missing values with observed values from a firm with similar characteristics, in this case, size and industry. Due to the low imputation rate for most variables, the change in methodology is not expected to have a major impact on the results. In some cases, due to small sample size, imputed outliers are excluded. There are a few variables that Kaiser/HRET has decided should not be imputed; these are typically variables where “don’t know” is considered a valid response option (for example, firms’ opinions about effectiveness of various strategies to control health insurance costs).
The survey now contains a few questions on employee cost sharing that are asked only of firms that indicate in a previous question that they have a certain cost-sharing provision. For example, the copayment amount for prescription drugs is asked only of those that report they have copayments for prescription drugs. Because the composite variables are reflective of only those plans with the provision, separate weights for the relevant variables were created in order to account for the fact that not all covered workers have such provisions.
National Research, LLC (NR), our Washington, D.C.-based survey research firm, introduced a new CATI (Computer Assisted Telephone Interview) system at the end of 2007, and, due to several delays in the field, obtained fewer responses than expected. As a result, an incentive of $50 was offered during the final two and a half weeks the survey was in the field. Kaiser/HRET compared the distribution of key variables between firms receiving the incentive and firms not receiving the incentive to determine any potential bias. Chi-square test results were not significant, suggesting minimal to no bias.
In 2008, we changed the method used to report the annual percentage premium increase. In prior years, the reported percentage was based on a series of questions that asked responding firms the percentage increase or decrease in premiums from the previous year to the current year for a family of four in the largest plan of each plan type (e.g., HMO, PPO). The reported premium increase was the average of the reported percentage changes (i.e., 6.1% for 2007) weighted by covered workers. This year, we calculate the overall percentage increase in premiums from year to year for family coverage using the average of the premium dollar amounts for a family of four in the largest plan of each plan type reported by respondents and weighted by covered workers (i.e., $12,106 for 2007 and $12,680 for 2008, an increase of 5%). A principal advantage of using the premium dollar amounts to calculate the annual change in premiums is that we are better able to capture changes in the cost of health insurance for those firms that are newly in the market or that change plan types, especially those that move to plans with very different premium levels. For example, in the first year that a firm offers a plan of a new plan type, such as a consumer-directed plan, the firm can report the level of the premium they paid, but using the previous method would be unable to report the rate of change from the previous year since the plan was not previously offered. If the premium for the new plan is relatively low compared to other premiums in the market, the relatively low premium amount that the firm reports will tend to lower the weighted average premium dollar amount reported in the survey, but the firm responses would not provide any information to the percentage premium increase question. Another advantage of using premium dollar amounts to examine trends is that these data directly relate to the other findings in the survey and better address a principal public policy issue (i.e., what was the change in the cost of insurance over some past period). Many users noted, for example, that the percentage change calculated from the reported premium dollar amounts between two years did not directly match the reported average premium increase for the same period. There are several reasons why we would not expect these questions to produce identical results: 1) they are separate questions subject to varying degrees of reporting error, 2) firms could report a premium dollar amount for a plan type they might not have offered in the previous year, therefore, contributing information to one measure but not the other, or 3) firms could report a premium dollar amount for a plan that was not the largest plan of that type in the previous year. Although the two approaches have generated similar results in terms of the long-term growth rate of overall family premiums, there are greater discrepancies in trends for subgroups like small employers and self-funded firms. Focusing on the dollar amount changes over time will provide a more reliable and consistent measure of premium change that also is more sensitive to firms offering new plan options.
As we have in past years, this year we collected information on the cost-sharing provisions for hospital admissions and outpatient surgery that is in addition to any general annual plan deductible. However, for the 2008 survey, we changed the structure of the question and now include “separate annual deductible or hospital admissions” as a response option rather than collecting the information through a separate question. We continue to examine and sometimes modify the questions on hospital and outpatient surgery cost sharing because this can be a complex component of health benefit plans. For example, for some plans it is difficult to distinguish a separate hospital deductible from one categorized as a general annual deductible, where office visits and preventive care are covered and the deductible only applies to hospital use. Because this continues to be a point of confusion, we continue to refine the series of questions in order to clearly convey the information we are attempting to collect from respondents.
As in 2007, we asked firms if they offer health benefits to opposite-sex or same-sex domestic partners. However, this year, we changed the response options because during early tests of the 2008 survey, several firms noted that they had not encountered the issue yet, indicating that the responses of “yes,” “no,” and “don’t know” were insufficient. Therefore, this year we added the response option “not applicable/not encountered” to better capture the number of firms that report not having a policy on the issue.
In the fall of 2008, with guidance from experts in survey methods and design from NORC, we reviewed the methods used for the survey. As a result of this review, several important modifications were made to the 2009 survey, including the sample design and questionnaire. For the first time, this year we determined the sample requirements based on the universe of firms obtained from the U.S. Census rather than Dun and Bradstreet. Prior to the 2009 survey, the sample requirements were based on the total counts provided by Survey Sampling Incorporated (SSI) (which obtains data from Dun and Bradstreet). Over the years, we have found the Dun and Bradstreet frequency counts to be volatile because of duplicate listings of firms, or firms that are no longer in business. These inaccuracies vary by firm size and industry. In 2003, we began using the more consistent and accurate counts provided by the Census Bureau’s Statistics of U.S. Businesses and the Census of Governments as the basis for post-stratification, although the sample was still drawn from a Dun and Bradstreet list. In order to further address this concern at the time of sampling, we now also use Census data as the basis for the sample. This change resulted in shifts in the sample of firms required in some size and industry categories.
This year, we also defined Education as a separate sampling category, rather than as a subgroup of the Service category. In the past, Education firms were a disproportionately large share of Service firms. Education is controlled for during post-stratification, and adjusting the sampling frame to also control for Education allows for a more accurate representation of both Education and Service industries.
In past years, both private and government firms were sampled from the Dun and Bradstreet database. For the 2009 sample, Government firms were sampled in-house from the 2007 Census of Governments. This change was made to eliminate the overlap of state agencies that were frequently sampled from the Dun and Bradstreet database. Each year the survey attempts to repeat interviews with respondents from past years (see “Response Rate” section below), and in order to maintain government firms that had completed the survey in the past (firms that have completed the survey in the past are known as panel firms), government firms from the 2008 survey were matched to the Census of Governments to identify phone numbers. All panel government firms were included in the sample (resulting in an oversample). In addition, the sample of private firms is screened for firms that are related to state/ local governments, and if these firms are identified in the Census of Governments, they are reclassified as government firms and a private firm is randomly drawn to replace the reclassified firm. These changes to the sample frame resulted in an expected slight reduction in the overall response rate, since there were shifts in the number of firms needed by size and industry. Therefore, the data used to determine the 2009 Employer Health Benefits sample frame include the U.S. Census’ 2005 Statistics of U.S. Businesses and the 2007 Census of Governments. At the time of the sample design (December 2008), these data represented the most current information on the number of public and private firms nationwide with three or more workers. As in the past, the post- stratification is based on the most up-to-date Census data available (the 2006 update to the Census of U.S. Businesses was purchased during the survey field period) and the 2007 Census of Governments. The Census of Governments is conducted every five years, and this is the first year the data from the 2007 Census of Governments have been available for use.
Based on recommendations from cognitive researchers at NORC and internal analysis of the survey instrument, a number of questions were revised to improve the clarity and flow of the survey in order to minimize survey burden. For example, in order to better capture the prevalence of combinations of inpatient and outpatient surgery cost sharing, the survey was changed to ask a series of yes or no questions. Previously, the question asked respondents to select one response from a list of types of cost sharing, such as separate deductibles, copayments, coinsurance, and per diem payments (for hospitalization only). We have also expanded the number of questions for which respondents can provide either the number of workers or the percentage of workers. Previously, after obtaining the total number of employees, the majority of questions asked about the percentage of workers with certain characteristics. Now, for questions such as the percentage of workers making $23,000 a year or less or the enrollment of workers in each plan type, respondents are able to respond with either the number or the percentage of workers. Few of these changes have had any noticeable impact on responses.
New topics in the 2010 survey include questions on eligibility for dependent coverage, coverage for care received at retail clinics, health plan changes as a result of the Mental Health Parity and Addiction Equity Act of 2008, and disease management. As in past years, this year’s survey included questions on the cost of health insurance, offer rates, coverage, eligibility, enrollment patterns, premiums, employee cost sharing, prescription drug benefits, retiree health benefits, wellness benefits, and employer opinions.
Firms in the sample with 3-49 workers that did not complete the full survey are contacted and asked (or re-asked in the case of firms that previously responded to only one question about offering benefits) whether or not the firm offers health benefits. As part of the process, we conduct a McNemar test to verify that the results of the follow-up survey are comparable to the results from the original survey. If the test indicates that the results are comparable, a nonresponse adjustment is applied to the weights used when calculating firm offer rates. This year, for the first time since we began conducting the follow-up survey, the test indicated that the results from those answering the one question about offering health benefits in the original survey and those answering the follow-up survey were different (statistically significant difference at the p<0.05 level between the two surveys), suggesting the results are not comparable. Therefore, we did not use the results of this follow-up survey to adjust the weights as we have in the past. In the past, the nonresponse adjustment lowered the offer rate for smaller firms by one to three percentage points, so not making the adjustment this year makes the offer rate look somewhat higher when making comparisons to prior years. For 2010, we saw a very large and unexpected increase in the offer rate (from 60 percent in 2009 to 69 percent in 2010) overall and particularly for firms with 3 to 9 workers (from 46 percent in 2009 to 59 percent in 2010). While not making the adjustment this year added to the size of the change, there would have been a large and difficult to explain change even if a nonresponse adjustment comparable to previous years had been made.
New topics in the 2011 survey include questions on stoploss coverage for self-funded plans, cost sharing for preventive care, plan grandfathering resulting from the Affordable Care Act (ACA), and employer awareness of tax credits authorized under the ACA.
This year, we became aware that the way we have been using the data from the Census Bureau for calibration was incorrect and resulted in an over-count of the actual number of firms in the nation. Specifically, firms operating in more than one industry were counted more than once in computing the total firm count by industry, and firms with establishments were counted more than once in computing the total firm count by state (which affects the regional count). Because smaller firms are less likely to operate in more than one industry or state, the miscounts occurred largely for larger from sizes. The error affects only statistics that are weighted by the number of firms (such as the percent of firms offering health benefits or sponsoring a disease management plan). Statistics that are weighted by the number of workers or covered workers (such as average premiums, contributions, or deductibles) were not affected. We addressed this issue by proportionally distributing the correct national total count of firms within each firm size as provided by the U.S. Census Bureau across industry and state based on the observed distribution of workers. This effectively weights each firm within each category (industry or state) in proportion to its share of workers in that category. The end result is a synthetic count of firms across industry and state that sums to the national totals. Firm-weighted estimates resulting from this change show only small changes from previous estimates, because smaller firms have much more influence on national estimates. For example, the estimate of the percentage of firms offering coverage was reduced by about .05 percentage points in each year (in some years no change is evident due to rounding). Estimates of the percentage of large firms offering retiree benefits were reduced by a somewhat larger amount (about 2 percentage points). Historical estimates used in the 2011 survey release have been updated following this same process. As noted above, worker-weighted estimates from prior years were not affected by the miscount and remain the same.
New topics in the 2012 survey include the use of biometric screening, domestic partner benefits, and emergency room cost sharing. In addition, many of the questions on health reform included in the 2011 survey were retained, including stoploss coverage for self-funded plans, cost sharing for preventive care, and plan grandfathering resulting from the Affordable Care Act (ACA).
There are several variables in which missing data is calculated based on respondents’ answers to other questions (for example, when missing employer contributions to premiums is calculated from the respondent’s premium and the ratio of contributions to premiums). In 2012 the method to calculate missing premiums and contributions was revised; if a firm provides a premium for single coverage or family coverage, or a worker contribution for single coverage or family coverage, that information was used in the imputation. For example, if a firm provided a worker contribution for family coverage but no premium information, a ratio between the family premium and family contribution was imputed and then the family premium was calculated. In addition, in cases where premiums or contributions for both family and single coverage were missing, the hotdeck procedure was revised to draw all four responses from a single firm. The change in the imputation method did not make a significant impact on the premium or contribution estimates.
In 2012, the method for calculating the size of the sample was adjusted. Rather than using a combined response rate for panel and non-panel firms, separate response rates were used to calculate the number of firms to be selected in each strata. In addition, the mining stratum was collapsed into the agriculture and construction industry grouping. In sum, changes to the sampling method required more firms to be included and may have reduced the response rate in order to provide more balanced power within each strata.
To account for design effects, the statistical computing package R and the library package “survey” were used to calculate standard errors. All statistical tests are performed at the .05 level, unless otherwise noted. For figures with multiple years, statistical tests are conducted for each year against the previous year shown, unless otherwise noted. No statistical tests are conducted for years prior to 1999. In 2012 the method to test the difference between distributions across years was changed to use a Wald test which accounts for the complex survey design. In general this method was more conservative than the approach used in prior years.
In 2012, average coinsurance rates for prescription drugs, primary care office visits, specialty office visits, and emergency room visits include firms that have a minimum and/or maximum attached to the rate. In years prior to 2012 we did not ask firms the structure of their coinsurance rate. For most prescription drug tiers, and most services, the average coinsurance rate is not statically different depending on whether the plan has a minimum or maximum.
In 2012 the calculation of the response rates was adjusted to be slightly more conservative than previous years.
Starting in 2013, information on conventional plans was collected under the PPO section and therefore the covered worker weight was representative of all plan types.
Starting in 2014, we elected to estimate separate single and family coverage premiums for firms that provided premium amounts as the average cost for all covered workers, instead of differentiating between single and family coverage. This method more accurately accounted for the portion that each type of coverage contributes to the total cost for the 1 percent of covered workers who are enrolled at firms affected by this adjustment.
Several provisions of the ACA took effect on January 1, 2014 which impacted non-grandfathered plans as well as plans renewing in calendar year 2014, such as the requirement to have an out of pocket limit and a waiting period of not more than three months. As a result, firms with non-grandfathered plans that reported that they did not have out-of-pocket limits, or waiting periods exceeding three months, were contacted during our data-confirmation calls. We did not have information on the month in which a firm’s plan or plans was renewed. Many of these firms indicated that they had a plan year starting prior to January 2014, so these ACA provision were not yet in effect for these plans.
Firms with 200 or more workers were asked: “Does your firm offer health benefits for current employees through a private or corporate exchange? A private exchange is one created by a consulting firm or an insurance company, not by either a federal or state government. Private exchanges allow employees to choose from several health benefit options offered on the exchange.” Employers were still asked for plan information about their HMO, PPO, POS and HDHP/SO plan regardless of whether they purchased health benefits through a private exchange or not.
Beginning in 2014, we collected whether firms with a non-final disposition code (such as a firm that requested a callback at a later time or date) offered health benefits. By doing so we attempt to mitigate any potential non-response bias of firms either offering or not offering health benefits on the overall offer rate statistic.
To increase response rates, firms with 3-9 employees were offered an incentive of $75 in cash or as a donation to a charity of their choice to complete the full survey.
In 2015, weights were not adjusted using the nonresponse adjustment process described in previous years’ methods. As in past years, Kaiser/HRET conducted a small follow-up survey of those firms with 3 to 49 workers that refused to participate in the full survey. Based on the results of a McNemar test, we were not able to verify that the results of the follow-up survey were comparable to the results from the original survey. In 2010, the results of the McNemar test were also significant and we did not conduct a nonresponse adjustment.
The 2015 survey contains new information in several areas, including on wellness and biometric screening. In most cases, information reported in this section is not comparable with previous years’ findings. Data presented in the 2015 report reflect the firm’s benefits at the time they completed the interview. Some firms may report on a plan which took effect in the prior calendar year. Starting in 2015, firms were able to have a contribution and deductible in compliance with HSA requirements for the plan year.
Starting in 2015, employers were asked how many full-time equivalents they employed. In cases in which the number of full-time equivalents was relevant to the question, interviewer skip patterns may have depended on the number of FTEs.
In cases where a firm had multiple plans, they were asked about their strategies for containing the cost of specialty drugs for the plan with the largest enrollment.
Under the Affordable Care Act, non-grandfathered plans are required to have an out-of- pocket maximum. Non-grandfathered plans who indicated that they did not have an out of pocket maximum were asked to confirm whether their plan was grandfathered and whether that plan had an out-of-pocket maximum.
Between 2015 and 2016, we conducted a series of focus groups that led us to the conclusion that human resource and benefit managers at firms with between 20 and 49 employees think about health insurance premiums more similarly to benefit managers at smaller firms than larger firms. Therefore, starting in 2016, we altered the health insurance premium question pathway for firms with between 20-49 employees to match that of firms with 3-19 employees rather than firms with 50 or more employees. This change affected firms representing 8% of the total covered worker weight. We believe that these questions produce comparable responses and that this edit does not create a break in trend.
Starting in 2016, we made significant revisions to how the survey asks employers about their prescription drug coverage. In most cases, information reported in the Prescription Drug Benefits section is not comparable with previous years’ findings. First, in addition to the four standard tiers of drugs (generics, preferred, non-preferred, and lifestyle), we began asking firms about cost sharing for a drug tier that covers only specialty drugs. This new tier pathway in the questionnaire has an effect on the trend of the four standard tiers, since respondents to the 2015 survey might have previously categorized their specialty drug tier as one of the other four standard tiers. We did not modify the question about the number of tiers a firm’s cost-sharing structure has, but in cases in which the highest tier covered exclusively specialty drugs we reported it separately. For example, a firm with three tiers may only have copays or coinsurances for two tiers because their third tier copay or coinsurance is being reported as a specialty tier. Furthermore, in order to reduce survey burden, firms were asked about the plan attributes of only their plan type with the most enrollment. Therefore, in most cases, we no longer make comparisons between plan types. Lastly, prior to 2016, we required firms’ cost sharing tiers to be sequential, meaning that the second tier copay was higher than the first tier, the third tier was higher than the second, and the fourth was higher than the third. As drug formularies have become more intricate, many firms have minimum and maximums attached to their copays and coinsurances, leading us to believe it was no longer appropriate to assume that a firm’s cost sharing followed this sequential logic.
In cases where a firm had multiple plans, they were asked about their strategies for containing the cost of specialty drugs for the plan type with the largest enrollment. Between 2015 and 2016, we modified the series of ‘Select All That Apply’ questions regarding cost containment strategies for specialty drugs. In 2016, we elected to impute firms’ responses to these questions. We removed the option “Separate cost sharing tier for specialty drugs” and added specialty drugs as their own drug tier questionnaire pathway. We added question options on mail order drugs and prior authorization.
In 2016, we modified our questions about telemedicine to clarify that we were interested in the provision of health care services, and not merely the exchange of information, through telecommunication. We also added dependent and spousal questions to our health risk assessment question pathway.
While the Kaiser/HRET survey similar to other employer and household surveys has seen a general decrease in response rates over time, the decrease between the 2016 and 2017 response rates is not solely explained by this trend. In order to improve statistical power among sub-groups, including small firms and those with a high share of low income workers, the size of the sample was expanded from 5,732 in 2016 to 7,895 in 2017. As a result, the 2017 survey includes 204 more completes than the 2016 survey. While this generally increases the precision of estimates (for example, a reduction in the standard error for the offer rate from 2.2% to 1.8%), it has the effect of reducing the response rate. In 2017, non-panel firms had a response rate of 17%, compared to 62% for firms that had participated in one of the last two years.
To increase response rates, firms with 3-9 employees were offered an incentive for participating in the survey. A third of these firms were sent a $5 Starbucks gift card in the advance letter, a third were offered an incentive of $50 in cash or as a donation to a charity of their choice after completing the full survey, and a third of firms were offered no incentive at all. Our analysis does not show significant differences in responses to key variables among these incentive groups.
In 2017, weights were not adjusted using the nonresponse adjustment process described in previous years’ methods. As in past years, Kaiser/HRET conducted a small follow-up survey of those firms with 3-49 workers that refused to participate in the full survey. Based on the results of a McNemar test, we were not able to verify that the results of the follow-up survey were comparable to the results from the original survey. In 2010 and 2015, the results of the McNemar test were also significant and we did not conduct a nonresponse adjustment.
To reduce the length of survey, in several areas, including stoploss coverage for self-funded firms and cost sharing for hospital admissions, outpatient surgery, and emergency room visits, we revised the questionnaire to ask respondents about the attributes of their largest health plan rather than each plan type they may offer. This expands on the method we used for prescription drug coverage in 2016. Therefore, for these topics, aggregate variables represent the attributes of the firm’s largest plan type, and are not a weighted average of all of the firms plan types. In previous surveys, if a firm had two plan types, one with a copayment and one with a coinsurance for hospital admissions, the covered worker weight was allotted proportionally toward the average copayment and coinsurance based on the number of covered workers with either feature. With of this change, comparison among plans types is now a comparison of firms where any given plan type is the largest. The change only affects firms that have multiple plan types (58% of covered workers). After reviewing the responses and comparing them to prior years where we asked about each plan type, we find that the information we are receiving is similar to responses from previous years. For this reason, we will continue to report our results for these questions weighted by the number of covered workers in responding firms.
Starting in 2017, respondents were allowed to volunteer that their plans did not cover outpatient surgery or hospital admissions. Less than 1% of respondents indicated that their plan did not include coverage for these services. Cost sharing for hospital admissions, outpatient surgery and emergency room visits was imputed by drawing a firm similar in size and industry within the same plan type.
As in past years, we conducted a small follow-up survey of those firms with 3-49 workers that refused to participate in the full survey. Based on the results of a McNemar test, we were not able to verify that the results of the follow-up survey were comparable to the results from the original survey, and weights were not adjusted using the nonresponse adjustment process described in previous years’ methods. In 2010, 2015, and 2017, the results of the McNemar test were also significant and we did not conduct a nonresponse adjustment.
In light of a number of regulatory changes and policy proposals, we included new questions on the anticipated effects of the ACA’s individual mandate penalty repeal on the firm’s health benefits offerings, and the impact of the delay of the high cost plan tax, also known as the Cadillac tax, on the firm’s health benefits decisions. Also new in 2018 are questions asking about smaller firms’ use of level-funded premium plans, an alternative self-funding method with integrated stop loss coverage and a fixed monthly premium.
In 2018, we moved the battery of worker demographics questions from near the beginning of the survey to the end of the survey in an effort to improve the flow. There is no evidence that this move has impacted our survey findings and we will continue to monitor any suspected impacts.
The 2018 survey also expands on retiree health benefits questions, asking firms about cost reduction strategies, whether they contribute to the cost of coverage, and how retiree benefits are offered (e.g., through a Medicare Advantage contract, a traditional employer plan, private exchange, etc.).
Starting in 2018, we allowed respondents who did not know the combined maximum incentive or penalty an employee could receive for health screening and/or wellness and health promotion to answer a categorical question with specified ranges. This method is consistent with how we handle the percent of low-wage and high-wage workers at a firm. In 2018, 18% of respondents did not know the dollar value of the their incentive or penalty and 39% were able to estimate a range.
Starting in 2018, the survey began asking small firms who indicated that their plan was fully-insured whether the plan was level-funded. In a level-funded plan, employers make a set payment each month to an insurer or third party administrator which funds a reserve account for claims, administrative costs, and premiums for stop-loss coverage. These plans are often integrated and firms may not understand the complexities of the self-funded mechanisms underlying them. Some small employers who indicate that their plan is self-funded may also offer a plan that meets this definition. Respondents offering level funded plans were asked about any attachment points applying to enrollees. These firms were not less likely to answer this question, and including them doesn’t not substantially change the average. Prior to 2018, all firms reporting coverage as underwritten by an insurer were excluded from the stop-loss calculations.
The response option choices for the type of incentive or penalty for completing biometric screening or a health risk assessment changed from 2017 to 2018.
Starting in 2019, we discontinued a weighting adjustment informed by a follow-back survey of firms with 3-49 workers that refused to participate in the full survey. This adjustment was intended to reduce non-response bias in the offer rate statistic, under the assumption that firms that did not complete the survey were less likely to offer health benefits. The adjustment involves comparing the distribution of offering to non-offering firms in the full survey and the follow-back sample in the three smallest size categories (3-9, 10-24, 25-49). The adjustment is based on the differences between the two groups of firms and generally operates to adjust the weights of offering firms and non-offering firms to bring the counts closer together. However, if the distributions of the two groups differ to a statistically significant extent, we consider the follow-back survey to be a different population from the full survey and do not make any adjustment to the weights.
Although we cannot be sure of the reason, we are no longer witnessing the systematic upward bias on estimates for the offer rates of small firms that gave rise to the adjustment. Looking at the decade from 2010 to 2019, offer rates among firms responding to the follow-up survey have been higher for five of ten surveys. Firms with 3-49 employees responding to this follow-up survey have reported a higher offer rate than the full EHBS survey during the 2014, 2016, 2017, 2018, and 2019 surveys. An alternative way to measure non-response bias is to compare estimates throughout the fielding period.
In 2019, the percent of firms offering health benefit was similar in the last month of fielding to offer rates throughout the entire fielding period. Changes in both the survey methodology and the health insurance market have led us to become increasingly cautious about assuming that the follow back survey is a suitable proxy for the true population. Since 2014, we have collected offer rate information from firms before a final disposition is assigned. This method was introduced to reduce a bias in which firms who offer health benefits face a longer average survey than non-offering firms. This had the effect of increasing the percentage of firms for whom contact was made from whom we collected offer rate information. Additionally, we have also attempted to reduce non-response bias by increasing our data collection.
Recent changes in the marketplace also raise some concerns about the validity of the follow-back survey to be the basis for a weight adjustment. We have in recent years seen an increase in non-offering firms reporting that they are providing funds to employees to purchase non-group health insurance. We do not consider this to be an offer of health insurance by the firm, but we are concerned that the person who responds to the follow-back survey may not be able to make that distinction. The follow-back survey is a very simple set of questions asked to whoever answers the phone at a firm that refused to participate in the survey. In contrast, during the full-survey, we attempt to talk to the person most knowledgeable about health benefits, and the interviewers are trained to distinguish between types of benefit programs.
For 2019, making the weight adjustment would change offer rate statistic for all firms from 57% to 60%. Neither estimate is different than the 57% we reported last year (when the weight adjustment was not made because the statistical test indicated that the follow-back group was significantly different than the full survey group).
Starting in 2019, all presented calculations of out-of-pocket maximums strictly relied on an arithmetic average across all plans weighted by covered worker plan enrollment. In prior surveys, some figures (for example Figures 7.43, 7.45, and 7.46 in the 2018 report) were calculated based on the out-of-pocket maximum of the largest plan. This change did not meaningfully change any findings and ensured consistency within the out-of-pocket maximum section of the Employee Cost Sharing section.
For prescription drug coverage, similar to years past, if the firm reports that the worker pays the full cost for drugs on a particular tier and/or that the plan only offers access to a discount program, we do not consider this as offering covering for that drug tier. Starting this year, firms with multiple tiers that cover exclusively specialty drugs, were asked about the cost-sharing of the tier that is used most often. Cost-sharing for prescription drugs does not typically include mail order. Hospital, outpatient surgery and prescription drug cost-sharing was only asked of a firm’s largest plan type.
For 2019, we clarified the question that we use to ask firms whether or not they provide retiree health benefits; particularly, we added language that explicitly stated that firms that had terminated retiree health benefits but still has some retirees currently getting coverage, or that had current employees who will get retiree health coverage in the future, should answer yes to the question. We made this clarification in response to a large decline in the 2018 survey in the prevalence of retiree coverage (from 25% in 2017 to 18% in 2018). In the 2018 survey, we expressed concern that the then current public focus on public entities eliminating retiree benefits for future (not existing) retirees may be influencing the responses we were getting and said that we were going to add clarifying language to the survey question in future years.
For 2019, two open-ended questions were added to the survey in order to examine employer responses to the opioid crisis and obstacles preventing firms from adopting narrow network health plans. All responses to these questions were reviewed in a consistent manner by KFF staff to determine whether they could be recoded as an earlier multiple choice item, or if they could be sorted into new categories.
To increase participation in the final two weeks of the survey, a financial incentive was offered to firms with 3-9 employees, but only 6 firms that completed the survey within that time period qualified for the incentive. All respondents received a printed copy of the survey findings.
2020 was a challenging year both in administering the survey, as well as for many of our respondents who were scrambling to respond to the pandemic and the ensuing economic downturn. Our questionnaire was developed before the extent of the pandemic became apparent and the fielding period included response from both before and after. We asked respondents about their plans at the time of the interview, with approximately half of the responses (composing 50% of the covered worker weight) collected between January and March. The remaining interviews were completed before the middle of July. The survey is designed to track changes in benefit and cost between years and is not well suited to answer many of the important questions that emerged this year for a couple of reasons. Firstly, employers make decisions about their plans before the plan year begins. Premiums for self-funded employers are usually reported as the cost for a former worker to enroll in COBRA (deflated by an administrative fee) and do not reflect real-time spending. Many other plan features, including provider networks and cost-sharing, are set before a plan’s open enrollment period. We expect to learn more about how changes in benefits and utilization affected cost in the 2021 survey. Secondly, the month in which a respondent completes the survey is not random, the data collection firm completes interviews with larger panel firms first. We do not believe that these firms are similar to the non-panel firms that complete the survey later in the year. We believe these firms differ in ways which are not corrected for by weighting, which means we cannot look at how responses changed over the period to detect patterns of change. Thirdly, our sample is not sufficient to make many comparisons across fielding period. We plan to ask employers about changes to their plans and the impact of COVID-19 on their decision making in the 2021 survey.
In the summer of 2019, National Research LLC, which had conducted the Employer Health Benefit Survey since its inception, ceased operation. We engaged in a search to identify a new firm to conduct the 2020 survey and selected Davis Research LLC, based on their extensive experience in research on firms and establishments. While we believe that the sampling methodology, questionnaire and survey procedures were consistent between years, readers are strongly encouraged to consider “total survey error” when drawing conclusions about differences between statistics. Survey-adjusted standard errors (and statistical testing) measure uncertainty in estimates based on the sampling strategy, but do not measure biases that may be introduced through the data collection process such as interviewer or house effects. House effects refer to the impact of a data collection firm’s management and workflow processes on final statistics. We do not know how, or if at all, changing the data collection firm from National Research to Davis impacted estimates. Empirical studies of house effects vary greatly, with some reporting almost no impact and others observing significant differences in point estimates.
In order to minimize house effect impacts, we conducted extensive interview training with managers and interviewers at Davis, including sessions lead by interviewers with prior experience on the project. In addition, KFF pretested and observed interviews to verify that Davis’ quality assurance process was consistent with our understanding of how the survey had been conducted historically.
Starting in 2020, we limited the number of margins used to calibrate weights and adjust for non-response. Until 2019, our weighting procedure incorporated offer status, firm size, geographic region, and metropolitan status to adjust for unit nonresponse. Our 2020 weighting algorithm no longer relies on metropolitan vs. non-metropolitan as part of the non-response calculation. Separately, earlier surveys post-stratified each firm’s set of weights to industry, firm size, census division, and panel versus non-panel margins. Starting in 2020, we reduced this weight calibration to only industry and firm size controls. Finally, we collapsed industries in our 5,000+ employee firm size category, owing to the fact that many large businesses operate across multiple industries. All three of these changes were prompted by an increase in the number of calibration cells with low sample, which can result in individual firms with highly influential weights if not revised. Without this revision, some 2020 statistics would had been driven by a small number of firms with overly influential weights. Reducing the number of variables in these improves the stability of some published estimates. This issue arose in part due to the smaller number of completed interviews in 2020 relative to 2019.
Historically we measured the annual changes in workers’ wages and in inflation by comparing the values for April of the previous year and April of the current year. This year the labor market underwent significant disruptions in March and April as employers laid off and furloughed large numbers of workers in response to the COVID-19 pandemic. A relatively high share of lower-wage workers were furloughed and laid off during these months, resulting in a high change in wages as measured from April to April. In response to this unprecedented change in the labor market, we have elected to change how we calculate workers wages and inflation. Beginning with our 2020 publication, we are now calculating the change in workers wages and inflation based on an average of the first quarter of each year. Using this method, workers wages increased 3.4% compared to 7.7% between April and April. And similarly inflation increased 2.1% compared to 0.3%. Prior to 2020, both methods produced very similar estimates.
HDHP/SO includes high-deductible health plans with a deductible of at least $1,000 for single coverage and $2,000 for family coverage and that offer either a Health Reimbursement Arrangement (HRA) or a Health Savings Account (HSA). Although HRAs can be offered along with a health plan that is not an HDHP, the survey collected information only on HRAs that are offered along with HDHPs. For specific definitions of HDHPs, HRAs, and HSAs, see the introduction to Section 8.↩︎
Response rate estimates are calculated by dividing the number of completes over the number of refusals and the fraction of the firms with unknown eligibility to participate estimated to be eligible. Firms determined to be ineligible to complete the survey are not included in the response rate calculation.↩︎
Estimates presented in [Figure 2.1], [Figure 2.2], [Figure 2.3], [Figure 2.4], [Figure 2.5], and [Figure 2.6] are based on the sample of both firms that completed the entire survey and those that answered just one question about whether they offer health benefits.↩︎
The average annual premiums in 2021, are $7,739 for single coverage and $22,221 for family coverage. Over the last year, the average premium for single coverage increased by 4% and the average premium for family coverage increased by 4%. The average family premium has increased 47% since 2011 and 22% since 2016.
The average premium for single coverage in 2021 is $7,739 per year. The average premium for family coverage is $22,221 per year [Figure 1.1].
The average annual premium for single coverage for covered workers in small firms ($7,813) is similar to the average premium for covered workers in large firms ($7,709). The average annual premium for family coverage for covered workers in small firms ($21,804) is similar to the average premium for covered workers in large firms ($22,389). [Figure 1.3].
The average annual premiums for covered workers in HDHP/SOs are lower than the average premiums for coverage overall for both single coverage ($7,016 v. $7,739) and family coverage ($20,802 vs. $22,221). The average premiums for covered workers enrolled in PPOs are higher than the overall average premiums for both single coverage ($8,092 v. $7,739) and family coverage ($23,312 vs. $22,221) [Figure 1.1].
The average premiums for covered workers with single coverage are relatively high in the Northeast. The average premiums for covered workers with family coverage are relatively high in the Northeast and relatively low in the South [Figure 1.4].
The average premium for single coverage varies across industries. Compared to the average single premiums for covered workers in other industries, the average premiums for covered workers in the Manufacturing, and in the Agriculture/Mining/Construction categories are relatively low and the average premium for Health Care workers is relatively high [Figure 1.5].
The average premiums for covered workers in firms with a relatively large share of lower-wage workers (where at least 35% of the workers earn $28,000 annually or less) are lower than the average premium for covered workers in firms with a smaller share of lower-wage workers for both single coverage ($7,156 vs. $7,796) and family coverage ($20,315 vs. $22,407) [Figures 1.6 and 1.7].
The average annual premiums for covered workers in private for-profit firms are lower than average annual premiums for covered workers in other firms for both single and family coverage. Average annual premiums for covered workers in private not-for-profit firms are higher than average annual premiums for covered workers in other firms for both single and family coverage [Figures 1.6 and 1.7].
The average annual premiums for covered workers in firms with at least some union workers are higher than the average premiums for workers in firms with no union workers for both single coverage ($8,014 vs. $7,590) and family coverage ($23,095 vs. $21,747) [Figure 1.8].
Figure 1.1: Average Annual Premiums for Covered Workers, Single and Family Coverage, by Plan Type, 2021
Figure 1.2: Average Annual Premiums for Covered Workers, Single and Family Coverage, by Firm Size, 2021
Figure 1.3: Average Monthly and Annual Premiums for Covered Workers, by Plan Type and Firm Size, 2021
Figure 1.4: Average Monthly and Annual Premiums for Covered Workers, by Plan Type and Region, 2021
Figure 1.5: Average Monthly and Annual Premiums for Covered Workers, by Plan Type and Industry, 2021
Figure 1.6: Average Annual Premiums for Covered Workers With Single Coverage, by Firm Characteristics, 2021
Figure 1.7: Average Annual Premiums for Covered Workers With Family Coverage, by Firm Characteristics, 2021
Figure 1.8: Average Annual Premiums for Covered Workers, by Firm Characteristics and Firm Size, 2021
PREMIUM DISTRIBUTION
There remains considerable variation in premiums for both single and family coverage.
Nineteen percent of covered workers are employed in a firm with a single premium at least 20% higher than the average single premium, while 23% of covered workers are in firms with a single premium less than 80% of the average single premium [Figure 1.9].
For family coverage, 18% of covered workers are employed in a firm with a family premium at least 20% higher than the average family premium, while 22% of covered workers are in firms with a family premium less than 80% of the average family premium [Figure 1.9].
Ten percent of covered workers are in a firm with an average annual premium of at least $10,000 for single coverage [Figure 1.10]. Ten percent of covered workers are in a firm with an average annual premium of at least $29,000 for family coverage [Figure 1.11].
Figure 1.9: Distribution of Annual Premiums for Single and Family Coverage Relative to the Average Annual Single or Family Premium, 2021
Figure 1.10: Distribution of Annual Premiums for Covered Workers With Single Coverage, 2021
Figure 1.11: Distribution of Annual Premiums for Covered Workers With Family Coverage, 2021
PREMIUM CHANGES OVER TIME
The average premium for single coverage is 4% higher than the single premium last year, and the average premium for family coverage is 4% higher than the average family premium last year [Figure 1.12].
The average premium for single coverage has grown 20% since 2016, similar to the growth in the average premium for family coverage (22%) over the same period [Figure 1.12].
The $22,221 average family premium in 2021 is 22% higher than the average family premium in 2016 and 47% higher than the average family premium in 2011. The 22% family premium growth in the past five years is similar to the 20% growth between 2011 and 2016 [Figure 1.12].
The average family premiums for both small and large firms have increased at similar rates since 2016 (24% for small firms and 22% for large firms). For small firms, the average family premium rose from $17,546 in 2016 to $21,804 in 2021. For large firms, the average family premium rose from $18,395 in 2016 to $22,389 in 2021 [Figure 1.13].
The average family premium has grown faster since 2011 for covered workers in small as compared to covered workers in large firms (55% in small firms and 44% in large firms). In small firms, the average family premium rose from $14,098 in 2011 to $21,804 in 2021. In large firms, the average family premium rose from $15,520 in 2011 to $22,389 in 2021 [Figures 1.13].
For covered workers in large firms, over the past five years, the average family premium in firms that are fully insured has grown at a similar rate to the average family premium for covered workers in fully or partially self-funded firms (16% for fully insured plans and 23% for self-funded firms) [Figure 1.14].
The average premiums for family coverage have risen faster than inflation over the last 5 years (22% vs. 11%) and the last 10 years (47% vs. 19%) [Figure 1.15].
Figure 1.12: Average Annual Premiums for Single and Family Coverage, 1999-2021
Figure 1.13: Average Annual Premiums for Covered Workers With Family Coverage, by Firm Size, 1999-2021
Figure 1.14: Among Workers in Large Firms, Average Annual Premiums for Family Coverage, by Funding Arrangement, 1999-2021
Figure 1.15: Cumulative Premium Increases, Inflation, and Earnings for Covered Workers With Family Coverage, 2001-2021
Section 2: Health Benefits Offer Rates
While nearly all large firms (200 or more workers) offer health benefits to at least some workers, small firms (3-199 workers) are significantly less likely to do so. The percentage of all firms offering health benefits in 2021 (59%) is similar to the percentages of firms offering health benefits last year (56%) and five years ago (56%).
Firms not offering health benefits continue to cite cost as the most important reason they do not do so. Almost all (96%) firms that offer coverage offer both single and family coverage.
FIRM OFFER RATES
In 2021, 59% of firms offer health benefits, similar to the percentage last year [Figure 2.1].
The overall percentage of firms offering health benefits in 2021 is similar to the percentages offering health benefits in 2016 (56%) and 2011 (60%) [Figure 2.1].
Ninety-nine percent of large firms offer health benefits to at least some of their workers. In contrast, only 58% of small firms offer health benefits [Figures 2.2 and 2.3]. The percentages of both small and large firms offering health benefits to at least some of their workers in 2021 are similar to those last year [Figure 2.2].
The smallest-sized firms are least likely to offer health insurance: 49% of firms with 3-9 workers offer coverage, compared to 65% of firms with 10-24 workers, 74% of firms with 25-49 workers, and 93% of firms with 50-199 workers [Figure 2.3]. Since most firms in the country are small, variation in the overall offer rate is driven largely by changes in the percentages of the smallest firms (3-9 workers) offering health benefits [Figure 2.4]. For more information on the distribution of firms in the country, see the Survey Design and Methods Section and [Figure M.6].
Only 56% of firms with 3-49 workers offer health benefits to at least some of their workers, compared to 94% of firms with 50 or more workers [Figure 2.5].
Because most workers are employed by larger firms, most workers work at a firm that offers health benefits to at least some of its employees. Ninety-one percent of all workers are employed by a firm that offers health benefits to at least some of its workers [Figure 2.6].
Figure 2.1: Percentage of Firms Offering Health Benefits, 1999-2021
Figure 2.2: Percentage of Firms Offering Health Benefits, by Firm Size, 1999-2021
Figure 2.3: Percentage of Firms Offering Health Benefits, by Firm Size, Region, and Industry, 2021
Figure 2.4: Percentage of Firms Offering Health Benefits, by Firm Size, 1999-2021
Figure 2.5: Percentage of Firms Offering Health Benefits to at Least Some of Their Workers, by Firm Size, 2021
Figure 2.6: Percentage of Workers at Firms That Offer Health Benefits to at Least Some Workers, by Firm Size, 1999-2021
Figure 2.7: Percentage of Firms Offering Health Benefits Which Offer Family Coverage, by Firm Size, 2021
PART-TIME WORKERS
Among firms offering health benefits, relatively few offer benefits to their part-time workers.
The Affordable Care Act (ACA) defines full-time workers as those who on average work at least 30 hours per week, and part-time workers as those who on average work fewer than 30 hours per week. The employer shared responsibility provision of the ACA requires that firms with at least 50 full-time equivalent employees offer most full-time employees coverage that meets minimum standards or be assessed a penalty.10
Beginning in 2015, we modified the survey to explicitly ask employers whether they offered benefits to employees working fewer than 30 hours. Our previous question did not include a definition of “part-time”. For this reason, historical data on part-time offer rates are shown, but we did not test whether the differences between 2014 and 2015 were significant. Many employers may work with multiple definitions of part-time; one for their compliance with legal requirements and another for internal policies and programs.
Thirty-six percent of large firms that offer health benefits in 2021 offer health benefits to part-time workers, similar to the percentage in 2020 [Figure 2.8]. The share of large firms offering health benefits to part-time workers increases with firm size [Figure 2.9].
Figure 2.8: Among Firms Offering Health Benefits, Percentage That Offer to Part-Time Workers, by Firm Size, 1999-2021
Figure 2.9: Among Firms Offering Health Benefits, Percentage That Offer to Part-Time Workers, by Firm Size, 2021
ASSISTING EMPLOYEES TO PURCHASE COVERAGE IN NON-GROUP MARKET
Some employers provide funds to some or all of their employees to help them purchase coverage in the individual (“non-group”) market. Employers that do not otherwise offer health benefits may do this an alternative to offering a group plan, or employers that offer a group plan to some employees may use this approach for some types or classes of workers, such as part-time employees. One way an employer can provide tax-preferred assistance for employees to purchase non-group coverage is through an Individual Coverage Health Reimbursement Arrangement, or ICHRA. Both employers that offer and those that do not offer health benefits were asked if they provide funds to any employee to purchase non-group coverage.
Four percent of firms offering health benefits and 7% of firms not offering health benefits offer funds to one or more of their employees to purchase non-group coverage in 2021 [Figure 2.10].
Among small firms not offering health benefits, 7% offer funds to one or more of their employees to purchase non-group coverage, similar to the percentage (8%) last year [Figure 2.11].
Among all firms (offering and not offering health benefits) that do not offer funds to any employees to purchase non-group coverage in 2021, only 1% are “very likely” and an additional 7% are “somewhat likely” to offer an ICHRA to at least some employees in the next two years.
Large firms that currently offer or intend to offer an ICHRA were asked about the types of employees that are or would be offered such an arrangement. Forty-four percent offer or intend to offer an ICHRA to all their employees, 16% offer or intend to offer to part-time or seasonal workers, 60% offer or intend to offer to low-wage workers, and 19% offer or intend to offer to some other group of employees, such as only full-time employees.
Figure 2.10: Among Firms Offering Health Benefits, Percentage of Firms That Provide Workers Funds to Purchase Non-Group Insurance, Such As Through an ICHRA, Firm Size, 2021
Figure 2.11: Among Small Firms Not Offering Health Benefits, Percentage of Firms That Provide Workers Funds to Purchase Non-Group Insurance, by Firm Size, 2012-2021
Figure 2.12: Among Small Firms Not Offering Health Benefits, How Likely Is Firm to Offer an ICHRA in the Next Two Years, by Firm Size, 2021
Figure 2.13: Among Firms Offering Health Benefits, How Likely Is Firm to Offer an ICHRA in the Next Two Years, by Firm Size, 2021
FIRMS NOT OFFERING HEALTH BENEFITS
The survey asks firms that do not offer health benefits several questions, including whether they have offered insurance or shopped for insurance in the recent past, their most important reasons for not offering coverage, and their opinion on whether their employees would prefer an increase in wages or health insurance if additional funds were available to increase their compensation. Because such a small percentage of large firms report not offering health benefits, we present responses for small non-offering firms only.
The cost of health insurance remains the primary reason cited by firms for not offering health benefits. Among small firms not offering health benefits, 30% cite high cost as “the most important reason” for not doing so. Other factors include employees are covered by another health plan (including a spouse’s plan) (21%), “the firm is too small” (25%), and “most employees are part-time or temporary workers” (7%). Few small firms indicate that they do not offer because they believe employees will get a better deal on the health insurance exchanges (1%) [Figure 2.14].
Some small non-offering firms have either offered health insurance in the past five years or shopped for health insurance in the past year.
Twelve percent of small non-offering firms have offered health benefits in the past five years, similar to than the percentage reported last year [Figure 2.15].
Ten percent of small non-offering firms have shopped for coverage in the past year, similar to the percentage last year (17%) [Figure 2.15].
Among small non-offering firms that report they stopped offering coverage within the past five years, 16% stopped offering coverage within the past year.
Seventy-four percent of small firms not offering health benefits believed that their employees would prefer a two dollar per hour increase in wages rather than health insurance. [Figure 2.16].
Figure 2.14: Among Small Firms Not Offering Health Benefits, Most Important Reason for Not Offering, 2021
Figure 2.15: Among Small Firms Not Offering Health Benefits, Percentage of Firms That Report the Following Actions, 2009-2021
Figure 2.16: Among Small Firms Not Offering Health Benefits, Firms’ View of Employees’ Preference for Higher Wages or Health Insurance Benefits, 2003-2021
Section 3: Employee Coverage, Eligibility, and Participation
Employers are the principal source of health insurance in the United States, providing health benefits for almost 155 million nonelderly people.11 Most workers are offered health coverage at work, and most of the workers who are offered coverage take it. Workers may not be covered by their own employer for several reasons: their employer may not offer coverage, they may not be eligible for the benefits offered by their firm, they may elect to receive coverage through their spouse’s employer, or they may refuse coverage from their firm. In 2021, 62% of workers in firms offering health benefits are covered by their own firm, similar to the percentages last year, five years ago and ten years ago.
ELIGIBILITY
Even in firms that offer health benefits, some workers may not be eligible to participate.12 Many firms, for example, do not offer coverage to part-time or temporary workers. Among workers in firms offering health benefits in 2021, 81% are eligible to enroll in the benefits offered by their firm, similar to the percentages last year, five years ago, and 10 years ago, for both small and large firms [Figures 3.1 and 3.2].
Eligibility varies considerably by firm wage level. Workers in firms with a relatively large share of lower-wage workers (where at least 35% of workers earn $28,000 a year or less) have a lower average eligibility rate than workers in firms with a smaller share of lower-wage workers (75% vs. 82%) [Figure 3.6].
Workers in firms with a relatively large share of higher-wage workers (where at least 35% earn $66,000 or more annually) have a higher average eligibility rate than workers in firms with a smaller share of higher-wage workers (87% vs. 75%) [Figure 3.6].
Eligibility also varies by the age of the workforce. Those in firms with a relatively small share of younger workers (where fewer than 35% of the workers are age 26 or younger) have a higher average eligibility rate than those in firms with a larger share of younger workers (83% vs. 64%) [Figure 3.6].
Eligibility rates vary considerably for workers in different industries. The average eligibility rate remains particularly low for workers in retail firms (55%) [Figure 3.3].
Figure 3.1: Eligibility, Take-Up, and Coverage Rates for Workers in Firms Offering Health Benefits, by Firm Size, 1999-2021
Figure 3.2: Eligibility and Coverage Rates for Workers in Firms Offering Health Benefits, 1999-2021
Figure 3.3: Eligibility, Take-Up, and Coverage Rates in Firms Offering Health Benefits, by Firm Size, Region, and Industry, 2021
Figure 3.4: Eligibility, Take-Up, and Coverage Rates in Firms Offering Health Benefits, by Firm Size, 2021
Figure 3.5: Among Workers at Small Firms, Eligibility for Workers at Their Own Firms, 1999-2021
Figure 3.6: Among Workers in Firms Offering Health Benefits, Percentage of Workers Eligible for Health Benefits Offered by Their Firm, by Firm Characteristics, 2021
TAKE-UP RATE
Seventy-seven percent of eligible workers take up coverage when it is offered to them, similar to the percentage last year [Figure 3.1].13
The likelihood of a worker accepting a firm’s offer of coverage varies by firm wage level. Eligible workers in firms with a relatively large share of lower-wage workers have a lower average take up rate than eligible workers in firms with a smaller share of lower-wage workers (63% vs. 79%) [Figure 3.7].
Eligible workers in firms with a relatively large share of higher-wage workers have a higher average take up rate than those in firms with a smaller share of higher-wage workers (81% vs. 73%) [Figure 3.7].
The likelihood of a worker accepting a firm’s offer of coverage also varies with the age distribution of the workforce. Eligible workers in firms with a relatively large share of younger workers have a lower average take up rate than those in firms with a smaller share of younger workers (72% vs. 78%) [Figure 3.7].
Eligible workers in private, for-profit firms have a lower average take up rate (74%) and eligible workers in public firms have a higher average take up rate (86%) than workers in other firm types [Figure 3.7].
The average percentages of eligible workers taking up benefits in offering firms also varies across industries [Figure 3.3].
The share of eligible workers taking up benefits in offering firms (77%) is similar to the shares in 2016 (79%) [Figure 3.1].
Figure 3.7: Among Workers in Firms Offering Health Benefits, Percentage of Eligible Workers Who Take Up Health Benefits Offered by Their Firm, by Firm Characteristics, 2021
Figure 3.8: Among Workers in Firms Offering Health Benefits, Percentage of Eligible Workers Who Take Up Health Benefits Offered by Their Firm, by Firm Size, 1999-2021
COVERAGE
In 2021, the percentage of workers at firms offering health benefits covered by their firm’s health plan is 62%, similar to the percentage last year [Figure 3.1] and [Figure 3.2].
The coverage rate at firms offering health benefits is similar for small firms and large firms in 2021. These rates are similar to the rates last year for both small firms and large firms [Figure 3.1] and [Figure 3.3].
There is significant variation by industry in the coverage rate among workers in firms offering health benefits. The average coverage rate is particularly low in the retail industry (40%) [Figure 3.3].
There also is variation by firm wage levels. Among workers in firms offering health benefits, those in firms with a relatively large share of lower-wage workers are less likely to be covered by their own firm than workers in firms with a smaller share of lower-wage workers (47% vs. 64%). A similar pattern exists in firms with a relatively large share of higher-wage workers, with workers in these firms being more likely to be covered by their employer’s health benefits than those in firms with a smaller share of higher-wage workers (71% vs. 55%) [Figure 3.9].
The age distribution of workers is also related to variation in coverage rates. Among workers in firms offering health benefits, those in firms with a relatively small share of younger workers are more likely to be covered by their own firm than those in firms with a larger share of younger workers (64% vs. 46%). Similarly, workers in offering firms with a relatively large share of older workers are more likely to be covered by their own firm than those in firms with a smaller share of older workers (66% vs. 59%) [Figure 3.9].
Among workers in firms offering health benefits, those working in public firms are more likely than workers in other firm types to be covered by their own firm [Figure 3.9].
Among workers in all firms, including those that offer and those that do not offer health benefits, 56% are covered by health benefits offered by their employer, similar to the percentages last year, five years ago, and ten years ago [Figure 3.10].
Figure 3.9: Among Workers in Firms Offering Health Benefits, Percentage of Workers Covered by Health Benefits Offered by Their Firm, by Firm Characteristics, 2021
Figure 3.10: Percentage of Workers Covered by Their Firm’s Health Benefits, 1999-2021
Figure 3.11: Percentage of All Workers Covered by Their Firm’s Health Benefits, Both in Firms Offering and Not Offering Health Benefits, by Firm Size, 1999-2021
See Section 2 for part-time and temporary worker offer rates.↩︎
In 2009, we began weighting the percentage of workers that take up coverage by the number of workers eligible for coverage. The historical take-up estimates have also been updated. See the Survey Design and Methods section for more information.↩︎
Section 4: Types of Plans Offered
Most firms that offer health benefits offer only one type of health plan (75%). Large firms (200 or more workers) are more likely than small firms (3-199 workers) to offer more than one type of health plan. Firms are most likely to offer their workers a PPO plan and are least likely to offer a conventional plan (sometimes known as indemnity insurance).
NUMBER OF PLAN TYPES OFFERED
In 2021, 75% of firms offering health benefits offer only one type of health plan. Large firms are more likely than small firms to offer more than one plan type (59% vs. 23%) [Figure 4.1].
Sixty-two percent of covered workers are employed in a firm that offers more than one type of health plan. Seventy-one percent of covered workers in large firms are employed by a firm that offers more than one plan type, compared to 38% in small firms [Figure 4.2].
Sixty-seven percent of covered workers in firms offering health benefits work in firms that offer one or more PPOs; 58% work in firms that offer one or more HDHP/SOs; 23% work in firms that offer one or more HMOs; 10% work in firms that offer one or more POS plans; and 2% work in firms that offer one or more conventional plans [Figure 4.4].
Among covered workers in firms offering only one type of health plan, 54% are in firms that only offer one or more PPOs and 26% are in firms that only offer one or more HDHP/SOs [Figure 4.5].
Figure 4.1: Among Firms Offering Health Benefits, Percentage of Firms That Offer One, Two, or Three or More Plan Types, by Firm Size, 2021
Figure 4.2: Among Firms Offering Health Benefits, Percentage of Covered Workers in Firms Offering One, Two, or Three or More Plan Types, by Firm Size, 2021
Figure 4.3: Among Firms Offering Health Benefits, Percentage of Firms That Offer the Following Plan Types, by Firm Size, 2021
Figure 4.4: Among Firms Offering Health Benefits, Percentage of Covered Workers in Firms That Offer the Following Plan Types, by Firm Size, 2021
Figure 4.5: Among Firms Offering Only One Type of Health Plan, Percentage of Covered Workers in Firms That Offer the Following Plan Type, by Firm Size, 2021
CHOICE OF HDHP/SO PLANS
Some firms only offer workers an HDHP/SO, or do not make other plan choices available to some workers. At 58% of firms that offer an HDHP/SO, at least some workers can only choose an HDHP/SO, while 42% of firms that offer an HDHP/SO allow workers also to choose between an HDHP/SO and other plan types [Figure 4.6].
Figure 4.6: Among Firms Offering an HDHP/SO, Percentage of Firms That Offer Workers Various Plan Type Choices, by Firm Size, 2021
The survey collects information on a firm’s plan with the largest enrollment in each of the plan types. While we know the number of plan types a firm has, we do not know the total number of plans a firm offers workers. In addition, firms may offer different types of plans to different workers. For example, some workers might be offered one type of plan at one location, while workers at another location are offered a different type of plan.
HMO is a health maintenance organization. The survey defines an HMO as a plan that does not cover non-emergency out-of-network services.
PPO is a preferred provider organization. The survey defines PPOs as plans that have lower cost sharing for in-network provider services, and do not require a primary care gatekeeper to screen for specialist and hospital visits.
POS is a point-of-service plan. The survey defines POS plans as those that have lower cost sharing for in-network provider services, but do require a primary care gatekeeper to screen for specialist and hospital visits.
HDHP/SO is a high-deductible health plan with a savings option such as an HRA or HSA. HDHP/SOs are treated as a distinct plan type even if the plan would otherwise be considered a PPO, HMO, POS plan, or indemnity plan. These plans have a deductible of at least $1,000 for single coverage and $2,000 for family coverage and are offered with an HRA, or are HSA-qualified. See Section 8 for more information on HDHP/SOs.
Conventional/Indemnity The survey defines conventional or indemnity plans as those that have no preferred provider networks and the same cost sharing regardless of physician or hospital.
Section 5: Market Shares of Health Plans
PPOs are the most common plan type, covering 46% of covered workers, followed by HDHP/SOs, HMOs, POS plans, and conventional plans. All of these percentages are similar to the enrollment percentages in 2020.
Forty-six percent of covered workers are enrolled in PPOs, followed by HDHP/SOs (28%), HMOs (16%), POS plans (9%), and conventional plans (1%) [Figure 5.1].
The percentage of covered workers enrolled in HDHP/SOs is similar to the percentages last year (31%) and five years ago (29%), but higher than the percentage 10 years ago (17%). The percentage of covered workers enrolled in PPOs decreased 9% over the past decade [Figure 5.1].
The percentage of covered workers enrolled in HMOs (16%) is similar to the percentages last year (11%) and five years ago (15%). This percentage has moved around over the last few years and we are unsure as to why. We will continue to watch this topic.
A larger share of covered workers are enrolled in HDHP/SOs than in HMOs in small and large firms [Figure 5.2].
Covered workers in large firms are more likely to be enrolled in HDHP/SOs than covered workers in small firms (30% vs. 23%) [Figure 5.2]. Covered workers in small firms are much more likely than covered workers in large firms to be enrolled in POS plans (17% vs. 5%) [Figure 5.2].
Plan enrollment patterns also differ across regions.
HMO enrollment is significantly higher in the West (34%), and is significantly lower in the Midwest (8%) and in the South (10%) [Figure 5.3].
Covered workers in the Midwest (39%) are more likely to be enrolled in HDHP/SOs than workers in other regions, while covered workers in the West (19%) are less likely to be enrolled in HDHP/SOs [Figure 5.3].
Figure 5.1: Distribution of Health Plan Enrollment for Covered Workers, by Plan Type, 1988-2021
Figure 5.2: Distribution of Health Plan Enrollment for Covered Workers, by Plan Type and Firm Size, 2021
Figure 5.3: Distribution of Health Plan Enrollment for Covered Workers, by Firm Size, Region, and Industry, 2021
Section 6: Worker and Employer Contributions For Premiums
Covered workers on average contribute 17% of the premium for single coverage and 28% of the premium for family coverage in 2021.14 The average monthly worker contributions are $108 for single coverage ($1,299 annually) and $497 for family coverage ($5,969 annually). The average contribution amount for family coverage is higher for covered workers in small firms (3-199 workers) than for covered workers in large firms (200 or more workers) ($7,710 vs. $5,269).
In 2021, covered workers on average contribute 17% of the premium for single coverage and 28% of the premium for family coverage. The average percentage contributed for single coverage has remained stable in recent years. The average percentage contributed for family coverage is similar to the percentage (27%) last year [Figure 6.1].15
Covered workers in small firms on average contribute a much higher percentage of the premium for family coverage than covered workers in large firms (37% vs. 24%) [Figure 6.2].
Workers with single coverage have an average contribution of $108 per month ($1,299 annually), and workers with family coverage have an average contribution of $497 per month ($5,969 annually) toward their health insurance premiums [Figure 6.3], [Figure 6.4], and [Figure 6.5].
The average worker contribution in HDHP/SOs for family coverage is lower than the overall average worker contribution for family coverage ($5,129 vs. $5,969) [Figure 6.6].
Worker contributions also differ by firm size.
Covered workers in small firms on average contribute significantly more annually for family coverage than covered workers in large firms ($7,710 vs. $5,269). The average contributions amounts for covered workers in small and large firms are similar for single coverage [Figure 6.7].
Figure 6.1: Average Percentage of Premium Paid by Covered Workers for Single and Family Coverage, 1999-2021
Figure 6.2: Average Percentage of Premium Paid by Covered Workers for Single and Family Coverage, by Firm Size, 2021
Figure 6.3: Average Monthly Worker Premium Contributions for Single and Family Coverage, 1999-2021
Figure 6.4: Average Annual Worker and Employer Contributions to Premiums and Total Premiums for Single Coverage, 1999-2021
Figure 6.5: Average Annual Worker and Employer Contributions to Premiums and Total Premiums for Family Coverage, 1999-2021
Figure 6.6: Average Annual Worker and Employer Premium Contributions and Total Premiums for Single and Family Coverage, by Plan Type, 2021
Figure 6.7: Average Annual Worker and Employer Premium Contributions and Total Premiums for Single and Family Coverage, by Firm Size, 2021
Figure 6.8: Average Annual Worker and Employer Premium Contributions and Total Premiums for Single Coverage, by Plan Type and Firm Size, 2021
Figure 6.9: Average Annual Employer and Worker Premium Contributions and Total Premiums for Family Coverage, by Plan Type and Firm Size, 2021
DISTRIBUTIONS OF WORKER CONTRIBUTIONS TO THE PREMIUM
About nine-tenths of covered workers are in a plan where the employer contributes at least half of the premium for both single and family coverage.
Twelve percent of covered workers are in a plan where the employer pays the entire premium for single coverage, while only 4% of covered workers are in a plan where the employer pays the entire premium for family coverage [Figure 6.10].
Covered workers in small firms are much more likely than covered workers in large firms to be in a plan where the employer pays the entire premium.
Twenty-nine percent of covered workers in small firms have an employer that pays the full premium for single coverage, compared to 5% of covered workers in large firms [Figure 6.10].
For family coverage, 10% of covered workers in small firms have an employer that pays the full premium, compared to 1% of covered workers in large firms [Figure 6.10].
Thirteen percent of covered workers are in a plan with a worker contribution of more than half of the premium for family coverage [Figure 6.10].
Thirty-one percent of covered workers in small firms work in a firm where the worker contribution for family coverage is more than 50% of the premium, a much higher percentage than the 5% of covered workers in large firms [Figure 6.10].
Small shares of covered workers in small firms (3%) and large firms (1%) must pay more than 50% of the premium for single coverage [Figure 6.10].
There is substantial variation among workers in both small and large firms in the dollar amounts they must contribute.
Among covered workers in small firms, 34% have a contribution for single coverage of less than $500, while 20% have a contribution of $2,000 or more [Figure 6.13]. For family coverage, 13% have a contribution of less than $1,500, while 27% have a contribution of $10,500 or more [Figure 6.14].
Among covered workers in large firms, 12% have a contribution for single coverage of less than $500, while 16% have a contribution of $2,000 or more [Figure 6.13]. For family coverage, only 3% have a contribution of less than $1,500, while 5% have a contribution of $10,500 or more [Figure 6.14].
Figure 6.10: Distribution of Percentage of Premium Paid by Covered Workers for Single and Family Coverage, by Firm Size, 2021
Figure 6.11: Distribution of Percentage of Premium Paid by Covered Workers for Single Coverage, 2002-2021
Figure 6.12: Distribution of Percentage of Premium Paid by Covered Workers for Family Coverage, 2002-2021
Figure 6.13: Distribution of Worker Contributions for Single Coverage, by Firm Size, 2021
Figure 6.14: Distribution of Worker Contributions for Family Coverage, by Firm Size, 2021
DIFFERENCES BY FIRM CHARACTERISTICS
The percentage of the premium paid by covered workers varies by firm characteristics.
Covered workers in private, for-profit firms have relatively high premium contribution rates for single (20%) and family (30%) coverage. Covered workers in public firms and have relatively low premium contributions for single (11%) and family (23%) coverage. The average single coverage contribution rate for covered workers in private not-for-profit firms (16%) is also relatively low [Figure 6.17].
Covered workers in firms with a relatively large share of lower-wage workers (where at least 35% of workers earn $28,000 a year or less) have a higher average contribution rate for family coverage than those in firms with a smaller share of lower-wage workers (35% vs. 27%) [Figure 6.17].
Covered workers in firms with a relatively large share of higher-wage workers (where at least 35% earn $66,000 or more annually) have a lower average contribution rate for family coverage than those in firms with a smaller share of higher-wage workers (24% vs. 32%) [Figure 6.17].
Covered workers in firms with a relatively large share of younger workers (where at least 35% of workers are age 26 or younger) have higher average contribution rates for single coverage (23% vs. 17%) and for family coverage (35% vs. 28%) than those in firms with a smaller share of younger workers [Figure 6.17].
Covered workers in firms that have at least some union workers have a lower average contribution rate for family coverage (20% vs. 33%) than those in firms without any union workers [Figure 6.17].
Among covered workers in large firms, those that are in partially or completely self-funded plans on average have a lower average contribution rate for family coverage than workers in firms that are fully-insured (23% vs. 30%) [Figure 6.19].16
Figure 6.15: Distribution of the Percentage of Total Premium Paid by Covered Workers for Single and Family Coverage, by Firm Wage Level, 2021
Figure 6.16: Average Annual Worker and Employer Contributions to Premiums and Total Premiums for Single and Family Coverage, by Firm Wage Level, 2021
Figure 6.17: Average Annual Premium Contributions Paid by Covered Workers for Single and Family Coverage, by Firm Characteristics, 2021
Figure 6.18: Average Percentage of Family Premium Paid by Covered Workers, by Firm Characteristics, 2021
Figure 6.19: Average Percentage of Premium Paid by Covered Workers, by Firm Characteristics and Size, 2021
DIFFERENCES BY REGION AND INDUSTRY
The average worker contribution rate for single coverage is relatively high in Northeast (20%) and relatively low in the West (14%) [Figure 6.20].
The average worker contribution rate for family coverage is relatively low in the Northeast (24%) and the Midwest (25%) and relatively high in the South (33%) [Figure 6.20].
There is considerable variation in average worker contribution rates across industries for single and family coverage [Figure 6.21].
Figure 6.20: Average Premium Paid by Covered Workers for Single and Family Coverage, by Plan Type and Region, 2021
Figure 6.21: Average Percentage of Premium Paid by Covered Workers, by Industry, 2021
CHANGES OVER TIME
The average worker contributions in 2021 for single coverage ($1,299) and for family coverage ($5,969) are similar to the average contribution levels last year [Figures 6.4 and 6.5].
The average worker contributions for single and family coverage have increased over the last five years (15% and 13%, respectively) and over the last 10 years (41% and 45%, respectively) [Figures 6.4 and 6.5].
Figure 6.22: Average Annual Worker Contributions for Covered Workers With Single Coverage, by Firm Size, 1999-2021
Figure 6.23: Average Annual Worker Contributions for Covered Workers With Family Coverage, by Firm Size, 1999-2021
Figure 6.24: Average Percentage of Premium Paid by Covered Workers for Single and Family Coverage, by Firm Size, 1999-2021
Figure 6.25: Among Large Firms, Average Annual Worker Contributions for Covered Workers With Family Coverage, by Firm Wage Level, 1999-2021
Estimates for premiums, worker contributions to premiums, and employer contributions to premiums presented in Section 6 do not include contributions made by the employer to Health Savings Accounts (HSAs) or Health Reimbursement Arrangements (HRAs). See Section 8 for estimates of employer contributions to HSAs and HRAs.↩︎
The average percentage contribution is calculated as a weighted average of all a firm’s plan types and may not necessarily equal the average worker contribution divided by the average premium.↩︎
For definitions of self-funded and fully-insured plans, see the introduction to Section 10.↩︎
Section 7: Employee Cost Sharing
In addition to any required premium contributions, most covered workers must pay a share of the cost for the medical services they use. The most common forms of cost sharing are: deductibles (an amount that must be paid before most services are covered by the plan), copayments (fixed dollar amounts), and coinsurance (a percentage of the charge for services). Sometimes cost sharing forms are mixed, such as assessing coinsurance for a service up to a maximum amount, or assessing coinsurance or a copayment for a service, whichever is higher. The type and level of cost sharing may vary with the type of plan in which the worker is enrolled. Cost sharing may also vary by the type of service, such as office visits, hospitalizations, or prescription drugs.
The cost-sharing amounts reported here are for covered workers using in-network services. Plan enrollees receiving services from providers that do not participate in plan networks often face higher cost sharing and may be responsible for charges that exceed the plan’s allowable amounts. The framework of this survey does not allow us to capture all of the complex cost-sharing requirements in modern plans, particularly for ancillary services (such as durable medical equipment or physical therapy) or cost-sharing arrangements that vary across different settings (such as tiered networks). Therefore, we do not collect information on all plan provisions and limits that affect enrollee out-of-pocket liability.
GENERAL ANNUAL DEDUCTIBLES FOR WORKERS IN PLANS WITH DEDUCTIBLES
We consider a general annual deductible to be an amount that must be paid by enrollees before most services are covered by their health plan. Non-grandfathered health plans are required to cover some services, such as preventive care, without cost sharing. Some plans require enrollees to meet a service-specific deductible, such as for prescription drugs or hospital admissions, in lieu of or in addition to a general annual deductible. As discussed below, some plans with a general annual deductible for most services exclude specified classes of care from the deductible, such as prescriptions or physician office visits.
Eighty-five percent of covered workers in 2021 are enrolled in a plan with a general annual deductible for single coverage, similar to the percentages last year (83%) and five years ago (83%) but higher than the percentage ten years ago (74%) [Figure 7.2].
The percentages of covered workers enrolled in a plan with a general annual deductible for single coverage are the same for small firms (3-199 workers) (85%) and large firms (200 or more workers) (85%) [Figure 7.2].
The likelihood of being in a plan with a general annual deductible varies by plan type. Forty-three percent of covered workers in HMOs do not have a general annual deductible for single coverage, compared to 15% of workers in POS plans and 15% of workers in PPOs [Figure 7.1].
For covered workers in a plan with a general annual deductible, the average annual deductible for single coverage is $1,669, similar to the average deductible ($1,644) last year [Figure 7.3] and [Figure 7.8].
For covered workers in plans with a general annual deductible, the average deductibles for single coverage are $1,271 in HMOs, $1,245 in PPOs, $1,852 in POS plans, and $2,424 in HDHP/SOs [Figure 7.6].
The average deductibles for single coverage are higher for most plan types for covered workers in small firms than for covered workers in large firms. For covered workers in PPOs, the most common plan type, the average deductible for single coverage in small firms is considerably higher than the average deductible in large firms ($1,972 vs. $976) [Figure 7.6]. Overall, for covered workers in plans with a general annual deductible, the average deductible for single coverage in small firms ($2,379) is higher than the average deductible in large firms ($1,397) [Figure 7.3].
The average general annual deductible for single coverage for covered workers in plans with a general annual deductible has increased 13% over the past five years and 68% over the past ten years [Figure 7.8].
Figure 7.1: Percentage of Covered Workers With No General Annual Deductible for Single Coverage, by Plan Type and Firm Size, 2021
Figure 7.2: Percentage of Covered Workers in a Plan That Includes a General Annual Deductible for Single Coverage, by Plan Type and Firm Size, 2006-2021
Figure 7.3: Percentage of Covered Workers in a Plan That Includes a General Annual Deductible and Average Deductible for Single Coverage, by Firm Size and Region, 2021
Figure 7.4: Percentage of Covered Workers in a Plan That Includes a General Annual Deductible and Average Deductibles for Single Coverage, by Firm Characteristics, 2021
Figure 7.5: Among Covered Workers With No General Annual Deductible, Percentage Who Face Other Types of Cost Sharing, 2021
Figure 7.6: Among Covered Workers With a General Annual Deductible for Single Coverage, Average Deductible, by Plan Type and Firm Size, 2021
Figure 7.7: Percentage of Covered Workers With a General Annual Deductible for Single Coverage, 2006-2021
Figure 7.8: Among Covered Workers With a General Annual Deductible, Average Single and Family Coverage Deductible, by Plan Type, 2006-2021
GENERAL ANNUAL DEDUCTIBLES AMONG ALL COVERED WORKERS
As discussed above, the share of covered workers in plans with a general annual deductible has increased significantly over time, from 74% in 2011 to 85% in 2021 [Figure 7.9]. The average deductible amount for covered workers in plans with a deductible has also increased over the period, from $991 in 2011 to $1,669 in 2021 [Figure 7.10]. Neither trend by itself, however, captures the full impact of changes in deductibles on covered workers. We can look at the average impact of both trends together on covered workers by assigning a zero deductible value to covered workers in plans with no deductible and looking at how the resulting averages change over time. These average deductible amounts are lower in any given year but the changes over time reflect both the higher deductibles in plans with a deductible and the fact that more workers face them.
Using this approach, the average general annual deductible for single coverage for all covered workers in 2021 is $1,434, similar to the amount last year ($1,364) [Figure 7.10].
The 2021 value is 17% higher than the average general annual deductible of $1,221 in 2016 and 92% higher than the average general annual deductible of $747 in 2011 [Figure 7.10].
Another way to look at deductibles is the percentage of all covered workers who are in a plan with a deductible that exceeds certain thresholds. Fifty-eight percent of covered workers are in plans with a general annual deductible of $1,000 or more for single coverage, similar to the percentage last year [Figure 7.13].
Figure 7.9: Prevalence and Value of General Annual Deductibles for Single Coverage, by Firm Size, 2006-2021
Over the past five years, the percentage of covered workers with a general annual deductible of $1,000 or more for single coverage has grown 13%, from 51% to 58% [Figure 7.13].
Workers in small firms are considerably more likely to have a general annual deductible of $1,000 or more for single coverage than workers in large firms (72% vs. 52%) [Figure 7.12].
In 2021, 29% of covered workers are enrolled in a plan with a deductible of $2,000 or more, similar to the percentage last year (26%) [Figure 7.14]. This percentage is much higher for covered workers in small firms than large firms (45% vs. 22%) [Figure 7.12].
Figure 7.10: Average General Annual Deductibles for Single Coverage, 2006-2021
GENERAL ANNUAL DEDUCTIBLES AND ACCOUNT CONTRIBUTIONS
One of the reasons for the growth in general annual deductibles has been the growth in enrollment in HDHP/SOs, which have higher deductibles than other plans. While higher deductibles in other plan types generally increases enrollee out-of-pocket liability, the shift in enrollment to HDHP/SOs does not necessarily do so because many HDHP/SO enrollees receive an account contribution from their employers, which in essence reduces the higher cost sharing in these plans.
Twenty-seven percent of covered workers in an HDHP with an HRA and 2% of covered workers in an HSA-qualified HDHP receive an account contribution from their employer for single coverage at least equal to their deductible, while another 20% of covered workers in an HDHP with an HRA and 17% of covered workers in an HSA-qualified HDHP receive account contributions that, if applied to their deductible, would reduce the deductible to $1,000 or less [Figure 7.16].
If we reduce the general annual deductibles by employer account contributions, the percentage of covered workers with a deductible of $1,000 or more would be reduced from 58% to 50% [Figure 7.13] and [Figure 7.15].
Figure 7.11: Among Covered Workers Who Face a Deductible for Single Coverage, Average General Annual Deductible for Single Coverage, by Firm Size, 2006-2021
Figure 7.12: Percentage of Covered Workers Enrolled in a Plan With a High General Annual Deductible for Single Coverage, by Firm Size, 2021
Figure 7.13: Percentage of Covered Workers Enrolled in a Plan With a General Annual Deductible of $1,000 or More for Single Coverage, by Firm Size, 2009-2021
Figure 7.14: Percentage of Covered Workers Enrolled in a Plan With a General Annual Deductible of $2,000 or More for Single Coverage, by Firm Size, 2009-2021
Figure 7.15: Percentage of Covered Workers Enrolled in a Plan With a High General Annual Deductible for Single Coverage, Reduced by Any HRA/HSA Contributions, by Firm Size, 2021
Figure 7.16: Among Covered Workers With a General Annual Deductible, Average General Annual Deductibles for Single Coverage, Reduced by Any HRA/HSA Contributions, by Plan Type and Firm Size, 2021
Figure 7.17: Among Covered Workers With a General Annual Deductible, Distribution of General Annual Deductibles for Single Coverage, Reduced by Any HRA/HSA Contributions, 2007-2021
Figure 7.18: Among Covered Workers With a General Annual Deductible, Distribution of General Annual Deductible for Single Coverage, 2007-2021
Figure 7.19: Among Covered Workers With a General Annual Deductible, Distribution of General Annual Deductibles for Single Coverage, by Plan Type, 2021
GENERAL ANNUAL DEDUCTIBLES FOR WORKERS ENROLLED IN FAMILY COVERAGE
General annual deductibles for family coverage are structured in two primary ways: (1) with an aggregate family deductible, the out-of-pocket expenses of all family members count against a specified family deductible amount, and the deductible is considered met when the combined family expenses exceed the deductible amount; (2) with a separate per-person family deductible, each family member is subject to a specified deductible amount before the plan covers expenses for that member, although many plans consider the deductible for all family members met once a specified number (typically two or three) of family members meet their specified deductible amount.17
Forty-two percent of covered workers in HMOs are in plans without a general annual deductible for family coverage; the percentages in plans without family deductibles are lower for workers in PPOs (13%) and POS plans (13%). As defined, all covered workers in HDHP/SOs have a general annual deductible for family coverage [Figure 7.20].
Among covered workers enrolled in family coverage, the percentages of covered workers in a plan with an aggregate general annual deductible are 28% for workers in HMOs; 50% for workers in PPOs; 72% for workers in POS plans; and 73% for workers in HDHP/SOs [Figure 7.20].
The average deductible amounts for covered workers in plans with an aggregate annual deductible for family coverage are $3,400 for HMOs; $3,000 for PPOs; $4,130 for POS plans; and $4,705 for HDHP/SOs [Figure 7.21]. The average deductible amounts for aggregate family deductibles are similar to last year for each plan type.
For covered workers in plans with an aggregate deductible for family coverage, the average annual family deductibles in small firms are higher than the average annual family deductibles in large firms for covered workers in HMOs, PPOs and HDHP/SOs [Figure 7.21].
Among covered workers enrolled in family coverage, the percentages of covered workers in plans with a separate per-person annual deductible for family coverage are 30% for workers in HMOs; 37% for workers in PPOs; 15% for workers in POS plans; and 27% for workers in HDHP/SOs [Figure 7.20].
The average deductible amounts for covered workers in plans with separate per-person annual deductibles for family coverage are $1,190 for HMOs, $1,126 for PPOs, and $2,748 for HDHP/SOs [Figure 7.21].
Forty-four percent of covered workers in plans with a separate per-person annual deductible for family coverage have a limit for the number of family members required to meet the separate deductible amounts [Figure 7.24]. Among those covered workers in plans with a limit on the number of family members, the most frequent number of family members required to meet the separate per-person deductible is two [Figure 7.25].
Figure 7.20: Distribution of Type of General Annual Deductible for Covered Workers With Family Coverage, by Plan Type, 2021
Figure 7.21: Among Covered Workers With a General Annual Deductible, Average Deductibles for Family Coverage, by Deductible Type, Plan Type, and Firm Size, 2021
Figure 7.22: Among Covered Workers With a Separate Per-Person General Annual Deductible for Family Coverage, Distribution of Deductibles, by Plan Type, 2021
Figure 7.23: Among Covered Workers With an Aggregate General Annual Deductible for Family Coverage, Distribution of Deductibles, by Plan Type, 2021
Figure 7.24: Among Covered Workers With a Separate Per-Person General Annual Deductible for Family Coverage, Structure of Deductible Limits, by Plan Type, 2021
Figure 7.25: Among Covered Workers With a Separate Per-Person General Annual Deductible for Family Coverage and a Per-Person Limit, Distribution of Maximum Number of Family Members Required to Meet the Deductible, by Plan Type, 2021
Figure 7.26: Among Covered Workers With an Aggregate General Annual Deductible for Family Coverage, Distribution of Aggregate Deductibles, by Plan Type, 2016 and 2021
CHARACTERISTICS OF GENERAL ANNUAL DEDUCTIBLES
The majority of covered workers with a general annual deductible are in plans where the deductible does not have to be met before certain services, such as physician office visits or prescription drugs, are covered.
Majorities of covered workers (76% in HMOs, 70% in PPOs, 64% in POS plans, and 71% in HDHP/HRAs) who are enrolled in plans with general annual deductibles are in plans where the deductible does not have to be met before physician office visits for primary care are covered [Figure 7.27].
Similarly, among workers with a general annual deductible, large shares of covered workers in HMOs (95%), PPOs (89%), POS plans (85%), and HDHP/HRAs (84%) are enrolled in plans where the general annual deductible does not have to be met before prescription drugs are covered [Figure 7.27].
Figure 7.27: Among Covered Workers With a General Annual Deductible, Percentage With Coverage for the Following Services Without Having to First Meet the Deductible, by Plan Type, 2021
HOSPITAL ADMISSIONS AND OUTPATIENT SURGERY
Whether or not a worker has a general annual deductible, most workers face additional types of cost sharing (such as a copayment, coinsurance, or a per diem charge) when admitted to a hospital or having outpatient surgery. The distribution of workers with cost sharing for hospital admissions or outpatient surgery does not equal 100%, as workers may face a complex combination of types of cost sharing. For this reason, the average copayment and coinsurance rates include workers who may have a combination of these types of cost sharing.
In addition to any general annual deductible that may apply, 68% of covered workers have coinsurance and 12% have a copayment that apply to inpatient hospital admissions. Lower percentages of covered workers have per day (per diem) payments (5%), a separate hospital deductible (3%), or both a copayment and coinsurance (9%), while 15% have no additional cost sharing for hospital admissions after any general annual deductible has been met [Figure 7.28].
For covered workers in HMOs, copayments are more common (23%) and coinsurance (37%) is less common than the average for all covered workers [Figure 7.28].
HDHP/SOs, on average, have a different cost-sharing structure than other plan types for hospital admissions. Only 2% of covered workers in HDHP/SOs have a copayment for hospital admissions, lower than the average for all covered workers [Figure 7.28].
The average coinsurance rate for a hospital admission is 20%, the average copayment is $321 per hospital admission, and the average per diem charge is $261 [Figure 7.31]. Seventy-one percent of workers enrolled in a plan with a per diem for hospital admissions have a limit on the number of days a worker must pay the amount [Figure 7.32].
The cost-sharing provisions for outpatient surgery are similar to those for hospital admissions, as most workers have coinsurance or copayments. In 2021, 16% of covered workers have a copayment and 68% have coinsurance for outpatient surgery. In addition, 7% have both a copayment and coinsurance, while 15% have no additional cost sharing after any general annual deductible has been met [Figures 7.29 and 7.30].
For covered workers with cost sharing for outpatient surgery, the average coinsurance rate is 20% and the average copayment is $162 [Figure 7.31].
Figure 7.28: Distribution of Covered Workers With Other Cost Sharing for Hospital Admissions, in Addition to Any General Annual Deductible, by Plan Type, 2021
Figure 7.29: Distribution of Covered Workers With Other Cost Sharing for Outpatient Surgery, in Addition to Any General Annual Deductible, by Plan Type, 2021
Figure 7.30: Percentage of Covered Workers With the Following Types of Cost Sharing for Hospital Admissions and Outpatient Surgery, in Addition to Any General Annual Deductible, 2021
Figure 7.31: Among Covered Workers With Separate Cost Sharing for Hospital Admissions or Outpatient Surgery, Average Cost Sharing, by Type, 2021
Figure 7.32: Among Covered Workers With a Charge Per Day for Hospital Admissions, Average Cost Sharing Features, 2021
Figure 7.33: Among Covered Workers With a Copayment for Hospital Admissions or Outpatient Surgery, Distribution of Copayments, 2021
Figure 7.34: Among Covered Workers With Coinsurance for Hospital Admissions or Outpatient Surgery, Distribution of Coinsurance Rates, 2021
COST SHARING FOR PHYSICIAN OFFICE VISITS
The majority of covered workers are enrolled in health plans that require cost sharing for an in-network physician office visit, in addition to any general annual deductible.18
The most common form of cost sharing for an in-network physician office is a copayment. Seventy-one percent of covered workers have a copayment for a primary care physician office visit and 20% have coinsurance. For office visits with a specialty physician, 69% of covered workers have a copayment and 22% have coinsurance [Figure 7.35].
The form of cost sharing for physician office visits varies by firm size. For in-network primary care office visits, covered workers in small firms are more likely to have a copayment (78% vs. 68%) are are less likely to have coinsurance (9% vs. 25%). The pattern is similar for in-network office visits with specialists.
Covered workers in HMOs, PPOs, and POS plans are much more likely to have copayments for both primary care and specialty care physician office visits than workers in HDHP/SOs. For primary care physician office visits, 21% of covered workers in HDHP/SOs have a copayment, 57% have coinsurance, and 16% have no cost sharing after the general annual plan deductible is met [Figure 7.35].
Among covered workers with a copayment for in-network physician office visits, the average copayment is $25 for primary care and $42 for specialty physician office visits, similar to the amounts last year [Figure 7.36].
Among covered workers with coinsurance for in-network physician office visits, the average coinsurance rates are 19% for a visit with a primary care physician and 20% for a visit with a specialist, similar to the rates last year [Figure 7.36].
Figure 7.35: Percentage of Covered Workers With the Following Types of Cost Sharing for Physician Office Visits, by Plan Type, 2021
Figure 7.36: Among Covered Workers With Copayments And/Or Coinsurance for Physician Office Visits, Average Copayments and Coinsurance, by Plan Type, 2021
Figure 7.37: Among Covered Workers With a Copayment for a Primary Care Physician Office Visit, Distribution of Copayments, by Plan Type, 2021
Figure 7.38: Among Covered Workers With a Copayment for a Specialist Physician Office Visit, Distribution of Copayments, by Plan Type, 2021
Figure 7.39: Among Covered Workers With a Copayment for a Primary Care Physician Office Visit, Distribution of Copayments, 2006-2021
Figure 7.40: Among Covered Workers With a Copayment for a Specialist Physician Office Visit, Distribution of Copayments, 2006-2021
Figure 7.41: Among Covered Workers With a Copayment And/Or Coinsurance for Physician Office Visits, Average Copayment and Coinsurance, 2006-2021
OUT-OF-POCKET MAXIMUMS
Virtually all covered workers are in a plan that partially or totally limits the cost sharing that enrollees must pay in a year. This limit is generally referred to as an out-of-pocket maximum. The Affordable Care Act (ACA) requires that non-grandfathered health plans have an out-of-pocket maximum of no more than $8,550 for single coverage and $17,100 for family coverage in 2021. Out-of-pocket limits in HSA qualified HDHP/SOs are required to be somewhat lower.19 Many plans have complex out-of-pocket structures, which makes it difficult to accurately collect information on this element of plan design.
In 2021, more than 99% of covered workers are in a plan with an out-of-pocket maximum for single coverage. This is a significant increase from 98% in 2016 [Figure 7.42].
For covered workers in plans with an out-of-pocket maximum for single coverage, there is wide variation in spending limits.
Thirteen percent of covered workers in plans with an out-of-pocket maximum for single coverage have an out-of-pocket maximum of less than $2,000, while 27% have an out-of-pocket maximum of $6,000 or more [Figure 7.44].
Figure 7.42: Percentage of Covered Workers in a Plan With an Out-Of-Pocket Maximum for Single Coverage, 2009-2021
Figure 7.43: Percentage of Covered Workers in a Plan With an Out-Of-Pocket Maximum Above Certain Thresholds for Single Coverage, 2009-2021
Figure 7.44: Among Covered Workers With an Out-Of-Pocket Maximum for Single Coverage, Distribution of Out-Of-Pocket Maximums, by Plan Type, 2021
Figure 7.45: Among Covered Workers With an Out-Of-Pocket Maximum for Single Coverage, Average Out-Of-Pocket Maximums, by Firm Size, 2021
Some workers with separate per-person deductibles or out-of-pocket maximums for family coverage do not have a specific number of family members that are required to meet the deductible amount and instead have another type of limit, such as a per-person amount with a total dollar amount limit. These responses are included in the averages and distributions for separate family deductibles and out-of-pocket maximums.↩︎
Starting in 2010, the survey asked about the prevalence and cost of physician office visits separately for primary care and specialty care. Prior to the 2010 survey, if the respondent indicated the plan had a copayment for office visits, we assumed the plan had a copayment for both primary and specialty care visits. The survey did not allow for a respondent to report that a plan had a copayment for primary care visits and coinsurance for visits with a specialist physician. The changes made in 2010 allow for variations in the type of cost sharing for primary care and specialty care visits. The survey includes cost sharing for in-network services only.↩︎
Section 8: High-deductible Health Plans With Savings Option
To help cover out-of-pocket expenses not covered by a health plan, some firms offer high-deductible plans that are paired with an account that allows enrollees to use tax-preferred funds to pay plan cost sharing and other out-of-pocket medical expenses. The two most common types are health reimbursement arrangements (HRAs) and health savings accounts (HSAs). HRAs and HSAs are financial accounts that workers or their family members can use to pay for health care services. These savings arrangements are often (or, in the case of HSAs, always) paired with health plans with high deductibles. The survey treats high-deductible plans paired with a savings option as a distinct plan type – High-Deductible Health Plan with Savings Option (HDHP/SO) – even if the plan would otherwise be considered a PPO, HMO, POS plan, or conventional health plan. Specifically for the survey, HDHP/SOs are defined as (1) health plans with a deductible of at least $1,000 for single coverage and $2,000 for family coverage20 offered with an HRA (referred to as HDHP/HRAs); or (2) high-deductible health plans that meet the federal legal requirements to permit an enrollee to establish and contribute to an HSA (referred to as HSA-qualified HDHPs).21
PERCENTAGE OF FIRMS OFFERING HDHP/HRAS AND HSA-QUALIFIED HDHPS
Twenty-two percent of firms offering health benefits offer an HDHP/HRA, an HSA-qualified HDHP, or both. Among firms offering health benefits, 6% offer an HDHP/HRA and 17% offer an HSA-qualified HDHP [Figure 8.1]. The percentage of firms offering an HDHP/SO is similar to last year.
Large firms (200 or more workers) are more much likely than small firms (3-199 workers) to offer an HDHP/SO (58% vs. 20%) [Figure 8.3].
Figure 8.1: Among Firms Offering Health Benefits, Percentage That Offer an HDHP/HRA And/Or an HSA-Qualified HDHP, 2005-2021
Figure 8.2: Among Firms Offering Health Benefits, Percentage That Offer an HDHP/SO, by Firm Size, 2005-2021
Figure 8.3: Among Firms Offering Health Benefits, Percentage That Offer an HDHP/HRA And/Or an HSA-Qualified HDHP, by Firm Size, 2021
ENROLLMENT IN HDHP/HRAS AND HSA-QUALIFIED HDHPS
Twenty-eight percent of covered workers are enrolled in an HDHP/SO in 2021, similar to the percentage last year (31%) [Figure 8.4].
Enrollment in HDHP/SOs has increased over the past decade, from 17% of covered workers in 2011 to 28% in 2021 [Figure 8.4].
Seven percent of covered workers are enrolled in HDHP/HRAs and twenty-one percent of covered workers are enrolled in HSA-qualified HDHPs in 2021. These percentages are similar to the percentages last year [Figure 8.4].
The percentage of covered workers enrolled in HDHP/SOs is higher in large firms (30%) than in small firms (23%) [Figure 8.5].
Figure 8.4: Percentage of Covered Workers Enrolled in an HDHP/HRA or HSA-Qualified HDHP, 2006-2021
Figure 8.5: Percentage of Covered Workers Enrolled in an HDHP/SO, by Firm Size, 2006-2021
PREMIUMS AND WORKER CONTRIBUTIONS
In 2021, the average annual premiums for covered workers in HDHP/HRAs are $7,441 for single coverage and $21,662 for family coverage [Figure 8.6].
The average annual premiums for workers in HSA-qualified HDHPs are $6,877 for single coverage and $20,507 for family coverage. These amounts are significantly less than the average single and family premium for covered workers in plans that are not HDHP/SOs [Figure 8.7].
The average annual worker contributions to premiums for workers enrolled in HDHP/HRAs are $1,569 for single coverage and $6,407 for family coverage [Figure 8.6]. The average contribution for family coverage for covered workers in HDHP/HRAs are similar to the average premium contribution made by covered workers in plans that are not HDHP/SOs [Figure 8.7].
The average annual worker contributions to premiums for workers in HSA-qualified HDHPs are $1,134 for single coverage and $4,718 for family coverage. The average contributions for single and family coverage for covered workers in HSA-qualified HDHPs are significantly less than the average premium contribution made by covered workers in plans that are not HDHP/SOs [Figure 8.7].
Figure 8.6: HDHP/HRA and HSA-Qualified HDHP Features for Covered Workers, 2021
Figure 8.7: Average Annual Premiums and Contributions to Savings Accounts for Covered Workers in HDHP/HRAs or HSA-Qualified HDHPs, Compared to Non-HDHP/SOs, 2021
Figure 8.8: Average Annual Premiums and Contributions for Covered Workers in HDHP/SOs and Non-HDHP/SOs, for Family Coverage, 2021
Figure 8.9: Total Annual Costs (Premiums and Account Contributions) for Covered Workers in HDHP/SOs, for Family Coverage, by Firm Size, 2021
Figure 8.10: Average Annual Premiums for Covered Workers With Family Coverage, by Plan Type, 2007-2021
Figure 8.11: Average Annual Premiums for Covered Workers With Single Coverage, by Plan Type, 2007-2021
OUT-OF-POCKET MAXIMUMS AND PLAN DEDUCTIBLES
HSA-qualified HDHPs are legally required to have an annual out-of-pocket maximum of no more than $7,000 for single coverage and $14,000 for family coverage in 2021. Non-grandfathered HDHP/HRA plans are required to have out-of-pocket maximums of no more than $8,550 for single coverage and $17,100 for family coverage in 2021. Virtually all HDHP/HRA plans have an out-of-pocket maximum for single coverage in 2021.
The average annual out-of-pocket maximum for single coverage is $4,425 for HDHP/HRAs and $4,368 for HSA-qualified HDHPs [Figure 8.6].
As expected, workers enrolled in HDHP/SOs have higher deductibles than workers enrolled in HMOs, PPOs, or POS plans.
The average general annual deductible for single coverage is $2,349 for HDHP/HRAs and $2,454 for HSA-qualified HDHPs [Figure 8.6]. These averages are similar to the amounts reported in recent years. There is wide variation around these averages: 41% of covered workers enrolled in an HDHP/SO are in a plan with a deductible of $1,000 to $1,999 for single coverage while 25% are in a plan with a deductible of $3,000 or more [Figure 8.12].
The survey asks firms whether the family deductible amount is (1) an aggregate amount (i.e., the out-of-pocket expenses of all family members are counted until the deductible is satisfied), or (2) a per-person amount that applies to each family member (typically with a limit on the number of family members that would be required to meet the deductible amount) (see Section 7 for more information).
The average aggregate deductibles for workers with family coverage are $5,217 for HDHP/HRAs and $4,572 for HSA-qualified HDHPs [Figure 8.6]. As with single coverage, there is wide variation around these averages for family coverage: 9% of covered workers enrolled in HDHP/SOs with an aggregate family deductible have a deductible of $2,000 to $2,999 while 20% have a deductible of $6,000 dollars or more [Figure 8.15].
Figure 8.12: Distribution of Covered Workers in HDHP/SOs With the Following General Annual Deductibles for Single Coverage, by Firm Size, 2021
Figure 8.13: General Annual Deductible for Workers in HDHP/SOs After Any Employer Account Contributions for Single Coverage, by Firm Size, 2021
Figure 8.14: Among Covered Workers With a General Annual Deductible, Average Deductibles for Workers in Non-HDHP/SOs Compared to HDHP/SOs Before and After Any Employer Account Contributions, for Single Coverage, 2007-2021
Figure 8.15: Distribution of Covered Workers in HDHP/SOs With the Following Aggregate Family Deductibles, 2021
EMPLOYER ACCOUNT CONTRIBUTIONS
Employers contribute to HDHP/SOs in two ways: through their contributions toward the premium for the health plan and through their contributions (if any, in the case of HSAs) to the savings account option (i.e., the HRAs or HSAs themselves).
Looking at only the annual employer contributions to premiums, covered workers in HDHP/HRAs on average receive employer contributions of $5,872 for single coverage and $15,255 for family coverage [Figure 8.7]. These amounts are similar to the contribution amounts last year.
The average annual employer contributions to premiums for workers in HSA-qualified HDHPs are $5,743 for single coverage and $15,789 for family coverage. Both amounts are similar to the contribution amounts last year. The average employer contributions for covered workers in HSA-qualified HDHPs for single coverage is lower than the average contribution for covered workers in plans that are not HDHP/SOs [Figure 8.7].
Looking at employer contributions to the savings options, covered workers enrolled in HDHP/HRAs on average receive an annual employer contribution to their HRA of $1,410 for single coverage and $2,344 for family coverage [Figure 8.7].
HRAs are generally structured in such a way that employers may not actually spend the whole amount that they make available to their employees’ HRAs.22 Amounts committed to an employee’s HRA that are not used by the employee generally roll over and can be used in future years, but any balance may revert back to the employer if the employee leaves his or her job. Thus, the employer contribution amounts to HRAs that we capture in the survey may exceed the amount that employers will actually spend.
Covered workers enrolled in HSA-qualified HDHPs on average receive an annual employer contribution to their HSA of $575 for single coverage and $987 for family coverage [Figure 8.7].
In many cases, employers that sponsor HSA-qualified HDHP/SOs do not make contributions to HSAs established by their employees. Thirty-eight percent of employers offering single coverage and 42% offering family coverage through HSA-qualified HDHPs do not make contributions toward the HSAs that their workers establish. Among covered workers enrolled in an HSA-qualified HDHP, 22% enrolled in single coverage and 24% enrolled in family coverage do not receive an account contribution from their employer [Figure 8.16] and [Figure 8.17].
The average HSA contributions reported above include the portion of covered workers whose employer contribution to the HSA is zero. When those firms that do not contribute to the HSA are excluded from the calculation of the average amounts, the average employer contribution for covered workers is $744 for single coverage and $1,296 for family coverage.
The percentages of covered workers enrolled in a plan where the employer makes no HSA contribution (22% for single coverage and 24% for family coverage) are similar to the percentages in recent years [Figure 8.16] and [Figure 8.17].
There is considerable variation in the amount that employers contribute to savings accounts.
Forty-two percent of covered workers in an HDHP/HRA receive an annual HRA contribution of less than $800 for single coverage, while 25% receive an annual HRA contribution of $1,600 or more [Figure 8.16].
Thirty-five percent of covered workers in an HSA-qualified HDHP receive an annual HSA contribution of less than $400 for single coverage, including 22% that receive no HSA contribution from their employer [Figure 8.16]. In contrast, 9% of covered workers in an HSA-qualified HDHP receive an annual HSA contribution of $1,200 or more. Two percent of covered workers have an employer that matches any HSA contribution for single coverage.
Employer contributions to savings account options (i.e., the HRAs and HSAs themselves) for their workers can be added to their health plan premium contributions to calculate total employer contributions toward HDHP/SOs. We note that HRAs are a promise by an employer to pay up to a specified amount and that many employees will not receive the full amount of their HRA in a year, so adding the employer premium contribution amount and the HRA contribution represents an upper bound for employer liability that overstates the amount that is actually expended. Since employer contributions to employee HSAs immediately transfer the full amount to the employee, adding employer premium and HSA contributions is an instructive way to look at their total liability under these plans.
For HDHP/HRAs, the average annual total employer contribution for covered workers is $7,282 for single coverage and $17,599 for family coverage. The average total employer contributions for covered workers for single coverage and family coverage in HDHP/HRAs are similar to the average firm contributions toward single and family coverage in plans that are not HDHP/SOs [Figure 8.7].
For HSA-qualified HDHPs, the average total annual firm contribution for covered workers is $6,304 for single coverage and $16,808 for workers with family coverage. The average total firm contribution amount for single coverage in HSA-qualified HDHPs is lower than the average firm contributions toward health plans that are not HDHP/SOs [Figure 8.7].
Figure 8.16: Distribution of Covered Workers With the Following Annual Employer Contributions to Their HRA or HSA, for Single Coverage, 2021
Figure 8.17: Distribution of Covered Workers With the Following Annual Employer Contributions to Their HRA or HSA, for Family Coverage, 2021
Figure 8.18: Average Annual Employer Contributions to HSA Accounts for Covered Workers Enrolled in an HSA-Qualified HDHP, 2009-2021
Figure 8.19: Among Covered Workers in HDHP/HRAs and HSA-Qualified HDHPs, Average Annual Employer HSA and HRA Contributions, 2021
COST SHARING FOR OFFICE VISITS
The cost-sharing pattern for primary care office visits differs for workers enrolled in HDHP/SOs. Forty-six percent of covered workers in HDHP/HRAs have a copayment for primary care physician office visits compared to 9% enrolled in HSA-qualified HDHPs [Figure 8.20]. Workers in other plan types are much more likely to face copayments than coinsurance for physician office visits (see Section 7 for more information).
Figure 8.20: Distribution of Covered Workers in HDHP/HRAs and HSA-Qualified HDHPs With the Following Types of Cost Sharing in Addition to the General Annual Deductible, 2021
Health Reimbursement Arrangements (HRAs) are medical care reimbursement plans established by employers that can be used by employees to pay for health care. HRAs are funded solely by employers. Employers may commit to make a specified amount of money available in the HRA for premiums and medical expenses incurred by employees or their dependents. HRAs are accounting devices, and employers are not required to expend funds until an employee incurs expenses that would be covered by the HRA. Unspent funds in the HRA usually can be carried over to the next year (sometimes with a limit). Employees cannot take their HRA balances with them if they leave their job, although an employer can choose to make the remaining balance available to former employees to pay for health care. HRAs often are offered along with a high-deductible health plan (HDHP). In such cases, the employee pays for health care first from his or her HRA and then out-of-pocket until the health plan deductible is met. Sometimes certain preventive services or other services such as prescription drugs are paid for by the plan before the employee meets the deductible.
Health Savings Accounts (HSAs) are savings accounts created by individuals to pay for health care. An individual may establish an HSA if he or she is covered by a “qualified health plan” – a plan with a high deductible (at least $1,400 for single coverage and $2,800 for family coverage in 2021 or $1,400 and $2,800, respectively, in 2020) that also meets other requirements. Employers can encourage their employees to create HSAs by offering an HDHP that meets the federal requirements. Employers in some cases also may assist their employees by identifying HSA options, facilitating applications, or negotiating favorable fees from HSA vendors. Both employers and employees can contribute to an HSA, up to the statutory cap of $3,600 for single coverage and $7,200 for family coverage in 2021. Employee contributions to the HSA are made on a pre-income tax basis, and some employers arrange for their employees to fund their HSAs through payroll deductions. Employers are not required to contribute to HSAs established by their employees but if they elect to do so, their contributions are not taxable to the employee. Interest and other earnings on amounts in an HSA are not taxable. Withdrawals from the HSA by the account owner to pay for qualified health care expenses are not taxed. The savings account is owned by the individual who creates the account, so employees retain their HSA balances if they leave their job. See https://www.federalregister.gov/d/2019-08017/p-850 For those enrolled in an HDHP/HSA, see https://www.irs.gov/pub/irs-pdf/p969.pdf
There is no legal requirement for the minimum deductible in a plan offered with an HRA. The survey defines a high-deductible HRA plan as a plan with a deductible of at least $1,000 for single coverage and $2,000 for family coverage. Federal law requires a deductible of at least $1,400 for single coverage and $2,800 for family coverage for HSA-qualified HDHPs in 2021 (or $1,400 and $2,800, respectively, for plans in their 2020 plan year). Not all firms’ plan years correspond with the calendar year, so some firms may report a plan with limits from the prior year. See definitions at the end of this Section for more information on HDHP/HRAs and HSA-qualified HDHPs.↩︎
The definitions of HDHP/SOs do not include other consumer-driven plan options, such as arrangements that combine an HRA with a lower-deductible health plan or arrangements in which an insurer (rather than the employer as in the case of HRAs or the enrollee as in the case of HSAs) establishes an account for each enrollee. Other arrangements may be included in future surveys as the market evolves.↩︎
The survey asks “Up to what dollar amount does your firm promise to contribute each year to an employee’s HRA or health reimbursement arrangement for single coverage?” We refer to the amount that the employer commits to make available to an HRA as a contribution for ease of discussion. As discussed, HRAs are notional accounts, and employers are not required to actually transfer funds until an employee incurs expenses. Thus, employers may not expend the entire amount that they commit to make available to their employees through an HRA. Some employers may make their HRA contribution contingent on other factors, such as completing wellness programs.↩︎
Section 9: Prescription Drug Benefits
Nearly all (99%) covered workers are at a firm that provides prescription drug coverage in its largest health plan. Employer plans have over time incorporated more complex benefit designs for prescriptions drugs, as employers and insurers expand the use of formularies with multiple cost-sharing tiers as well as other management approaches. To reduce the burden on respondents, we ask offering firms about the attributes of prescription drug coverage only for their largest health plan. This survey asks employers about the cost-sharing in up to four tiers, and for a tier exclusively for specialty drugs. Some plans may have more than one tier for specialty drugs or other variations. There also may be other areas of variation in how plans structure their formularies.
DISTRIBUTION OF COST SHARING
The large majority of covered workers (92%) are in a plan with tiered cost sharing for prescription drugs [Figure 9.1]. Cost-sharing tiers generally refer to a health plan placing a drug on a formulary or preferred drug list that classifies drugs into categories that are subject to different cost sharing or management. It is common for there to be different tiers for generic, preferred and non-preferred drugs, and in recent years, plans have created additional tiers that may, for example, be used for specialty drugs or expensive drugs such as biologics. Some plans may have multiple tiers for different categories; for example, a plan may have preferred and non-preferred specialty tiers. The survey obtains information about the cost-sharing structure for up to five tiers.
Eighty-eight percent of covered workers are in a plan with three, four, or more tiers of cost sharing for prescription drugs [Figure 9.1]. These totals include tiers that cover only specialty drugs, even though the cost-sharing information for those tiers is reported separately.
Although the overall distribution of HDHP/SOs does not statistically differ from non-HDHP/SO plans, certain segments of that distribution have a different cost-sharing pattern for prescription drugs than other plan types. Compared to covered workers in other plan types, those in HDHP/SOs are less likely to be in a plan with four or more tiers of cost sharing (44% vs. 55%) and are more likely to be in a plan that has no cost sharing for prescriptions once the plan deductible is met (9% vs. 2%) [Figure 9.2].
Figure 9.1: Distribution of Covered Workers Facing Different Cost-Sharing Formulas for Prescription Drug Benefits, 2017-2021
Figure 9.2: Distribution of Covered Workers Facing Different Cost-Sharing Formulas for Prescription Drug Benefits, by Plan Type and Plan Size, 2021
TIERS NOT EXCLUSIVELY FOR SPECIALTY DRUGS
Even when formulary tiers covering only specialty drugs are not counted, a large share (83%) of covered workers are in a plan with three or more tiers of cost sharing for prescription drugs. The cost-sharing statistics presented in this section do not include information about tiers that cover only specialty drugs. In cases in which a plan covers specialty drugs on a tier with other drugs, they will still be included in these averages. Cost-sharing statistics for tiers covering only specialty drugs are presented further down in this section.
For covered workers in a plan with three or more tiers of cost sharing for prescription drugs, copayments are the most common form of cost sharing in the first three tiers and coinsurance is the next most common [Figure 9.3].
Among covered workers in plans with three or more tiers of cost sharing for prescription drugs, the average copayments are $12 for first-tier drugs, $36 second-tier drugs, $66 for third-tier drugs, and $124 for fourth-tier drugs [Figure 9.6].
Among covered workers in plans with three or more tiers of cost sharing for prescription drugs, the average coinsurance rates are 20% for first-tier drugs, 25% second-tier drugs, 35% third-tier drugs, and 32% for fourth-tier drugs [Figure 9.6].
Eight percent of covered workers are in a plan with two tiers for prescription drug cost sharing (excluding tiers covering only specialty drugs).
For these workers, copayments are more common than coinsurance for first-tier and second-tier drugs [Figure 9.3]. The average copayment for the first tier is $11 and the average copayment for the second tier is $32 [Figure 9.6].
Four percent of covered workers are in a plan with the same cost sharing for prescriptions regardless of the type of drug (excluding tiers covering only specialty drugs).
Among these workers, 25% have copayments and 70% have coinsurance [Figure 9.3]. The average coinsurance rate is 25% [Figure 9.6].
Figure 9.3: Among Covered Workers With Prescription Drug Coverage, Distribution With the Following Types of Cost Sharing for Prescription Drugs, 2021
Figure 9.4: Among Covered Workers With Three or More Tiers of Prescription Drug Cost Sharing, Distribution With the Following Types of Cost Sharing, by Firm Size, 2021
Figure 9.5: Among Covered Workers With Three or More Tiers of Prescription Drug Cost Sharing, Distribution With the Following Types of Cost Sharing, by Plan Type, 2021
Figure 9.6: Among Covered Workers With Prescription Drug Coverage, Average Copayments and Coinsurance, 2021
COINSURANCE MAXIMUMS
Coinsurance rates for prescription drugs often include maximum and/or minimum dollar amounts. Depending on the plan design, coinsurance maximums may significantly limit the amount an enrollee must spend out-of-pocket for higher-cost drugs. Even in plans without explicit coinsurance maximum amounts, the overall plan out-of-pocket maximum limits enrollee cost sharing on covered services, including prescription drugs.
These coinsurance minimum and maximum amounts vary across the tiers.
For example, among covered workers in a plan with coinsurance for the third cost-sharing tier, 36% have only a maximum dollar amount attached to the coinsurance rate, 6% have only a minimum dollar amount, 36% have both a minimum and maximum dollar amount, and 21% have neither. For those in a plan with coinsurance for the fourth cost-sharing tier, 46% have only a maximum dollar amount attached to the coinsurance rate, 2% have only a minimum dollar amount, 22% have both a minimum and maximum dollar amount, and 25% have neither [Figure 9.7].
Figure 9.7: Distribution of Coinsurance Structures for Covered Workers Facing a Coinsurance for Prescription Drugs, 2021
SEPARATE TIERS FOR SPECIALTY DRUGS
Specialty drugs, such as biologics that may be used to treat chronic conditions, or some cancer drugs, can be quite expensive and often require special handling and administration. We revised our questions beginning with the 2016 survey to obtain more information about formulary tiers that are exclusively for specialty drugs. We are reporting results only among large firms because a small firm respondents had large shares of “don’t know” responses to some of these questions.
Ninety-four percent of covered workers at large firms have coverage for specialty drugs [Figure 9.8]. Among these workers, 49% are in a plan with at least one cost-sharing tier just for specialty drugs [Figure 9.9].
Among covered workers at large firms in a plan with at least one separate tier for specialty drugs, 44% have a copayment for specialty drugs and 42% have coinsurance [Figure 9.10]. The average copayment is $101 and the average coinsurance rate is 27% [Figure 9.11]. Seventy-four percent of those with coinsurance have a maximum dollar limit on the amount of coinsurance they must pay.
Figure 9.8: Among Large Firms With Prescription Drug Coverage, Percentage of Covered Workers Whose Plan With the Largest Enrollment Includes Coverage for Specialty Drugs, by Firm Size, 2021
Figure 9.9: Among Large Firms Whose Prescription Drug Coverage Includes Specialty Drugs, Percentage of Covered Workers Enrolled in a Plan That Has a Separate Tier for Specialty Drugs, by Firm Size, 2021
Figure 9.10: Among Covered Workers at Large Firms Enrolled in a Plan With a Separate Tier for Specialty Drugs, Distribution of the Following Types of Cost Sharing, by Firm Size, 2021
Figure 9.11: Among Covered Workers at Large Firms Enrolled in a Plan With a Separate Tier for Specialty Drugs, Average Copayments and Coinsurance, by Firm Size, 2017 & 2021
Generic drugs Drugs that are no longer covered by patent protection and thus may be produced and/or distributed by multiple drug companies.
Preferred drugs Drugs included on a formulary or preferred drug list; for example, a brand-name drug without a generic substitute.
Non-preferred drugs Drugs not included on a formulary or preferred drug list; for example, a brand-name drug with a generic substitute.
Fourth-tier drugs New types of cost-sharing arrangements that typically build additional layers of higher copayments or coinsurance for specifically identified types of drugs, such as lifestyle drugs or biologics.
Specialty drugs Specialty drugs such as biological drugs are high cost drugs that may be used to treat chronic conditions such as blood disorder, arthritis or cancer. Often times they require special handling and may be administered through injection or infusion.
Section 10: Plan Funding
Many firms, particularly larger firms, choose to pay for some or all of the health services of their workers directly from their own funds rather than by purchasing health insurance for them. This is called self-funding. Both public and private employers use self-funding to provide health benefits. Federal law (the Employee Retirement Income Security Act of 1974, or ERISA) exempts self-funded plans established by private employers (but not public employers) from most state insurance laws, including reserve requirements, mandated benefits, premium taxes, and many consumer protection regulations. Sixty-four percent of covered workers are in a self-funded health plan in 2021. Self-funding is common among larger firms because they can spread the risk of costly claims over a large number of workers and dependents. Some employers which sponsor self-funded plans purchase stoploss coverage to limit their liabilities.
In recent years, a complex funding option, often called level-funding, has become more widely available to small employers. Level-funded arrangements are nominally self-funded options that package together a self-funded plan with extensive stoploss coverage that significantly reduces the risk retained by the employer. Thirty-eight percent of covered workers in small firms (3-199 workers) are in a level-funded plan.
SELF-FUNDED PLANS
Sixty-four percent of covered workers are in a plan that is self-funded, similar to the percentage (67%) last year [Figure 10.1] and [Figure 10.2].
The percentage of covered workers enrolled in self-funded plans is similar to the percentages five years ago (61%) and ten years ago (60%) [Figure 10.2].
As expected, covered workers in large firms are significantly more likely to be in a self-funded plan than covered workers in small firms (82% vs. 21%) [Figure 10.1] and [Figure 10.3].
Figure 10.1: Percentage of Covered Workers Enrolled in a Self-Funded Plan, by Firm Size, 2021
Figure 10.2: Percentage of Covered Workers Enrolled in a Self-Funded Plan, by Firm Size, 1999-2021
Figure 10.3: Percentage of Covered Workers Enrolled in a Self-Funded Plan, by Firm Size, Region, and Industry, 2021
Figure 10.4: Percentage of Covered Workers Enrolled in a Self-Funded Plan, by Plan Type and Firm Size, 2021
Figure 10.5: Percentage of Covered Workers Enrolled in a Self-Funded Plan by Firm Ownership Type, 2021
LEVEL-FUNDED PLANS
In the past few years, insurers have begun offering health plans that provide a nominally self-funded option for small or mid-sized employers that incorporates stoploss insurance with relatively low attachment points. Often, the insurer calculates an expected monthly expense for the employer, which includes a share of the estimated annual cost for benefits, premium for the stoploss protection, and an administrative fee. The employer pays this “level premium” amount, with the potential for some reconciliation between the employer and the insurer at the end of the year, if claims differ significantly from the estimated amount. These policies are sold as self-funded plans, so they generally are not subject to state requirements for insured plans and, for those sold to employers with fewer than 50 employees, are not subject to the rating and benefit standards in the ACA for small firms.
Due to the complexity of the funding (and regulatory status) of these plans, and because employers often pay a monthly amount that resembles a premium, respondents may be confused as to whether or not their health plan is self-funded or insured. We asked employers with fewer than 200 workers whether they have a level-funded plan.
Forty-two percent of small firms offering health benefits offer a level-funded plan in 2021, much higher than the percentage (13%) last year. The substantial increase for 2021 suggests that that there may be a significant shift in the small group market toward health-status-based rating, so it will be important to monitor this trend to see if continues over the next several years.
Figure 10.6: Among Covered Workers at Small Firms, Percentage Enrolled in a Level-Funded or Self-Funded Plan, by Firm Size, 2021
Figure 10.7: Among Covered Workers at Small Firms, Percentage Enrolled in a Level-Funded or Self-Insured Plan, by Firm Size, 2021
STOPLOSS COVERAGE
Employers purchase insurance, often referred to as “stoploss” coverage, to limit the amount that they may have to pay for claims in a self-funded plan. There are different types of stoploss; for example a stoploss policy may cover any amount that the plan sponsor must pay over a specified amount for each worker or enrollee (referred to as specific stoploss coverage) or it may limit the total amount the plan sponsor must pay for all claims in the plan over the plan year (referred to as aggregate stoploss coverage). Stoploss coverage also could be focused on particular types of claims. A firm may have more than one type of stoploss coverage.
At large firms (200 or more workers), 62% of covered workers in self-funded health plans are in plans that have stoploss insurance, similar to percentages last year (61%) and in 2018 (59%) [Figure 10.8].
The percentage of covered workers in large firms in self-funded plans with stoploss insurance (62%) is similar to the value when the survey first asked about stoploss insurance in 2011 (57%).
Figure 10.8: Among Covered Workers Enrolled in a Self-Funded Plan (At Firms With 200 or More Workers), Percentage Covered by Stoploss Insurance, by Firm Size, 2021
Self-Funded Plan An insurance arrangement in which the employer assumes direct financial responsibility for the costs of enrollees’ medical claims. Employers sponsoring self-funded plans typically contract with a third-party administrator or insurer to provide administrative services for the self-funded plan. In some cases, the employer may buy stoploss coverage from an insurer to protect the employer against very large claims.
Fully-Insured Plan An insurance arrangement in which the employer contracts with a health plan that assumes financial responsibility for the costs of enrollees’ medical claims.
Level-Funded Plan An insurance arrangement in which the employer makes a set payment each month to an insurer or third party administrator which funds a reserve account for claims, administrative costs, and premiums for stop-loss coverage. When claims are lower than expected, surplus claims payments may be refunded at the end of the contract.
Stoploss Coverage Stoploss coverage limits the amount that a plan sponsor has to pay in claims. Stoploss coverage may limit the amount of claims that must be paid for each employee or may limit the total amount the plan sponsor must pay for all claims over the plan year.
Attachment Point Attachment points refer to the amount at which the insurer begins to pay its obligations for stoploss coverage, either because plan, individual or claim spending exceed a designated value.
Section 11: Retiree Health Benefits
Retiree health benefits are an important consideration for older workers making decisions about their retirement. Retiree benefits can be a crucial source of coverage for people retiring before Medicare eligibility. For retirees with Medicare coverage, retiree health benefits can provide an important supplement to Medicare, helping them pay for cost sharing and benefits not otherwise covered by Medicare.
This year’s survey finds that 27% of large firms offering health benefits offer retiree health benefits, similar to the percentage (29%) in 2020.
This survey asks retiree health benefits questions only of large firms (200 or more workers).
EMPLOYER RETIREE BENEFITS
In 2021, 27% of large firms that offer health benefits offer retiree health benefits for at least some current workers or retirees, similar to the percentage last year [Figure 11.1]. In 2019, we modified the question that we use to ask firms whether or not they provide retiree health benefits, to explicitly say “yes” if they still had some retirees getting coverage even if they terminated retiree health benefits (for current workers) or if they had current employees who will get retiree health coverage in the future. For this reason, estimates of retiree health benefits from 2019 and after are not comparable to prior survey estimates.
Retiree health benefits offer rates vary considerably by firm characteristics.
Among large firms offering health benefits, the likelihood that a firm will offer retiree health benefits increases with firm size [Figure 11.2].
The share of large firms offering retiree health benefits varies considerably by industry [Figure 11.2].
Among large firms offering health benefits, public employers are more likely (56%) to offer retiree health benefits than other firm types [Figure 11.3].
Large firms offering health benefits with at least some union workers are more likely to offer retiree health benefits than large firms without any union workers (42% vs. 22%) [Figure 11.3].
Large firms offering health benefits with a relatively large share of younger workers (where at least 35% of the workers are age 26 or younger) are less likely to offer retiree health benefits than large firms with a larger share of younger workers (12% vs. 29%) [Figure 11.3].
Large firms offering health benefits with a relatively large share of older workers (where at least 35% of the workers are age 50 or older) are more likely to offer retiree health benefits than large firms with a smaller share of older workers (34% vs. 20%) [Figure 11.3].
Large firms offering health benefits with a relatively large share of lower-wage workers (where at least 35% of workers earn $28,000 a year or less) are less likely to offer retiree health benefits than large firms with a smaller share of lower-wage workers (14% vs. 29%) [Figure 11.3].
Figure 11.1: Among Large Firms Offering Health Benefits to Active Workers, Percentage of Firms Offering Retiree Health Benefits, 1988-2021
Figure 11.2: Among Large Firms Offering Health Benefits to Active Workers, Percentage of Firms Offering Retiree Health Benefits, by Firm Size, Region, and Industry, 2021
Figure 11.3: Among Large Firms Offering Health Benefits to Active Workers, Percentage of Firms Offering Retiree Health Benefits, by Firm Characteristics, 2021
COVERAGE FOR EARLY RETIREES AND MEDICARE-AGE RETIREES
Among large firms offering retiree health benefits, 89% offer benefits to early retirees under the age of 65 and 64% offer them to Medicare-age retirees [Figure 11.4].
Among all large firms offering health benefits to current workers, 17% offer retiree health benefits to Medicare-age retirees.
Among large firms offering retiree health benefits, 57% offer benefits to both early and Medicare-age retirees.
Figure 11.4: Among Large Firms Offering Health Benefits to Active Workers and Retirees, Percentage of Firms Offering Health Benefits to Early and Medicare-Age Retirees, 2000-2021
BENEFIT ELIGIBILITY
Among large firms offering retiree health benefits, 86% say that at least some current employees will be eligible for retiree health benefits after meeting any age and/or length of service requirements [Figure 11.5].
Among large firms offering retiree health benefits, 58% say that new hires will be eligible for the firm’s retiree health benefits after meeting any age and/or length of service requirements [Figure 11.5].
Among large firms offering retiree benefits, a large share (80%) report offering health benefits to the spouses of retirees [Figure 11.5].
Figure 11.5: Among Large Firms Offering Health Benefits to Active Workers and Retirees, Percentage of Firms Offering Retiree Health Benefits to Various Groups of Workers, by Firm Size, 2021
MEDICARE ADVANTAGE
Forty-five percent of large employers offering retiree health benefits to Medicare-age retirees offer coverage to at least some Medicare-age retirees through a contract with a Medicare Advantage plan, the same percentage as last year (45%) [Figure 11.6].
Figure 11.6: Among Large Firms That Offer Retiree Health Benefits to Medicare-Age Retirees, Percentage of Firms That Contract With a Medicare Advantage (MA) Plan, 2021
PREMIUM CONTRIBUTIONS
Sixty percent of large firms offering retiree health benefits make a contribution toward the cost of benefits for at least some of their retirees [Figure 11.7].
A defined contribution is a set dollar amount that the retiree can use to purchase a health plan they choose. Among large firms that make a contribution toward the cost of retiree benefits, 41% report that they make a defined contribution for retiree health benefits [Figure 11.8].
Figure 11.7: Among Large Firms Offering Health Benefits to Active Workers and Retirees, Percentage of Firms That Contribute to the Cost of Retiree Health Benefits, by Firm Size, 2021
Figure 11.8: Among Large Firms That Contribute to Retiree Health Benefits, Percentage of Firms That Contribute Through a Defined Contribution, by Firm Size, 2021
Section 12: Health Screening and Health Promotion and Wellness Programs
Most firms offer some form of wellness program to help workers and family members identify health issues and manage chronic conditions. Many employers believe that improving the health of their workers and their families can improve morale and productivity, as well as reduce health care costs. Only firms offering health benefits were asked about their wellness and health promotion programs.
In addition to offering wellness programs, a majority of large firms now offer health screening programs, including health risk assessments, which are questionnaires asking workers about lifestyle, stress, or physical health, and biometric screening, which we define as in-person health examinations conducted by a medical professional. Firms and insurers may use the health information collected during screenings to target wellness offerings or other health services to workers with certain conditions and to understand employee health risks. Some firms have incentive programs that reward or penalize workers for different activities, including participating in wellness programs or completing health screenings.
The COVID-19 pandemic placed stress on employer health promotion and wellness activities. Many employees worked remotely for large stretches of 2020, and many avoided public places, including medical offices and gyms. For these employees, achieving wellness goals or targets was a struggle, and some employers responded by modifying their health screening, health promotion and wellness programs in recognition of these challenges. This calendar year began with large shares of workers still working remotely and many people continuing to avoid unnecessary public contacts. Due to these uncertain circumstances, we modified our questions for 2021 about health screening and wellness to focus on changes that employers and payers made to accommodate the challenges workers had and may still have in achieving and maintaining good health.
Among firms with 50 or more employees offering a biometric screening opportunity both this year and last year, 32% of small firms (50-199 employees) and 43% of larger firms report making some change in their biometric screening programs since the start of the COVID-19 pandemic.
Among firms with 50 or more employees offering a health promotion or wellness program this year, 50% of smaller firms (50-199 employees) and 68% of larger firms reported making some change to their health promotion programs since the start of the COVID-19 pandemic.
BIOMETRIC SCREENING
Biometric screening is a health examination that measures a person’s risk factors (such as cholesterol, blood pressure, and body mass index (BMI)) for certain medical issues. A biometric outcome involves assessing whether the person meets specified health targets related to certain risk factors, such as meeting a target BMI or cholesterol level. As defined by this survey, goals related to smoking are not included in the biometric screening questions.
Among firms offering health benefits, 26% of small firms and 38% of large firms provide workers the opportunity to complete a biometric screening [Figure 12.1]. The percentage of large firms providing workers the opportunity to complete a biometric screening is lower than the percentage last year (50%) [Figure 12.2]. In fact, 45% of large firms offering health benefits in 2021, including 16% of large firms not offering a biometric screening opportunity this year, report offering a biometric screening opportunity in 2020.
Firms with at least 50 employees offering a biometric screening opportunity both this year and last year were asked about changes that they have made to their programs since the start of the COVID-19 pandemic. Overall, among firms offering a biometric screening opportunity both this year and last year, 32% of small firms (50-199 employees) and 43% of larger firms report making some change in their biometric screening programs since the start of the COVID-19 pandemic [Figure 12.3].
Three percent of smaller firms and 5% of larger firms reduced or eliminated incentives for completing the screening.
Thirteen percent of smaller firms and 23% of larger firms permitted screenings to be completed by a broader set of providers.
Five percent of smaller firms and 15% of larger firms reduced the stringency of screening requirements.
Nineteen percent of smaller firms and 18% of larger firms arranged for biometric screenings to be performed on a digital platform.
Three percent of smaller firms and 5% of larger firms suspended or eliminated the program for some workers.
Figure 12.1: Among Firms Offering Health Benefits, Percentage of Firms That Provide an Opportunity to Complete a Biometric Screening, by Firm Size, 2021
Figure 12.2: Among Firms Offering Health Benefits, Percentage of Firms That Provide an Opportunity to Complete Biometric Screening, by Firm Size, 2012-2021
Figure 12.3: Among Firms Which Offered Biometric Screening This Year and Last Year, Changes Firm Made to Biometric Screening Programs Due to the COVID-19 Pandemic, 2021
Figure 12.4: Among Firms with 50 or More Employees Which Offered Biometric Screening This Year and Last Year, Changes Firm Made to Biometric Screening Programs Due to the COVID-19 Pandemic, 2021
WELLNESS AND HEALTH PROMOTION PROGRAMS
Large shares of employers continue to offer educational and other programs to help workers engage in healthy lifestyles and reduce health risks. Wellness and health promotion programs may include exercise programs, health education classes, health coaching, and stress-management counseling. These programs may be offered directly by the firm, an insurer, or a third-party contractor. As with biometric and other screening programs, employers made changes for 2020 and 2021 in reaction to the COVID-19 pandemic.
Among firms offering health benefits, 42% of small firms and 69% of large firms offer programs to help workers stop smoking or using tobacco, 44% of small firms and 63% of large firms offer programs to help workers lose weight, and 48% of small firms and 71% of large firms offer some other lifestyle or behavioral coaching program. Overall, 58% of small firms and 83% of large firms offering health benefits offer at least one of these three programs [Figure 12.6] and [Figure 12.7]. These percentages are similar to the percentages last year.
Figure 12.5: Among Firms Offering Health Benefits, Percentage of Firms Offering Specific Wellness Programs to Their Workers, by Firm Size and Region, 2021
Figure 12.6: Among Firms Offering Health Benefits, Percentage of Firms Offering Specific Wellness Programs to Their Workers, by Firm Size, 2021
Figure 12.7: Among Firms Offering Health Benefits, Percentage of Firms Offering Wellness Programs, by Firm Size, 2015-2021
CHANGES TO WELLNESS AND HEALTH PROMOTION PROGRAMS
Firms with 50 or more employees with a wellness or health promotion program were asked if they made changes to their programs since the beginning of the COVID-19 pandemic. Overall, 50% of smaller firms (50-199 employees) and 68% of larger firms reported some type of change.
Three percent of smaller firms and 6% of larger firms reduced or eliminated incentives associated with their program [Figure 12.9].
Fifteen percent of smaller firms and 21% of larger firms added a new digital program or digital content to their program.
Eight percent of smaller firms and 10% of larger firms increased support for wearable devices.
Seventeen percent of smaller firms and 34% of larger firms expanded or modified the content of their existing programs to better address the health needs of people working from home.
Thirty-eight percent of smaller firms and 58% of larger firms provided or expanded on-line counseling services for emotional or financial distress, relationship issues, or other stressful situations.
Figure 12.8: Among Firms Offering a Specified Wellness Program, Percentage of Firms Which Changed Wellness Programs Due to the COVID-19 Pandemic, 2021
Figure 12.9: Among Firms Offering a Specified Wellness Program, Percentage of Firms Which Changed Wellness Programs Due to the COVID-19 Pandemic, by Firm Size, 2021
Section 13: Employer Practices, Telehealth and Employer Responses to the Pandemic
Employers frequently review and modify their health plans to incorporate new options or adapt to new circumstances. We continue to monitor new options, such as telemedicine, and ask about changes in the health or policy environments.
This year employers continue to deal with the coronavirus pandemic, with the accompanying economic and social disruptions and the uncertainty about when “normality” may return. For many employers, this means that some or even all of their employees began the year working remotely, with no clear guidance about when that may change. The approval and rapid dissemination of vaccines for coronavirus provide hope that the worst parts of the pandemic may be in the past, although low levels of vaccinations in some parts of the country (and throughout much of the world) and the emergence of new and more dangerous variants are reasons to remain cautious about new outbreaks.
We modified the 2021 survey to gather information about changes that employers may have made to their health benefits in response to COVID-19. Two issues, in particular, that received attention over the last year are telemedicine and mental health. Telemedicine proved to be an important source of access to care, particularly during the early months of the pandemic as people sheltered at home and avoided public places, including physician offices and health facilities. The compound stresses from social isolation and economic and health uncertainties challenged many families, focusing attention on the adequacy of mental health supports.
The share of employers covering health services through telemedicine continued to grow in 2021. In addition, many employers made changes in their telemedicine benefits after the COVID-19 pandemic began to broaden coverage or make the benefit easier to use. Many employers also made changes in their mental health coverage to make it easier for employees to access services.
SHOPPING FOR HEALTH COVERAGE
Fifty-one percent of firms offering health benefits reported shopping for a new health plan or a new insurance carrier in the past year, similar to the percentage last year. The likelihood that a firm reported shopping for a new health plans or carrier decreased with firm size. [Figure 13.1].
Among firms that offer health benefits and who shopped for a new plan or carrier in the past year, 24% changed insurance carriers [Figure 13.2].
Figure 13.1: Percentage of Firms Offering Health Benefits That Shopped for a New Plan or Health Insurance Carrier in the Past Year, by Firm Size, 2021
Figure 13.2: Among Firms Offering Health Benefits That Shopped for a New Plan or Insurance Carrier, Percentage of Firms That Changed Insurance Carriers in the Past Year, by Firm Size, 2021
TELEMEDICINE
While telemedicine was becoming an increasingly popular benefit prior to the COVID-19 pandemic, its use skyrocketed during the pandemic as people sheltered at home and refrained from seeking non-emergency health care. Both state and federal policymakers took steps to reduce regulatory barriers to the provision of telemedicine services, while employers and insurers also took steps to make it easier for patients to use them. We expanded the telemedicine questions on the survey for 2021 to ask about changes employers made to their telemedicine benefits after the beginning the COVID-19 pandemic.
We define telemedicine as the delivery of health care services through telecommunications to a patient from a provider who is at a remote location, including video chat and remote monitoring. This generally does not include the mere exchange of information via email, exclusively web-based resources, or online information that a plan may make available unless a health professional provides information specific to the enrollee’s condition. We note that during the coronavirus pandemic, some plans have eased their definitions to allow more types of digital communication to be reimbursed.
Ninety-five percent of firms with 50 or more workers that offer health benefits cover the provision of some health care services through telemedicine in their largest health plan, higher than the percentage (85%) in 2020 [Figure 13.3].
The percentages of small firms (50-199 workers) and large firms reporting that they cover services through telemedicine are much higher than they were three years ago (94% v. 65% for small firms and 96% v. 74% for large firms) [Figure 13.3].
Among firms with 50 or more employees offering telemedicine services, 20% offer telemedicine services through a specialized telemedicine service provider, such as Teledoc, Doctor on Demand, OR MDLIVE, 59% offer services through their health plan, 17% offer services through both a specialized telemedicine provider and their health plan, and 4% provide services through some other arrangement [Figure 13.5].
Small firms are more likely than larger firms to provide telemedicine services only through their health plan (63% v. 46%) while large firms are more likely than smaller firms to provide telemedicine services through both a specialized telemedicine provider and their health plan (24% v. 14%) [Figure 13.5].
As noted above, telemedicine has became an important source of health care services during the COVID-19 pandemic. Employers with 50 or more employees offering telemedicine services were asked about changes they made to their programs after the beginning the COVID-19 pandemic [Section 13.6]. Among these firms:
Nineteen percent of smaller employers and 35% of large employers expanded the number of services covered through telemedicine [Section 13.7].
Nineteen percent of smaller employers and 33% of large employers expanded the number or type of providers that could provide telemedicine services [Section 13.7].
Fifteen percent of smaller employers and 27% of large employers reduced or eliminated cost sharing for telemedicine services [Section 13.7].
Twenty-four percent of employers expanded the settings or locations where enrollees may use telemedicine services [Section 13.6].
Thirty-one percent of employers expanded coverage for additional modes of delivering telemedicine, such as by telephone [Section 13.6].
Three percent of smaller employers and 10% contracted with a new telemedicine service provider, such as a specialized telemedicine vendor [Section 13.7].
Forty-seven percent of smaller employers and 66% of large employers increased promotion or employee communication of telemedicine resources [Section 13.7].
Employers with 50 or more employees offering telemedicine services were asked how important they felt telemedicine would be in providing their employees with access to health care in the coming years. Almost half of these employers (47% felt telemedicine would be very important in providing access in the future, while only 4% said that telemedicine would be unimportant in providing access in the future [Figure 13.4].
Figure 13.3: Among Firms Offering Health Benefits, Percentage of Firms Whose Plan With the Largest Enrollment Covers Telemedicine, by Firm Size, 2015-2021
Figure 13.4: Among Firms Offering Health Benefits, How Important Firm Considers Telemedicine in Providing Access to Enrollees in the Coming Years, by Firm Size, 2021
Figure 13.5: Among Firms Offering Telemedicine Health Benefits, Structure of the Firms Telemedicine Benefits, by Firm Size, 2021
Figure 13.6: Among Firms Offering Telemedicine Benefits, Changes the Firm Made to Telemedicine Benefits During the COVID-19 Pandemic, 2021
Figure 13.7: Among Firms Offering Telemedicine Benefits, Changes the Firm Made to Telemedicine Benefits During the COVID-19 Pandemic, by Firm Size, 2021
COVID-19 IMPACTS AND POLICIES
The COVID-19 pandemic and the associated social and financial disruptions have challenged employers in many ways. Employers have made changes to their employment policies and to their health plans, and have seen changes in enrollment and utilization of plan services.
Enrollment of Dependents. Only small shares of employers say that they saw an increase or decrease in the share of dependents enrolling in their health plans after the start of the COVID-19 pandemic. Among firms with 50 or more employees offering health benefits to dependents, 5% said that the share of dependents enrolling in their health plans increased, 4% said that the share of dependents enrolling in their health plans decreased, and 92% said that the share remained about the same. Small firms were more likely than large firms to say that the share of dependents in their health plan decreased [Figure 13.8].
Figure 13.8: Among Firms Offering Health Benefits, Change in the Share of Dependents Enrolling in the Plan Since Start of the COVID-19 Pandemic, by Firm Size, 2021
Health Service Use. As was widely reported, the use of health care services fell significantly during 2020 as people sheltered at home and avoided health care settings. Entering into 2021, some of the questions for employers involved whether, and if so by how much, service use might rebound. We asked large employers (200 or more employees) offering health benefits how the level of service use in their health plans during the most recent quarter matched their expectations. Eighteen percent of these employers say that the level of service use in the last quarter was higher than expected, 50% say that the level was about what they expected, and 32% say that the level was below the level that they expected [Figure 13.9].
Figure 13.9: Among Large Firms Offering Health Benefits, Has the Amount of Health Care Utilization Been Above or Below Expectations During the Last Quarter, by Firm Size, 2021
Cost Sharing for COVID Treatment. Many employers and health plans waived cost sharing last year for their enrollees who became infected with COVID-19. Employers with 50 or more employees were asked if they currently waive cost sharing for COVID-19 treatment.
Thirty-five percent of employers with 50 to 199 workers and 45% of employers with 5,000 or more workers currently waive cost sharing for treatment of employees infected with COVID-19. Firms with 1,000 or more employees are more likely to waive cost sharing for COVID-19 treatment than smaller firms [Figure 13.10].
Figure 13.10: Among Firms Offering Health Benefits, Percentage of Firms Whose Largest Plan Waives Cost Sharing for COVID-19 Treatment, by Firm Size, 2021
Mental and Behavioral Health. The COVID-19 pandemic and the accompanying social and economic disruptions have placed an unprecedented level of stress on people all over the world. Many employers took steps to assist employees and family members facing these stresses, such as providing information on assistance and resources that they make available through their health plans and employee assistance programs or by creating new programs to support employees and family members needing assistance.
Employers with at least 50 employees offering health benefits were asked about changes they made to their health plans after the start of the COVID-19 pandemic to support the mental health of their employees. Sixteen percent of employers developed new resources, such as an employee assistance program [Figure 13.11].
Three percent of employers increased coverage for out-of-network mental health or substance abuse services. Firms with 1,000 or more employees were more likely than smaller firms (50 to 199 employees) to increase coverage for out-of-network services (9% v. 3%) [Figure 13.11].
Six percent of employers, including (16% of employers with 5,000 or more employees, expanded the number of mental health or substance abuse providers in their plans’ networks [Figure 13.11].
Four percent of employers waived or reduced cost-sharing for mental health or substance abuse services. The percentage of firms waiving or reducing cost sharing for these services increased with firm size [Figure 13.11].
Thirty-one percent of employers expanded the ways through which enrollees could get mental health or substance abuse services, such as through telemedicine. The percentage of firms expanding the methods of access for these services increased with firm size [Figure 13.11].
Twelve percent of employers with at least 50 employees offering health benefits reported seeing an increase in the share of employees using mental health services since the COVID-19 pandemic began. This percentage increases with firm size, with 46% of firms with 5,000 or more employees seeing such an increase. We note that the percentage if firms reporting “don’t know” to this question is relatively high (24%) [Figure 13.14].
A much smaller share of these employers (1%) reported seeing an increase in the share of employees using services for substance-abuse-related conditions since the COVID-19 pandemic began. This percentage increases with firm size, with 11% of firms with 5,000 or more employees seeing the share increase. We note that the percentage if firms reporting “don’t know” to this question is relatively high (22%) [Figure 13.14].
Despite the lower percentage of employers reporting that they saw an increase in the share of employees using services for substance-abuse-related conditions, there is concern among employers that substance abuse has grown among their employees since the COVID-19 pandemic began. Twenty-six percent of employers, including 59% of firms with 5,000 or more workers, say that they are concerned “a great deal” or are “somewhat” concerned that substance abuse conditions have increased among their employees [Figure 13.13].
Figure 13.11: Among Firms Offering Health Benefits, Changes the Firm Made Since the Beginning of the COVID-19 Pandemic to Meet the Mental Health Needs of Employees, 2021
Figure 13.12: Among Firms Offering Health Benefits, Changes the Firm Made Since the Beginning of the COVID-19 Pandemic to Meet the Mental Health Needs of Employees, by Firm Size, 2021
Figure 13.13: Among Firms Offering Health Benefits, Concern With Growth of Substance Abuse Conditions Among Employees, by Firm Size, 2021
Figure 13.14: Among Firms Offering Health Benefits, Percentage of Firms Which Have Seen an Increase in Employees Seeking Mental Health and Substance Abuse Services Since the COVID-19 Pandemic Began, by Firm Size, 2021
PRIVATE EXCHANGES
A private exchange is a virtual market that allows employers to provide their workers with a choice of several different health benefit options, often including voluntary or ancillary benefits options. Private exchanges generally are created by consulting firms, insurers, or brokers, and are different than the public exchanges run by the states or the federal government. There is considerable variation in the types of exchanges currently offered: some exchanges allow workers to choose between multiple plans offered by the same carrier while in other cases multiple carriers participate. Private exchanges have been operating for several years, but enrollment remains modest.
Five percent of firms offering health benefits with 50 or more workers offer coverage through a private exchange. These firms provide coverage to 5% of covered workers in firms with 50 or more workers. These percentages are similar to those in the past few years.
Figure 13.15: Among Firms Offering Health Benefits, Percentage of Covered Workers Enrolled at a Firm That Offers Benefits Through a Private or Corporate Exchange, by Firm Size, 2021
Figure 13.16: Among Firms Offering Health Benefits, Percentage of Covered Workers Enrolled at a Firm That Offers Benefits Through a Private or Corporate Exchange, by Firm Size, 2015-2021
HEALTH CARE PRICE TRANSPARENCY
New federal rules will require health plans (including self-funded plans) to make information available to enrollees about the estimated cost of services and cost-sharing on a “real-time” basis. Large employers (200 or more employees) were asked about the potential effectiveness and burdens of these new transparency requirements.
Among large employers offering health benefits, 26% say that providing employees with additional information about the cost of services will help their health care decision making “a great deal” and an additional 50% say that it will help their decision making “somewhat” [Figure 13.17].
Among large employers offering health benefits, 8% say that implementing the new transparency rules would involved “a great deal” of difficulty and an additional 45% say that it will be “somewhat” difficult [Figure 13.17]. Among firms with 5,000 or more employees, 21% say that implementing the new transparency rules would involved “a great deal” of difficulty.
Among large employers offering health benefits, only 3% say that the new transparency rules will reduce health spending “a great deal”, while 15% say that they will be reduce health spending “not at all.” Thirty-eight percent of these firms say that the new rules will reduce spending “somewhat” and 40% say that they will reduce spending “very little” [Figure 13.17].
Figure 13.17: Among Large Firms Offering Health Benefits, Firms Opinions On Health Transparency Requirements, 2021
PRESCRIPTION DRUG MANAGEMENT
Employers, health plans and their prescription benefit managers continue to add new features to manage the costs of prescription drugs. This year we included questions for larger employers (500 or more workers) about programs that exclude the value of pharmaceutical manufacturer subsidies (e.g., coupons) when determining if deductibles or out-of-pocket limits are met and programs that delay formulary placement for certain high-cost medications until they are proven effective.
Among employers with 500 or more employees offering prescription drug benefits in 2021, 13% have made a change to their prescription program in the last two years to delay the inclusion of new high-cost drug therapies until the therapy is proven effective. A fairly large share of employers with 500 or more workers (21%) did not know if they had made such a change to their programs [Figure 13.18].
Among employers with 500 or more employees offering prescription drug benefits in 2021, 18% have a programs that excludes subsidies from prescription drug manufacturers, such as coupons, from counting towards an enrollee’s deductible or out-of-pocket limit. About the same share of employers with 500 or more workers (14%) did not know if their programs included this feature [Figure 13.19].
Figure 13.18: Among Firms With 500 or More Employees Offering Drug Benefits, Percentage of Firms That Changed Their Formulary Over the Last Two Years to Delay the Inclusion of New High-Cost Drug Therapies Until They Are Proven Effective, 2021
Figure 13.19: Among Firms With 500 or More Employees Offering Prescription Drug Coverage, Percentage of Firms That Have a Copay Accumulator Program, 2021
Figure 13.20: Among Firms With 50 or More Employees Offering Each of the Following Programs, Percentage That Made Any Change Due to COVID-19 Pandemic, 2021
Average Family Premiums Rose 4% This Year to Top $22,000; Employers Boost Mental Health and Telemedicine amid COVID-19 Pandemic, Benchmark KFF Survey Finds
Annual family premiums for employer-sponsored health insurance rose 4% to average $22,221 this year, according to the 2021 benchmark KFF Employer Health Benefits Survey released today. On average, workers this year are contributing $5,969 toward the cost of family coverage, with employers paying the rest. This year’s survey also assesses how the pandemic affected workplace health benefits, including mental health services and telemedicine.
The annual change in premiums roughly matches the year-to-year rise in workers’ wages (5%) and inflation (1.9%), though what workers and employers pay toward premiums over time has risen more quickly. Since 2011, average family premiums have increased 47%, more than wages (31%) or inflation (19%).
About 155 million Americans rely on employer-sponsored coverage, and the 23rd annual survey of nearly 1,700 small and large employers provides a detailed picture of the trends affecting it. In addition to the full report and summary of findings released today, the journal Health Affairs is publishing an article with select findings online and in its December issue.
Among large employers with at least 200 workers, half report that health-care utilitization among their plan enrollees has been about what they expected for the most recent quarter. More say utlization has been below expectations (32%) than above it (18%), consistent with other data showing a slowdown in total health spending during the COVID-19 pandemic.
“In a year when the pandemic continued to cause health and economic disruption, there were only modest changes in the cost of employer-provided health benefits,” said Gary Claxton, a KFF senior vice president and director of the Health Care Marketplace Project. “Some employers adapted their plans to address mental health and other challenges facing their workers due to COVID-19.”
Among firms with at least 50 workers that offer health benefits, almost four in 10 (39%) report making changes to their mental health and substance abuse benefits since the beginning of the pandemic.
This includes 31% who increased the ways enrollees can access mental-health services, such as through telemedicine; and 16% who offered new mental health resources, such as an employee assistance program. Small shares say they expanded their in-network mental health and substance abuse providers (6%), waived or reduced cost-sharing for related services (4%) or increased coverage for out-of-network services (3%).
Overall 12% of employers with at least 50 workers that offer health benefits reported an increase in their enrollees’ use of mental-health services. Among the largest employers (with 1,000 or more workers), more than a third (38%) reported such an increase.
Other COVID-related findings include:
• Nearly two thirds (65%) of offering firms with at least 50 workers say they made changes related to telemedicine due to the pandemic. Half (51%) did additional promotion of their telemedicine benefits to workers and 31% expanded coverage for additional modes of telemedicine. In addition, nearly a quarter expanded the places where telemedicine could be delivered (24%), expanded the number or types of telemedicine providers (23%), and expanded covered telemedicine services.
• More than half (55%) of offering firms with at least 50 workers say they made changes to their wellness programs due to the pandemic. The most common changes involve expanding online counseling services (43%), expanding or changing existing programs to better meet the needs of people working from home (22%), and adding a new digital program such as an app (17%).
“The expansions of telemedicine and mental health benefits were important in meeting the needs of employees and their families in difficult times,” write Claxton; Matthew Rae, associate director of KFF’s Program on the Health Care Marketplace; and co-authors in Health Affairs. “These types of changes made sense not because employers want to spend more, but because employers want their employees to see their health benefit programs as ‘benefits’ and to value them as such.”
Average Deductible Now Stands at $1,669 This Year; Burden is Up 92% Over Past Decade
The average single deductible stands at $1,669 for workers who have one, similar to the average in each of the past two years ($1,644 in 2020; $1,655 in 2019) but up significantly since 2011 ($991). This year 85% of covered workers have a deductible in their plan, up from 74% a decade ago.
Combined, the growing share of workers with deductibles and rising average deductibles over the past decade have increased the burden of deductibles by 92% across all covered workers.
Among covered workers with a deductible, those at small firms with less than 200 employees on average face deductibles that are 70% higher than those at large firms with at least 200 employees ($2,379 vs. $1,397).
Other findings include:
• Offer rate holds steady. The survey finds 59% of employers offer health benefits, largely unchanged over the past decade. The larger an employer is, the more likely it is to offer health benefits to at least some of its workers, with nearly all (99%) firms with at least 200 or more workers and about half (56%) of firms with fewer than 50 workers offering coverage. Small firms that don’t offer coverage most often cite cost (30%), their small size (25%), and workers having other coverage (21%) as the most important reason.
• Price transparency. With new federal rules requiring health plans to make information available to enrollees about the costs of services, a quarter (26%) of firms with at least 200 workers say they expect the information will help employees’ health care decisions “a great deal.” Few (3%) say the requirements will reduce health spending “a great deal.”
• Retiree health benefits and Medicare Advantage. About a quarter (27%) of large firms offer retiree health benefits for at least some current workers or retirees. Of these, 89% offer coverage to early retirees (under age 65) and 64% offer coverage to Medicare-age retirees (65 and older). For those offering benefits to Medicare-age retirees, nearly half (45%) offer coverage through a contract with a Medicare Advantage plan.
Methodology
KFF conducted the annual employer survey between January and July of 2021. It included 1,686 randomly selected, non-federal public and private firms with three or more employees that responded to the full survey. An additional 2,413 firms responded to a single question about offering coverage. For more information on the survey methodology, see the Survey Design and Methods Section.
ABOUT HEALTH AFFAIRS:
Health Affairs is the leading peer-reviewed journal at the intersection of health, health care, and policy. Published monthly by Project HOPE, the journal is available in print and online. Late-breaking content is also found through healthaffairs.org, Health Affairs Today, and Health Affairs Sunday Update.
Project HOPE is a global health and humanitarian relief organization that places power in the hands of local health care workers to save lives across the globe. Project HOPE has published Health Affairs since 1981.