Family Planning and Contraceptive Provision Among Females Enrolled in Medicaid

Published: Feb 17, 2022

Introduction

Family planning services, which include contraceptive services and supplies as well as a broader set of services related to sexual and reproductive health, are key preventive services for women. Most women (87%) use contraception at some point and on average, women report using 3.4 methods of contraception throughout their lifetime. For low-income women in particular, Medicaid plays a major role in financing family planning services. Recognizing the importance of contraception and family planning services, federal Medicaid law classifies family planning services and supplies as a “mandatory” benefit category that states must cover. Federal Medicaid law has other protections that promote access to family planning services that:

  • Prohibit providers from charging copayments or any other form of patient cost sharing for family planning services
  • Establish a 90% federal matching rate (FMAP) for the costs of services classified as family planning, a higher rate than for other services
  • Entitle beneficiaries to obtain family planning services from any provider that participates in the Medicaid program, called free choice of provider, including for beneficiaries enrolled in managed care organizations (MCOs)

All states cover prescription contraceptives for women, but they may limit access through utilization controls. Additionally, about half of states offer a range of family planning benefits including contraceptive services and supplies to individuals who do not otherwise qualify for full Medicaid coverage. States can establish these family planning programs by receiving permission from the federal Centers for Medicare and Medicaid Services (CMS) through a Section 1115 waiver or by amending their Medicaid programs with a State Plan Amendment (SPA). Recognizing the importance of contraceptive services for women, CMS recently added two measures of contraceptive care to the core health care quality measures, known as the Adult and Child Core Sets. These measures assess provision of the most and moderately effective contraceptive methods (i.e., sterilization, intrauterine devices (IUDs), implants, injectables (e.g., Depo-Provera), oral pills, patch, or ring) to female beneficiaries.

Despite the special status of family planning services under Medicaid, very little is known about the provision of these services to Medicaid beneficiaries. To better understand the level of use of these services and to explore the variation in utilization across states, we examine the provision of contraceptive services and supplies, as well as provision of family planning services more broadly to reproductive age women (ages 15 to 49) continuously covered by Medicaid in 2018. We present new national and state-level data by age as well as comparisons by region. This analysis is based on claims data from the Transformed Medicaid Statistical Information System (T-MSIS) and is based on data from 43 states and the District of Columbia. Seven states are excluded due to concerns about data quality.

Findings

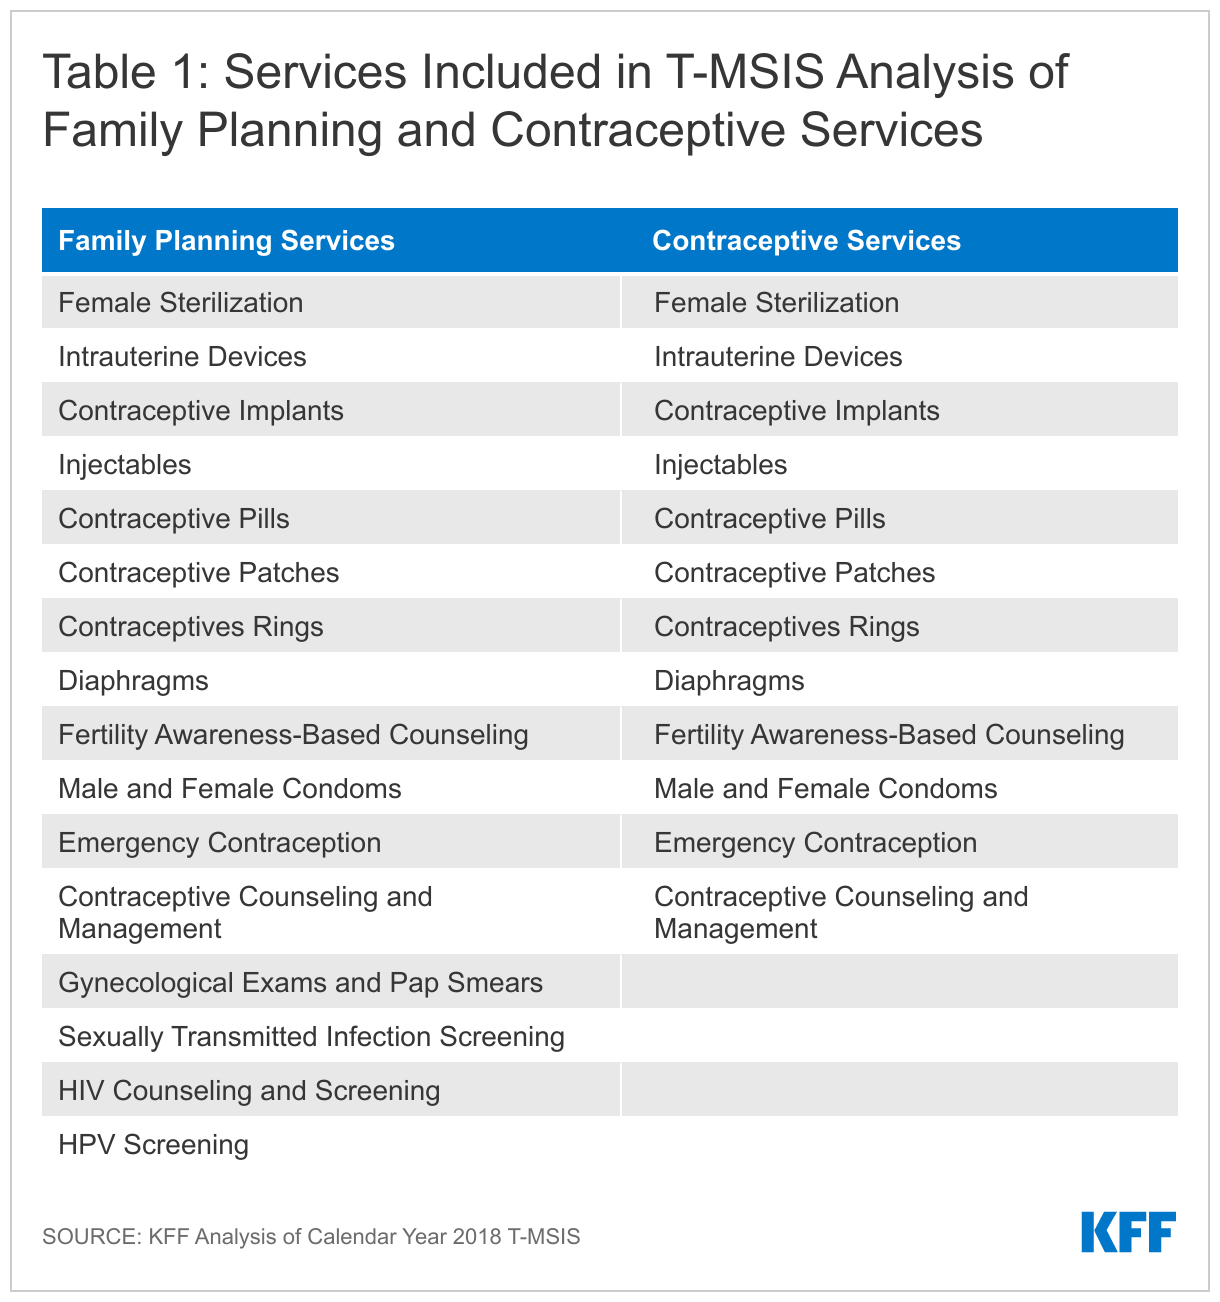
Among females ages 15-49 continuously enrolled in Medicaid in 2018, we looked at family planning service provision and contraceptive service provision (Table 1). Contraceptive services for this analysis included drugs, devices, procedures, and counseling intended to prevent pregnancy. Family planning services were defined to include all contraceptive services as well as related services to prevent and screen for some sexually transmitted infections (STIs) and HIV, as well as gynecological exams and Pap smears.

Table 1: Services Included in T-MSIS Analysis of Family Planning and Contraceptive Services

By looking at service provision among those who were continuously enrolled in Medicaid, we minimize the impact of coverage churning, which can limit access to care.

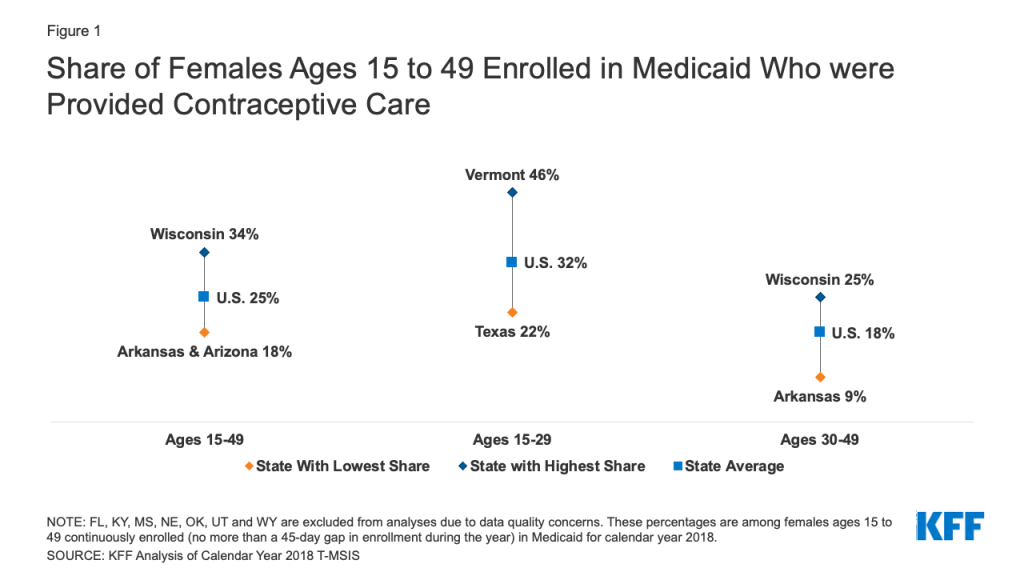
One in four (25%) female Medicaid enrollees of reproductive age (ages 15 to 49) obtained at least one contraceptive service in 2018.This share varied considerably, ranging from 18% in Arkansas and Arizona to 34% in Wisconsin (Figure 1). These percentages represent the share of females overall provided these services, which may include women who were pregnant during the year and not in need of contraceptive services.

Contraceptive provision was on average almost twice as high among females ages 15-29 (32%) than females ages 30-49 (18%). There was considerable variation in these rates by age across states with less than a quarter (22%) of females ages 15-29 in Texas receiving contraceptive services compared to nearly half of their counterparts in Vermont (46%). Among females ages 30-49, only 9% received contraceptive services in Arkansas compared to a quarter (25%) in Wisconsin.

Figure 1: Share of Females Ages 15 to 49 Enrolled in Medicaid Who were Provided Contraceptive Care

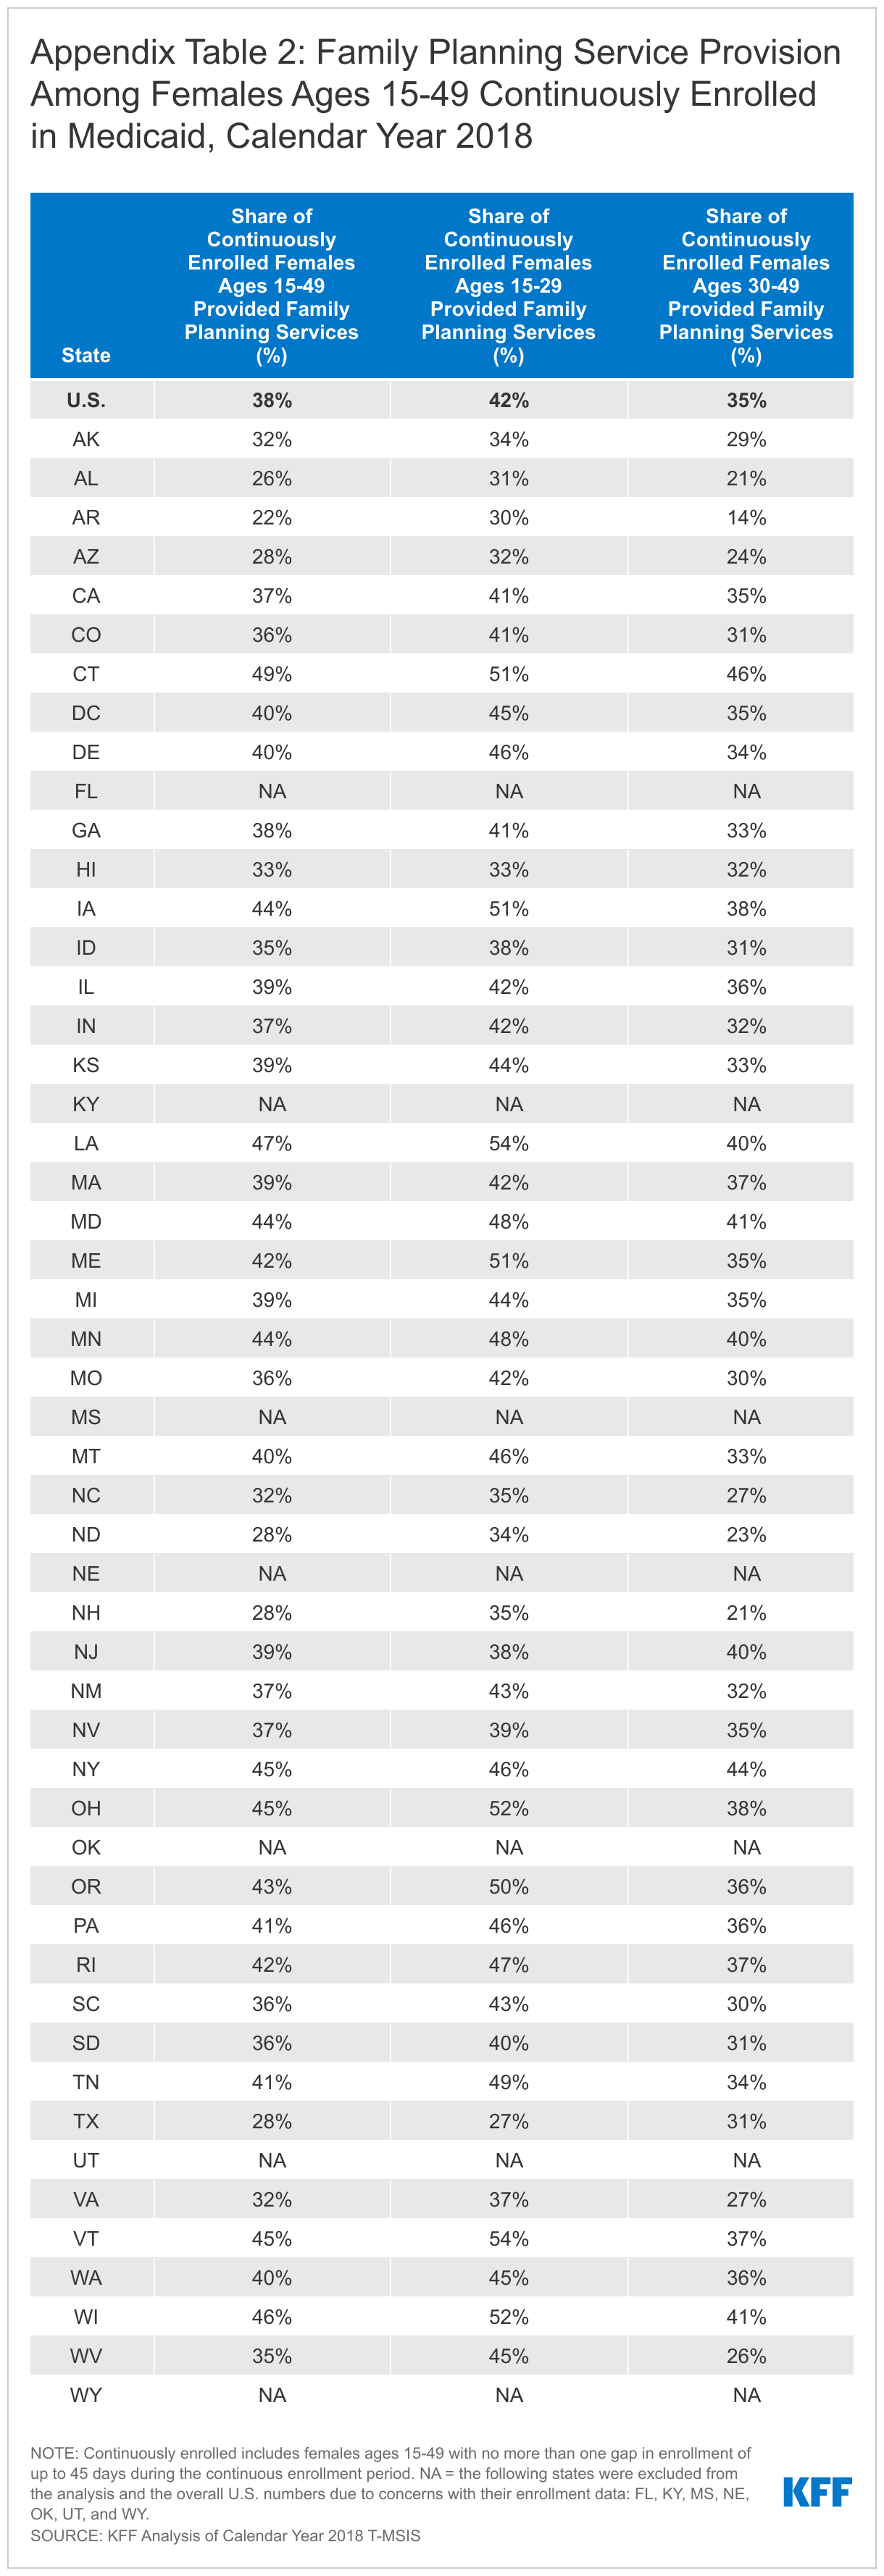
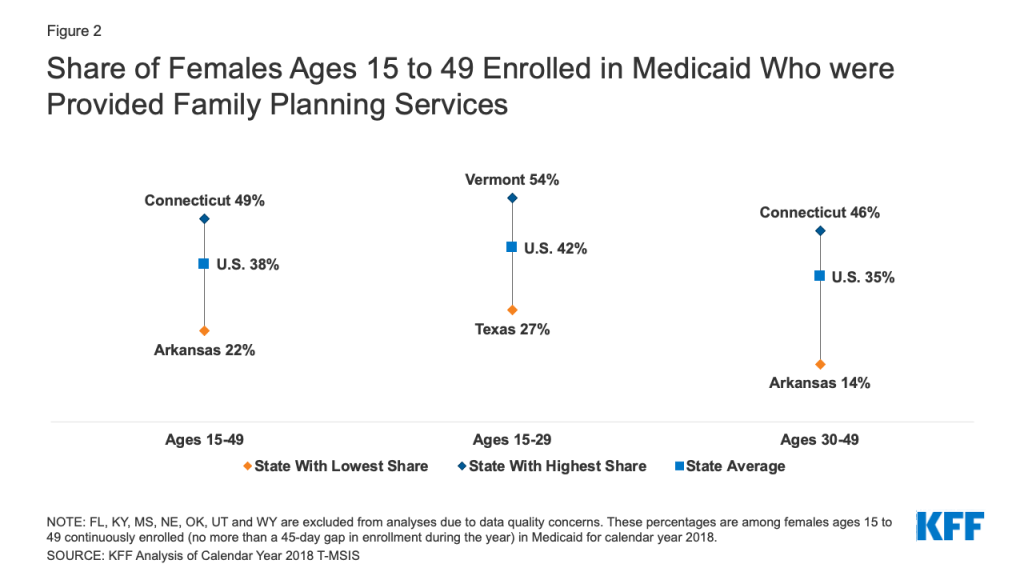
When looking more broadly at family planning services including screenings for sexually transmitted infections and cervical cancer in addition to contraceptive services, just under 4 in 10 females ages 15-49 (38%) were provided family planning services. This ranged from a low of 22% in Arkansas to a high of 49% in Connecticut (Figure 2). Younger females ages 15-29 were on average, 1.3 times more likely to receive family planning services compared to those ages 30-49 (42% vs. 35%). Among females ages 15-29, family planning service provision ranged from a low of 27% in Texas to a high of 54% in Vermont. The range was slightly wider among females ages 30-49 with 14% receiving family planning services in Arkansas compared to 46% in Connecticut.

Figure 2: Share of Females Ages 15 to 49 Enrolled in Medicaid Who were Provided Family Planning Services

Many factors can contribute to state level variation in provision of services, including eligibility levels, Medicaid utilization controls, access to clinicians, the availability of services, clinician practices, payment rates, beneficiaries’ needs and preferences, and more.

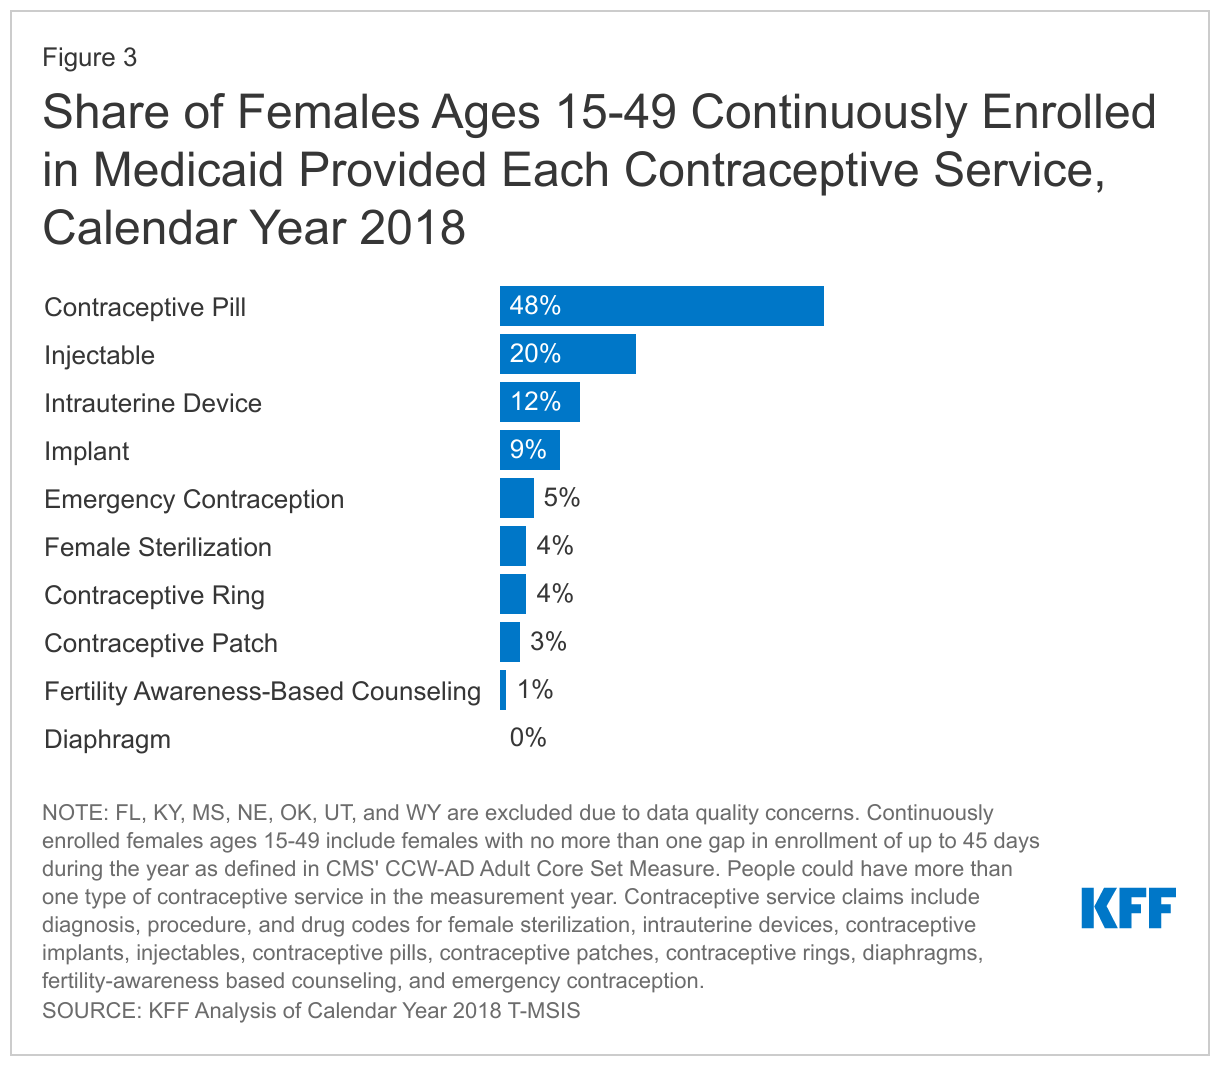
Nationally, the most commonly provided method of contraception to female Medicaid beneficiaries was oral contraceptives, which is also the most commonly used reversible contraceptive among females in the general population. Nearly half of women provided contraceptive services in Medicaid in 2018 obtained contraceptive pills (48%), followed by injectable contraception (20%), and then intrauterine devices (12%) (Figure 3). Approximately one in five (21%) females obtained a long-acting reversible contraceptive (LARC) in 2018, which includes IUDs and implants.

Among those continuously enrolled in Medicaid, only 4% of women had a diagnosis or procedure code for female sterilization in 2018. Since sterilization is a one-time procedure, women who were sterilized in earlier years would not show up in the current measurement year. Combined with IUDs and implants, one quarter of contraceptive users was provided a “most effective” method in 2018 (e.g., sterilization, contraceptive implants, intrauterine devices or systems (IUD/IUS)). Five percent of females was provided emergency contraceptive pills. Less than 5% of females were provided the other methods – patch, ring, diaphragm, or fertility awareness-based counseling.

For the following figures on contraceptive method provided, women could have more than one method within the year.

Share of Females Ages 15-49 Continuously Enrolled in Medicaid Provided Each Contraceptive Service, Calendar Year 2018

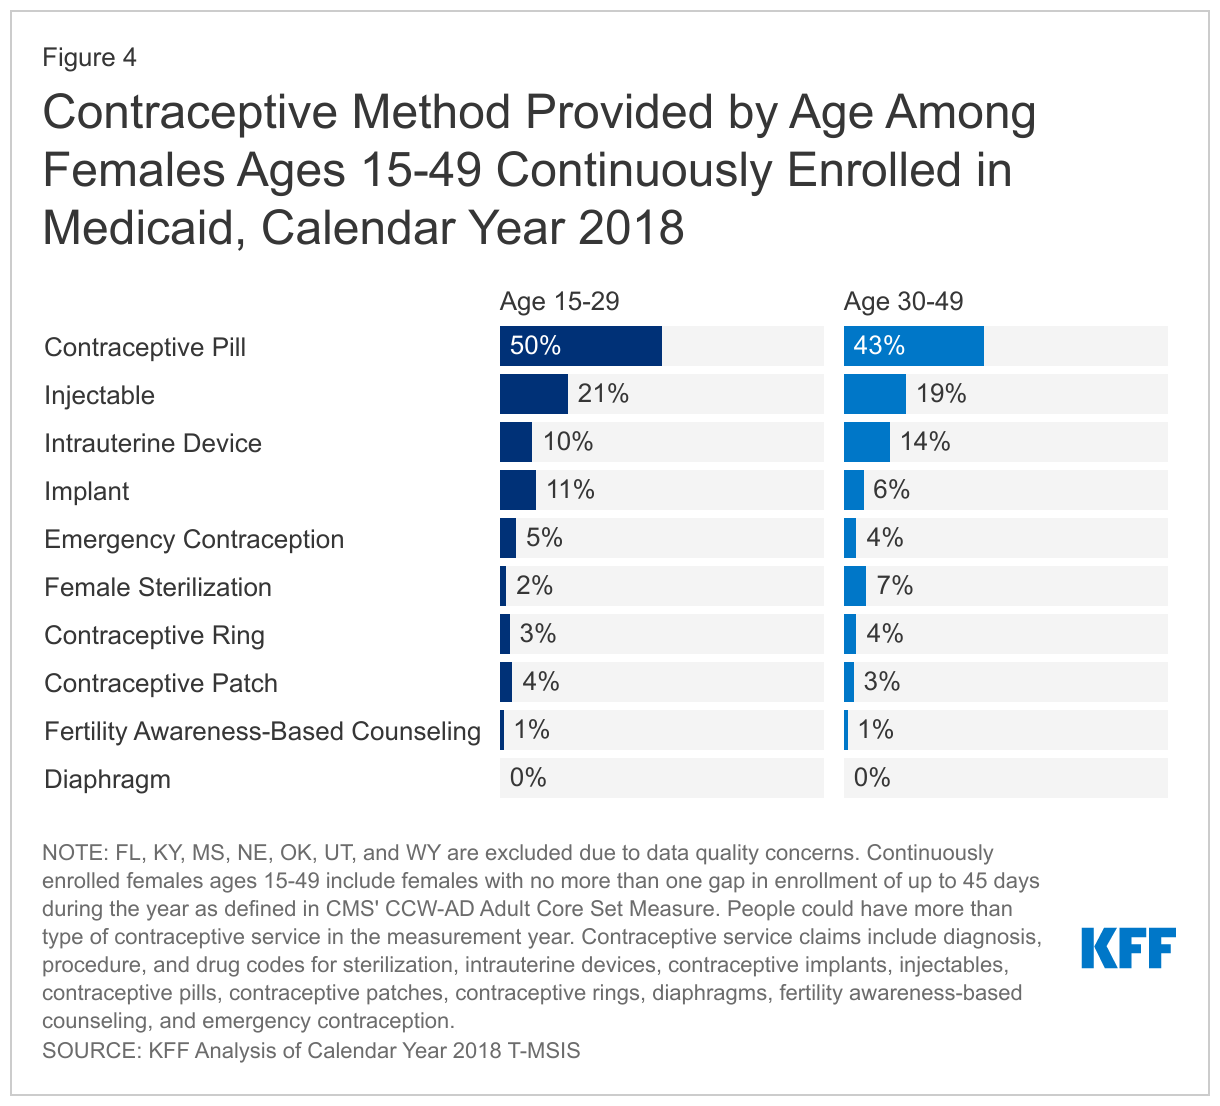
Contraceptive provision differs by age. Younger females in their teens and 20s had higher provision of oral contraceptives and lower use of sterilization than females in their 30s and 40s. Preferences regarding the type of contraceptive method often differs by a person’s age and the length of time they desire to prevent pregnancy. Not surprisingly, a larger share of females ages 30-49 received a sterilization procedure in the year, compared to females ages 15-29, who had higher use of reversible methods such as contraceptive implants, injectables, and oral contraceptive pills (Figure 4). Interestingly, about one in five females in each age group obtained a LARC (IUDs and implants) during the calendar year. The provision of contraceptive patches and rings was similarly low among both age groups. Less than 1% of females in each age group were provided a diaphragm. Similarly, a small share of females received fertility awareness-based counseling (1%) in each age group. Finally, 5% of females ages 15-29 and 4% of females ages 30-49 were provided a prescription for emergency contraception pills. Since emergency contraceptive pills can purchased over the counter without a prescription, some  women may have used the pills but this would not be reflected in this claims database. For Medicaid to cover the costs of the pills, however, enrollees need to have a prescription.

Contraceptive Method Provided by Age Among Females Ages 15-49 Continuously Enrolled in Medicaid, Calendar Year 2018

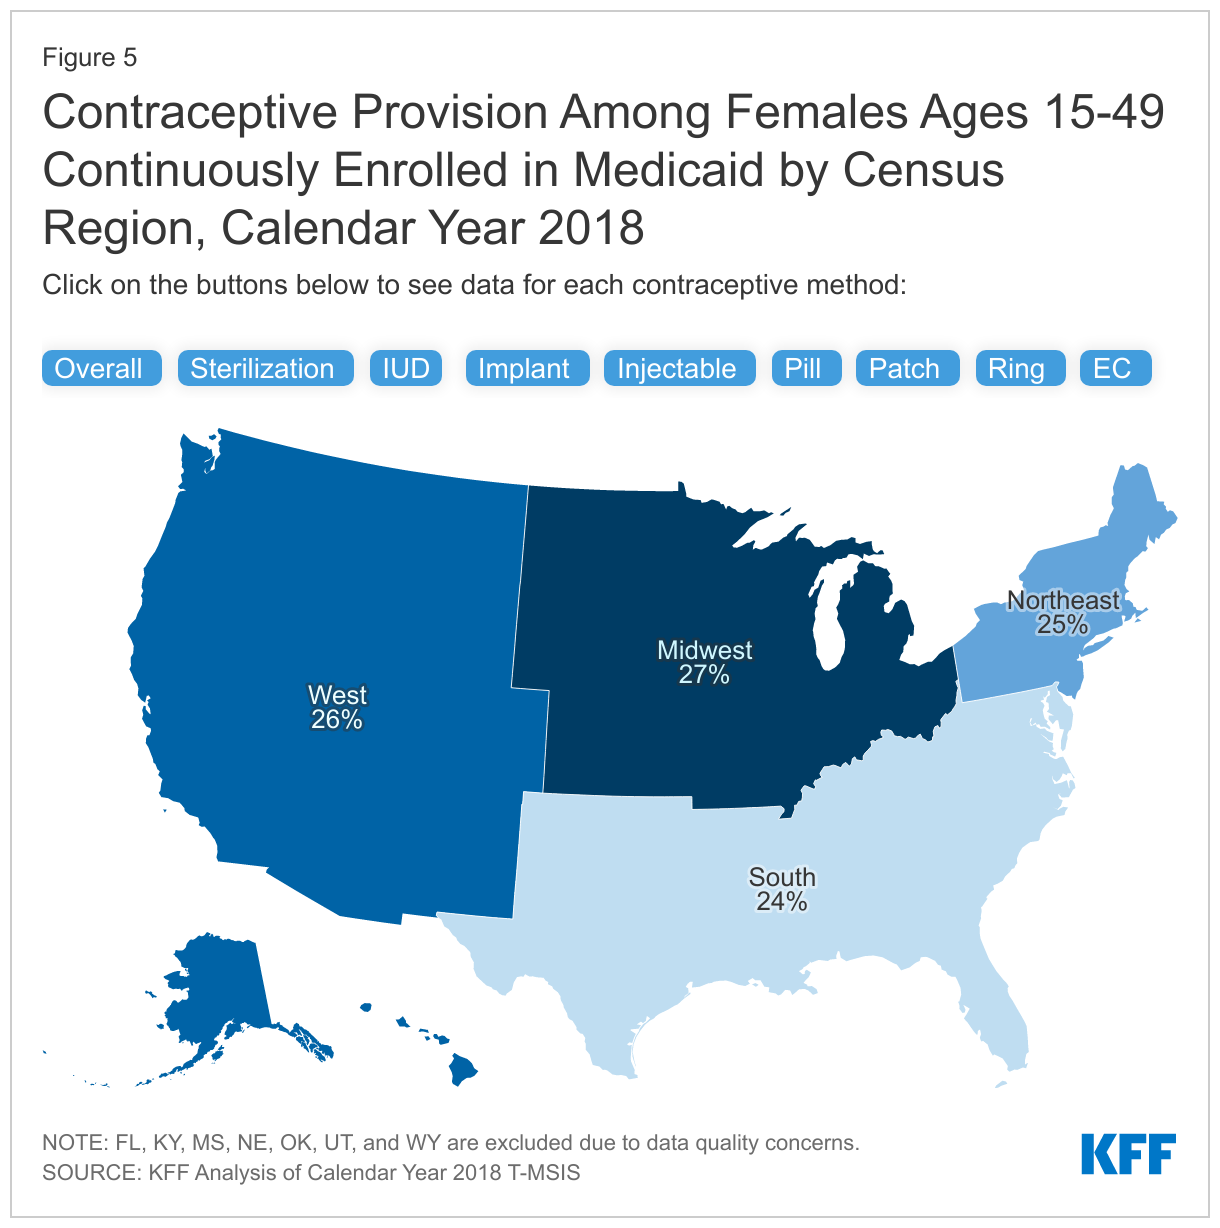
There are some notable regional differences in the provision of contraceptive methods, particularly for oral contraceptives, injectables, and emergency contraceptive pills. We compared differences in types of contraceptives that were provided in the four census regions: West, South, Midwest, and Northeast (Figure 5), excluding FL, KY, MS, NE, OK, UT, WY due to concerns about data quality. The share of women provided sterilization in 2018 was highest in the South (5%), but similar across regions (4% in Midwest, 3% in West, and 3% in Northeast). The share of women provided an intrauterine device was lowest in the South (9% compared to 11% in Midwest, 12% in Northeast, and 13% in West) and the share receiving a contraceptive implant was lowest in the Northeast (7% compared to 9% in Midwest, 9% in South, and 11% in West). The largest differences were in the shares provided injectable contraception, with the highest share being in the South (27%) compared to 15% in the West. The share of women provided contraceptive pills was lowest in the South (42%) and highest in the Northeast (52%). The share of women provided emergency contraception was lower in the South (1%) compared to the West (7%), Midwest (5%), and Northeast (6%). There were not substantial regional differences in the shares of women provided the contraceptive patch, contraceptive ring, diaphragm, and fertility awareness-based counseling.

Contraceptive Provision Among Females Ages 15-49 Continuously Enrolled in Medicaid by Census Region, Calendar Year 2018

Discussion

Given the central role of Medicaid in financing family planning services for low-income women, it is important to understand what family planning service and contraceptive service provision looks like across states. While these are important services for many women, not all women need or want to use contraception. Our overall finding that 25% of reproductive age women were provided a contraceptive service is consistent with rates recently published by CMS, where 25.3% of women ages 21 to 44 at risk of unintended pregnancy were provided a “most effective” or “moderately effective” method of contraception. It is unclear whether the remaining women, who represent the majority of reproductive age women on Medicaid encounter access barriers or a lack of availability, or whether they feel they do not need or do not wish to use contraceptive services, or some other reason.  Some of these women may be pregnant or trying to get pregnant and do not need contraception.  Others may be using over-the-counter methods such as condoms or spermicide.

It is notable that there are considerable differences in provision of family planning and contraceptive services and supplies by age. A higher share of women in their teens and 20’s received contraceptive and family planning services compared to women over the age of the 30. This could partially be explained by higher shares of women over age 30 having had sterilization procedures in previous years as well as greater reliance on longer acting contraceptive methods, like IUDs which can last up to 10 years depending on the type of IUD. Regardless of age, contraceptive pills remain the most frequently provided contraceptive method within Medicaid overall, followed by injectable contraception (e.g., Depo-Provera).

Another notable finding is the substantial state variation in the share of women provided contraceptive and family planning services. Similar to our findings, an analysis of contraceptive utilization in 37 states using the 2019 Behavioral Risk Factor Surveillance System (BRFSS) among women with different insurance types found lower contraceptive use among women aged 18-49 in the South compared to the West. Some of the states that we found to have the highest and lowest shares of contraceptive use among women with Medicaid were also found to have higher and lower shares of contraceptive use in the BRFSS data, including higher shares in Wisconsin and lower shares in Arizona and Arkansas.

These differences by state could reflect the variation in the adoption of policies and programs to increase access to contraception, including those from public health practitioners, clinicians, and state and federal policymakers. Many initiatives to expand contraceptive access have focused on expanding access to postpartum LARCs. Notably, many states revised their payment policies to make it easier for providers to get reimbursed for immediate postpartum LARCs outside of the global maternity care fee. For example, Louisiana and South Carolina, states that implemented a separate payment structure for postpartum LARC insertions were found to have the highest rates of effective contraceptive provision 60 days postpartum among Medicaid enrollees in 2016. These states also had considerably higher contraceptive provision than their neighboring states in our analysis.

Furthermore, state adoption of utilization control policies can also shape access and availability of contraceptive methods. These policies include prior authorization for certain methods like emergency contraception, step therapy that require beneficiaries to use contraceptives off a Preferred Drug List before being able to use another method of choice and limiting the amount of supply a beneficiary can receive at one time, such as a 1-month or 3-month supply rather than the recommended 12-month supply.

Due to the personal nature of reproductive health care choices including contraceptive use and the history of reproductive coercion in many communities in the US, there is no agreed upon benchmark for contraceptive provision and method mix. However, information about the provision of services and how use varies by state and populations provides policymakers and clinicians important insights about the differences across states and sets a baseline for the study of future policy changes and initiatives.

Methods

This analysis is based on claims data from the Transformed Medicaid Statistical Information System (T-MSIS) Research Identifiable Files (RIF). Data for 2018 were from the final version (Release 1) of these files. This analysis was limited to females ages 15-49 continuously enrolled in Medicaid with no more than a 45-day gap in enrollment during the year. This definition of continuous enrollment was chosen to align with CMS’ Adult and Child Set Core Measures, specifically, those around contraceptive provision, and to give people sufficient time in Medicaid to access contraceptive and family planning services.

We excluded the following states from our analysis due to concerns with the quality of their enrollment data: Florida, Kentucky, Mississippi, Nebraska, Oklahoma, Utah, and Wyoming. We relied on data quality assessments from DQ Atlas to exclude states based on data quality ratings of the following indicators: (1) Enrollment Benchmarking: Medium concern for Total Medicaid and CHIP Enrollment (Mississippi, Nebraska, and Kentucky), (2) Enrollment Patterns Over Time: Number of Enrollment Spans - % of Beneficiaries with Only One Enrollment Span in Year ≥ 99.8 (Florida, Wyoming), (3) Enrollment Patterns Over Time: Number of Enrollment Spans - % Beneficiaries with 3 or More Enrollment Spans in Year ≥ 5% (Oklahoma). Additionally, we excluded Utah because of a substantially lower rate of continuous enrollment, which may be due to an administrative error where a large number of enrollees were disenrolled from April 31, 2018 to June 1, 2018. The analysis was limited to 2018 claims, so enrollees that may have been enrolled in the previous or subsequent year but had more than one 45-day gap in enrollment in 2018 were truncated and excluded from the continuously enrolled population for the 2018 calendar year. Data reflect enrollment in any eligibility pathway as well as any payment structure (FFS, managed care, etc.)

Contraceptive claims were captured from the 2018 T-MSIS header and line files for “other services” claims and prescription drug claims, as well as the header files for inpatient claims for provision of female sterilization, intrauterine devices (IUDs), contraceptive implants, injectables, contraceptive pills, contraceptive patches, contraceptive rings, diaphragms, male and female condoms, emergency contraception, counseling for fertility-awareness based methods, contraceptive counseling, and contraceptive management and surveillance of other contraceptives. Family planning services included any contraceptive claims, as well as claims for sexually transmitted infection (STI) screening, gynecological exams and pap smears, Human Immunodeficiency Virus (HIV) counseling and screening, and Human Papillomavirus (HPV) screening. According to the DQATLAS, the following states had unusable data for one or more files: Rhode Island (inpatient claims volume), Tennessee (inpatient diagnosis codes), Maryland (inpatient procedure codes), and Utah (other services professional procedure codes). Since the other data, particularly for the “other services” files and RX files where the majority of family planning and contraceptive service claims are found, we did not exclude any states based on these ratings.

The share of beneficiaries provided contraceptive services included any female ages 15-49 continuously enrolled in Medicaid with at least one contraceptive service claim in 2018. The share provided family planning services included any female ages 15-49 continuously enrolled in Medicaid with at least one claim for contraceptive services, sexually transmitted infection (STI) screening, gynecological exams and pap smears, HIV counseling and screening, and HPV screening. A list of diagnosis, procedure, and drug codes that were used for this analysis are available upon request.

Appendix Tables

Appendix Table 1: Contraceptive Service Provision Among Females Ages 15-49 Continuously Enrolled in Medicaid, Calendar Year 2018
Appendix Table 2. Family Planning Service Provision Among Females Ages 15-49 Continuously Enrolled in Medicaid, Calendar Year 2018
News Release

Analysis Finds The Share of Nursing Home Staff Who Have Been Vaccinated Against COVID-19 Varies Substantially by State

Vaccination Mandate Has Been the Focus of Litigation By Some States

Published: Feb 17, 2022

The share of nursing home staffers who have been fully vaccinated against COVID-19 varies considerably by state, from 70 percent in Ohio to 99 percent in Maine, Rhode Island, New York and Massachusetts, a new KFF analysis finds. The national average is 84 percent.

The analysis of federal nursing home data for the week ending Jan. 30 comes as providers strive to comply with a federal mandate that health care workers whose employers participate in Medicare or Medicaid be vaccinated against the novel coronavirus. Although some states have sued to challenge this rule, the Supreme Court recently let it go into effect.

Facilities in different states have different deadlines to comply with the mandate, in part due to ongoing state litigation challenging the federal rule. Deadlines for workers to have received their first dose ranged from January 27 to February 21, depending on the state. States with earlier deadlines generally reported higher completed staff vaccination rates than states with later deadlines.

Facilities won’t face enforcement action from the Centers for Medicare and Medicaid Services if more than 80 percent of their staff receive their first dose by their deadline, and they have a plan to achieve a 100 percent single-dose staff vaccination rate within 60 days.

The analysis is based on 10,627 nursing homes reporting complete vaccination data, or about 70 percent of all nursing homes nationally.

People With HIV in Non-Medicaid Expansion States: Who Could Gain Coverage Eligibility Through Build Back Better or Future Expansion?

Published: Feb 15, 2022

People with HIV living in the 12 states that have not adopted the Medicaid expansion face limited access to health coverage. In 2018, across sampled states, 20% of people with HIV living in non-expansion states were uninsured compared to 6% in expansion states, and those in expansion states were more likely to have Medicaid coverage (46% v 30%). Moreover, some adults with incomes below 100% of the federal poverty level (FPL) in non-expansion states fall into the “coverage gap”, where they do not qualify for Medicaid through an existing pathway and are not eligible for marketplace subsidies.

Figure 1: Insurance Coverage Among Adults with HIV by State Medicaid Expansion Status, 2018

One provision in the Build Back Better Act (BBBA), as passed by the House of Representatives, aims to temporarily close the coverage gap, although its prospects are uncertain as negotiations continue in the Senate. It would temporarily create new coverage opportunities, including by providing a low-cost (with zero premiums) marketplace alternative for those with incomes below 100% FPL who are not otherwise eligible for Medicaid. The BBBA includes a provision to encourage states that have already expanded to maintain that status. In addition, the BBBA would also enhance cost-sharing subsidies provided under the American Rescue Plan Act (ARPA) to those with incomes between 100-138% FPL.

In this analysis, we explore the implications of the BBBA’s current coverage provisions for people with HIV in select non-expansion states. We estimate the size of the population that could gain eligibility as well as their socio-demographic characteristics and examine their affordability barriers, compared to people with HIV overall. We also discuss the implications of such policy changes for the Ryan White HIV/AIDS Program, the nation’s HIV safety-net program. To do so, we used data from the Centers for Disease Control’s and Prevention’s (CDC) Medical Monitoring Project (MMP), a surveillance system which produces national and state-level representative estimates of behavioral and clinical characteristics of adults with diagnosed HIV in the United States. The MMP sample includes five of the twelve non-expansion states –  Florida, Georgia, Mississippi, North Carolina, and Texas – which together account for about 84% of people living with diagnosed HIV in non-expansion states.

We defined the group who could benefit from key BBBA coverage provisions as non-elderly adults with HIV with incomes below 139% FPL who were either uninsured or had health coverage other than from Medicaid or Medicare. Notably, this is the same population that could gain eligibility for coverage if their states expanded their Medicaid programs. (See Methodology for detail.)

Findings

Overall, we find that an estimated 55,132 (or 23%) of non-elderly individuals with HIV in sampled non-expansion states could gain eligibility for new or enhanced subsidies under the BBBA. This is also the population that could gain Medicaid eligibility, if these states expanded their programs. The share ranges by state, from an estimated 18% in both North Carolina and Georgia to 28% in Texas. (See Table 1.)

Table 1: Estimated Percent and Number of People with HIV Who Could Gain Coverage Eligibility, by State
StatePercentageEstimated Number
Florida22%20,561
Georgia18%8,556
Mississippi22%1,783
North Carolina18%4,328
Texas28%19,905
Overall23%55,132

How this 23% could be impacted by BBBA is as follows. As noted, the BBBA would provide those with incomes below 100% FPL, including uninsured people in the coverage gap, with marketplace subsidies and cost-sharing assistance, making private insurance premiums free and cost-sharing minimal. We estimate that approximately 47,078 (or 16%) of non-elderly adults with HIV in the sampled non-expansion states would become eligible for this provision. BBBA would also enhance subsidies for those 100-138% FPL and we estimate beyond this 16%, an additional 7% of non-elderly people with HIV in non-expansion states would be eligible for these enhanced subsidies. Notably, BBBA provisions are temporary, and set to expire in 2025 unless renewed. Under a scenario where all sampled states expanded their Medicaid program, the full 23% of non-elderly people with HIV could gain Medicaid eligibility.

Characteristics of people with HIV who could gain eligibility for new or enhanced coverage

Non-elderly people with HIV in these states who could gain new coverage eligibility, including enhanced subsidies under the BBBA or through Medicaid expansion, are more likely to be under 50 years old, people of color, and uninsured compared to non-elderly people with HIV overall (Table 2):

  • 66% are under 50 years old (compared to 52% of all non-elderly people with HIV)
  • 86% are non-White, including 55% who are Black/African American (compared to 72% and 42% of all non-elderly people with HIV)
  • 59% are uninsured (compared to 26% of all people with HIV), 26% have any private insurance, of which 32% have marketplace coverage (compared to 61% and 18%, respectively, of all non-elderly people with HIV) and 15% have other coverage (similar to the 13% among all non-elderly people with HIV)
Table 2: Characteristics of Non-elderly People with HIV Who Could Gain New or Enhanced Coverage Eligibility and Characteristics of All Non-elderly People with HIV
CharacteristicPotentially Eligible People with HIV in Non-expansion StatesAll Non-elderly People with HIV
Age: Under 5066%52%
Race/ethnicity: BIPOC86%72%
Insurance Coverage: Uninsured59%26%
Insurance Coverage: Any private

Of which is Marketplace

26%

32%

61%

18%

Insurance Coverage: Other coverage apart from Medicare15%13%

Addressing Affordability Barriers

Potentially eligible people with HIV in sampled non-expansion states are more likely to face certain affordability barriers compared to people with HIV overall. Approximately one in three (31%) of those in this potentially eligible group report being unable to pay health care bills during the past 12 months and 30% say they currently have unpaid medical bills. By comparison, 20% of non-elderly adults with HIV overall report being unable to pay health care bills during the past 12 months and 23% report they currently have unpaid medical bills. Smaller but comparable shares of those potentially eligible and people with HIV overall say they have taken the following measures to save money on medication: Skipped doses (8% v 6%), took less medicine than prescribed (7% v 6%), delayed filling a prescription (11% v 8%), asked a doctor for lower cost medication (10% for both), or used alternative therapies (6% v 4%). (Table 3.)

Table 3: Health Care Affordability Challenges Among People with HIV Who Could Gain New or Enhanced Coverage Eligibility and Characteristics of All Non-elderly People with HIV
CharacteristicPotentially Eligible People with HIV in Non-expansion StatesAll Non-elderly People with HIV
Inability to pay healthcare bills31%20%
Currently have unpaid medical bills30%23%
Skipped doses to save money8%6%
Took less medicine to save money7%6%
Delayed filling prescription to save money11%8%
Asked doctor for lower cost medication to save money10%10%
Used alternative therapies to save money6%4%

The Ryan White HIV/AIDS Program

The Ryan White HIV/AIDS Program plays a key role in the lives of about half of all people with HIV in the U.S., and an especially important role in providing HIV care and treatment for those in non-expansion states in the coverage gap. We find that seventy percent (70%) of those who could gain new coverage opportunities under BBB or Medicaid expansion currently receive support from Ryan White, compared to 46% of non-elderly people with HIV overall, with Ryan White supporting a range of outpatient HIV services including medications although it cannot pay for non-HIV care. As such, if this group gains coverage, it could mean that state programs could shift limited Ryan White resources to expand support services that were not possible to finance in the past. In fact, people with HIV with all insurance coverage types and Ryan White experience higher rates of sustained viral suppression (an indicator for health and preventing transmission) than those with only insurance coverage and no support from the program, in large part due to these supportive, wrap around services.

Discussion

We estimate that if the BBBA, as passed by the House, was enacted almost a quarter (23%) of non-elderly people with HIV in select non-expansion states could become eligible for these new coverage opportunities. This is the same share estimated to become eligible through Medicaid expansion which could be a potentially more stable coverage pathway given the currently time limited nature of the BBBA. Given high rates of uninsurance among people with HIV in non-expansion states and the prevalence of problems with medical bills, coverage gains could improve health access and affordability. And since people with HIV in non-expansion states are disproportionally people of color, new coverage opportunities could also help to address health disparities at the intersection of HIV and race/ethnicity. Coverage expansions through either pathway (the BBBA or Medicaid expansion) may also relieve the Ryan White Program from financing HIV care and treatment, allowing it to provide more robust support services, which could lead to improved care outcomes for people with HIV. In addition, a shift to coverage could mean that those previously in without affordable insurance could access care for non-HIV care needs that in the past would have not been addressed through the Ryan White Program.

Acknowledgments

The authors wish to thank Dr. Sharoda Dasgupta, Dr. Linda Beer, Tamara Carree, and Stacy Crim of the Centers for Disease Control and Prevention (CDC), who were instrumental in this work in providing access to data, guidance, and conducting statistical analysis.

This work was supported in part by the Elton John AIDS Foundation. We value our funders. KFF maintains full editorial control over all of its policy analysis, polling, and journalism activities.

Methodology

Data on people with HIV are based on 2018 and 2019 data cycles from the Medical Monitoring Project (MMP), a Centers for Disease Control and Prevention (CDC) surveillance system which produces national and state-level representative estimates of behavioral and clinical characteristics of adults with diagnosed HIV in the United States.

MMP employs a two-stage, complex sampling design. First, jurisdictions are selected from all U.S. states, the District of Columbia, and Puerto Rico using a probability proportional to size sampling strategy based on AIDS prevalence at the end of 2002, such that areas with higher prevalence had a higher probability of selection. Next, adults (aged 18 years and older) with diagnosed HIV were sampled from selected jurisdictions from the National HIV Surveillance System (NHSS), a census of US persons with diagnosed HIV. During 2018 and 2019, data come from: California (including the separately funded jurisdictions of Los Angeles County and San Francisco), Delaware, Florida, Georgia, Illinois (including the separately funded jurisdiction of Chicago), Indiana, Michigan, Mississippi, New Jersey, New York (including the separately funded jurisdiction of New York City), North Carolina, Oregon, Pennsylvania (including the separately funded jurisdiction of Philadelphia), Puerto Rico, Texas (including the separately funded jurisdiction of Houston), Virginia, and Washington.

Data used in this analysis were collected via telephone or face-to-face interviews and medical record abstractions during the following periods:

  • 2018 data was collected between June 1, 2018 – May 31, 2019
  • 2019 data was collected between June 1, 2019–May 31, 2020
  • The response rate was 100% at the first stage, and was 45% for each of the 2 cycles included in this analysis. Data were weighted based on known probabilities of selection at state or territory and patient levels. In addition, data were weighted to adjust for non-response using predictors of person-level response, and post-stratified to NHSS population totals by age, race/ethnicity, and sex at birth. This analysis includes information on 7,037 non-elderly adults (those under 65 years of age) with HIV. Data presented on non-expansion states are representative of only those states sampled.

Analysis

For all non-elderly respondents in MMP, we examined self-reported insurance coverage. Response options included insurance programs (Medicaid, Medicare, private insurance – employer and marketplace -, Ryan White HIV/AIDS Program – Ryan White or the AIDS Drug Assistance Program-, Veteran’s Administration, Tricare or CHAMPUS coverage, other public insurance, and other unspecified insurance). “Other specify” responses were recoded to reflect the most accurate coverage type when possible.

We estimated weighted percentages of individuals with the following types of health care coverage: no coverage (uninsured), private insurance (with breakouts for employer coverage and marketplace coverage), Medicaid, Medicare, and other. Because respondents in MMP may indicate more than one type of coverage, we relied on a hierarchy to group people into mutually exclusive coverage categories. After removing people with any Medicaid or Medicare coverage, we categorized people into coverage according to the following hierarchy:

  • Private coverage overall (with non-mutually exclusive breakouts for employer coverage and marketplace coverage)
  • Other public coverage, including Tricare/CHAMPUS, Veteran’s Administration, or city/county coverage
  • Uninsured

In most cases, this hierarchy classified individuals according to the coverage source that served as their primary payer. People who did not report any of the sources of insurance coverage were classified as uninsured.

Medicaid expansion status was identified based on KFF data. While Virginia was a non-expansion state during half of the 2018 cycle, it expanded its program and coverage became effective January 2019. Virginia was coded here as an expansion state given the forward-looking nature of this analysis.

People with HIV in non-expansion states were identified as potentially eligible for BBB assistance or Medicaid based on their state of residence, if they were under the age of 65, had incomes between 0-138% FPL, and had insurance other than Medicare or Medicaid or were uninsured. Build Back Better eligibility was also assessed to capture the estimated number and share in the coverage using the same criteria but with the poverty threshold being 0-99% FPL.

Limitations

Although MMP is based on a probability sample that allows for reporting of nationally representative estimates of characteristics among people with HIV, people were not sampled with respect to Medicaid expansion status of their state of residence. Therefore, the Medicaid expansion and non-expansion coverage data presented here are representative only of the subset of states sampled that fell into each group. Insurance coverage data is self-reported by respondents and not verified. Receipt of Ryan White support is also self-reported. By relying on a hierarchy to group individuals into coverage categories, it is possible individuals were grouped into a coverage category that was not their dominant payer over the course of a year. We were unable to identify immigrants who would be ineligible for Medicaid based on immigration status but previous work suggests this percentage is likely small and would not have substantially impacted estimates. In addition, some people who are currently uninsured may already be eligible for Medicaid or other coverage. However, we expect that share to be low for several reasons. First, even prior to Medicaid expansion opportunities becoming available, the disability pathway was the most common way people with HIV became eligible for Medicaid coverage. All five states sampled use autoenrollment for people with SSI therefore limiting those eligible but not enrolled in the program. Second, Ryan White acts of payer of last resort and grantees are required to regularly assess clients for eligibility for health coverage. Given that 82% of uninsured people receive Ryan White support and the majority of the potentially eligible group identified here are uninsured, the program would likely have already identified potential coverage opportunities and assisted with enrollment, including through Medicaid, where possible. It is also important to note that respondents may not be aware of all the services they receive that are paid for by the Ryan White HIV/AIDS Program (the program provides funding directly to service organizations in many cases) and therefore, the estimates of the number of individuals who receive Ryan White HIV/AIDS Program services is likely an underestimate.

Diversity of Under-5 Age Group Varies Across States

Authors: Jason Millman, Jennifer Kates, and Robin Rudowitz
Published: Feb 10, 2022

Prioritizing equity will be a key component of the anticipated rollout of Pfizer’s COVID-19 vaccine to children under 5 years old, which could be authorized as early as next week. Of the 19 million children under 5 in the United States, half are children of color, making this group more diverse than the U.S. population overall (40%).

There is also significant variation across the country. In five states and Washington, DC, children of color account for at least two-thirds of all children in this age group: Hawaii, New Mexico, California, Texas, and Nevada. In eight other states, the share is above half: Arizona, Florida, Maryland, Georgia, New Jersey, New York, Delaware, and Mississippi.

While Black and Hispanic people during the pandemic have been less likely than their White counterparts to have received a COVID-19 vaccine, racial disparities in vaccination rates have narrowed over time and have closed for Hispanic people. Our recent brief on the upcoming vaccination roll-out to young children discusses the importance of addressing potential access barriers and enlisting trusted community messengers to mitigate similar disparities in vaccination rates among this group.

Outpatient telehealth use soared early in the COVID-19 pandemic but has since receded

Authors: Justin Lo, Matthew Rae, Krutika Amin, and Cynthia Cox
Published: Feb 10, 2022

Telehealth use skyrocketed during the early months of the pandemic. While it has since decreased somewhat from that high, it still represents a much more substantial share of health care than before COVID, this KFF-Epic Research analysis finds.

From March through August 2021, 8% of all outpatient visits were conducted via telehealth– down from 13% in the first six months of the pandemic, but well above pre-pandemic levels, when telehealth accounted for a negligible share of outpatient visits.

The report also looks at telehealth use by chronic condition and by gender and summarizes potential implications for expanded telehealth use for access, costs and quality of care, as well as the regulatory environment likely to affect telehealth in the future.

The analysis can be found on the Peterson-KFF Health System Tracker, an information hub dedicated to monitoring and assessing the performance of the U.S. health system.

News Release

Telehealth Accounted for 8% of Outpatient Visits More Than a Year into COVID-19 Pandemic, Suggesting a More Permanent Shift in How Patients Receive Care

Published: Feb 10, 2022

Telehealth use skyrocketed during the early months of the pandemic. While it has since decreased somewhat from that high, it still represents a much more substantial share of health care than before COVID, a new KFF-Epic Research analysis finds.

From March through August 2021, 8% of all outpatient visits were conducted via telehealth – down from 13% in the first six months of the pandemic, but well above pre-pandemic levels, when telehealth accounted for a negligible share of outpatient visits (rounding to 0%).

The analysis examines data from Cosmos, Epic’s HIPAA-defined limited data set of more than 126 million patients from hospitals and clinics across the country. Other findings include:

  • Adults ages 65 and older relied on telehealth for a smaller share (5%) of outpatient visits between March and August 2021 than younger adults (8%) and children (11%).
  • Patients in rural and urban areas used telehealth at similar rates during the six-month period (10% and 8%, respectively).

The report also looks at telehealth use by chronic condition and by gender and summarizes potential implications for expanded telehealth use for access, costs and quality of care, as well as the regulatory environment likely to affect telehealth in the future.

The report is available through the KFF-Peterson Health System Tracker, an online information hub that monitors and assesses the performance of the U.S. health system.

Medicaid Financing and the U.S. Territories: Implications of The Build Back Better Act

Authors: Lina Stolyar and Robin Rudowitz
Published: Feb 9, 2022

The U.S territories – American Samoa, the Commonwealth of the Northern Mariana Islands (CNMI), Guam, Puerto Rico, and the U.S. Virgin Islands (USVI) – have faced an array of longstanding fiscal and health challenges that were exacerbated by recent natural disasters and the COVID-19 pandemic. Over time, Congress has provided additional federal funding often to address emergencies and additional financing needs beyond the Medicaid allotments set in law. Recent funding increases were set to expire at the end of FY 2021, but administrative action helped to avoid a sharp decline in federal Medicaid financing at the end of FY 2021. The Build Back Better Act (BBBA) includes a permanent statutory increase to the territories’ Medicaid allotments and match rates. This policy watch examines how Medicaid funding for the territories works, the current allotments, and how BBBA would change Medicaid funding for the territories going forward. While a version of BBBA has passed the house, its fate in the Senate remains uncertain.

Unlike in the 50 states and D.C., annual federal funding for Medicaid in the U.S. territories is subject to a statutory cap and fixed matching rate. Both the capped federal allotment (known as the Section 1108 allotment) and the territories’ federal matching rate (known as the federal medical assistance percentage, or FMAP) are fixed in statute. This funding arrangement is unlike federal Medicaid funding for states where federal dollars are uncapped and the FMAP is adjusted annually based on a state’s relative per capita income. Once a territory exhausts its capped federal funds, it no longer receives federal financial support for its Medicaid program during that fiscal year.

Over time, Congress has provided increases in federal funds for the territories broadly and in response to specific emergency events. Most recently, the Further Consolidated Appropriations Act of 2020 and the Families First Coronavirus Response Act (FFCRA) significantly increased the allotments for each of the territories for FY 2020 and FY 2021 (seven to nine times the statutory levels) and also raised the FMAP rates from the statutory level of 55% to 76% for Puerto Rico and 83% for the other territories. These statutory changes to the allotments and the match rate expired at the end of September. However, like other states, the territories are also eligible to receive a 6.2 percentage point increase to the statutory Medicaid match rate through the end of the quarter in which the public health emergency (PHE) expires if certain maintenance of eligibility requirements are met.

At the end of September 2021, CMS calculated FY 2022 allotments for the territories based on allotments for FY 2021 (except for Puerto Rico where calculations were based on allotments for FY 2020). These calculations helped to avoid a fiscal cliff in federal Medicaid funding for the territories that could have resulted in significant reductions to eligibility levels and benefits. These calculations represent increases of around 3% for all territories compared to their FY 2021 allotment except for Puerto Rico, which would see a decrease of around 2% from FY 2021 (Figure 1). In November 2021, the GAO released a non-binding legal opinion that CMS did not have the authority to adjust the base for the FY 2022 federal allotment for Puerto Rico based on the FY 2020 allotments, but President Biden recently stated that Puerto Rico will receive $2.9 billion in Medicaid funding. CMS noted the calculations related to the allotments would not affect the FMAP rates that would return to the statutory 55% (with an additional 6.2 percentage points available under the public health emergency) on October 1, 2021. However, a prior continuing resolution maintained FMAP rates of 76% for Puerto Rico and 83% for the rest of the U.S. territories through December 3, 2021. The most recent continuing resolution passed by the House would extend these FMAP rates for all territories (except Puerto Rico) through March 11, 2022. Puerto Rico’s current FMAP rate is 55%.

The Build Back Better Act (BBBA) proposed permanent increases in federal allotments and matching rates for the U.S. territories. The BBBA that passed the House and the draft released by the Senate Finance Committee both include provisions to increase the capped federal allotment and fixed matching rates for the U.S. territories (Figure 1). Compared to their FY 2021 allotments these proposed allotments represent modest increases of 5 – 8% for American Samoa, USVI, and Guam and more significant increases of 17% and 20% for CNMI and Puerto Rico, respectively. Additionally, FMAP rates would increase to 83% for all territories except Puerto Rico. Puerto Rico would receive an FMAP rate of 76% in FY 2022 and a rate of 83% in subsequent years dependent on Puerto Rico establishing a reimbursement floor for provider payments.

Federal Allotment and FMAP Rates for FY 2021 and 2022 for the U.S. Territories

The passage of the BBBA would provide Puerto Rico and the territories with more certainty in their federal funding and FMAP rates. The BBBA provides a permanent increase in the federal allotments and match rates for all territories. Without the BBBA, the FY 2022 allotment for Puerto Rico will remain slightly lower relative to FY 2021. In addition, the continuing resolution that would extend the enhanced match rate for the territories (except Puerto Rico) will expire on March 11, 2022. When this happens, all territories would see lower FMAP rates resulting in the territories needing to contribute more local funds to draw down federal funds.

How Do Prescription Drug Costs in the United States Compare to Other Countries?

Published: Feb 8, 2022

In 2019, the U.S. spent more than $1,000 per person on prescribed medicines, an amount higher than any peer nation. This chart collection examines what we know about prescription drug spending and use in the U.S. and comparably large and wealthy countries, using data from the Organization for Economic Cooperation and Development (OECD).

News Release

Medication Abortion Via Telehealth: What You Need to Know About State Regulations

Published: Feb 7, 2022

With the country waiting on the Supreme Court’s decision on Dobbs v. Jackson Women’s Health Organization, the case that could overturn Roe v. Wade, many are looking towards telehealth as an alternative to expand access to medication abortion. A new KFF issue brief explains the newly revised Food and Drug Administration (FDA) policy on medication abortion and the differential impact this could have on states by assessing the intersection of federal policy regarding dispensing medication abortion pills with state laws regulating the provision of abortion services.

Prior to the COVID-19 pandemic, dispensing medication abortion via telehealth was limited by a FDA requirement which allowed only certified clinicians to dispense mifepristone, the medication abortion pill, at a health care setting. After temporarily suspending the enforcement of the requirement during the pandemic public health emergency, the FDA permanently lifted the requirement on December 16, 2021.  While this change will likely expand access to medication abortion in some states, many states have other policies that will still restrict medication abortion via telehealth.

The new brief reviews state requirements and regulations that affect the availability of medication abortion via telehealth, including which states have directly banned telehealth abortions already. To learn more about the latest news on abortion, visit www.kff.org/womens-health-policy/.

HIV Policy Alignment with International Standards in PEPFAR Countries

Authors: Alicia Carbaugh, Anna Rouw, and Jennifer Kates
Published: Feb 7, 2022

Introduction

Key Findings

  • Adoption of evidence-based guidelines, laws, and policies is important for improving HIV-related health outcomes. While PEPFAR’s primary focus is on HIV service delivery, it also aims to create conditions within countries that can contribute to successful implementation of HIV programs, which includes helping to foster policy environments through both operational guidance and diplomacy.
  • We examined the policy environments in PEPFAR countries to assess alignment with international HIV-related standards, looking at four main categories (clinical care and treatment, testing and prevention, structural, and health systems). We also compared PEPFAR countries to other low- and middle-income countries (LMICs).
  • Overall, we find that PEPFAR countries have stronger policy alignment than other LMICs – PEPFAR countries as a group have adopted 60% of recommended policies, compared with 48% among other LMICs, and PEPFAR countries have higher alignment scores than other LMICs in three of the four categories.
  • Policy alignment was particularly strong, including relative to other LMICs, in areas in which PEPFAR directly focuses and supports. PEPFAR countries scored highest (81%) in the area of clinical care and treatment, which includes policies related to early treatment initiation, treatment regimens, and viral load testing, and scored 20 percentage points higher than other LMICs. While the overall score on testing and prevention was lower than that of clinical care and treatment, there was still a large differential compared to other LMICs (57% compared to 37%). Scores were lowest and similar for both groups on policies and laws related to structural factors, such as HIV-related non-criminalization policies.
  • Policy alignment across PEPFAR countries varies substantially – overall policy adoption scores range from 33% in Trinidad & Tobago to 82% in South Africa and there is also variation within each main category – for instance, while no PEPFAR country has adopted policies related to drug use non-criminalization (structural), all 53 PEPFAR countries have fully aligned viral load testing policies (clinical care and treatment) with international standards.
  • While PEPFAR countries scored higher than other LMICs overall, a significant share of recommended policies have yet to be adopted in PEPFAR countries, particularly in the area of structural barriers, which may be the most difficult to affect at the country level, given that they often require national legal changes and/or reach beyond HIV. Going forward, these findings may serve as a baseline for targeting and assessing future PEPFAR efforts as the program seeks to further improve HIV outcomes in the countries within which it works.

Introduction

The U.S. government’s President’s Emergency Plan for AIDS Relief (PEPFAR), the world’s largest commitment by any nation to address a single disease, has played a significant role in addressing HIV/AIDS in the hardest-hit countries around the world and is credited with helping to shift the trajectory of the epidemic.1  While most of PEPFAR’s efforts are focused on providing services to those with and at risk for HIV, PEPFAR also aims to create conditions that can contribute to the successful implementation of HIV programs. 2 ,3 ,4  This includes working to foster the adoption of normative, evidence-based guidance and policies developed by international bodies aimed at improving HIV-related health outcomes.5 ,6 ,7 

Through its operational guidance and direct diplomatic engagement,8  PEPFAR has worked to encourage and in some cases require that country programs adopt certain policies, such as new antiretroviral treatment guidelines; differentiated service delivery9  – including multi-month dispensing of antiretrovirals (ARVs) to reduce the need for frequent refills, which has become particularly important to ensure continuity of treatment during COVID-19; and the removal of user fees that can serve as obstacles to HIV service access; as well as increase domestic budgets for HIV.10 ,11 ,12 ,13 ,14  PEPFAR also has emphasized the importance of addressing stigma and a human rights approach, particularly for reaching key populations that some societies have historically shunned.15 ,16 ,17 ,18  As a result, the program has been found to have played an important role in helping to shape the HIV policy environments in the countries in which it operates.19 ,20 ,21 ,22 ,23 ,24 

We sought to assess policy alignment with international HIV standards in PEPFAR countries. We included PEPFAR countries that were required to develop Country or Regional Operating Plans (COPs or ROPs), which are used for approval of funding and serve as annual strategic plans for U.S. HIV/AIDS efforts in host countries in 2020.25 ,26 ,27  In addition to assessing how PEPFAR COP/ROP countries align with international standards, we also compared this group to other LMICs.28 ,29 

Because we looked only at a point-in-time snapshot, findings cannot necessarily be attributed to PEPFAR. Rather, they may serve as a baseline for targeting and assessing future PEPFAR efforts, as the program seeks to further improve HIV outcomes in the countries within which it works. It is possible that policies may have changed in PEPFAR countries since we completed the analysis. For instance, according to a presentation by PEPFAR headquarters staff to stakeholders on August 2, 2021, numerous PEPFAR countries have been making modifications to their polices or guidelines related to multi-month dispensing of antiretrovirals during the COVID-19 pandemic.30 

Methods31 ,32 

We analyzed data from the HIV Policy Lab, a joint project of Georgetown University’s O’Neill Institute and other academic, civil society, and multilateral partners, with the support of PEPFAR, which compiles and measures the HIV-related policies of the 194 World Health Organization (WHO) member states against international normative guidance. The policies that the HIV Policy Lab uses as benchmarks are those recommended by internationally-recognized authorities, including the WHO, UNAIDS, the U.N. Development Programme, the Global Commission on HIV and the Law, and others based on current science and evidence and aimed at improving HIV-related outcomes. The HIV Policy Lab database uses information reported by governments through the National Commitments and Policy Instrument (NCPI) housed on UNAIDS’ Laws and Policies Analytics platform,33  and collects additional data from official countries sources, reports from U.N. member states, and other partner organizations.

We used the most recent year of data available (through 2020) on policies by country to assess their status in 53 PEPFAR countries required to submit a COP and ROP in 2020, and 85 other LMICs that either did not receive PEPFAR support (82 countries) or received some U.S. HIV support, but were not required to submit a COP or ROP in 2020 (3 countries).34 ,35 ,36  We included the full set of 33 indicators – along with more than 30 sub-indicators – across the four categories that the HIV Policy Lab tracks: clinical care and treatment; testing and prevention; health systems; and structural barriers (see Table 1 and the Appendix; more detailed explanations of each indicator can be found in the HIV Policy Lab’s Codebook).

For each indicator where data are available, the HIV Policy Lab assigns points based on adoption status – “Adopted” (1 point), “Partially Adopted” (0.5), and “Not Adopted” (0). For indicators with sub-indicators, the HIV Policy Lab assigns a full point if all sub-indicators are adopted, a half point (0.5) if some are adopted, and 0 if none are adopted. The points for all indicators are added to obtain a raw score for each country. Adoption percentages are calculated by dividing the raw scores by the total possible scores; indicators for which there are no data available are excluded. Scores for groups (e.g., PEPFAR countries, regions) were calculated by averaging country scores at the overall- and category-level. Scores presented in the text are for the main indicators unless otherwise noted. Countries without data were excluded.

Our analysis is based on data downloaded on December 7, 2021.

Table 1: Policy Indicators Included in Analysis, by Category
Clinical Care and TreatmentTesting and PreventionHealth SystemsStructural
Treatment InitiationSelf-testingTask ShiftingSame-sex Sex Non-Criminalization
Same-day Treatment StartPartner Notification/Index TestingHealthcare FinancingSex Work Non-Criminalization
Treatment RegimenCompulsory TestingUniversal Health CoverageDrug Use Non-Criminalization
Differentiated Service DeliveryAge Restrictions on Testing & TreatmentUser FeesHIV Exposure Non-Criminalization
Viral Load TestingPrEPAccess to Medicines (TRIPS)Non-discrimination Protections
Pediatric Diagnosis & TreatmentHarm ReductionUnique Identifiers with Data ProtectionsNational Human Rights Institutions
Migrant Access to HealthcareComprehensive Sexuality EducationData SharingConstitutional Right to Health
Tuberculosis DiagnosisPrisoners PreventionGirls Education
Gender-based Violence
Civil Society

Findings

PEPFAR countries, as a group, have greater policy alignment, than other LMICs.

  • Overall, PEPFAR countries have an average adoption score of 60% for the recommended policies, compared to 48% for other LMICs. Policy adoption scores in PEPFAR countries range from 33% in Trinidad & Tobago to a high of 82% in South Africa (see Figure 1).
  • PEPFAR countries score higher on three of the four policy categories tracked, with an average score 22 percentage points greater than that of other LMICs for clinical care and treatment indicators; 16 percentage points higher for testing and prevention indicators; and 10 points higher for health systems indicators. The score for the fourth category — structural indicators – was similar to that of other LMICs (see Figure 2).
Overall HIV Policy Adoption Scores by PEPFAR Country

PEPFAR countries have the strongest policy alignment in the area of clinical care and treatment and the weakest on structural indicators.

  • On average, PEPFAR countries have an adoption score of 83% for policies related to clinical care and treatment (see Figure 2), ranging from a low of 31% (Nicaragua) to a high of 100% in eight countries (Eswatini, Ethiopia, Haiti, Malawi, Papua New Guinea, South Sudan, Uganda, and Zimbabwe).
  • For testing and prevention indicators, PEPFAR countries have an average adoption score of 53%, ranging from 0% (Trinidad and Tobago) to 94% (Nigeria).
  • PEPFAR countries scored an average of 60% for health systems indicators, ranging from 14% (Laos) to 93% in three countries (Eswatini, South Africa, and Thailand).
  • PEPFAR countries have the weakest alignment for policies related to structural indicators (47%), with Lesotho scoring the lowest in this category at 11%, and Rwanda and South Africa scoring the highest at 70%.
Average HIV Policy Adoption Scores of PEPFAR v. Other LMICs by Policy Category

Clinical Care and Treatment

  • All PEPFAR countries in this analysis (53) have fully adopted viral load testing policies aligned with international standards (whether a national policy is in place to monitor viral load in people with HIV at least once a year). This was the only indicator among the 33 for which 100% of countries have fully aligned policies. Treatment initiation policies (whether a national policy is in place that states that people with HIV, regardless of CD4 count, are eligible to start treatment) followed closely with 52 of the 53 PEPFAR countries fully adopting.
  • Differentiated service delivery (DSD) policies (whether national policy allows for differentiated HIV treatment services such as multi-month dispensing and community antiretroviral therapy) had the smallest share of PEPFAR countries fully adopting – 15 of the 53 PEPFAR countries, although an additional 36 had adopted some DSD policies.

Testing and Prevention

  • Adoption of prevention policies is greatest for comprehensive sexuality education (whether national policies require curriculum that meets international standards be taught in primary and secondary schools), with 42 PEPFAR countries fully adopting (out of 52 with available data).
  • Policies related to HIV prevention among prisoners (whether national policy stipulates that prevention tools, such as condoms, lubricants, and syringe access/exchange programs available to prisoners) were the least likely to be aligned, with just two countries (Kyrgyzstan and Tajikistan) fully adopting policies aligned with international standards (out of 52 with available data), although an additional 13 had adopted some policies in this area.

Health Systems

  • Within this category, PEPFAR countries are most aligned on policies related to unique identifiers with data protections (whether the country utilizes unique identifiers for continuity of care across multiple facilities and has legally-enforceable data privacy protections) – 33 of 53 PEPFAR countries have policies fully aligned with international standards and an additional 17 countries had some national policy related to patient data protection.
  • More than half of PEPFAR countries (27 of 52 with available data) have fully aligned policies related to user fees (whether national policy stipulates that public primary care and HIV services are available without user fees) and an additional 20 have adopted some policies in this area.
  • PEPFAR countries are least likely to be aligned on policies related to universal health coverage of HIV treatment and PrEP (whether national health coverage includes medications for HIV treatment and PrEP) – 11 PEPFAR countries (out of 51 with available data) have fully aligned policies with international standards, with an additional 22 having adopted some policies related to universal health coverage of HIV treatment and PrEP.

Structural

  • PEPFAR countries have the strongest alignment on policies related to gender-based violence – an indicator that assesses whether or not countries have laws that explicitly address domestic violence with enforceable penalties (42 of 53 countries).
  • On the other end of the spectrum, no PEPFAR country has adopted policies related to drug use non-criminalization (whether national policy avoids criminalizing personal possession of drugs). Additionally, only three of 53 PEPFAR countries have policies related to sex work non-criminalization (whether national policy avoids criminalizing the buying, selling, and organizing of sex work) that are fully aligned with international standards (Haiti, Honduras, and Panama).
Percentage of Countries that Have Fully Adopted Indicator by PEPFAR Status

Discussion

While no PEPFAR country has fully aligned its laws and policies with international standards, this analysis shows that they have, on average, greater alignment than other LMICs and this differential is greatest in areas in which PEPFAR focuses most of its direct support, such as treatment and testing policies. As noted above, PEPFAR has actively worked toward changing local policies in countries, principally with regard to the adoption of treatment guidelines, the removal of user fees for HIV services, and the implementation of differentiated service delivery strategies, such as the multi-month dispensing of antiretrovirals – which has become critically important during the COVID-19 pandemic – and increasing domestic budgets for HIV. Further, PEPFAR has played a role in spotlighting the need for countries to address HIV among some of the most vulnerable populations, which have been historically shunned by some countries. At the same time, as this analysis demonstrates, there is still a significant share of recommended policies that have yet to be adopted in PEPFAR countries, particularly in the area of structural barriers, such as policies related to non-discrimination of marginalized groups and decriminalization of activities including sex work and drug use, which may be the most difficult to affect at the country level given that they often require national legal changes and/or reach beyond HIV.

While the data included in this analysis do not measure the extent or quality of implementation, policy adoption can be viewed as a step in the direction of evidence-based practices and indicate a country’s commitment to addressing HIV and creating a foundation that can facilitate and optimize HIV/AIDS efforts. This is especially important in PEPFAR countries, which include those that have been hardest hit by the HIV/AIDS epidemic. Indeed, PEPFAR’s most recent draft guidance to COP and ROP countries for 2022 places an even greater premium on policy change, including requiring country programs to either ensure change in some areas as a condition of receiving funding, or submit a detailed description of existing barriers and proposed plan to be able to meet these requirements.

Looking ahead, there are important questions surrounding PEPFAR’s role, beyond service delivery, in countries, especially as the program awaits the confirmation of a new coordinator, is expected to release a new five-year strategy, and is due for reauthorization in two years, all of which could provide openings for strengthening PEPFAR even further. The findings presented here, while not necessarily attributable to PEPFAR, may serve as a baseline for targeting and assessing future PEPFAR efforts, as the program seeks to further improve HIV outcomes in the countries within which it works and policymakers consider PEPFAR’s next phase.

Appendix

Appendix 1: Policy Indicators and Sub-Indicators Included in Analysis, by Category
CategoryNameIndicator or Sub-Indicator
Clinical care and treatmentTreatment initiationIndicator
Same-day treatment startIndicator
Treatment regimenIndicator
Differentiated service deliveryIndicator
Differentiated service delivery – Community ART distributionSub-indicator
Differentiated service delivery – Clinical visit frequencySub-indicator
Differentiated service delivery – Multi-month dispensingSub-indicator
Viral load testingIndicator
Pediatric diagnosis and treatmentIndicator
Pediatric diagnosis and treatment – Pediatric diagnosisSub-indicator
Pediatric diagnosis and treatment – Pediatric treatmentSub-indicator
Migrants’ access to health careIndicator
Migrants’ access to health care – Primary health careSub-indicator
Migrants’ access to health care – HIV health careSub-indicator
Tuberculosis diagnosticsIndicator
Testing and preventionSelf-testingIndicator
Partner notification/Index testingIndicator
Partner notification/Index testing – Index testingSub-indicator
Partner notification/Index testing – Confidentiality in index testingSub-indicator
Compulsory testingIndicator
Age restrictions on testing and treatmentIndicator
PrEPIndicator
PrEP – PolicySub-indicator
PrEP – Regulatory approvalSub-indicator
Harm reductionIndicator
Harm reduction – Harm reduction strategySub-indicator
Harm reduction – Syringe non-criminalizationSub-indicator
Comprehensive sexuality educationIndicator
Prisoner preventionIndicator
Prisoner prevention – CondomsSub-indicator
Prisoner prevention – Needle and syringe exchange programSub-indicator
Health systemsTask shiftingIndicator
Health financingIndicator
Health financing – BudgetSub-indicator
Health financing – Tax revenueSub-indicator
Universal health coverageIndicator
Universal health coverage – ARVsSub-indicator
Universal health coverage – PrEPSub-indicator
User feesIndicator
User fees – Primary careSub-indicator
User fees – HIV servicesSub-indicator
Access to medicines (TRIPS)Indicator
Access to medicines (TRIPS) – IncorporationSub-indicator
Access to medicines (TRIPS) – UseSub-indicator
Unique identifiers with data protectionsIndicator
Unique identifiers with data protections – Unique identifiers useSub-indicator
Unique identifiers with data protections – Data protectionsSub-indicator
Data sharingIndicator
Data sharing – DisaggregationSub-indicator
Data sharing - FrequencySub-indicator
StructuralSame-sex sex non-criminalizationIndicator
Same-sex sex non-criminalization – LawsSub-indicator
Same-sex sex non-criminalization – ArrestsSub-indicator
Sex work non-criminalizationIndicator
Drug use non-criminalizationIndicator
HIV exposure non-criminalizationIndicator
HIV exposure non-criminalization – LawsSub-indicator
HIV exposure non-criminalization – ArrestsSub-indicator
Non-discrimination protectionsIndicator
Non-discrimination protections – Sexual orientationSub-indicator
Non-discrimination protections – Gender identitySub-indicator
Non-discrimination protections – HIV statusSub-indicator
National human rights institutionsIndicator
Constitutional right to healthIndicator
Girls’ educationIndicator
Civil societyIndicator
Civil society – Social contractingSub-indicator
Civil society - FreedomSub-indicator
NOTE: Please see the HIV Policy Lab codebook for indicator and sub-indicator definitions.

Endnotes

  1. For more information on PEPFAR, see KFF’s The U.S. President’s Emergency Plan for AIDS Relief (PEPFAR) fact sheet. ↩︎
  2. U.S. Department of State, PEPFAR 2021 Country and Regional Operational Plan (COP/ROP) Guidance for All PEPFAR Countries, updated February 2021, accessed: https://www.state.gov/wp-content/uploads/2021/02/PEPFAR-COP21-Guidance-Final.pdf. ↩︎
  3. U.S. Department of State, PEPFAR 2021 Annual Report to Congress, February 2021, accessed: https://www.state.gov/wp-content/uploads/2021/02/PEPFAR2021AnnualReporttoCongress.pdf. ↩︎
  4. U.S. Department of State, Strategy for Accelerating HIV/AIDS Epidemic Control (2017-2020), September 2017, accessed: https://www.state.gov/wp-content/uploads/2019/08/PEPFAR-Strategy-for-Accelerating-HIVAIDS-Epidemic-Control-2017-2020.pdf. ↩︎
  5. U.S. Department of State, PEPFAR 2021 Country and Regional Operational Plan (COP/ROP) Guidance for All PEPFAR Countries, updated February 2021, accessed: https://www.state.gov/wp-content/uploads/2021/02/PEPFAR-COP21-Guidance-Final.pdf. ↩︎
  6. U.S. Department of State, PEPFAR 2021 Annual Report to Congress, February 2021, accessed: https://www.state.gov/wp-content/uploads/2021/02/PEPFAR2021AnnualReporttoCongress.pdf. ↩︎
  7. Specific examples of normative, evidence-based guidance and policies developed by international bodies include the WHO’s Consolidated guidelines on HIV prevention, testing, treatment, service delivery and monitoring: recommendations for a public health approach (see: https://www.who.int/publications/i/item/9789240031593) and Key Considerations for Differentiated ART Delivery for Specific Populations jointly produced by the WHO, U.S. Centers for Disease Control and Prevention, PEPFAR, USAID, and the International AIDS Society (see: https://www.who.int/publications/i/item/WHO-HIV-2017.34), among others. All guidelines and policies that the HIV Policy Lab uses as benchmarks with which to assess countries are included in their codebook (see: https://hivpolicylab.org/codebook). ↩︎
  8. PEPFAR is administered through the Office of the U.S. Global AIDS Coordinator and Health Diplomacy within the U.S. Department of State, led by a Senate-confirmed coordinator with the rank of ambassador, and is housed within U.S. diplomatic missions under the oversight of the U.S. ambassador in country. ↩︎
  9. For more information on differentiated service delivery, see https://www.differentiatedservicedelivery.org/. ↩︎
  10. U.S. Department of State, PEPFAR 2021 Country and Regional Operational Plan (COP/ROP) Guidance for All PEPFAR Countries, updated February 2021, accessed: https://www.state.gov/wp-content/uploads/2021/02/PEPFAR-COP21-Guidance-Final.pdf. ↩︎
  11. U.S. Department of State, PEPFAR 2021 Annual Report to Congress, February 2021, accessed: https://www.state.gov/wp-content/uploads/2021/02/PEPFAR2021AnnualReporttoCongress.pdf. ↩︎
  12. U.S. Department of State, U.S. Embassy and Consulate in Nigeria. “U.S. Urges Removal of User-fees for People Living with HIV,” October 2019, accessed: https://ng.usembassy.gov/u-s-urges-removal-of-user-fees-for-people-living-with-hiv/. ↩︎
  13. Ahonkhai AA, et al. “The impact of user fees on uptake of HIV services and adherence to HIV treatment: Findings from a large HIV program in Nigeria,” PLOS ONE, September 2020, accessed: https://journals.plos.org/plosone/article?id=10.1371/journal.pone.0238720. ↩︎
  14. USAID, “Sustainable Financing: Controlling the HIV/AIDS Epidemic Through Shared Responsibility,” webpage, accessed: https://www.usaid.gov/global-health/health-areas/hiv-and-aids/technical-areas/sustainable-financing-initiative (August 5, 2021). ↩︎
  15. U.S. Department of State, Strategy for Accelerating HIV/AIDS Epidemic Control (2017-2020), September 2017, accessed: https://www.state.gov/wp-content/uploads/2019/08/PEPFAR-Strategy-for-Accelerating-HIVAIDS-Epidemic-Control-2017-2020.pdf. ↩︎
  16. U.S. Department of State, PEPFAR 2021 Country and Regional Operational Plan (COP/ROP) Guidance for All PEPFAR Countries, updated February 2021, accessed: https://www.state.gov/wp-content/uploads/2021/02/PEPFAR-COP21-Guidance-Final.pdf. ↩︎
  17. U.S. Department of State, “Statement from Ambassador Deborah Birx, M.D., U.S. Global AIDS Coordinator, on the Principles of PEPFAR's Public Health Approach,” April 2014, accessed: https://web.archive.org/web/20150905071637/http:/www.pepfar.gov/press/releases/2014/224738.htm. ↩︎
  18. U.S. Department of State, Draft PEPFAR COP 2022 Guidance. ↩︎
  19. Institute of Medicine, Evaluation of PEPFAR, February 2013, accessed: https://www.nap.edu/catalog/18256/evaluation-of-pepfar. ↩︎
  20. O’Neill Institute for National and Global Health Law at Georgetown University Law Center, Reorganization and the Future of PEPFAR; Implications of State and USAID Reform, 2018. ↩︎
  21. Kolker J. “A Diplomat’s Perspective on Use of Science and Evidence in Implementing PEPFAR,” Science and Diplomacy, April 2018, accessed: https://www.sciencediplomacy.org/article/2018/kolker-pepfar. ↩︎
  22. Daschle T, Frist B, Building Prosperity, Stability, and Security Through Strategic Health Diplomacy: A Study of 15 Years of PEPFAR, Bipartisan Policy Center, 2018, accessed: https://bipartisanpolicy.org/wp-content/uploads/2019/03/Building-Prosperity-Stability-and-Security-Through-Strategic-Health-Diplomacy-A-Study-of-15-Years-of-PEPFAR.pdf. ↩︎
  23. Collins C et al, “Four Principles for Expanding PEPFAR’s Role as a Vital Force in U.S. Health Diplomacy Abroad,” Health Affairs, July 2012, accessed: https://www.healthaffairs.org/doi/10.1377/hlthaff.2012.0204. ↩︎
  24. Daschle T, Frist B, The Case for Strategic Health Diplomacy: A Study of PEPFAR, 2015, Bipartisan Policy Center, November 2015, accessed: https://bipartisanpolicy.org/wp-content/uploads/2019/03/BPC_Strategic-Health-November-2015.pdf. ↩︎
  25. The COP/ROP documents serve as annual strategic plans for U.S. HIV/AIDS efforts in host countries, as well as serve as the basis for the approval of U.S. funding. Each COP focuses on PEPFAR’s efforts in one county in most cases, whereas the ROPs focus on a group of countries. Most, but not all, COP countries receive a greater level of investment than ROP countries. ↩︎
  26. PEPFAR’s 2020 Country Operational Plan Guidance for all PEPFAR Countries includes a list of 55 countries that were required to submit a COP or ROP that year. This list served as the basis for our “PEPFAR countries” group. Two countries on this list (Barbados and Suriname) were excluded from our analysis following communication with staff in the Office of the Global AIDS Coordinator that confirmed that direct bilateral support had been discontinued to those countries in recent years. ↩︎
  27. U.S. Department of State, PEPFAR 2021 Country and Regional Operational Plan (COP/ROP) Guidance for All PEPFAR Countries, updated February 2021, accessed: https://www.state.gov/wp-content/uploads/2021/02/PEPFAR-COP21-Guidance-Final.pdf. ↩︎
  28. According to the U.S. government database www.foreignassistance.gov, three countries that were not required to develop a COP or ROP received some HIV funding in FY 2020 – Colombia, Peru, and Venezuela. These countries were not included in the PEPFAR group. ↩︎
  29. Only low- and middle-income countries, as defined by the World Bank (https://datahelpdesk.worldbank.org/knowledgebase/articles/906519-world-bank-country-and-lending-groups) were included in this analysis, with the exception of two high-income countries (Panama and Trinidad and Tobago) that receive PEPFAR support and were required to submit a ROP in 2020. ↩︎
  30. U.S. Department of State, “PEPFAR Update – Stakeholder Townhall,” presentation delivered on August 2, 2012. ↩︎
  31. O’Neill Institute for National and Global Health Law at Georgetown University Law Center, HIV Policy Lab, accessed: https://hivpolicylab.org/. ↩︎
  32. Kavanagh M, et al, “Understanding and comparing HIV-related law and policy environments: cross-national data and accountability for the global AIDS response,” BMJ Global Health, 2020, accessed: https://gh.bmj.com/content/5/9/e003695. ↩︎
  33. UNAIDS, Laws and Policies Analytics, web platform, accessed: http://lawsandpolicies.unaids.org/. ↩︎
  34. PEPFAR’s 2020 Country Operational Plan Guidance for all PEPFAR Countries includes a list of 55 countries that were required to submit a COP or ROP that year. This list served as the basis for our “PEPFAR countries” group. Two countries on this list (Barbados and Suriname) were excluded from our analysis following communication with staff in the Office of the Global AIDS Coordinator that confirmed that direct bilateral support had been discontinued to those countries in recent years. ↩︎
  35. According to the U.S. government database www.foreignassistance.gov, three countries that were not required to develop a COP or ROP received some HIV funding in FY 2020 – Colombia, Peru, and Venezuela. These countries were not included in the PEPFAR group. ↩︎
  36. Only low- and middle-income countries, as defined by the World Bank (see: https://datahelpdesk.worldbank.org/knowledgebase/articles/906519-world-bank-country-and-lending-groups), were included in this analysis, with the exception of two high-income countries (Panama and Trinidad and Tobago) that receive PEPFAR support and were required to submit a ROP in 2020. ↩︎