The KFF COVID-19 Vaccine Monitor is an ongoing research project tracking the public’s attitudes and experiences with COVID-19 vaccinations. Using a combination of surveys and qualitative research, this project tracks the dynamic nature of public opinion as vaccine development and distribution unfold, including vaccine confidence and acceptance, information needs, trusted messengers and messages, as well as the public’s experiences with vaccination.
Key Findings:
- Most adults believe that the worst of the COVID-19 pandemic is over but there are disagreements about what returning to normal means and when it should happen, especially as the public is similarly concerned that lifting and not lifting pandemic restrictions could have negative impacts. Majorities are worried that lifting some pandemic restrictions could leave immune-compromised people behind due to their increased risk of getting sick and half are also worried easing restrictions could lead to an increased number of deaths in their community, or that they personally wouldn’t be able to get needed medical care because local hospitals could be again overwhelmed. On the other hand, at least six in ten are also worried that if masking and testing requirements are not lifted that kids and teenagers’ mental health will suffer or that local businesses will suffer due to loss of revenue.
- While public leaders and communities are deciding when and how life returns after the COVID-19 pandemic, voters have already moved onto other key issues as they begin to think about the upcoming midterm elections. A large majority of registered voters (91%) say the economy and inflation are “very important” or “somewhat important” in deciding who to vote for in this year’s midterm elections. Other major issues such as voting rights (84%), foreign policy (83%), health care costs (82%), and immigration (79%) generate large levels of interest among voters, but the COVID-19 pandemic doesn’t currently rank among the top four issues for any group of voters.
- Overall COVID-19 vaccine uptake among adults and children remains relatively unchanged since January. About one-fourth of adults remain unvaccinated including one in six who say they will “definitely not” get vaccinated. Partisanship continues to play an outsized role in vaccination and booster intent among adults and among parents’ intentions to vaccinate their children.
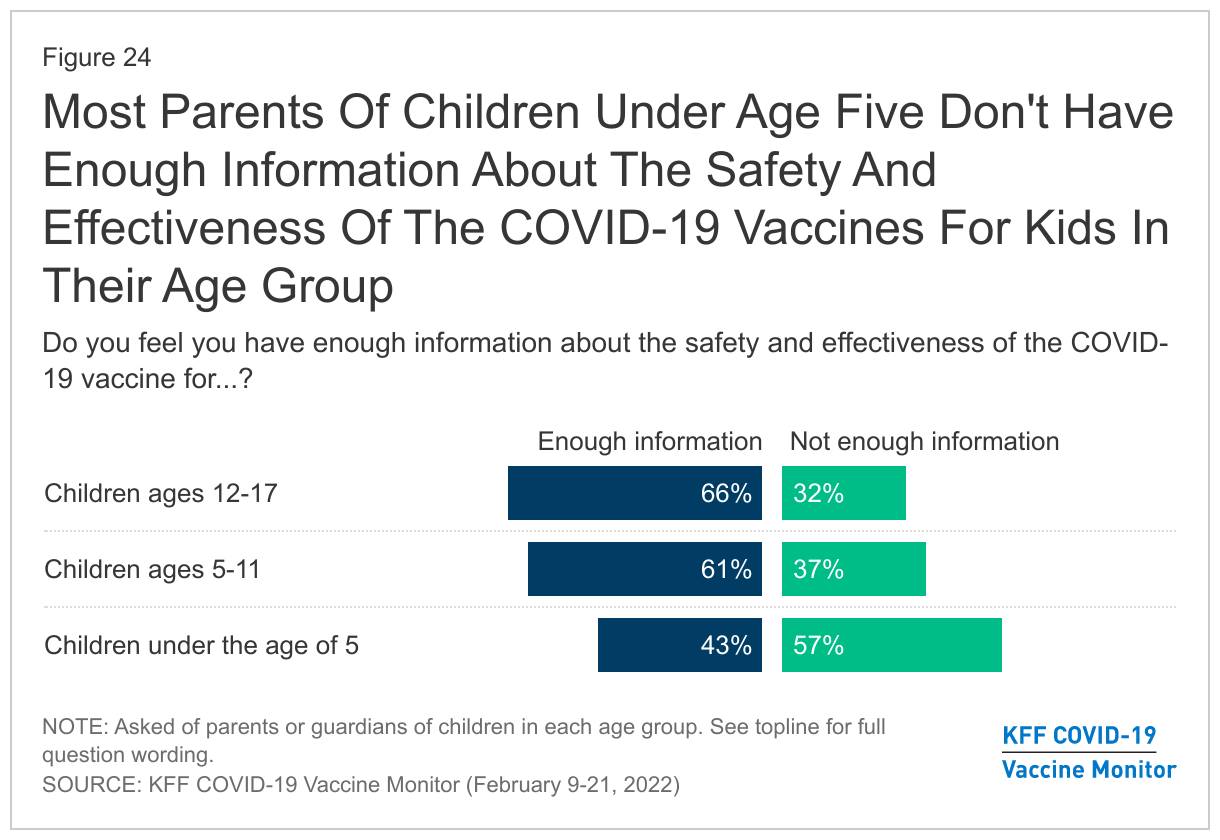
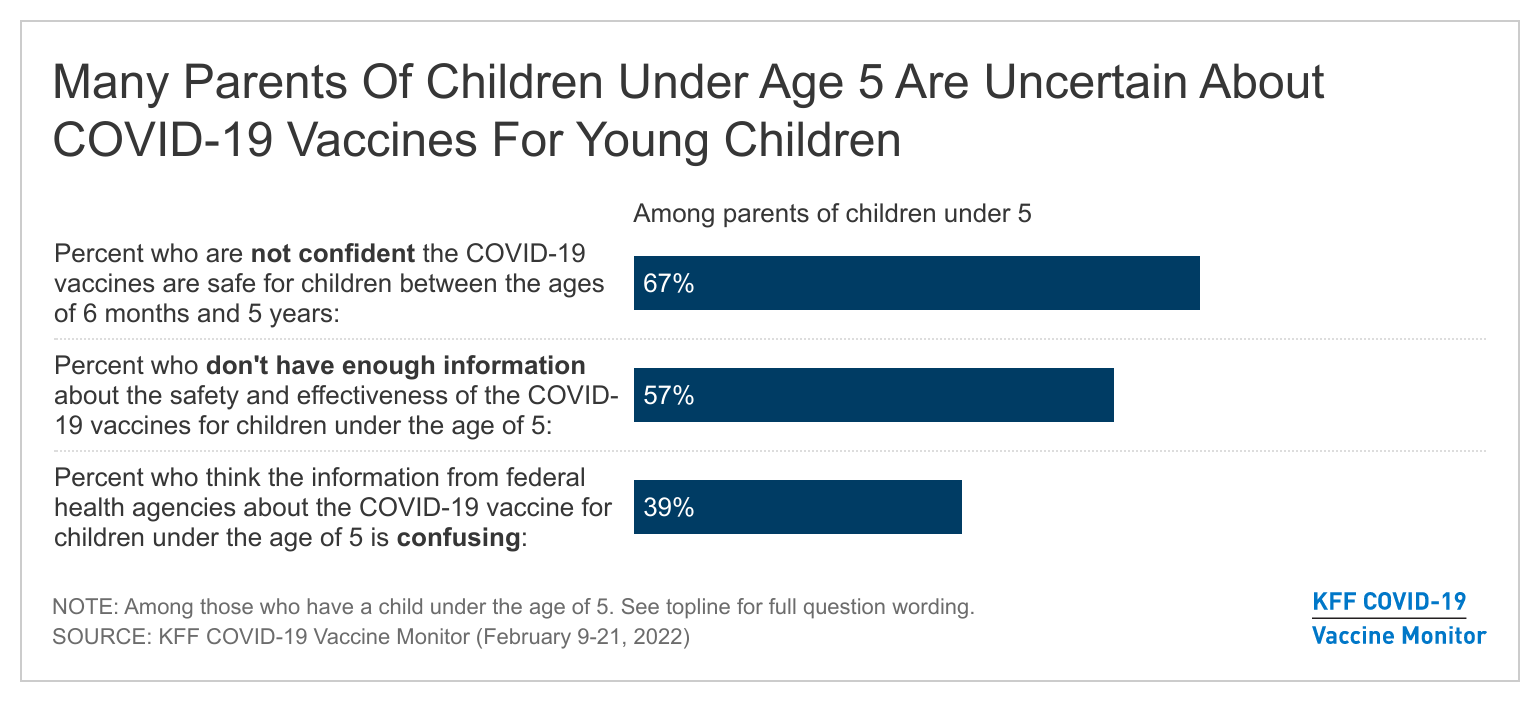
- On February 11th, Pfizer postponed its application to expand COVID-19 vaccines for children ages 6 months to 4 years. In the latest Monitor, conducted during this announcement, a majority of parents of children under five say they don’t have enough information about the safety and effectiveness of COVID-19 vaccines for children under five (57%). In addition, four in ten (39%) say the information from federal health agencies about the COVID-19 vaccine for that age group is confusing. Amidst these concerns, one in five (21%) parents of children under age five say they’ll get their child vaccinated right away once a COVID-19 vaccine is approved for their age group.
What Does “Return To Normal” Mean?
On February 17th, 2022, California became the first state to formally announce an approach to “return to normal” as they prepare to treat COVID-19 as an endemic rather than a pandemic. This move by California, a state that has had some of the strictest requirements around masking and testing in the country, marks – to some – a clear turning point in the pandemic. The February KFF COVID-19 Vaccine Monitor, fielded February 9th through 21st, explores what “return to normal” means for most people and finds that while many say the worst of the pandemic is over, there is uncertainty about what the future holds.
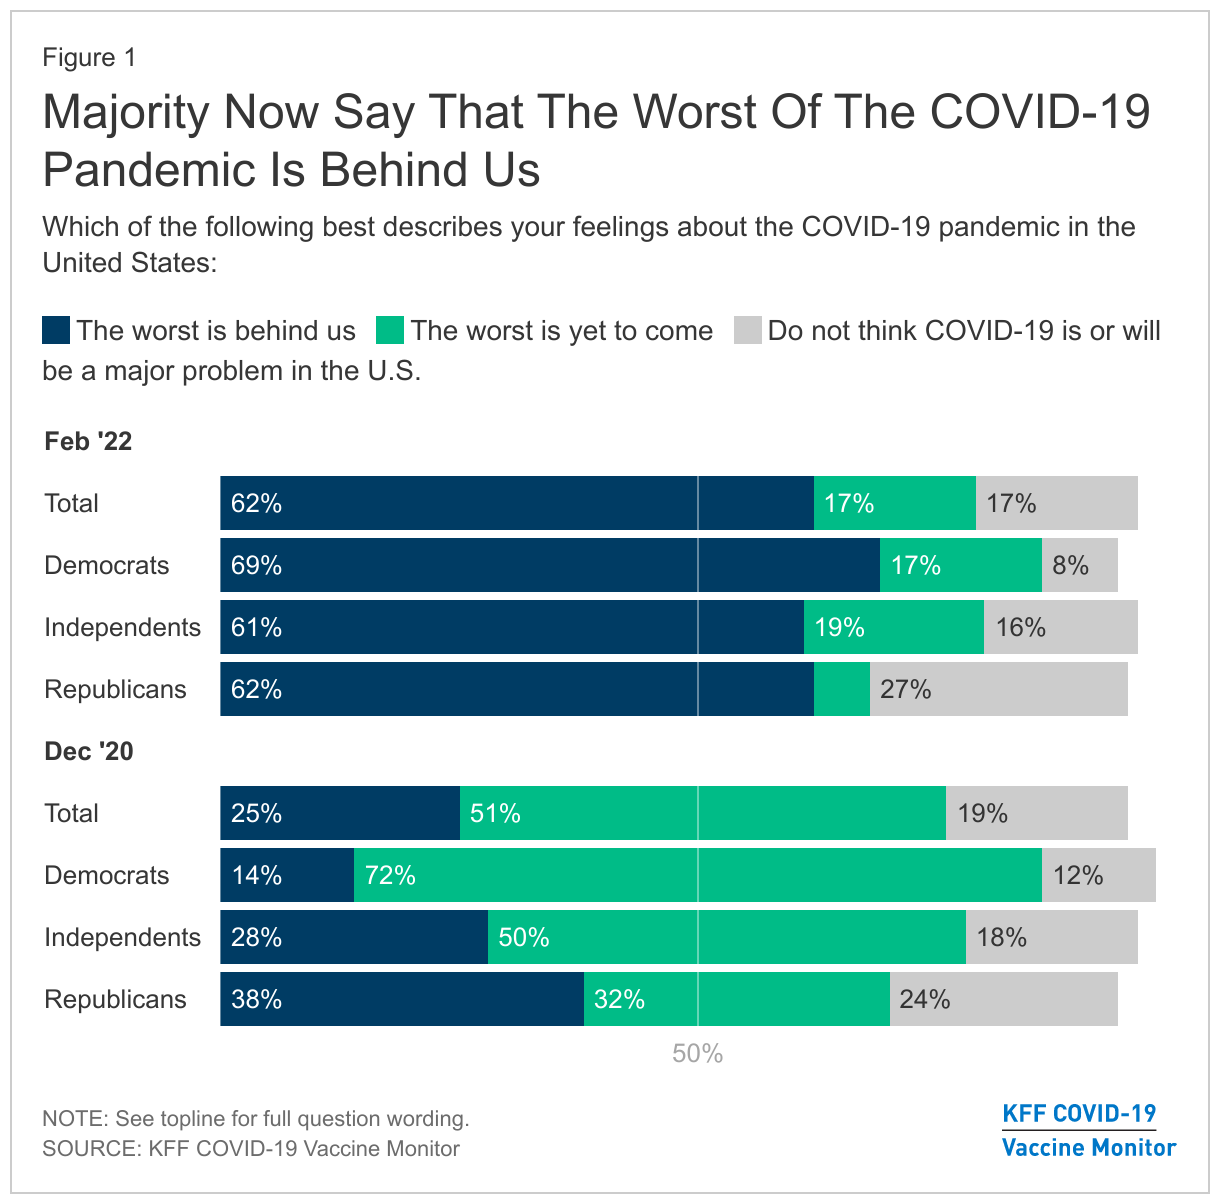
Overall, people largely think the worst of the pandemic is over with six in ten adults (62%) saying that when it comes to COVID-19 in the U.S., “the worst is behind us.” Another 17% say the worst is still yet to come, while 17% said they don’t think COVID-19 is or will be a major problem in the U.S. This is a reversal from perceptions of the pandemic 14 months ago and prior to widespread availability of COVID-19 vaccines. Back in December 2020, one quarter of the public thought the worst was behind us while half (51%) said the worst was yet to come.
Majorities of Democrats (69%), independents (61%), and Republicans (62%) agree that the worst of the pandemic is behind us, as do two-thirds of vaccinated adults. About half of unvaccinated adults also agree (49%) but a third of this group say that they don’t think COVID-19 is or will be a major problem in the U.S.
Returning to “Normal” Elicits Some COncerns, uncertainty about Lifting Restrictions
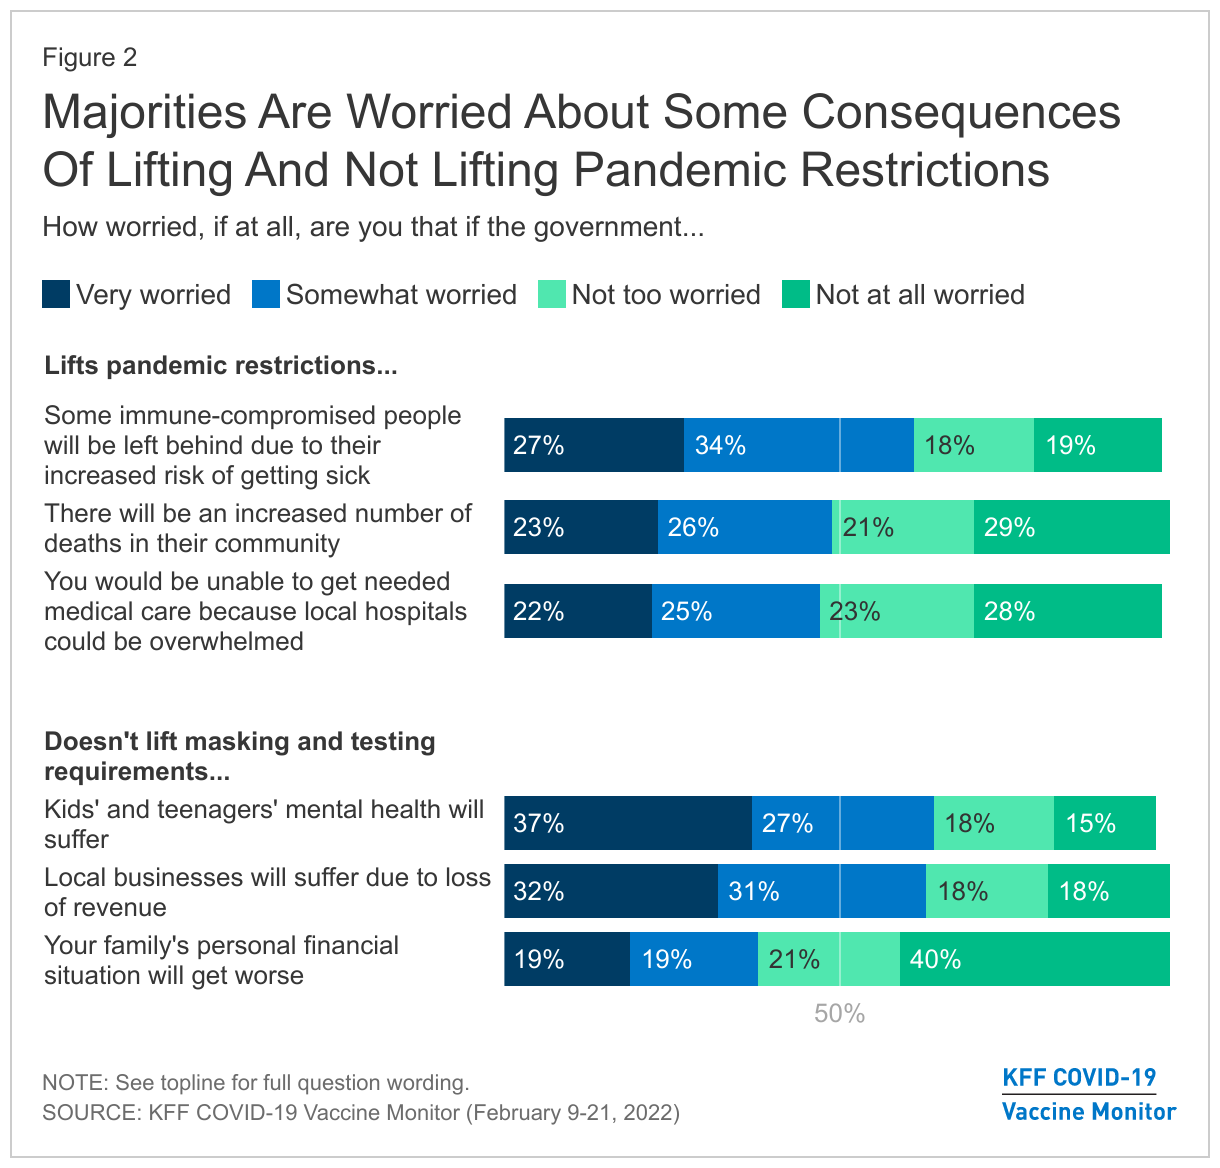
Majorities of adults are worried about some of the possible consequences of both lifting and not lifting pandemic restrictions such as mask requirements and testing. Six in ten are worried about immune-compromised people being left behind due to their increased risk of getting sick (61%) while about half are worried there will be an increased number of deaths in their community if the government lifts pandemic restrictions (49%) or that they personally wouldn’t be able to get needed medical care because local hospitals could be again overwhelmed if restrictions are relaxed (48%).
On the other hand, majorities of the public are also worried that if masking and testing requirements are not lifted that kids’ and teenagers’ mental health will suffer (65%) or that local businesses will suffer due to loss of revenue (63%). About four in ten (38%) are worried that their own family’s personal financial situation will get worse.
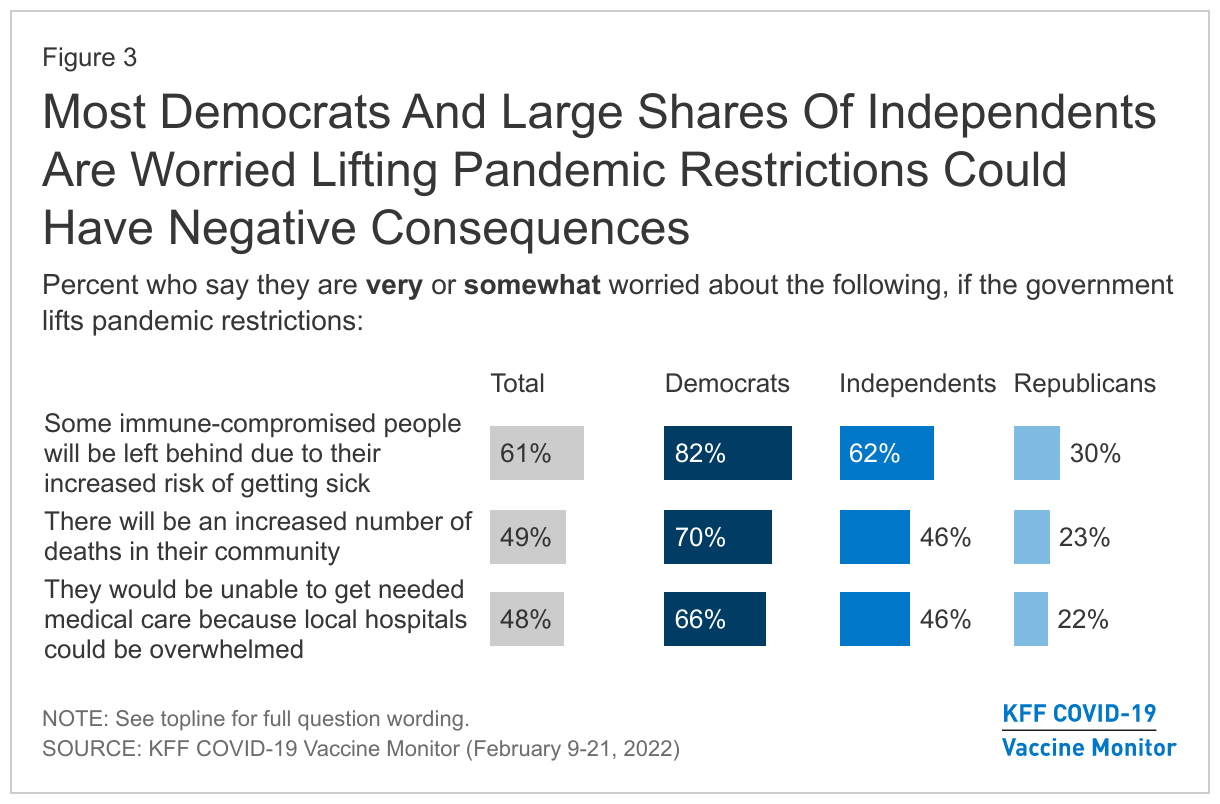
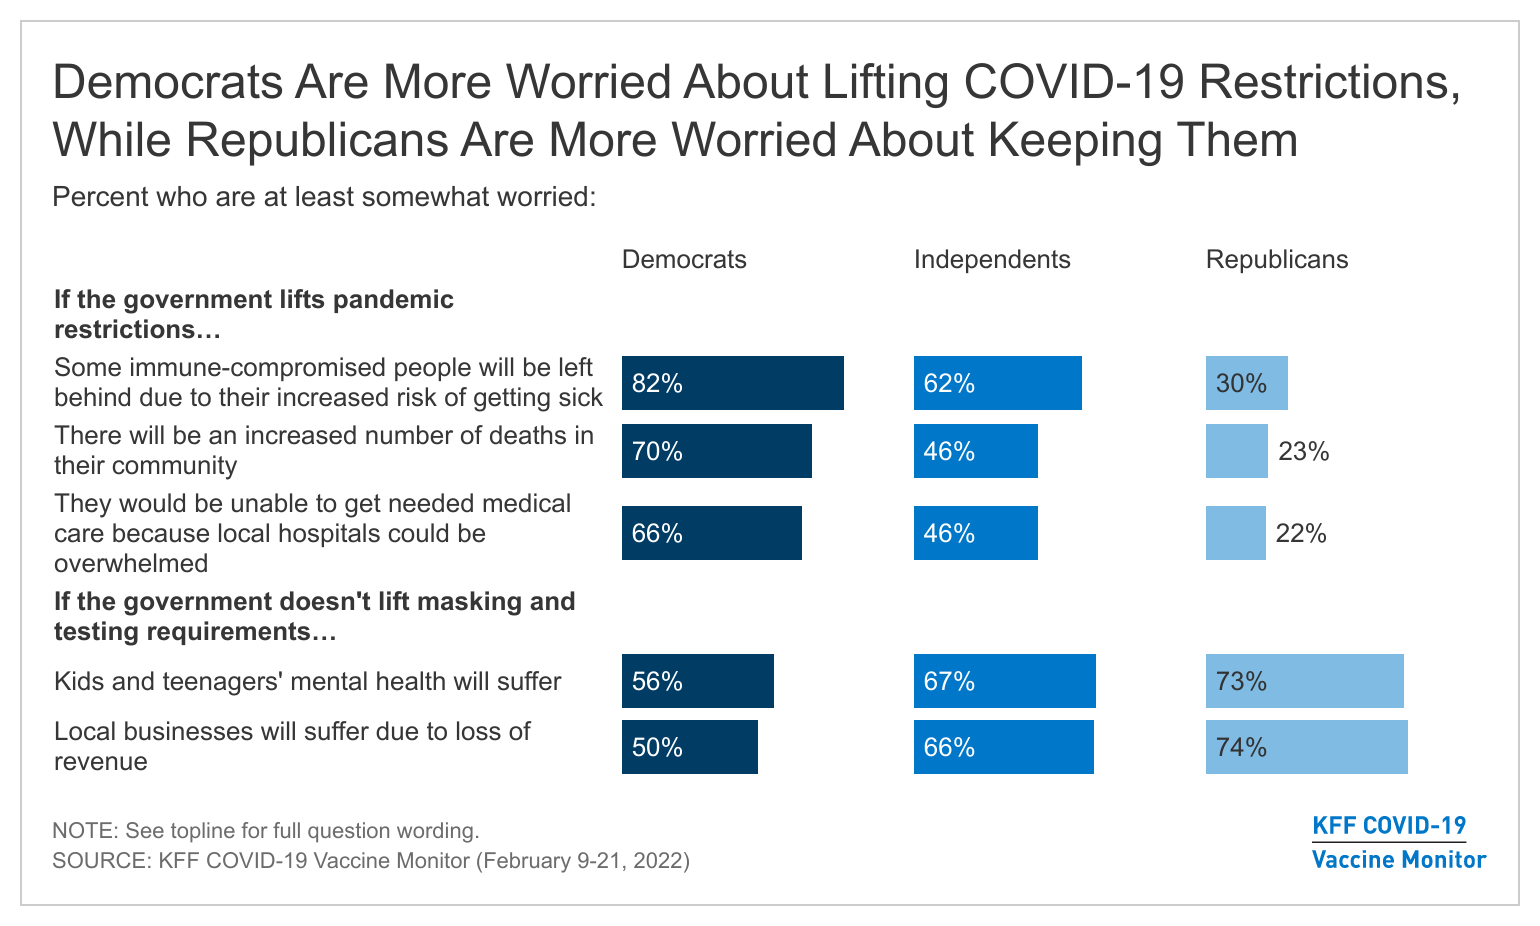
Larger shares of Democrats and independents than Republicans are worried that the government lifting pandemic restrictions could have negative consequences, including leaving immune-compromised people behind (82% and 62%, compared to 30%), an increased number of deaths (70%, 46%, and 23%), or hospitals being overrun and being unable to get needed medical care (66%, 46%, and 22%).
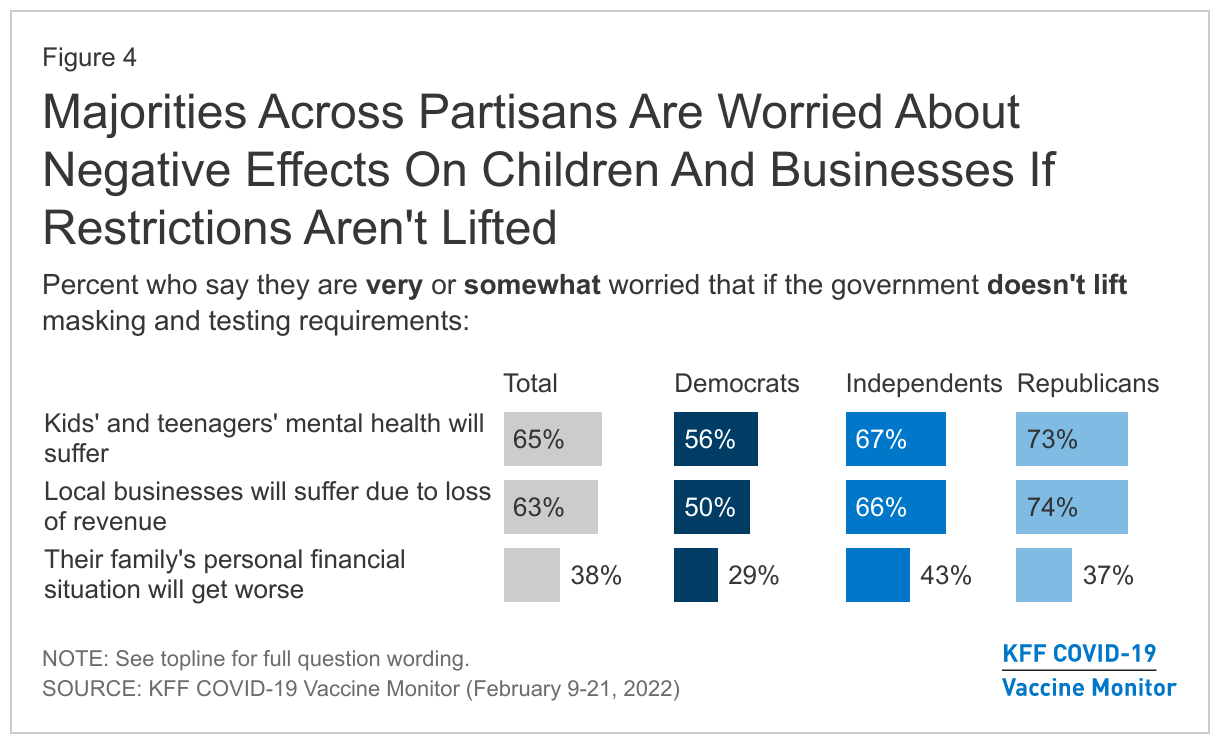
On the other hand, majorities of Republicans, independents, and Democrats are worried that if the government doesn’t lift masking and testing requirements there could be negative mental health consequences for children and teenagers or negative economic consequences on local businesses.
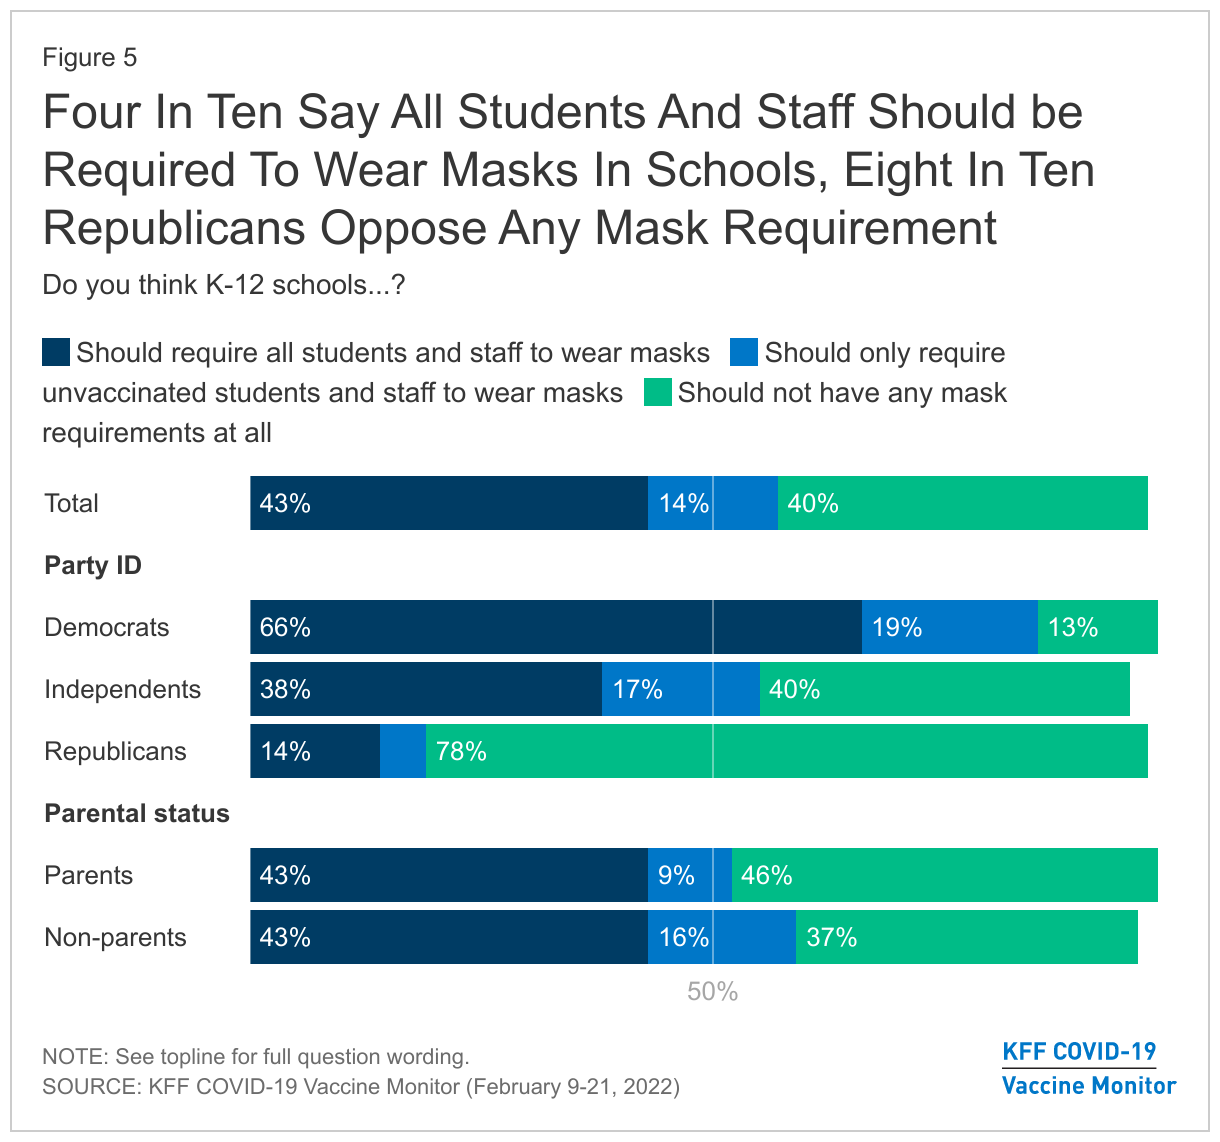
The scientific debate about mask requirements in schools has received notable attention recently as many school districts ease their masking requirements. Along with concerns over children’s mental health, overall support for masking in K-12 schools has decreased among the public since this past fall. Almost six in ten support any mask requirements in schools including four in ten (43%) who say all students and staff should be required to wear masks and 14% who say this requirement should only be for unvaccinated students and staff.
The overall share who support any mask requirement has decreased 9 percentage points since September 2021, when two-thirds supported some level of masking requirement. While there are still large partisan differences in support for such requirements , overall support for mask requirements in schools has decreased since September among Democrats, independents, and Republicans.
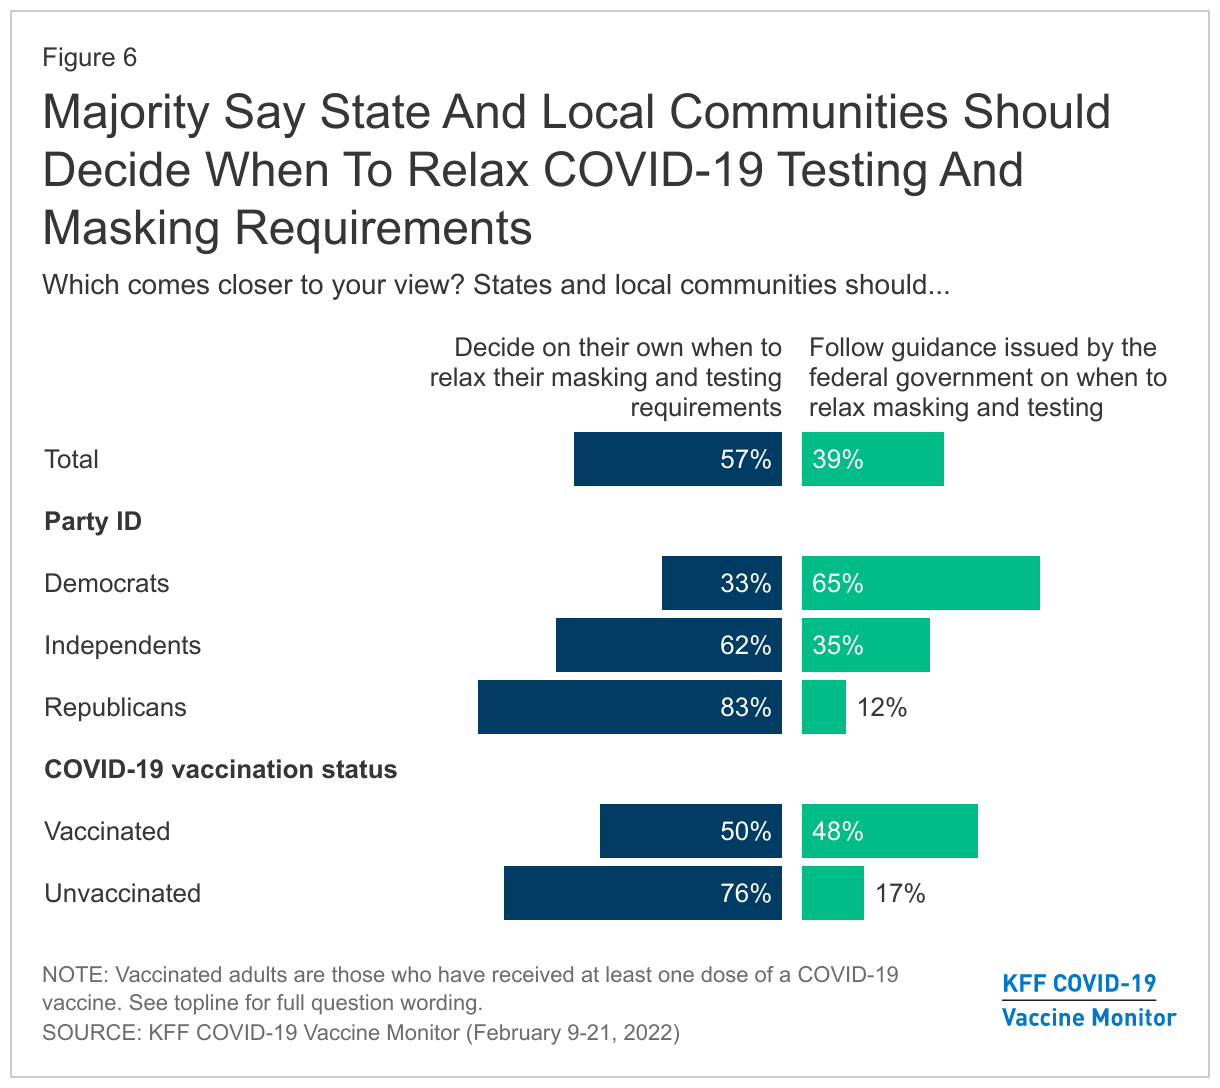
Balancing concerns on both sides has proven to be a difficult task for leaders. Most (57%) say states and local communities should be taking the lead on when to relax masking and testing requirements, while four in ten (39%) say states and local communities should follow federal guidance. An overwhelming majority of Republicans say the decisions should be made locally or at the state level (83%), while two-thirds of Democrats (65%) say that communities should be following guidance from the federal government.
When Will “Return to Normal” Be?
Nearly half of U.S. adults think it will be safe for most people to resume their normal pre-pandemic activities by late spring or sooner, including one-third (35%) who say it safe to do so “now,” 4% in “the next month or so” and one in ten who say it will be safe “by late spring.” Another one in five say they think it will be safe to resume activities by mid-summer (13%) or mid-fall (5%). Yet, around one-fourth of adults (26%) say it will be at least another year or longer before it will be safe for most people to resume normal pre-pandemic activities.
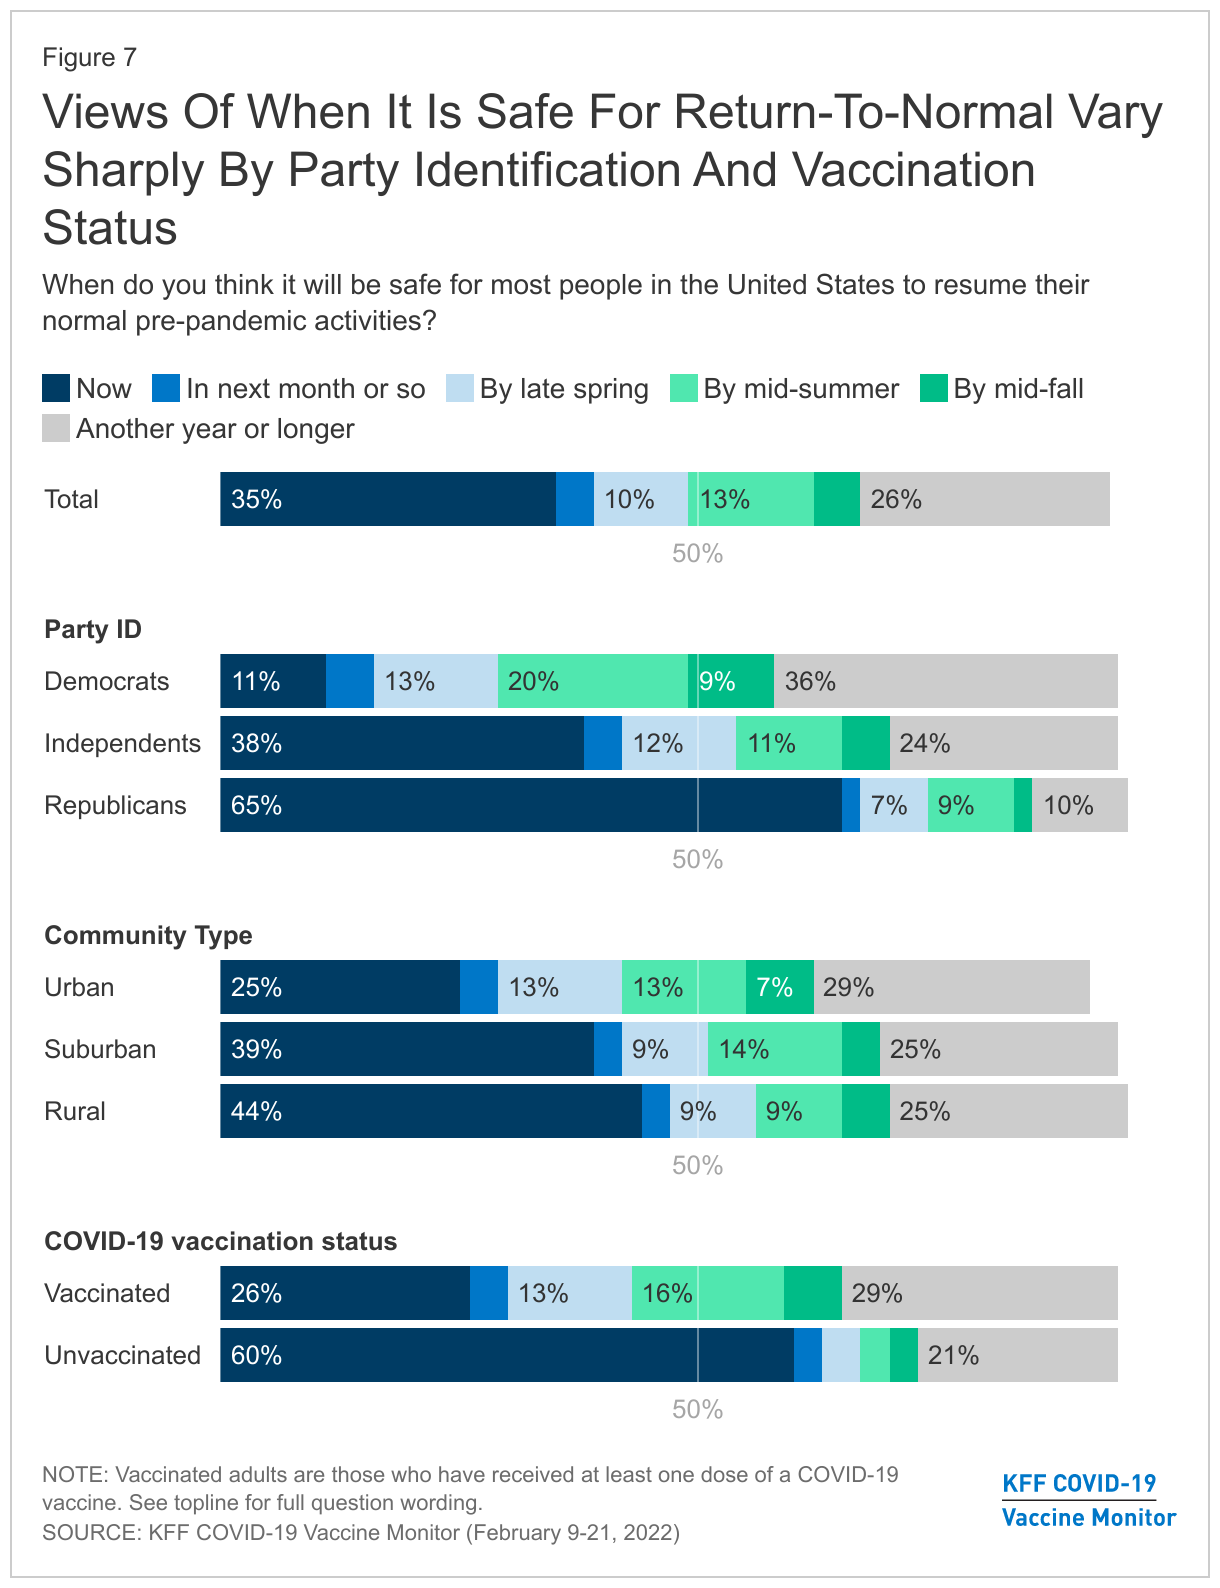
Throughout the pandemic, Republicans and Democrats have held strikingly different views of the coronavirus and the precautions needed to prevent its spread. The same is true of views of returning to normal with two-thirds of Republicans believing it is safe to resume normal pre-pandemic activities either “now” (65%) or “in the next month or so” (2%). Democrats, on the other hand, are far more cautious with about one in ten saying it is safe to resume activities “now” and an additional 5% saying “in the next month or so.” More than one-third of Democrats say it will be at least another year before it is safe to resume activities compared to a quarter of independents and one in ten Republicans who say the same. Six in ten unvaccinated adults say it is safe for most people to resume their normal pre-pandemic activities “now” compared to one-quarter of vaccinated adults who say the same. This is consistent with previous KFF research finding unvaccinated adults were far more skeptical of the severity of the virus and less worried about them or their family members getting seriously sick.
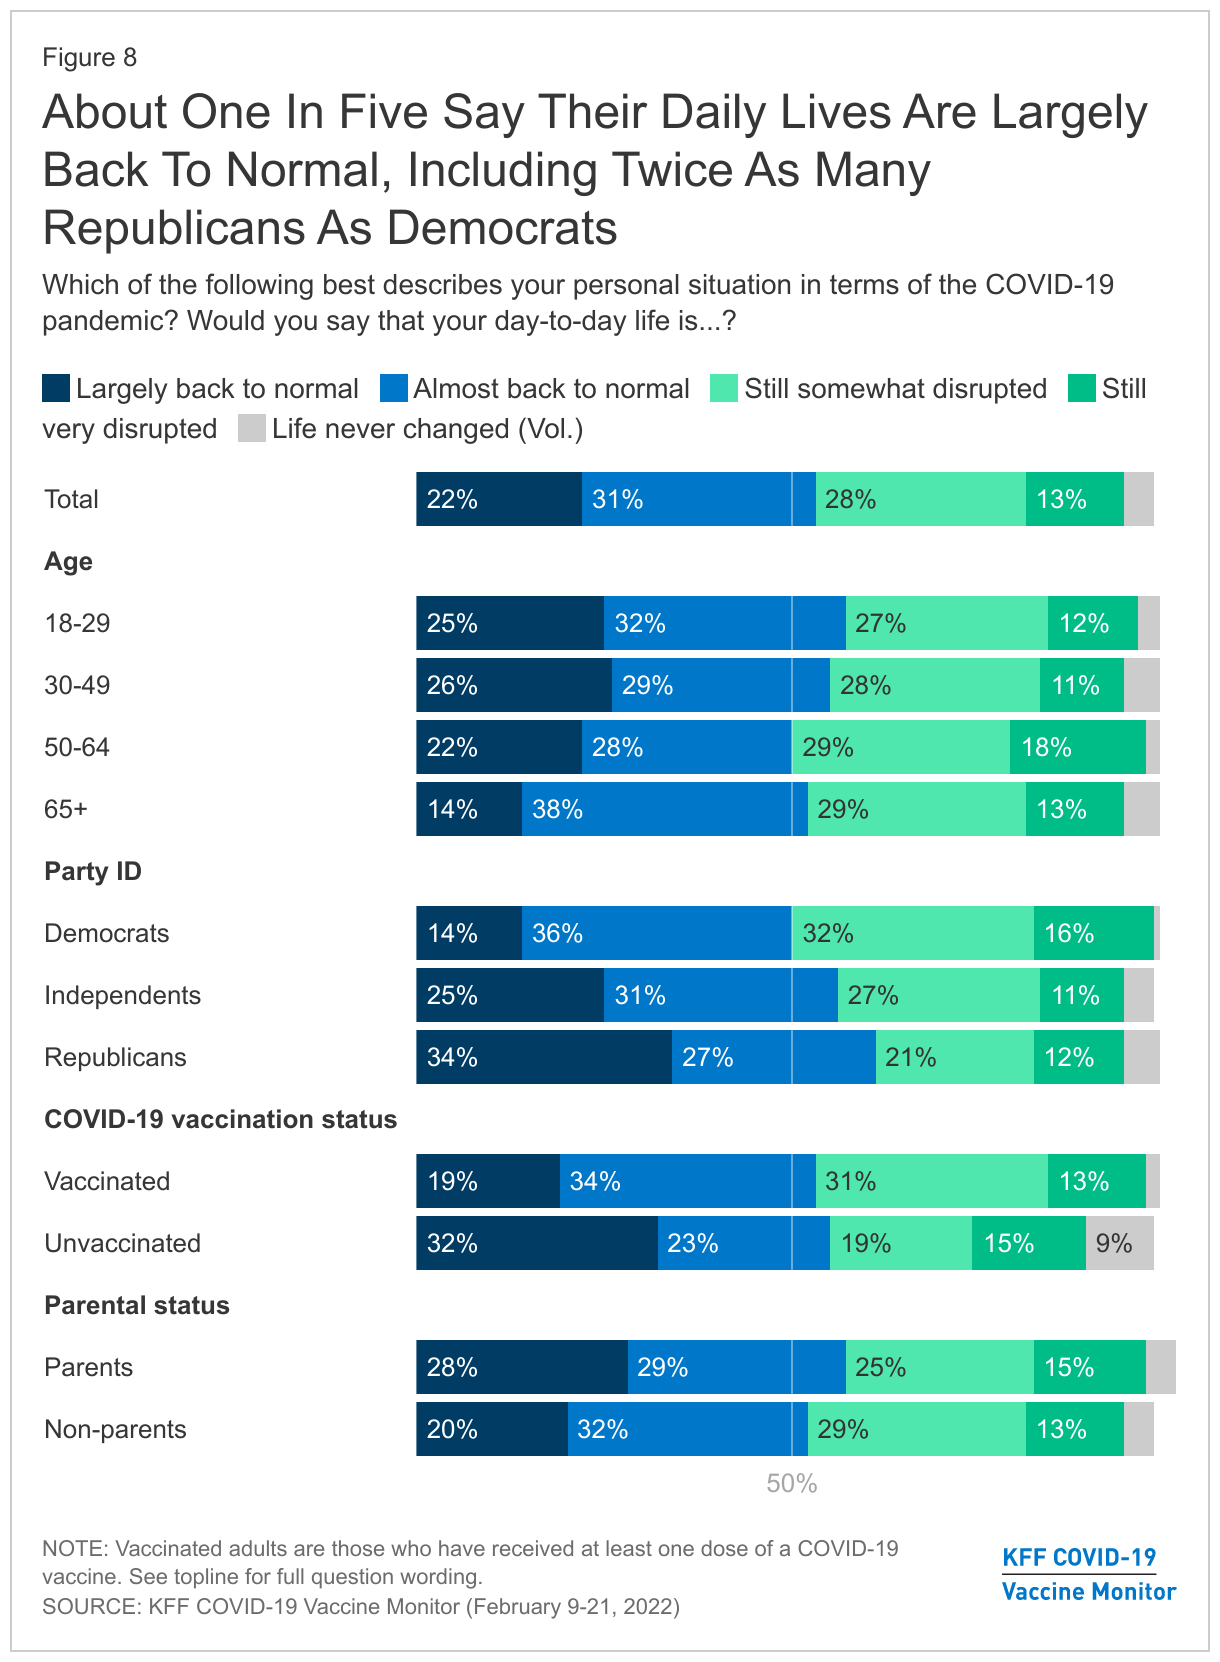
For Many, Day-To-Day Life is Almost Back To Normal
About half of adults say that when it comes to their personal situation in terms of the pandemic, their day-to-day lives are already “largely” (22%) or “almost” back to normal (31%), while four in ten say their lives are still “somewhat” or “very” disrupted. Republicans are more than twice as likely as Democrats to report that their day-to-day life is “largely back to normal” (34% v. 15%). A larger share of unvaccinated adults compared to vaccinated adults say their life is “largely back to normal” (32% vs. 19%), with an additional 9% of unvaccinated adults (compared with 2% of vaccinated adults) volunteering that their life never changed. Adults under age 65 are slightly more likely than those ages 65 and over to say their lives are largely back to normal. With most kids back at in-person schooling and fewer omicron cases, at least half of parents and non-parents say their lives are at least almost back to normal.
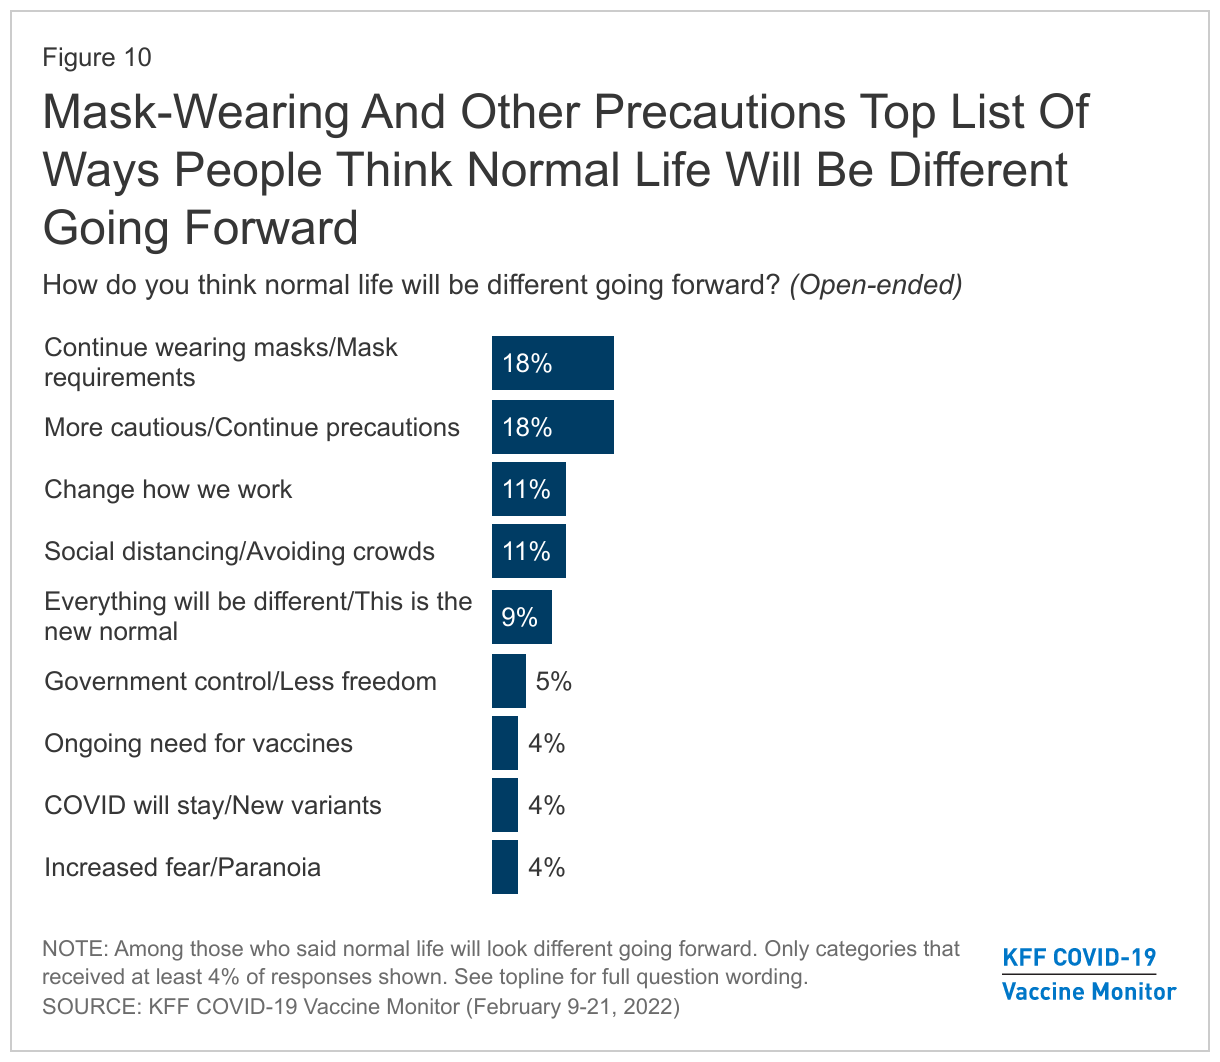
One thing that Republicans, Democrats, vaccinated adults, and unvaccinated adults agree on is that normal life will look different going forward. Large majorities of adults, regardless of age, parental status, gender, and party identification say normal life will look like something different rather than going back to the way things were before the pandemic.
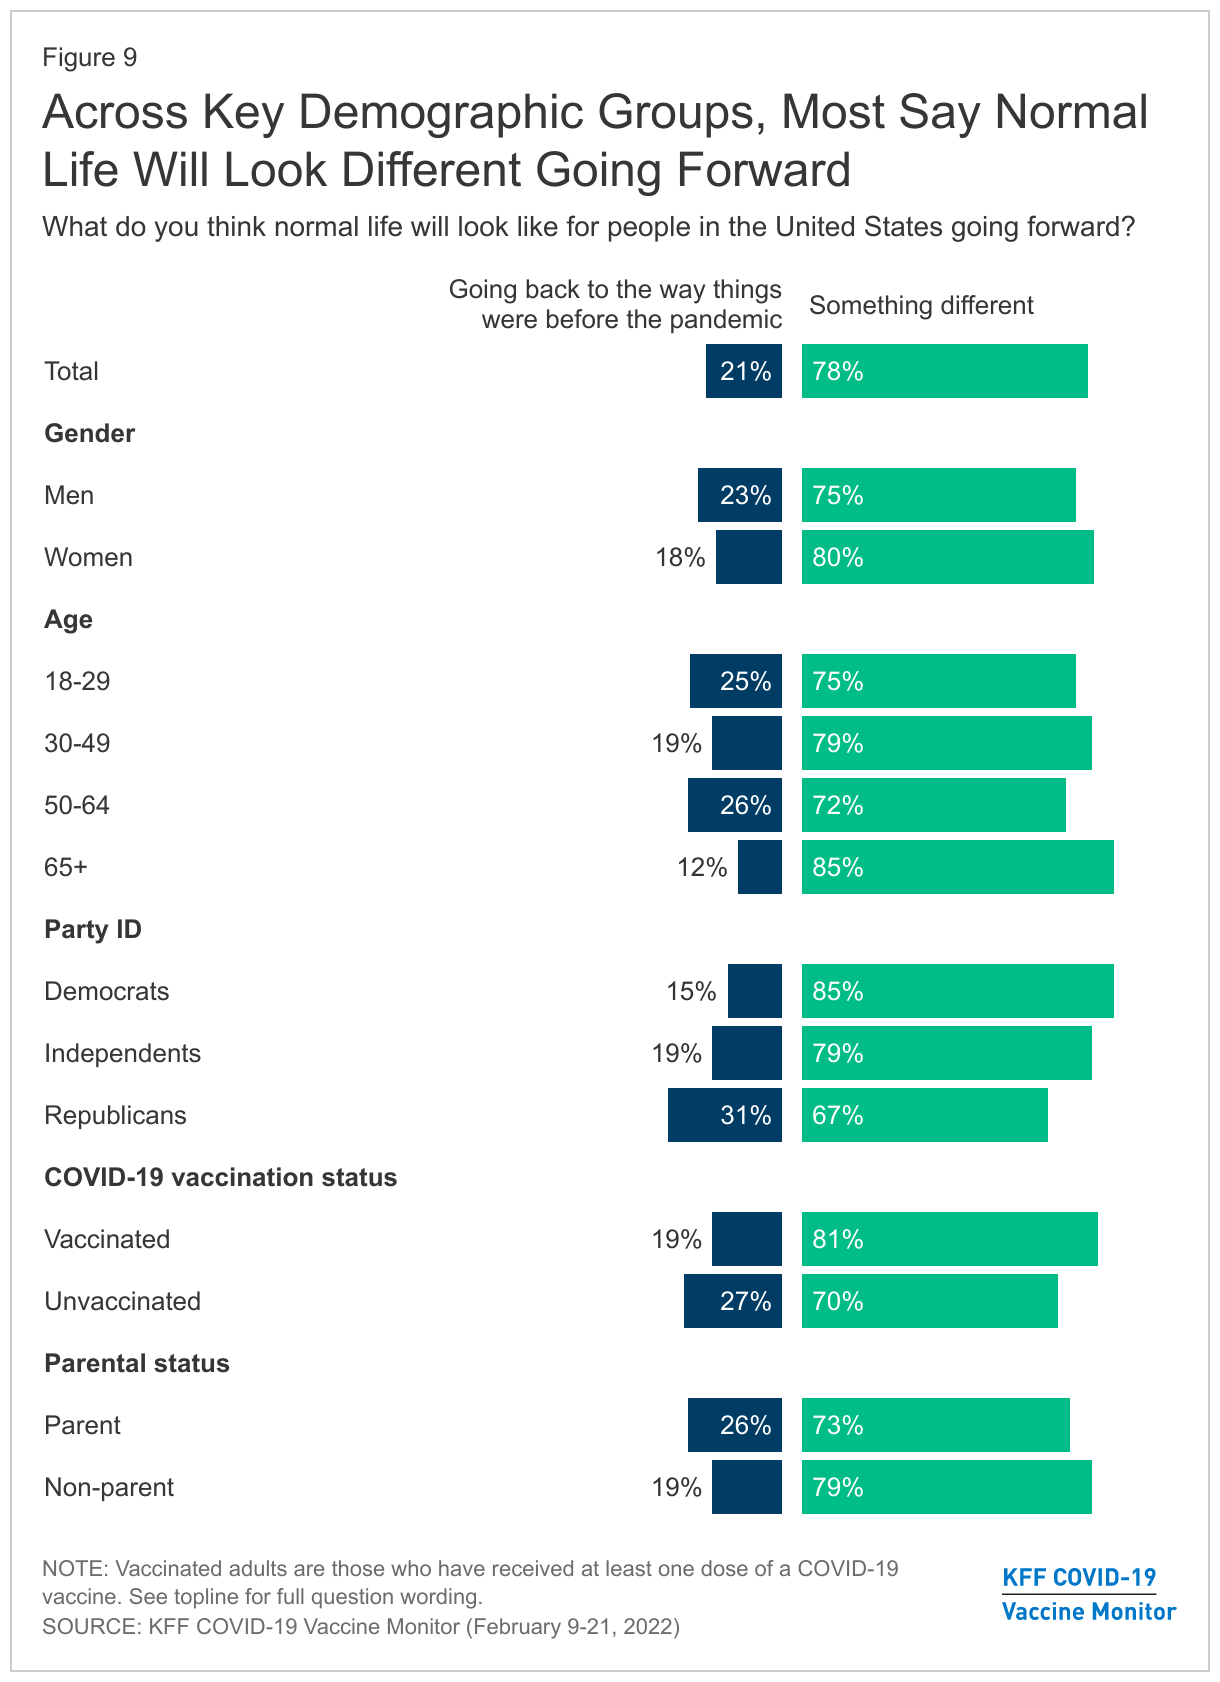
When asked to say in their own words how normal life will be different going forward, about one in five (18%) offer responses related to either continuing to wear masks and the same share (18%) mention being more cautious or continuing precautions in their daily lives. One in ten offer responses related to changing the way we work (11%) or social distancing or avoiding crowds (11%). Some (9%) simply offer that everything will be different and this the current situation is our new normal. Smaller shares offer responses related to government control (5%), an ongoing need for vaccines (4%), that COVID-19 is here to stay and there will be new variants (4%), or increased paranoia or fear (4%).
Voters, Midterms, And COVID-19
While the COVID-19 pandemic still looms large for many people in the U.S., it is not the top issue on voters’ minds as they begin to think about the 2022 midterm elections.
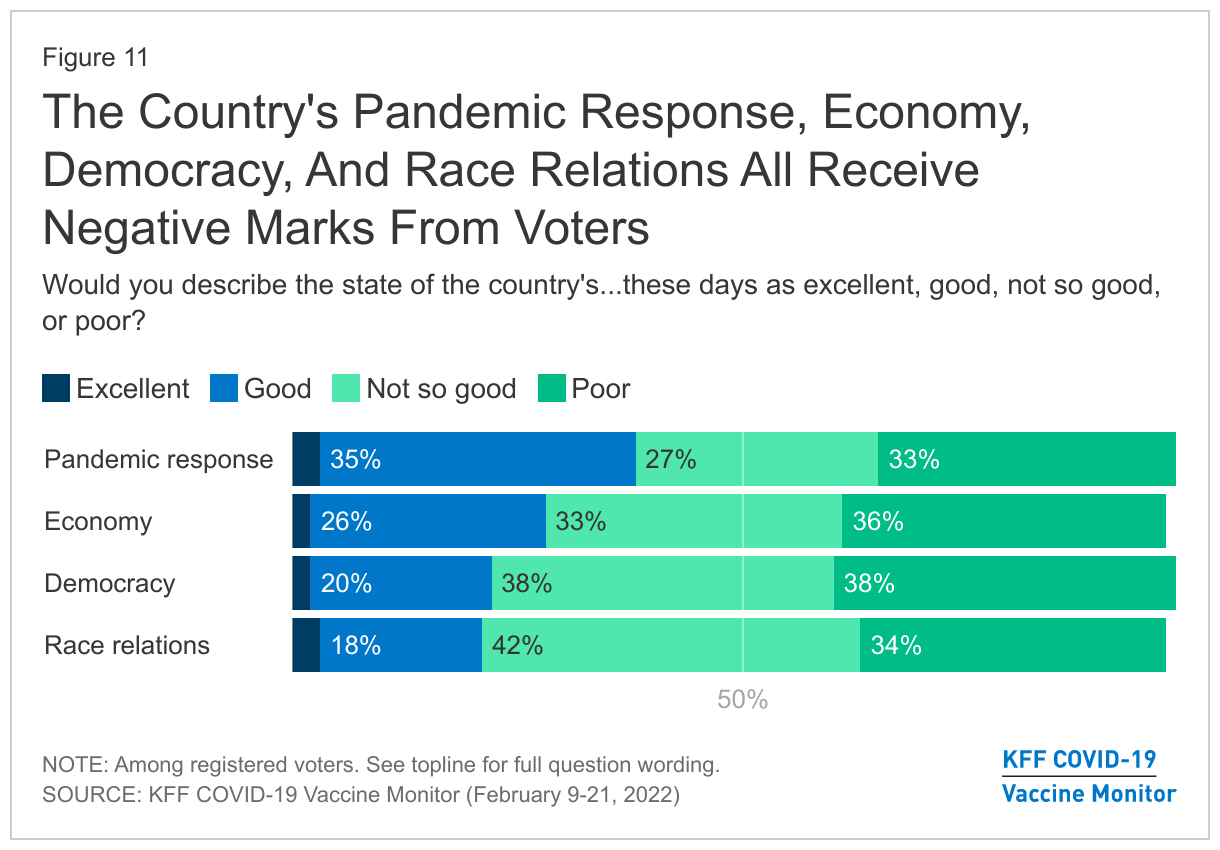
Large majorities of registered voters are pessimistic about the current state of key issues facing the country. About four in ten say the state of the country’s pandemic response is “excellent” (3%) or “good” (35%), while six in ten call it “not so good” (27%) or “poor” (33%). Even fewer voters rate the state of the country’s economy (28%), the country’s democracy (21%), or the state of the country’s race relations (21%) as “excellent” or “good.” In fact, across the board, at least six in ten voters say the state of the country in each of these four areas is either “not so good” or “poor.”
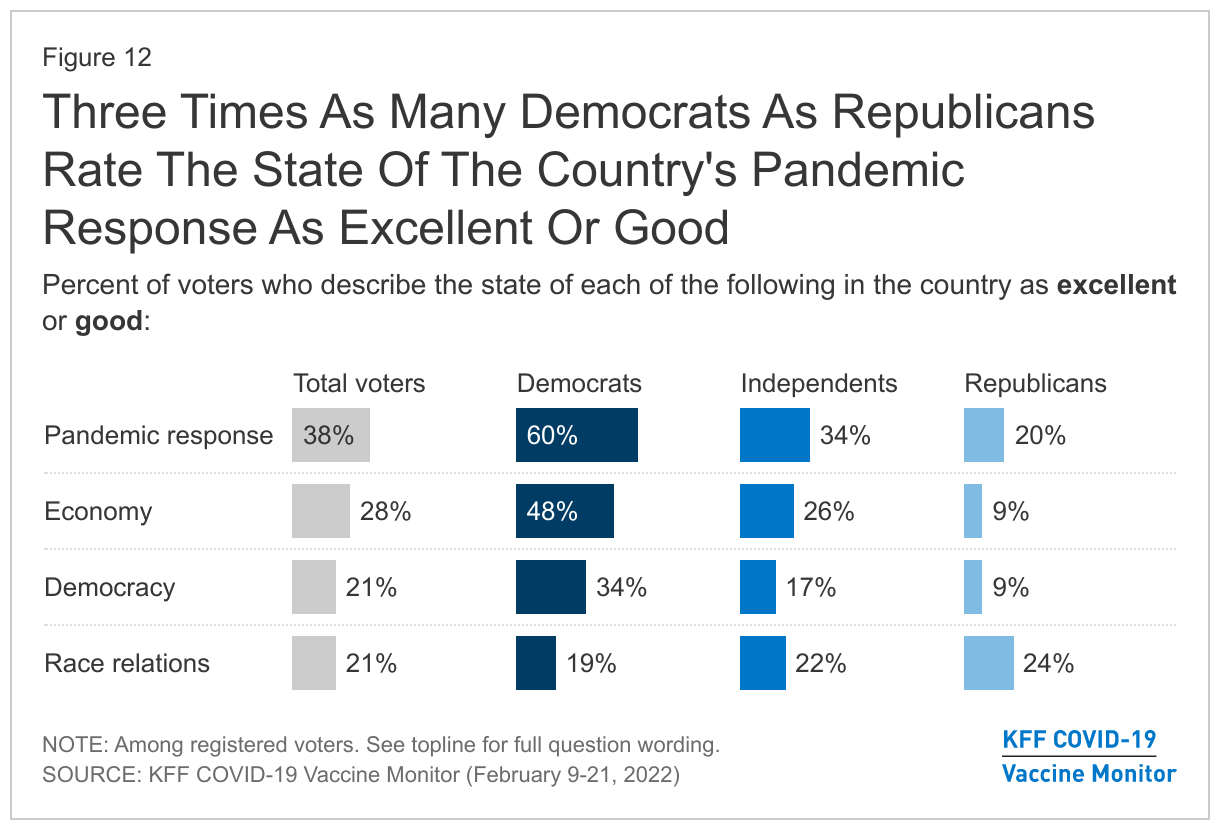
Democratic voters are three times as likely as Republican voters to say the state of the country’s pandemic response is “excellent” or “good” (60% compared to 20%). They are also more positive than Republican voters about the state of the country’s economy (48% compared to 9%) and democracy (34% compared to 9%). The state of the country’s race relations receives equally poor marks across partisans, with 19% of Democratic voters, 22% of independent voters, and 24% of Republican voters saying it is “excellent” or “good.”
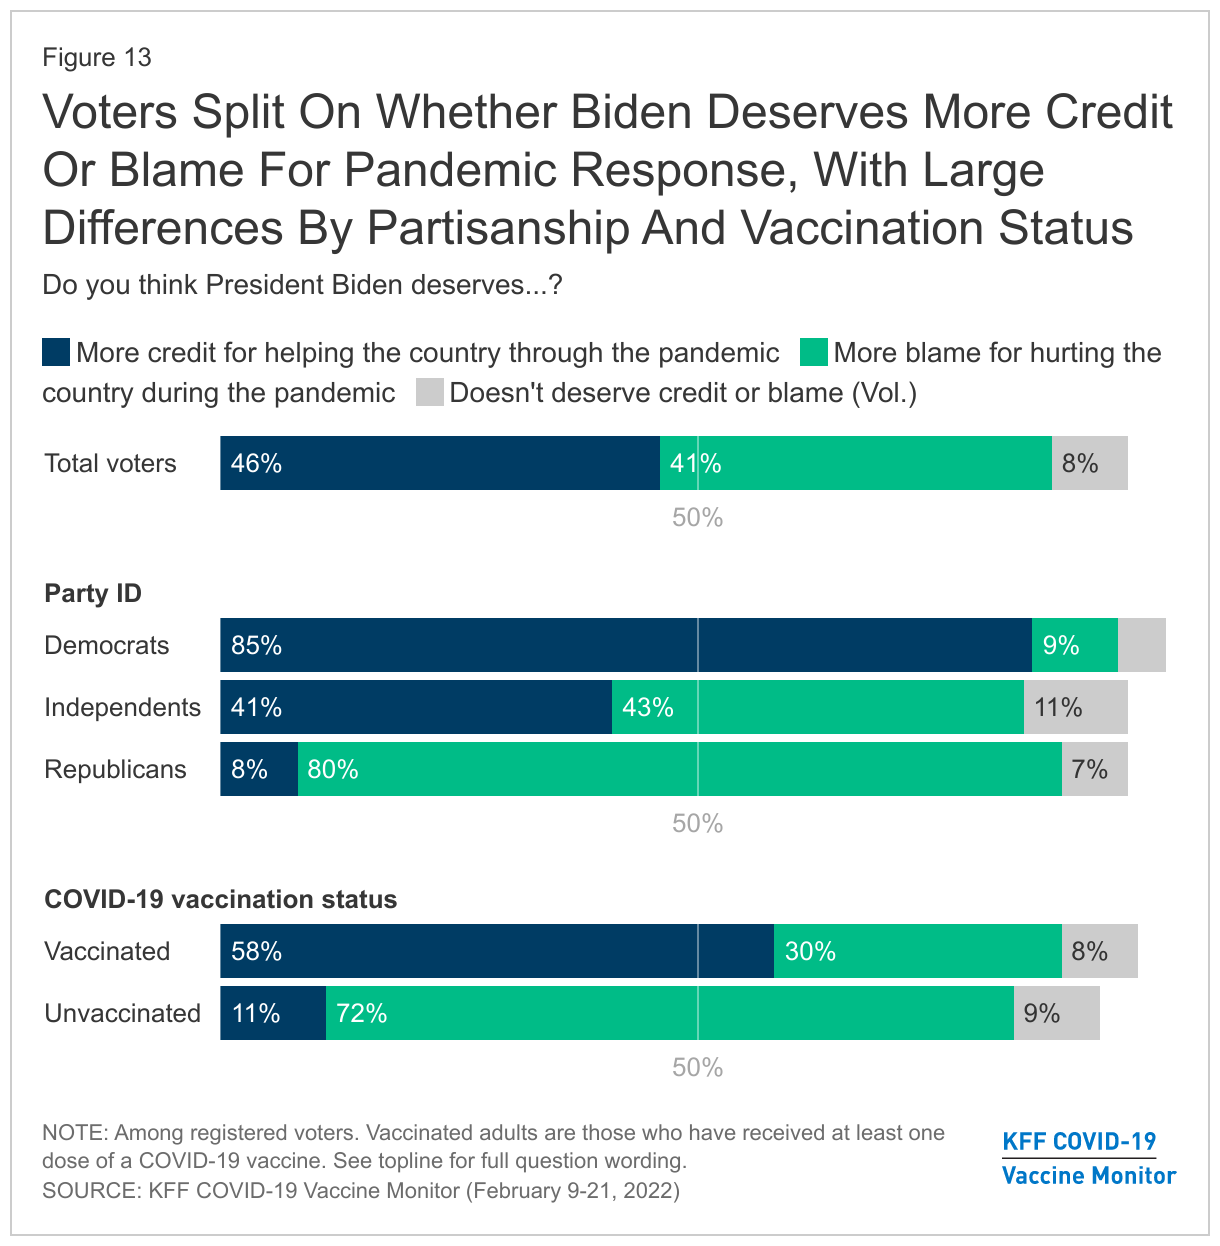
When it comes to President Biden’s handling of the pandemic, 46% of voters say he deserves more credit for helping the country through the pandemic while a similar share say he deserves more blame for hurting the country during the pandemic (41%). Eight in ten Republican voters (80%) say Biden deserves more blame than credit, as do 72% of unvaccinated voters. Democrats and vaccinated voters reflect the opposite view, with 85% and 58% respectively saying that Biden deserves more credit than blame. President Biden also fares better with groups who tend to vote more Democratic including Black voters and those living in urban areas.
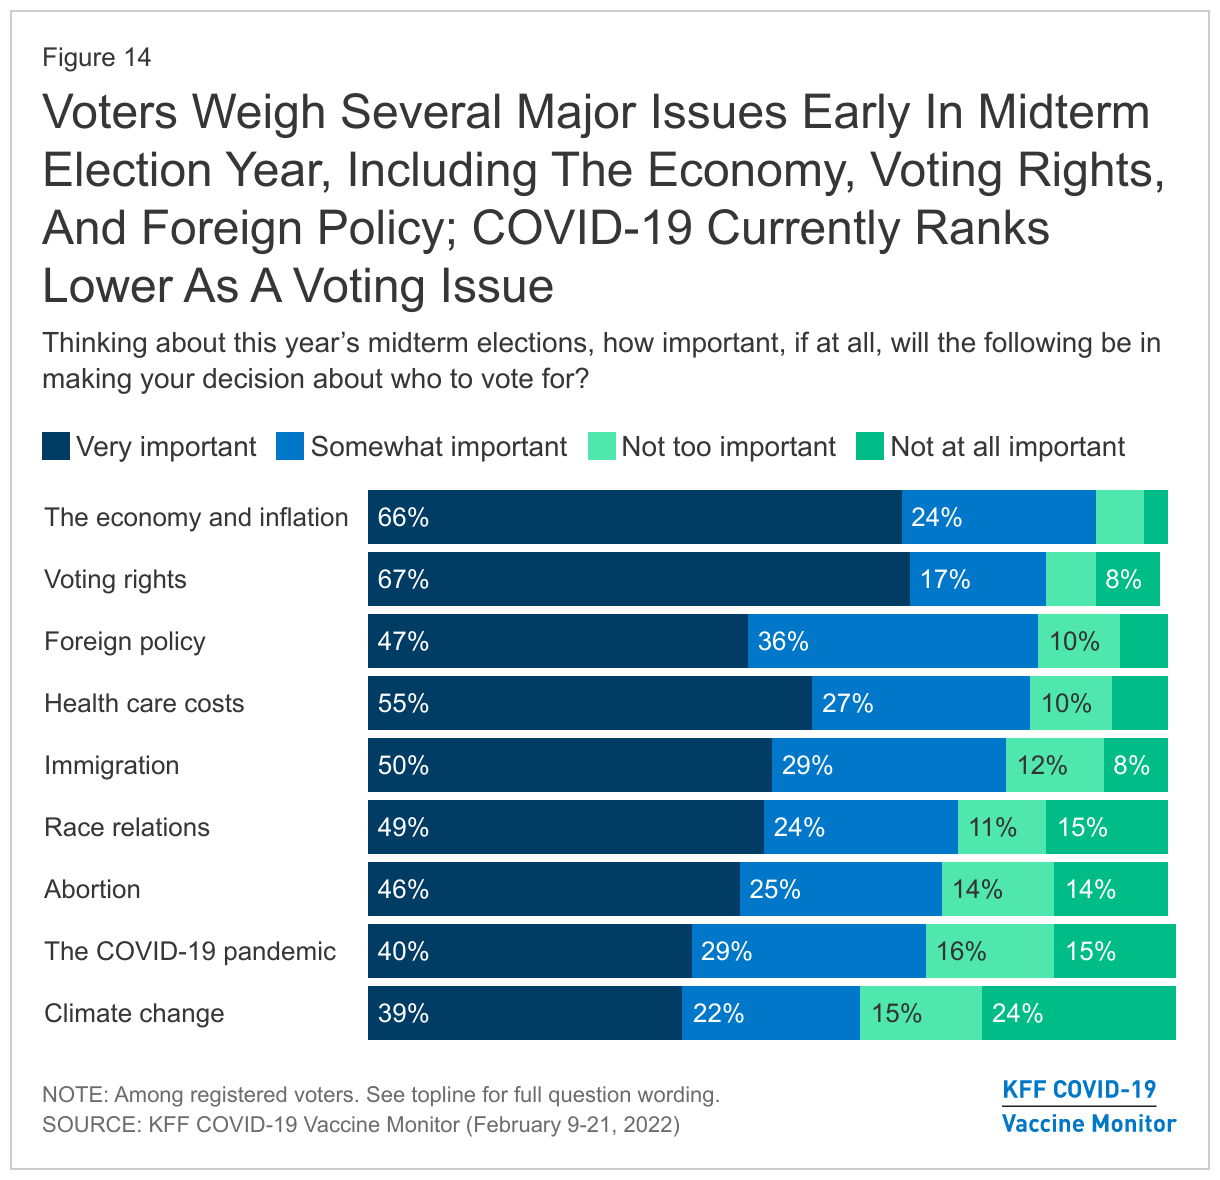
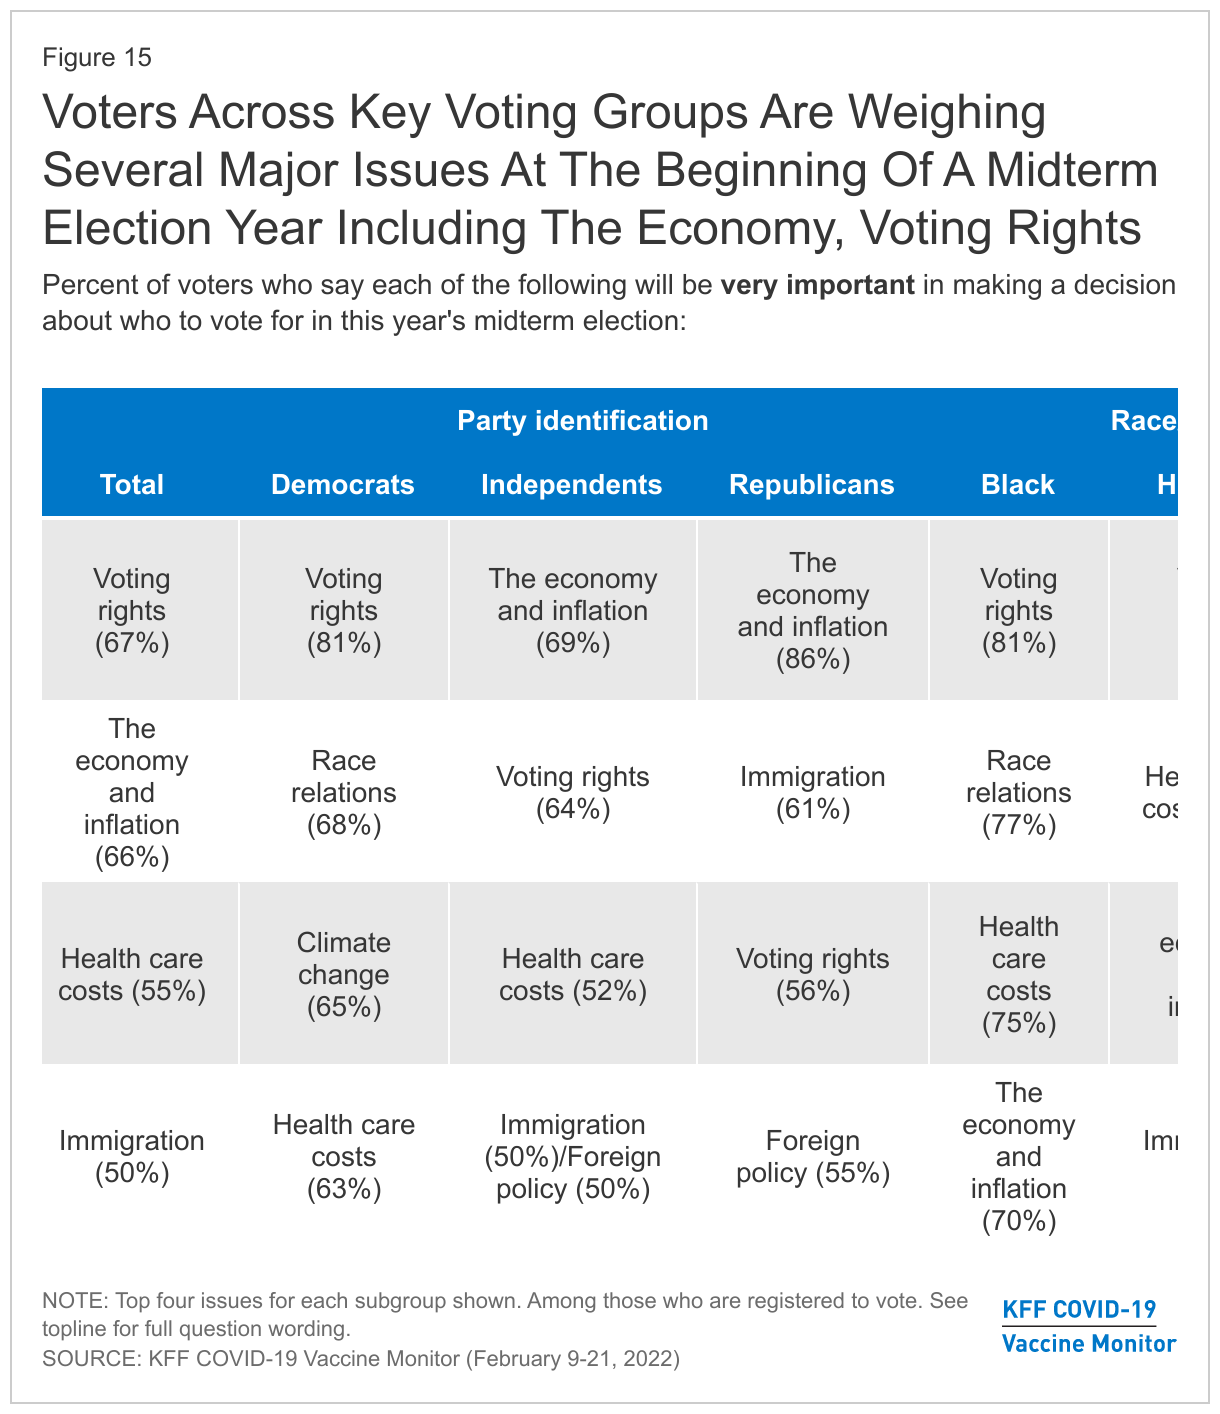
The economy and inflation are top of mind for voters as they begin thinking about the upcoming 2022 midterm elections. A large majority of registered voters (91%) say the economy and inflation will be “very important” or “somewhat important” in deciding who to vote for in this year’s midterm elections. About eight in ten also say voting rights (84%), foreign policy (83%), health care costs (82%), and immigration (79%) will be at least somewhat important to their vote. (The survey was fielded just prior to Russia’s invasion of Ukraine.) Roughly seven in ten say abortion (71%), and COVID-19 (69%) will be important to their vote, while climate change ranks at the bottom of the list with six in ten (61%) voters saying it is important to their vote.
Looking at issues that partisan voters rate as “very important,” the economy/inflation is the top issue for Republican voters with nearly nine in ten (86%) saying it will be “very important” to their vote, while voting rights (81%) is currently top of mind for Democratic voters. Independent voters are focused similarly on the economy and inflation (69%) and voting rights (64%). Partisan voters also differ on the importance of other key domestic issues. For example, Democratic voters are more likely than Republican voters to say race relations (68% vs. 31%), climate change (65% vs. 11%), and health care costs (63% vs. 45%) will be very important to their vote, while Republican voters are more likely to say the same of immigration (61% vs. 40%) and foreign policy (55% vs. 36%). Voting rights are also among the top issues for Black voters (81% say very important) and Hispanic voters (73%). Notably, the COVID-19 pandemic doesn’t break into the top three issues across partisan voting groups.
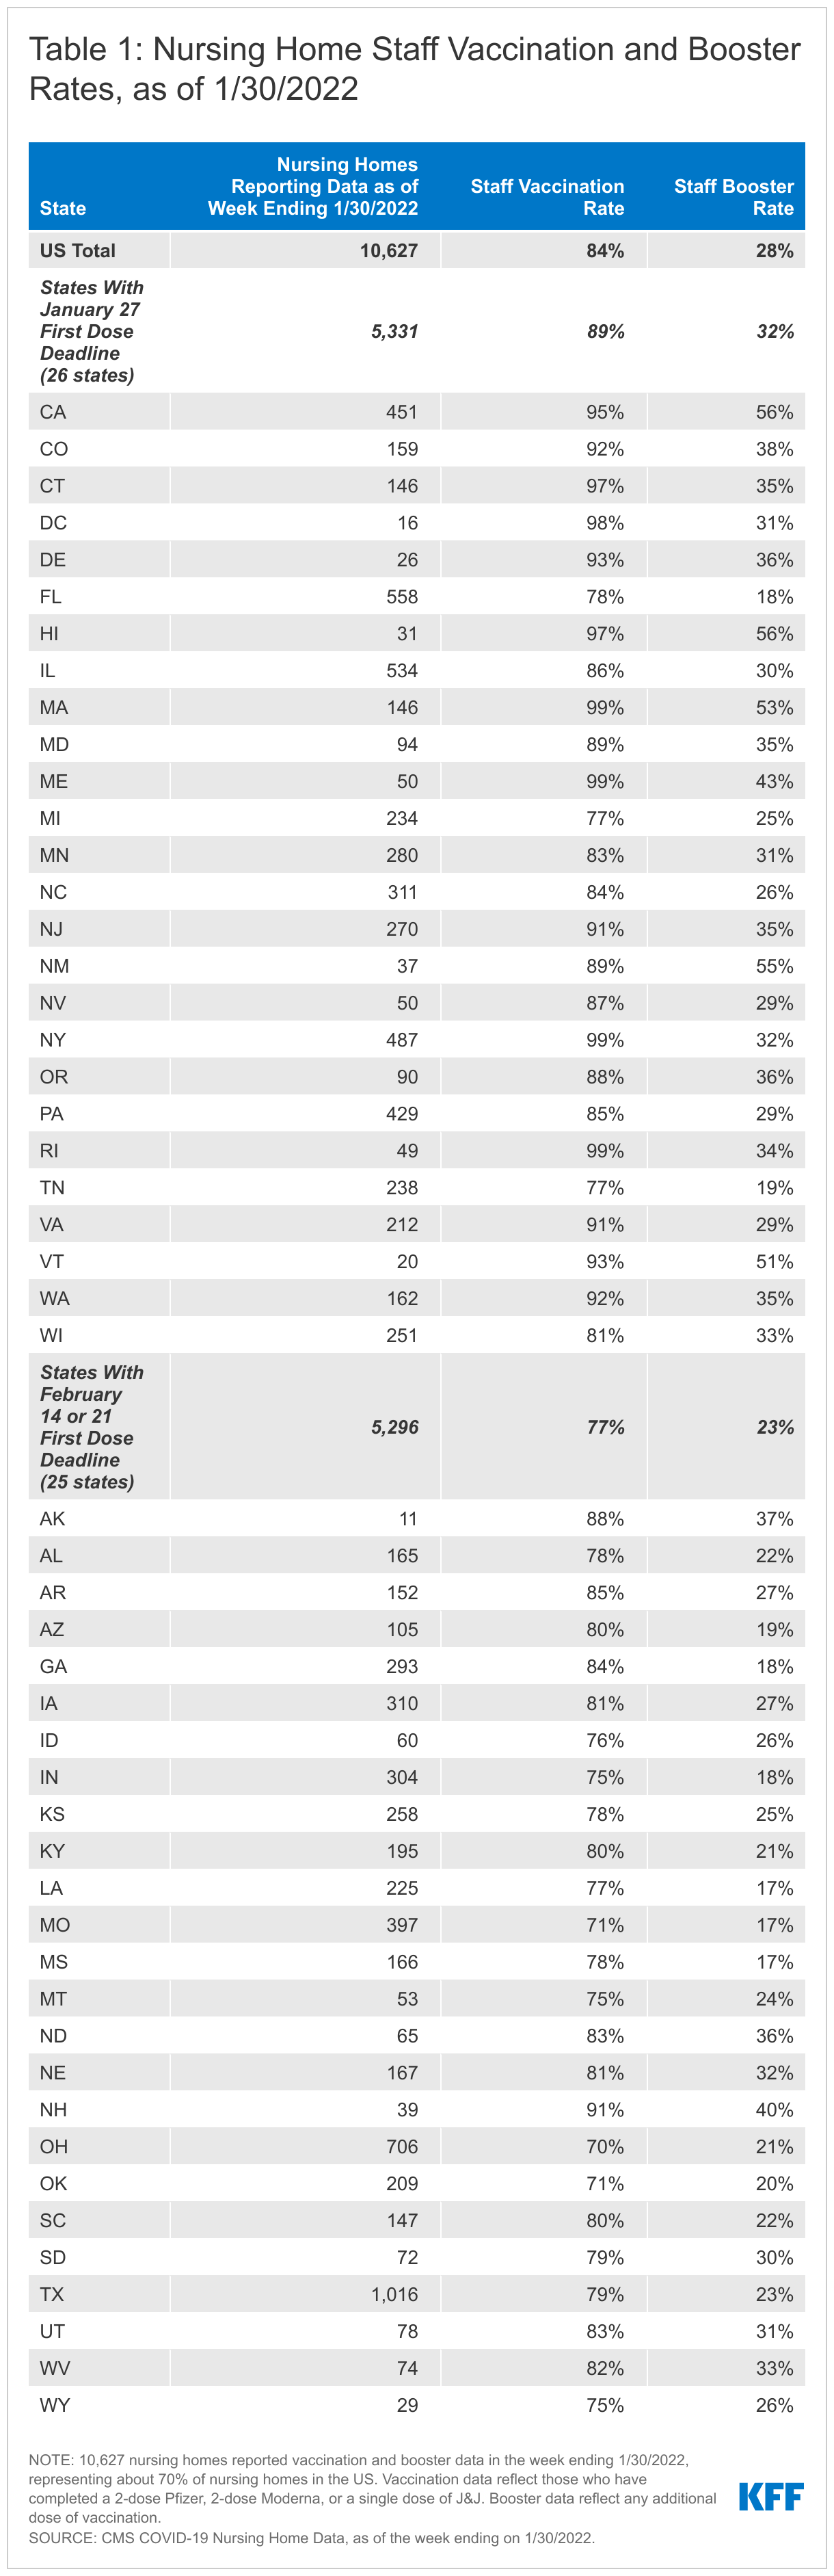
COVID-19 Vaccinations and Booster Uptake
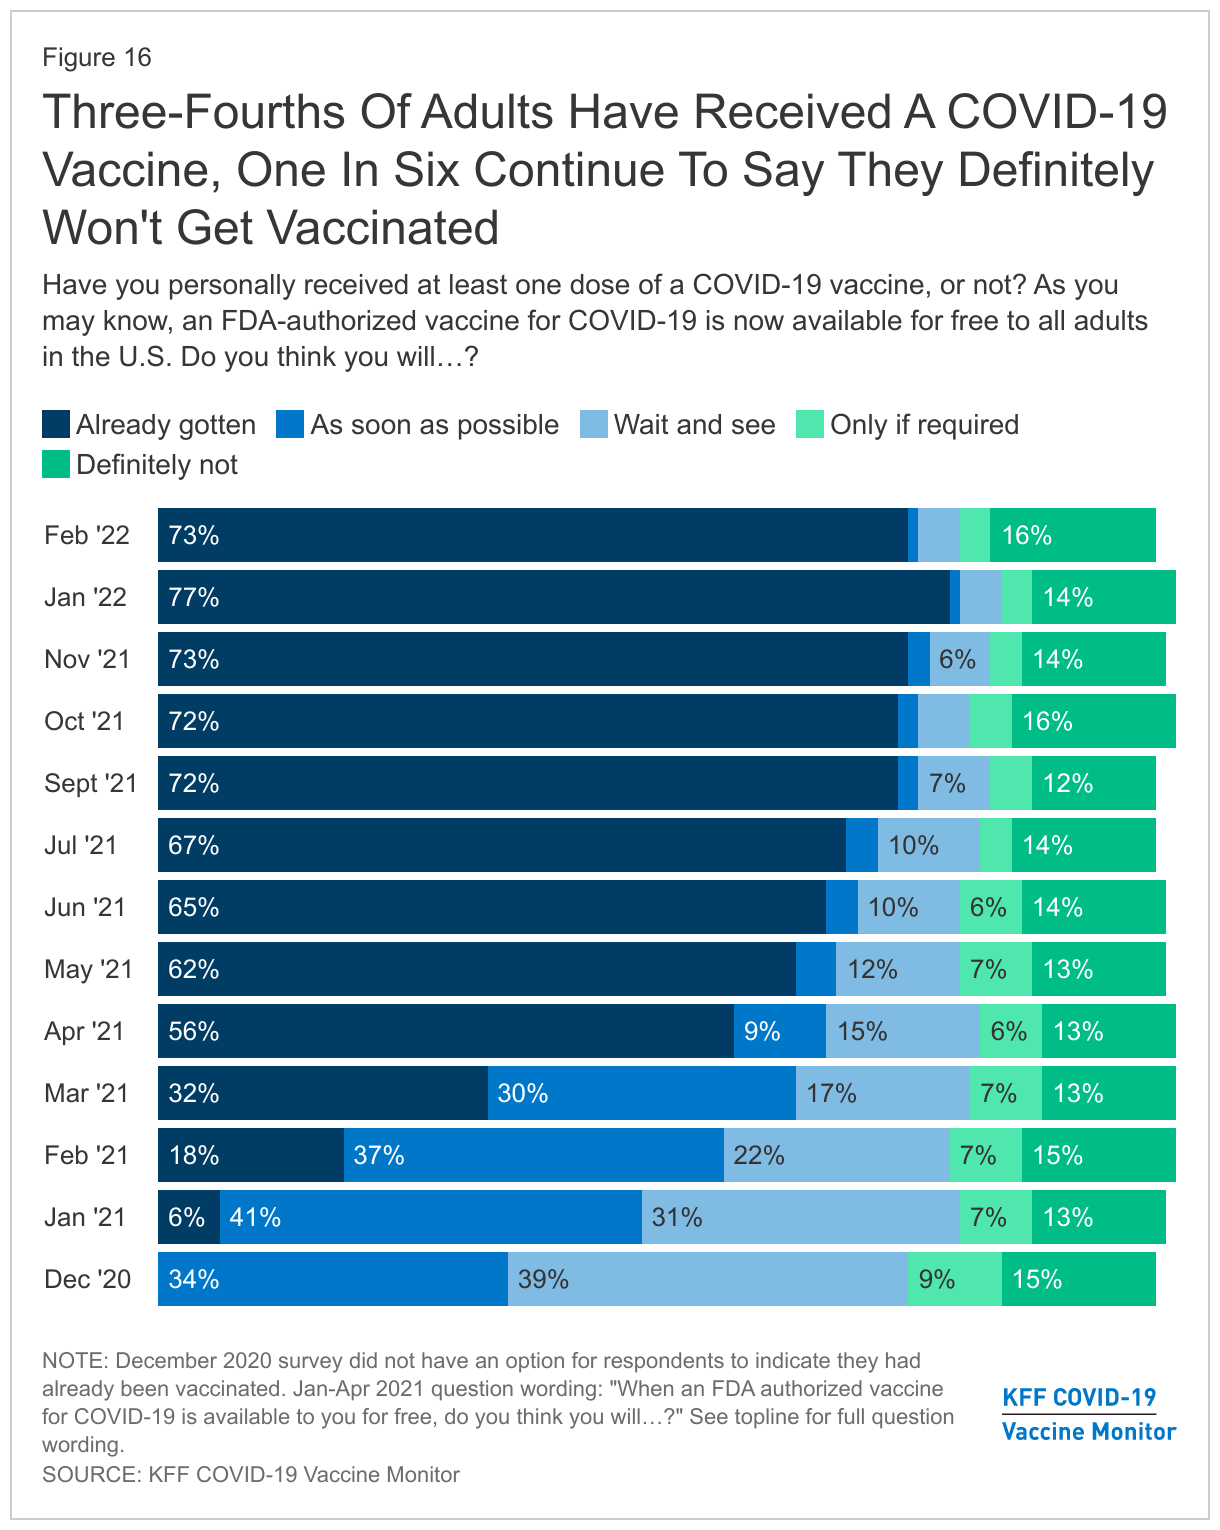
The latest Monitor survey finds that about three-quarters (73%) of adults say they have gotten at least one dose of a COVID-19 vaccine, a share that has held relatively steady since last September. While last month’s survey suggested that initial vaccine uptake may have been inching up among adults amid the omicron wave, that trend does not appear to be continuing with about one-fourth of adults remaining unvaccinated including one in six who say they will “definitely not” get vaccinated.
Nearly half of adults now report they have received a booster dose (47%) with partisanship continuing to play an outsized role in vaccination and booster intent. Nearly three-fourths of Democrats reporting being vaccinated and having received a booster dose (72%), compared to 44% of independents and one-fourth (27%) of Republicans.
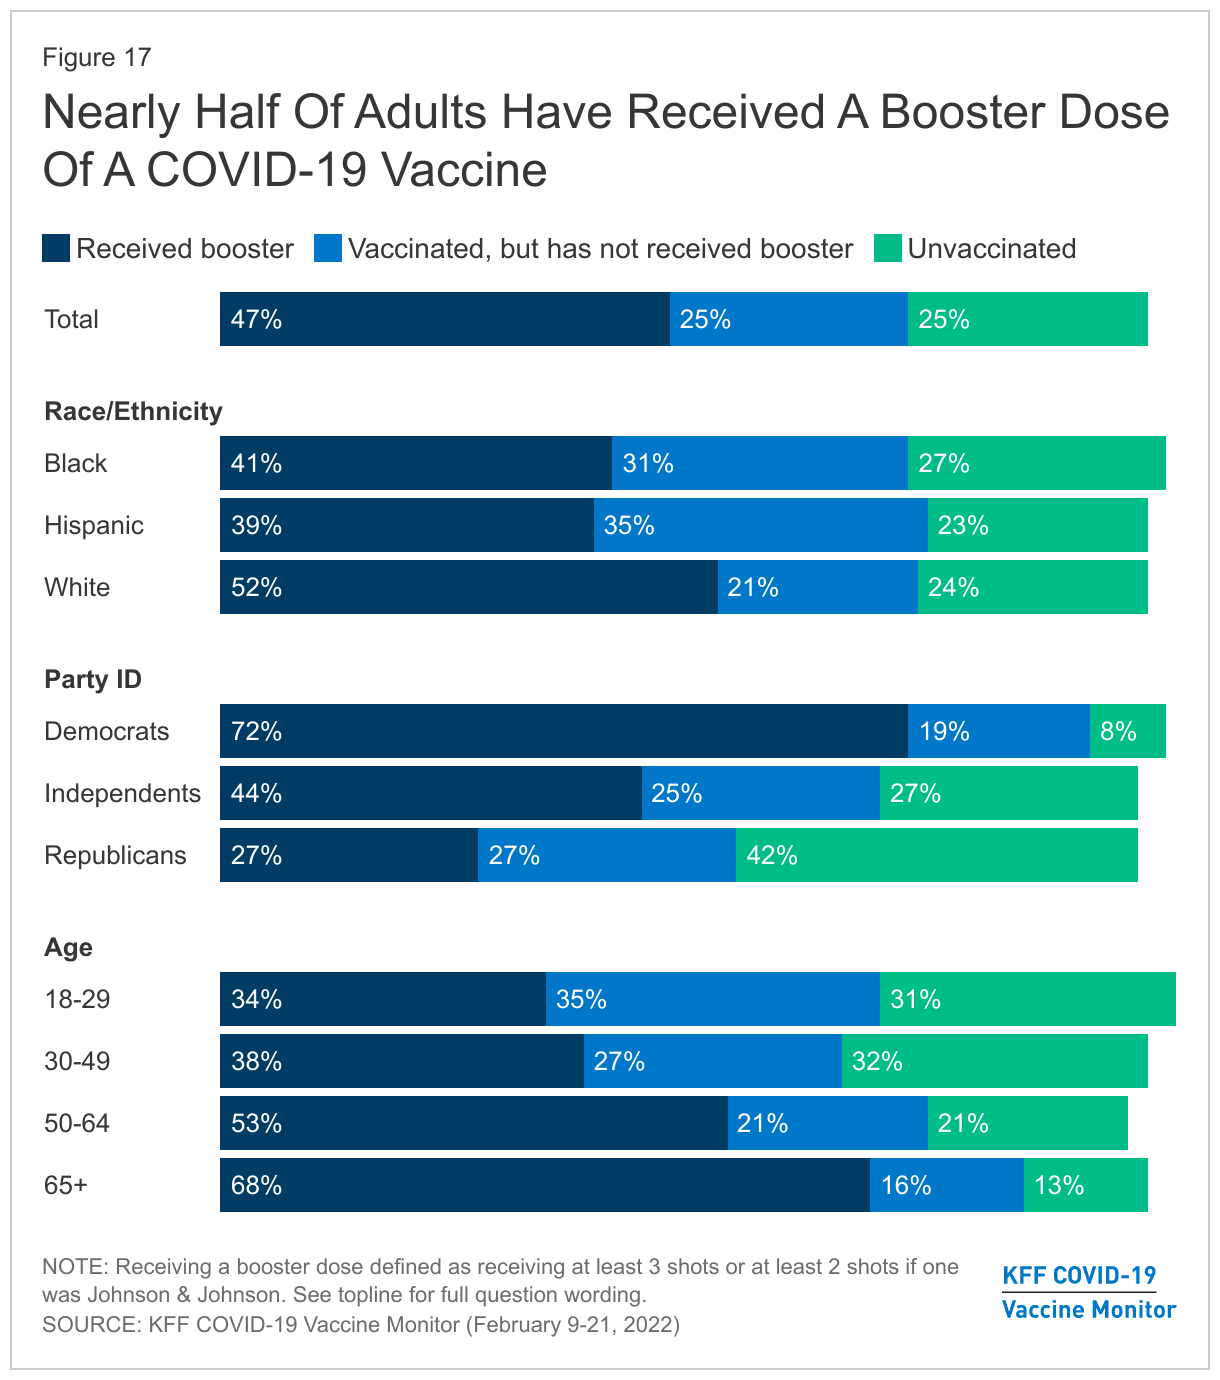
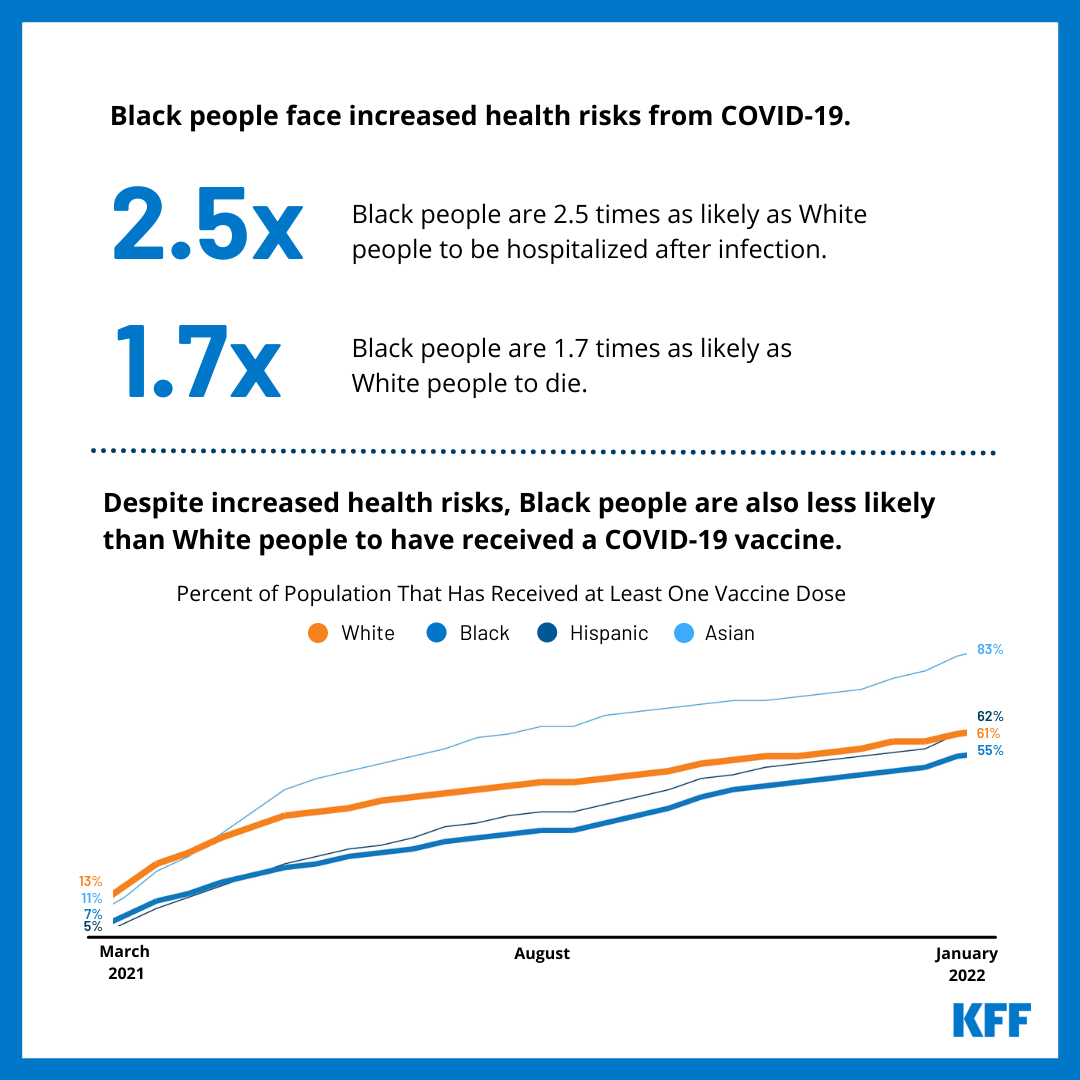
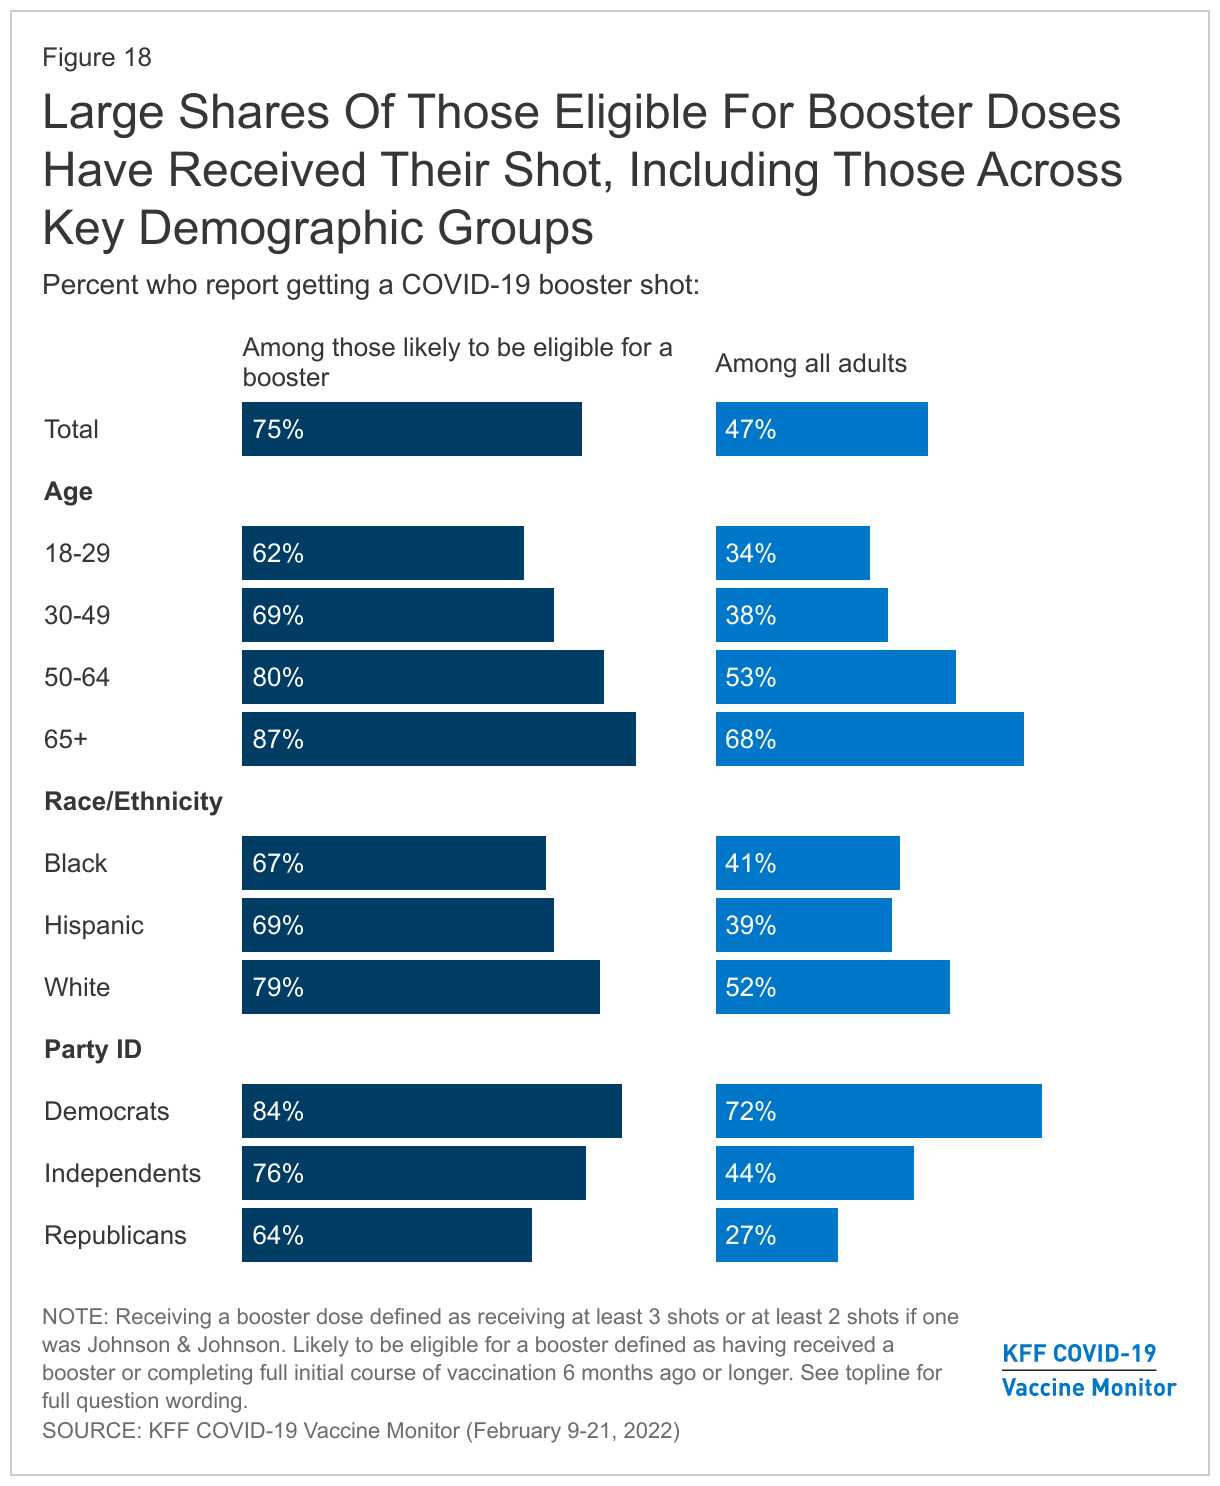
Black adults (41%) and Hispanic adults (39%) continue to lag behind White adults (52%) in the share who have gotten a booster dose of a COVID-19 vaccine as do younger adults and those earning lower levels of income. These population groups were also some of the later groups to receive an initial vaccination and therefore, larger shares of them are not yet eligible for a booster dose. Among those likely eligible for a booster, at least six in ten across age groups, racial and ethnic identities, and party identification have received a booster dose. White adults continue to outpace Black adults and to a lesser degree, Hispanic adults, in receiving a booster dose even among those likely eligible for a shot.
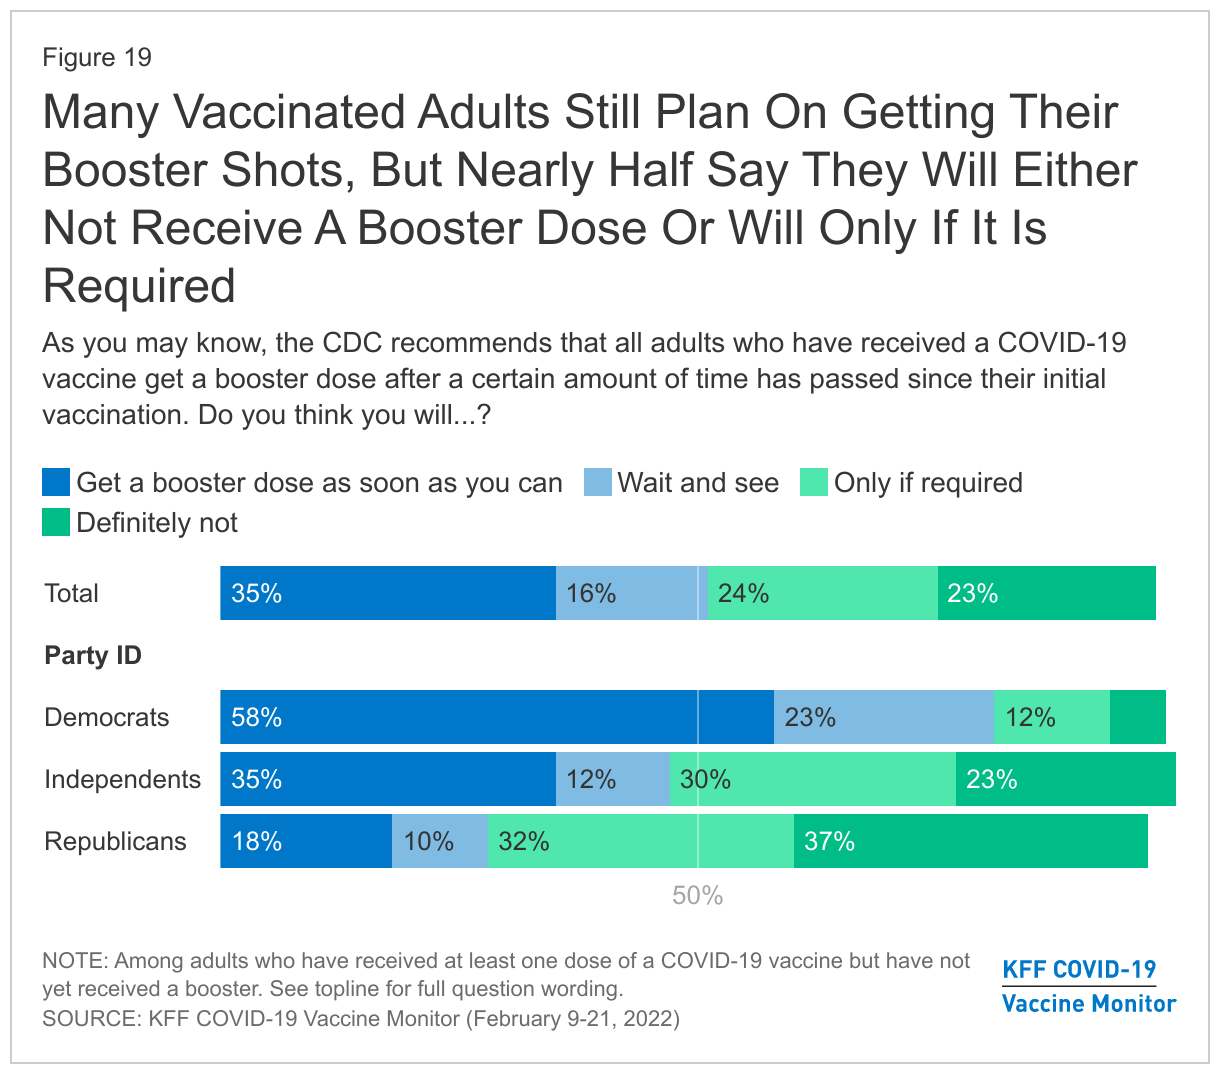
Among vaccinated adults who have not yet received a booster dose, more than one-third continue to say they plan to get an additional dose “as soon as they can,” while 16% say they want to “wait to see” how the booster is working for other people before they decide to get an additional dose. About half of vaccinated adults who have not yet received a booster dose say they will “only get it if required” or say they will “definitely not” get a booster shot, including more than two-thirds of Republicans (68%), half of independents (53%), and one in five Democrats (18%).
Parents’ Vaccination Intentions For Their Children, Views Of Vaccine Requirements In Schools
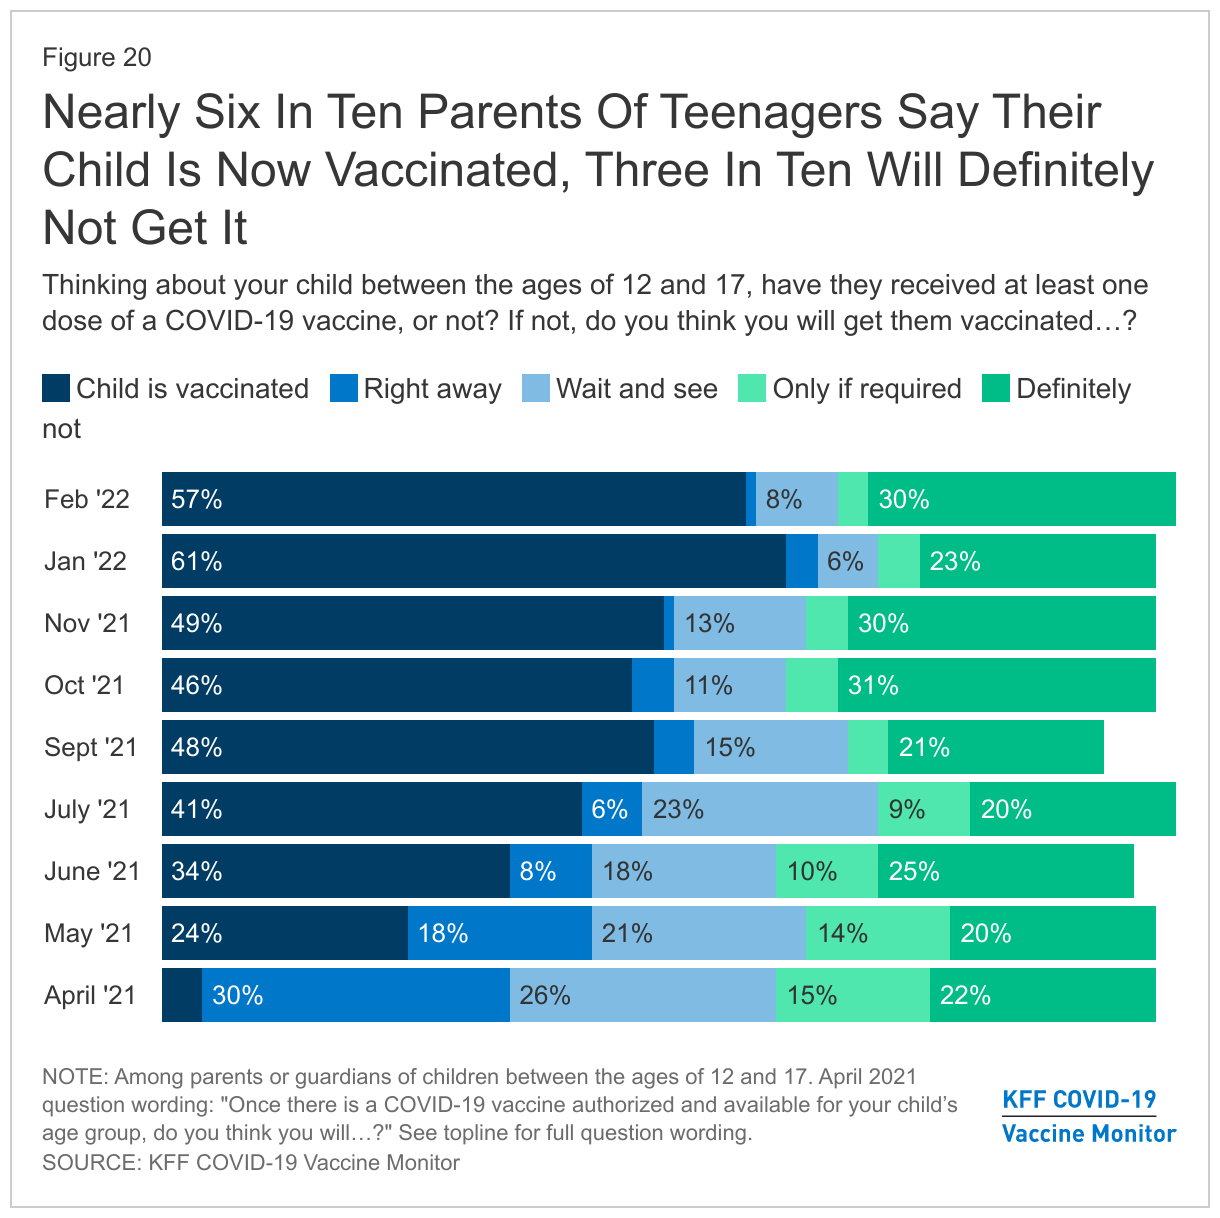
Parents’ intentions to vaccinate their children have remained relatively steady over the past month. About six in ten parents of teenagers, ages 12-17, say their child has been vaccinated (57%), with an additional one in ten who say they will either get them vaccinated right away (1%) or want to “wait and see” (8%) before deciding. The remaining share (about a third of parents of 12-17 year-olds) say they will definitely not get their child vaccinated (30%) or will only get them vaccinated if it is required (3%).
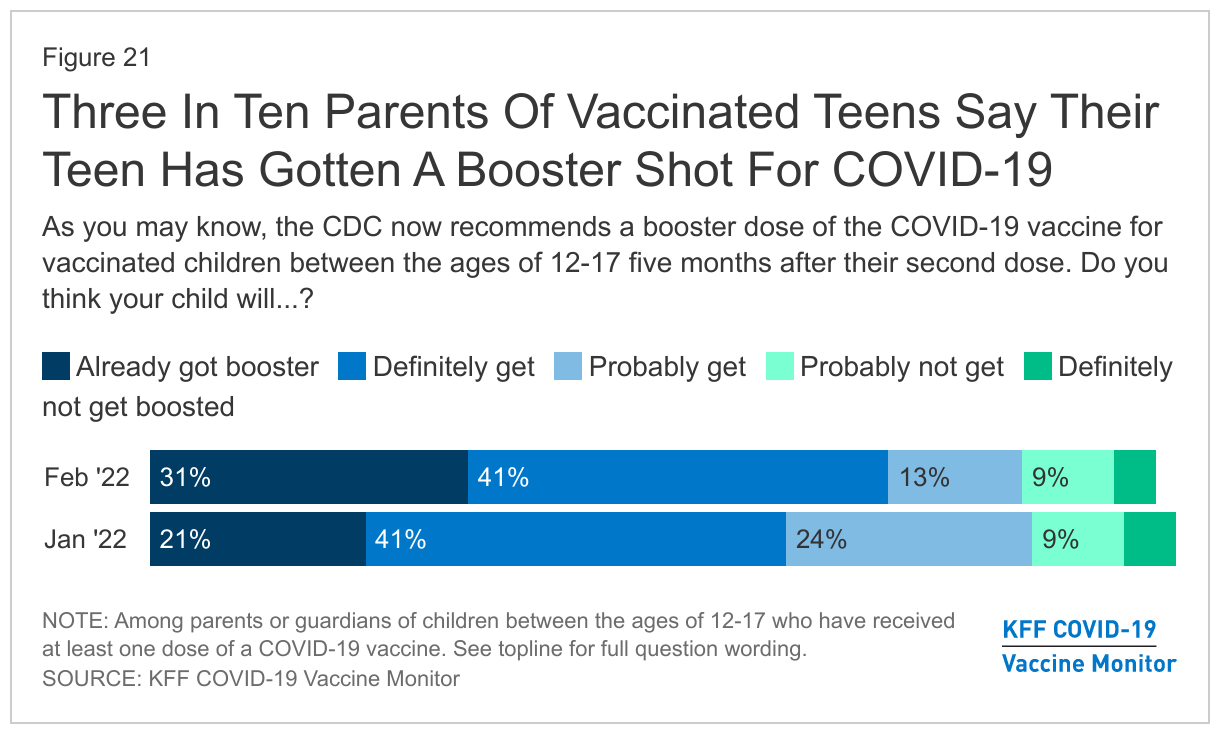
With COVID-19 booster shots recently approved for children between the ages of 12-17, 31% of parents of vaccinated teenagers now report that their teen has received a COVID-19 booster dose. Most parents of vaccinated teenagers say their teen has already gotten a booster dose or that they will definitely (41%) or probably (13%) be getting one – only about one in seven (14%) say their teenager will “probably not get” or “definitely not get” a booster shot.
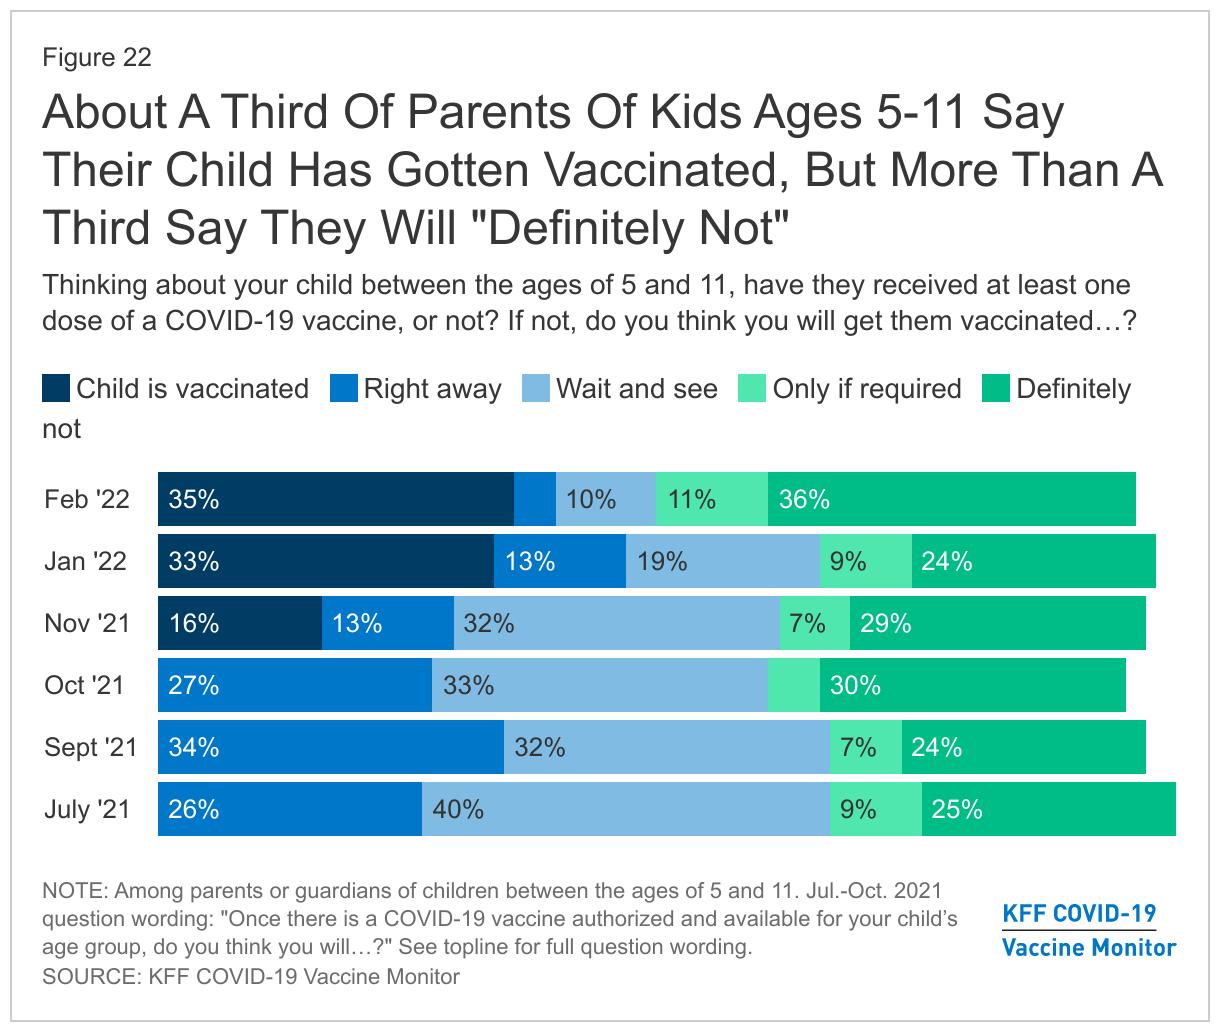
About a third of parents of kids ages 5-11 now report their child has gotten vaccinated (35%). A small share now say they will get their child vaccinated right away (4%), while one in ten parents of 5-11 year-olds still want to wait and see. The latest survey suggests there is some trepidation among parents of younger kids with nearly half of them saying they either will only get them vaccinated if required (11%) or saying they definitely won’t get their 5-11 year-old vaccinated (36%).
Concern and Confusion Among Parents Of Children UNDER age Five
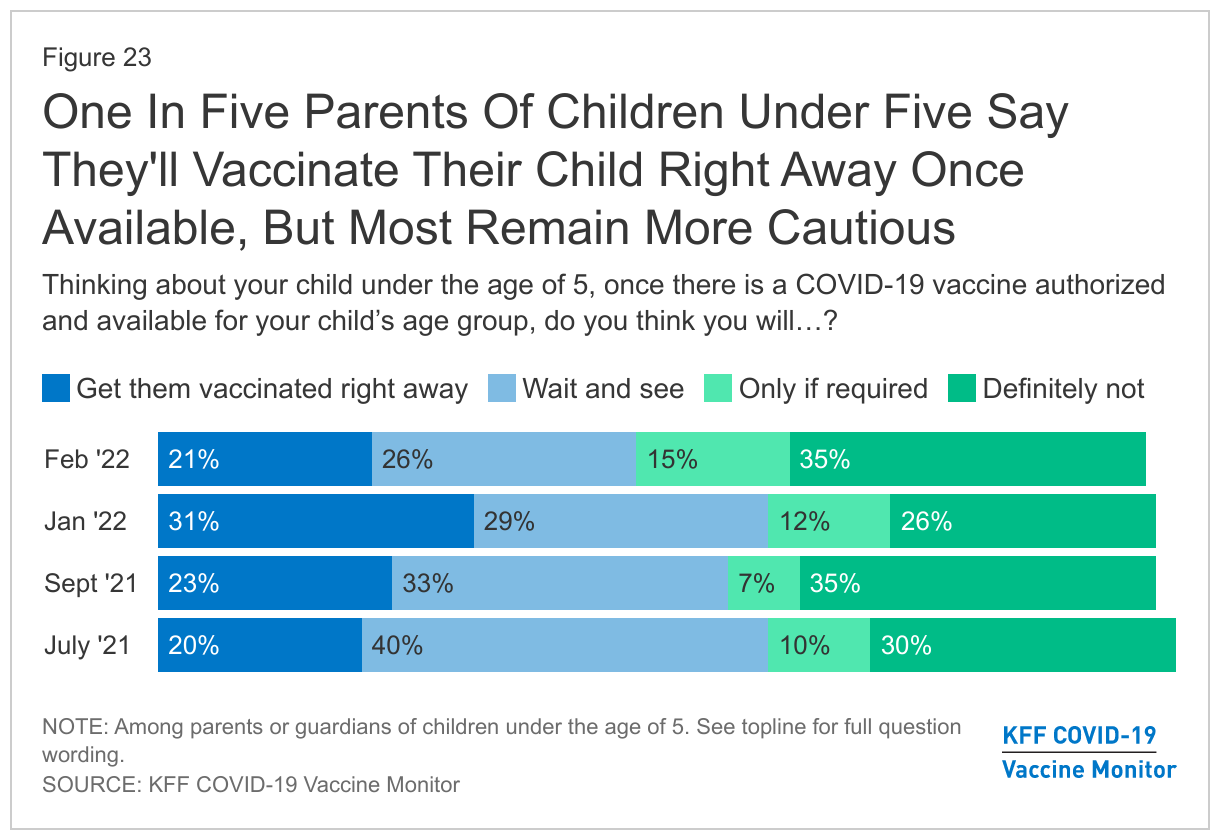
Amid Pfizer’s decision to postpone their FDA request to authorize a COVID-19 vaccine for children ages 6 months to 4 years due to the need for more research on whether are necessary to produce a sufficient immune response in young children, one in five parents of children under 5 (21%)1 now say they’ll get their child vaccinated right away once a COVID-19 vaccine is authorized for their age group. A quarter of parents (26%) report they’ll wait and see before getting their young child vaccinated, 15% will only get them vaccinated if required, and 35% definitely won’t get them vaccinated.
A majority of parents of children under five say they don’t have enough information about the safety and effectiveness of COVID-19 vaccines for children under five (57%). On the other hand, majorities of parents of children ages 12-17 and 5-11, groups that have already received FDA authorization for COVID-19 vaccines, say they have enough information about the safety of vaccines for their age groups – with 66% parents of kids ages 12-17 saying they have enough information and 61% parents of kids ages 5-11.
In addition, four in ten (39%) parents of kids under age five say the information from federal health agencies about the COVID-19 vaccine for that age group is confusing while 52% say the information is clear.
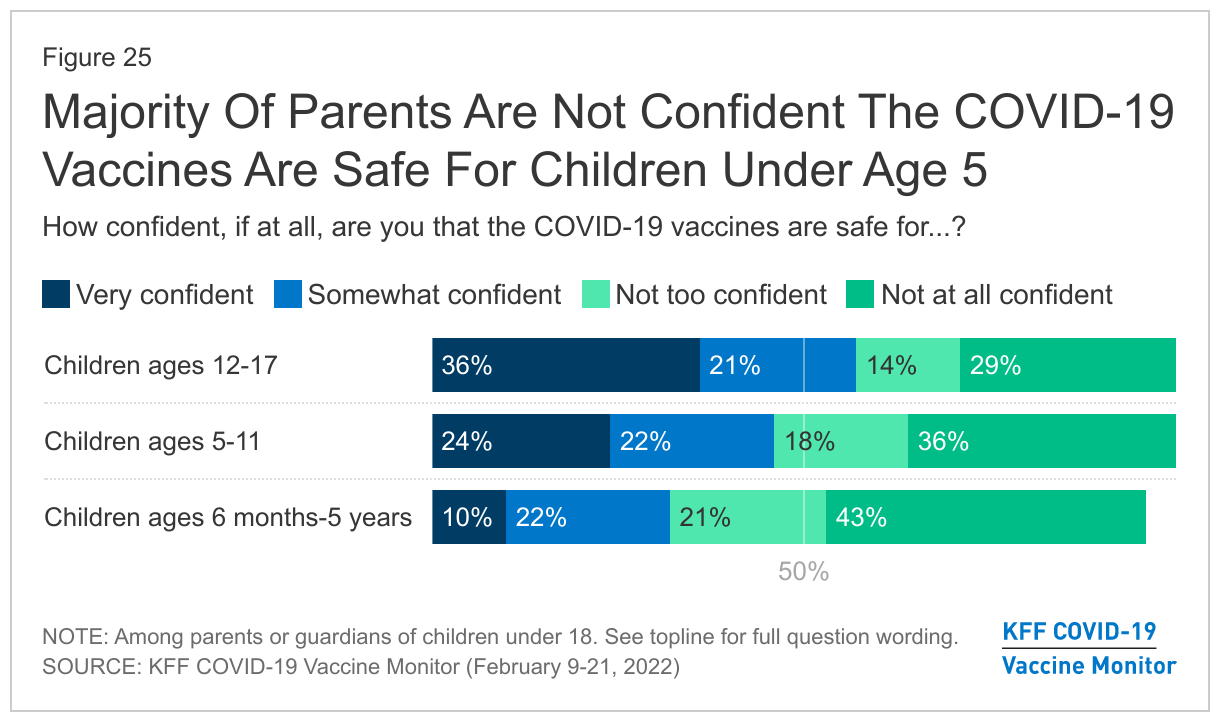
Reflecting vaccine intentions among parents of children from different age groups, parents of teenagers express the most confidence in the safety of the vaccines for their kids. Over half of parents say they are confident in the safety of the COVID-19 vaccines for children ages 12-17 (57%), many of whom have already been vaccinated. Fewer parents (45%) are confident in the safety of the vaccines for children ages 5-11, while 32% say they are confident the COVID-19 vaccines are safe for children under the age of 5. Majorities of parents say they are not confident in the safety of the vaccines for children under five (64%) and ages 5-11 (54%).
Vaccine Requirements in Schools
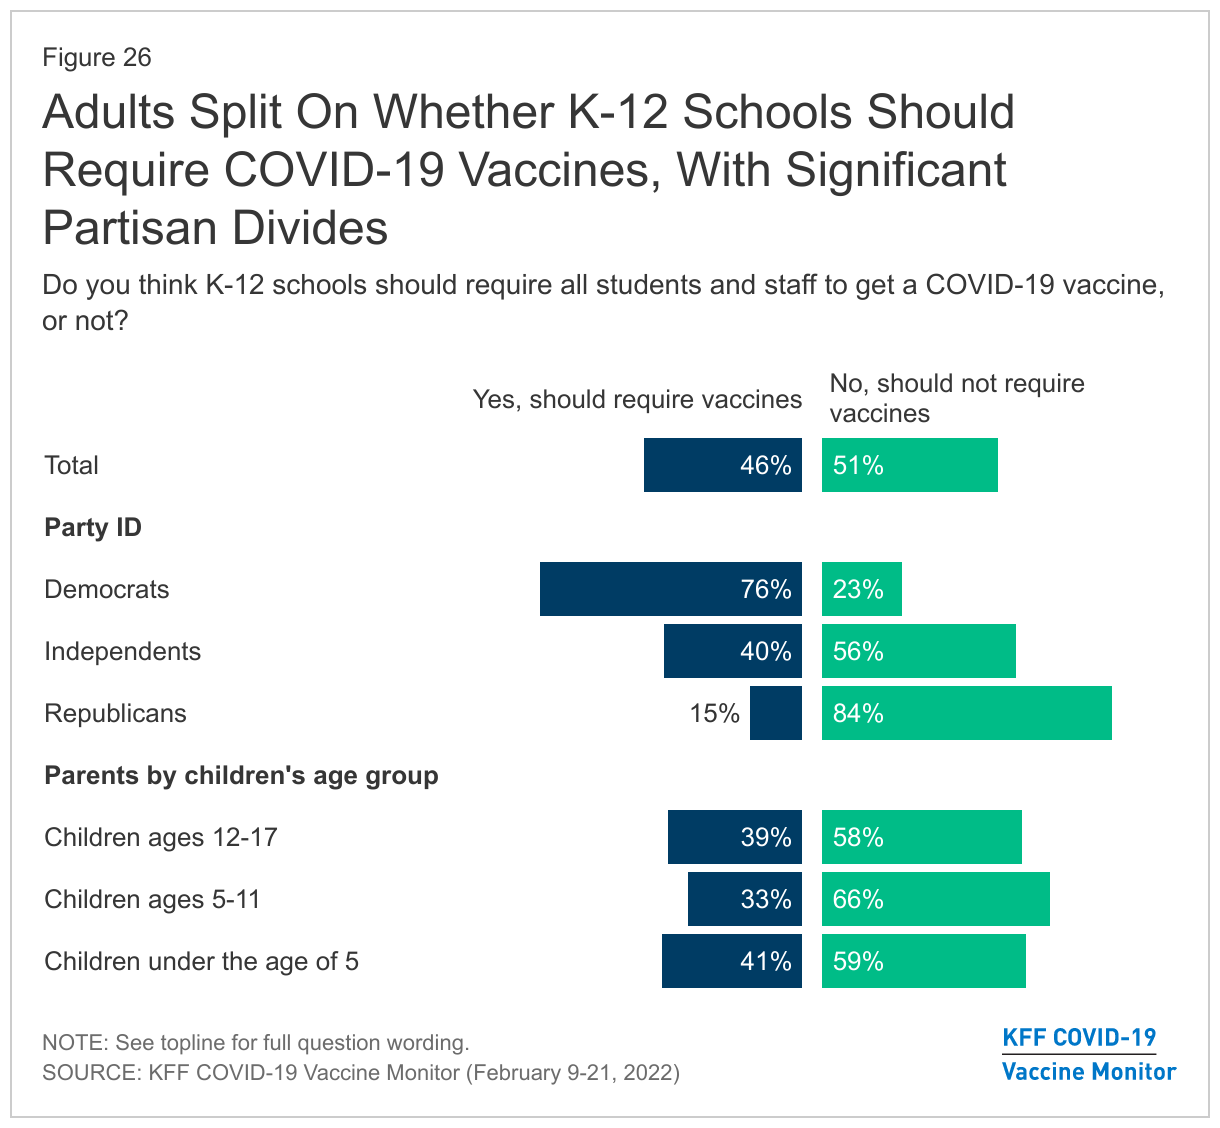
The public is divided on whether K-12 schools should require their staff and eligible students to get a COVID-19 vaccine, with similar shares saying schools should (46%) and should not (51%) require vaccines. Three-fourths of Democrats (76%) say schools should require COVID-19 vaccinations while more than eight in ten Republicans (84%) say schools should not. Independents are more likely to say school should not require COVID-19 vaccines (56%) than to say they should be required (40%). Six in ten parents say schools should not require vaccines including majorities of parents of teens ages 12-17 (58%), children 5 to 11 years old (66%), and children under age 5 (59%).