KFF designs, conducts and analyzes original public opinion and survey research on Americans’ attitudes, knowledge, and experiences with the health care system to help amplify the public’s voice in major national debates.
With funding for additional COVID-19 support at a stalemate in Congress, a new KFF analysis looks at potential scenarios that United States might face if a 4th COVID-19 vaccine dose is recommended to the public. The analysis finds that the U.S. government does not have enough funding to purchase vaccine doses remaining to fully cover the population under any of the predicted scenarios.
If 4th doses are authorized and recommended for all ages, there will be a deficit of almost half a billion doses to cover everyone, including fully vaccinating those not yet up to date with their vaccinations. If 4th doses are provided only to people ages 65 and older, the deficit would be 162.5 million doses with the current supply.
Under a scenario where enough doses are purchased to vaccinate 70% of the population, the U.S. would still experience a vaccine supply deficit of 118.3 million doses to provide 4th doses to people of all ages.
Currently, there are only enough doses in the existing supply to provide 70% of those ages 65 and older with a 4th dose. To date, 65% of the U.S. population has been fully vaccinated.
The additional funding necessary to accommodate a 4th dose ranges from about half a billion dollars to over $9 billion, depending on the recommendations for different age groups and whether the doses are for the lower-priced Moderna vaccine or the higher-priced Pfizer shot.
Update: On March 29, 2022, the Food and Drug Administration (FDA) authorized a second booster dose (4th dose) for those ages 50 and older (and for immunocompromised individuals). We have added the 50+ scenario to our analysis.
With Congress having reached a funding stalemate regarding additional COVID-19 support, the White House has said that the federal government “does not have adequate resources to purchase enough booster vaccine doses for all Americans, if additional doses are needed.” We sought to assess this by estimating how far the current U.S. supply of COVID-19 vaccines could stretch under different scenarios. To do so, we looked at the number of COVID-19 vaccine doses the federal government has already purchased, the number of people already vaccinated and boosted. We then estimated the number of additional doses that would be required to fill any gaps needed to reach vaccination targets, including to fully vaccinate those who still haven’t completed a primary series, under different assumptions about further booster coverage with 3rd and 4th doses. We assumed that primary vaccination will soon be authorized for all ages, and examined the future supply of mRNA vaccine doses only (i.e., Johnson and Johnson doses were not included). We assessed the following four scenarios:
Providing a 4th dose to those ages 50 and older
Providing a 4th dose to those ages 65 and older
Providing a 4th dose to those ages 18 and older
Providing a 4th dose to all ages
For each scenario, we looked at supply needed to purchase enough doses to reach two vaccine coverage targets: 70% and 100%. Data are as of March 20, 2022 (see methods for sources and additional details).
Findings
We find that the federal government does not have enough vaccine doses remaining in its current supply to fully cover the U.S. population with a 4th dose under any of these scenarios.
The deficit between current supply and doses required is most acute (484 million doses) if a 4th dose is authorized for all ages and enough doses are purchased to cover 100% of the population. However, a deficit still exists even if 4th doses are needed only for those ages 65 and older (162.5 million doses), as well as for the larger age group of people 50 and older (a deficit of 225 million doses), as authorized by the FDA on March 29..
When a 70% population coverage target is used instead, there is still a supply deficit (118.3 million doses) if 4th doses are purchased for those of all ages, and a modest deficit to reach 70% of those ages 18 and older with a 4th dose (34 million). There are enough doses to cover 70% of those ages 65 and older with a 4th dose as well as 70% of those ages 50 and older.
Based on the lowest available prices paid per dose by the U.S. government for domestic vaccine supply ($15.00/dose for Moderna and $19.50 for Pfizer), we estimate that additional funding required ranges from $509.5 million (if all future doses were Moderna and enough were purchased to reach 70% coverage of those 18 and older with a 4th dose) to $9.4 billion (if all future doses were Pfizer and enough were purchased to reach 100% of all ages with a 4th dose).
With the FDA authorizing a 4th dose for those ages 50 and older, our analysis finds that the U.S. government currently has purchased enough vaccine doses for 70% of this age group to receive a 4th dose, and for completing vaccination for others. While the government does not have enough doses to cover all those ages 50 and older, it is also unlikely that 4th dose take-up will approach 100% of the population anytime soon. If 4th dose authorization is further expanded, potential supply constraints will grow.
Table 1: Number of Additional COVID-19 Vaccine Doses Needed by Scenario and Coverage Target
Scenario
70% Coverage
100% Coverage
4th dose to 50+
240,419,688
528,522,614
4th dose to 65+
196,460,245
465,723,410
4th dose to 18+
337,162,096
666,726,055
4th dose to all ages
421,517,894
787,234,338
Table 2: Number of Surplus/Deficit COVID-19 Vaccine Doses by Scenario and Coverage Target
Scenario
70% Coverage
100% Coverage
4th dose to 50+
62,775,437
(225,327,489)
4th dose to 65+
106,734,880
(162,528,285)
4th dose to 18+
(33,966,971)
(363,530,930)
4th dose to all ages
(118,322,769)
(484,039,213)
Methods
We calculated the number of people who would need to be vaccinated in the U.S. to reach 70% and 100% vaccine coverage by age group. We compared these levels to the number who had already completed a primary COVID-19 vaccine series (if they received two doses of the two-dose mRNA series or one dose of a single-dose vaccine), and the number who had received a 3rd dose (booster) by age group. We then looked at the additional doses needed for four scenarios: (1) providing a 4th dose to those ages 50 and older 2) providing a 4th dose to those ages 65 and older; (3) providing a 4th dose to those ages 18 and older; and (4) providing a 4th dose to all ages. For each scenario, we assessed the number of doses needed to complete the primary vaccine series and, for scenarios 1-3, the number of doses needed to provide a third dose to all those ages 12 and older, as is currently recommended by CDC, before adding a 4th dose. For scenario 4, we assumed a 3rd dose would be recommended for all ages. For each of the 4 scenarios, we examined both 70% and 100% coverage targets, resulting in 8 distinct supply requirement outcomes. We then compared the number of additional doses needed in each supply outcome to the number of doses remaining in the current U.S. vaccine supply, and determined the amount of supply surplus or deficit. We assumed that any doses already delivered (whether administered yet or not) were no longer available for purposes of the remaining supply. We also did not include remaining J&J vaccines in the available future supply and we removed Moderna doses already provided for international use from the available supply. Finally, we estimated the potential cost of purchasing additional doses if more were needed. We used the estimated price paid per dose for Moderna and Pfizer vaccines using the lowest available price per dose estimate paid to date among supply contracts. Data on the size of the U.S. population by age group were obtained from the U.S. Census. Data on the number of U.S. vaccine doses purchased and estimated price per dose were obtained from official U.S. government, pharmaceutical company releases, and the UNICEF COVID-19 Vaccine Market Dashboard. Data on the number of vaccine doses delivered and number of people vaccinated were obtained from the CDC COVID Data Tracker and are current as of March 20, 2022.
Over two years into the COVID-19 pandemic, many people continue to grapple with worsened mental health associated with social distancing, income loss, and death and illness. Roughly one-third (32%) of adults in the United States reported symptoms of anxiety and/or depressive disorder in February 2022. Among these adults, 27% reported having unmet mental health care needs.
In this data note, we explore how the use of mental health care varied across populations reporting poor mental health before the pandemic using data from the National Health Interview Survey (NHIS) in 2019. The 2019 NHIS data included detailed questions on symptoms of anxiety and depression. These questions were not asked on the 2020 survey, so pandemic-era NHIS data will not be available until the 2021 survey is released later this year.
In this analysis, we find that leading up to the pandemic, 8.5 million adults reported moderate to severe symptoms of anxiety and/or depression but did not receive treatment either through therapy or prescription drugs in the past year. Among adults reporting moderate to severe symptoms of anxiety and/or depression, receipt of mental health treatment was lowest among several demographic groups – including young adults, Black adults, men, and uninsured people. These data provide a useful baseline for understanding disparities in mental health treatment that were already present before the pandemic, and may have been exacerbated by the public health crisis.
How many adults report symptoms of anxiety/depression and receipt of treatment overall?
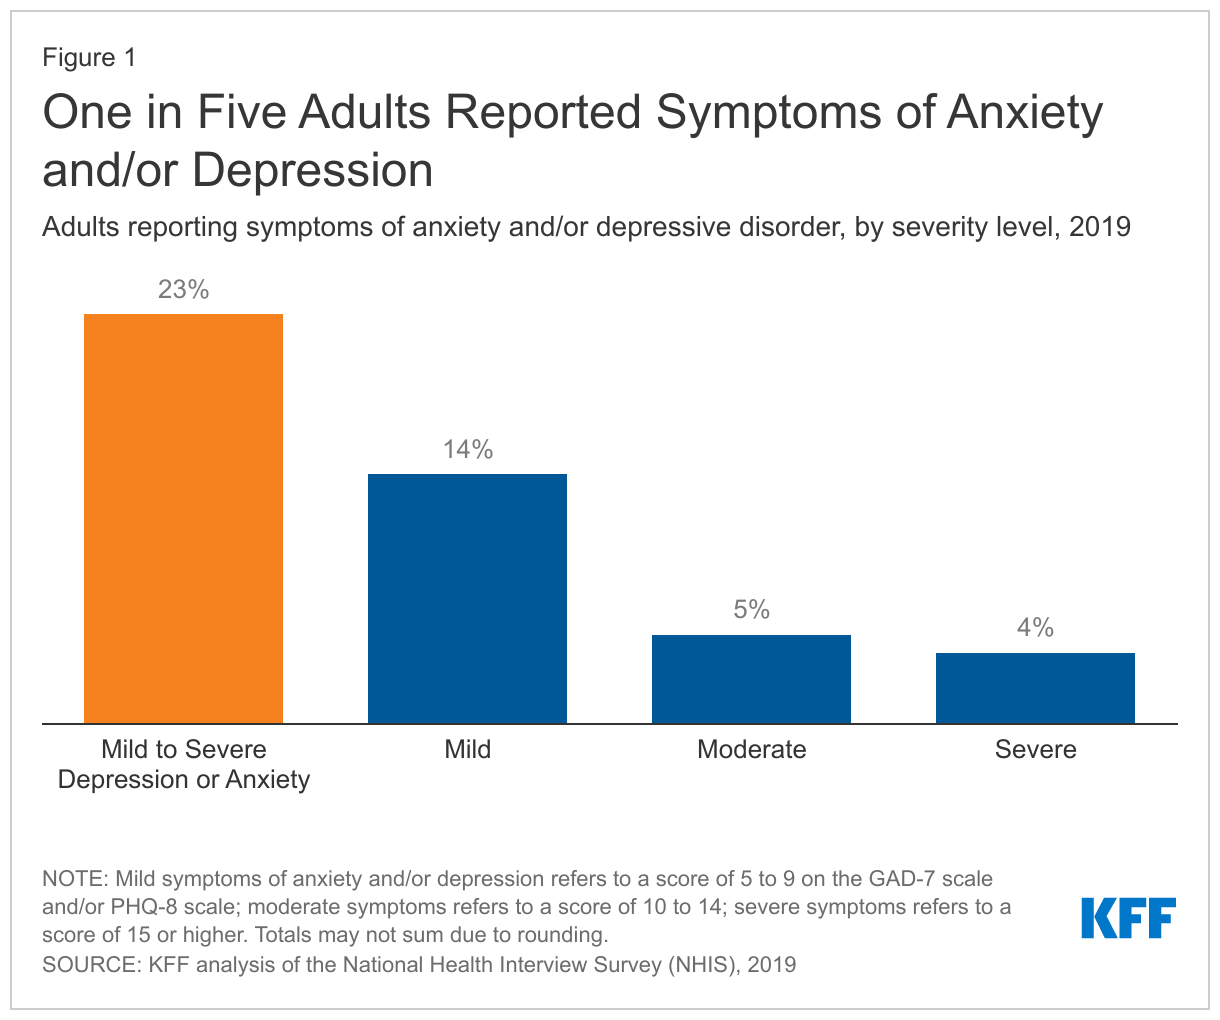
Prior to the pandemic, nearly 1 in 4 adults (23% of people ages 18 and above) reported symptoms of anxiety and/or depression (Figure 1). Fourteen percent of adults reported mild symptoms of anxiety and/or depression while 5% reported moderate symptoms and 4% reported severe symptoms (Figure 1). In total, 54.9 million adults reported at least mild symptoms, with 9.5 million having severe symptoms. Anxiety and depression can affect quality of life and often co-occur with physical health problems.
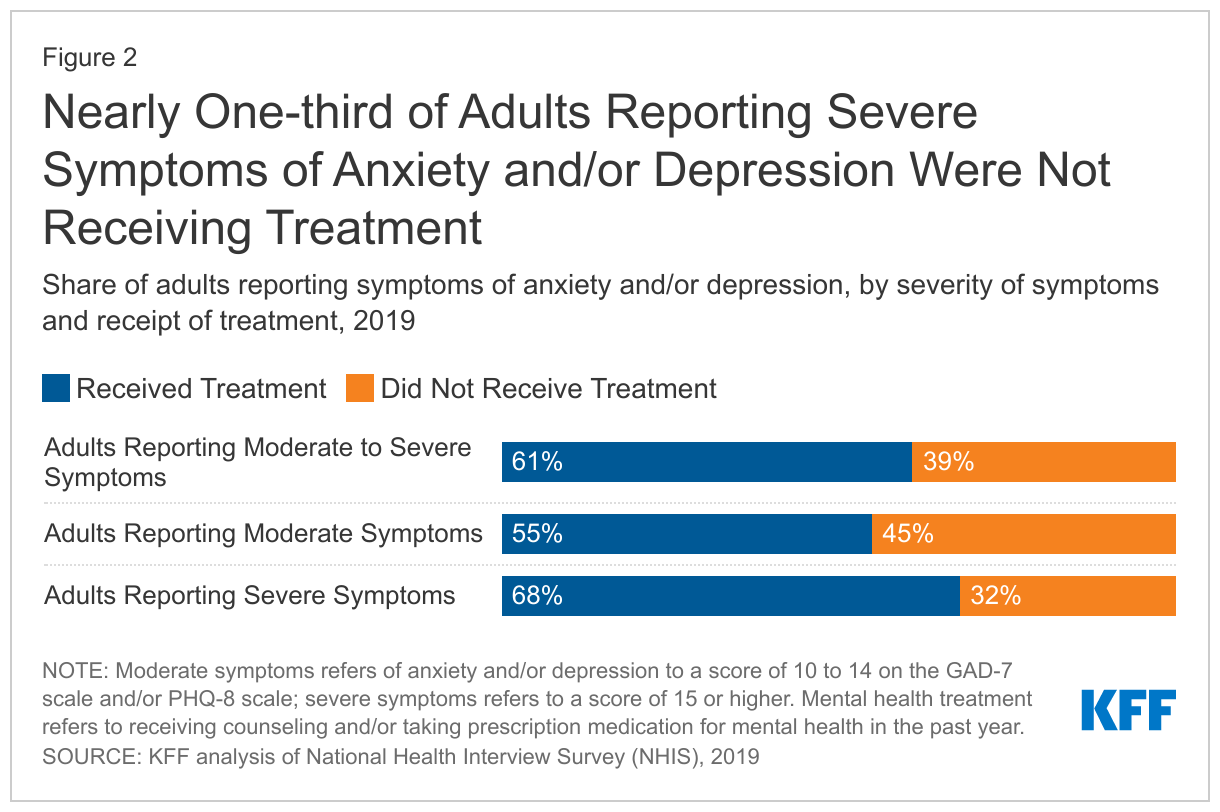
Many adults with mental health conditions do not receive care. In 2019, 21.6 million adults reported moderate to severe symptoms of anxiety and/or depression. Among these adults, 8.5 million (39%) were not receiving treatment (Figure 2). Treatment is defined as receiving counseling and/or taking prescription medication for mental health, depression and/or anxiety in the past year. Among the 9.5 million adults reporting severe symptoms of anxiety and/or depressive disorder, 3.1 million (32%) were not receiving treatment.
A number of factors may contribute to not receiving mental health care. Among those reporting symptoms of moderate or severe anxiety and/or depressive disorder, who were not receiving treatment, 23% indicated that they skipped or delayed therapy due to cost. Other data from 2019 found that among adults with any mental illness in the past year and unmet needs for mental health care, 25% cited not knowing where to obtain care as a reason they did not access services. Widespread mental health provider shortages coupled with low rates of insurance acceptance may also contribute to treatment barriers.
How does reporting of symptoms of anxiety/depression and receipt of treatment vary by demographic characteristics and insurance coverage?
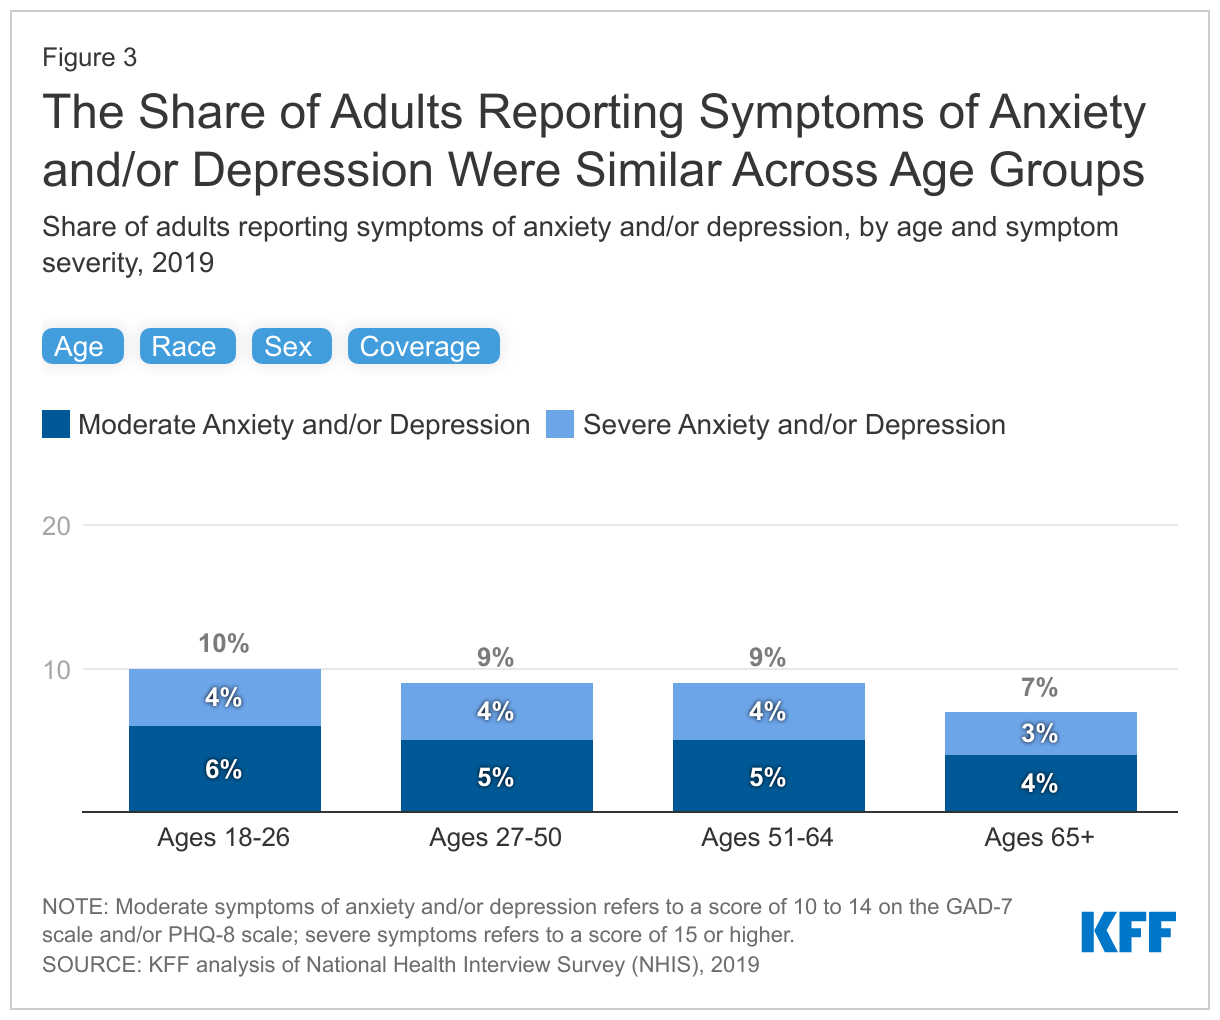
The share of adults reporting moderate to severe symptoms of anxiety and/or depression varied across some demographic groups and by insurance coverage. In 2019, more women (11%) than men (7%) reported moderate to severe symptoms of anxiety and/or depression (Figure 3). A disproportionate share of adults that reported moderate to severe symptoms of anxiety and/or depression were enrolled in Medicaid (19%) and a smaller share are enrolled in an employer plan (6%).
How does receipt of mental health treatment vary by demographic characteristics and insurance coverage?
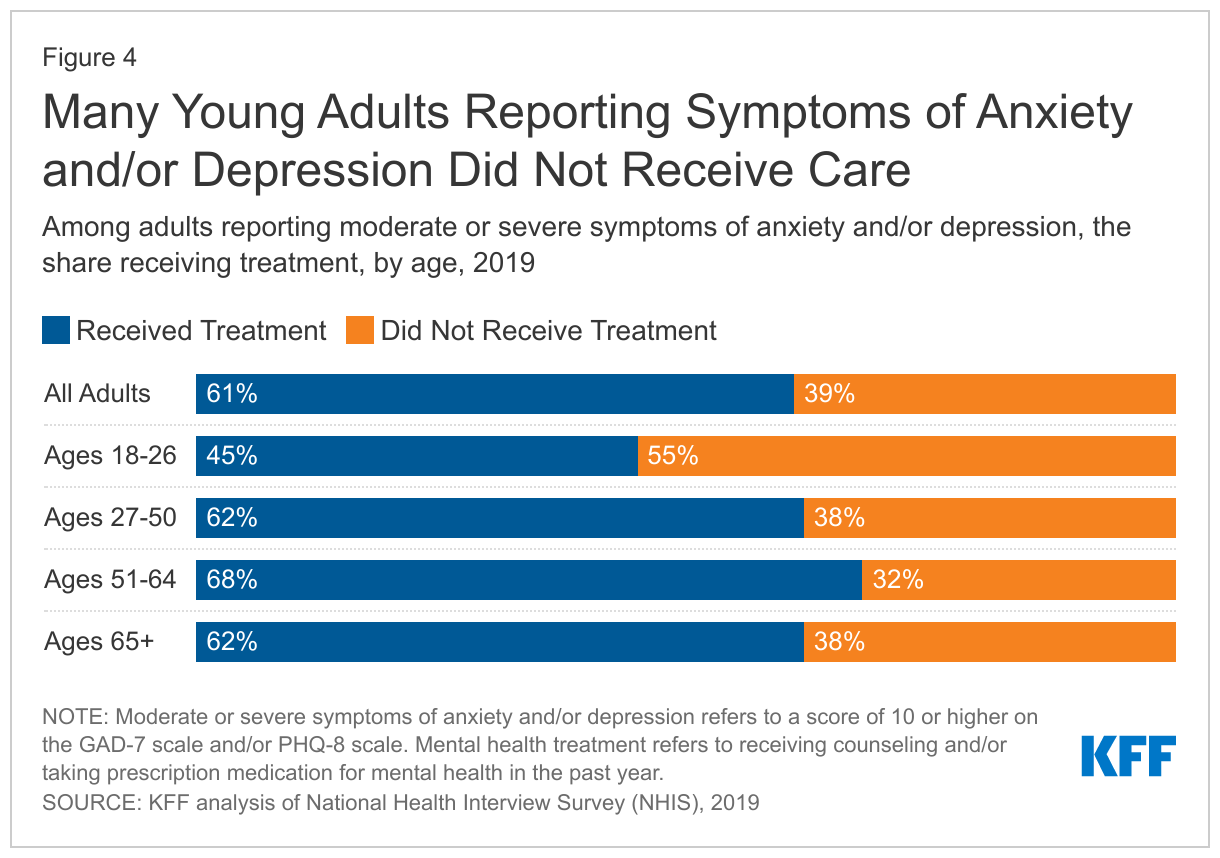
Leading up to the pandemic, disparities in receipt of mental health care existed across age, racial and ethnic groups, gender, and insurance status. In 2019, 10% of young adults (ages 18-26) reported moderate to severe symptoms of anxiety and/or depressive disorders, similar to older adults. More than half (55%) of these young adults reporting moderate or severe symptoms reported not receiving mental health treatment in the past year; this is significantly higher than the share of older adults reporting similar symptoms who were not receiving treatment (38% for ages 27-50; 32% for ages 51-64; and 38% for ages 65 and up) (Figure 4). Some research suggests that costs and factors associated with transitioning from pediatric to adult health care may be linked to limited mental health treatment among young adults in need of care.
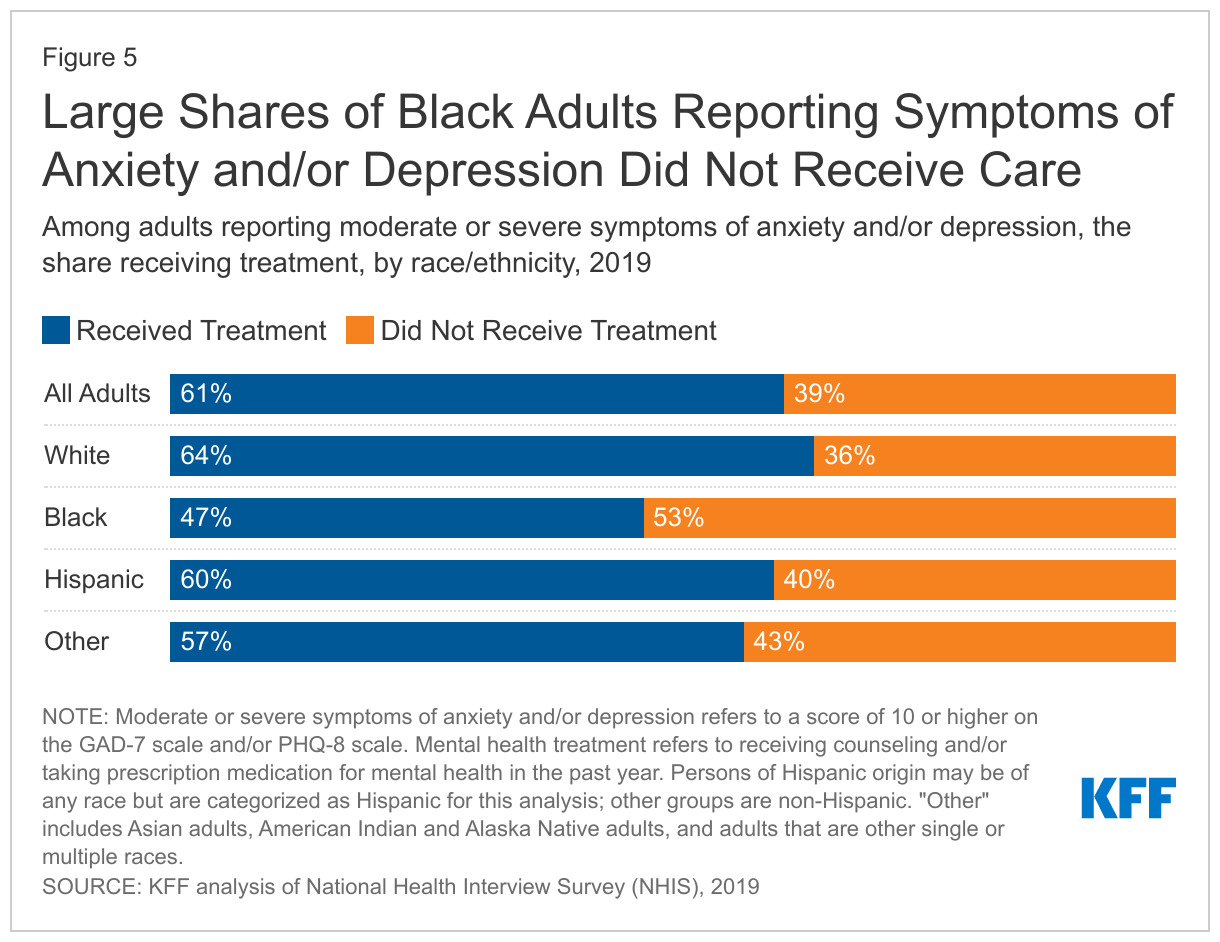
In 2019, nine percent of White, nine percent of Black, and eight percent of Hispanic adults reported moderate or severe symptoms of anxiety and/or depressive disorder. Despite substantively similar reporting of mental health symptoms across racial and ethnic groups, receipt of treatment varied considerably - compared to White adults (36%), a much larger share of Black adults (53%) with moderate to severe symptoms of anxiety and/or depressive disorder did not receive treatment in the past year (Figure 5). In contrast, there was no significant difference in receipt of treatment between Hispanic and White adults. Data were not sufficient to conduct analyses for other racial groups. Research suggests that structural inequities may contribute to disparities in use of mental health care, including lack of health insurance coverage and financial and logistical barriers to accessing care. Moreover, lack of a diverse mental health care workforce, the absence of culturally informed treatment options, and stereotypes and discrimination associated with poor mental health may also contribute to limited mental health treatment among Black adults.
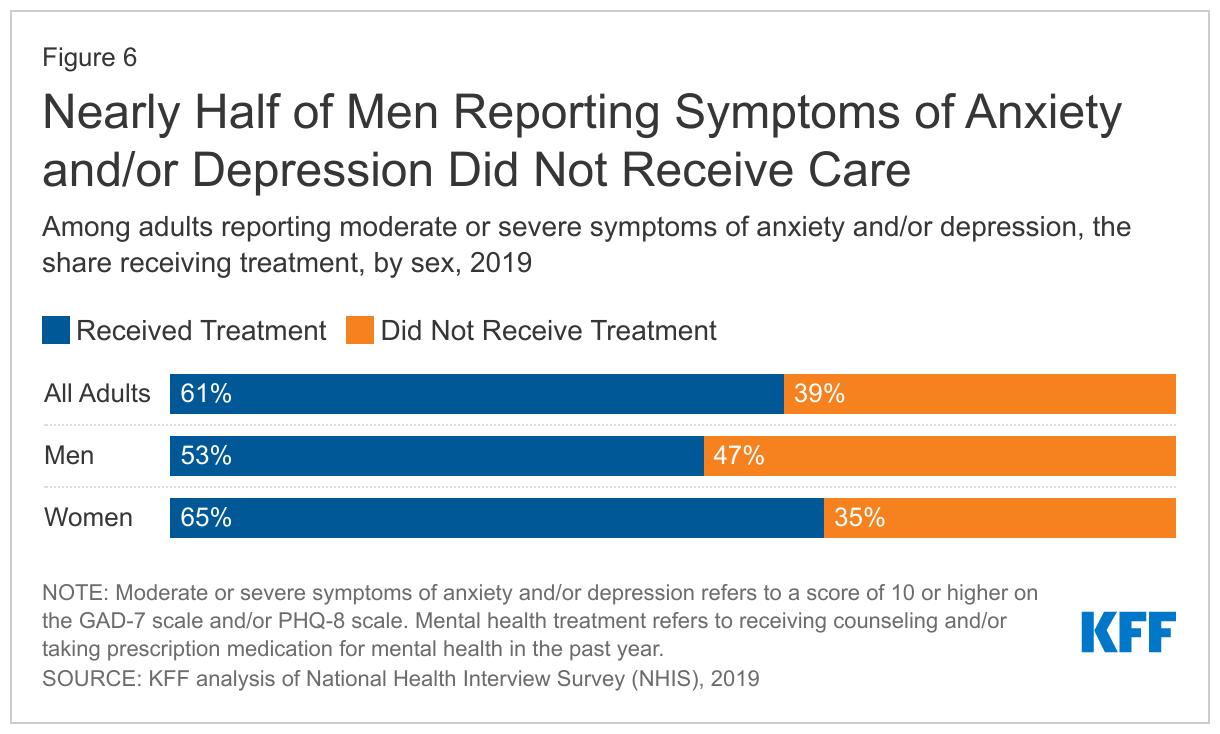
Men (7%) were less likely than women (11%) to report moderate to severe symptoms of anxiety and/or depressive disorder prior to the pandemic (Figure 3). At the same time, men (47%) with moderate to severe symptoms of anxiety and/or depressive disorder were more likely than women (35%) to not receive mental health treatment in the past year (Figure 6). Some research suggests men may be less likely to seek mental health care. Men are also more likely to be uninsured and less likely to report a usual source of care.
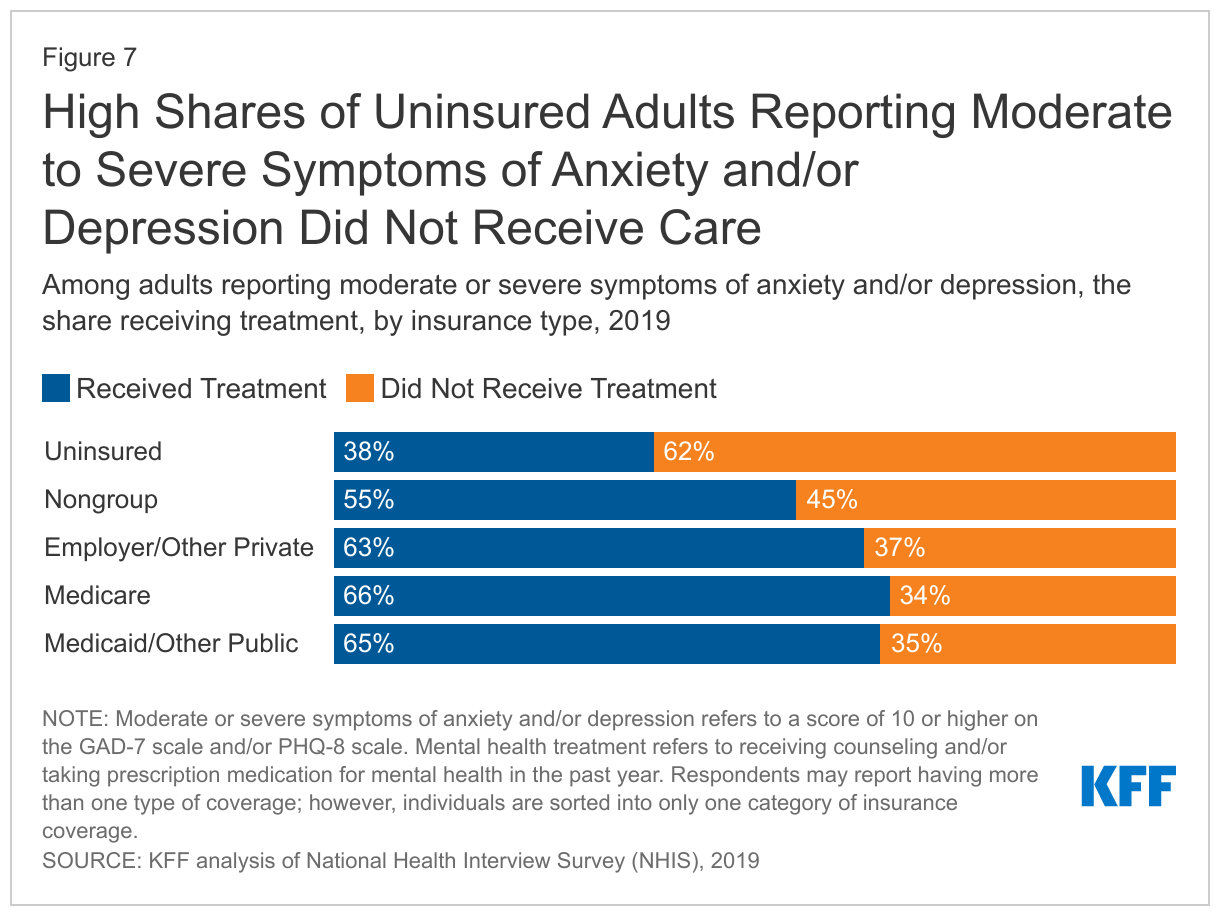
Uninsured adults with moderate to severe symptoms of anxiety and/or depression (62%) were significantly more likely to not receive mental health care compared to their insured counterparts (36%) in 2019. Narrow mental health networks in private insurance plans, including nongroup plans may be linked to access issues. Prior to the pandemic, individuals enrolled in nongroup plans commonly reported delayed or forgone care due to cost. Many employers have indicated that they have narrower provider networks for mental health services than other health care.
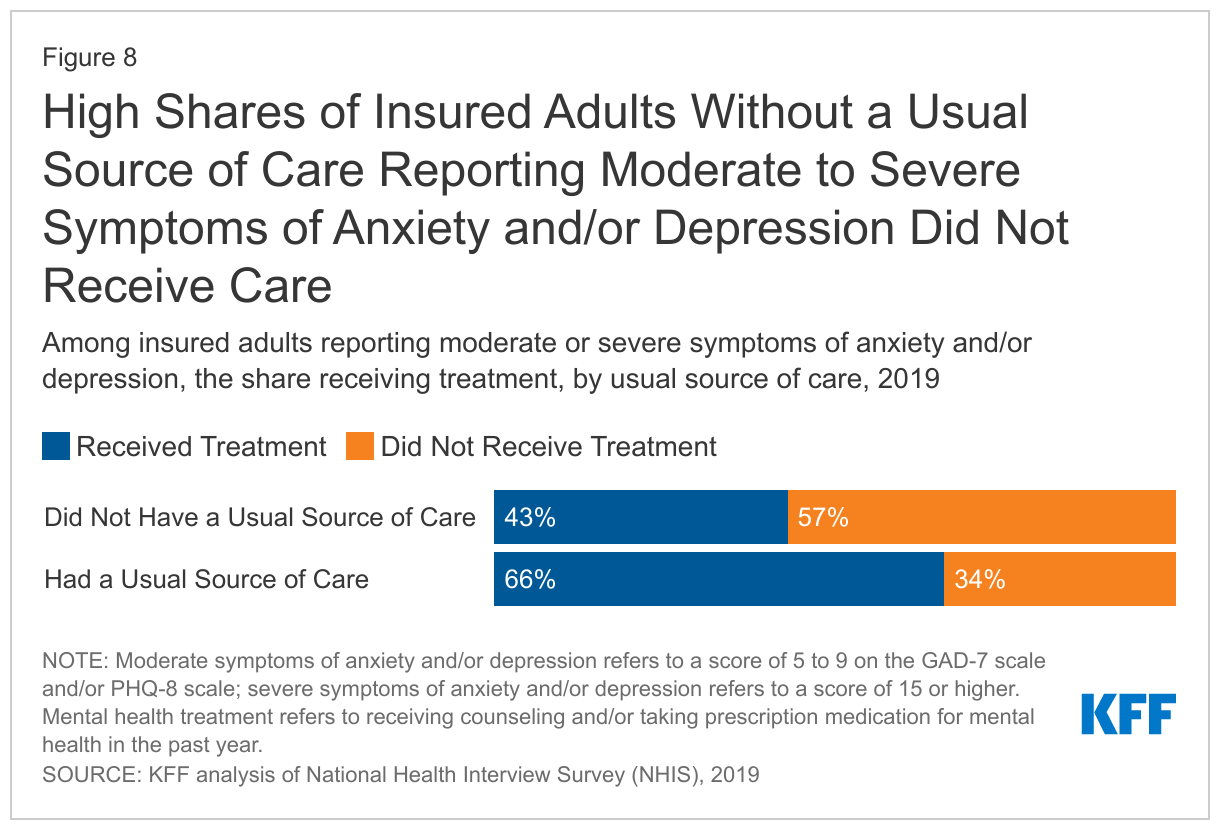
Despite having insurance coverage, insured adults with moderate or severe symptoms of anxiety and/or depression and a usual source of outpatient care (57%) were more likely to not receive mental health treatment than those with a usual source of care (34%) in 2019 (Figure 8). Individuals with a usual source of care may receive mental health treatment directly or through referrals to specialized mental health treatment within or outside their usual care source. Having a usual source of care may improve but does not ensure mental health treatment. Irregular or no mental health screening in outpatient settings, difficulty finding or paying for mental health services, and coverage limitations may contribute to the lack of treatment, even among insured individuals who report a usual source of care.
How have mental health concerns and access to care changed since the pandemic?
An increasing share of people across the U.S. have reported poor mental health since the pandemic began. Some populations – including young adults and some communities of color – have fared worse during the pandemic. Higher shares of young adults reported symptoms of anxiety and/or depressive disorder, increased substance use, and thoughts of suicide compared to older adults. Mental distress and deaths due to drug overdose have also disproportionately increased among some adults of color compared to White adults. Additionally, Black and Hispanic adults have been more likely to experience negative financial impacts and higher rates of COVID-illness and death compared to White adults.
Barriers to accessing mental health care predate the pandemic, though they may have worsened in recent years, particularly for at-risk groups. Some steps have been taken to address challenges in accessing mental health care during the pandemic. Telehealth has played an important role in delivering mental health care during the pandemic. Restrictions around the use of telehealth and prescribing over telehealth were temporarily eased as were some state laws around provider licensing and practice authority. In 2021, the American Rescue Plan Act allocated some funds toward behavioral health workforce development and developing mental health mobile crisis support teams. Additionally, the national suicide hotline number, ‘988’, is set to launch in July 2022. There have also been some bipartisan efforts in response to the mental health crisis, including proposed mental health packages and a legislative agenda from the Addiction and Mental Health Task force. Recently, the Biden administration announced its Unity Agenda which proposes improving behavioral health workforce capacity, improving access to care in integrated settings, and expanding insurer coverage requirements. It is unclear how recent policy measures will impact access to mental health treatment especially among groups who experienced barriers to care even before the pandemic.
This work was supported in part by Well Being Trust. We value our funders. KFF maintains full editorial control over all of its policy analysis, polling, and journalism activities.
Methods
This analysis used data from the 2019 National Health Interview Survey (NHIS). The National Health Interview Survey (NHIS) is a national probability survey of American Households sponsored annually by the U.S. Census Bureau and the Center for Disease Control and Prevention (CDC). The 2019 NHIS data included detailed questions on symptoms of anxiety and depression; these questions were not asked on the 2020 survey. This analysis uses full mental health screening scales (GAD-7 and PHQ-8). Other KFF analyses have used abbreviated mental health screening scales (GAD-2 and PHQ-2) in order to draw comparisons to estimates from the Household Pulse Survey during the pandemic. Abbreviated mental health screening scales flag individuals with moderate or severe symptoms aligned with a diagnosable condition, whereas the full screening scales shown in this analysis categorize mental health symptoms into mild, moderate, or severe groups. This analysis includes data on White, Black, and Hispanic adults. Persons of Hispanic origin may be of any race but are categorized as Hispanic for this analysis; other groups are non-Hispanic. Data were insufficient to allow for analysis of other racial groups. Respondents may report having more than one type of coverage; however, individuals are sorted into only one category of insurance coverage. We define individuals in treatment as those who received counseling or therapy from mental health professional in the past 12 months, or someone taking a depression, anxiety or mental health prescription drug.
Several legislative proposals in Congress propose a $35 per month cap on what people with health insurance would have to pay out of pocket for insulin, a life-saving hormone taken regularly by many people with diabetes to maintain their health.
This analysis of insurance claims data finds that such a cap could provide financial relief to at least 1 out of 5 insulin users with different types of private health insurance.
Among people with private insurance who currently pay more than $35 per month for insulin on average, half would save at least $19 per month, and a quarter would save at least $42 per month. Savings are highest among people who buy their own insurance.
The report analyzes 2018 claims data from the Centers for Medicare and Medicaid Services EDGE data for the individual and small-group markets and the IBM Health Analytics MarketScan Commercial Claims and Encounters Database for the large-employer market. It is available through the KFF-Peterson Health System Tracker, an online information hub dedicated to monitoring and assessing the performance of the U.S. health system.
Several legislative proposals in Congress propose a $35 per month cap on what people with health insurance would have to pay out of pocket for insulin, a life-saving hormone taken regularly by many people with diabetes to maintain their health.
Such a cap could provide financial relief to at least 1 out of 5 insulin users with different types of private health insurance, a new KFF analysis of insurance claims data finds.
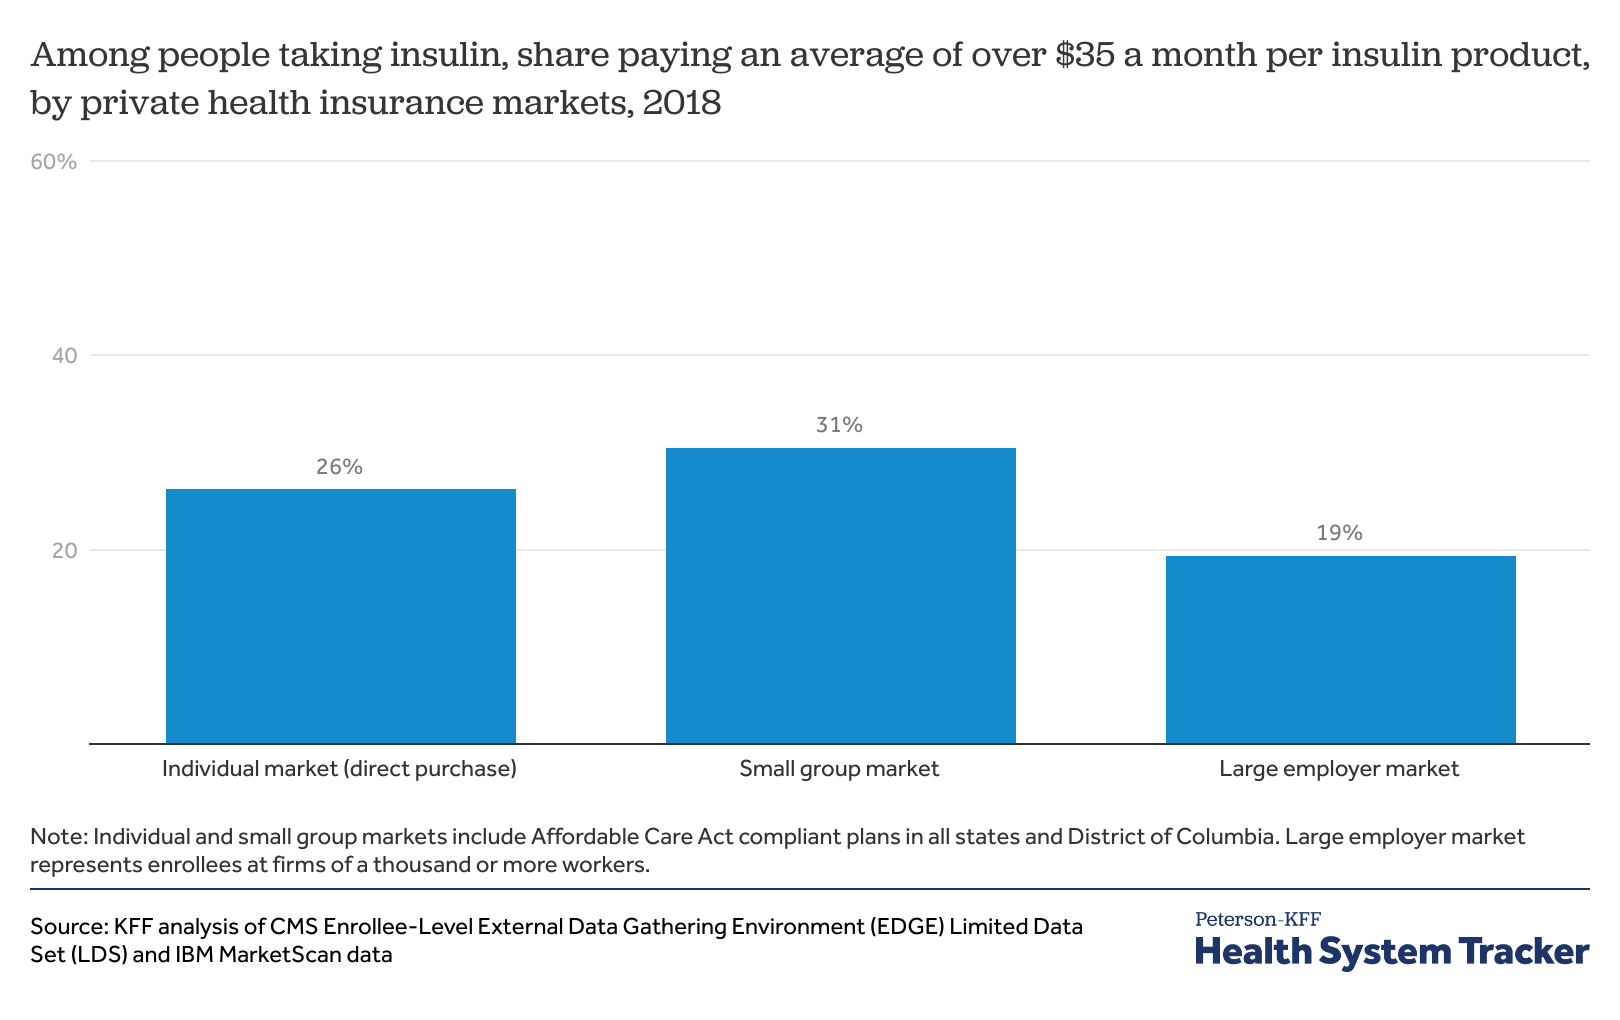
In the large employer market, 19% of people who take insulin spend an average of more than $35 per month ($420 annually) for insulin, the analysis shows. The shares are even higher for insulin users covered through the small group market (31%) and individual market (26%).
People in small group plans may face higher out-of-pocket costs for insulin because such coverage is generally less comprehensive than in large employer plans, and there is no reduced cost-sharing for low-income people as there is for individual market plans purchased through the Affordable Care Act’s marketplaces.
Among people with private insurance who currently pay more than $35 per month for insulin on average, half would save at least $19 per month, and a quarter would save at least $42 per month. Savings are highest among people who buy their own insurance.
The $35 per month cap on insulin out-of-pocket costs is the main provision in the Affordable Insulin Now Act, introduced in February 2022 by Sen. Raphael Warnock, and one of many drug-pricing provisions in the Build Back Better Act, which passed the House last year but stalled in the Senate.
The report analyzes 2018 claims data from the Centers for Medicare and Medicaid Services EDGE data for the individual and small-group markets and the IBM Health Analytics MarketScan Commercial Claims and Encounters Database for the large-employer market. It is available through the KFF-Peterson Health System Tracker, an online information hub dedicated to monitoring and assessing the performance of the U.S. health system.
Medicaid managed care organizations (MCOs) deliver care to more than two-thirds of all Medicaid beneficiaries nationally. Medicaid MCOs (also referred to as managed care plans) may be in contact with enrollees as they provide care coordination and other member services (e.g., health education and promotion, call center support) and may conduct periodic outreach to promote appropriate use of care (e.g., to encourage prevention, wellness, and early intervention). Throughout the pandemic, states have worked with managed care plans to respond to changing public health conditions and new developments, including to promote the take-up of COVID-19 vaccinations.
Medicaid MCOs have seengrowth in their membership during the pandemic that tracksoverall Medicaid enrollment trends. Enrollment growth reflects downturns in the economy due to the pandemic and provisions in the Families First Coronavirus Response Act (FFCRA) that require states to ensure continuous enrollment for current Medicaid enrollees to access a temporary increase in the Medicaid match rate during the Public Health Emergency (PHE) period. It is expected that the PHE will be extended through at least mid-July 2022 since the Biden administration indicated it would give states 60 days-notice before the PHE is terminated or is allowed to expire (the current PHE is set to expire in mid-April). If the PHE ends in mid-July, the continuous enrollment requirement would expire at the beginning of August 2022.
Medicaid managed care plans can assist state Medicaid agencies in communicating with enrollees, conducting outreach and assistance, and ultimately, in improving coverage retention (including facilitating transitions to the Marketplace where appropriate). After the PHE ends, state Medicaid agencies will need to complete a large number of eligibility and enrollment tasks and actions, including processing renewals, redeterminations (based on changes in circumstance), and post-enrollment verifications. Current CMS guidance indicates states must initiate all renewals and other outstanding eligibility actions within 12 months after the PHE ends. Medicaid managed care plans have a financial interest in maintaining enrollment, which could also prevent disruptions in care for enrollees, including prescription drug benefits. Four for-profit parent firms that account for about 40% of Medicaid enrollment nationally (Anthem, Centene, Molina, and UnitedHealth Group) reported on Q4 2021 earnings calls that they expect modest enrollment declines in their Medicaid membership after the continuous enrollment requirement ends. However, these firms also indicated expecting to pick up/capture many individuals who transition from Medicaid through their other lines of business (i.e., the Affordable Care Act Marketplace and employer sponsored insurance (ESI)). Managed care plans have long cited lack of continuous eligibility, or churn, as a key challenge in ensuring access to care and for care continuity.
How can states engage MCOs to help individuals retain Medicaid coverage or transition to other coverage?
CMS released guidance for state Medicaid agencies on resuming normal operations including outlining strategies for working with managed care plans to promote continuity of coverage when the continuous enrollment requirement during the PHE ends. In the guidance, CMS notes that the federal Medicaid managed care marketing rules (42 CFR 438.104) do not prohibit plans from providing information and conducting general outreach on behalf of states. States must develop an “unwinding operational plan” to document their comprehensive plan to resume normal operations in their Medicaid and Children’s Health Insurance Program (CHIP) programs. CMS is encouraging states to gather input on their unwinding plans, including from managed care plans. Key strategies from the CMS guidance include:
Working with plans to obtain and update beneficiary contact information. States may direct MCOs to seek updated contact information from enrollees. Plans must confirm the accuracy of updates received from a third party (e.g., provider) with enrollees directly. MCOs may share this information with the state or may instruct or assist individuals in providing their updated contact information to the state. States may accept updated enrollee contact information from MCOs including mailing addresses, telephone numbers, and email addresses provided the state complies with certain beneficiary notice requirements (to confirm the accuracy of updated contact information) or the state receives a waiver of such requirements from CMS. While guidance expects plans to help in updating contact information, plans have historically cited difficulty reaching members and inaccurate member contact information as key barriers to engaging enrollees in care coordination activities. While state plans are evolving, as of January 2022, about half of states reported working with managed care plans to update beneficiary mailing addresses before the end of the PHE.
Sharing renewal files with MCOs to conduct outreach and provide support to individuals enrolled in Medicaid during their renewal period. States can provide monthly files to MCOs containing information about beneficiaries for whom the state is initiating the renewal process, or beneficiaries who have yet to submit renewal forms or other documentation and are at risk of losing coverage, to enable plans to conduct outreach and provide assistance with the renewal process. Prior to sharing information with managed care plans (e.g., renewal files), states may need to identify and address possible systems or operational challenges, including to ensure data accuracy.
Enabling MCOs to conduct outreach to individuals who have recently lost coverage for procedural reasons. States can provide MCOs monthly termination files to enable plans to conduct outreach to individuals terminated from Medicaid for procedural reasons (e.g., not returning renewal forms timely). CMS notes states may need to expedite review of plan outreach messaging or may want to consider developing standard language to be used by Medicaid managed care plans to ensure compliance with federal marketing requirements as well as any state-specific laws or contract requirements that may apply. Within two months or less after Medicaid coverage loss, managed care contracts must provide for automatic re-enrollment into an enrollee’s original plan. However, during the PHE unwinding period, CMS will approve state waivers to extend this automatic re-enrollment period up to 120 days.
Permitting plans to assist individuals to transition to and enroll in ACA Marketplace coverage if ineligible for Medicaid or CHIP. States may encourage MCOs that also offer a Qualified Health Plan (QHP) in the ACA Marketplace to share information with their own enrollees who have been determined ineligible for Medicaid to assist in the transfer of individuals to Marketplace coverage (which has higher income eligibility thresholds than Medicaid). To avoid gaps in coverage, managed care plans may reach out to individuals beforethey lose coverage to allow them to apply for Marketplace coverage in advance. CMS notes that federal Medicaid managed care marketing rules (and Exchange regulations) do not prohibit Medicaid managed care plans that offer a QHP from providing information about the QHP to enrollees who could potentially enroll in the QHP due to loss of eligibility; however, plans must comply with state-specific laws and/or contract requirements that may prohibit this activity.
In addition to strategies identified in the CMS guidance, Medicaid managed care plans may also consider adding staff to help manage the unwinding process. Additional staff could work proactively to identify members at-risk for disruptions in care and disenrollment (e.g., individuals with limited English proficiency, people with disabilities). Managed care plans can also work in partnership with providers (including community health centers) and community-based organizations to further bolster efforts to reach and assist members to ensure coverage retention or transitions to Marketplace coverage.
What to watch?
Understanding how managed care plans are involved in the development of state unwinding operational plans and what is included in the operational plans themselves will be key areas to watch. When continuous enrollment requirement ends, states will begin processing renewals and redeterminations and millions of people could lose coverage if they are no longer eligible or face administrative barriers during the process despite remaining eligible. The significant volume of work that states face will place a heavy burden on eligibility and enrollment staff and could contribute to coverage loss related to procedural errors. Medicaid managed care plans may be well positioned to assist states in conducting outreach and providing support to enrollees who will need to navigate the renewals or redeterminations.
As mid-April approaches, additional information about the timing of the end of the PHE may become available. The Biden administration indicated it would give states 60 days-notice before the PHE is terminated or is allowed to expire. The current PHE is set to expire in mid-April. On February 8, 2022, the Medicaid Health Plans of America (MHPA), a national trade association representing more than 130 MCOs, sent a letter to Congressional leaders asking Congress to provide at least 120-days lead time before the end of the continuous enrollment requirement. States are developing unwinding operational plans but it is not clear that these plans will be made publicly available. The policies adopted and the implementation of strategies to promote continuity of coverage will vary across states and plans and will have major implications for Medicaid and broader coverage as the PHE unwinds.
President Biden recently signed the reauthorization of the Violence Against Women Act (VAWA). The new VAWA includes changes that could help strengthen and expand the availability of health care services for victims, including better oversight of programs for survivors of sexual assault and a new public website with information about the availability of forensic nurse examiners.
To qualify for federal grants to address violence against women, states are required to ensure that rape kits, or Medical Forensic Exams (MFE), are provided at no cost to survivors. However, there are often gaps in coverage for health care services that are outside of the MFE, like sexually transmitted infection testing, emergency contraception, or services for injuries incurred during sexual assault (such as stitches). Coverage policies for these services vary by state and are not necessarily guaranteed to be provided without cost-sharing. While the 2022 VAWA makes many changes, it does not specifically address out-of-pocket charges that many can face after a sexual assault.
In the United States, more than one in three women experience sexual violence in their lifetime. Despite the intent of Violence Against Women Act (VAWA) to protect survivors from out-of-pocket spending stemming from rape kit collection services also known as a medical forensic exam (MFE), many women face health care bills because they seek those critical services.
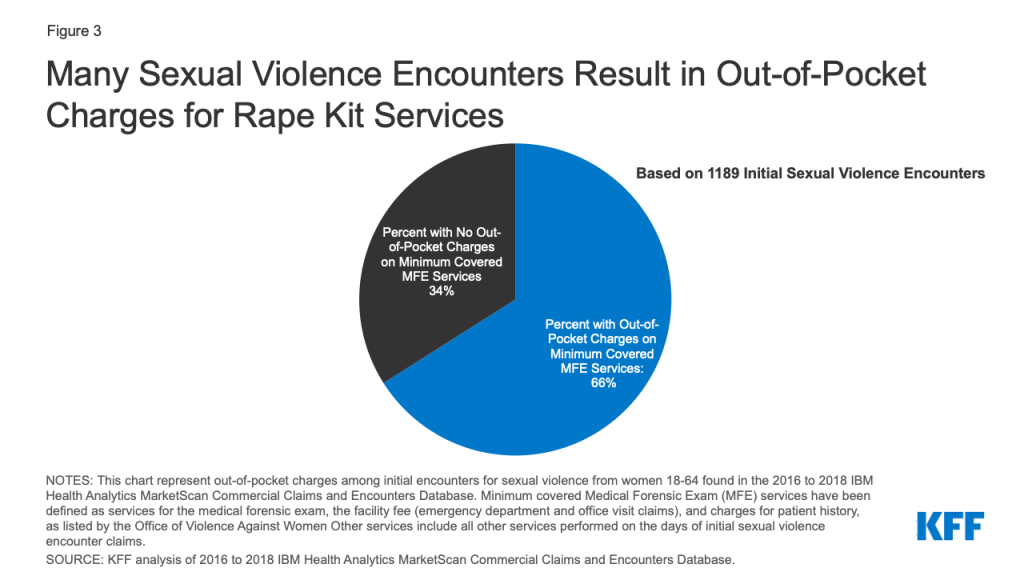
A new KFF analysis of a sample of private insurance claims from large employers finds that two-thirds (66%) of insured women who received a rape kit after a sexual assault faced out-of-pocket charges for these services, spending an average of $347 out of pocket.
This new analysis also reviews the federal and state policies that contribute to the gaps in coverage for these women, despite the intention of the VAWA to make no-cost rape kits accessible to all survivors.
President Biden recently signed the newly reauthorized VAWA, which does not specifically address the issue of out-of-pocket charges that many face for minimum covered services of the MFE. The reauthorization could help strengthen and expand the availability of health care services for victims, including better oversight and transparency regarding programming for survivors of sexual assault and a new public website with information about the availability of forensic nurse examiners.
Sexual violence is a public health concern that affects every community and often has lasting impacts on health and well-being.
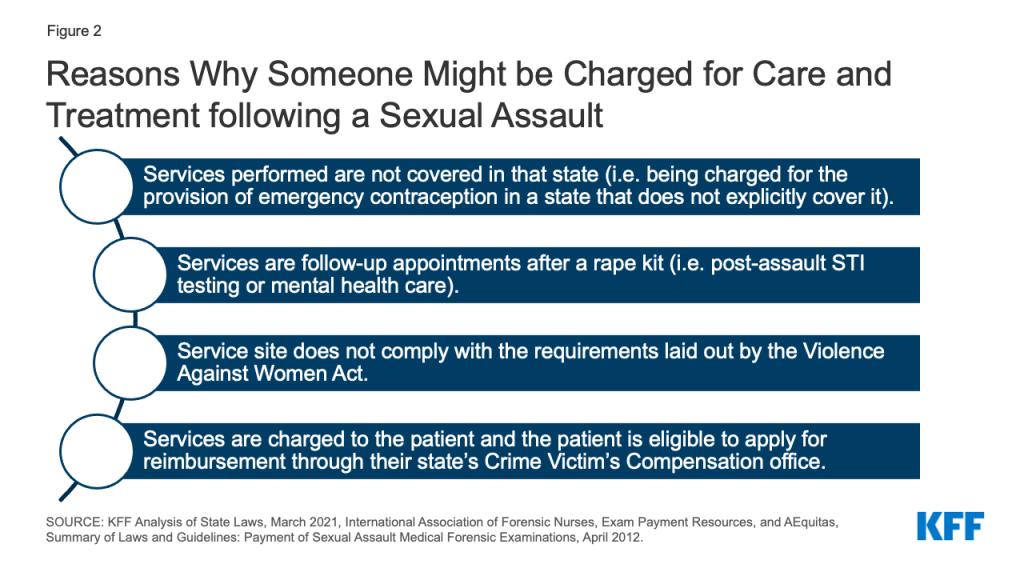
While the intent of the Violence Against Women Act (VAWA) is to guarantee full coverage for rape kits or forensic exam services to survivors of sexual violence, some people are still charged for rape kit services. There are several reasons that that could be happening:
The exam is conducted by an individual who the state does not recognize as a provider of covered Medical Forensic Exams (MFEs). These are typically provided by Sexual Assault Nurse Examiners (SANEs).
Hospitals’ billing services may not know that the services should not be charged to the victim and send a bill to them for services provided.
Finding a place to get a rape kit from a provider specially trained in MFEs can be difficult in some places. Only a fraction of hospitals in the US have a trained forensic examiner such as a SANE. This makes it especially difficult to get an exam from a trained provider in rural communities. In addition, there is no government sanctioned national database of SANE providers making it difficult for victims who do not interact with law enforcement or a rape crisis center to know where to go.
The scope of services required to be performed along with the forensic exam and evidence collection vary by state. Many services that are considered to be the standard of care, outside of the forensic exam and evidence collection process and performed by a provider at the same time or on the same day as a forensic exam (such as medication, x-rays or MRIs), are not subject to the VAWA coverage requirement.
KFF analysis of a sample of private insurance claims from large employers found that two-thirds (66%) of privately-insured women who likely presented for a rape kit after a sexual assault were charged out-of-pocket costs for some services which are typically included in the minimum standard rape kit services as defined by the US Department of Justice. Women who were charged cost-sharing for services often included in the MFE spent an average of $347 dollars out of pocket.
Despite the intention of the VAWA to provide no-cost rape kits to all survivors of sexual violence, some survivors still face out-of-pocket charges for minimum standard rape kit services as well as other medical care that takes place following a sexual assault.
Introduction
Sexual violence impacts every community and affects people of all genders, sexual orientations, and ages, and often has lasting impacts on health and well-being. Sexual violence has been classified as a serious public health issue by the World Health Organization (WHO), and the Centers for Disease Control and Prevention (CDC). In the US, more than 1 in 3 women and 1 in 4 men experience sexual violence in their lifetimes. The Violence Against Women Act (VAWA) provides federal funding and guidance for programs to serve victims of sexual violence in the US. Despite the availability of federal and state funding and programs designed to support victims of sexual violence, many women face sizable out-of-pocket expenses for services they receive from a health care provider after a sexual assault.1 This brief examines the policies that impact coverage of health care services for survivors of sexual assault and identifies gaps in those programs and coverage for their care, particularly for women with private health insurance.
Overview of Federal and State Programs to Support Victims of Sexual Violence
The Violence Against Women Act (VAWA) is the major federal legislation that provides funding and guidance for programs that aid victims of sexual violence. VAWA’s scope is broad, covering domestic violence, sexual harassment, stalking, and sexual assault. VAWA provides grants to states, local governments, and other organizations to establish their own violence-related programs and protocols. While the focus of public policies on sexual assault tends to be prosecution of perpetrators and the collection of evidence, provisions in VAWA also address health care coverage and costs.
Violence Against Women Act (VAWA): First passed in 1994, VAWA authorizes federal funds to be used for services to aide individuals who are victims of sexual violence. VAWA requires states or another entity to provide no-cost rape kits and enforces and funds this requirement.
Services, Training, Officers, Prosecutors (STOP) grants in each state. These grants are VAWA formula grants which support state and territory efforts to develop and strengthen law enforcement and prosecution strategies to address violence against women and improve victim services, such as paying for rape kits (or Medical Forensic Exams). According to federal law, in order to qualify for these grants states must “incur the full out-of-pocket cost of forensic medical exams” by providing or arranging for MFEs free of charge to victims of assault.
Crime Victim’s Compensation Funds (CVCs): These state-level funds are established to reimburse victims for expenses related to crimes, which can include out-of-pocket expenses related to evidence collection and treatment. However, CVCs are typically the payer of last resort, and in most states, to be able to access the funds, the victim must report the crime to law enforcement within 72 hours of occurrence. These policies limit the availability of these funds to many victims of sexual violence.
What is a Rape Kit? It depends on where you live and where you go
Medical Forensic Exams (MFEs), Physical Evidence and Recovery Kits (PERKs), and Sexual Assault Forensic Exams (SAFEs) are all colloquially known as “rape kits.” In this brief, we use the terms MFE and rape kit interchangeably.
MFEs are used to collect evidence related to the sexual assault. The Office of Violence Against Women specifies that at a minimum, the standard medical forensic exam should include:
gathering information from the patient for the forensic medical history
head-to-toe examination of the patient
documentation of biological and physical findings
collection of evidence from the patient
use of the exam space, such as an emergency room
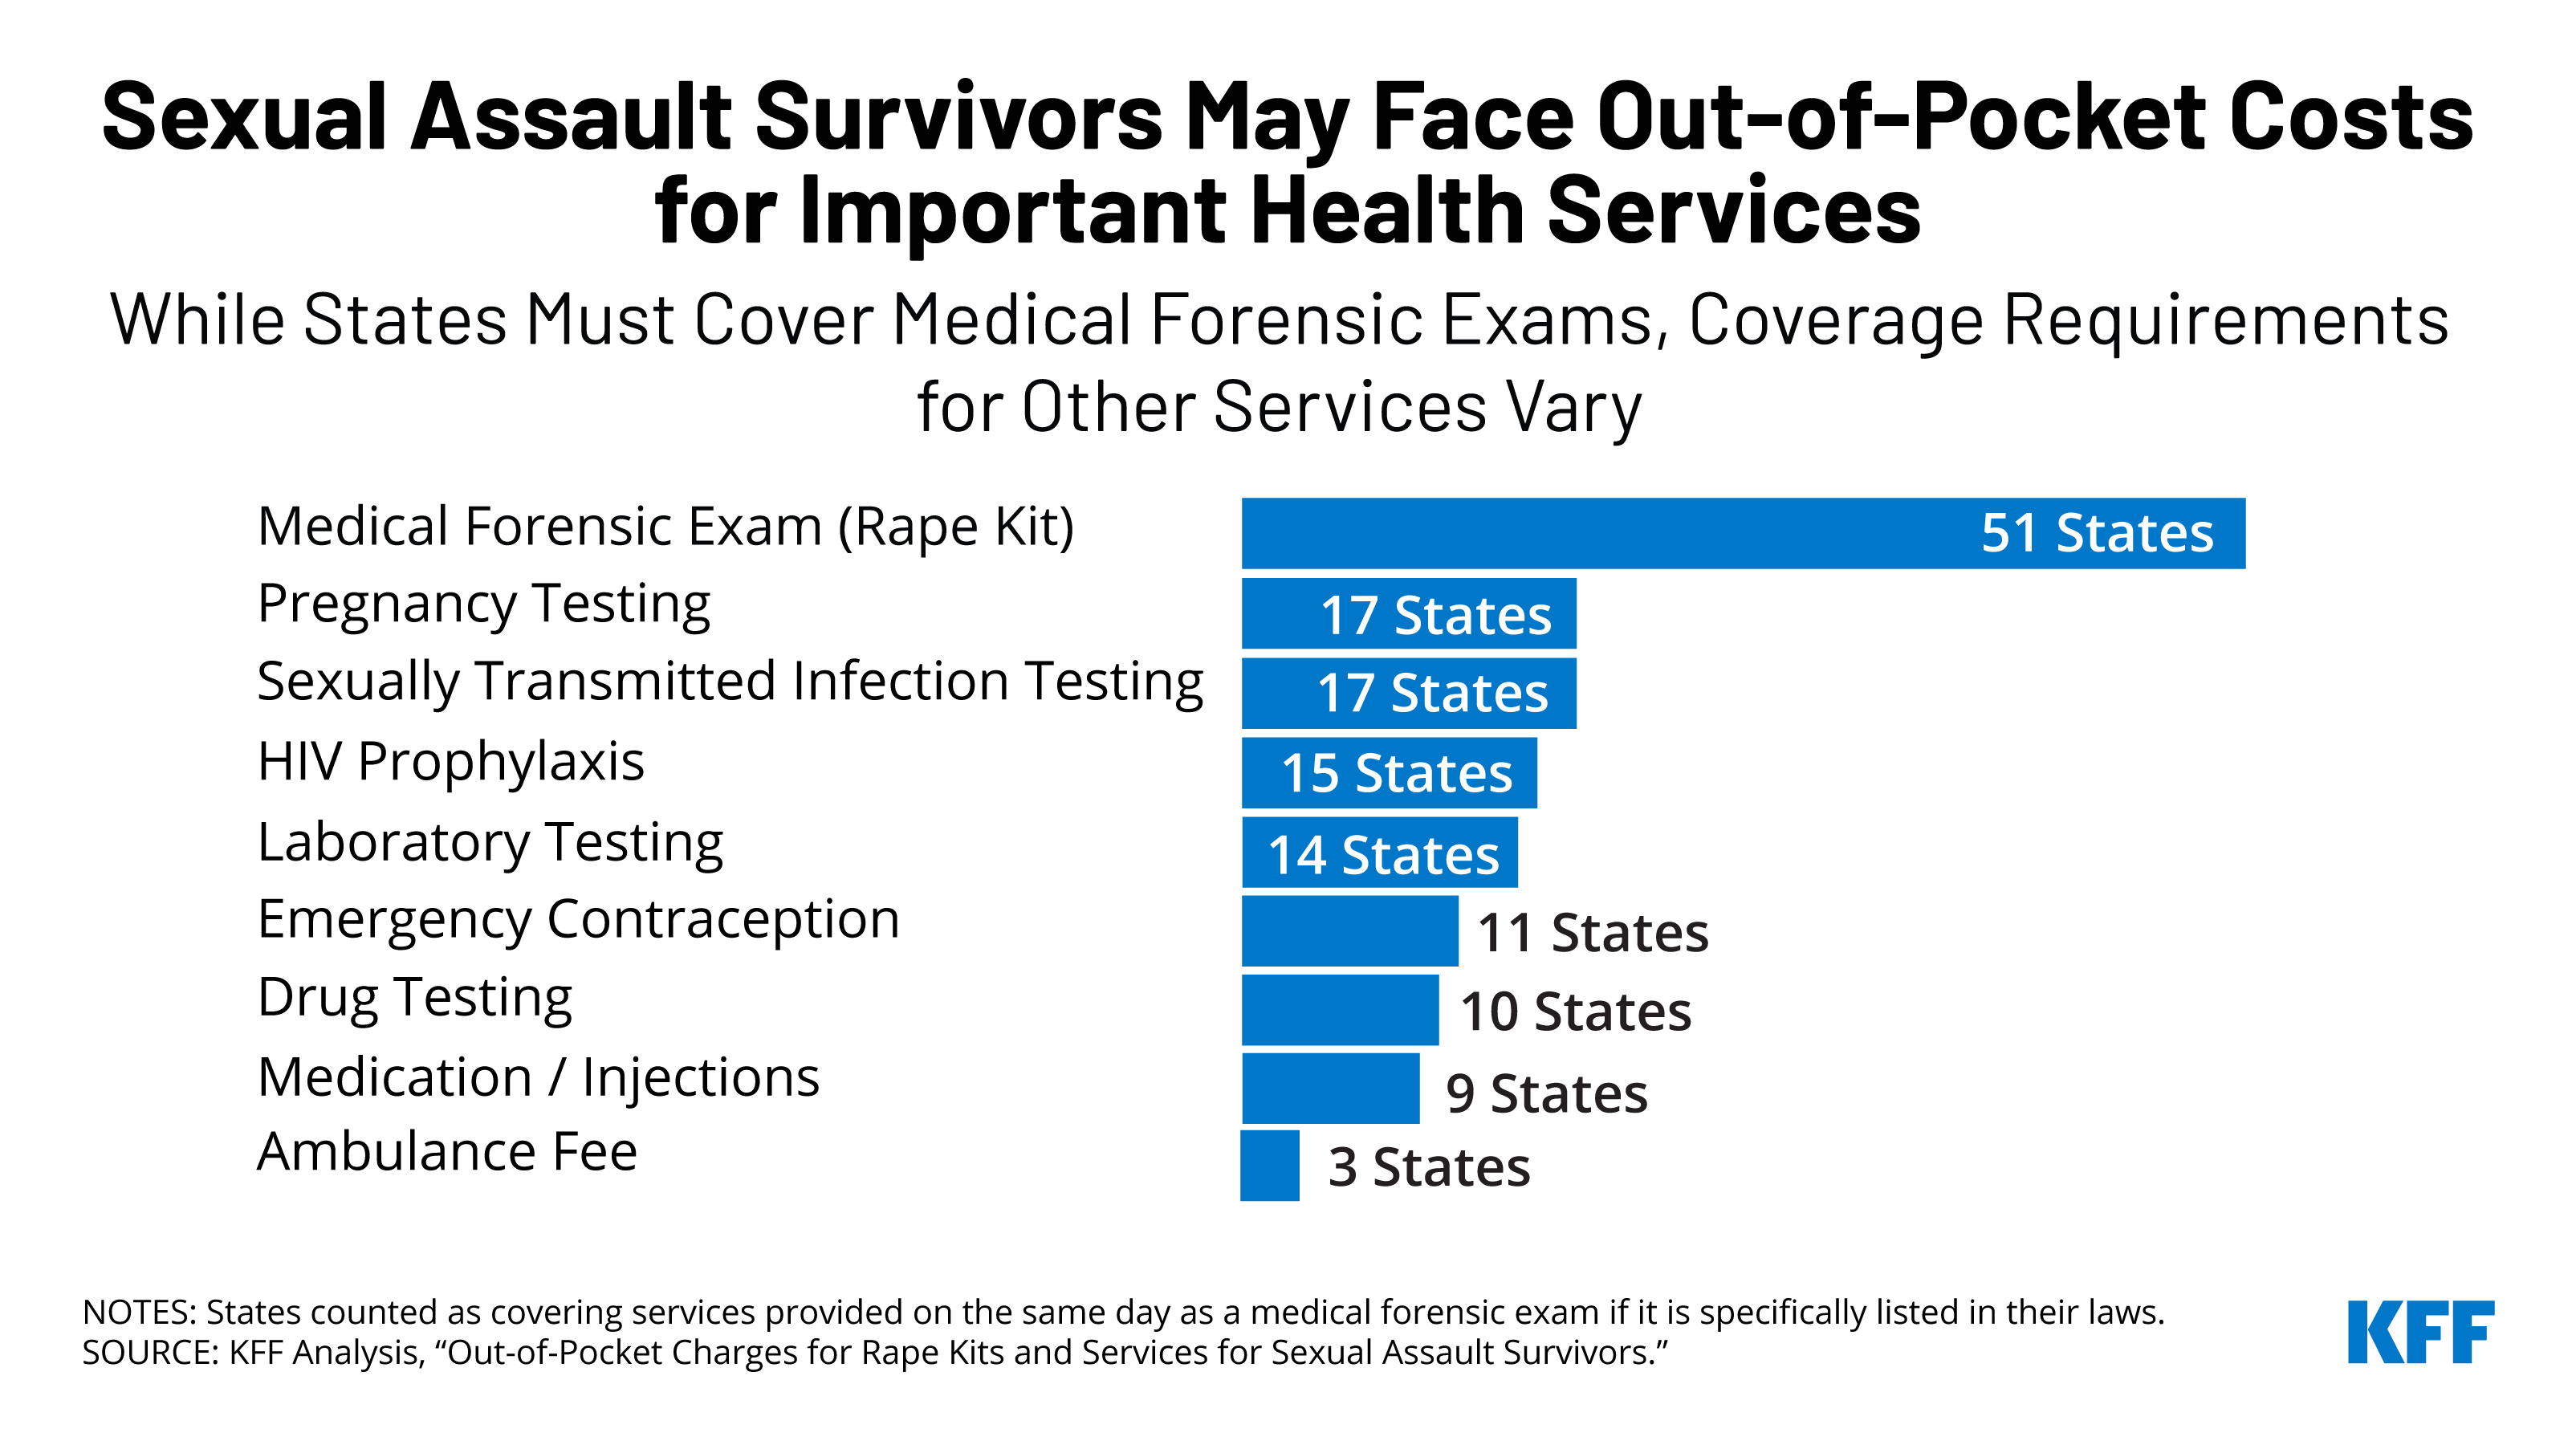
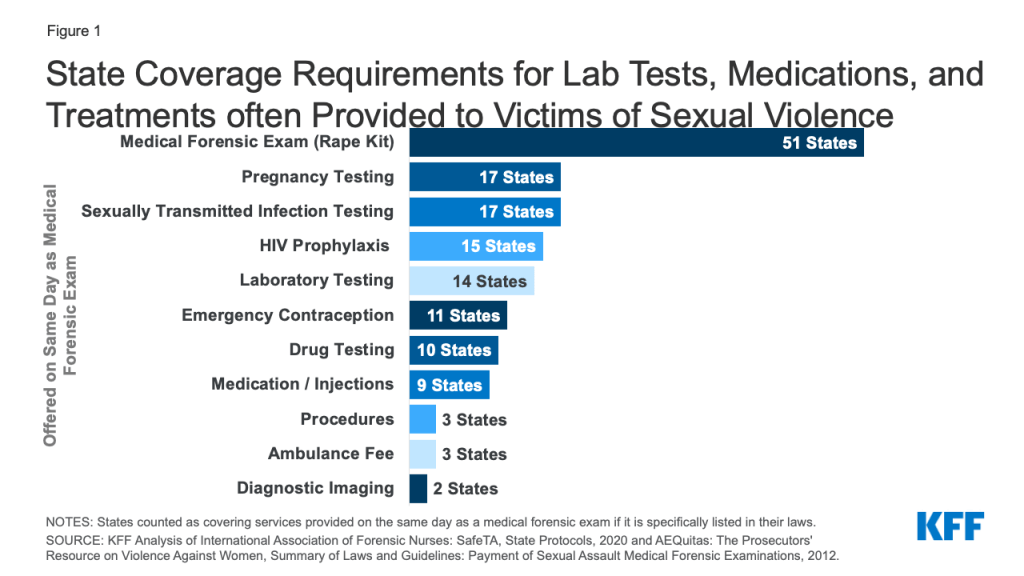
Beyond the minimum forensic exam, the Office of Violence Against Women states that “the inclusion of additional procedures (e.g., testing for sexually transmitted diseases) may be determined by the state in accordance with its current laws, policies, and practices.” Within these broad federal guidelines, states can define what is included in a rape kit which results in variation across the country. Although states are required to ensure that rape kits are provided at no-cost to survivors in order to qualify for STOP grants, there are often gaps in coverage for health care services that are outside of the MFE, like sexually transmitted infection (STI) testing, emergency contraception, or services for injuries incurred during sexual assault (such as stitches). Coverage policies for these services vary by state and are not necessarily guaranteed to be provided without cost-sharing.
The scope of coverage required by states is particularly unclear when it comes to lab testing, drug testing, pregnancy testing, and STI testing. For example, although MFEs typically include urinalysis, some states choose to specify that they cover these services as part of the kit, but many others do not. Because the services included in a rape kit are not explicitly defined in statute or by federal regulation, it is unclear whether states consider these services a part of the forensic exam (which they are required to cover in full per VAWA) or if they mandate them through separate state laws.
Furthermore, 17 states cap how much the state will spend on services per victim. For example, Georgia, Nevada, and Pennsylvania all limit spending to $1,000 per victim. Some states cap costs for the MFE, some states cap the costs paid to the provider but make clear that the patient will not have to pick up the extra costs, and some states specify ceilings for other services, such as medication or laboratory testing. Medical costs outside of the MFE may expose survivors to cost sharing following sexual assault in any state as VAWA does not explicitly mandate coverage for these services. Variation in state requirements contributes to differences in out-of-pocket costs between states.
Figure 1: State Coverage Requirements for Lab Tests, Medications, and Treatments often Provided to Victims of Sexual Violence
Access to Sexual Assault Nurse Examiners & Guaranteed No-Cost Rape Kits Varies by State and Exam Site
Sexual Assault Nurse Examiners (SANEs) or Sexual Assault Forensic Examiners (SAFEs), which are used interchangeably in this paper, are clinicians who are specially trained in provision of rape kits. Forensic exam nurses often get certified as SANEs after some time of providing rape kits — during this time, as they have already gone through the training, they would still be included under the VAWA coverage requirements. VAWA’s no-cost coverage only applies to rape exams that states confirm meet the criteria outlined in VAWA, effectively exams that are often conducted by SANEs. However, SANEs and other specially trained examiners are not available in every hospital and it is difficult to know where to find a hospital that staffs one of these examiners. The only national database of SANE nurse locations was created in December of 2020 and has identified between 800 and 900 SANE programs in the U.S., whereas there are more than 6,000 hospitals nationally. A Government Accountability Office (GAO) report found that access to SANE options and transportation varied across states. For example, the GAO found that survivors in some rural areas would need to travel two hours to find a hospital staffed by a SANE.
While some states, like Colorado and Massachusetts, publicly post a list of SANE locations, most states do not. As it stands, in order to find a trained examiner most survivors would need to call their local police department or a sexual assault service provider, like a hotline or local crisis center, or obtain access to the national database mentioned above. In some cases, the examiner may travel to the location of the patient to conduct the exam — in this case, it is the responsibility of the billing department to recognize the exam as covered, even if the location does not usually provide rape kits.
Although VAWA is widely believed to guarantee the provision of rape kits without cost-sharing for all, there are many gaps which may leave a survivor subject to out-of-pocket costs. These include a limited availability of rape kits, lack of clarity on coverage policies for non-SANE providers offering rape kits, as well as varying definitions of what services are included in rape kits between states, and unclear processes if a hospital or an insurer charges out of pocket costs (Figure 2).
Figure 2: Reasons Why Someone Might be Charged for Care and Treatment following a Sexual Assault
Out-of-Pocket Costs for Rape Kit Services Under Private Insurance
According to a Department of Justice guide on STOP grant funding, states can require or ask victims to submit charges for exams to their personal insurance providers, but they must ensure that victims are not billed any costs, such as co-payments or deductibles, for the services that constitute the MFE. We analyzed a sample of private insurance medical claims from the 2016 to 2018 IBM Health Analytics MarketScan Commercial Claims and Encounters Database, which contains claims information provided by large employer plans to examine out of pocket spending on typical rape kit services delivered in an outpatient hospital or emergency room setting. For more information see the Methods section.
Our analysis included identified episodes in which an adult women received a sexual violence diagnosis and either a STI test or exam procedure code typical of a rape kit (such as tissue examination or salvia swab), at an outpatient clinic, emergency room or urgent care clinic.
Eighty-three percent of women presenting under these circumstances and receiving an initial sexual violence diagnosis incurred out-of-pocket costs. On average, women facing out-of-pocket expenses in one of these cases faced $466 in cost-sharing, with half of women spending more than $226 dollars for all outpatient services.
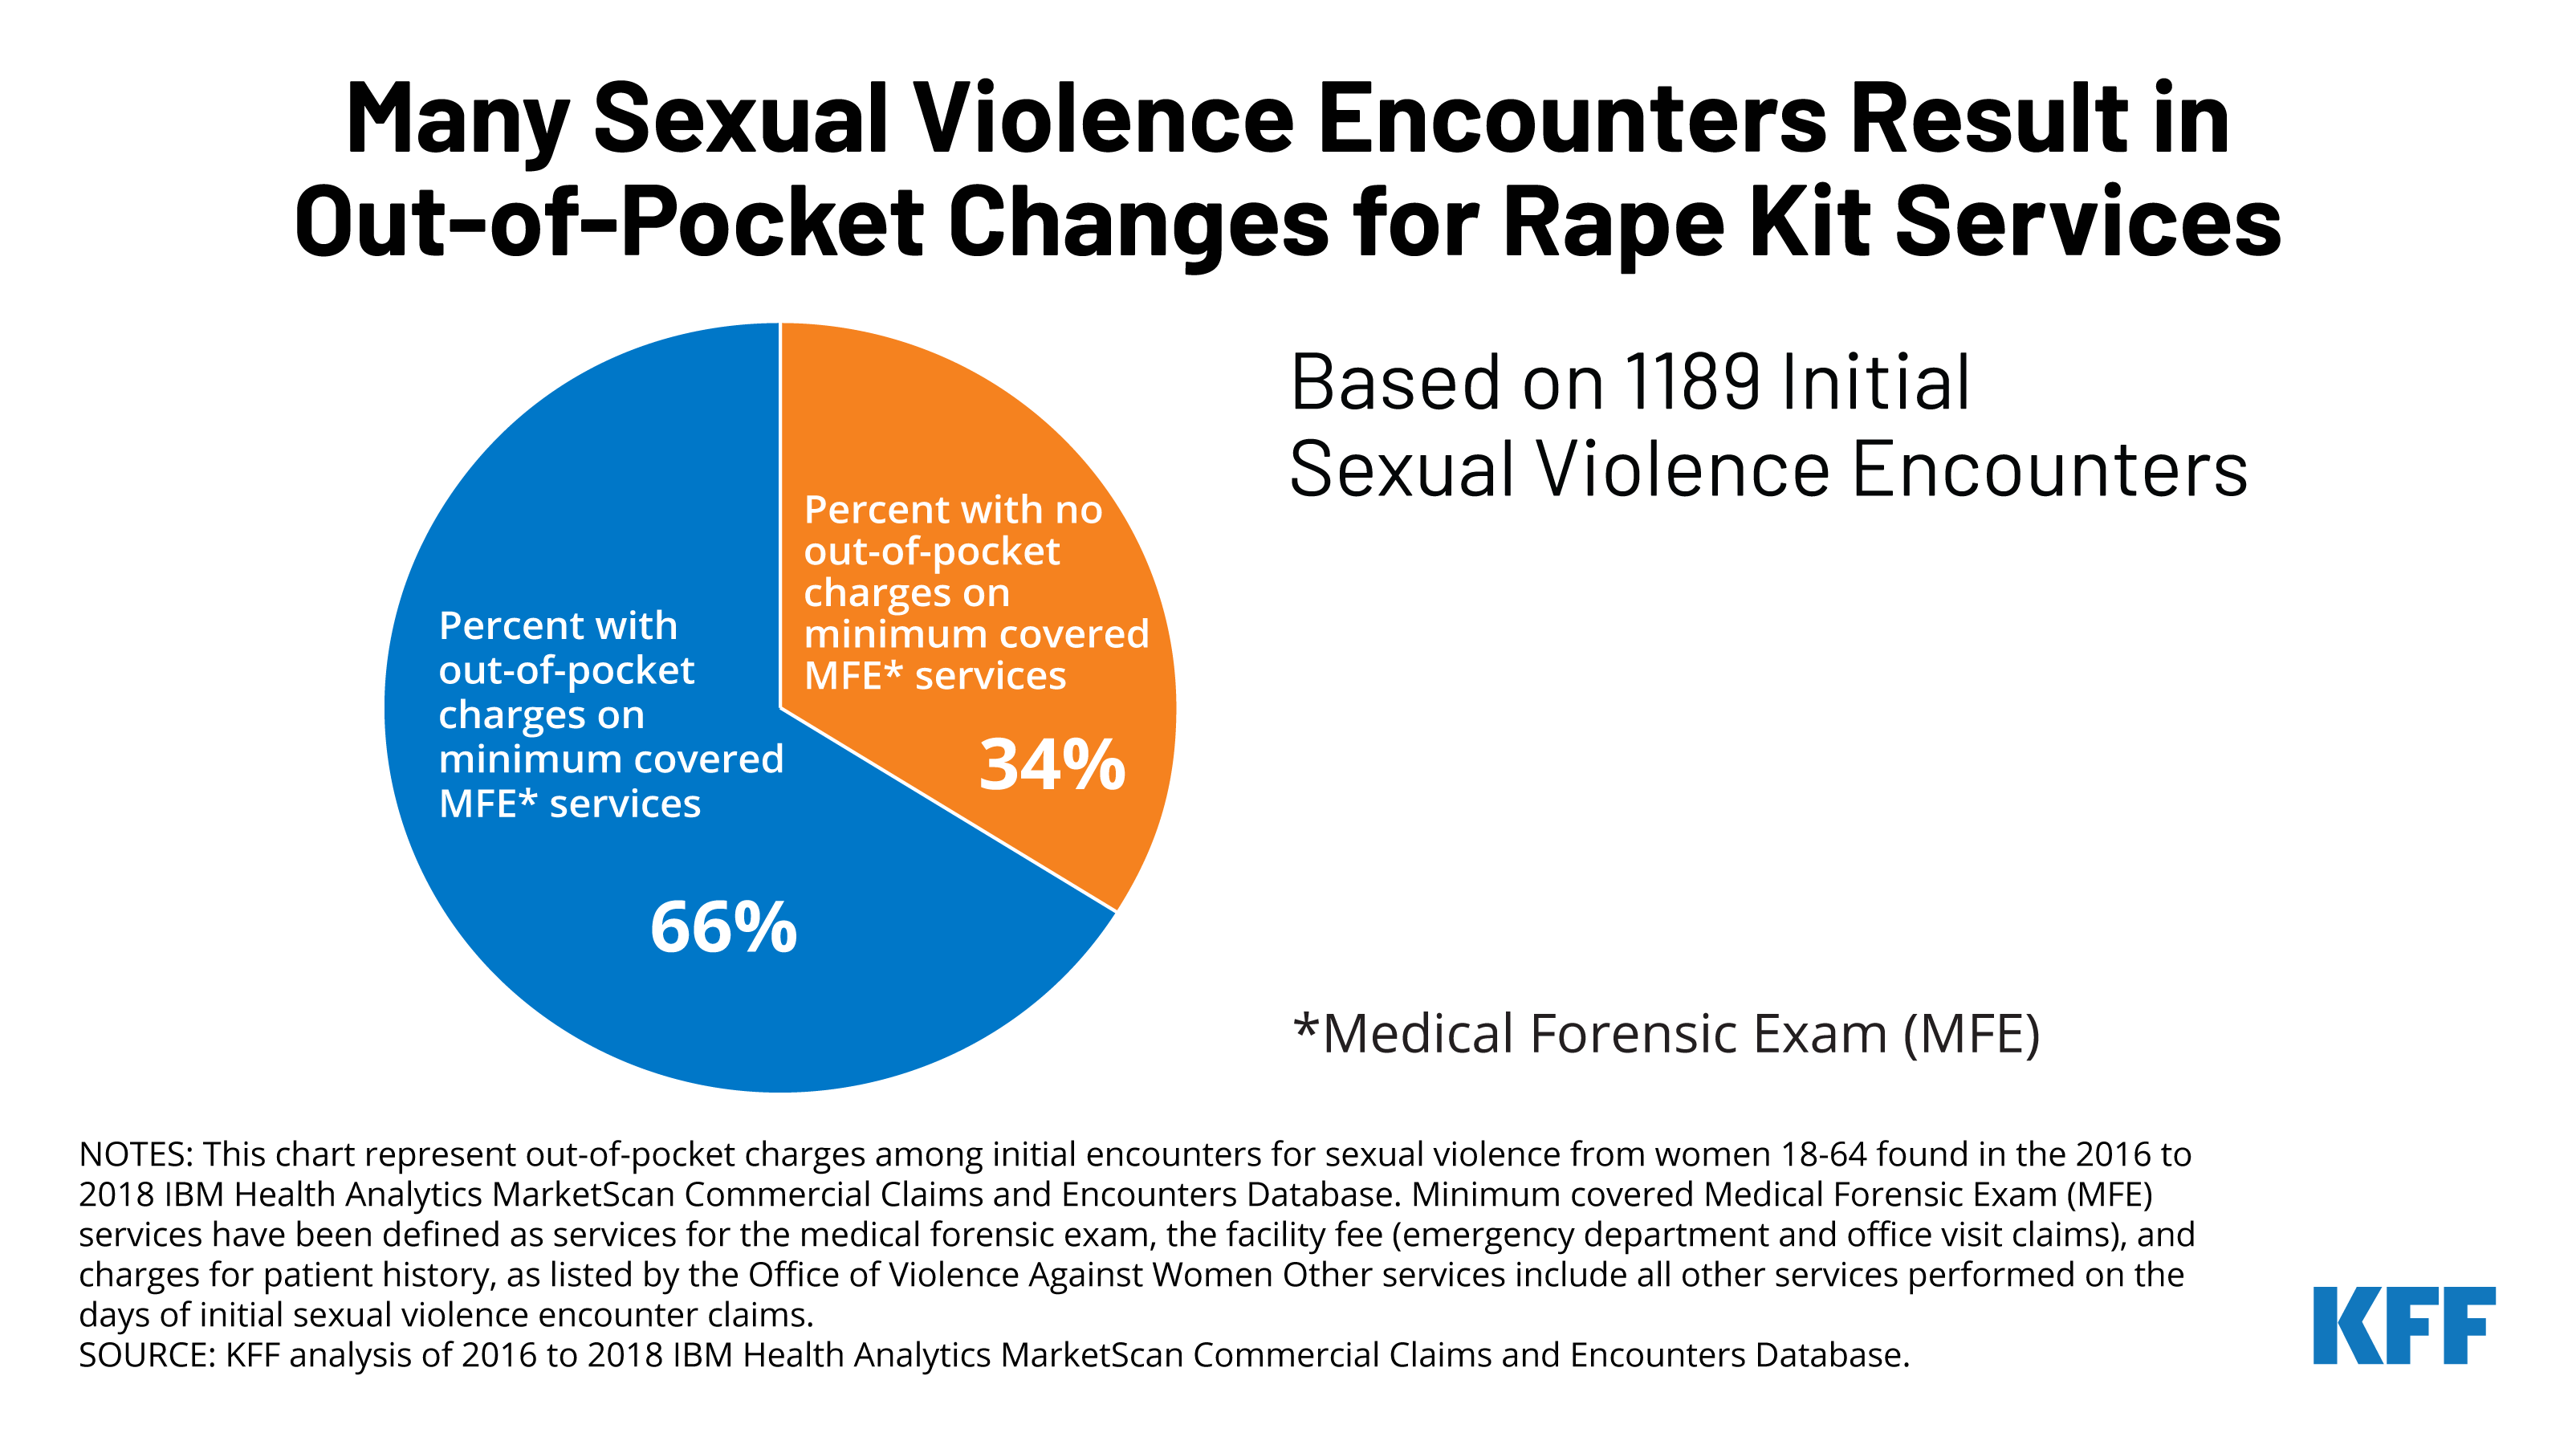
We then classified the different procedures that were billed as part of these encounters and identified a set of procedures that are often included as part of an MFEs: evaluation and management services or observation, patient history, swabs for DNA testing, and examinations of skin, hair, and nails. Two-thirds (66%) of survivors in this sample were charged out of pocket for at least one of these services (Figure 3). For example, among survivors who had a claim for emergency evaluation and management, roughly three quarters (74%) incurred out-of-pocket costs for these services. Among women facing cost-sharing for services often included in the MFE (an emergency room evaluation and management charge, an exam, patient history, pregnancy or STI test), victims with cost-sharing spent an average of $347 dollars, with half of women spending more than $200.
Figure 3: Many Sexual Violence Encounters Result in Out-of-Pocket Charges for Rape Kit Services
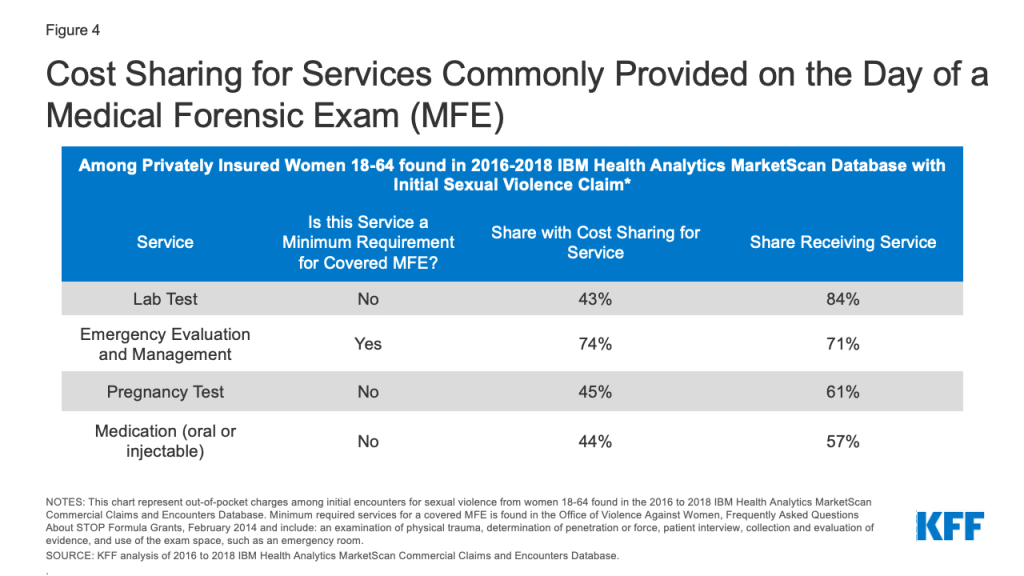
Many survivors also incurred cost sharing for a variety of services outside of the minimum covered services. While these services are not necessarily subject to the VAWA requirement for no-cost coverage of evidence collection, they are important components of care after a sexual assault for many survivors. For example, the majority of survivors had lab tests, pregnancy tests, and oral or injected medications such as antibiotics (Figure 4). Nearly half of all patients were charged out-of-pocket costs for these services. Other notable services, which were less frequently provided to survivors, also incurred out of pocket charges. This includes half (52%) of encounters that used an ambulance and almost half (47%) of those who had drug tests (data not shown). This analysis is consistent with previous research which also found that many patients were charged cost-sharing on days that they received rape kits.
Figure 4: Cost Sharing for Services Commonly Provided on the Day of a Medical Forensic Exam (MFE)
These data illustrate that many survivors of sexual violence are faced with charges for health services typically considered standard care after sexual violence but not necessarily directly relevant to obtaining evidence for law enforcement.
For uninsured survivors, the costs for the MFE would go directly to the state agency paying for the evidence collection, but survivors could still be charged for services that are outside of the MFE. Out-of-pocket charges for these services could, in theory, be submitted for reimbursement through the survivor’s state Crime Victim’s Compensation (CVC) office.
Looking Forward
Sexual violence survivors often face an array of short- and long-term health needs. Provisions in the VAWA were intended to eliminate cost barriers for victims of sexual assault to obtain forensic exams following an assault. This analysis on the immediate health charges experienced by people following an incident of sexual violence finds that in a large sample of medical claims among adult women who are insured and who are provided with a rape kit following a sexual assault, most faced out-of-pocket costs for this care. While provisions in VAWA were intended to prevent out-of-pocket charges for this care, many survivors are still faced with charges.
Victims of sexual assault in all states should not have to pay any out of pocket costs for MFE services. However, our analysis finds that some women are being charged for these services. Whether they are insured or uninsured, many survivors would likely not have or be able to get the information they need to navigate this complex system and obtain funds to cover their out-of-pocket medical and health costs following a sexual assault. They would also have to know that their MFE could be charged to their insurance first, that coverage of costs outside of evidence collection depends on their state’s policies, and that their state’s CVC might be required to cover their remaining costs.
Existing gaps in VAWA can result in survivors facing cost-sharing or barriers to access when victims seek services. These include the overall lack of SANEs and other trained providers in many hospitals, variation between states in what services they require to be covered in a rape kit, and variation in rules and processes for accessing CVCs.
The newly reauthorized VAWA, recently signed by President Biden, the original sponsor of VAWA in 1993, will likely address some of these gaps. For example, the law supports the creation of the first government-sanctioned database that would identify where SANEs are located to increase the likelihood that a victim of sexual violence obtains an exam and receives care that protects them from out-of-pocket charges. However, the new law will not necessarily prevent out-of-pocket charges for all health services needed following an assault.
Some have proposed other options to address these gaps outside of the VAWA legislative vehicle. The Survivor’s Access to Supportive Care Act (SASCA), reintroduced to Congress in 2021, aims to increase access to and availability of SANEs and would require the Office of the Inspector General to issue a report concerning hospital compliance about access to and reimbursements for MFEs.
Despite the protections and funding that VAWA offers to support victims of sexual violence, some people continue to incur out-of-pocket spending after a sexual assault, presenting another barrier to care for those who have just experienced trauma.
Appendix 1: State Requirements for Coverage of Services in Medical Forensic Exams
Appendix 2: Methods for analysis of out-of-pocket costs in claims from IBM Marketscan database
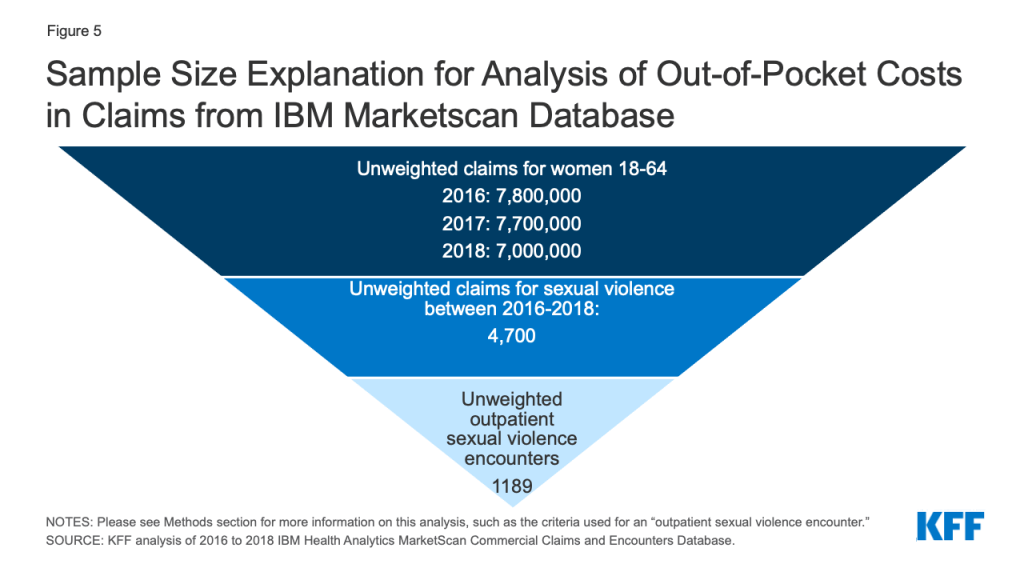
We analyzed a sample of medical claims obtained from the 2016 to 2018 IBM Health Analytics MarketScan Commercial Claims and Encounters Database, which contains claims information provided by large employer plans. We only included claims for women between the ages of 18 and 64.
We further limited this analysis to women with claims for sexual violence (Figure 5). Sexual violence claims were defined as services in which an ICD-10 diagnosis code of T7421XA (Adult sexual abuse, confirmed, initial encounter), T7621XA (Adult sexual abuse, suspected, initial encounter) or Z0441 (Encounter for examination and observation following alleged adult rape) was assigned to the record. This method does not include services rendered to women who received a diagnosis of sexual exploitation, or received services to treat sexual violence after the initial encounter or in which another diagnosis was used on the claim. In total, over 4,700 unweighted enrollees had at least one claim of sexual violence over the three-year period.
Sexual Violence ICD-10 Diagnosis Codes
ICD-10 Diagnosis
Description
Z0441
Encounter for examination and observation following alleged adult rape
TZ421XA
Adult sexual abuse, confirmed, initial encounter
T7621XA
Adult sexual abuse, suspected, initial encounter
Of the 4,700 unweighted enrollees that had at least one claim of sexual violence over the three-year period, these claims were further limited to those submitted for outpatient care, meaning that inpatient services are not included or the cost of any retail prescription drugs they received after their visit. Claims were aggregated into an episode (‘outpatient days’), so that cost-sharing is considered spending that occurred on consecutive days in which a women has an sexual violence diagnosis and an STI or clinical exam.. We only considered cost-sharing that occurred during the initial encounter. Any cost-sharing on follow-up physician office visits were not included. We used a conservative denominator, including only days in which we expected a rape kit should have been administered: to do so we calculated days in which the survivor presented at an urgent care clinic or hospital (stdplac = 19, 22 or 23) and received both a sexual violence diagnosis and at least one STI test or exam. By doing so, we were attempting to exclude women who were receiving an initial sexual violence diagnosis weeks or years after the crime had been committed. We were unable to capture other locations where MFEs might be offered, like domestic violence safe houses or rape crisis centers.
In total there were 1189 unweighted sexual violence encounter outpatient days that met these criteria. Many of these outpatient days included claims with other diagnoses including depression screenings, treatments for physical violence or infection. In this analysis, we present cost-sharing for a limited set of services independent of these additional diagnoses. We looked at CPT codes related to pregnancy testing, STI testing, lab testing, drug testing, vaccines, medication (oral and injections), infusions, emergency department visits, patient history, office visits, diagnostic imaging, ambulance use, psychology use, contraception, pap smears, pregnancy care, procedures performed, physical therapy, and the MFE itself.
Figure 5: Sample Size Explanation for Analysis of Out-of-Pocket Costs in Claims from IBM Marketscan Database
Weights were applied to match counts in the Current Population Survey for enrollees at firms of a thousand or more workers by sex, age, and state. Weights were trimmed at eight times the interquartile range. On average 23% of women in large group plans are represented in the dataset.
This dataset does not include cases in which a person receives a rape kit but no claims are submitted to the insurer. Therefore, this data is not well suited for calculating prevalence of sexual violence, as spending is limited to women who received services, a diagnosis indicating sexual violence and the plan received the claim. This study attempts to discuss the cost-sharing faced by survivors presenting in a limited set of circumstances and not the financial burden of sexual violence overall. Cost-sharing includes the spending a woman faces from copays, coinsurances and deductibles.
The state policy tracking in shown in Appendix Table 1 was collected between June 2021 and December 2021. This data may change over time as fluctuations in state funds often impact what services states are able to cover.
The Department of Justice (DOJ) defines rape legally as the penetration, no matter how slight, of the vagina or anus with any body part or object, or oral penetration by a sex organ of another person, without the consent of the victim. Nearly 1 in 5 women in the United States have experienced attempted or completed rape during their lifetimes. In this paper, rape and sexual assault are used interchangeably, although sexual assault is an umbrella term that also includes attempted rape, unwanted sexual touching, and forcing the victim to perform sexual acts. The reason these terms are used interchangeably in this paper is that rape kits and associated services may be needed even in cases outside of the scope of the DOJ definition of rape.
↩︎
The Families First Coronavirus Response Act (FFCRA), enacted at the beginning of the coronavirus pandemic, requires states to provide continuous enrollment to Medicaid enrollees until the end of the month in which the public health emergency (PHE) ends in order to receive enhanced federal funding. During this time, states generally cannot disenroll people from Medicaid, which has prevented coverage loss and churn (moving off and then back on to coverage) among enrollees during pandemic. The PHE is currently in effect through mid-April 2022 and the Biden administration has said it will give states 60 days’ notice before the PHE ends. Since that notice was not issued in February 2022, it is expected the PHE will be extended again, although there is uncertainty over how long the extension will last.
Once states resume redeterminations and disenrollments at the end of the PHE, Medicaid enrollees who moved within a state during the pandemic but are still eligible for coverage are at increased risk of being disenrolled if their contact information is out of date. Many state Medicaid programs are heavily reliant on the mail for communicating with enrollees about renewals and redeterminations, including requests for information and documentation. States can disenroll individuals who fail to respond to these requests. We analyzed federal survey data for 2020 and found:
Roughly 1 in 10 Medicaid enrollees (9%) moved in-state in 2020. A much smaller share, just 1%, moved to a different state in the U.S. Individuals that move within the same state may continue to be eligible for Medicaid, while a move out of state would make them no longer eligible for Medicaid coverage in their previous state. Shares of Medicaid enrollees moving within a state has trended downward in recent years, but trends could have changed in 2021, as more people became vaccinated against COVID-19 and the national eviction moratorium was lifted in August 2021.
Among those covered by Medicaid, young adults and single-parent families with children were more likely to move within a state than other groups. Among Medicaid enrollees that moved within the same state in 2020, half (50%) moved for housing-related reasons and 28% moved for family-related reasons.
States can take a number of actions to update enrollees’ addresses and other contact information to minimize coverage gaps and losses for eligible individuals after the end of the PHE, particularly for individuals who may have moved within a state. These actions include conducting direct outreach to enrollees, partnering with managed care organizations and other stakeholders in outreach efforts, developing clear policies for returned mail, and checking available data sources for more up-to-date contact information. A recent survey of states found that most states (46) were taking proactive steps such as these to update contact information, although fewer (35) are following up on returned mail. Careful monitoring and oversight of state progress during the unwinding period could provide information to prevent erroneous terminations of coverage.
Introduction
To understand who may be at increased risk of losing Medicaid coverage because of out-of-date contact information, this brief analyzes data from the Current Population Survey’s (CPS) Annual Social and Economic Supplement (ASEC) from March 2021 to examine the share of Medicaid enrollees who moved within a state (and therefore are more likely to remain eligible for Medicaid in the same state) in 2020 and the demographic characteristics of those individuals. It also examines trends in residential mobility over time and discusses strategies states can adopt to minimize coverage losses among these individuals.
The data used in our analysis reflect mobility patterns during 2020 and were collected before important events, such as when the COVID-19 vaccine became widely available to all adults and the end of the national eviction moratorium, that may have affected the number of people who moved more recently. Additionally, our analysis focuses on non-elderly Medicaid enrollees (because enrollees ages 65 and older likely have Medicare as their primary source of coverage) and so we refer to non-elderly Medicaid enrollees simply as “enrollees” for the remainder of this brief. See the Methods box at the end of this brief for more details about the analysis and limitations.
What do we know about Medicaid enrollees who moved in-state in 2020?
Roughly 1 in 10 Medicaid enrollees (9%) moved in-state in 2020. A much smaller share, just 1%, moved to a different state in the U.S., which would make them no longer eligible for Medicaid coverage in their previous state. The share of enrollees moving within the same state was slightly higher compared to people who are not enrolled in Medicaid (8%), although the share was not significantly different for non-enrollees who moved to a different state in 2020 (2%). These estimates are based on CPS ASEC data, which asks survey respondents whether they lived in the same house one year ago. One limitation of this approach is that the CPS ASEC data do not identify people who have moved multiple times over the course of the year, reflecting more severe housing instability that is more common among low-income populations. Additionally, these data do not identify temporary (or seasonal) moves during the year, such as moving in with family or friends, which became more common in 2020 and early 2021 in response to the pandemic.
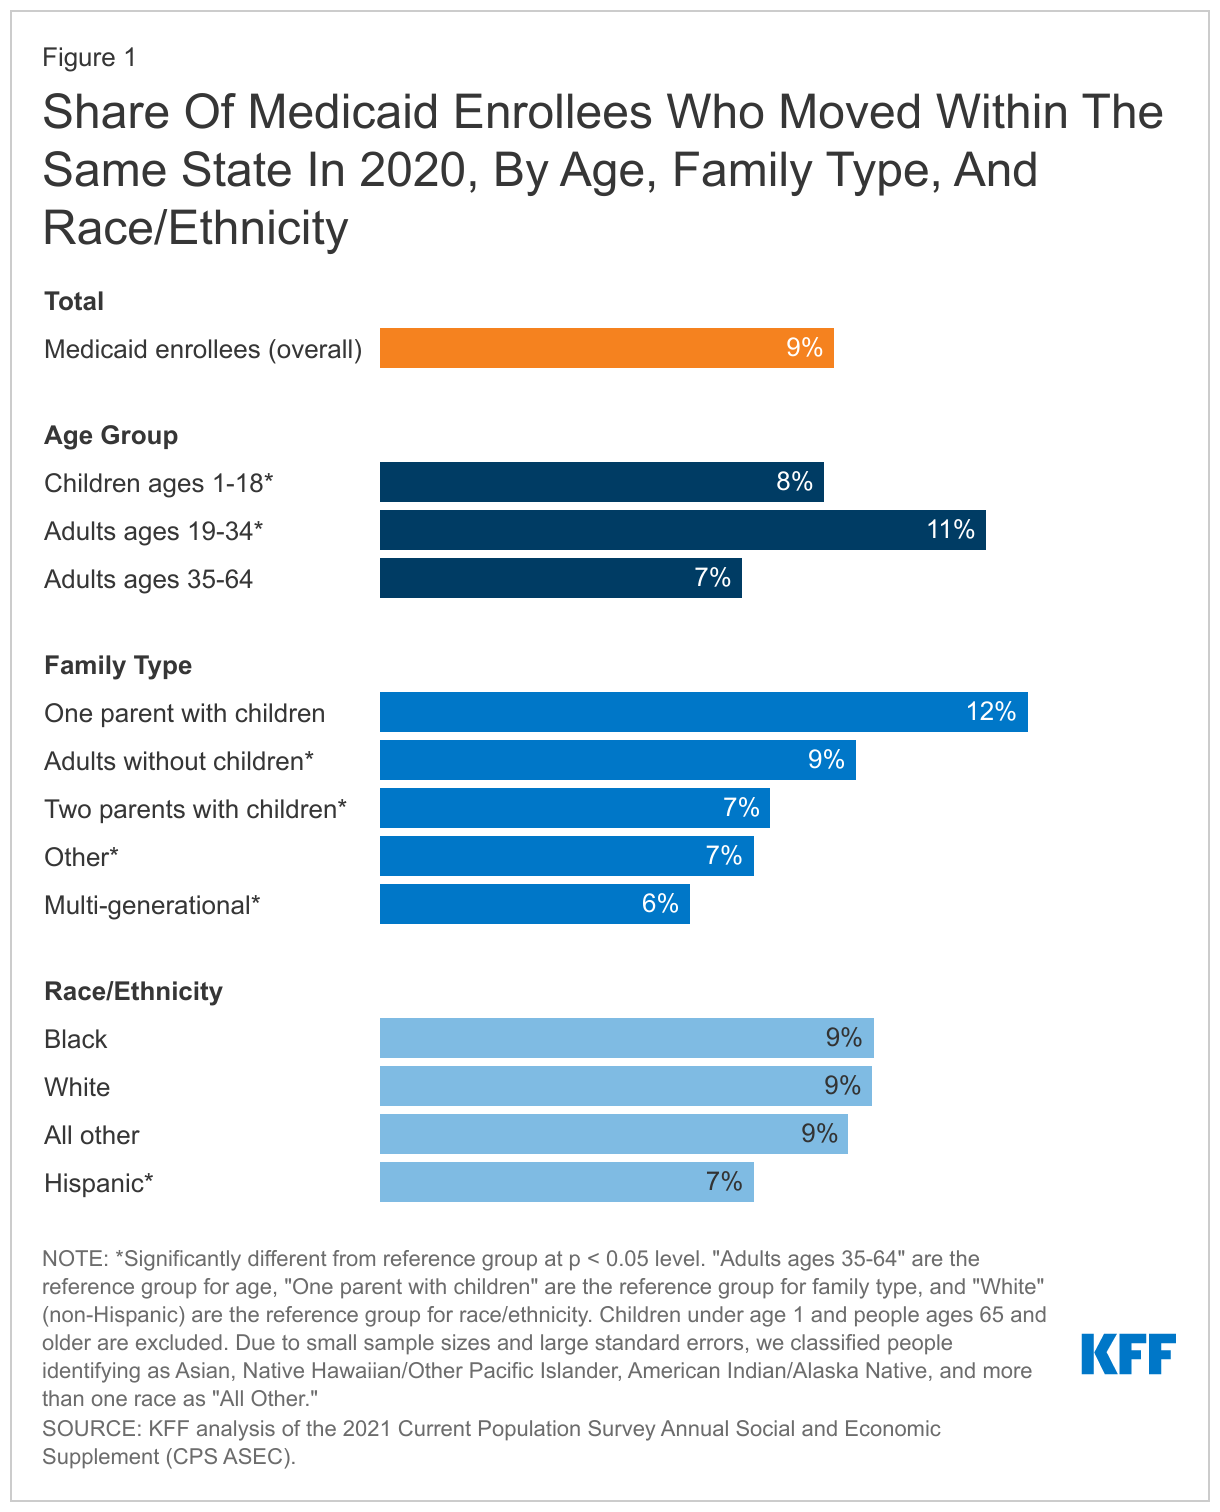
Among those covered by Medicaid, young adults and single-parent families with children were more likely to move within a state than other groups (Figure 1). In 2020, approximately 11% of young adults (ages 19-34) with Medicaid coverage moved in-state compared to 8% of children and 7% of adults ages 35-64 with Medicaid. Among the different family types analyzed, enrollees who live in single-parent families were the most likely to move in 2020 (12%), while enrollees living in multi-generational families were among the least likely to move (6%). When we compared residential mobility by race/ethnicity, a smaller share of Hispanic people enrolled in Medicaid moved within state in 2020 (7%) compared to White people (9%), while the shares of Black people (9%) and people of other races (9%) who moved were not different compared to White people.
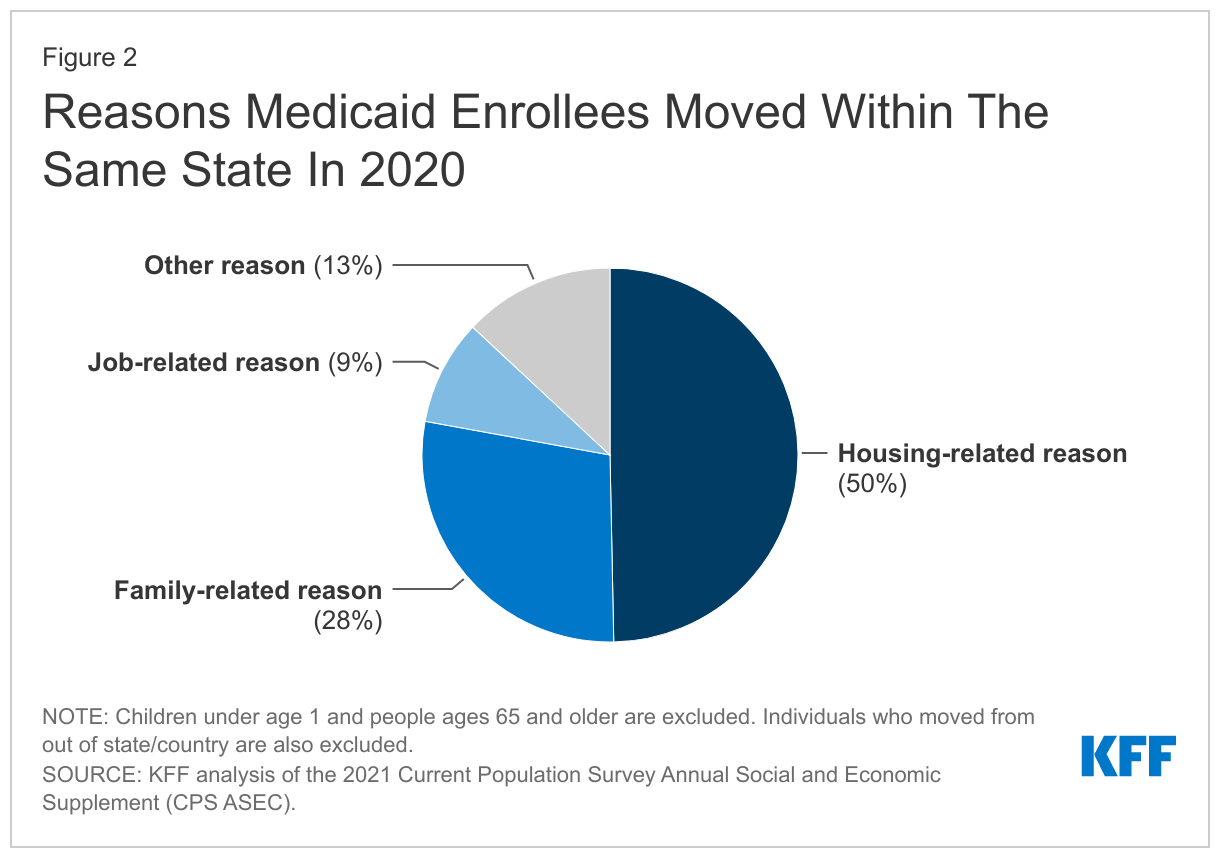
Among enrollees that moved within the same state in 2020, half (50%) moved for housing-related reasons and 28% moved for family-related reasons (Figure 2). Housing-related reasons include wanting a better home and/or neighborhood, wanting cheaper housing, foreclosure or eviction, and other unspecified housing-related reasons. Family-related reasons include establishing one’s own household, changes in marital status, and other unspecified family reasons. Generally, Medicaid enrollees were more likely to move in-state for family-related reasons compared to people who were not enrolled in Medicaid (28% vs. 24%) and were less likely to move in-state for job-related reasons compared to people who were not enrolled (9% vs. 12%). Medicaid enrollees and non-enrollees both moved within the same state for housing-related or other reasons at about the same rate. When compared to the reason people moved in 2018 (the most recent measurement year before the pandemic), Medicaid enrollees’ reasons for moving have stayed relatively steady despite economic disruptions in 2020 related to the pandemic.
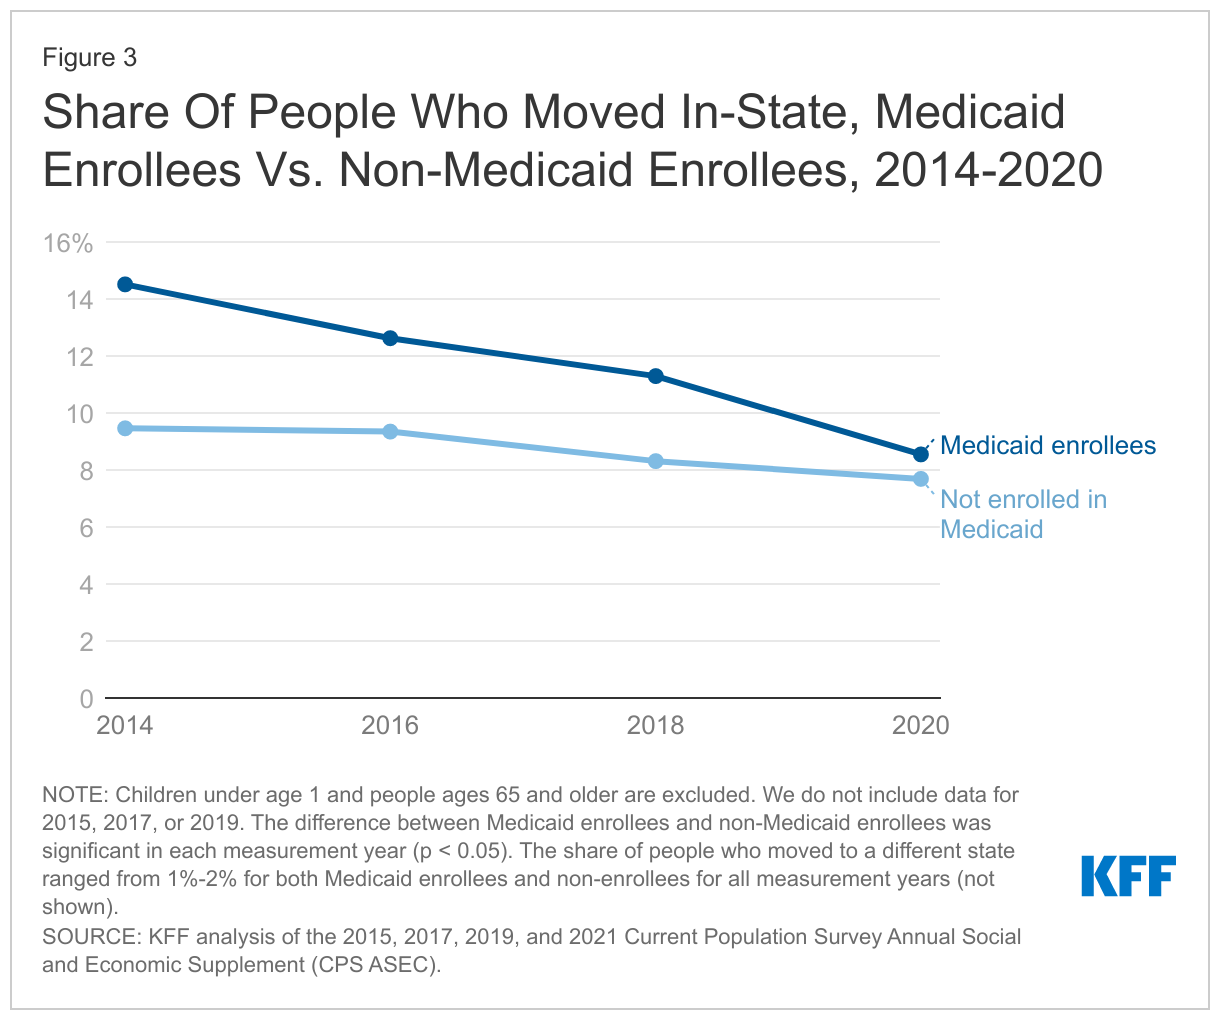
The share of Medicaid enrollees moving within the same state has declined slightly in recent years, from 15% in 2014 to 9% in 2020, although that trend could change in 2021 and 2022 (Figure 3). Declining shares of Medicaid enrollees moving within the same state since 2014 mirrors national trends of fewer people moving over time. However, the share of Medicaid enrollees moving has decreased faster compared to non-enrollees in recent years. While the pandemic has raised concerns about economic disruptions and housing instability among low-income populations, the data for 2020 indicate that residential mobility among both Medicaid enrollees and non-enrollees largely followed pre-pandemic trends. However, these trends could have changed in 2021, as more people became vaccinated against COVID-19 and the national eviction moratorium was lifted in August 2021.
How can states minimize coverage losses among eligible enrollees who move?
With the continuous enrollment requirement in place during the PHE and the prohibition on disenrolling individuals from Medicaid, states may not be communicating regularly with enrollees and, as a result, may have outdated contact information for those who have moved within the state during the past two years. When the PHE ends and states resume routine redeterminations and disenrollments, some enrollees may be at risk of losing coverage simply because they do not receive notices or renewal information. As states prepare to resume normal operations, they can take a number of actions to update enrollee addresses and other contact information to minimize coverage gaps and losses for eligible individuals. The Centers for Medicare and Medicaid Services (CMS) has developed a broad set of policy and operational strategies states can adopt to maintain continuous coverage for eligible individuals, including specific strategies for updating contact information and reducing returned mail:
Conduct communication campaigns through mail, text, and email to encourage enrollees to provide updated contact information. States can send periodic notices during the PHE to remind enrollees to update their contact information. To the extent states have alternative contact information, they can also reach out through automated phone calls, text messages and emails. And, to ensure that enrollees are reminded when they proactively reach out to the Medicaid or other social services agencies, states can update call center scripts to request updated contact information at the beginning of the call and can add alerts to Medicaid, CHIP, and social services websites.
Partner with managed care organizations (MCOs), community-based organizations, application assisters, and providers in outreach efforts. To expand the reach of outreach efforts, states can work with MCOs, community partners, and providers to reinforce messages and remind enrollees to provide updated information. Enrollees are used to receiving communication from MCOs and may be more likely to respond to reminders from them. Navigators and certified application assisters can also be effective partners because they regularly update contact information during interactions with clients. States can opt to accept updated information from these entities, or in the case of MCOs require that they share this information but should develop policies for verifying updated information with enrollees.
Develop clear policies for following up on returned mail that can include checking available data sources and contacting enrollees via phone, text, or email. When mail is returned and no forwarding address is provided, states are encouraged to check available data sources, including the United States Postal Service (USPS) National Change of Address Database, the Supplemental Nutrition Assistance Program (SNAP), Temporary Assistance for Needy Families (TANF) or other programs, and/or contact information from MCOs. They can also contact enrollees via phone, text, or email to obtain updated mailing addresses.
To prepare for the end of the PHE and continuous enrollment requirement, most states (46) are taking proactive steps to update enrollee addresses, although fewer (35) are following up on returned mail as of January 2022. Actions to update addresses include conducting outreach to enrollees, checking other programs for updated addresses, and working with managed care plans and providers to update address information. States that follow up on returned mail are most likely to call or email enrollees using information on file when they received returned mail from a notice sent to an enrollee.
Looking Ahead
As states resume redeterminations and disenrollments at the end of the PHE, evidence suggests that it is unlikely that large proportions of enrollees would be no longer eligible for Medicaid because they moved out of state. When asked to predict the primary reasons people will lose coverage after the continuous enrollment requirement is lifted, few states (3) identified moving as a key driver of disenrollments, and all cited other reasons, including increased income or other changes in circumstances, in addition to moving. While the number of Medicaid enrollees moving within the same state did not increase during the first year of the pandemic, the 9% of Medicaid who moved in-state in 2020 still amounts to a significant number of enrollees whose contact information is more likely to be out of date and who are at increased risk of losing coverage as states unwind the continuous enrollment requirement. It is also possible that, as the pandemic continued into 2021 and 2022, the cumulative number of Medicaid enrollees who moved has increased as well. States with relatively large numbers of disenrollments due to returned mail may indicate erroneous terminations, as returned mail alone does not necessarily indicate a change in economic circumstances that affects eligibility, especially when relatively few enrollees move out of state (approximately 1% of enrollees in 2020). Careful monitoring and oversight of state progress during the unwinding period could provide information to prevent erroneous terminations of coverage.
Methods
We analyzed data from Current Population Survey’s (CPS) Annual Social and Economic Supplement (ASEC) from March 2021, 2019, 2017, and 2015. These data provide information on who moved during the previous year (2020, 2018, 2016, and 2014, respectively). Our analysis focuses on people who had Medicaid coverage at some point during the year and who moved within the same state (moving out of state would mean that the enrollee no longer qualifies for Medicaid coverage in the previous state). We exclude enrollees ages 65 and older since nearly all would qualify for Medicare and are less likely to lose their primary source of coverage. Children under age 1 are also excluded because the CPS ASEC questions on moving as of March of the previous year are not applicable to respondents under age 1. Our analysis also focuses on individuals who moved within the US. While our analysis includes a small number of people who have moved from outside the U.S. (i.e., from a US territory or a foreign country), we do not include these individuals in our counts of people who moved in-state or to a different state. For the March 2021 CPS data (and not for previous years), we analyzed differences in selected demographic groups, including age group, family type, and race/ethnicity. We also analyzed the share of people moving within state by sex, urban/rural (using metropolitan statistical areas as a proxy), and foreign born, but we did not find significant differences between these groups and so are not shown in Figure 2. All differences reported in this brief are measures at the p < 0.05 level.
The analysis focuses on individuals and uses person weights, which is important for interpreting our findings on demographic groups. For example, although children will typically move with adults, the difference between child enrollees and older enrollees reflects situations where adults do not live with children or, in some cases, children (especially those aged 18) who do not live with adults. In other households, the children may be enrolled in Medicaid but their parents are not, or there could be more children enrolled in Medicaid than adults (or vice versa). In analyzing family type, we consider the type of family for each individual. For example, while we excluded enrollees ages 65 and older from our analysis, child enrollees who live with their parents and grandparents are considered to live in multi-generational households.
We conducted a robustness check of our findings by comparing the share of people moving in-state as identified in the CPS ASEC versus the American Community Survey (ACS). We compared findings for Medicaid enrollees and non-enrollees ages 1-64, using data collected in the March 2019 CPS ASEC sample and the 2019 ACS sample. Generally, the percent of people moving in-state over the past year were slightly lower in the March 2019 CPS ASEC sample (11% of enrollees and 8% of non-enrollees) compared to the 2019 ACS sample (13% of non-enrollees and 11% of non-enrollees). We would expect some differences due to different and data collection methods and timing between CPS and ACS, and so the difference of 2 or 3 percentage points seemed reasonably small.
Our findings have important limitations. First, the CPS ASEC sample does not tell us when a person moved. So, we do not know whether the person was enrolled in Medicaid before, during, or after the move. Additionally, we do not know how many times a person moved and, depending upon timing, temporary moves may not be captured. Second, the latest CPS data used here only provide data for 2020, but the economic impacts of the pandemic have lasted much longer, including when the federal government lifted the national eviction moratorium in August 2021.