California Efforts to Address Behavioral Health and SDOH: A Look at Whole Person Care Pilots

Authors: Michelle Tong and Elizabeth Hinton
Published: Mar 17, 2022

Introduction

The “California Advancing and Innovating Medi-Cal” (CalAIM) initiative was recently approved by the Centers for Medicare and Medicaid Services (CMS) and launched in January 2022. CalAIM seeks to improve health outcomes and advance health equity for “Medi-Cal” (Medicaid) beneficiaries and other low-income people in the state. As of September 2021, over 13 million people were enrolled in Medi-Cal in California – the largest Medicaid program in the nation. CalAIM will leverage Medicaid as a tool to help address complex challenges, including behavioral health access, the health needs of people experiencing homelessness, and the complex clinical needs of justice-involved populations. Central to the demonstration is a person-centered approach, first authorized as “Whole Person Care” (WPC) pilots implemented through a waiver approved by the federal government under section 1115 of the Medicaid statute (known as “Medi-Cal 2020”). The WPC pilot program aimed to coordinate and integrate physical health, behavioral health, and social services for Medicaid enrollees with complex needs. Under CalAIM, the state will incorporate and transition WPC pilot services statewide through the state’s Medicaid managed care system. The California initiatives are part of a growing movement to better meet behavioral health needs and improve equity and health by addressing underlying social determinants.

As CalAIM launches, it is useful to take a closer look at the WPC pilot program and what has been learned to date from its implementation. This brief draws heavily on findings from the interim evaluation, which assessed WPC infrastructure development and implementation and analyzed whether WPC led to “better care and better health” within the first three years. In this brief, we explore key questions involving the WPC pilots, which may provide insights for other states pursuing or contemplating similar strategies for identifying and addressing the medical and non-medical or social needs of high-risk, high-utilizing Medicaid enrollees.

What Were Whole Person Care Pilots (WPC)?

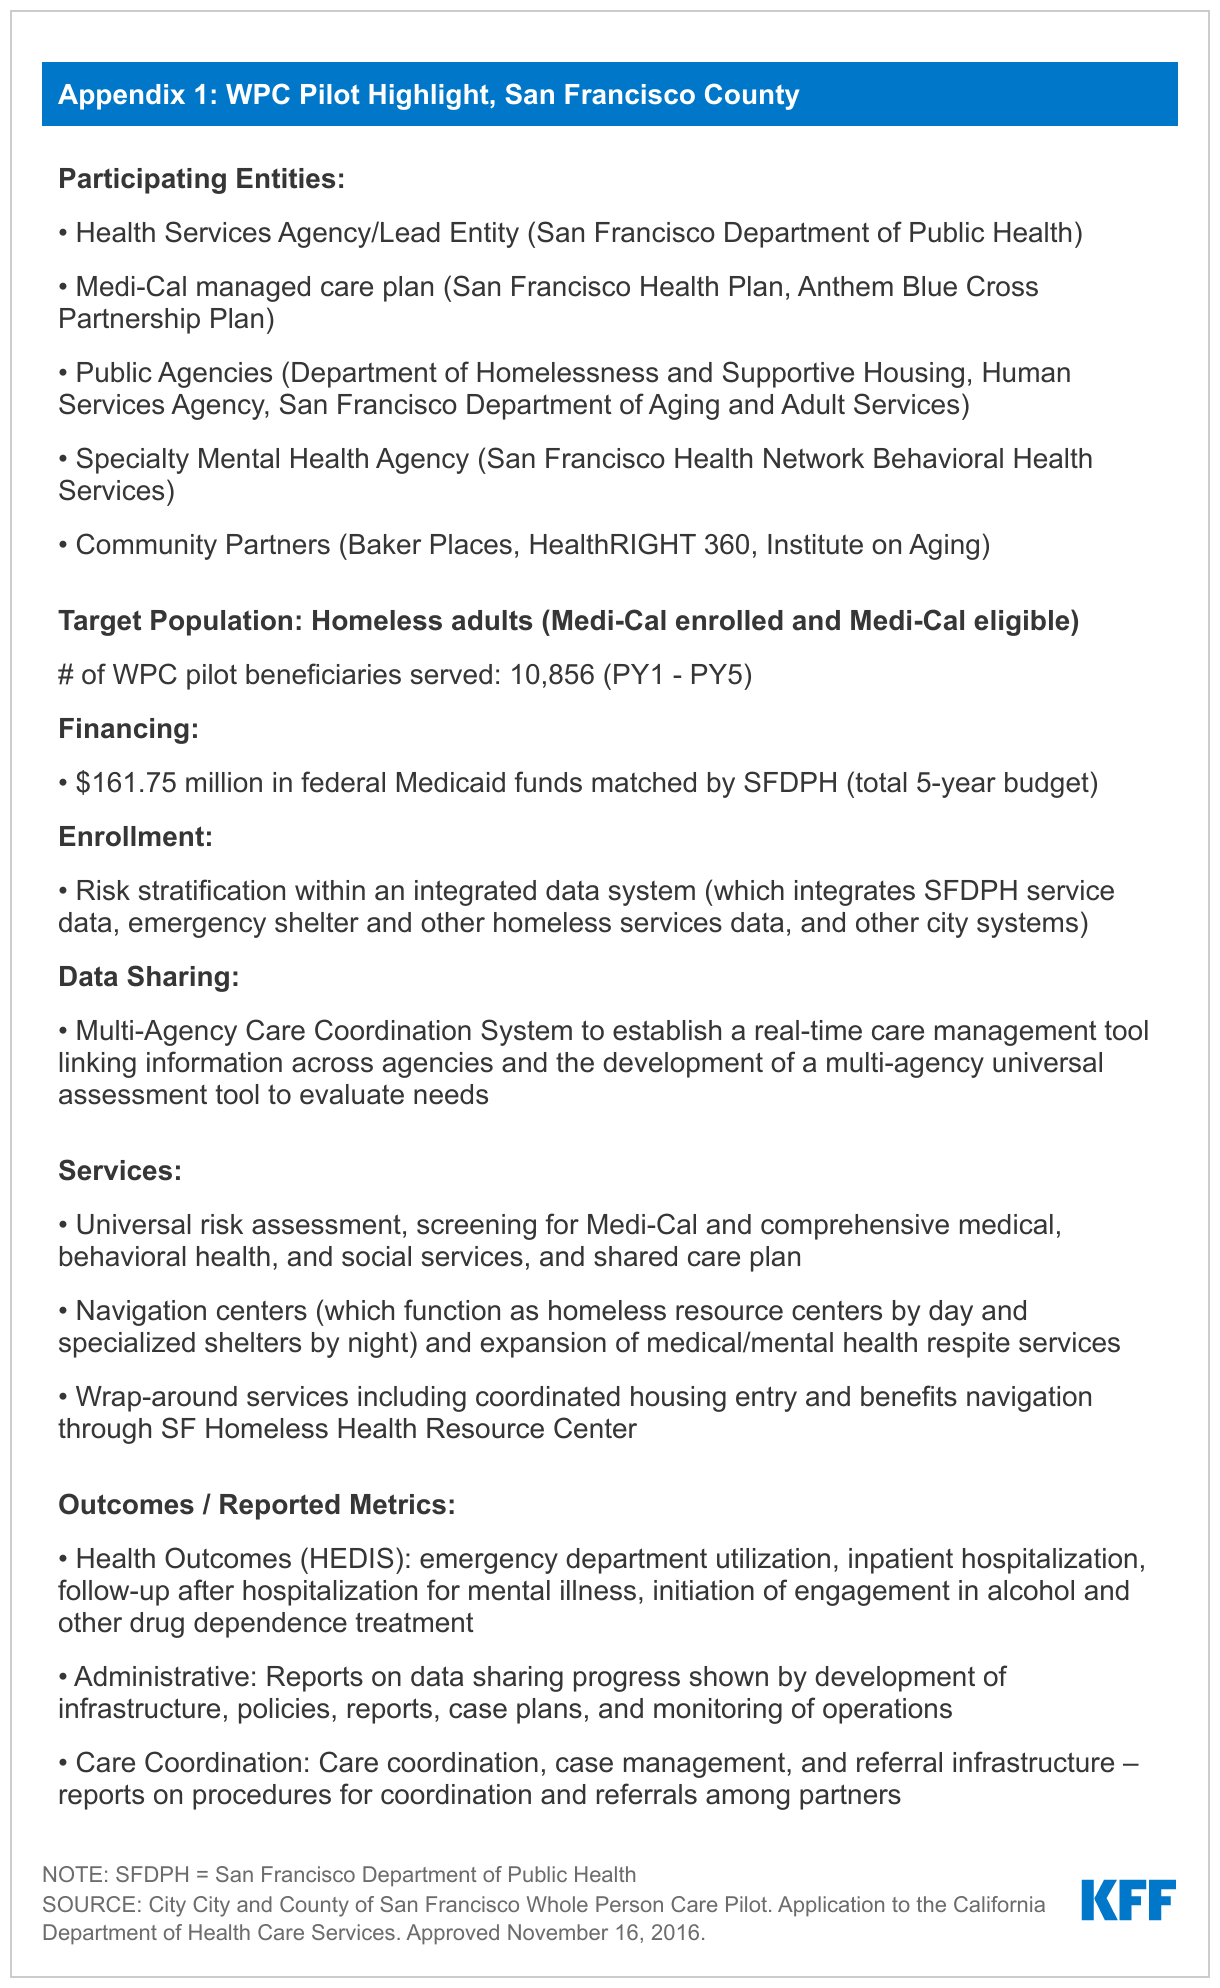
In 2016, California began its “Whole Person Care” (WPC) pilot program, which aimed to coordinate and integrate physical health, behavioral health, and social services for Medicaid enrollees with complex needs. The WPC pilot program also aimed to increase integration and data sharing among county agencies, health plans, and community-based organizations. The pilot was authorized under the state’s Section 1115 waiver. California’s Department of Health Care Services (DHCS) selected 25 WPC pilots (spanning 26 counties) to participate in the program across the state.1  (See Appendix for a spotlight on San Francisco County’s WPC pilot.) Each individual WPC pilot program defined its target population and interventions, within state guidelines. The WPC pilots were scheduled to end in December 2020 but were extended through December 2021 under the state’s Section 1115 waiver.

Each WPC pilot included a “lead entity” and key community partners (called “participating entities”). Lead entities coordinated the pilot, collaborated with local community partners, and served as the single point of contact for DHCS. Lead entities included county health and health services agencies, healthcare systems, behavioral health departments, and a city municipality.2  Each WPC pilot included key community partners, including Medi-Cal managed care plans, county health agencies, other public agencies (e.g., county alcohol and substance use disorder programs, human services agencies, public health departments, criminal justice/probation entities, and housing authorities), and community-based providers.3  In their applications, approved WPC pilots enumerated specific roles of each participating entity in service provision, data management, and implementation of WPC programs. In the initial program years, WPC pilots focused heavily on developing data and administrative infrastructure for data sharing, case management, outreach and enrollment, performance, and quality improvement efforts.

WPC pilots targeted a number of high-risk populations with complex needs. Primary WPC target populations included high utilizers of health care (e.g., those with avoidable use of the emergency room and/or hospital admission), individuals experiencing homelessness or at-risk of homelessness, individuals with multiple chronic conditions, individuals with severe mental illness or substance use disorders (SMI/SUD), and justice-involved individuals. Nearly half (46%) of all pilot enrollees were homeless across target populations, and most were men, 50-64 years old, White, English speaking, and enrolled in managed care. Pilots classified 10% of enrollees as at-risk of homelessness and 6% as justice-involved. Beneficiaries had high rates of hypertension, substance use disorders, and mental health conditions, as well as high rates of service use (particularly SUD services and emergency department visits). Participation in the pilot program was voluntary for eligible individuals. Many WPC pilots used street or shelter-based outreach to identify eligible enrollees.4  Other strategies used to identify pilot enrollees included referrals from health care facilities, health plan eligibility lists, and predictive modeling based on program criteria.

WPC pilot beneficiaries received care coordination and other services not covered by Medi-Cal to address medical, behavioral health, and social needs. All pilots were required to provide care coordination services, but pilots also offered a variety of other services tailored to local needs and available resources. Services offered by WPC pilots included housing-related services, employment assistance, short-term residential care for individuals experiencing homelessness (referred to as “medical respite”), and sobering centers. Given the high need for housing support, pilots commonly provided housing-related services, including housing navigation (to help identify and secure affordable housing), tenancy supports (e.g., security deposit and first month’s rent), as well as landlord incentives and coaching. Other WPC service examples included providing linkages to health, mental health, and substance use disorder services through medical respite, peer support specialists, mobile teams, or service integration teams.

The state’s Section 1115 waiver authorized up to $3 billion in federal and state Medicaid funds over five years for the WPC pilot. For each demonstration year, $300 million was made available in federal financial participation to fund the WPC pilots. The non-federal share was financed through local funds from participating government agencies (also referred to as “intergovernmental transfers” or IGTs). Each WPC pilot had an annual budget and could draw down funds for eligible activities including infrastructure development, data collection, and services/interventions as well as other outcome-based incentive payments. WPC pilots reimbursed for services on a fee-for-service (FFS) (i.e., per service or encounter) basis or using a per-member-per-month (PMPM) bundle.5  In the early stages, pilots were reimbursed for application submission and reporting baseline data, while subsequent years were oriented toward providing services, achieving proposed metrics, and providing incentive payments.

Pilots were required to submit mid-year and annual reports detailing spending and outcome metrics, including NCQA and HEDIS measures as well as county and population-specific measures. The state is also subject to independent evaluation requirements under its Section 1115 waiver. Findings from the state’s interim independent evaluation of the WPC program are discussed in more detail in the section that follows.

What Can We Learn from WPC?

A variety of strategies resulted in the enrollment of more than more than 108,000 unique individuals into WPC between January 2017 and December 2018 (PY 2 and PY 3).6  To identify and enroll eligible individuals, WPC pilots used administrative and electronic medical record data, referrals from partners (managed care plans, health care providers, and clinics), and warm hand-offs from social services agencies. To facilitate referrals into the program, some WPC pilots developed formal contracts with community partners. Pilots also used street- and shelter-based outreach to identify people eligible for but not enrolled in Medi-Cal. To identify the appropriate interventions for enrollees, some pilots developed universal risk assessment tools (used across partner agencies) to stratify client acuity (or level of need) across multiple domains (e.g., health and housing status). To address eligibility gaps in Medi-Cal (also referred to as “churn”), WPC pilots proactively monitored eligibility and renewal dates.7  Nearly all pilots identified low beneficiary engagement – or willingness to enroll and participate in services – as a barrier and stressed the importance of using a “relationship-based” approach to engage medically and socially complex prospective enrollees, as well as a variety of other strategies to foster engagement (e.g., connecting enrollees to immediate benefits, hiring WPC staff with shared lived experience to build trust).8 

Data sharing presented challenges for the vast majority of WPC pilots, although capacity increased over time. The majority of pilots developed electronic platforms to facilitate and track care coordination activities (e.g., care plans, encounter notes, and service referrals). Multiple pilots reported participating in health information exchanges and reported increased utilization of real-time data platforms across lead entities and partner agencies over time. Challenges – including duplicative data entry and managing multiple disparate data systems across settings – persisted across most pilots. Other data sharing challenges included concerns around legal risks of data sharing and differing interpretations of laws and regulations involving patient privacy and confidentiality. To address data sharing concerns, some pilots developed universal consent forms to facilitate the release of information across WPC partner organizations, while others developed consent forms to allow for the targeted release of specific data, allowing enrollees to opt out of sharing certain information (e.g., mental health history and HIV test results).9 

Pilots reported success with introducing new care coordination processes and using data systems/sharing to support care coordination activities. Care coordination services were frequently provided by non-clinical staff (under supervision of clinical staff) including community health workers (CHWs), and most pilots reported employing care coordinators with shared lived experience. Many pilots reported using a single dedicated care coordinator who followed enrollees across all WPC-participating care settings. Nearly all pilots reported the most common mode of communication between care coordinators and enrollees was in-person. All pilots reported using “active” referral strategies, including helping enrollees schedule appointments, accompanying enrollees to appointments, assisting with transportation, and following up with enrollees after appointments. Challenges common to care coordination included limited availability and/or accessibility of services for referrals. This was especially true for housing needs, where barriers included long wait times for permanent housing, limited housing options available, and poor housing quality.

Figure 1: Interim Outcomes and Learnings form WPC Pilots

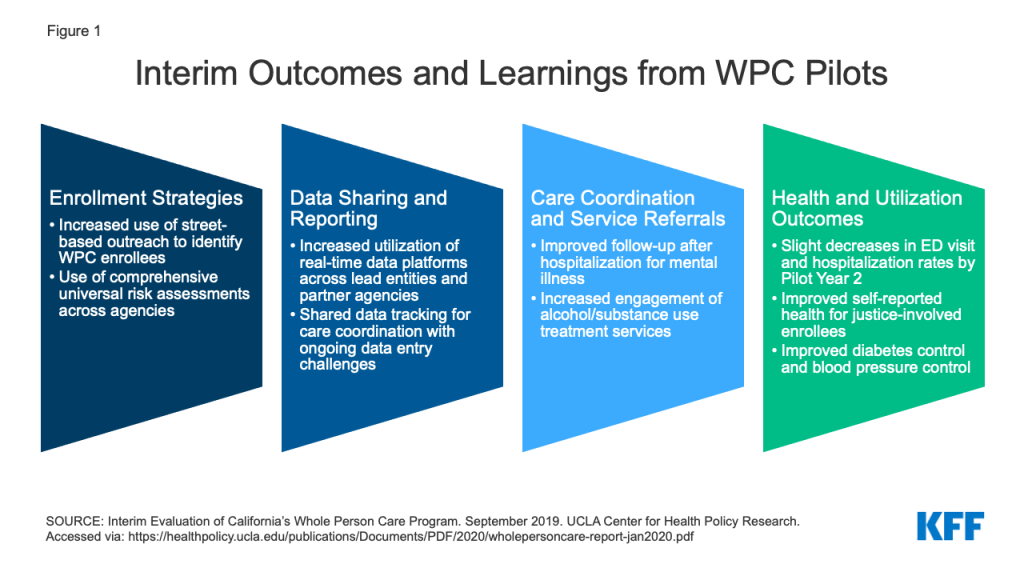
WPC pilots demonstrated improvements in select health utilization and outcomes, care coordination, and delivery of housing services. The interim evaluation used pilot-reported metrics and Medi-Cal data to determine whether WPC led to better care and better health in the first three years. Analyses included comparison of selected Medi-Cal metrics before and after WPC implementation for WPC enrollees and a control group of Medi-Cal enrollees with similar characteristics. Interim evaluation data showed WPC pilots improved rates of follow-up after hospitalization for mental illness, initiation and engagement in alcohol and drug dependence treatment, and timely provision of comprehensive care plans and suicide risk assessments. The interim evaluation found that emergency department (ED) visit rates from WPC Pilot Year 1 to Pilot Year 2 decreased by 19% for WPC enrollees and 8% for the control group, a significantly larger decrease for the WPC enrollees, although analysis of pre-WPC enrollment compared to post-enrollment ED visit rates found no difference for both groups.10  While adjusted trends of all-cause readmissions did not show a reduction in either group, rates of all-cause readmissions declined from year 1 to year 2 (this decline was greater among WPC enrollees compared to the control group). The interim evaluation also found improvement in health outcomes metrics, including self-reported overall and emotional health and diabetes and blood pressure control. Nearly half of all pilot enrollees were homeless across target populations. The interim evaluation showed success in delivery of housing services and in the receipt of supportive housing, but challenges related to adequate housing supply and direct funding to provide housing. Recent analyses found the COVID-19 pandemic impacted WPC pilots in a variety of ways, but pilots were able to capitalize on existing WPC infrastructure and leverage/coordinate with other COVID-19 response activities. The final evaluation will assess the role of WPC in reducing costs for pilot enrollees and the Medi-Cal program overall, whether care coordination and partnerships were sustained beyond the demonstration, and any differences in interventions/services by target population and pilot site to help identify which services may improve outcomes.

What is Next for WPC and CalAIM?

Under CalAIM, the state will move beyond county pilots to standardize and incorporate services offered by WPC statewide through Medi-Cal managed care plans. CalAIM, which launched in January 2022, seeks to take the state’s whole person care approach statewide, with a central focus on improving health and reducing health disparities and inequities.11  CalAIM adds new programs and reforms existing programs.12  The CalAIM demonstration and its various components are authorized under Section 1115, Section 1915(b), and through state plan amendments. The three stated goals of CalAIM13  are as follows:

  • Identify and manage member risk and need through whole person care approaches and addressing SDOH.
  • Improve quality outcomes, reduce health disparities, and drive delivery system transformation and innovation through value-based initiatives, modernization of systems, and payment reform.
  • Move Medi-Cal to a more consistent and seamless system by reducing complexity and increasing flexibility.

Under CalAIM, Medi-Cal managed care plans will provide Enhanced Care Management (ECM) and Community Supports to targeted high-need beneficiaries. These services will be provided through contracts with community-based providers including organizations that participated in WPC.14  With the launch of ECM and Community Supports, DHCS will sunset the WPC pilots and the Health Homes program.15  Although the state has indicated many WPC enrollees will automatically transition to receiving ECM and Community Supports (many of which the state says may be equivalent to services received under WPC), some WPC enrollees will not transition to receiving these services, and some individuals may lose access to certain services they received under WPC.16  ECM and Community Supports (described in detail in the box below) will only be available to Medicaid beneficiaries enrolled in managed care plans, and managed care plans will have discretion over which Community Supports to cover.

Key New Services Offered Under CalAIM

Enhanced Care Management Benefit: The new enhanced care management benefit includes care coordination and comprehensive care management services to address the clinical, behavioral, and social needs of Medi-Cal enrollees with complex needs. Managed care plans will contract with community-based entities (e.g., county agencies, FQHCs, PCPs, CMHCs) to provide care management services.17  DHCS has identified populations of focus for the new ECM benefit (e.g., individuals experiencing homelessness, high utilizers, and adults with serious mental illness or substance use disorders) while managed care plans will be able to add to this list.18  Every beneficiary enrolled in ECM will have a dedicated care manager.

Community Supports: Community Supports (also referred to as “in lieu-of services” (ILOS)) will address social drivers of health.19  These services build on and scale existing work from WPC pilots, Health Homes, and home and community-based services (HCBS) waivers. DHCS has identified 14 Community Supports.20  Services will be delivered through community providers and integrated with ECM. Examples include housing navigation services, recuperative care (medical respite), environmental accessibility adaptations, medically tailored meals, and sobering centers. These services will substitute for certain medical services (e.g., emergency department visits, inpatient hospital care, or nursey facility services) covered by Medi-Cal. The state is encouraging (but not requiring) managed care plans to offer as many of the 14 Community Supports as possible. Most of the Community Supports have been authorized as “ILOS” under Section 1915(b) waiver authority.21  Although “Special Terms and Conditions” (STCs) are not a typical feature of 1915(b) waiver approvals, CMS imposed extensive STCs in connection with the state’s 1915(b) approval. The STCs impose documentation and reporting requirements on both managed care plans and the state Medicaid agency as CMS aims to evaluate the effectiveness of the ILOS and their impact on Medicaid beneficiaries.

Under Section 1115, CMS authorized $1.44 billion in one-time funding to assist with transitioning the WPC pilots and Health Homes programs from Medi-Cal 2020 to CalAIM. “Providing Access and Transforming Health” (PATH) will provide transitional funding to support continuity of services and maintain and support provider and community-based organization capacity. One goal of PATH will be to help ensure Medi-Cal enrollees have continuous access to benefits and services provided previously through WPC pilots as these services and activities are integrated into managed care plans. The funding may not be used to initiate new services but is supposed to ensure continuity for services that correspond to Community Supports managed care plan choose to offer.22  A portion of PATH funds will be used to support justice-involved individuals by sustaining pre- and post-release services provided through WPC pilots and by supporting certain pre-release application planning and IT investments for justice-involved activities.

In addition to incorporating services offered by WPC pilots statewide, the state is planning to undertake a host of other behavioral health reforms under CalAIM. For example, the state plans to integrate the administration and financing of specialty mental health and SUD services under a single state/county contract. The goal is to improve outcomes for enrollees through more coordinated treatment and to allow providers to respond in a more patient-centered way. The state also plans to improve coordination of mental health care between Medi-Cal managed care plans (managing non-specialty mental health services) and county-operated mental health (managing specialty mental health services and SUD treatment). Distinct from these efforts, CalAIM also includes a plan to test the full integration of physical health, behavioral health, and oral health under one contracted managed care entity.

Looking Ahead

As mental illnesses and substance use disorder have worsened during the COVID-19 pandemic, many states are building on and developing initiatives to address behavioral health issues in Medicaid. States are expanding benefits such as community-based mobile crisis intervention services and screening, expanding the use of telehealth for behavioral health, and using managed care organizations to deliver services. In addition to California, ColoradoMassachusettsMontana, and Washington are advancing broad behavioral health initiatives spanning many areas. Key lessons from California to date show that such initiatives require integrated data systems, adequate funding streams, and multi-sector provider partnerships to coordinate services. Going forward, California’s experience in trying to scale the WPC pilots statewide and use managed care authority to broadly deliver a range of additional services will be important to understand and learn from as other states work to improve behavioral health services and address social determinants to enhance health and equity.

Appendix

Appendix 1: WPC Pilot Highlight, San Francisco County
  1. Two pilots (Small County and Solano County) discontinued their WPC programs as of 12/31/2020. ↩︎
  2. Organizations eligible to apply as lead agencies as defined by the state included county or city agencies, certain designated public hospitals, federally recognized tribes or tribal health programs, or a consortium of these entities. ↩︎
  3. Letter of extension approval for California Medi-Cal 2020 Demonstration. December 2020. Centers for Medicare and Medicaid Expenditure Authority. Accessed via: https://www.medicaid.gov/Medicaid-CHIP-Program-Information/By-Topics/Waivers/1115/downloads/ca/ca-medi-cal-2020-ca.pdf ↩︎
  4. Pourat P, O’Masta, B, Haley LA, and Chuang E. A Snapshot of California’s Whole Person Care Pilot Program: Implementation Strategies and Enrollees. May 2021. UCLA Center for Health Policy Research. Accessed via: https://healthpolicy.ucla.edu/publications/Documents/PDF/2021/wholepersoncare-policybrief-may2021.pdf ↩︎
  5. For example, FFS payments might be made for discrete services including mobile clinic visits, housing transition services, medical respite, transportation, or care coordination. PMPM bundled payments might be made for one or more services and/or activities including comprehensive case management, housing support services, mobile outreach and engagement, or long-term care diversion. DHCS may allow pilots to rollover unspent funds from one year to the next. ↩︎
  6. Pourat N, Chuang E, Chen X, O’Masta B, Haley LA, Lu C, Huynh MP, Albertson E, and Huerta DM. Interim Evaluation of California’s Whole Person Care (WPC) Program. Los Angeles, CA: UCLA Center for Health Policy Research, September 2019. Accessed via: https://healthpolicy.ucla.edu/publications/Documents/PDF/2020/wholepersoncare-report-jan2020.pdf ↩︎
  7. Ibid 6. ↩︎
  8. Chuang E, Pourat N, Haley LA, O'Masta B, Albertson E, and Lu C. Integrating Health And Human Services In California's Whole Person Care Medicaid 1115 Waiver Demonstration. Health Aff (Millwood). 2020 Apr;39(4):639-648. doi: 10.1377/hlthaff.2019.01617. PMID: 32250689. Accessed via: https://www.healthaffairs.org/doi/10.1377/hlthaff.2019.01617 ↩︎
  9. Ibid 8. ↩︎
  10. The interim evaluation used difference-in-difference methodology to compare WPC enrollees to the Medi-Cal enrollee control group between a baseline period (pre-WPC enrollment) and an enrollment period (including data from one year after WPC Year 1 and two years after WPC enrollment). The analysis found no significant change for either group for adjusted trends in emergency department (ED) visit rates and a significant increase in hospitalizations for WPC enrollees compared to the control group. However, the analysis found a decrease in ED and hospitalization rates for both groups from the first to the second years of WPC enrollment. Emergency department (ED) visits, hospitalizations, and all-cause readmission for WPC enrollees were rising prior to WPC enrollment and continued to increase in the first year of pilot enrollment (reflecting successful enrollment of high utilizers into the pilot), before declining overall in the second program year. ↩︎
  11. CalAIM builds on existing infrastructure for the 25 WPC pilots, and counties that did not already have WPC pilots in place were able to apply for additional funding in 2020 to initiate WPC-like pilot capacity. All of the 33 counties that applied for the $20 million one-time funding were approved. Accessed via: https://www.dhcs.ca.gov/services/Documents/MCQMD/WPC_Documents/20M-One-Time-Funding-10-18-19.pdf ↩︎
  12. CalAIM Explained: Overview of New Programs and Key Changes. October 2021. California Health Care Foundation. Accessed via: https://www.chcf.org/publication/calaim-explained-overview-new-programs-key-changes/ ↩︎
  13. CalAIM: Our Journey to a Healthier California for All. Department of Health Care Services. Accessed via: https://www.dhcs.ca.gov/CalAIM/Pages/calaim.aspx ↩︎
  14. Ibid 4. ↩︎
  15. In 2018, DHCS launched the Health Homes Program (HHP). The HHP serves eligible Medi-Cal managed care plan Members with complex medical needs and chronic conditions who may benefit from intensive care management and coordination. Health plans are required to automatically authorize all HHP Members for ECM and reassess within six months to determine if they still benefit from ECM-level care coordination. Health plans must also appropriately transition eligible HHP Members to applicable Community Supports that the health plan elects to offer. Accessed via: https://www.dhcs.ca.gov/Documents/MCQMD/WPC-and-HHP-Transition-Public-Webinar-9-21-21.pdf ↩︎
  16. Ibid 15. ↩︎
  17. Ibid 16. ↩︎
  18. California Advancing and Innovating Medi-Cal (CalAIM) Enhanced Care Management. Department of Health Care Services. Accessed via: https://www.dhcs.ca.gov/CalAIM/Documents/CalAIM-ECM-a11y.pdf ↩︎
  19. “In-lieu-of” services are a substitute for covered services and may qualify as a covered service for the purposes of capitation rate setting, as long as the state determines in-lieu-of services are medically appropriate and cost effective. Enrollees are not required to use the alternative service or setting but may choose to do so. Approved in-lieu-of services are authorized and identified in MCO contracts. Costs associated with in-lieu-of services may be included in the numerator of the medical loss ratio (MLR) and are taken into account when developing capitation rates. ↩︎
  20. Ibid 18. ↩︎
  21. The Section 1115 demonstration provides separate authority for short-term post hospitalization housing and recuperative care services (delivered by managed care plans). ↩︎
  22.  Funding will be available where there is a current commitment from the managed care plan that it will elect to offer the service by January 1, 2024. ↩︎

A Snapshot of Mental Health and Access to Care Among Nonelderly Adults in California

Authors: Nirmita Panchal, Greg Young, Cynthia Cox, Jared Ortaliza, Giorlando Ramirez, and Rachel Garfield
Published: Mar 17, 2022

The COVID-19 pandemic has coincided with worsening mental health across the country, and California is no exception. For this data note, we analyzed data from the California Health Interview Survey (CHIS), which asks noninstitutionalized adults detailed questions on mental health and substance use, to further examine the impact of the pandemic on mental health in the state.

The pandemic comes on the heels of an already worsening mental health and substance use crisis in California. As shown in Figure 1, a growing share of nonelderly adults have reported past year serious psychological distress over time in California, up from 9% in 2016 to 15% in 2020. Substance use issues have also worsened – drug overdose deaths increased over 40% from 2019 to 2020 in California.

Serious Psychological Distress Among Nonelderly Adults in California, 2016-2020

During the pandemic, serious psychological distress was more pronounced among some communities, including women and low-income adults in California. As shown in Figure 2, women in California (16%) were more likely than men (13%) to experience serious psychological distress in 2020. In general, women have more often reported poor mental health compared to their male counterparts both before and during the pandemic. In California, lower-income adults were more likely to experience serious psychological distress (19% for incomes between 0 and 138% FPL; 17% for incomes between 139 and 249% FPL; and 15% for incomes between 250 and 399% FPL) than high-income adults (11%) in 2020 (Figure 2). A recent survey of nonelderly adult Californians who saw a health care provider in the past year also found that low-income individuals were more likely than higher-income individuals to report worsening mental health during the pandemic.1  Separately, compared to White adults in California (15%), some communities of color – including Asian (12%) and Black (11%) adults – were less likely to report experiencing serious psychological distress in 2020 (Figure 2). Serious psychological distress among Hispanic adults (15%) was similar to White adults (Figure 2). Other KFF analyses found that, nationally, mental health and substance use concerns have been exacerbated among many people of color throughout the pandemic. Research has also shown that stigma – including stereotypes and discrimination – around mental health concerns is more pronounced among communities of color, perhaps affecting self-reporting of mental health and access to care. Additionally, a survey of adults in California found that among nonelderly individuals with mental health needs, people of color were less likely than White people to receive care.

Share of Nonelderly Adults with Serious Psychological Distress, by Sex, Income Level, and Race/Ethnicity, 2020

In 2020, poor mental health outcomes among nonelderly adults varied greatly across counties in California. As shown in the map below, the share of nonelderly adults with past year serious psychological distress ranged from 9% to 28% across counties in 2020; highest in some Central Valley counties (Colusa/Glenn/Tehama, 28.3%; Butte, 26.9%; Merced, 24.2%) and lowest in Bay Area counties (San Francisco, 9.1%; Marin, 9.5%; Contra Costa, 9.6%). The share of nonelderly adults who ever had thoughts of suicide ranged from 8% to 34% across counties in 2020; highest in northern counties (Del Norte/Lassen/Modoc/Plumas/Sierra/Siskiyou, 34.3%; Butte, 29.7%; Mendocino, 29.2%) and lowest in some southern and eastern counties (El Dorado, 8.1%; Imperial, 8.8%; Placer, 9.3%).

Share of Nonelderly Adults With Past Year Serious Psychological Distress, 2020, by County or Region

Nearly nine in ten nonelderly adults in California have insurance coverage to help them access and cover the cost of health care, including mental health services. In recent years and in response to the pandemic, the state has introduced several policy measures to increase access to mental health and substance use services; many of these efforts leverage insurance coverage through Medi-Cal (the state’s Medicaid program), which covers 20% of nonelderly adults, or private coverage, which covers 67%.

Across insurance types, large shares of nonelderly adults reported poor mental health outcomes in 2020. Medi-Cal enrollees were significantly more likely than private insurance enrollees to experience past year serious psychological distress in 2020 (18% vs. 11%, respectively) (Figure 4), perhaps reflecting Medi-Cal coverage of many people with disabling health conditions including serious mental illness and/or many low-income individuals who may be more likely to report poor mental health. Many nonelderly adults also reported thoughts of suicide in 2020: 14% among Medi-Cal enrollees and 13% among private insurance enrollees (data was not statistically different).

Serious Psychological Distress Among Nonelderly Adults in California, by Insurance Type, 2020

Many insured adults in California reported barriers to care for mental health and substance use services in 2020. Twenty four percent of nonelderly adults in California reported needing help for mental health or substance use issues in the past year (Table 1).2  Among nonelderly adults with mental health or substance use needs, the share who received treatment in the past year was similar across plan type (60% of Medi-Cal enrollees and 55% of private insurance enrollees) (Table 1). Medi-Cal enrollees who received treatment reported a higher average number of visits to a professional in the past year compared to their privately insured counterparts (18 visits vs. 11 visits).

Many Medi-Cal (40%) and private insurance (45%) enrollees with mental health or substance use needs did not receive treatment. Large shares of insured adults who did not receive treatment cited concerns about costs (54% of Medi-Cal enrollees and 49% of private insurance enrollees) and difficulties scheduling an appointment (30% of Medi-Cal enrollees and 20% of private insurance enrollees) as barriers. With the pandemic and accompanying economic recession, many adults have faced financial hardship and have had difficulty paying for usual expenses. This may be linked to the high shares of adults citing concerns over costs as a barrier for accessing mental health or substance use treatment – even for Medi-Cal enrollees, who have very low or no out-of-pocket costs for these services. Scheduling difficulties as a barrier to accessing mental health or substance use services may reflect an insufficient availability of providers.

Table 1: Among Nonelderly Adults with Any Mental Health or Substance Use Needs, Access and Utilization of Services in the Past Year, by Insurance Type, 2020
All Nonelderly AdultsMedi-Cal EnrolleesPrivate Insurance Enrollees
Share of Nonelderly Adults with Mental Health or Substance Use Needs24.3%23.2%23.8%
   Share that Received Treatment53.8%59.6%54.8%

Average Number of Visits to a Professional

1318*11*
   Share that Did Not Receive Treatment46.2%40.4%45.2%

Did Not Receive Care Due to Concerns About Costs^

57.2%53.9%49.1%

Did Not Receive Care Due to Difficulty Scheduling an Appointment^

23.0%30.2%19.9%
*Indicates statistically significant difference between Medi-Cal and private insurance enrollees.^Respondents were able to select from multiple reasons regarding not accessing needed mental health or substance use services.NOTES: Nonelderly adults refers to adults ages 18 to 64. Medi-Cal enrollees refers to enrollees with only Medi-Cal coverage for the past 12 months. Private insurance enrollees refers to enrollees with only private insurance (through employer plans or privately purchased) for the past 12 months.SOURCE: KFF analysis of California Health Interview Survey (CHIS) Adult Data Files, 2020.

 The pandemic highlights issues with accessing mental health and substance use care across California. California continues to face shortages of mental health providers. In light of pandemic-related precautions and restrictions, accessing services for health care, including mental health or substance use care, has been challenging nationally. In response, measures, including the temporary public health emergency, have allowed many providers to offer care through telehealth. Across the state of California, access to mental health care can also vary greatly. Specifically, for Medi-Cal enrollees, access can vary widely from county to county and navigating care can be particularly challenging for enrollees with co-occurring serious mental health and physical health needs.

In response to mental health and substance use needs in California during the pandemic, several policy actions were taken to increase and standardize access to care. Senate Bill 855 addresses gaps in existing mental health parity laws by requiring insurers to expand coverage to a broader range of mental health and substance use disorders (apart from Medi-Cal). Assembly Bill 2265 will allow for funds from the Mental Health Services Act, typically reserved for mental health services only, to be used for substance use services as well among people with co-occurring mental health and substance use issues. Additionally, through Senate Bill 803, Medi-Cal mental health and substance use services will expand to include peer support specialists. In California’s recent state budget proposal, funds were allocated for dyadic care – allowing for behavioral health services for parents to be incorporated into pediatric health care visits among Medi-Cal beneficiaries. California’s renewal applications for Section 1115 and 1915(b) waivers, known as California Advancing and Innovating Medi-Cal (CalAIM), were also recently approved. CalAIM builds on the state’s Medi-Cal 2020 Whole Person Care pilot program to coordinate and integrate physical health, behavioral health, and social services for Medicaid enrollees with complex needs. In addition to transitioning these services to the state’s managed care system, CalAIM includes behavioral health initiatives to address the division of services between county-level mental health plans and managed care plans, and to standardize access to services for enrollees with serious mental health needs. Private insurers have also taken steps to address mental health and substance use care. Nationally, some plans expanded coverage to include mental health or substance use services accessed through telehealth and many employer sponsored plans made changes such as waiving or reducing cost-sharing and increasing coverage for out-of-network services. Separately, California has taken steps to fund the statewide launch of 988, a mental health crisis hotline.

Looking ahead, further research on access to care and utilization of mental health services will be informative as state policymakers, administrators, and health care providers continue to discuss how to address mental health and substance use needs among Californians.

This work was supported in part by Well Being Trust. We value our funders. KFF maintains full editorial control over all of its policy analysis, polling, and journalism activities.

Methods

This analysis uses the 2020 California Health Interview Survey (CHIS) Adult Data Files, which surveys noninstitutionalized individuals. We narrowed our analysis to nonelderly adults, ages 18 to 64. In 2019, CHIS conducted a redesign of the survey. The redesign affected representation of different groups in the sample frame. Therefore, some demographic level data are not reported in this analysis; for example, demographic breakouts by type of insurance is excluded.

  1. This survey from California Health Care Foundation used both a probability-based sample and nonprobability sample of nonelderly adults (age 18–64) in California. ↩︎
  2. All respondents of the California Health Interview Survey were asked whether they felt they needed help for a mental or emotional or alcohol or drug problem in the past year. ↩︎

No Surprises Act Quiz

Published: Mar 17, 2022

The No Surprises Act is a new federal law that establishes protections from unexpected bills for consumers with private health insurance.

Test your understanding of the law and share your results!

Step 1 of 12

The No Surprises Act protects you by limiting what you have to pay for certain types of medical bills. Of the types of bills listed below, which one is not subject to No Surprises Act Protections?(Required)

News Release

States Are Planning for the End of the Continuous Enrollment Requirement in Medicaid After the COVID-19 Public Health Emergency Expires, But Many Have Not Made Key Decisions

50-State Survey Finds the Unwinding of the Medicaid Continuous Enrollment Requirement Requirement Will Have Major Implications for Continuity of Coverage

Published: Mar 16, 2022

As states plan for the end of the COVID-19 public health emergency, the resumption of eligibility redeterminations and disenrollments when the continuous Medicaid enrollment requirement is lifted could lead to coverage disruptions and losses, according to a new KFF 50-state survey.

The requirement, a condition of states receiving enhanced federal Medicaid funding during the pandemic, has helped drive Medicaid and CHIP enrollment to a record 85 million people, an increase of 19.1 percent since the start of the pandemic. It prohibits states from disenrolling individuals while the public health emergency is in effect, to cushion low-income people against the economic and health disruptions of the pandemic.

But with the public health emergency expected to expire in the coming months, the new survey of state Medicaid and CHIP officials finds that many state Medicaid programs still have not made key decisions about how to handle the resumption of eligibility redeterminations that will lead to the disenrollment of people who are no longer eligible and those who are eligible but do not complete renewal paperwork.

Only about half of states (27) said they had a plan for how they will prioritize outstanding eligibility and renewal actions when the continuous enrollment requirement is lifted, the survey finds. The states with plans in place have different strategies and approaches, with 11 states indicating that they will target enrollees who appear to be no longer eligible first, while nine plan to conduct fresh renewals on a rolling basis based on the month in which the individual’s annual renewal is due. Seven states have adopted a hybrid approach. States that prioritize re-checking the status of people who no longer appear to be eligible will likely generate coverage disruptions sooner than states that wait until enrollees’ standard renewal date arrives.

Current guidance from the Centers for Medicare and Medicaid Services gives states up to 12 months to initiate and 14 months to complete all redeterminations. The survey – fielded prior to the release of the guidance – finds that of the 48 states that have established a timeframe for processing redeterminations, 41 states plan to take 9-12 months, four states plan to take 6-9 months, and three states plan to take 3-6 months. States that take less than a full year to complete all redeterminations could trigger greater coverage losses among eligible individuals, because there will be less time to conduct outreach and boost administrative staff capacity.

Across the 20 states that were able to report such data, about 13 percent of Medicaid enrollees are expected to be disenrolled when the continuous enrollment requirement ends. The estimates range widely, from about 8 percent of enrollees in West Virginia to over 30 percent of enrollees in Hawaii.

Such estimates suggest that millions of people will lose Medicaid coverage in the months following the end of the public health emergency. Many children will be eligible for CHIP and many adults will be eligible for Affordable Care Act (ACA) Marketplace or other coverage. Successfully transitioning such individuals into other coverage options could reduce the number who become uninsured.

Among other key findings from the survey:

  • While states cannot disenroll people while the public health emergency is in place, as of January 2022, 42 states report conducting so- called “ex parte” renewals, which are processed automatically using data available to the agency, such as state wage databases. Continuing to process these renewals now can help to maintain coverage and reduce backlogs at the end of the public health emergency. However, a majority of states indicate that less than half of renewals can be completed using available data sources without having to follow up with the enrollee for more information about their income and circumstances.
  • Forty-one states plan to follow up with enrollees when the enrollee must take action to avoid a loss of coverage. States are not required to follow up with enrollees who do not respond to a renewal request; however, sending reminder notices via mail – and also by phone, text, and/or email – can reduce the number of people who remain eligible but are disenrolled at the end of the public health emergency because they did not respond to a request for information.
  • Almost all states (46) are planning to try to update enrollees’ mailing addresses, including through conducting data matches with the U.S. Postal Service, working with managed care organizations, and launching outreach campaigns. Also, 35 states say they will follow-up on returned mail via telephone, email, and text before terminating an enrollee’s coverage.
  • Thirty states plan to boost staff capacity, including through approving overtime, hiring new eligibility workers, or borrowing staff from other agencies.
  • Forty-one states have the data systems necessary to report the share of people who are disenrolled because they are determined to be ineligible versus the share who are disenrolled for procedural reasons. CMS has indicated it will require states to report monthly data to monitor their progress on unwinding and compliance with current rules.

These and other findings from the survey will be discussed today at a public web briefing. An archived video recording of the briefing will be available on kff.org later today. The public health emergency has been extended to mid-April, but the Biden Administration has indicated that states will have 60 days’ notice before it ends, so it is expected that the declaration will be extended again.

KFF conducted the 20th annual survey of states Medicaid and CHIP eligibility levels and enrollment and renewal policies in January 2022, with help from the Georgetown University Center for Children and Families. The survey presents a snapshot of actions states are taking to prepare for the end of the continuous enrollment requirement, as well as key state Medicaid enrollment and renewal procedures in place during the pandemic.

The full survey report, Medicaid and CHIP Eligibility and Enrollment Policies as of January 2022: Findings from a 50-State Survey, includes state-level data about Medicaid and CHIP eligibility in every state. Also available are other recent KFF analyses related to the end of the public health emergency, including Unwinding of the PHE: Maintaining Medicaid for People with Limited English Proficiency and Without Build Back Better, Will the End of the Public Health Emergency Leave Even More People Uninsured?


Medicaid and CHIP Eligibility and Enrollment Policies as of January 2022: Findings from a 50-State Survey

Authors: Tricia Brooks, Allexa Gardner, Aubrianna Osorio, Jennifer Tolbert, Bradley Corallo, Meghana Ammula, and Sophia Moreno
Published: Mar 16, 2022

Executive Summary

Enrollment in Medicaid has grown significantly during the coronavirus pandemic. Provisions in the Families First Coronavirus Response Act (FFCRA) require states to provide continuous coverage for Medicaid enrollees until the end of the month in which the public health emergency (PHE) ends in order to receive enhanced federal funding. Continuous enrollment has helped to preserve coverage and halted Medicaid churn. However, when the PHE ends, states will begin processing redeterminations and millions of people could lose coverage if they are no longer eligible or face administrative barriers despite remaining eligible. Existing state enrollment and renewal procedures, as well as their approaches to the unwinding of the continuous enrollment requirement, will have major implications for Medicaid enrollment and broader coverage.

The 20th annual survey of state Medicaid and Children’s Health Insurance Program (CHIP) officials conducted by KFF and the Georgetown University Center for Children and Families in January 2022 presents a snapshot of actions states are taking to prepare for the lifting of the continuous enrollment requirement, as well as key state Medicaid enrollment and renewal procedures in place during the PHE. The Centers for Medicare and Medicaid Services (CMS) released new guidance on March 3, 2022, which emphasizes promoting continuity of coverage and avoiding inappropriate coverage terminations when the continuous enrollment requirement ends. While this recent guidance was released after the survey was fielded, state responses reported here illustrate how states expect to approach the unwinding of continuous enrollment and what the effects of the new guidance may be.

Plans for the End of the PHE

States are required to develop plans for how they will prioritize outstanding eligibility and renewal actions when the continuous coverage requirement is lifted; just over half of states (27) have determined their approach. At the time of the survey, given uncertainty around the timing of the end of the PHE, timing of additional guidance from the CMS, and the future of the Build Back Better Act, it is perhaps not surprising that many states have yet to finalize their plans. However, having plans in place early will allow for better preparation and will enable states to communicate their plans to enrollees and other stakeholders in the state. Among the states with plans, eleven states indicate they will target individuals who appear to be no longer eligible first, while eight states plan to conduct fresh renewals based on the individual’s renewal month, and eight have adopted a combination or hybrid approach. While most states plan to wait until the continuous enrollment requirement is lifted to resume disenrollments, three states have not yet decided whether they will forgo enhanced federal funding and begin disenrollments before the end of the PHE. However, even if states begin disenrollments prior to the end of the PHE, they must still follow the unwinding guidance CMS has issued.

Fifteen states indicate they will conduct electronic data matches to identify and target enrollees for priority action who may no longer be eligible after the continuous enrollment requirement is lifted. States are not required to conduct data matches in between renewal periods. While data matches can identify people who experienced a change in income or circumstance that makes them no longer eligible, broad data searches may also identify inconsistent or inaccurate information that does not impact eligibility and could lead to eligible individuals losing coverage if they do not follow up.

The majority of states (41) plan to take up to a full year to process redeterminations and return to routine operations; however, seven states plan to resume normal operations more quickly. When states resume redeterminations at the end of the PHE, they will need to conduct a fresh review of eligibility based on current circumstances before disenrolling anyone from Medicaid. Current CMS guidance gives states up to 12 months to initiate and 14 months to complete all redeterminations and 41 states indicate they will take at least 9 months and up to the full year. The elimination of the enhanced federal Medicaid matching rate (at the end of the quarter in which the PHE ends) could put fiscal or political pressure on states to move more quickly. The risk of moving quickly is that there will be less time to conduct outreach to enrollees and develop staff capacity to process renewals. CMS encourages states to initiate redetermination on no more than 1/9th of their total caseload each month to minimize this risk.

When the continuous enrollment requirement is lifted, a majority of states (41) plan to follow-up with enrollees when action must be taken to avoid a loss of coverage due to missing information. States are not required to follow up with enrollees who do not respond to a renewal request and may simply send a termination notice if no response is received within 30 days. However, sending reminder notices via mail – and also through other communication modes, such as phone, text, and/or email – can increase the response rate to renewal requests and reduce the number of people who remain eligible but are disenrolled at the end of the PHE because they did not respond to a request for information.

In preparation for the end of the PHE, states are taking steps to update enrollee mailing addresses. The two-year COVID-19 emergency has likely exacerbated longstanding difficulties in reaching enrollees by mail. In response, the vast majority of states (46) are planning actions to update mailing addresses before the end of the PHE, including conducting data matches with the United States Postal Service (USPS) National Change of Address database; working with managed care organizations (MCOs); and conducting outreach campaigns. In addition, 35 states will follow-up on returned mail to attempt to locate an enrollee before terminating coverage.

Anticipating the need for additional staff resources at the end of the PHE, 30 states plan to take steps to boost staff capacity.  Most states are taking multiple actions that include approving overtime, hiring new eligibility workers or contractors, or borrowing staff from other units or agencies.

Most states are able to report key metrics needed to monitor the unwinding process. Almost all states (50) report they are capable of tracking call center statistics and a majority (41) are able to report the share of disenrollments that were determined ineligible versus disenrollments due to procedural reasons. Having timely and reliable data from states will be needed to monitor the unwinding process and assess whether additional steps should be taken to avoid coverage losses among those who remain eligible. In recent guidance, CMS has indicated it will require states to report monthly data to monitor their progress on unwinding and compliance with current rules, although there is no indication the data will be released publicly.

In 20 states able to report, it is estimated that about 13% of Medicaid enrollees will be disenrolled when the continuous enrollment requirement ends. However, the estimates range widely across reporting states from about 8% to over 30% of total enrollees. Based on available data, most states report that an increase in income will be the primary reason for the disenrollment although several states also expect incomplete renewals or missing documentation will be a primary reason for disenrollment. If these estimates hold true, millions of people will lose Medicaid coverage in the months following the end of the PHE; however, many children will likely be eligible for CHIP and many adults will likely be eligible for Affordable Care Act (ACA) Marketplace or other coverage. Successfully transitioning these individuals into those other coverage options could avoid gaps in coverage and reduce the number who lose coverage altogether and become uninsured.

Enrollment and Renewal Policies During the PHE

Even during the PHE, states continue to streamline application processes and integrate non-MAGI and non-health programs into the system that determines MAGI Medicaid eligibility.  In almost all states, applications can be submitted online, by telephone, in person, or by mail. Additionally, nearly all states (48) now offer online accounts for Medicaid and CHIP enrollees that make it easier for individuals to submit and access information about their coverage. States have taken steps to improve the mobile friendliness of their applications and online accounts. All states use electronic data matches from a variety of data sources to verify income eligibility and, as a result, most states (43) can provide eligibility determinations in real time (within 24 hours).

While states cannot disenroll people, as of January 2022, most states (42) report processing ex parte renewals and sending renewal forms (30 states) to reduce backlogs in renewals at the end of the PHE.  By continuing ex parte renewals during the PHE, states have been able to renew coverage for 12 months for those who remain eligible. Of the 42 states actively processing ex parte renewals, nearly two-thirds (30 states) are sending renewal forms or requests for documentation when they are unable to confirm ongoing eligibility through electronic data sources, although they may not disenroll anyone during the PHE. By processing ex parte renewals and sending out renewal forms, states will have a smaller backlog of delayed renewals or pending actions when the PHE ends.

Medicaid and CHIP Eligibility

As of January 2022, Medicaid and CHIP eligibility was stable as the PHE protections remained in effect for the entirety of 2021. Oklahoma and Missouri implemented the ACA Medicaid adult expansion in 2021, leaving only 12 states that have not filled the coverage gap for low-income adults. In the 12 states that have not implemented the Medicaid expansion, eligibility for parents remains extremely low (ranging from 16% to 100% of the poverty level) and only Wisconsin covers adults without dependent children (through a waiver of standard Medicaid eligibility rules). Eligibility levels for children and pregnant women held constant with median eligibility at 255% of the federal poverty level (FPL) and 205% FPL respectively.

Looking Ahead

Recent CMS guidance provides guardrails and flexibilities for states to promote continuity of coverage during the unwinding period; however, state decisions and actions will have implications for Medicaid enrollment. Recently released guidance emphasizes strategies to promote continuity of coverage. The guidance reiterates existing options for states, such as adopting 12-month continuous eligibility for children and extending postpartum coverage for 12 months, and provides additional flexibilities, including using Supplemental Nutrition Assistance Program (SNAP) eligibility to renew Medicaid coverage. How states approach the unwinding of the continuous enrollment requirement will affect the extent to which eligible individuals retain coverage and those who are no longer eligible are able to transition to other coverage. Outcomes will differ across states as they make different choices and careful monitoring of state progress throughout the unwinding period can provide information to assess fiscal effects and state efforts to promote continuity of coverage.

The fate of the Build Back Better Act (BBBA) will have implications for overall coverage. The BBBA includes provisions to close the Medicaid coverage gap in states that have not adopted the ACA Medicaid expansion and to extend the enhanced Marketplace premium subsidies initially made available by the American Rescue Plan Act (ARPA), which have made coverage more affordable for millions of people. While the number of people who are uninsured has not increased during the PHE as many had predicted, millions of people could lose coverage if those who continue to be eligible for Medicaid are not able to retain coverage, and if the provisions in the BBBA that close the coverage gap and make Marketplace coverage more affordable are not enacted.

Report

Introduction

The extension of the coronavirus public health emergency through the entirety of 2021 had a significant impact on Medicaid and the Children’s Health Insurance Program (CHIP). Since its emergence in early 2020, the coronavirus’ twin economic and public health crises continued to expose significant disparities in the public health infrastructure and further highlighted the importance of health coverage. During this time, enrollment in Medicaid increased as people sought coverage after losing jobs or income because of the pandemic. Provisions in the Families First Coronavirus Response Act (FFCRA) and the Coronavirus Aid, Relief and Economic Security Act (CARES), require states to maintain eligibility standards and provide continuous enrollment in Medicaid until the end of the public health emergency (PHE) to qualify for a 6.2 percentage point increase in Federal Medical Assistance Percentage (FMAP). The continuous enrollment requirement and other economic factors resulted in Medicaid enrollment growth of 19.1% between February 2020 and September 2021 (the most recently available data), with much of the increase occurring in the first year of the PHE. States also adopted other temporary changes in their state Medicaid plans, through disaster-related authorities, to streamline processes and connect individuals to coverage more quickly, such as expanding the use of presumptive eligibility, waiving premiums and cost-sharing, and allowing self-attestation of certain eligibility criteria.

This 20th annual survey of Medicaid and CHIP program officials in the 50 states and the District of Columbia (DC) conducted in January 2022 by KFF and the Georgetown University Center for Children and Families provides data on state Medicaid and CHIP eligibility levels and presents a snapshot of key aspects of state enrollment and renewal procedures in place during the second year of the COVID-19 PHE. In anticipation of the likely end of the PHE in 2022, this year’s survey also focuses on actions states are taking to prepare for the lifting of the continuous enrollment requirement. The report includes policies for children, pregnant women, parents and other non-elderly adults whose eligibility is based on Modified Adjusted Gross Income (MAGI) financial eligibility rules; it does not include policies for groups eligible through Medicaid pathways for adults over the age of 65 or on the basis of disability.

CMS released new guidance on March 3, 2022 that emphasizes promoting continuity of coverage and avoiding inappropriate coverage terminations when the continuous enrollment requirement ends (Table 1). While this recent guidance was released after the survey was fielded, state responses reported here illustrate how states expect to approach the unwinding of continuous enrollment and what the effects of the new guidance may be.

CMS Guidance On Unwinding The Continuous Enrollment Requirement

Back to top.

Preparing for the End of the PHE

Resuming Redeterminations and Disenrollments

States are required to develop plans for how they will prioritize outstanding eligibility and renewal actions when the continuous coverage requirement is lifted; just over half of states (27) have determined their approach (Figure 1). Given uncertainty around the timing of the end of the PHE, additional guidance that CMS may issue, and the future of the BBBA, it is perhaps not surprising that many states have yet to finalize their plans. However, having plans in place early will allow for better preparation and will enable states to communicate their plans to enrollees and other stakeholders in the state. Among the states with firm plans, eleven states indicate they will target individuals who have been flagged with a change in circumstances and/or are no longer likely to be eligible (population-based approach) while eight states plan to conduct fresh renewals based on the individual’s renewal month (time-based approach). Eight states plan to adopt a hybrid approach that combines the population- and time-based approaches. States adopting a population-based approach mentioned targeted strategies, including aligning renewals in some way with the Supplemental Nutrition Assistance Program (SNAP), prioritizing those with premiums in order to avoid unnecessary billing, processing individuals who have aged out of coverage, and deprioritizing pregnant women. Regardless of the approach a state adopts, the operational plan must consider ways to ensure continuity of coverage among those who remain eligible. While most states plan to wait until the continuous enrollment requirement is lifted to resume disenrollments, three states have not decided whether to forgo enhanced federal funding and begin disenrollments before the end of the PHE. However, even if states begin disenrollments prior to the end of the PHE, they must still follow the unwinding guidance CMS has issued.

tate Approaches To Prioritizing Renewals and Pending Actions Following The End Of The Continuous Enrollment Requirement, January 2022

Fifteen states indicate they will conduct electronic data matches to identify and target enrollees for priority action who may no longer be eligible after the continuous enrollment requirement is lifted (Figure 2). Nineteen states do not plan to conduct these types of data matches and 16 states indicate that a decision has yet to be made. While taking steps to identify individuals whose income has increased above Medicaid thresholds may be a useful way to prioritize renewals, these data searches, if broad in nature, can result in unintended consequences. Wide-ranging data searches may identify inconsistent or inaccurate information that does not impact eligibility; however, states may be prompted to take action on these discrepancies, which could lead to eligible individuals losing coverage if they do not follow up. In the most recent guidance, CMS recommends states suspend periodic data matches as a way to improve coverage retention and reduce churn.

Number of States Planning to Conduct Electronic Data Matches To Identify Enrollees Who May No Longer Be Eligible When The Continuous Enrollment Requirement Is Lifted, January 202

The majority of states plan to take up to a full year to process redeterminations and return to routine operations (Figure 3). When states resume redeterminations at the end of the PHE, they will need to conduct a fresh review of eligibility based on current circumstances and consider eligibility for all eligibility pathways before disenrolling anyone from Medicaid. Current CMS guidance, released after the survey was fielded, gives states up to 12 months to initiate and 14 months to complete the backlog of redeterminations. Of the 48 states that have established a timeframe for processing redeterminations, 41 states plan to take 9-12 months; four states plan to take 6-9 months; and three states plan to take 3-6 months. No state currently plans to take less than 3 months. Importantly, the enhanced federal Medicaid matching rate will end at the end of the quarter in which the PHE ends, which could put fiscal or political pressure on states to move more quickly. The risk of moving quickly is that there will be less time to conduct outreach to enrollees and develop staff capacity to process renewals. CMS encourages states to initiate redeterminations on no more than 1/9th of their total caseload each month to minimize this risk.

Estimated Length Of Time States Will Take to Process Redeterminations And Return to Normal Operations, January 2022

When the continuous enrollment requirement is lifted, a majority of states (41) plan to follow-up with enrollees when action must be taken to avoid a loss of coverage due to missing information (Figure 4). States must give individuals 30 days to respond to a renewal request but there is no federal requirement for states to do more than send the renewal form, followed by a termination notice if the individual does not respond. However, sending reminder notices via mail and also through other communication modes, such as phone, text, and/or email, can increase the response rate to renewal requests. Follow-up reminders can be key to reducing the number of people who remain eligible but are disenrolled at the end of the PHE because they did not respond to a request for information. Of the 41 states that plan to send reminders, about half (25) will attempt to contact enrollees at least two times and most plan to use a variety of communication modes ranging from mail (33 states), email (18), individual phone call (17), automated call (11), and text (11).

Number of States Sending Reminders When Action is Required to Retain Coverage, January 2022

Updating Contact Information

The vast majority of states (46) are planning actions to update mailing addresses before the end of the PHE (Figure 5). Outdated mailing addresses and returned mail have long been a problem in Medicaid and the impact of the more than two-year COVID-19 emergency is expected to exacerbate difficulties in reaching enrollees by mail, the primary method states use to send renewals and requests for information. Most states are taking proactive steps to update mailing addresses before the end of the PHE, including conducting “update your address” outreach (34 states); checking for updated addresses in SNAP or other benefit programs (27 states); working with managed care organizations (MCOs) (25 states); and conducting data matches with the United States Postal Service (USPS) National Change of Address database (9 states). Two states have not yet made a final decision on what actions they will take. The total number of states taking steps is higher than the 19 states indicating they were taking proactive steps to update mailing addresses in the 2021 survey.

State Actions To Update Mailing Addresses Before The End Of The Continuous Enrollment Requirement, January 2022

Over two-thirds of the states (35) take steps to follow-up on returned mail beyond re-mailing a notice to the same address. Returned mail has been a persistent problem in Medicaid, and CMS has provided guidance to the states on dealing with returned mail, depending on whether mail is returned with an in-state, out-of-state, or no forwarding address. Of the 35 states that take action on returned mail, almost all (32) follow up by telephone, while 12 states indicate they use email, 8 states check other programs and data sources, and 3 states use text to contact enrollees about the need to update their mailing address. Once the PHE expires, under current federal rules, states that do not have follow-up procedures in place may automatically terminate coverage without the advance ten-day notice when an enrollee cannot be located. However, using alternative methods for following up on returned mail can help reduce the number of disenrollments that occur when regular mail does not reach an enrollee.

Boosting Staff Capacity

More than half of states (30) plan to take steps to boost staff capacity at the end of the PHE (Figure 6). Like many employers, state eligibility agencies have experienced challenges in retaining and recruiting eligibility workers during the pandemic. Staff hired in the past two years are not experienced in processing renewals, and even workers with more tenure need refresher training. Of the states planning to boost workforce capacity, 21 states plan to approve overtime, while 15 states plan to hire new eligibility workers, and 12 states plan to hire contractors to boost capacity. Fewer states plan to borrow staff from other units/agencies or bring back retired workers on a temporary basis.

Planned Actions to Boost Eligibility Staff Capacity At The End Of The PHE, January 2022

Monitoring the Return to Normal Operations and Estimating Coverage Impacts

Almost all states (50) report they are capable of tracking call center statistics and a majority (41) are able to report the share of disenrollments that were determined ineligible versus disenrollments due to procedural reasons. Having timely and reliable data from states on key metrics will be needed to monitor the unwinding process and assess if the state needs to take additional steps to avoid coverage losses among those who remain eligible. Unreasonable call wait times and increasing loss of coverage due to procedural reasons can signal early problems that could warrant oversight from CMS. States have been required to report data on call wait time and reason for disenrollment along with other metrics to CMS through the Performance Indicator Project. However, most of these data are not publicly reported by CMS, making them less useful for monitoring the immediate effects of the unwinding of the continuous enrollment requirement on coverage unless a state chooses to voluntarily share key data. In recently released guidance, CMS has indicated it will require states to report monthly data on their progress with the unwinding, although it has not yet identified the data elements that states will be required to report.

In 20 states able to report, it is estimated that about 13% of Medicaid enrollees will be disenrolled when the continuous enrollment requirement ends. However, the estimates range widely across reporting states from about 8% to over 30% of total enrollees. Based on available data, most states report that an increase in income will be the primary reason for the disenrollments, but several states also expect incomplete renewals or missing documentation to be a primary reason for disenrollment. If these estimates hold true, millions of people will lose Medicaid coverage in the months following the end of the PHE; however, many children will likely be eligible for CHIP and many adults will likely be eligible for Marketplace or other coverage. Successfully transitioning these individuals into those other coverage options could reduce the number who lose coverage altogether and become uninsured.Back to top.

Enrollment and Renewal Processes During the PHE

Eligibility System Integration

While more states are moving toward managing their own State-based Marketplaces (SBM), not all SBM states have integrated Medicaid and CHIP into their Marketplace eligibility and enrollment system (Figure 7). Since 2020, six states transitioned to SBM status, bringing the total number of SBMs to 21, which includes 18 states that operate their own Marketplace eligibility systems and three states that rely on the federal healthcare.gov platform (SBM-FP). The remaining 30 states rely on the Federally-facilitated Marketplace (FFM) for some or all Marketplace functions. SBM states can choose to integrate Medicaid and CHIP into their Marketplace eligibility system, which can facilitate transitions of coverage between Medicaid, CHIP, and the Marketplaces. However, not all states have done so, particularly states that transitioned to full SBM status more recently. In 10 of the 18 SBM states with their own systems, the Marketplace eligibility system also determines eligibility for MAGI Medicaid and CHIP, but eight SBM states have yet to integrate Medicaid and CHIP into their Marketplace system. These eight SBM states, along with the three SBM-FP states and 30 FFM states that use healthcare.gov, have separate Medicaid and CHIP eligibility systems (41 states in total).

Integration of Marketplace and MAGI-Medicaid/CHIP Eligibility Systems, January 2022

States continue to integrate non-MAGI and non-health programs into the system that determines MAGI Medicaid eligibility. When the ACA Medicaid expansion and other changes were implemented in 2014, many states delinked their Medicaid eligibility systems for MAGI groups (children, pregnant women parents, and expansion adults) from their systems for seniors and individuals with disabilities (non-MAGI groups) and from non-health programs, including Supplemental Nutrition Assistance Program (SNAP), Temporary Assistance for Needy Families (TANF), and child care subsidies. Since then, however, many states have reintegrated these programs. Systems that integrate eligibility for all health programs, as well as non-health programs, make it easier for individuals to apply for multiple assistance programs and for states to consolidate eligibility tasks, increasing administrative efficiency. It also allows for the sharing of information across programs to verify eligibility and facilitate renewals for Medicaid. In January 2022, over two-thirds of states (36) reported having integrated non-MAGI Medicaid with the MAGI Medicaid and CHIP eligibility system. SNAP and TANF are integrated in the system that determines eligibility for Medicaid in 28 states while 15 states have also integrated child care subsidies into their MAGI Medicaid eligibility systems (Figure 8). These counts include Kentucky and Rhode Island, the only SBM states that have fully integrated their Marketplace eligibility system with eligibility for MAGI Medicaid, non-MAGI Medicaid, and non-health programs.

Number Of States That Have Integrated Non-MAGI Medicaid And Non-Health Programs Into The System That Determines MAGI-Medicaid Eligibility, 2020 And 2022

Applications, Online Accounts, and Mobile Access

In almost all states, applications can be submitted online, by telephone, in person, or by mail. All states accept applications online and in person (subject to COVID restrictions) while 50 states offer paper applications that can be mailed in, and 49 states accept applications by telephone without requiring a written signature. More than half of the states (28) accept applications through other modes, most frequently fax or email.

Several states have added non-MAGI Medicaid and non-health programs to their applications during the pandemic. Thirty-nine states allow applicants to apply for both MAGI and non-MAGI Medicaid through a single application, up from 34 states in 2020. Multi-benefit applications now include SNAP in 29 states (up from 26 states in 2020) and TANF in 27 states (up from 23 states in 2020). In addition, 17 states include child care subsidies in their multi-benefit applications, up from 12 in 2020 (Figure 9). Multi-benefit applications are more common in states that have Medicaid eligibility systems that are integrated with non-MAGI Medicaid and non-health programs.

States With Multi-Benefit Applications, Including Medicaid And Non-Health Programs, 2020 And 2022

Nearly all states (48) now offer online accounts for Medicaid and CHIP enrollees that make it easier for individuals to submit and access information about their coverage. Five states (Arkansas, Iowa, Kansas, Missouri, and North Carolina) launched online accounts since January 2020. Almost all states that have online accounts allow individuals to check application status, report changes, and view notices while slightly fewer permit individuals to renew coverage through their account. Since January 2020, several states have expanded the features offered, including the ability to upload documentation and the option to receive notices electronically (41 states up from 33 states in 2020).

States have taken steps to improve the mobile friendliness of their applications and online accounts. As more individuals use smart devices, such as phones and tablets, states are increasingly working to ensure that applications and online accounts can be used on multiple technology platforms. As of January 2022, 32 states report their online applications are mobile friendly compared to just 20 states in 2020. Similarly, 35 of the 48 states with online accounts report mobile-friendly formatting, an increase of 12 states since 2020 (Figure 10).

Number of States with Mobile-Friendly Formatting for Applications and Online Accounts, 2020 And 2022

Eligibility Verification Processes

All states use electronic data matches from a variety of data sources to verify income eligibility. Under the ACA, states must first attempt to verify eligibility (both income and other criteria) before requiring the individual to complete a form or submit documentation. Data-driven eligibility determinations at application and renewal are faster and reduce the burden of submitting and processing paperwork for both individuals and states. Data sources used by more than 40 states include the Federal Data Services Hub, state wage databases, and state unemployment databases. Two-thirds (34) of states also use commercial databases (like TALX or the Work Number) that provide wage information from large employers and 30 states access SNAP income data. Nearly all states access multiple sources to verify income.

The use of electronic data enables most states to process at least a small number of eligibility determinations in real time (defined as 24 hours); however, there is significant variation across states in the share of real-time determinations. Forty-three states report being able to make real-time eligibility determinations but some states indicate that while a small share of applications may be processed in 24 hours, their “systems are not programmed” to make real-time determinations; determinations made within 24 hours in these states require eligibility worker intervention. Since 2018, CMS has released an annual report showing the share of MAGI applications processed within five timeframes: within 24 hours; 1 – 7 days; 8 – 30 days; 31 – 45 days; and over 45 days.

Renewal Processes During the PHE

As of January 2022, most states (42) report processing ex parte renewals to extend coverage for individuals during the PHE. Under the ACA, states must seek to complete administrative or ex parte renewals by verifying ongoing eligibility through available data sources, such as state wage databases, before sending a renewal form or requesting documentation from an enrollee. Some states suspended renewals as they implemented the MOE continuous enrollment requirement and made other COVID-related adjustments to operations. Under normal circumstances, if a state cannot determine that an individual remains eligible based on available information, it must send the enrollee a pre-populated form with the renewal information and provide at least 30 days for the enrollee to provide the necessary information and correct inaccuracies. During the PHE, states have been encouraged to continue using data to conduct ex parte renewals and extend coverage for 12 months for those who remain eligible. Of the 42 states actively processing ex parte renewals, nearly two-thirds (30 states) are sending renewal forms or requests for documentation when they are unable to confirm ongoing eligibility through electronic data sources, although they may not disenroll anyone for eligibility or procedural reasons during the PHE. By processing ex parte renewals and sending out renewal forms, states will have a smaller backlog of delayed renewals or pending actions when the PHE ends.

The share of renewals completed using ex parte processes varies across states and is low in many states. Completing renewals by checking electronic data sources to verify ongoing eligibility reduces the burden on enrollees to maintain coverage. Of the 42 states processing ex parte renewals, only 11 states report completing 50% or more of renewals using ex parte processes. Twenty-two states complete less than 50% of renewals on an ex parte basis, including 11 states where less than 25% of renewals are completed using ex parte processes (Figure 11). CMS notes in recent guidance that states can increase the share of ex parte renewals they complete without having to follow up with the enrollee by expanding the data sources they use to verify ongoing eligibility.

Share of Medicaid Renewals Completed Using Ex Parte Processes, January 2022

Under the ACA, states are expected to accept renewals through four modes: online, by telephone, in person, and by mail. When renewals can be completed via ex parte or administrative processes, there is no need for enrollees to take action unless the information used to renew coverage is inaccurate. However, if a state is unable to renew coverage using data available to the agency, it is likely that documentation will be needed to confirm ongoing eligibility. Almost all states (50) accept information needed at renewal via mail and in person, with slightly fewer states accepting missing information over the phone (39 states) with a telephonic signature. As states add or expand online account functionality, more states are allowing enrollees to provide missing renewal information or documentation through their online accounts (41 states compared to 39 states in 2020). Most states (49) also allow renewal information to be submitted by fax.

As of January 2022, 32 states provide 12-month continuous eligibility for all children in Medicaid and/or CHIP and four states provide continuous eligibility for adults (Figure 12). Two states provide 12-month continuous eligibility to a limited group of younger children in Medicaid, and one states limits eligibility in both programs. The continuous coverage policy for children is more common in CHIP with 24 of 34 separate CHIP programs providing a full year of coverage compared to 24 of the 51 Medicaid programs that have adopted the option. Only New York provides 12-month continuous eligibility for all adults. Kansas covers parents and Utah covers a targeted group of adults with incomes 0-5% FPL for a full year under waiver authority. Montana received approval from CMS in December 2021 to eliminate 12-month continuous eligibility for expansion adults, although the coverage remains in effect during the PHE. The state also requested approval to eliminate 12-month continuous eligibility for parents; however, that request is still pending with CMS. Continuous eligibility eliminates coverage gaps due to income fluctuations, which are often temporary, and is referenced in recent CMS guidance as a strategy for promoting continuous coverage for eligible individuals and reducing churn. In states without continuous eligibility, enrollees are expected to report changes in circumstances, which will add to the state’s workload as it resumes routine operations at the end of the PHE.

States That Provide 12-Month Continuous Eligibility For Children In Medicaid or CHIP, January 2022

Back to top.

Medicaid and CHIP Eligibility

As of January 2022, Medicaid and CHIP eligibility were stable as the public health emergency protections remained in effect for the entirety of 2021. To provide economic relief to the states and promote stability of coverage during the COVID-19 pandemic, the FFCRA provides a 6.2 percentage point increase in the federal share (FMAP) of certain Medicaid spending if states meet MOE requirements. The MOE provisions prohibit states from reducing eligibility levels, implementing stricter enrollment procedures, or increasing premiums beyond policies in place as of January 1, 2020. States are also required to provide continuous enrollment through the end of the month in which the PHE ends and must cover COVID-19 testing and treatment for Medicaid enrollees. The COVID-related MOE does not apply to separate CHIP programs, but other MOE requirements remain in place for CHIP.

In 2021, Oklahoma and Missouri implemented the ACA Medicaid adult expansion, leaving only 12 states that have not filled the coverage gap for low-income adults (Figure 13). As of January 2022, 39 states cover parents and adults without dependent children with incomes at least up to 138% FPL (the FPL is $13,590 for an individual; $23,030 for a family of three in 2022). Just half of the states (25) and DC immediately expanded coverage to adults in January 2014. Since then, an additional 13 states have adopted the Medicaid expansion; six via state ballot initiatives, including Missouri and Oklahoma. In 2022, South Dakota will be the seventh state where voters will have a say in the state’s decision to expand Medicaid.

Medicaid Income Eligibility for Expansion Adults, January 2022

In the 12 states that have not implemented the Medicaid expansion, eligibility for parents remains extremely low, and only Wisconsin covers adults without dependent children (Figures 14 and 15). The median eligibility level for parents and caretakers in the 12 non-expansion states now stands at 38.5% FPL ($8,866 annually for a family of three), ranging from a low of 16% FPL in Texas to 100% FPL in Wisconsin. Nine non-expansion states base eligibility on a fixed dollar threshold that is converted to the equivalent federal poverty level for comparison purposes. Over time, the equivalent eligibility level will decrease when annual updates adjust federal poverty levels upward to account for inflation. In a year when the jump in the federal poverty levels is more significant, as it was in 2022, this erosion is more evident. For example, Tennessee’s parent eligibility declined from 93% FPL to 88% FPL between 2021 and 2022. Wisconsin is the only non-expansion that has aligned eligibility for adults without dependent children with that for parents at 100% FPL, through a waiver.

Median Medicaid Income Eligibility Limits Based On Implementation Of Medicaid Expansion, January 2022
Medicaid Income Eligibility Limits For Adults In States That Have Not Implemented The Medicaid Expansion, January 2022

As of January 2022, children’s upper income eligibility remains unchanged, with the median eligibility level stable at 255% FPL. Child eligibility in Medicaid and CHIP continues to be the highest of all eligibility groups with all but two states (Idaho and North Dakota) covering children at or above 200% FPL. (Figure 16). Eligibility levels for children range from a low of 175% FPL in North Dakota to a high of 405% FPL in New York. More than a third of the states (19) cover children at or above 300% FPL. The only change in eligibility levels for children’s coverage was in Kansas, where CHIP eligibility is linked to a dollar-based income level tied to the 2008 FPL.

ncome Eligibility Levels For Children in Medicaid/CHIP, January 2022

The median eligibility limit for coverage for pregnant women in Medicaid and CHIP remained steady at 205% FPL. States provide pregnancy coverage at higher income levels than coverage for parents or other adults. Across states, eligibility levels for pregnant women in Medicaid and CHIP range from a low of 138% FPL (the federal minimum level) in Idaho and South Dakota to a high of 380% FPL in Iowa. Two-thirds of the states (35) cover pregnant women at or above 200% FPL. Six states have expanded pregnancy coverage in CHIP, an option for states that cover pregnant women in Medicaid up to at least 185% FPL (Figure 17) while 18 states provide pregnancy coverage from birth to conception for targeted low-income children.

Income Eligibility Levels For Pregnant Individuals In Medicaid/CHIP,  January 2022

As of January 2022, 41 states have adopted federal options to extend coverage to immigrant children and pregnant women; eight of these states use state funds to extend coverage or limited benefits to some adults and children who do not qualify for federal funding. States have several options to use federal funding to cover children or pregnant people without the five-year waiting period in Medicaid and CHIP. Dating back to the enactment of CHIP, states have had the option to provide coverage in CHIP from conception to birth, known as the unborn child option, which effectively extends coverage to pregnant people without regard to immigration status. In 2021, Virginia became the 18th state to adopt this option. The 2009 CHIP Reauthorization Act (CHIPRA) also provided states another option to waive the five-year waiting period before covering lawfully-residing children and pregnant people. As of January 2022, two-thirds of states (35) have implemented the CHIPRA option for children in Medicaid and all of those states with separate CHIP programs (24 states) cover lawfully-residing children in CHIP. Twenty-five states have adopted the CHIPRA option to cover lawfully-residing pregnant people (Figure 18).

Federally Funded Medicaid/CHIP Coverage For Immigrant Children And Immigrant Pregnant Individuals, January 2022

States also use state-only funds to extend coverage to immigrant groups who are not eligible for federal funding. As of January 2022, seven states cover all children regardless of immigration status, while Iowa covers some immigrant children who do not qualify for federal funding. California began covering young adults ages 19-26 regardless of immigration status in January 2020 and starting in May 2022, will extend coverage to adults ages 50 and older regardless of immigration status. There is growing interest in filling coverage gaps, particularly for children and pregnant women. Maine, New Jersey, and Vermont will extend coverage to all children regardless of immigration status in July 2022 and Connecticut will cover all children under age nine starting in January 2023. Vermont will also extend state-funded coverage to pregnant people who do not qualify for federal funding in mdi-2022 and the District of Columbia and Maine are planning to adopt the CHIP unborn child option for pregnant people in April and July 2022, respectively.

The median eligibility level for family planning services was 206% FPL, but eligibility levels range from 138% FPL in Louisiana and Oklahoma to a high of 306% FPL in Wisconsin. All states must cover family planning services in Medicaid and 30 states use federal funds, through a state plan option or waiver, to provide family planning only services to people who do not qualify for full Medicaid through another pathway.Back to top.

Looking Ahead

States are preparing now for the end of the PHE, but they will still need lead time to finalize their plans. Anticipating the end of the PHE in the coming months, states have begun making decisions around actions they will take to resume normal operations. However, some states have yet to adopt key strategies related to how they will approach processing redeterminations and other pending actions that will inform their overall operational plans. These plans are necessary to begin taking steps to update policies and procedures, make any needed systems changes, and engage with stakeholders around the details. Providing adequate lead time to states before ending the PHE will enable states to finalize their operational plans. The Biden administration has promised to provide at least 60 days’ notice, but signaling even earlier when the PHE will end, if possible, would enable states and other key stakeholders, including MCOs, to ensure policies and processes are in place and ready to implement.

CMS guidance on resuming normal operations focuses on prioritizing continuity of coverage. CMS has released several rounds of guidance during the PHE, initially in December 2020, in August 2021 and most recently in March 2022 (the latest guidance was released after the survey was fielded). Guidance issued under the Biden administration has consistently emphasized strategies to promote continuity of coverage and avoid inappropriate terminations among people who remain eligible for coverage. The most recent guidance reiterates that all states must complete a full redetermination before an enrollee’s coverage can be terminated. It also gives states an additional two months to complete processing renewals, but all renewals must still be initiated in the 12-month unwinding period. The guidance strongly encourages states to initiate no more than 1/9th of total caseloads each month to reduce the risk that a compressed renewal workload will result in individuals being erroneously determined ineligible and to distribute renewals more evenly in future years. It also provides states with additional flexibilities to align work on pending actions, including aligning Medicaid renewals with SNAP recertifications or coordinating renewals for all household members.

The PHE has demonstrated how continuous enrollment can eliminate churn in Medicaid; going forward states can adopt existing options and strategies to promote coverage. Such options include adopting 12-month continuous coverage for children (also for adults through an 1115 waiver), extending postpartum coverage for 12-months, and increasing the effectiveness of data-driven determinations and renewals by using information from other programs and expanding data sources used to verify income and other information. Many states have adopted these options, including 32 states that provide 12-month continuous eligibility for children and 21 states that have or plan to extend postpartum coverage from 60 days to 12 months to all pregnant individuals. Adopting the Medicaid expansion in the 12 states that have not yet done so can also ensure continuity of coverage for parents in those states who may have experienced a small increase in income during the pandemic and may no longer be eligible under current rules. It would also provide coverage to the two million people in the coverage gap who do not currently have an affordable coverage option. The American Rescue Plan Act (ARPA) provides temporary financial incentives for states that newly adopt the Medicaid expansion. States that have not yet done so can protect ongoing coverage by adopting these options or otherwise streamlining automated renewal processes.

State actions and decisions around the unwinding will affect Medicaid enrollment and transitions to other coverage. How states approach the unwinding of the continuous enrollment requirement will affect the extent to which eligible individuals retain coverage and those who are no longer eligible are able to transition to other coverage. Outcomes will differ across states as they make different choices and face challenges balancing workforce capacity, fiscal pressures, and the volume of work. Careful monitoring of state progress throughout the unwinding period can provide information to assess fiscal effects and state efforts to promote continuity of coverage. CMS has indicated states will be required to submit baseline and monthly data for a minimum of 14 months that it will use to monitor the unwinding to ensure compliance with timelines and to prevent erroneous disenrollment of eligible individuals. CMS has not yet specified what data elements states will need to report nor does it indicate whether the data will be made publicly available. If the data are not released publicly, it will be more difficult for entities other than CMS to monitor state actions.

The fate of the Build Back Better Act (BBBA) will have implications for overall coverage. The BBBA includes several provisions related to the unwinding of the continuous enrollment requirement, some of which CMS has incorporated in the most recent guidance. BBBA also includes provisions to close the Medicaid coverage gap in the dozen states that have not expanded eligibility under the ACA and to extend the enhanced Marketplace premium subsidies initially made available by ARPA that have made coverage more affordable for millions of people. The number of people who are uninsured has not increased during the PHE as many had predicted. However, the end of the PHE poses risks to that coverage stability. Millions of people could lose coverage if those who continue to be eligible for Medicaid are not able to retain coverage and if the provisions in the BBBA that close the coverage gap and make Marketplace coverage more affordable are not enacted.

Tables

Table A:Trends in State Medicaid and CHIP Eligibility, Enrollment, and Renewal Policies, July 2005-January 2022
Table 1:Income Eligibility Limits for Children's Health Coverage as a Percent of the Federal Poverty Level, January 2022
Table 2:Medicaid and CHIP Coverage for Pregnant Individuals and Medicaid Family Planning Expansion, January 2022
Table 3:State Adoption of Options to Cover Immigrant Populations, January 2022
Table 4:Medicaid Income Eligibility Limits for Adults as a Percent of the Federal Poverty Level, January 2022
Table 5:Integration of MAGI-Medicaid Eligibility Systems with Marketplace Systems, Non-MAGI Medicaid, and Non-Health Programs, January 2022
Table 6:Modes For Submitting Medicaid Applications and Features of Online Applications, January 2022
Table 7:Features of Online Medicaid Accounts, January 2022
Table 8:Income Verification and Real-Time Eligibility Determinations, January 2022
Table 9:Medicaid Ex Parte Renewals for Children, Pregnant Women, Parents, and Expansion Adults, January 2022
Table 10:Modes For Submitting Medicaid Renewals, January 2022
Table 11:State Adoption of 12-Month Continuous Eligibility for Selected Populations, January 2022
Table 12:State Plans For Unwinding the Continuous Enrollment Requirement, January 2022
Table 13:Medicaid Renewal Communications When Continuous Enrollment Requirement Ends, January 2022
Table 14:Ongoing or Planned Actions to Update Mailing Address, January 2022
Table 15:State Follow-Up on Returned Mail, January 2022
Table 16:Planned Actions to Increase Eligibility Staff Capacity for Processing Redeterminations When the Continuous Enrollment Requirement Ends, January 2022
Table 17:Call Center and Disenrollment Data Tracking Capabilities, January 2022
Table 18:State Estimates of the Share of Medicaid Enrollees Who Will Be Determined Ineligible When the Continuous Enrollment Requirement Ends and Primary Reason(s) for Loss of Eligibility, January 2022

Medicare Part B Drugs: Cost Implications for Beneficiaries in Traditional Medicare and Medicare Advantage

Published: Mar 15, 2022

In the face of rising prescription drug costs, a large majority of the public supports federal efforts to lower drug spending. In his 2022 State of the Union address, President Biden urged Congress to pass legislation to rein in drug costs. In November 2021, the House of Representatives passed the Build Back Better Act (BBBA), which includes several provisions that would lower prescription drug costs, but the Senate has yet to take action on this legislation. Proposals included in the BBBA would allow the federal government to negotiate the price of some drugs covered under Medicare Part B (drugs administered by physicians and other health care providers) and Part D (retail prescription drugs); require drug companies to pay rebates to the federal government when annual increases in drug prices for Medicare and private insurance exceed the rate of inflation; cap monthly insulin costs for people with Medicare and private insurance; and cap Medicare beneficiaries’ out-of-pocket drug spending under Part D (but not Part B).

To better understand the potential out-of-pocket cost exposure that Medicare beneficiaries may face for Part B drugs, in this brief we analyze cost-sharing liability for these drugs in traditional Medicare and cost-sharing requirements in Medicare Advantage plans. Data limitations preclude us from analyzing actual out-of-pocket costs paid by beneficiaries who used Part B drugs. For traditional Medicare beneficiaries, claims data do not report separately cost-sharing liability paid directly by beneficiaries versus supplemental insurance (where applicable). For Medicare Advantage enrollees, there are no data available on actual out-of-pocket costs paid for Part B drugs.

Beneficiaries in traditional Medicare are charged 20% of the cost of Part B drugs, with no annual limit on their out-of-pocket costs. Beneficiaries enrolled in Medicare Advantage plans – which account for a growing share of the Medicare population and currently cover close to half of all beneficiaries – also typically face cost-sharing requirements for Part B drugs up to their plan’s out-of-pocket limit ($7,550 for in-network cost sharing and $11,300 for in-network and out-of-network cost sharing combined in 2022). Most but not all beneficiaries in traditional Medicare have some form of supplemental coverage to help with their Medicare cost-sharing requirements, while most Medicare Advantage enrollees do not. For example, most traditional beneficiaries who have Medigap have a policy that covers the 20% coinsurance for Part B drugs and services, while Medicaid and some of the Medicare Savings Programs cover Medicare cost sharing for eligible low-income beneficiaries in both traditional Medicare and Medicare Advantage. But even those with supplemental insurance may face some out-of-pocket costs for their Part B drugs, depending on the generosity of their coverage. In addition, roughly 6 million Medicare beneficiaries have no supplemental coverage and would be responsible for the full 20% coinsurance.

In the first part of this analysis, we examine Medicare claims data for 2019 to assess cost-sharing liability for Part B drugs for beneficiaries in traditional Medicare (excluding Part B vaccines since these are provided at no cost to Medicare beneficiaries). In the second part of our analysis, we use Medicare Advantage benefit design data for 2022 to examine the range in cost-sharing amounts at or below 20% coinsurance charged by Medicare Advantage plans for in-network Part B drugs. We also analyze variation in cost-sharing amounts for out-of-network Part B drugs charged by plans that provide out-of-network coverage. (See Methods for additional details on both parts of our analysis.)

Findings

One-fourth of the 4.1 million traditional Medicare beneficiaries who used one or more Part B drugs in 2019 had average annual cost-sharing liability of at least $1,000

Of the 4.1 million beneficiaries in traditional Medicare who received one or more Medicare Part B drugs included in this analysis, 1 in 4 (1.0 million beneficiaries) faced cost-sharing liability of at least $1,000 and nearly 1 in 5 (0.7 million) faced cost-sharing liability of at least $2,000 in 2019 (Figure 1). About 0.4 million traditional Medicare beneficiaries – or 1 in 10 of those who used Part B drugs – had at least $5,000 in cost-sharing liability for these drugs in 2019. As previously noted, we are unable to analyze how many beneficiaries had supplemental insurance to cover some or all of these costs and how many were responsible for paying the full amount out-of-pocket.

1 in 4 traditional Medicare beneficiaries who used one or more Medicare Part B drugs in 2019 faced cost-sharing liability greater than $1,000

For more than half of all Part B drugs included in this analysis, average annual cost-sharing liability was $1,000 or more in 2019

Of the 287 Part B drugs included in this analysis, more than half (54% or 155 drugs) had average annual cost-sharing liability of at least $1,000 in 2019, and more than 4 in 10 (43% or 123 drugs) had cost-sharing liability of at least $2,000.

  • Eight of the top 10 Part B drugs with the highest total spending, and 18 of the top 20, had average annual cost-sharing liability of at least $1,000 in 2019 (Figure 2, Table 1). For example, average beneficiary liability for Eylea, the top-spending Part B drug in 2019 used by 270,300 traditional Medicare beneficiaries to treat macular degeneration, was $2,100. For the cancer drug Keytruda, second in terms of total Medicare Part B spending, average cost-sharing liability was $9,100.
  • Conversely, average annual cost-sharing liability for most of the Part B drugs with the highest number of users was below $1,000. Only 2 of the top 10 Part B drugs based on the number of users, and 4 of the top 20, had average annual cost-sharing liability of at least $1,000 in 2019 (Table 2). For example, average beneficiary liability for the most-commonly used (non-vaccine) Part B drug, Prolia (and the equivalent brand Xgeva), an osteoporosis treatment used by nearly 600,000 traditional Medicare beneficiaries in 2019, was $600.
Traditional Medicare beneficiaries faced cost-sharing liability greater than $1,000 for 8 of the top 10 Part B drugs by total spending and 2 of the top 10 Part B drugs by total number of users in 2019

Average annual cost-sharing liability exceeded $10,000 for more than 1 in 10 Part B drugs in this analysis (13% or 36 drugs). While some of the highest-liability drugs were used by relatively few beneficiaries to treat rare conditions, two of these drugs were used by more than 10,000 beneficiaries in 2019: Opdivo, a treatment for several types of cancer used by 30,300 beneficiaries, with average annual cost-sharing liability of $10,200; and Darzalex, a treatment for multiple myeloma used by nearly 12,000 beneficiaries, with average annual cost-sharing liability of $12,900.

Like beneficiaries in traditional Medicare, Medicare Advantage enrollees typically face 20% coinsurance for Part B drugs, but can be exposed to higher cost-sharing requirements for these drugs when administered by an out-of-network provider

Medicare Advantage plans have flexibility to determine cost-sharing amounts for Part B covered drugs, subject to certain limits, and can differentiate cost sharing for chemotherapy from other Part B drugs. In 2022, Medicare Advantage plans are prohibited from charging more than 20% coinsurance, or the equivalent copay amount, for both chemotherapy and other Part B drugs from in-network providers. There are no similar restrictions on out-of-network cost-sharing amounts.

Based on our analysis of Medicare Advantage plan cost-sharing requirements and enrollment as of January 2022:

  • Consistent with current requirements, all 22.9 million Medicare Advantage enrollees included in this analysis (excluding enrollees in employer group plans) face coinsurance of 20% or less (or equivalent cost sharing) for chemotherapy and other Part B drugs when provided in-network (Figure 3). Some Medicare Advantage plans always charge less than 20% coinsurance for both types of drugs; for example, 25% of HMO enrollees and 9% of PPO enrollees and other plans that offer out-of-network coverage charge less than 20% coinsurance for Part B drugs administered in network. Other plans vary cost-sharing amounts for Part B drugs (e.g., a $0 copayment or 20% coinsurance) depending on the type of drug (e.g., chemotherapy vs. other Part B drugs) and/or where it is furnished (e.g., a pharmacy or other provider setting).
Most Medicare Advantage enrollees face a 20% coinsurance rate for Medicare Part B drugs provided in-network, but many enrollees face higher cost sharing for drugs received out-of-network
  • Among the 8.3 million Medicare Advantage enrollees in PPOs and other types of plans with out-of-network coverage, one-fourth of these enrollees (2.1 million) face 20% coinsurance for Part B drugs received from an out-of-network provider, while close to half (44% or 3.7 million) would be charged more than 20% for these drugs if administered by an out-of-network provider (Figure 4). Among these enrollees, 1.1 million are in plans that charge 50% for out-of-network Part B drugs, 1.1 million are in plans that charge 40% coinsurance, and 0.9 million enrollees are in plans that charge a 30% coinsurance (0.9 million). Another 31% of enrollees with out-of-network coverage (2.5 million) may face coinsurance higher than 20% depending on the type of drug and/or where the drug is administered.
3.7 million Medicare Advantage enrollees face coinsurance greater than 20% for Medicare Part B drugs from out-of-network providers in 2022, including 1.1 million enrollees who would pay 50% coinsurance
  • The 14.7 million Medicare Advantage enrollees in HMOs and other plans with no out-of-network coverage would pay 100% of the cost for Part B drugs administered out-of-network unless they received prior approval from their plan.

Unlike traditional Medicare, Medicare Advantage plans have an out-of-pocket limit, but Medicare Advantage enrollees can still face substantial cost-sharing amounts for some of the higher-priced Part B drugs, especially if administered out-of-network.

  • For Eylea, a treatment for macular degeneration, Medicare Advantage enrollees would face average cost-sharing liability of $2,100 at a 20% coinsurance rate and up to $5,200 at a 50% coinsurance rate, assuming the plan pays the same price as traditional Medicare.
  • For Rituxan, a cancer and autoimmune treatment, Medicare Advantage enrollees would face average cost-sharing liability of $4,600, based on a 20% coinsurance rate for in-network chemotherapy, but could face costs up to their plan’s maximum out-of-limit for this one drug alone based on higher out-of-network coinsurance rates (up to $11,300 in 2022).
  • For Prolia (and the equivalent brand Xgeva), an osteoporosis treatment, Medicare Advantage enrollees would face average cost-sharing liability of $600 at a 20% coinsurance rate and up to $1,400 at a 50% coinsurance rate, assuming the plan pays the same price for these drugs as traditional Medicare.

Discussion

Beneficiaries in both traditional Medicare and Medicare Advantage can be exposed to potentially high out-of-pocket costs for Part B drugs – though data limitations preclude us from analyzing out-of-pocket costs paid directly by beneficiaries who used Part B drugs in either traditional Medicare or Medicare Advantage plans and the share of costs covered by private supplemental insurance or Medicaid. We find that, overall, 1 in 4 beneficiaries in traditional Medicare who used Part B drugs in 2019 faced cost-sharing liability of at least $1,000, and more than half of Part B drugs included in this analysis had average cost-sharing liability of $1,000 or more. Given the absence of an out-of-pocket limit for beneficiaries in traditional Medicare, the costs of chemotherapy and other Part B drugs could represent a substantial financial burden for beneficiaries with no supplemental coverage, or with supplemental coverage that does not cover all cost-sharing requirements for these drugs.

While Medicare Advantage plans are required to have a maximum out-of-pocket limit and can charge no more than 20% for Part B drugs administered by an in-network provider, most Medicare Advantage enrollees would face higher costs for Part B drugs furnished by an out-of-network provider, including close to 4 million enrollees in plans with out-of-network coverage and nearly 15 million enrollees in HMOs and other plans with no out-of-network coverage. Plans with out-of-network coverage typically charge higher cost sharing for Part B drugs and other services received out-of-network to encourage enrollees to receive care from in-network providers where plans have negotiated lower prices. These network arrangements and cost-sharing differences can have potentially large cost implications for Medicare beneficiaries.

Among the set of proposals that policymakers have recently considered to lower prescription drug costs, allowing the federal government to negotiate prices for some drugs covered under Part B and Part D and requiring inflation rebates for Medicare-covered drugs to limit annual increases in drug prices could help to address the spending burden that Medicare beneficiaries could face if they need high-cost drugs, whether covered under Part B or Part D.

This work was supported in part by Arnold Ventures. We value our funders. KFF maintains full editorial control over all of its policy analysis, polling, and journalism activities.

Methods

This analysis is based on 2019 Medicare claims data for separately payable (non-packaged) Part B drugs from a 20% sample of Medicare beneficiaries, removing drugs taken by fewer than 11 beneficiaries in the sample. The claims include beneficiaries in traditional Medicare only, excluding beneficiaries enrolled in Medicare Advantage. Using HCPCS codes for Part B drugs, claims were pulled from the outpatient, carrier, and durable medical equipment (DME) files, removing packaged drugs, vaccines, and claims from Maryland hospitals, Critical Access Hospitals, and dialysis facilities.

We calculate beneficiary liability using variables in the claims data corresponding to deductible and coinsurance amounts, but we are not able to determine the amount that a beneficiary actually paid. Beneficiaries may not be responsible for some or all of their cost-sharing liability if they have certain types of supplemental coverage, including most Medigap policies or full benefits through Medicaid.

Medicare Advantage cost-sharing amounts and plan designs are based on the Centers for Medicare & Medicaid Services (CMS) Medicare Plan Finder data for 2022 and 2022 PBP Benefits file. Enrollment numbers are from the CMS January 2022 enrollment files. Plan-county enrollment and plan totals were removed if fewer than 11 beneficiaries were enrolled. Additionally, all employer plans were removed from the analysis as they are not required to submit all the data necessary for this analysis. We also excluded all Medicare-Medicaid plans.

For out-of-network Part B drugs in PPOs, data limitations preclude us from assessing differences in out-of-network cost-sharing amounts for chemotherapy and other Part B drugs because the Medicare Plan Finder does not separate out-of-network cost sharing for these two categories. It is likely that the percentage of enrollees we report as having a mixed cost-sharing structure for out-of-network Part B drugs would be lower if the data allowed us to analyze out-of-network cost sharing separately for chemotherapy and other Part B drugs. For an analogous approach, we estimated combined in-network cost-sharing amounts based on the amounts for chemotherapy and other Part B drugs. If these cost-sharing amounts were analyzed separately, the percentage of enrollees paying 20% coinsurance would be higher for chemotherapy, with a lower percentage of enrollees exposed to a mixed cost-sharing design. The percentages for the separate category of other Part B drugs would be similar to the percentages we report for both chemotherapy and other Part B drugs combined.

Tables

Average annual cost-sharing liability for traditional Medicare beneficiaries for almost all (18) of the top 20 high-spending Medicare Part B drugs was $1,000 or more in 2019
Average annual cost-sharing liability for traditional Medicare beneficiaries for 16 of the top 20 most commonly-used Medicare Part B drugs was less than $1,000 in 2019
News Release

Telehealth Continues to Account for More Than a Third of Outpatient Visits for Mental Health and Substance Use Services Well into the COVID-19 Pandemic

Published: Mar 15, 2022

A new analysis from KFF and Epic Research finds that telehealth visits for outpatient mental health and substance use services went from virtually zero percent in 2019 prior to the COVID-19 pandemic to a peak of 40% in mid-2020 – and continued to account for more than a third (36%) of such visits in the six months ending in August 2021.

The telehealth boom for mental health and substance use services far exceeds the increase recorded over the same period for other outpatient services. As a result, mental health and substance use services accounted for 39% of all telehealth outpatient visits in the six-month period between March and August 2021, about five times the share of all other outpatient visits. This reflects the tremendous increase in need for mental health services as a result of the pandemic, social distancing and ensuing economic turmoil, as well as a return to in-person visits for other outpatient care. 

The analysis examines data from Cosmos, Epic’s HIPAA-defined limited data set of more than 126 million patients from hospitals and clinics across the country. It also examines variations in telehealth use by age, gender and diagnosis.

Telehealth Has Played an Outsized Role Meeting Mental Health Needs During the COVID-19 Pandemic

Authors: Justin Lo, Matthew Rae, Krutika Amin, Cynthia Cox, Nirmita Panchal, and Benjamin F. Miller
Published: Mar 15, 2022

There has been a rapid increase in the use of telehealth thus far into the COVID-19 pandemic for both mental and physical health concerns. While many employer health plans covered telehealth prior to the pandemic, utilization of these services was relatively low, accounting for less than 1% of outpatient visits. At its pandemic peak, telehealth represented 13% of outpatient visits between March and August of 2020. As in-person care resumed, telehealth began to represent a smaller share of outpatient care (8% between March and August 2021). While many continue to envision an expanded role for telehealth in the delivery of care following the pandemic, there remains considerable uncertainty in what services will be available, where and how providers will be able to practice, how benefits will be structured, and how providers will be paid.

The COVID-19 pandemic has taken a toll on the nation’s mental health, with 3 in 10 adults in the U.S. reporting symptoms consistent with depression or anxiety disorder since April 2020. Over 20% of adults reporting poor mental health also report not receiving counseling or therapy during the pandemic. Telehealth has played a particularly significant role in meeting the need for mental health services. Thus far into the pandemic, some private payers have improved coverage for mental health and substance use, removing pre-pandemic restrictions on coverage for these services via telehealth. Similarly, Medicaid expanded coverage of telehealth services during the pandemic for mental health and substance use services. Many state Medicaid programs reported that telehealth has had particular value in maintaining or improving access to such services during the pandemic.

This analysis looks at outpatient visits during five six-month periods between March 2019 and August 2021, using data from Cosmos, a HIPAA-defined Limited Data Set of more than 126 million patients from over 156 Epic organizations, including 889 hospitals and 19,420 clinics across all 50 states. Mental health and substance use visits were identified based on the primary ICD-10-CM diagnosis code listed for the visit. We find that a year and a half into the pandemic, telehealth continues to play a significant role in providing services, particularly for mental health and substance use services.

Mental health and substance use services by telehealth has remained elevated whereas other outpatient care use by telehealth has declined

Share of outpatient visits delivered by telehealth, 2019-2021

Telehealth represented less than 1% of outpatient care before the pandemic (rounding to zero) for both mental health and substance use and other concerns. However, at its pandemic peak, telehealth represented 40% of mental health and substance use outpatient visits and 11% of other visits (during the March- August 2020 period). Since then, in-person care has returned and telehealth visits have dropped off to represent 5% of other outpatient care visits, those without a mental health or substance use claim in the March-August 2021 period. However, telehealth use has remained strong for mental health and substance use treatment, still representing 36% of these outpatient visits.

Telehealth use for mental health or substance use continues to grow as a share of all telehealth visits

Share of visits with a mental health and substance use disorder primary diagnosis, 2019-2021

Mental health and substance use visits represent a growing share of both telehealth visits and outpatient visits overall, but the trend is much more pronounced for telehealth. By the period of March-August 2021, 39% of telehealth outpatient visits were primarily for a mental health or substance use diagnosis compared to 24% a year earlier and 11% two years earlier. Among all outpatient visits (in-person and over telehealth), the share with a mental or substance use diagnosis grew from 4% in March-August 2019 to 8% during the pandemic, and has remained at 8% in March-August 2021.

This is a product of several factors, including the tremendous increase in need for mental health services as a result of the pandemic, social distancing and ensuing economic turmoil, as well as a return to in-person visits for other outpatient care.

Rural residents are more likely to use telehealth for mental and substance use disorder visits

Share of outpatient visits delivered by telehealth, by patient characteristics, March-August 2021

The adoption of telehealth varies based on the health needs of patients, their readiness and ability to adopt the technology, and the restrictions or incentives they face from payers and providers. Looking at the most recent study period (March-August 2021), a relatively high share of patients in rural areas relied on telehealth to receive outpatient mental health and substance use services (55%) compared to those in urban areas (35%). This pattern is especially pronounced in comparison to other outpatient health care services, where we observed a similar rate across urban and rural (5% vs. 6%) areas. This may be impacted by the number of rural areas which have a shortage of mental health providers.

Non-elderly adults consistently used telehealth to access mental health and substance use services

Share of outpatient visits delivered by telehealth, by age groups, 2019-2021

Early on in the pandemic (March-August 2020), outpatient services for mental health and substance use were delivered by telehealth at a similar rate among children and the elderly, and a slightly lower rate among non-elderly adults. A year later (March-August 2021), non-elderly adults were somewhat more likely to be treated via telehealth compared to kids and seniors. In the most recent period, 58% of all mental health or substance use outpatient visits, and 62% of these visits performed via telehealth, were among people in the 19-64 age group.

Telehealth use is significant across major mental health and substance use disorder conditions

Share of mental health or substance use outpatient visits delivered over telehealth by mental health or substance use condition in March-August 2021

The primary ICD-10-CM diagnosis code listed on an outpatient visit was categorized into conditions based on the Clinical Classifications Software Refined (CCSR). Major conditions were selected if there were more than 5,000 total visits (in-person and telehealth) during the March-August 2021 period. A large share of outpatient visits for major mental and substance use conditions were delivered over telehealth during this period, including for substance use disorders such as opioid-related disorders (29%) and alcohol-related disorders (29%). For mental health needs, over 1 in 3 outpatient visits were delivered by telehealth (for example, 35% and 38% of outpatient visits were over telehealth for depression or anxiety, respectively).

Discussion

How the mass adoption of telehealth affects access, cost, and quality of mental health and substance use disorder services remains to be seen. Telehealth may provide a way to improve access to mental health and substance use disorder care, particularly for people living in areas with fewer providers. Though differences in comfort with technology, digital literacy and lack of internet at home may hinder access to telehealth for some.

Payers’ and regulators’ policies governing telehealth services continue to evolve. As required under the Consolidated Appropriations Act of 2021 (CAA), and as implemented under the CY 2022 Medicare Physician Fee Schedule Final Rule, Medicare has permanently removed geographic restrictions for mental health and substance use services and permanently allows beneficiaries to receive those services at home. Also under the Physician Fee Schedule final rule, CMS will now permanently cover audio-only visits for mental health and substance use services, though only when the beneficiary is not capable of, or does not consent to, the use of two-way, audio/video technology.

States have broad flexibility to determine Medicaid coverage of telehealth services as well as providers’ licensure requirements to practice and prescribe during a telehealth consultation. States expanded Medicaid telehealth coverage in response to the pandemic, with nearly all states covering and paying parity for audio-visual and audio-only mental health and substance use disorder visits in their fee-for-service Medicaid programs as of July 2021. Many states plan to maintain all or some of these expanded telehealth policies post-pandemic, especially flexibilities for behavioral health visits. However, some states have moved to reinstate certain rules that limit telehealth use, providers’ ability to practice across state lines, and providers’ ability to prescribe medication without an in-person visit. In some other states, telehealth coverage expansions for Medicaid are tied to the COVID-19 public health emergency (PHE) and will expire with the PHE unless extended. State and federal laws regarding providers’ abilities to prescribe medication via telehealth and practice across state lines will also affect telehealth use in the future. Temporary federal policies that gave qualified providers more flexibility to prescribe controlled substances over telehealth are set to expire at the end of the PHE.

Data during the pandemic suggest there is a concerning increase in the number of individuals reporting symptoms of depression or anxiety and showing signs of substance use disorder. Many employers have expressed concern about the availability of mental health providers in their plan network. Given the increased need for services and concerns about the availability of mental health and substance use care providers, some payers may look to bolster access to these services through telehealth.

As policy makers continue to look at how to regulate and pay for telehealth services, it is important to consider opportunities for patient choice so that telehealth is not necessarily given as the only option for those looking for care. Additionally, the Substance Abuse and Mental Health Services Administration (SAMHSA) has called for refining clinical guidelines for tele-mental health services, including broader adoption of telehealth for mental and substance use disorders. In particular, how laws affecting prescribing patterns for mental health and substance use therapies are devised after the COVID-19 public health emergency ends may influence the long-term use of telehealth for mental health and substance use disorders.

Justin Lo is with Epic Research. Matthew Rae, Krutika Amin, Cynthia Cox, and Nirmita Panchal are with KFF. Benjamin F. Miller is with Well Being Trust.

Methods

This analysis was done using Epic’s Cosmos dataset, a HIPAA-defined limited data set of electronic health records from over 150 Epic organizations. Estimates in this report are based on this population and not weighted to be nationally representative. The analysis used data on outpatient visits for 94 data contributors to Cosmos from March 1, 2019 through August 31, 2021 and was analyzed in 6-month periods. Mental health and substance use services delivered by third-party vendors may not be included.  Organizations were then excluded if they had software go-lives or mergers during the study time period, had multiple weeks of missing data, or showed discrepancies. Mental health and substance use visits were identified based on the primary ICD-10-CM diagnosis code listed on the outpatient visit. Primary diagnosis codes were then grouped based on the Agency for Healthcare Research and Quality (AHRQ) Clinical Classifications Software Refined (CCSR) grouping. Rural patients are those who do not reside in a core based statistical area (CBSA).

Half of Admissions in the Large Group Market Are Paid Above 150% of Medicare Rates, Excluding Maternity Admissions

Published: Mar 11, 2022

Rising health care prices have led premiums and deductibles for employer-sponsored coverage to grow faster than wages and general inflation, creating affordability challenges for employers and employees. One proposal to address the high prices paid by private insurers is to cap these prices at a multiple of Medicare rates. States, including Montana and Oregon, have adopted this approach for certain providers under their public employee health plan. In Washington state, the public option in the individual market ties payments to a percent of Medicare rates. This brief considers the potential implications for inpatient admissions and spending of applying a price cap to all private insurance hospital payments in the large employer group market.

In this analysis, we look at in-network payment rates for inpatient hospital stays, other than maternity/newborn admissions, among large employer plans relative to Medicare payment rates. To do so, we analyzed data from the 2018 IBM MarketScan Commercial Claims and Encounters Database that includes health claims from a sample of 18 million non-elderly people, representing about 82 million covered lives in large employer plans. Specifically, we examined the share of non-maternity inpatient hospital admissions and associated spending among large employer plans for in-network inpatient admissions paid above various ratios of private-to-Medicare rates. We then focus on 15 common types of admissions (classified using diagnosis related groups, or DRGs), representing more than a quarter of all non-maternity inpatient spending in the large group market (see methods for additional information). This analysis is intended to be illustrative and does not assess potential spillover effects on volume, access, or quality of a policy that caps prices for the privately insured.

Findings

About half of non-maternity inpatient hospital admissions in the large group market would be affected by a cap on prices set to 150% of Medicare rates. Based on our analysis, 52% of inpatient admissions were paid above 150% of Medicare rates, meaning just over half of all admissions would be affected by a cap on payments set at this level. Moving from 150% to 200% of Medicare rates, the share drops to just about one-third of admissions (32%). If the payment rate was capped at 300% of Medicare rates, 13% of admissions would be affected (Figure 1).

A cap set at a multiple of Medicare rates would affect a sizeable amount of inpatient spending in the large group market, even if set at 300% of Medicare rates. Just over one-third of non-maternity inpatient spending in the large group market is for spending associated with the portion of prices above 150% of Medicare rates. In other words, if no admission was paid more than 150% of Medicare, all else equal, spending would be 36% lower. Capping prices at 300% of Medicare rates would affect 13% of spending covered by employer plans (Figure 1).

A Cap Set at a Multiple of Medicare Rates Would Affect a Large Share of In-Network Spending and Admissions

Across 15 common types of admissions, the share of in-network admissions paid above 150% of Medicare varies substantially. For example, among patients covered by large group plans, 71% of admissions for hip and knee joint replacements (DRG 470) are paid more than 150% of Medicare rates, whereas only 15% of admissions for psychosis (DRG 885) are paid above 150% of Medicare rates.

Among these same 15 DRGs, between 3% and 19% of large group plan admissions have payments above 300% of the Medicare rates. For 6 of these 15 DRGs, at least 15% of inpatient stays in the large group market are paid above 300% of Medicare rates (DRG 247, DRG 460, DRG 219, DRG 025, DRG 871 and DRG 853). Figure 2 shows the share of admissions paid within different ranges of multiples of Medicare rates.

In other words, because the distribution of current prices varies widely across DRGS, the choice of where to set a cap would matter more for some types of admissions than others (Figure 2). It would also have different affects across individual hospitals depending on their current prices and distribution of admissions.

Share of In-Network Admissions Paid Above Multiple of Medicare Rates Varies Substantially Across DRGs

The average price for an in-network large group admission would fall more for admissions that currently have higher prices relative to Medicare. To illustrate how a cap set at a percent of Medicare rates might work, we repriced admissions currently paid above each multiple of the Medicare payment rate and recalculated the average price for the DRG in the large employer market. If a cap is set at 200% of Medicare rates, we assumed all large group admissions that are currently paid a at a higher rate would be paid the lower price of 200% of Medicare. For example, for hip and knee replacements, the average price paid by large employer plans would decrease from $30,506 to $25,366. The decrease would be smaller for psychoses under the same scenario, falling from $9,425 to $8,420 (Figure 3). In these illustrative calculations, we made no assumptions about spillover effects on the volume of admissions or prices paid underneath the cap. In practice, volume could increase to compensate for lower average prices with a cap, and the price for admissions below the cap could rise for the same reason.

Average Price of In-Network Admission Would Fall More for Some DRGs Under a Cap Set at 200% of Medicare Rates

Conclusions

High and rising health care costs, driven by high and rising prices, and exacerbated by increasing provider consolidation, are contributing to affordability challenges for people with employer-sponsored coverage. To counteract these effects, some have considered capping prices as a multiple of Medicare rates, following the lead of states, such as Montana, that have adopted this policy for its state employees’ health insurance plan.

Our analysis finds that a cap of 150% of Medicare rates would affect 52% of in-network admissions and 36% of in-network spending, while a cap of 300% of Medicare rates would affect 13% of in-network admissions and 13% of in-network spending, with variation across types of admissions. A lower cap would affect a larger share of admissions than of spending, because at lower levels more admissions are currently paid just above the potential cap. A cap on prices could potentially apply to both in- and out-of-network services, as has been proposed in other contexts. Our analysis examines in-network admissions, which account for the vast majority of spending in the group market. Therefore, our findings are illustrative of the range of admissions that could be affected and would not be substantially different if we included out-of-network admissions.

A cap on prices paid in the group market could be disruptive depending on the level at which the cap is set and the number of services to which it applies. At the same time, if a cap achieved meaningful savings, it could make health care more affordable - tradeoffs that warrant careful attention. In our analysis, we do not attempt to model any changes that may follow from a cap on prices, such as an increase in volume or an increase in prices for admissions that are below the cap. However, in Montana, capping prices at a multiple of Medicare rates resulted in net savings and utilization did not increase. There could also be effects on networks. In Washington state, some hospitals are not participating in the network for the public option in the individual market because the cap on prices of 160% of Medicare is too low. While it is unlikely that hospitals could forgo the large group market entirely, it is possible that some hospitals would choose to contract with fewer plans, creating access concerns.

While this analysis does not consider the potential impact on quality, it is possible that some high-priced inpatient admissions are of high quality and restricting prices could have a negative impact in those cases. There is some evidence this may be the case in unconcentrated (more competitive) markets. Additionally, a recent report by the Congressional Budget Office notes a correlation between prices and quality, though states there is not evidence of causality and it is not clear whether higher prices lead to higher quality or vice versa.

Capping the prices employer-sponsored plans pay for inpatient admissions would likely reduce hospital revenue. The magnitude of the impact would depend on the level of the cap, and whether volume changed in response. While affected providers could respond by operating more efficiently, it is also possible that decreases in revenue could lead to lower pay for hospital staff, fewer capital investments, and efforts to shift admissions away from payers who pay lower prices. These changes could be especially unpalatable during the ongoing COVID-19 pandemic, which has prompted billions of dollars in federal funding to help support and stabilize hospital finances.

This work was supported in part by Arnold Ventures. We value our funders. KFF maintains full editorial control over all of its policy analysis, polling, and journalism activities.

Methods

To calculate private insurance payment rates, we analyzed a sample of medical claims obtained from the 2018 IBM Health Analytics MarketScan Commercial Claims and Encounters Database. We only included claims for people under the age of 65. This analysis used claims for 18 million people representing about 22% of the 82 million people in the large group market in 2018. Weights were applied to match counts in the Current Population Survey for enrollees at firms of a thousand or more workers by sex, age, and state. Weights were trimmed at eight times the interquartile range. We exclude admissions accounting for 12% of total spending in Marketscan, namely DRGs related to childbirth. When selecting common DRGs, we did not include DRGS with fewer than 800 observations, regardless of the amount of spending attributed to those cases.

Averages represent the amounts paid to the hospitals for an admission. Across all the DRGs, hospital spending represented about 87% of the total cost of the admission. Costs include both amounts paid by enrollees in the form of cost sharing and spending by the plan. Hospital costs are trimmed to exclude the highest 0.5% of hospital costs within a DRG and admissions below 5% of the median. This is intended to exclude admissions in which the claims do not capture all the spending on the admission. These data reflect cost sharing incurred under the benefit plan, but do not include balance-billing payments that beneficiaries may make to health care providers for out-of-network services delivered during the admission or out-of-pocket payments for non-covered services. Only admissions with in-network room and board charges are included. Limiting to in-network admissions does not qualitatively affect our findings. In-network spending is about 90% of total spending after trimming outliers.

To calculate Medicare payment rates, we analyzed average payments to hospitals for admissions identified through the DRG, as reported in Inpatient Charge Data FY 2018. According to CMS documentation, the DRG reimbursements are "the average total payments to all providers for the DRG including the MS-DRG amount, teaching, disproportionate share, capital, and outlier payments for all cases. Also included in average total payments are co-payment and deductible amounts that the patient is responsible for and any additional payments by third parties for coordination of benefits." These files are prepared by the Centers for Medicare and Medicaid Services (CMS) using Medicare Provider Analysis and Review (MEDPAR) data.  For more information see: https://www.cms.gov/Research-Statistics-Data-and-Systems/Statistics-Trends-and-Reports/Medicare-Provider-Charge-Data/Downloads/Inpatient_Methodology.pdf.

IBM assigns a DRG to each admission using the Centers for Medicare & Medicaid Services (CMS) Grouper 37. This method selects a DRG for the admission based on the diagnosis and procedures a patient received during the case. The total payments to hospitals in the Marketscan data reflect the payments made to the hospitals. Some variation in the payment rates of admissions is accounted for by differences in the intensity or types of services that a patient receives, and not differences in the rates paid for those services. The rates Medicare uses to reimburse DRGs are designed to account for this variation in the intensity of cases and services. This analysis compares the average of DRG payment rates in Medicare to admissions in Marketscan. CMS suppresses DRGs with low counts; in order to use the most DRGs, we use national averages rather than the price in particular States or MSAs. Therefore, this analysis does not account for regional variation in Medicare reimbursement.

In Medicare, hospital admissions are reimbursed based on DRGs that reflects a patient’s clinical conditions and treatment. In contrast, private insurers pay for hospital admissions using different approaches that may vary with the procedures performed during the stay, including per diem payments, discounted fee-for-service payments, DRGs or other combinations of payments and performance incentives. Therefore, the variation in payment within DRG among large group plans, may reflect both variation in the intensity of services and the length of stay, as well as the prices being paid for those services.

News Release

1 in 10 Adults Owe Medical Debt, With Millions Owing More Than $10,000

Black Adults, Those in Poor Health, and People Living with Disabilities are Most Likely to Carry Significant Medical Debt

Published: Mar 10, 2022

Americans Likely Owe Hundreds of Billions of Dollars in Total Medical Debt

A new KFF analysis of government data estimates that nearly 1 in 10 adults (9%) – or roughly 23 million people – owe medical debt. This includes 11 million who owe more than $2,000 and 3 million people who owe more than $10,000.

The analysis is based on data from the 2020 Survey of Income and Program Participation, a nationally representative survey that asks every adult in a household whether they owed money for medical bills in 2019 and how much they owe. It looks at people with medical debt of more than $250.

The 2020 survey suggests Americans’ collective medical debt totaled at least $195 billion in 2019, though with quite a bit of uncertainty. A small share of adults account for a huge share of the total, with considerable variation from year to year. The estimate is significantly higher than other commonly cited estimates, which generally rely on data from credit reports that may not capture medical debts charged to credit cards or included in other debts rather than being directly owed to a provider.

Other findings include:

  • People ages 35-49 (11%) and 50-64 (12%) are more likely than other adults to report medical debt. They have greater health needs than younger people on average and aren’t yet old enough to qualify for Medicare coverage, which may protect them from high costs.
  • Larger shares of people in poor health (21%) and living with a disability (15%) report medical debt. People in these groups are more likely to need and receive care than people in better health and without disabilities.
  • Among racial and ethnic groups, a larger share of Black adults (16%) report having medical debt compared to White (9%), Hispanic (9%), and Asian American (4%) adults.
  • Adults who were uninsured for more than half of the year are more likely to report medical debt (13%) than those who were insured for all or most of the year (9%).

It’s not yet clear how the pandemic and resulting recession affected medical debt. Many people lost jobs and income early in the pandemic, which could have led to more difficulty affording medical care. At the same time, many people delayed or went without care, so fewer people may have been exposed to costly medical care. Shifts in insurance coverage and COVID-related cost-sharing waivers could also affect what people had to pay out-of-pocket.

Two related KFF analyses look at other challenges related to health costs:

The first finds that many households do not have enough money available to cover the cost of a typical deductible in a private health plan. For example, about a third (32%) of single-person households with private insurance in 2019 could not pay a $2,000 bill, and half (51%) could not pay a $6,000 bill.

The second finds that lower-income families (less than twice the federal poverty level) who have employer health coverage spend a tenth of their income on health care on average, including both their share of the premium and their out-of-pocket costs.

The new analyses are available through the KFF-Peterson Health System Tracker, an online information hub that monitors and assesses the performance of the U.S. health system.