Poll Finding

KFF COVID-19 Vaccine Monitor: Views On The Pandemic At Two Years

Published: Apr 6, 2022

Findings

The KFF COVID-19 Vaccine Monitor is an ongoing research project tracking the public’s attitudes and experiences with COVID-19 vaccinations. Using a combination of surveys and qualitative research, this project tracks the dynamic nature of public opinion as vaccine development and distribution unfold, including vaccine confidence and acceptance, information needs, trusted messengers and messages, as well as the public’s experiences with vaccination.

Key Findings:

  • With pandemic-related restrictions being lifted in many states as well as local areas and remaining mask mandates set to expire soon, most of the public (59%) say they have personally returned to doing some of their pre-pandemic activities, but not all, or say they are still doing very few of the activities they were doing before the pandemic. Two years into the pandemic, about a quarter of adults say they have basically returned to normal while one in seven say they never changed their activity level during the pandemic.
  • With people returning to some pre-pandemic activities, majorities still report wearing masks in public indoor areas. Eight in ten adults say they’ve worn a mask in public indoors at least some of the time in the last 30 days. Similarly, most say people should continue to wear masks in some public places to minimize the spread of COVID-19 and avoid another surge in cases (59%) while four in ten say people should stop wearing masks in public so things can get back to normal. Views of the federal mask mandate on airplanes and public transit are divided, with half of the public wanting the mandate extended and half wanting it to expire.
  • Larger shares of Democrats and vaccinated adults report they’ve been wearing masks and want others to continue doing so, while most Republicans and unvaccinated adults are eager to return to normal and lift mask mandates. Further, compared to their counterparts, Black adults, Hispanic adults, and those with lower incomes are less likely to say they’ve returned to normal, more likely to say they’re wearing masks frequently, and much more likely to say people should continue to wear masks to minimize the spread of the virus and prevent another surge. With Black and Hispanic adults and those with lower-incomes more likely to work in jobs that are highly impacted by COVID-19, the survey finds that they’re more likely to show concerns over reopening and unmasking measures.
  • The pandemic has taken a heavy toll on adults and children over the last two years with many reporting difficulties balancing their child’s education and their work, household finances, and mental or physical health. Six in ten parents say the pandemic has negatively affected their children’s schooling and over half saying the same about their children’s mental health. In addition, half of adults overall say their own personal mental health has been negatively affected, and four in ten say the same about their physical health and their financial situation. Those with lower incomes are more likely to report a negative impact on their finances, while young adults are more likely than older adults to say the pandemic had a negative impact on their mental and physical health as well as their employment situation.
  • Asked to say in their own words what has been the biggest challenge and/or any positive change brought about by the pandemic over the past two years, the top responses on both the negative and positive side related to human interactions and relationships or lack thereof. On the negative side, 27% say the hardest thing has been isolation and not seeing people. When asked if anything has changed for the better because of the pandemic, 24% say they’re closer to their family or spent more time with their families.

How Ready Is The Public To Return To “Normal” And Who Is More Hesitant About Lifting Mask Restrictions?

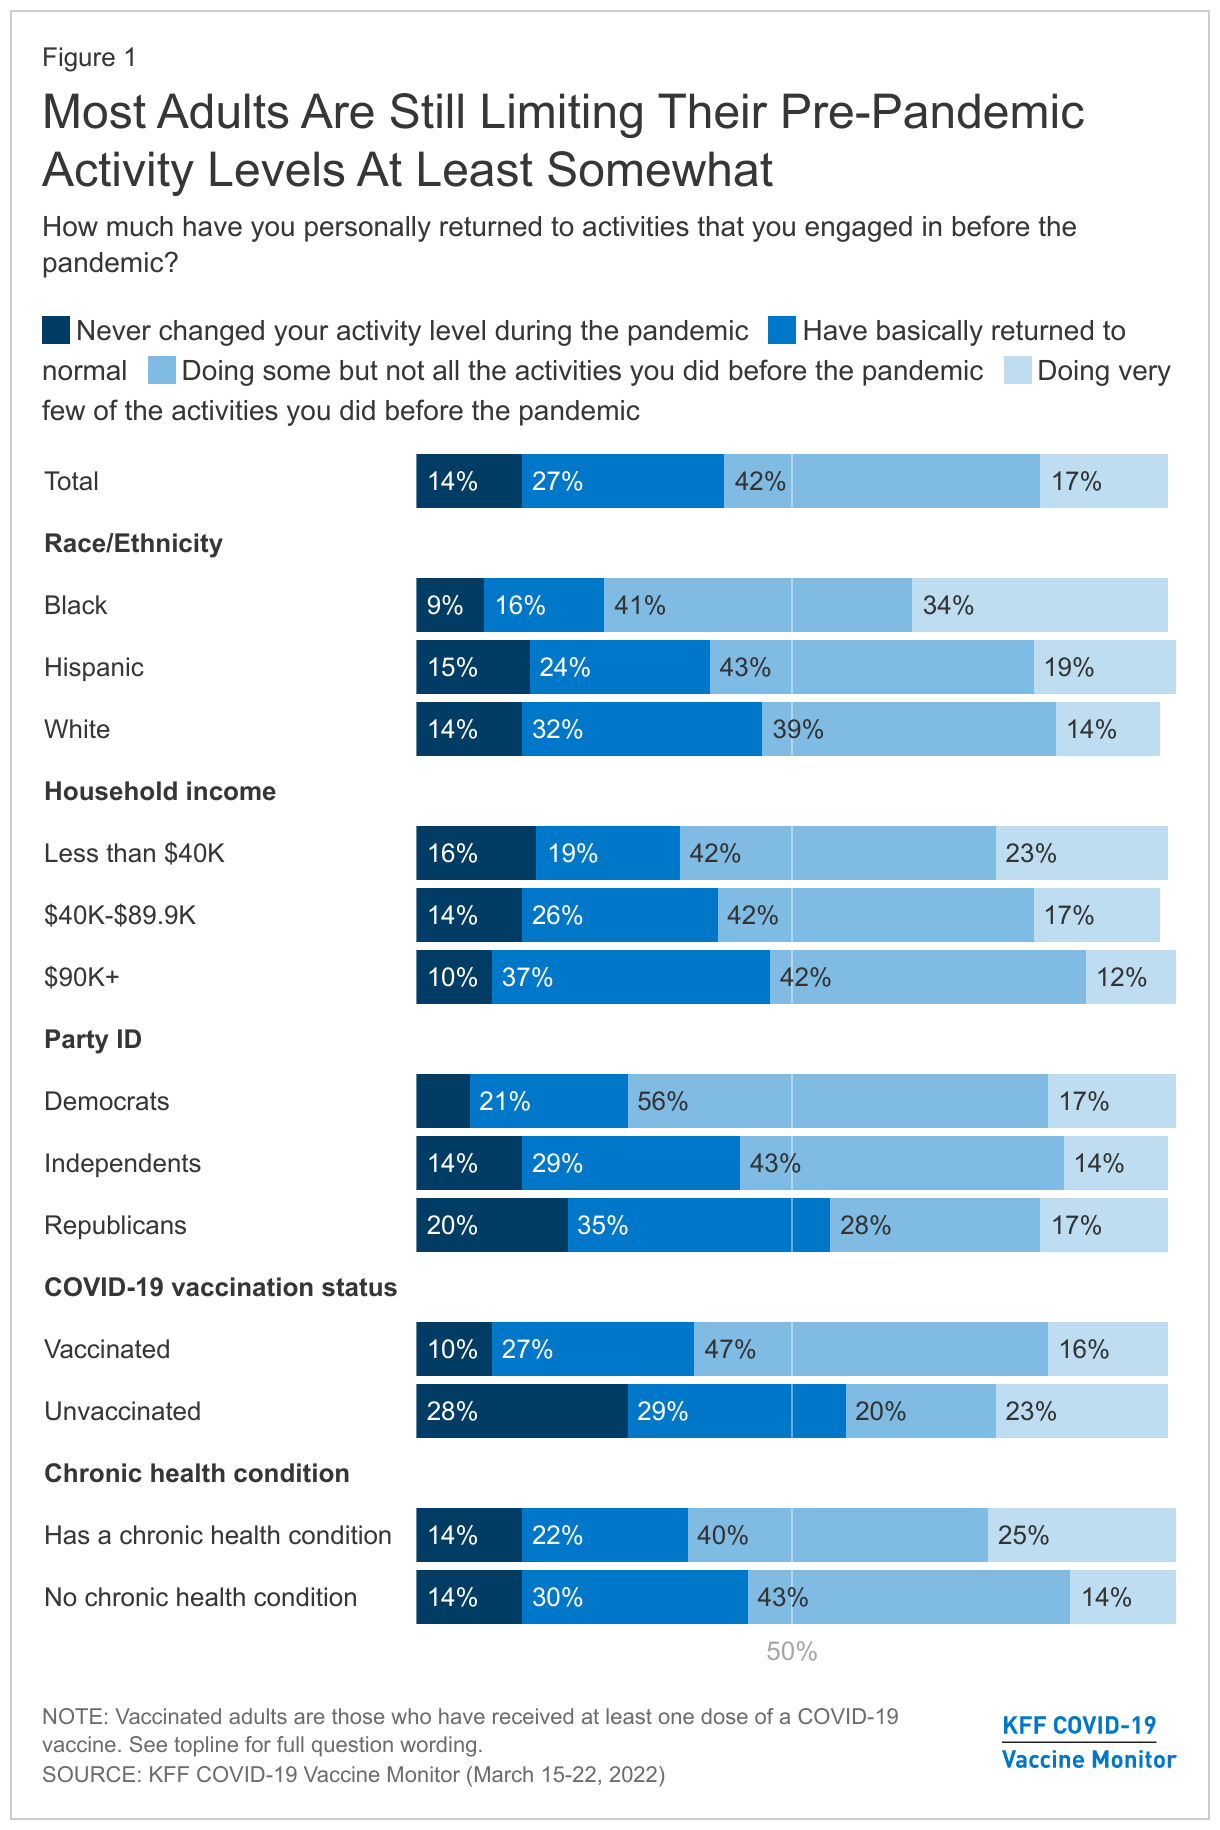
The latest analysis from a KFF COVID-19 Vaccine Monitor survey1  finds that as the omicron surge recedes, a majority of adults say they are limiting their activity levels from pre-pandemic at least somewhat in order to protect themselves from COVID, with 42% who are doing some but not all the activities they did before the pandemic and 17% who are doing very few of the activities they did before COVID-19. Around four in ten adults say they have basically returned to normal in terms of activities that they engaged in before the pandemic (27%) or that they never changed their activity level to begin with (14%).

Unvaccinated adults (57%), Republicans (55%), and White adults (47%) are the groups most likely to say they never changed activity levels or have basically returned to normal. Nearly half of those with household incomes of $90,000 or more say the same. Black adults (34%), those with a chronic condition that puts them at higher risk for COVID-19 (25%), and those living in households with incomes less than $40,000 (23%) are the most likely to say they are doing very few of the activities they did before the pandemic.

Most Adults Are Still Limiting Their Pre-Pandemic Activity Levels At Least Somewhat

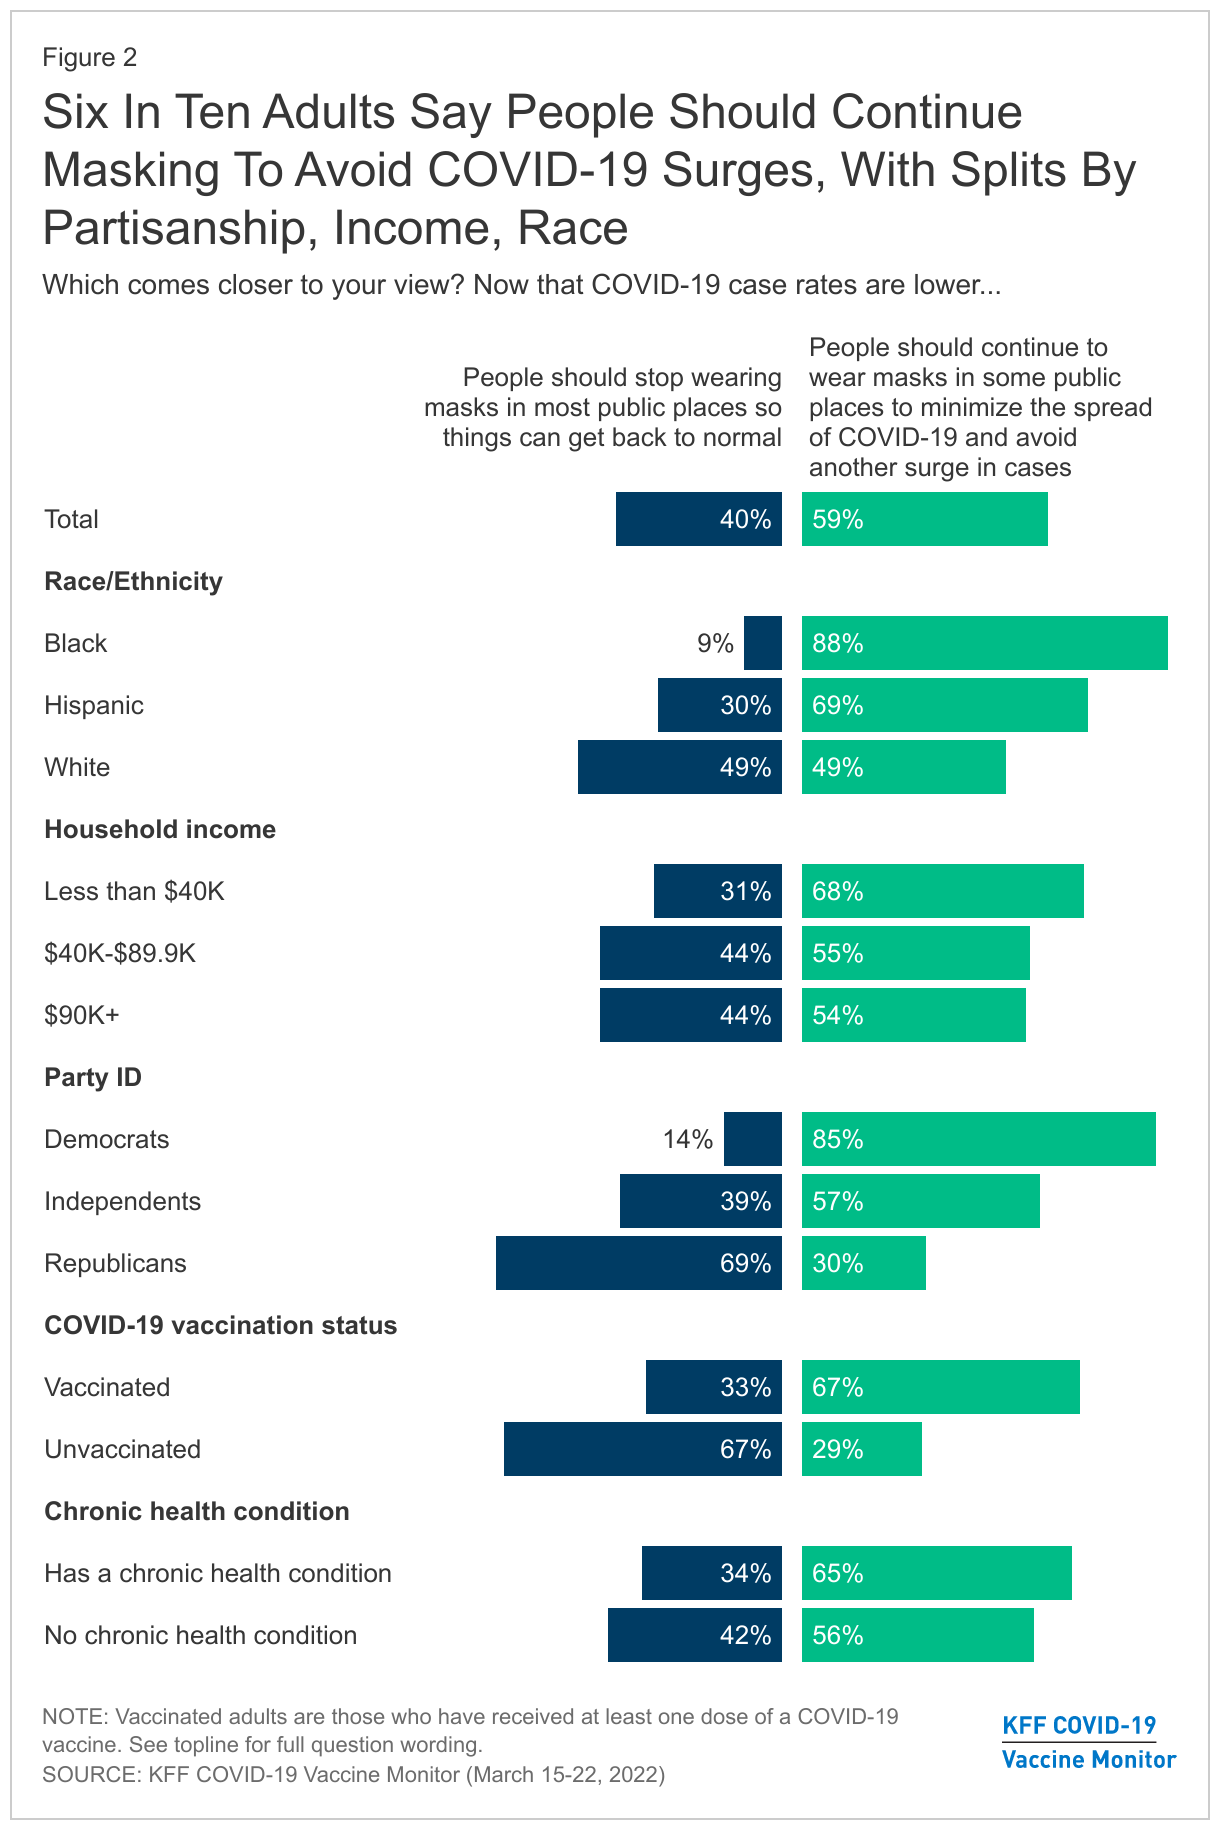
About six in ten adults (59%) say that now that COVID-19 case rates are lower, people should continue to wear masks in some public places to minimize the spread and avoid another surge in cases, while four in ten say that people should stop wearing masks in most public places so things can go back to normal. There are significant divides not only by partisanship, and vaccination status, but also by race, ethnicity, and income.

Eight-five percent of Democrats say that people should continue to wear masks, as do 57% of independents and 67% of vaccinated adults. Around seven in ten Republicans (69%) say that people should stop wearing masks so that things can return to normal, as do 67% of unvaccinated adults.

While White adults are split (49% say people should stop wearing masks, 49% say they should continue to wear them in some public places), large majorities of Black adults (88%) and Hispanic adults (69%) say that people should continue to wear masks in some public places to minimize the spread of COVID-19. Around two-thirds of those with a household income of less than $40,000 a year (68%) say the same, compared to 55% of those with an income between $40,000-$89,900 and 54% of those with an income of $90,000 or more. This finding that people of color are more likely to support continued mask wearing may reflect larger shares of Black and Hispanic adults being employed in service industries compared to White adults, putting them at an increased risk of exposure to COVID-19.

This finding is consistent with previous Vaccine Monitor surveys, which found Black and Hispanic adults were more likely to be worried that they personally will contract COVID-19, as well as be worried that someone in their family or their child will get sick. Black and Hispanic adults, as well as those with lower incomes were also more likely to say they don’t get paid time off if they get COVID-19.

Six In Ten Adults Say People Should Continue Masking To Avoid COVID-19 Surges, With Splits By Partisanship, Income, Race

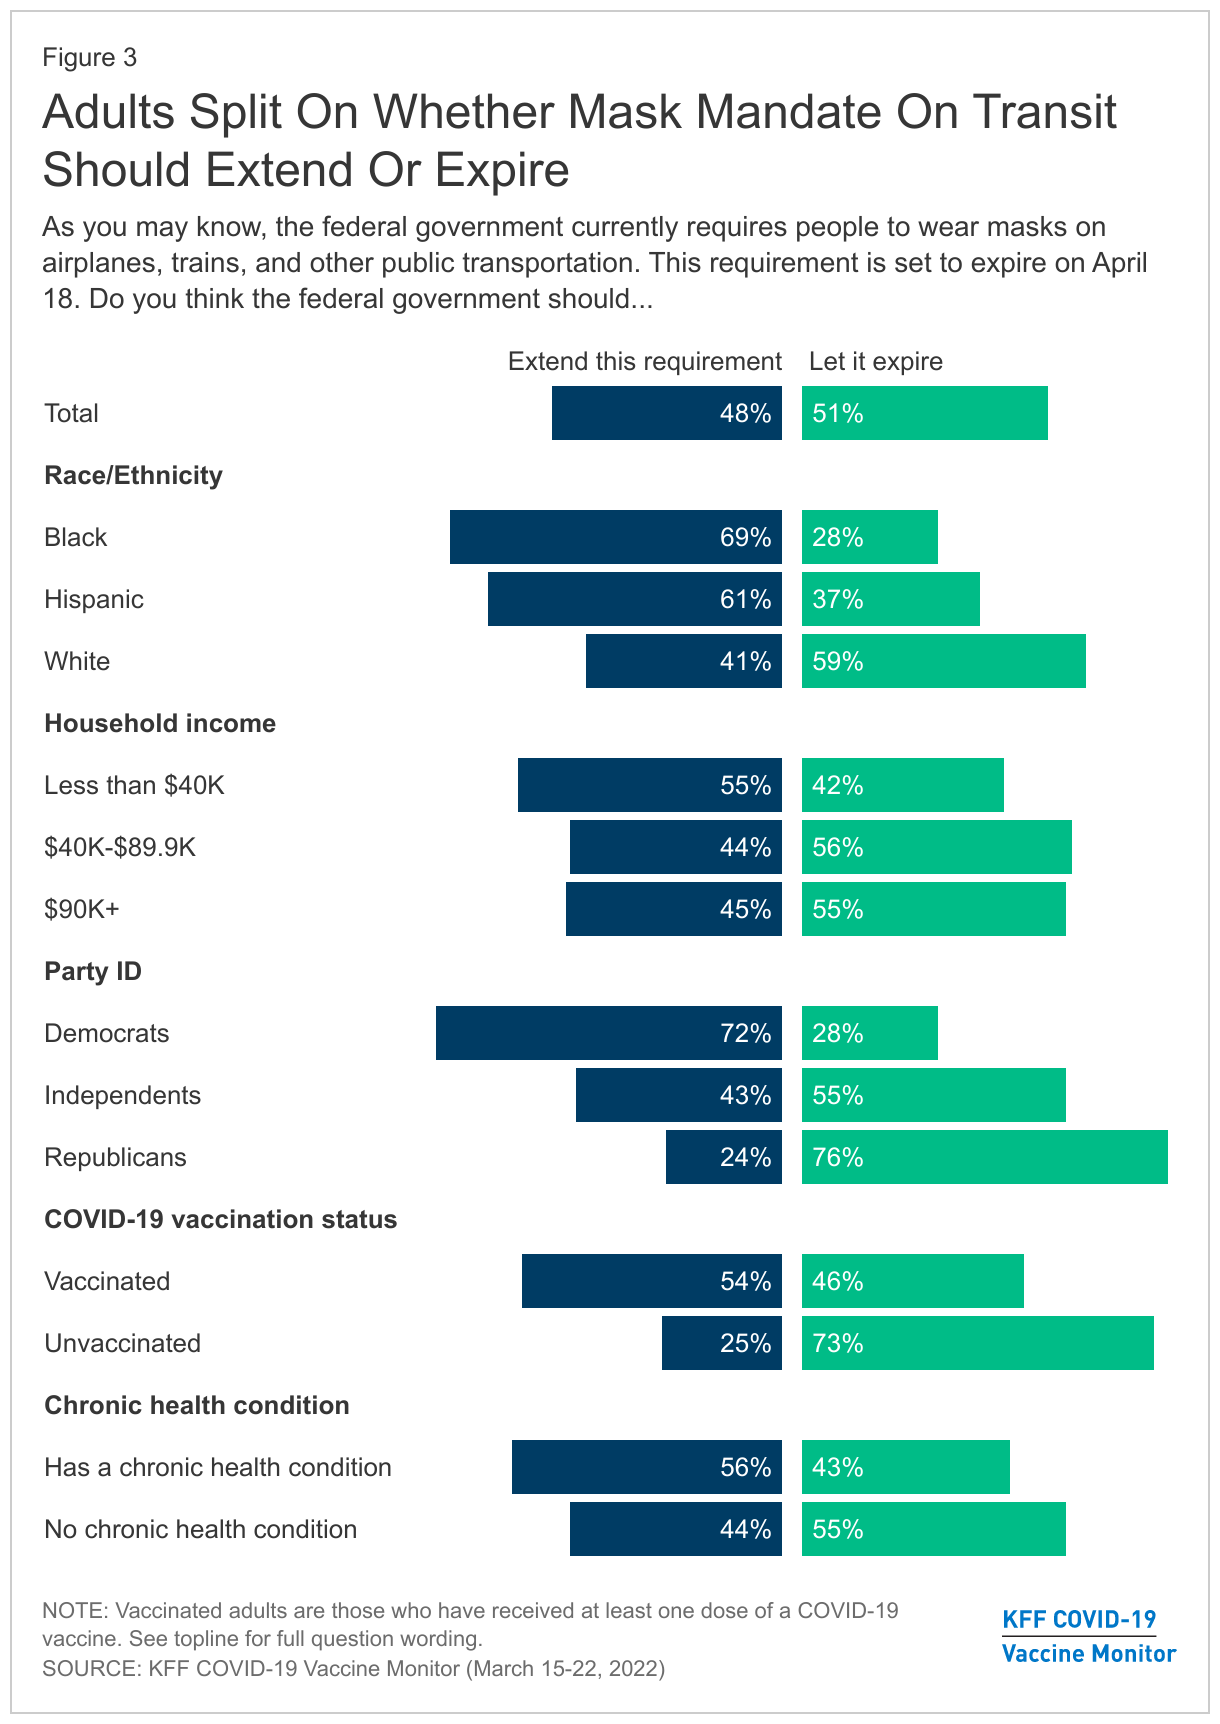
On the more specific question of mandating masks on public transportation, the public is more evenly divided. The federal government currently requires people to wear masks on airplanes, trains, and other public transportation. With this requirement set to expire on April 18, adults are split on whether the federal government should let the requirement expire (51%) or extend the requirement (48%).

Majorities of Democrats (72%) and vaccinated adults (54%) support extending the masking requirement on transportation. By contrast, three-quarters of Republicans (76%) and unvaccinated adults (73%), and over half of independents (55%) would prefer to let the requirement expire on April 18.

However, preferences for this federal mandate extend beyond partisanship and vaccination status, with lower income adults and people of color voicing support for keeping the requirement after April 18. At least six in ten of Black (69%) and Hispanic adults (61%) say the federal government should extend the requirement, compared to 41% of White adults. Over half of adults with lower incomes (55%) want to extend the masking requirement, compared to 44% of those with a household income of between $40,000-$89,900, and 45% of those with an income of $90,000 or more. Similar to views of general masking, this divide by racial and ethnic groups as well as income groups may reflect those most likely to be working in areas where they would be exposed to COVID-19 without mask mandates.

Those with chronic conditions are also more likely to support extending the federal mask mandate on transportation (56%), while more than half (55%) of those without chronic conditions want to let the mandate expire.

Adults Split On Whether Mask Mandate On Transit Should Extend Or Expire

current MASK USAGE

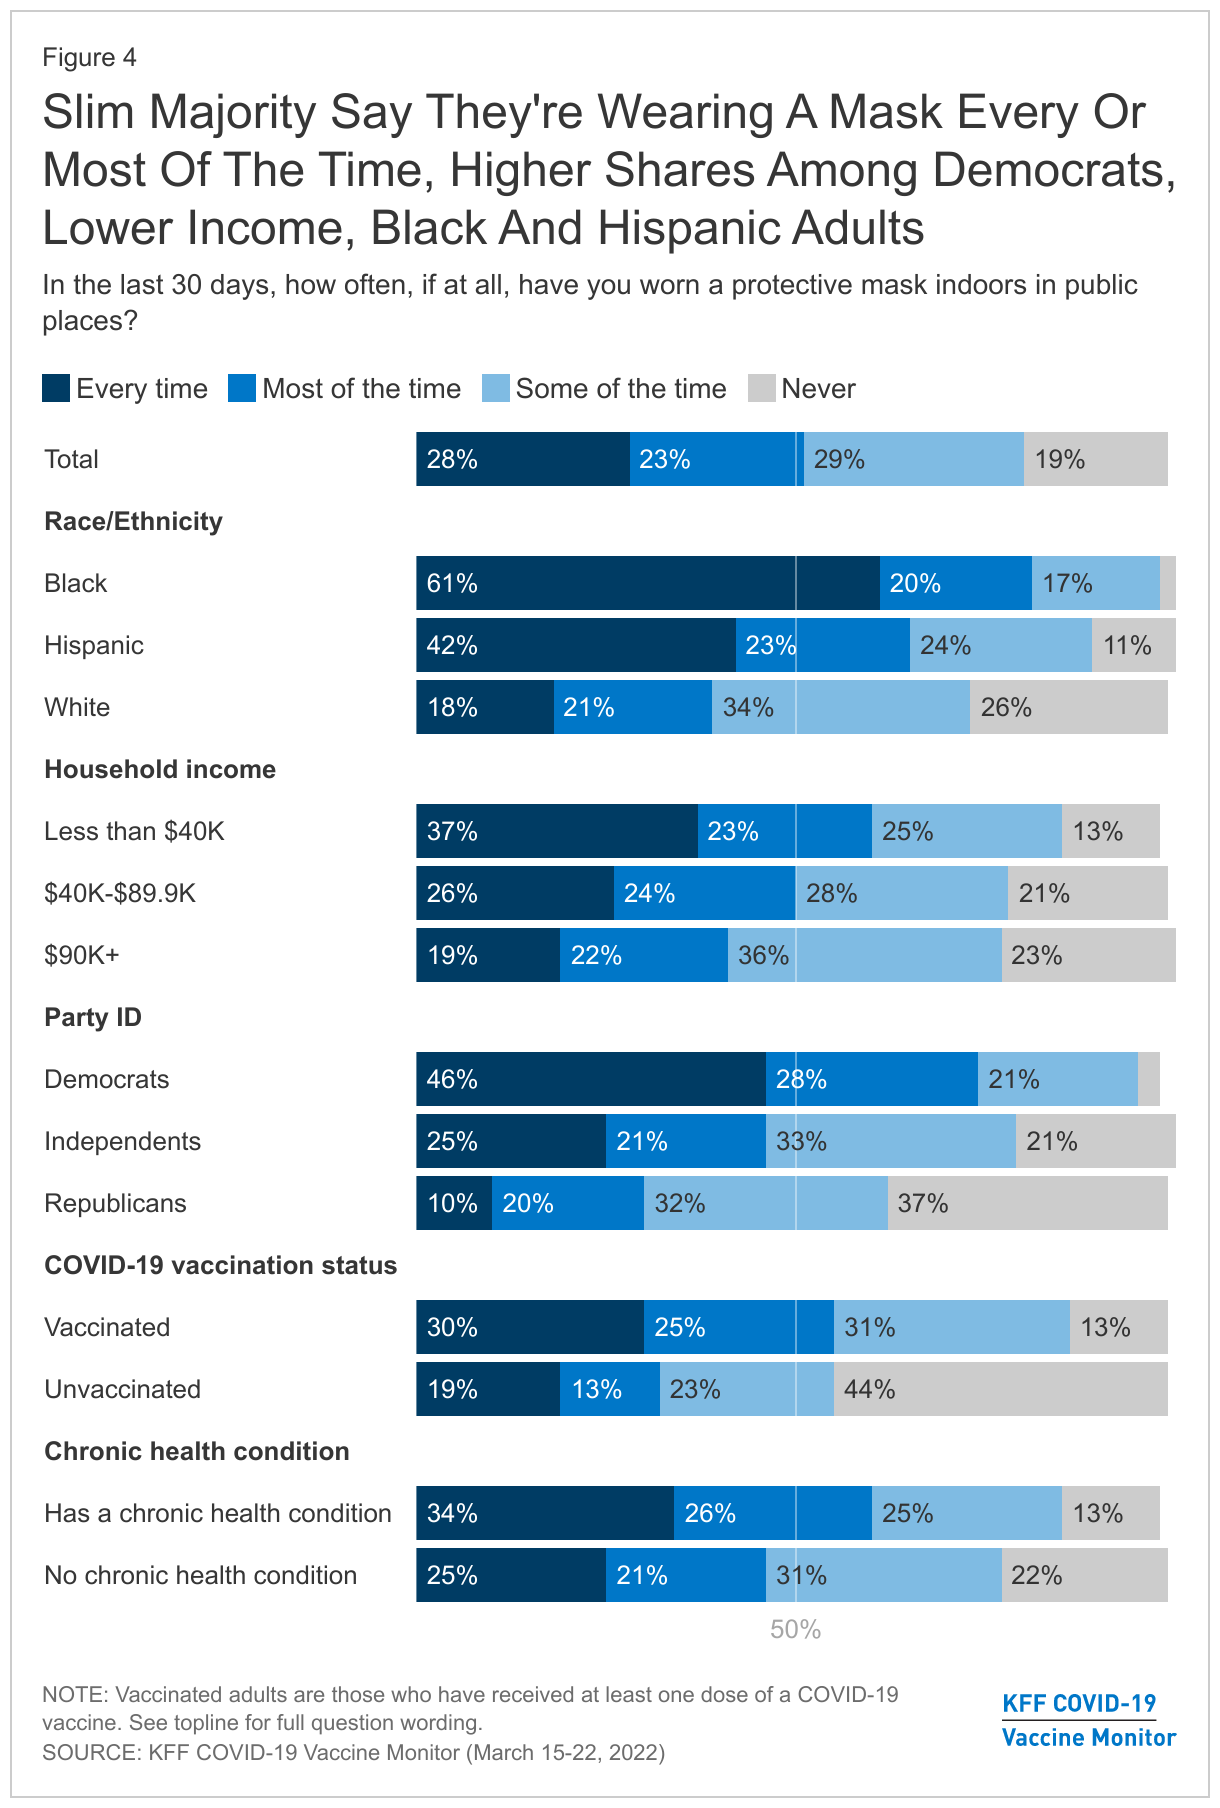
Most adults report continuing to wear a mask at least sometimes in public places. Around half of adults (51%) say that in the past 30 days they wore a mask every time or most of the time when indoors in public places, including 28% who say they wore one every time. Another 29% say they wore a mask some of the time, and 19% say they never wore a mask indoors in public places.

In line with attitudes about mask requirements on transportation, Democrats are more likely to say they always or mostly wore a mask indoors in the past 30 days (75%), compared to independents (46%) and Republicans (30%).

Two-thirds of unvaccinated adults say they have been wearing a mask some of the time or never have worn a mask indoors in the past 30 days (67%), while one-third (32%) report wearing one every or most of the time. A majority of vaccinated adults say they wore a mask every or most of the time (56%).

Showing differences by race and ethnicity, twice the share of Black adults compared to White adults report wearing a mask always or most of the time in the past 30 days (80% vs. 39%). Around two-thirds of Hispanic adults say the same (65%).

Slim Majority Say They're Wearing A Mask Every Or Most Of The Time, Higher Shares Among Democrats, Lower Income, Black And Hispanic Adults

The Pandemic’s Toll On Families Two Years In

IMPACTs ON MENTAL, PHYSICAL, and FINANCIAL HEALTH

The survey finds the pandemic has taken a heavy toll on adults and children over the last two years.  Whether it comes to their education, work, finances, mental or physical health, many – regardless of race, ethnicity and income – report feeling the negative effects of the pandemic.

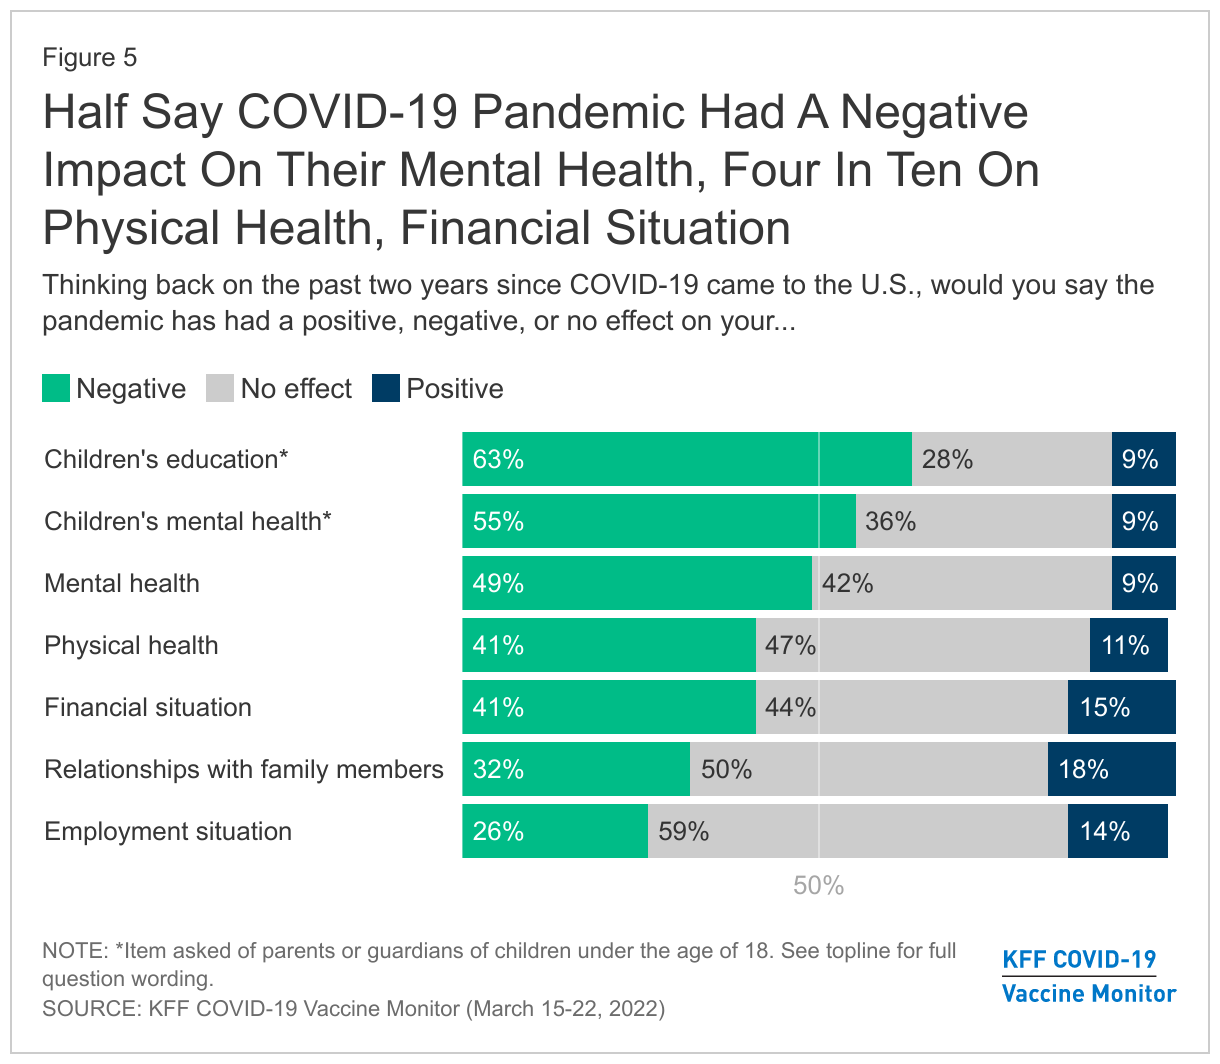
The most common negative effects of the pandemic, as reported by parents, are about their children’s education and mental health. Almost two-thirds of parents say that the pandemic has negatively affected their children’s education (63%), with 28% saying it had no effect, and 9% who report it had a positive effect. Moreover, over half (55%) of parents say the pandemic has had a negative impact on their children’s mental health, compared to 36% who say it made no difference, and 9% saying it had a positive effect.

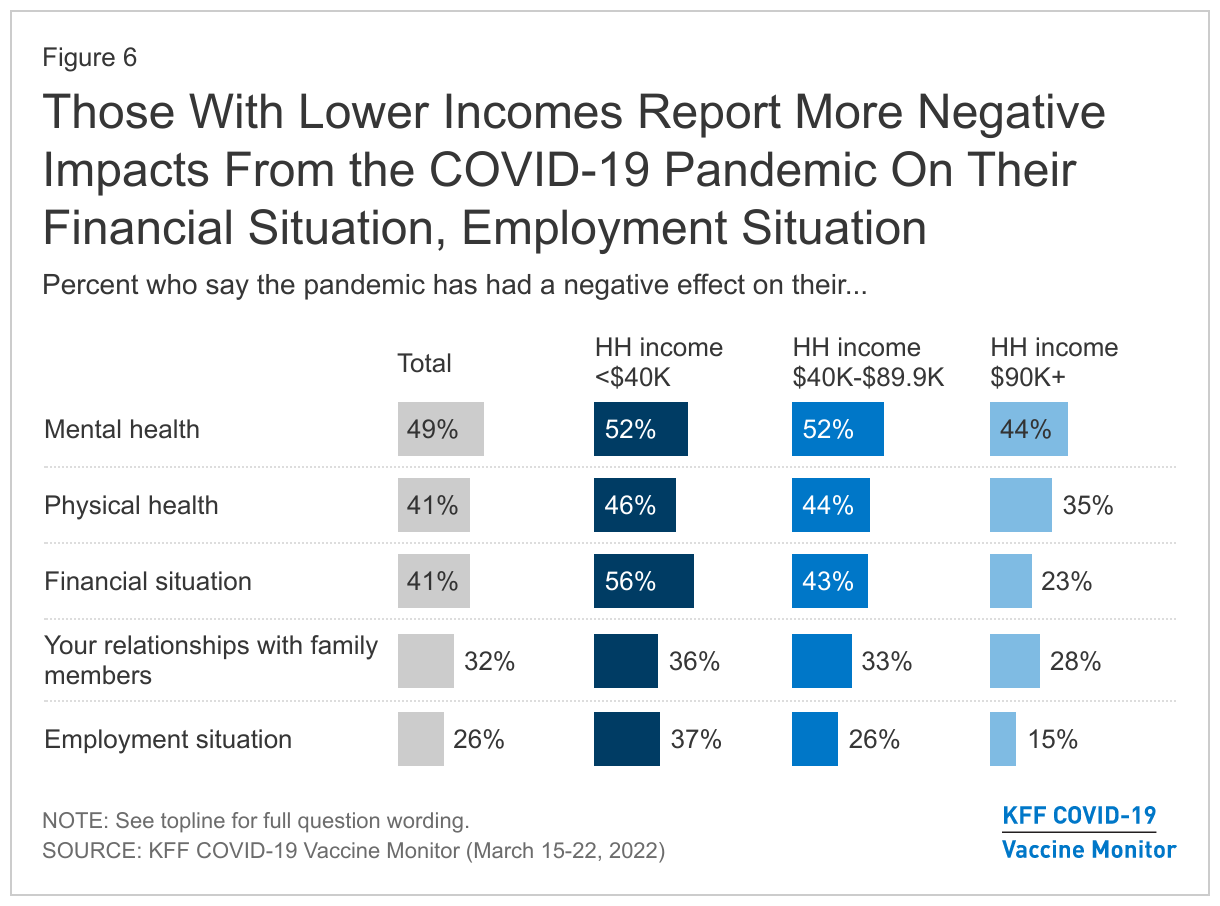
Among all adults, half say the pandemic has had a negative effect on their personal mental health (49%), and 41% say it has had a negative impact on their physical health. Few say it has had a positive effect on either their physical (11%) or mental health (9%).

About four in ten adults say the pandemic had a negative impact on their financial situation (41%) while a similar share report it had no impact (44%), with 15% who say it had a positive impact. One-quarter of adults say the pandemic has had a negative impact on their employment situation (26%), with 59% who report it has not had an impact.

Results are more mixed when it comes to the pandemic’s effect on family relationships. Around a third say the pandemic has had a negative impact on their relationships with family members (32%) while 18% say it has had a positive impact. Half say it has not had any impact one way or another.

Half Say COVID-19 Pandemic Had A Negative Impact On Their Mental Health, Four In Ten On Physical Health, Financial Situation

Adults in households with lower incomes report being harder hit by the pandemic, especially when it comes to financial and employment impacts. Adults with a household income of less than $40,000 a year are more likely to say the pandemic has had a negative impact on their financial situation (56%), compared to 43% of those with an income of between $40,000 and $90,000 and 23% of those with a household income of $90,000 or more a year.

In addition,  the share of those with lower incomes who say the pandemic had a negative impact on their employment situation (37%) is more than twice the share of  those with annual incomes greater than $90,000 (15%).

Those With Lower Incomes Report More Negative Impacts From the COVID-19 Pandemic On Their Financial Situation, Employment Situation

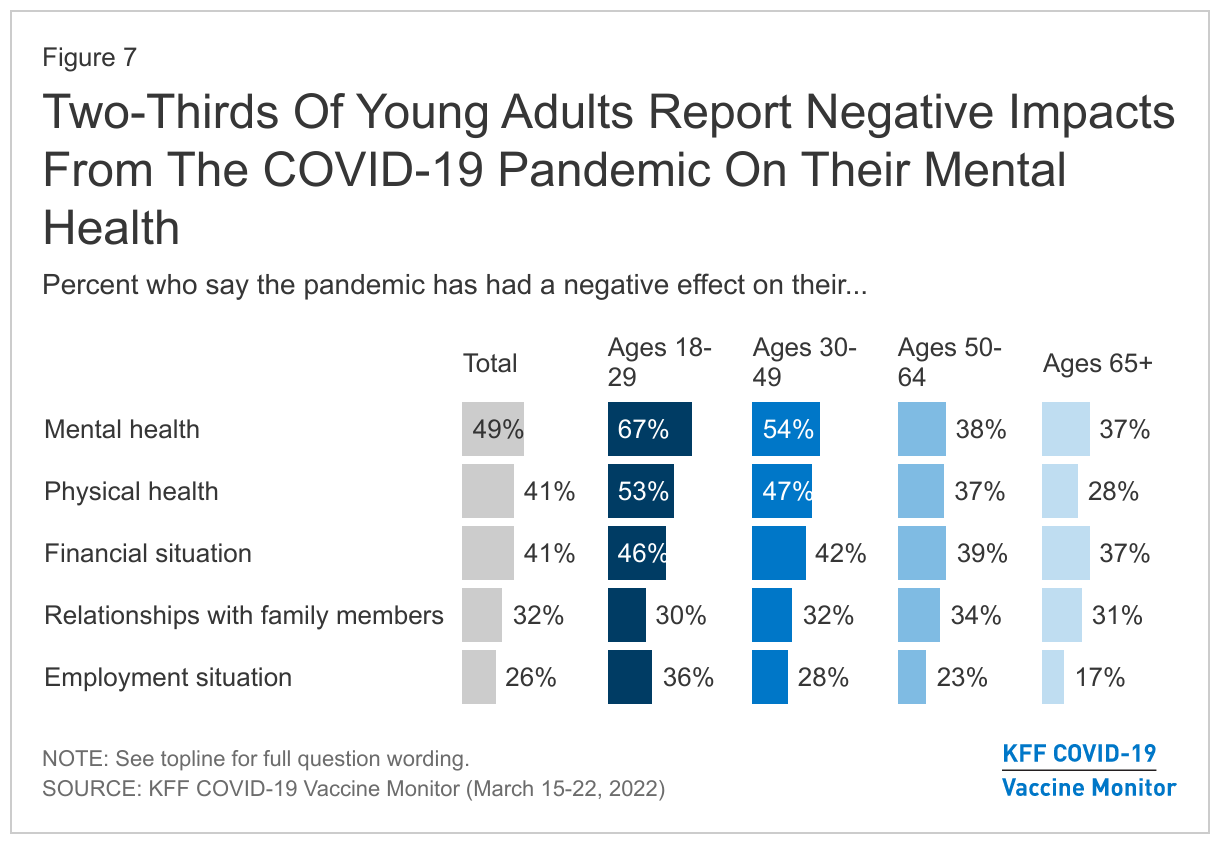
Younger people also report disproportionate effects from the COVID-19 pandemic, especially when it comes to their mental and physical health. Two-thirds of young adults aged 18-29 (67%) report that the pandemic has had a negative impact on their mental health, compared to just over half of 30-49 year-olds (54%), and under four in ten 50-64 year-olds (38%) and those over the age of 65 (37%).

Young adults are also more likely to report difficulties with their physical health due to the pandemic, with 53% of those under 30 reporting a negative impact, 47% of those 30-49, 37% of those 50-64, and 28% of those over the age of 65. In addition, larger shares of young adults report negative effects on their employment situation (36%) compared to older adults, including those ages 50-64 (23%) and those 65 and older (17%).

Two-Thirds Of Young Adults Report Negative Impacts From The COVID-19 Pandemic On Their Mental Health

PANDEMIC IMPACTS: IN THEIR OWN WORDS

In their own words, when asked about the biggest challenge and/or positive change brought about by the pandemic over the past two years, the top responses regarding both negative and positive effects were related to human interactions and relationships, or the lack thereof.

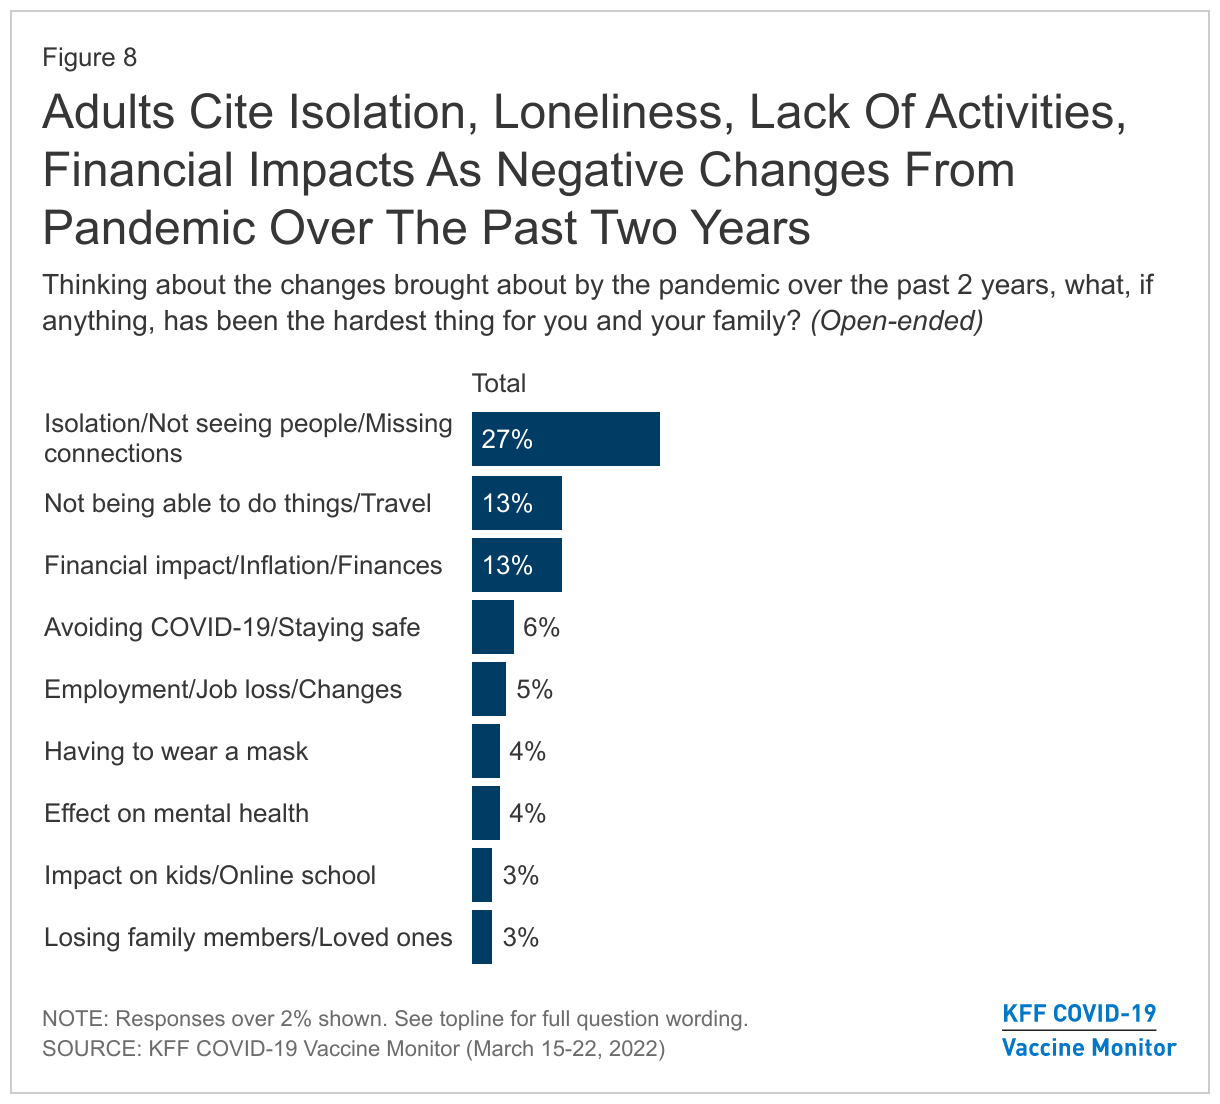
When asked about changes that have been brought about by the pandemic over the past two years, 27% say the hardest thing has been isolation and not seeing people. Another 13% say they have struggled with not being able to do things or travel, and 13% cite the financial impact, including inflation.

Some say the hardest part has been avoiding COVID-19 and staying safe (6%), employment changes and job loss (5%), having to wear a mask (4%), the effect on mental health (4%), the impact on kids and online schooling (3%), and losing family members and loved ones (3%).

Adults Cite Isolation, Loneliness, Lack Of Activities, Financial Impacts As Negative Changes From Pandemic Over The Past Two Years

In their own words: Thinking about the changes brought about by the pandemic over the past two years, what, if anything, has been the hardest thing for you and your family?

Being evicted and still not recovered financially.” – 43 year old, male, White, Democrat, South Carolina

“Not allowed to be with my wife when she was hospitalized with stage 4 cancer.” – 65 year old, male, White, Republican, Arkansas

“Finances, health, loss of family members, being hospitalized, lasting effects. My family's going through things because of the whole COVID thing. Their finances are going down and they're struggling; I had to leave my apartment - everything was chaotic.” – 31 year old, female, White, Independent, Tennessee

“Concern over preexisting conditions.” – 24 year old, female, Asian, Democrat, Illinois

“Deal with all mandates and restrictions.” – 30 year old, male, Hispanic, independent, Indiana

“Just the online schooling, I had to quit work to stay at home.” – 31 year old, female, White, Democrat, Ohio

“Division over what's real or not and what we should follow.” – 25 year old, male, Hispanic, Republican, Florida

“Having to wear masks everywhere, it’s terrible.” – 24 year old, male, White, Independent, Michigan

“Inability to visit elderly parents.” – 63 year old, male, White, Independent, Florida

“Getting clear information about it and how best to manage through the maze of many, many authorities giving advice about Covid.” – 90 year old, female, Black, Democrat, New York

“Mask mandates and business closures, especially as a truck driver.” – 58 year old, male, White, independent, South Dakota

“Medical debt, inability to work from disabilities exacerbated or initiated by covid.” – 31 year old, other, White, independent, Oregon

“Loss of non-family social relationships.” – 22 year old, female, White, Democrat, New York

“Mental health got a lot worse due to distancing people from each other.” – 38 year old, male, White, independent, Illinois

“The grief of people dying.” – 39 year old, female, White, independent, Texas

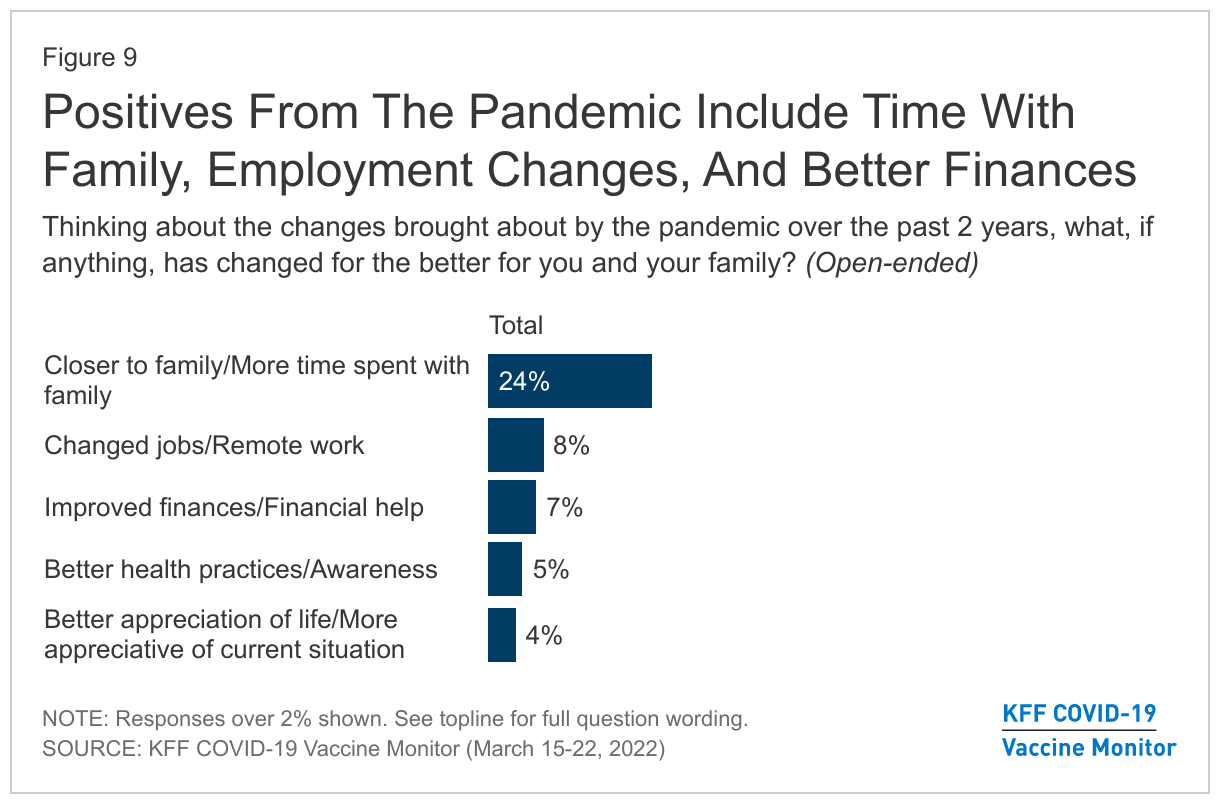
When asked if anything has changed for the better in the last two years, 24% say they are closer to their family or have spent more time with their families. Some (8%) also say that job changes or remote work were a positive change, 7% cited improvements in their financial situation, 5% said they had better health practices or awareness, and 4% cited a general appreciation of life or their current situation. A third of respondents said nothing changed for the better.

Positives From The Pandemic Include Time With Family, Employment Changes, And Better Finances

In their own words: Thinking about the changes brought about by the pandemic over the past two years, what, if anything, has changed for the better for you and your family?

Being able to use telehealth communications for doctors and by doing a lot of things by phone and email now, very convenient for families.” – 25 year old, female, White, independent, Kentucky

“Closer bonding with family and more stability with work life.” – 30 year old, male, Asian, independent, Texas

“Eating more prepared meals from home and saving money.” – 66 year old, female, White, Republican, Illinois

“Better handwashing and wearing a mask has helped with overall health.” – 66 year old, male, White, Democrat, California

“Gives me a good excuse to get out of dinner with in-laws.” – 37 year old, other, Hispanic, independent, Pennsylvania

“It helped cherish the moments you have with each other and to be less wasteful. Realize that habits/behaviors can change all the time; make the best changes.” – 39 year old, female, Black, Democrat, Tennessee

“The stimulus checks helped keep me out of debt.” – 52 year old, female, White, independent, Colorado

“More remote opportunities in education and employment.” – 21 year old, male, White, Democrat, Maryland

Methodology

This KFF Health Tracking Poll/COVID-19 Vaccine Monitor was designed and analyzed by public opinion researchers at the Kaiser Family Foundation (KFF). The survey was conducted March 15-22, 2022 online and by telephone among a nationally representative sample of 1,243 U.S. adults, conducted in English (1,188) and in Spanish (55). The sample includes 1,004 adults reached through the SSRS Opinion Panel either online or over the phone (n=39 in Spanish). The SSRS Opinion Panel is a nationally representative probability-based panel where panel members are recruited randomly in one of two ways: (a) Through invitations mailed to respondents randomly sampled from an Address-Based Sample (ABS) provided by Marketing Systems Groups (MSG)  through the U.S. Postal Service’s Computerized Delivery Sequence (CDS); (b) from a dual-frame random digit dial (RDD) sample provided by MSG. For the online panel component, invitations were sent to panel members by email followed by up to three reminder emails. 974 panel members completed the survey online and panel members who do not use the internet were reached by phone (30).

Another 239 (n=16 in Spanish) interviews were conducted from a random digit dial telephone sample of prepaid cell phone numbers obtained through MSG. Phone numbers used for the prepaid cell phone component were randomly generated from a cell phone sampling frame with disproportionate stratification aimed at reaching Hispanic and non-Hispanic Black respondents. Stratification was based on incidence of the race/ethnicity groups within each frame.

The combined cell phone and panel samples were weighted to match the sample’s demographics to the national U.S. adult population using data from the Census Bureau’s 2021 Current Population Survey (CPS). Weighting parameters included sex, age, education, race/ethnicity, region, and education. The sample was also weighted to match patterns of civic engagement from the September 2017 Volunteering and Civic Life Supplement data from the CPS. The sample was also weighted to match frequency of internet use from the National Public Opinion Reference Survey (NPORS) for Pew Research Center.  The weights take into account differences in the probability of selection for each sample type (prepaid cell phone and panel). This includes adjustment for the sample design and geographic stratification of the cell phone sample, within household probability of selection, and the design of the panel-recruitment procedure.

The margin of sampling error including the design effect for the full sample is plus or minus 4 percentage points. Numbers of respondents and margins of sampling error for key subgroups are shown in the table below. For results based on other subgroups, the margin of sampling error may be higher. Sample sizes and margins of sampling error for other subgroups are available by request. Sampling error is only one of many potential sources of error and there may be other unmeasured error in this or any other public opinion poll. Kaiser Family Foundation public opinion and survey research is a charter member of the Transparency Initiative of the American Association for Public Opinion Research.

This work was supported in part by grants from the Chan Zuckerberg Initiative DAF (an advised fund of Silicon Valley Community Foundation), the Ford Foundation, and the Molina Family Foundation. We value our funders. KFF maintains full editorial control over all of its policy analysis, polling, and journalism activities.


GroupN (unweighted)M.O.S.E.
Total1,243± 4 percentage points
COVID-19 vaccination status
Have gotten at least one dose of the COVID-19 vaccine981± 4 percentage points
Have not gotten the COVID-19 vaccine259± 7 percentage points
Race/Ethnicity
White, non-Hispanic748± 5 percentage points
Black, non-Hispanic188± 10 percentage points
Hispanic213± 9 percentage points
Party identification
Democrat396± 6 percentage points
Republican321± 7 percentage points
Independent310± 8 percentage points
Registered voters
Total voters1,036± 4 percentage points
Democratic voters351± 7 percentage points
Republican voters293± 7 percentage points
Independent voters253± 9 percentage points

Endnotes

  1. The latest data from the KFF COVID-19 Vaccine Monitor includes interviews conducted over the phone and online using a probability-based sample. ↩︎

Nursing Facility Staffing Shortages During the COVID-19 Pandemic

Authors: Nancy Ochieng, Priya Chidambaram, and MaryBeth Musumeci
Published: Apr 4, 2022

The disproportionate impact of the COVID-19 pandemic on nursing facility residents and staff has brought increased attention to long-standing workforce issues that can affect care quality and safety, such as staffing shortages and high turnover rates. These issues have existed for decades and have been associated with adverse outcomes, including increased mortality rates, hospitalization rates, and emergency department visits.  In a recent KFF poll,  a majority (70%) of adults said that this country’s nursing facilities and other long-term facilities are doing a “bad job” of maintaining adequate staffing levels.

Since the onset of the pandemic, more than 200,000 COVID-19 deaths have occurred among long-term care residents and staff, with most of these deaths (150,000 COVID-19 deaths) occurring among residents and staff in nursing facilities that are certified to receive Medicare and/or Medicaid payments. In response to these issues, the Biden Administration recently announced a set of nursing facility reforms, which were highlighted in the State of the Union address.

This analysis presents the most recent national and state-level data on nursing facility-reported staff shortages and describes the Biden Administration’s new policy initiatives to address staffing and other quality issues in nursing facilities. National staff shortage trend data spans from May 2020, the first month when nursing facilities were required to report COVID-19 facility data to the CDC, through March 20, 2022, the most recent week of data available. See the Methods box below for more details.

1.  What do the data show about nursing facility staffing?

As of the week ending March 20, 2022, the most recent data available, 28% of nursing facilities reported at least one staffing shortage (approximately 3,900 out of 14,000 facilities) (Figure 1). The current rate represents a slight drop since the week ending January 23, 2022, when the share of nursing facilities reporting a staff shortage peaked at 34%. This slight decline between January and March may be partly due to the decline in cases related to the Omicron variant as well as other potential factors, including anecdotal accounts of nursing facilities offering higher wages to attract workers. The current rate, 28%, is higher than the rate reported in May 2020, when 21% of nursing facilities reported at least one type of staff shortage.

Share of Nursing Facilities Reporting Staffing Shortages, May 2020-March 2022

The current level of staff shortages coincides with a period when health care providers, including nursing facilities, grappled with the impact of the Omicron variant, a highly transmissible variant that broke case and hospitalization records. This variant primarily affected residents and staff who were not vaccinated or boosted, though vaccinated older adults and those with other health conditions still faced a high risk of infection and mortality.

Nursing facilities were most likely to report a shortage of aides and least likely to report a shortage of clinical staff as of March 20, 2022. (Figure 1). Among the approximately 14,000 nursing facilities reporting complete and reliable data for the week ending March 20th, 26% reported aide shortages while just 3% reported clinical staff shortages.  Staff shortages were nearly as high for nursing staff as they were for aides, with 24% of facilities reporting nursing staff shortages. In the same time period, 14% reported other staff shortages. These patterns have held steady since nursing facilities began reporting this data in May 2020. For purposes of reporting staff shortages, the Centers for Medicare & Medicaid Services (CMS) defines aides to include certified nursing assistants (CNAs), nurse aides, and medication aides or technicians. Aides typically oversee overall care needs, including assistance with personal care needs and ensuring that each resident’s plan of care is being followed. Clinical staff primarily oversee medical needs and include physicians, physician assistants, and advanced practice nurses. Nursing staff include registered nurses, licensed practical nurses, and vocational nurses.

The share of nursing facilities reporting staffing shortages varies widely by state (Figure 2 and Table 1). As of the week ending March 20, 2022, the share of nursing facilities reporting staff shortages ranged from 4% of nursing facilities in Connecticut and California to 80% in Alaska (Figure 2, Table 1). Of note, less than 80% of nursing facilities in Alaska reported data and passed quality-checks performed by CMS.

In eight states, at least half of nursing facilities reported one or more staff shortage as of March 20, 2022. The five states with the highest shares of nursing facilities reporting any staffing shortages include Alaska (80%), Minnesota (64%), Maine (59%), Kansas (58%), and Wyoming (56%). Conversely, the five states with the lowest share of nursing facilities reporting staff shortages include California (4%), Connecticut (4%), Massachusetts (8%), Texas (9%), and New Jersey (9%) (Table 1). State variation in staffing shortages at the facility-level may be attributable to variation in local economies and labor markets, and could also be due to differences in the way in which nursing facilities define staff shortages.

Share of Nursing Facilities Reporting Staffing Shortages, as of March 20th, 2022

2. What new policies did the Biden Administration announce?

The Biden Administration’s new initiatives are focused on improving care quality, nursing facility oversight, data transparency, career pathways, and pandemic and emergency preparedness. Key policy proposals include establishing minimum staffing levels for Medicare and Medicaid-certified nursing facilities, strengthening oversight of poor-performing nursing facilities, supporting state efforts to tie Medicaid reimbursement rates to increases in staff compensation, and launching a national nursing career pathways campaign to recruit, train, and retain long-term care staff, among others. While some of the new policies can be adopted by the Administration, others would require Congressional action.

The Biden Administration plans to propose new regulations that would establish a minimum nursing facility staffing requirement within the next year. The fact sheet announcing this new proposal highlights adequate staffing levels as the “measure most closely linked to the quality of care residents receive.” The fact sheet cites a study of Connecticut nursing facilities, which found that an increase in registered nurse staffing of 20 minutes per resident day was associated with 22 percent fewer confirmed COVID-19 cases and 26 percent fewer COVID-19 deaths. Before proposing new regulations, CMS will conduct a new study to “determine the level and type of staffing needed to ensure safe and quality care.” Policymakers and other stakeholders have debated issues about care quality and staffing levels ever since federal requirements for nursing facilities to receive Medicare and Medicaid funds were established. The 1987 Nursing Home Reform Act adopted the current federal requirement that facilities provide 24-hour licensed nursing services “sufficient to meet resident needs,” including registered nurse services at least eight consecutive hours per day. However, there are no other federal requirements for minimum staffing hours per resident day, and staffing levels and their impact on care quality remain a topic of recurring concern among government regulators and other stakeholders.  While these proposed Biden reforms could take place administratively, some policy changes can be done via legislation. Provisions in the Build Back Better Act (BBBA) passed by the U.S. House of Representatives would have required HHS to conduct regular studies and report to Congress on the appropriateness of establishing minimum staffing ratios in nursing homes and to specify any appropriate minimum ratios for nurses and aides in regulations. However, whether the BBBA advances in the Senate remains uncertain.

3. What issues are important to watch?

Looking ahead, open questions remain about how and when the new Biden policy proposals will be implemented. The specific details about what minimum staff levels will be proposed are not yet known, and as noted above, CMS intends to conduct a study to inform the new proposed regulations. While the Administration plans to issue proposed rules within a year, it is not yet known when the new rules would be finalized or take effect. Enforcement of the new rules will likely be through the existing state inspection process, with facilities potentially subject to penalties such as fines or loss of Medicare or Medicaid funding. Another open question is how stakeholder reaction will affect the new rules. The proposal faces stiff opposition from the nursing home industry, which argues that facilities will be unable to meet new staffing and oversight requirements without additional federal funding. Proponents of the new rules contend that minimum staffing requirements are an important protection for nursing home residents. Others argue that the Biden proposal does not go far enough and should also address issues around Medicaid reimbursement rates and worker compensation. It is not clear whether Congress will authorize additional federal funding beyond the pandemic relief funds already provided for nursing facilities.

Another open question is how the pandemic and CMS’s health care provider vaccination mandate will affect nursing facility staffing shortages. When issuing the mandate, CMS acknowledged that some staff may leave their jobs because they do not want to receive the vaccine, but cited examples of vaccine mandates adopted by health systems in Texas and Detroit and a long-term care parent corporation with 250 facilities as well as the New York state health care worker mandate, all of which resulted in high rates of compliance and few employee resignations. Staff vaccination rates currently vary by state, likely reflecting a mix of federal mandate deadlines not yet passing, varying state and/or local mandates, and different degrees of vaccine hesitancy among staff. Data also show that the number of workers in nursing care and elder care facilities has continued to decline even while other health settings have returned to nearly pre-pandemic levels, raising questions about the long-term effects of the pandemic on the workforce.  Forthcoming KFF analyses will analyze the impact of the mandate when data is available, as well as evaluate state minimum staffing requirement changes post-COVID. It will be important to watch whether and how lessons from the pandemic are integrated into new policies to improve nursing facility care quality and protect residents and staff.

Methods

This analysis uses federal data on staffing reported weekly by facilities to the CDC’s National Healthcare Safety Network (NHSN) and reflects data from mid-May 2020 through March 20, 2022. These data are updated regularly to reflect revised data from previous weeks, so future versions of this dataset reflecting the same time period may output different values.

Each week, approximately 15,200 nursing facilities submit data through NHSN, including whether they are experiencing a shortage in nursing staff (including registered nurses, licensed practical nurses, and vocational nurses), clinical staff (including physicians, physician assistants, and advanced practice nurses), aides (including certified nursing assistants, nurse aides, medication aides, and medication technicians), or other staff (including administrative, custodial, and other environmental service staff).  These measures are asked and reported as binary measures (yes/no) and reflect staffing shortages as of the week of data reporting; therefore, we are unable to determine the magnitude of staffing shortages among nursing facilities that report “yes” to one or more staff positions. Additionally, these measures differ from other measures of staffing sufficiency, including the minimum staffing levels required by the federal government and states.

CMS performs data quality checks to identify facilities that may have entered incorrect data before publishing this data for public download. Facilities that have submitted erroneous data will have an “N” displayed in the column titled “Passed Quality Assurance Check”. Our final sample of nursing facilities in this analysis excludes facilities that CMS flagged in their data quality check, as well as facilities that are missing shortage measures. With these exclusions, each week of data in Figure 1 represents anywhere from 14,100 to 15,100 facilities. Each week of data represents a slightly different set of facilities due to weekly variation in nursing facility reporting. The most recent week of data, as of March 20, 2022, includes 14,156 nursing facilities. The federal data includes only data on Medicare or Medicaid certified nursing facilities. This analysis therefore does not reflect other long-term care settings, such as assisted living facilities, residential care facilities, group homes, or intermediate care facilities.

Tables

Share of Nursing Facilities Reporting Staffing Shortages, as of March 20th, 2022

Medicaid Spending and Enrollment: Updated for FY 2022 and Looking Ahead to FY 2023

Published: Apr 4, 2022

Over the past two years, the COVID-19 pandemic and recession have had significant implications for Medicaid spending and enrollment. Early in the pandemic, Congress passed the Families First Coronavirus Response Act (FFCRA), which authorized a 6.2 percentage point increase in the federal Medicaid match rate (“FMAP”) for states that meet certain “maintenance of eligibility” (MOE) requirements, including a continuous enrollment requirement. The additional funds were retroactively available to states beginning January 1, 2020 and continue through the quarter in which the public health emergency (PHE) period ends. States must meet MOE requirements through the end of the month in which the PHE ends.

The current PHE declaration is set to expire in mid-April 2022. However, it is now expected that the PHE will be extended through at least mid-July 2022 (the beginning of state fiscal year (FY) 2023 for most states) since the Biden administration indicated it would give states 60 days-notice before the PHE is terminated or is allowed to expire. While uncertainty remains around the duration of the PHE, the unwinding of the PHE will have significant implications for state Medicaid enrollment and spending trends, which states have begun to plan for.

In February 2022, the Kaiser Family Foundation (KFF) and Health Management Associates (HMA) fielded a rapid, mini-survey of Medicaid directors in all 50 states and the District of Columbia as a follow-up to the annual Medicaid Budget Survey conducted in summer 2021. At the time of the latest survey, most states were mid-way through FY 2022 and governors were releasing proposed budgets for FY 2023.1  A total of 44 states responded to the survey,2  although not all states answered every survey question. At the time of this survey, a majority of responding states’ spending and enrollment projections assumed the PHE would not be extended past April 2022, meaning projections assumed the MOE continuous enrollment requirement would end April 30, 2022 and the enhanced FMAP would end June 30, 2022. This brief explores Medicaid enrollment and spending growth estimates, as reported by state Medicaid directors, for FY 2022 and projections for FY 2023. Median calculations were used throughout the analysis.3  Extensions of the PHE would likely mean that increases in state spending and decreases in enrollment will occur later than what states have projected in our survey, but still within FY 2023 if the PHE is not extended beyond July.

Median Medicaid Enrollment and Spending Growth in FY 2022 and Projected FY 2023

State Medicaid agency reported growth rates for FY 2022 show increasing Medicaid enrollment and spending, reflecting state assumptions about the end of the PHE (Figure 1). Most states assumed that the PHE would be in place through the last quarter of FY 2022 reflecting the continuation of the MOE and fiscal relief provisions. Among responding states, the median enrollment growth rate was 8.9% for FY 2022. Many states identified ACA expansion adults as the eligibility group with the most enrollment growth so far in FY 2022, but with notable enrollment growth in other eligibility groups including children, parents, pregnant women, and other adults. Among states that responded to the mini-survey, median total spending was 9.6% in FY 2022. Among responding states, the median state spending growth rate was 8.0% in FY 2202. Enrollment and total spending growth rates reported here are higher and the state spending growth rate is lower than projections provided by states in the summer 2021 annual Medicaid Budget Survey due to updated assumptions about the duration of the PHE (earlier projections largely assumed the PHE would end at the end of December 2021).

State Medicaid agencies project enrollment and total spending growth will decline or slow in FY 2023 as a majority of states assumed the PHE would end in the last quarter of FY 2022 (Figure 1). At the time of the mini-survey, over three-quarters of state projections assumed the FFCRA enhanced FMAP would expire at the end of FY 2022, or June 30, 2022. Among responding states, enrollment is projected to decline by 5.0% in FY 2023, with most states pointing to the unwinding of the PHE and the MOE requirements as the most significant downward enrollment change driver. States expect to see larger enrollment declines across eligibility groups that experienced notable growth during the PHE (e.g., expansion adults, parents, children, and other adults). The median total Medicaid expenditure growth rate for responding states slows to 2.0% in FY 2023 with almost two-thirds of responding states indicated lower enrollment as the most significant downward driver for total Medicaid spending. Despite slowing total spending growth, states identified some upward drivers for FY 2023 including increases in utilization (6 out of 44) and provider reimbursement rates (15 out of 44). Some states (9 out of 44) noted higher enrollment could remain an upward pressure as it takes states time to process redeterminations and renewals following the end of the MOE.

For FY 2023, state Medicaid agencies project the state share of Medicaid spending will increase sharply by 14.0% (Figure 1). The state share of Medicaid spending typically grows at a similar rate as total Medicaid spending growth unless there is a change in the FMAP rate, like during the PHE, causing state spending on Medicaid to decline as federal support increases. States expected state spending growth to accelerate in FY 2023 following the projected end of the PHE and enhanced FMAP, as states will need to replace the expiring federal funds with state funds unless they make other changes to reduce spending.

Looking Ahead

While state economic conditions have improved and COVID-19 vaccines are now available for most U.S. residents, uncertainty remains around the trajectory of the pandemic and the duration of the PHE, especially with the rise of a new Omicron subvariant, BA.2. As states approach the end of FY 2022 and adopt budgets for FY 2023 (which begins in July for most states), this uncertainty has big fiscal implications. Medicaid plays a significant role in state budgets and has played a key role in the COVID-19 response and recovery across states. Unlike the federal government, states must meet balanced budget requirements, so dealing with these uncertainties makes it difficult to budget appropriately.

When the PHE and continuous enrollment requirement ends, states will begin processing redeterminations and renewals, likely leading to enrollment declines and decreased total Medicaid spending growth. The end of the PHE, however, will also end the enhanced FMAP, requiring states to increase state spending to replace the expiring federal funds.

Changes in Medicaid enrollment and spending are an inevitable consequence of the end of the PHE, but when they occur will depend on when the PHE does in fact end. And, the magnitude of the changes will depend on how states react. States will largely be responsible for managing the unwinding of the PHE and continuous enrollment requirement, which will likely lead to significant variation in Medicaid spending and enrollment growth trends across states.

  1. A few states will enact biennial budgets for FY 2023 and FY 2024 and some states with previously enacted biennial budgets may introduce/consider revised or supplemental budgets. ↩︎
  2. The 7 states that did not respond were: Connecticut, Georgia, Mississippi, New Mexico, Ohio, Pennsylvania, and Utah. The 44 responding states accounted for over three-quarters of total Medicaid enrollment. ↩︎
  3. Medians are calculated among all states that responded to each growth rate question. Number of respondents to each question varied. For FY 2022, 44 states reported Medicaid enrollment and expenditure growth rates. For FY 2023, 33 states reported enrollment growth rates, 37 states reported total expenditure growth rates, and 36 states reported state expenditure growth rates   ↩︎

States Look to Bolster Maternal Health

Authors: Ivette Gomez, Meghana Ammula, Jennifer Tolbert, and Usha Ranji
Published: Apr 1, 2022

The Medicaid program finances about 4 in 10 births in the US. Federal law requires states to provide Medicaid coverage without cost sharing for pregnant individuals with incomes up to 138% of the federal poverty level and cover them up to 60 days after childbirth. In recent years, there has been growing interest in extending this postpartum coverage period for Medicaid to improve maternal health and coverage stability and to address long-standing racial disparities in maternal health outcomes.

Starting April 1, a provision in the American Rescue Plan Act (ARPA) of 2021 gives states a new option to extend Medicaid postpartum coverage to 12 months without having to seek a waiver. To date, 28 states and DC have taken steps to extend postpartum Medicaid coverage to pregnant individuals up to 12 months under this option or through a Medicaid waiver.

While this new ARPA option is taking effect, during the federal COVID-19 Public Health Emergency states already have been prohibited from disenrolling individuals from Medicaid. As a result, postpartum coverage has been continuous since the start of the coronavirus pandemic. However, once the Public Health Emergency is lifted, possibly later this year, the continuous enrollment requirement will end and many postpartum adults will be at risk of losing their Medicaid coverage, particularly those living in non-expansion states.

Visit our tracker for detailed information on state activity.

Source


How Can We Put COVID Behind Us Without Guaranteed Paid Sick Leave?

Authors: Céline Gounder and Mollyann Brodie
Published: Mar 31, 2022

In this column in The Washington Post, Céline Gounder, Senior Fellow and KHN Editor-at-Large for Public Health, and Mollyann Brodie, Executive Vice President  and Executive Director of KFF’s Public Opinion and Survey Research Program, look at the challenges in returning to normal life after the COVID-19 pandemic when many Americans, particularly people of color and workers with low incomes, do not have paid sick leave.

News Release

Strategies To Lower Drug Costs Top the Public’s Health Priorities for Congress

Gas Prices Are the Public’s Top Financial Worry, But Unexpected Medical Bills Come in Second, Followed by Paying for Utilities and Food

Published: Mar 31, 2022

Against the backdrop of public concern about inflation and rising gas prices, proposals to lower what people pay out-of-pocket for drugs tops the public’s list of health care priorities for Congress, a new KFF Health Tracking Poll finds.

Most (55%) of the public say inflation is the biggest problem facing the country. Fewer cite other issues such as the Russian invasion of Ukraine (18%), climate change (6%), the COVID-19 pandemic (6%), and crime (6%).

The economy, including inflation, also ranks as the top voting issue as people begin to think about this year’s midterm elections.

Partly reflecting these concerns about inflation and prices, the public’s “top health care priorities for Congress” focus on lowering what people pay for their health care. These include limiting price increases for prescription drugs to the inflation rate (61% say it is a top priority), capping out-of-pocket costs for insulin (53%), and placing a limit on how much seniors have to pay for health care (52%). Nearly half (48%) say that allowing the federal government to negotiate lower drug prices for Medicare beneficiaries is a top priority.

Less than half rank other issues as top health priorities, such as expanding coverage to people with low incomes in states that have not expanded their Medicaid programs (42%), increasing funding for mental health services (42%), and improving safety and quality in nursing homes (40%). Fewer rank more spending for COVID-19 (25%) and making permanent the financial help for people buying marketplace health coverage that was included in COVID-19 relief law (22%) as top priorities.

“The public’s priorities in health reflect deep concern about the prices of everything right now, including drug prices,” KFF President and CEO Drew Altman said. “That doesn’t mean other things that have long been popular do not have public support too; they do. It just means prices are the preeminent concern.”

The poll also finds other signs of how heavily inflation and health costs are weighing on Americans, with most of the public saying they are worried about being able to afford gasoline or other transportation costs (71%), unexpected medical bills (58%), or monthly utility bills (50%). The shares worried about paying for gas and utilities are up significantly since February 2020.

With many people worried about affording unexpected medical bills, the poll also finds most (56%) people with private insurance say they know nothing at all about a federal law that took effect in January that protects people from receiving unexpectedly large medical bills when they unknowingly receive out-of-network care. Fewer say they know “a lot” (3%), “some” (18%) or “a little” (22%) about the law.

The poll also finds:

  • Half (51%) say they have delayed or gone without health care in the past year due to costs. This includes about a third who skipped dental care (35%), and a quarter who skipped vision care (25%) and doctor’s visits (24%). Some also skipped mental health care (18%), hospital services (14%), and hearing services, including hearing aids (10%).
  • With drug prices a major part of President Biden’s agenda, 29% of adults, including 43% of those with annual household incomes under of $40,000, say they either did not fill a prescription, cut pills in half or skipped doses, or took an over-the-counter product instead of a prescription due to cost in the past year.

As the Affordable Care Act Turns 12, Most People Continue to View the Law Favorably

Twelve years after its enactment, most (55%) of the public views the Affordable Care Act favorably. About a quarter (24%) of people say that the law has helped them, while 1 in 5 (20%) say that has hurt them. The most common way that people say that they were helped is by providing coverage to someone in their family, while the most common way people say they were hurt is by increasing costs.

There are major partisan differences. Most Democrats (87%) view the law favorably, and many (43%) say it directly helped them and their families. In contrast, most Republicans (79%) view the law unfavorably, and many (40%) say it has hurt them and their families. Independents mostly view the law favorably (58%), with a quarter (24%) saying the law has helped them and 16% saying it has hurt them.

Other findings include:

  • President Biden discussed improving care for residents of nursing homes and other long-term care facilities in his State of the Union address. Most of the public says that they are doing a “bad job” of maintaining adequate staffing (70%), offering affordable care (64%), and providing high-quality care (54%). Views of long-term care facilities are consistent across age groups.
  • About two thirds (65%) of people living in the 12 states that haven’t expanded their Medicaid programs under the ACA to cover more low-income uninsured people say that their state should, while one third (34%) say their state shouldn’t.

Designed and analyzed by public opinion researchers at KFF, the KFF Health Tracking Poll was conducted from March 15-22 among a nationally representative sample of 1,243 adults. Interviews were conducted in English and Spanish online (974) and by telephone (269). The margin of sampling error is plus or minus 4 percentage points for the full sample. For results based on subgroups, the margin of sampling error may be higher.

Poll Finding

KFF Health Tracking Poll – March 2022: Economic Concerns and Health Policy, The ACA, and Views of Long-term Care Facilities

Authors: Ashley Kirzinger, Audrey Kearney, Mellisha Stokes, Liz Hamel, and Mollyann Brodie
Published: Mar 31, 2022

Findings

Key Findings

  • As the nation’s economy and rising prices are on the forefront of the public’s mind, the latest KFF Health Tracking Poll finds the public wants lawmakers to prioritize out-of-pocket health care costs as Congress debates current health legislative priorities. A majority of the public (61%) say limiting how much drug companies can increase the price of prescription drugs each year to not surpass the rate of inflation should be a “top priority” for Congress. Slight majorities also say capping out-of-pocket costs for insulin at $35 a month (53%) and placing a limit on out-of-pocket costs for seniors (52%) are top priorities for Congress to take action on in the coming months. Majorities across partisans say many of the health care priorities asked about are important for Congress to work on in the coming months.
  • As many people move on from the COVID-19 pandemic, only about a quarter of the public say providing more funding to continue the COVID-19 pandemic response (25%) or making permanent the financial help that was part of the COVID-19 relief bill for people who buy their own insurance (21%) are top congressional health care priorities.
  • Twelve years since the passage of the Affordable Care Act, a majority of the public (55%) continue to view the law favorably, but opinions towards the 2010 health reform law are still divided by partisanship. Majorities of Democrats (87%) hold favorable views of the law and many (43%) say the law has directly helped them and their families. On the other side of the political aisle, most Republicans (79%) view the law unfavorably and four in ten say the ACA has hurt them and their families.
  • The No Surprises Act went into effect earlier this year and began protecting people with private health insurance from receiving surprise out-of-network medical bills when they received care from an in-network hospital. However, more than half of adults, 18-64, with private insurance say they know nothing at all about this legislation (56%), with an additional one in five (22%) saying they only know “a little.”
  • With a renewed focus from the Biden administration on reforming long-term care facilities such as nursing homes that have been much in the news during the COVID pandemic, KFF polling finds majorities of adults say this country’s nursing homes, assisted living facilities, and other long-term facilities are doing a “bad job” of maintaining adequate staffing levels (70%), offering affordable care (64%), or providing high-quality care to residents (54%). Views of the type of care provided by long-term facilities is even more negative among the one-fourth of adults who have a direct, recent connection with a long-term care facility. On the other hand, many (55%) say the country’s nursing homes are doing a “good job” of protecting residents and staff from COVID-19.

Economy and Inflation Are Public’s Top Concerns, Many Worry About Affording Basic Living Expenses

The latest KFF polling finds more than half of the public (55%) say inflation and rising prices is the biggest problem facing the U.S. right now, more than three times the share who say the same about any other issue included in the survey. About one in five (18%) say the Russian invasion into neighboring Ukraine is the biggest problem facing the U.S., followed by six percent each who say the same about the COVID-19 pandemic, crime, and climate change.

Inflation and rising prices is the top issue across partisans, with about half of Democrats (46%) and independents (53%) and seven in ten Republicans (70%) saying it is the biggest problem facing the U.S. About one in four Democrats (23%) say the Russian invasion into Ukraine is the biggest problem, as do 17% of independents and 14% of Republicans. One in ten Democrats also say either climate change (10%) or the COVID-19 pandemic (9%) is the country’s biggest problem, but few Republicans agree.

 Majority Of Adults Say Inflation And Rising Prices Are The Biggest Problem Facing The Country

The economy, inflation, and rising prices are also the top issue for voters as the country begins the ramp up to the 2022 midterm elections. When asked to name in their own words the issue they think will be most important when deciding which candidate to vote for, more than one-third of voters (37%) offer responses related to the economy. A handful of other issues also mentioned by voters include climate change (4%), crime (3%), the Russian invasion into Ukraine (3%), taxes (2%), the COVID-19 pandemic (2%), gas or energy (2%), or immigration (2%).

In Their Own Words: Thinking about the 2022 congressional elections later this year, what issue do you think will be the most important?

“People need to get back to work and prices need to come down” – 57-year-old female, White non-Hispanic, Pennsylvania

“Rising price of gasoline” – 69-year-old male, White non-Hispanic, California

“The most important issue is economy and someone who can get the economy started up again” – 34-year-old male, Hispanic, New Jersey

“The war going on in Ukraine” – 71-year-old male, Black, South Carolina

“Lowering prices of gas and houses” – 24-year-old female, Hispanic, Texas

The economy is also the top voting issue across partisan voters, with three in ten Democratic voters, more than a third of independent voters (36%), and nearly half of Republican voters (48%) offering economic issues as their top voting concern. Some partisan voters offer things other than policy issues as the biggest driver of their vote, including wanting to vote their party’s candidates into office: one in ten (11%) Democratic voters say the most important thing to them is voting for Democratic candidates, while 6% of Republican voters offer voting Republican as the most important aspect of their voting decision.

 The Economy Is The Top Voting Issue Across Partisans As Voters Begin To Think About Midterm Elections

Many Americans are also concerned about being able to afford basic living expenses for their families. At least half say they are either “very worried” or “somewhat worried” about being able to afford gasoline or other transportation costs (71%), unexpected medical bills (58%), or monthly utilities like electricity (50%). At least four in ten are worried about being able to afford food (47%), long-term care services for themselves or a family member (45%), their health insurance deductible (44%), their rent or mortgage (43%), or their prescription drug costs (43%). More than one-third (36%) are also worried about being able to afford their monthly health insurance premium. The share of people who say they are now worried about affording gas prices and monthly utilities has increased since February 2020, when roughly four in ten were worried about paying for gas (40%) and monthly utilities (38%).

 Many Americans Are Worried About Being Able To Afford Household Expenses Including Gas, Unexpected Medical Bills, Monthly Utilities

Worries about being able to afford living expenses are also largely dependent on an individual’s household income, with at least six in ten of those living in households with incomes of less than $40,000 annually saying they are worried about being able to afford gasoline or other transportation costs (79%), unexpected medical bills (66%), monthly utilities (65%), their rent or mortgage (63%), or their food costs (62%). However, with gas prices averaging over $4 a gallon across the country, a majority of individuals, regardless of income, report worries about being able to afford gasoline or other transportation costs.

Majorities Across Income Levels Are Worried About Gas Prices, For Lower-Income Families Gas Prices Are Just One Of Many Worries

In addition to being worried about affording health care costs along with other household expenses, half of adults (51%) report that they have delayed or gone without medical services due to costs in the past year. This includes more than one-third who have put off dental services (35%), and one-fourth who have put off vision care (25%) or general visits to their doctor or health care provider (24%). Fewer say they have put off mental health care (18%) or hospital services (14%) due to cost. One in ten say they have put off hearing services including getting hearing aids due to cost – including one in five (18%) older adults (ages 65 and older) who report this.

Half Of Adults Have Put Off Medical Care In The Past Year Due To Costs

Lowering the price of prescription drugs has been a major tenet of President Biden’s health care agenda and a constant source of debate among legislators. The latest polling finds three in ten adults (29%), including four in ten (43%) adults with household incomes of less than $40,000, saying they have either not filled a prescription, cut pills in half or skipped doses, or taken an over-the-counter medication instead due to the cost of their prescription drugs.

The Public’s Health Care priorities For Congress Are Focused on Bringing Down Costs

With economic issues at the forefront of the public’s mind, it is perhaps unsurprising that the top health care priorities the public wants Congress to focus on involve controlling out-of-pocket costs for families and individuals. Six in ten (61%) say limiting how much drug companies can increase the price of prescription drugs each year to not surpass the rate of inflation should be a “top priority” for Congress. Slight majorities also say capping out-of-pocket costs for insulin at $35 a month (53%) and placing a limit on out-of-pocket costs for seniors (52%) are top priorities for Congress to take action on in the coming months. About half of the public (48%) continue to say allowing the federal government to negotiate with drug companies to get a lower price on prescription drugs for people with Medicare is a top priority. Four in ten say expanding health coverage to people with lower incomes in states that have not expanded their Medicaid programs (42%), increasing government funding for access to mental health services and training for mental health providers (42%), and taking federal action to improve the safety and quality of nursing home care (40%) are top priorities for Congress. Smaller shares say providing more funding to continue the COVID-19 pandemic response (25%) or making permanent the financial help that was part of the COVID-19 relief bill for people who buy their own insurance (21%) should be top congressional health care priorities.

Controlling Out-Of-Pocket Health Care Costs Such As Limiting Annual Increases On Prescription Drugs And Capping Insulin Costs Are Top Health Care Priorities

Across most of the health care priorities asked about, majorities – regardless of partisanship – say each is at least an “important priority” while many rise to the “top priority” more often among Democrats. Large majorities of Democrats, independents, and Republicans say limiting how much drug companies can increase the prices of prescription drugs, allowing the federal government to negotiate with drug companies to get a lower price on prescription drugs for people with Medicare, capping out-of-pocket costs for insulin at $35 a month, taking federal action to improve the safety and quality of care in nursing homes, and increasing government funding for access to mental health care are important priorities for Congress to work on in the coming months. Smaller shares of Republicans say expanding coverage for lower-income people living in non-expansion states and providing more funding for the COVID-19 pandemic response are important priorities for Congress.

Large Majorities Across Partisans Say Many Health Care Issues Are Important Priorities For Congress To Work On

Prescription drug costs

When the public are asked which party they think deserves the most blame if Congress is unable to pass legislation lowering the cost of prescription drugs, they place the blame evenly across policymakers from both sides of the aisle. About half of the public say that either President Biden (23%) or Democrats in Congress (29%) will deserve the most blame, while more than four in ten (44%) say Republicans in Congress will deserve the most blame.

The vast majority of Democrats say the blame will fall on Republicans in Congress (82%), while equal shares say the blame falls on President Biden (8%) and Democrats in Congress (8%). Among Republicans, Democrats in Congress get the majority of the blame (58%), while 29% say the blame will fall on President Biden. Four in ten independents (43%) say Republicans in Congress will deserve the most blame, while about half say Democrats in Congress (24%) or President Biden (27%) will.

Half Of Public Say President Biden And Democrats In Congress Deserve Most Of The Blame If Congress Is Unable To Pass Prescription Drug Legislation

Affordable Care Act and No Surprises Act

On the 12th anniversary of the Affordable Care Act (ACA), the latest KFF polling finds a majority (55%) of the public continue to hold favorable views of the 2010 health reform law. This is consistent with KFF polling from last fall with no significant changes among key demographic groups. Since 2017, views of the ACA have consistently been more favorable than unfavorable, but are still largely driven by partisanship: nearly nine in ten Democrats (87%) along with six in ten independents (58%) view the law favorably, while eight in ten Republicans (79%) hold unfavorable views.

Clear Majority Of Public Continue To View The ACA Favorably

In addition, partisans hold very different perceptions of whether the ACA has directly helped or hurt them and their families. Four in ten Democrats (43%) say the ACA has “helped” them and their families, compared to one-fourth of independents (24%) and seven percent of Republicans. On the other hand, four in ten Republicans (40%) say the ACA has “hurt” them, compared to one in six independents (16%) and six percent of Democrats. At least half of all adults, regardless of self-identified party affiliation, say the ACA has had “no direct impact” on them or their family members.

While Many Across Partisans Say ACA Has Had No Direct Impact On Them, Democrats Are More Likely To Say The Law Has Helped Them While Republicans Are More Likely To Say It Has Hurt

About half of those who say the ACA helped them say allowing someone in their family to get or keep their health coverage has been the main way the health care law has helped them (48%, or 12% of total adults). Three in ten say the law has made it easier for them to get the health care they need (7% of total) and one in five say it has lowered the cost of their health care or health insurance (5% of total).

Half Of Those Who Say ACA Helped Them And Their Families Say It Allowed Them To Get Health Coverage

On the other side, more than half of those who say the ACA has hurt them believe it has increased the cost of their health care or health insurance (59%, 12% of total). This is more than twice the share who say the main way the ACA has hurt them is by making it more difficult to get the care they need (22%, 5% of total), or causing someone in their family to lose their health coverage (11%, 2% of total).

Most Of Those Who Say ACA Hurt Them And Their Families Say It Increased Their Health Care Costs

There are twelve states that have not expanded their Medicaid programs to cover more lower-income adults as part of the ACA. Among those living in non-expansion states, two-thirds (65%) say they think their state should expand Medicaid to cover more low-income uninsured people, while one-third (34%) say they think their state should keep Medicaid as it is today.

No Surprises Act

Earlier this year, a new law went into effect protecting people with private health insurance from receiving large medical bills when they accidentally received out-of-network care. Among adults, 18-64 years old, with private health insurance, about one in five say they know “a lot” (3%) or “some” (18%) about this new law. More than half say they know nothing at all about this new law (56%) while one in five say they know “a little.” Notably, partisanship does not seem to have affected awareness of the No Surprises Act with similar shares of Democrats (27%) and Republicans (22%) with private health insurance saying they knew “a lot” or “some” about the law but at least half saying they don’t know anything.

At Least Half With Private Insurance Across Partisans Say They Know Nothing About The No Surprises Act

Many Are Concerned About Quality And Cost Of Care At Long-Term Care Facilities

In his State of the Union address on March 1, 2022, President Biden announced steps to improve care for residents at nursing homes, assisted living, and other long-term care facilities. The latest polling finds that nearly half of adults (45%), including 51% of adults 50 and older, worry about being able to afford long-term care services like nursing home care, and less than half rate the quality and cost of care at this country’s nursing homes positively.

Majorities of adults say this country’s nursing homes, assisted living facilities, or other long-term facilities are doing a “bad job” of maintaining adequate staffing levels (70%), offering affordable care (64%), or providing high-quality care to residents (54%). However, many (55%) say the country’s nursing homes are doing a “good job” of protecting residents and staff from COVID-19.

Most Say Long-Term Care Facilities Are Doing A Bad Job  At Maintaining Adequate Staffing Levels, Providing Affordable And High-Quality Care

Views of long-term care facilities are consistent across age groups: majorities, regardless of age, say the facilities are performing poorly in maintaining adequate staffing and providing high-quality or offering affordable care. One-fourth (24%) of adults have a direct, recent connection with a long-term care facility, with them or a family member being a resident in the past three years. These individuals with a direct connection are more likely to say these facilities are doing a “bad job” at offering affordable care (70%, compared to 62% of those without a direct connection) or providing high-quality care (62% v. 51%).

Those With Direct Connection To Long-Term Care Facilities Are More Negative In Views Of Whether They Are Providing Affordable And High-Quality Care

In addition, nine percent of adults and six percent of older adults, ages 65 and older, say there was time in the past twelve months when they or a family member did not get long-term care because they couldn’t afford the cost.

Methodology

This KFF Health Tracking Poll was designed and analyzed by public opinion researchers at the Kaiser Family Foundation (KFF). The survey was conducted March 15-22, 2022 online and by telephone among a nationally representative sample of 1,243 U.S. adults, conducted in English (1,188) and in Spanish (55). The sample includes 1,004 adults reached through the SSRS Opinion Panel either online or over the phone (n=39 in Spanish). The SSRS Opinion Panel is a nationally representative probability-based panel where panel members are recruited randomly in one of two ways: (a) Through invitations mailed to respondents randomly sampled from an Address-Based Sample (ABS) provided by Marketing Systems Groups (MSG)  through the U.S. Postal Service’s Computerized Delivery Sequence (CDS); (b) from a dual-frame random digit dial (RDD) sample provided by MSG. For the online panel component, invitations were sent to panel members by email followed by up to three reminder emails. 974 panel members completed the survey online and panel members who do not use the internet were reached by phone (30).

Another 239 (n=16 in Spanish) interviews were conducted from a random digit dial telephone sample of prepaid cell phone numbers obtained through MSG. Phone numbers used for the prepaid cell phone component were randomly generated from a cell phone sampling frame with disproportionate stratification aimed at reaching Hispanic and non-Hispanic Black respondents. Stratification was based on incidence of the race/ethnicity groups within each frame.

The combined cell phone and panel samples were weighted to match the sample’s demographics to the national U.S. adult population using data from the Census Bureau’s 2021 Current Population Survey (CPS). Weighting parameters included sex, age, education, race/ethnicity, region, and education. The sample was also weighted to match patterns of civic engagement from the September 2017 Volunteering and Civic Life Supplement data from the CPS. The sample was also weighted to match frequency of internet use from the National Public Opinion Reference Survey (NPORS) for Pew Research Center.  The weights take into account differences in the probability of selection for each sample type (prepaid cell phone and panel). This includes adjustment for the sample design and geographic stratification of the cell phone sample, within household probability of selection, and the design of the panel-recruitment procedure.

The margin of sampling error including the design effect for the full sample is plus or minus 4 percentage points. Numbers of respondents and margins of sampling error for key subgroups are shown in the table below. For results based on other subgroups, the margin of sampling error may be higher. Sample sizes and margins of sampling error for other subgroups are available by request. Sampling error is only one of many potential sources of error and there may be other unmeasured error in this or any other public opinion poll. Kaiser Family Foundation public opinion and survey research is a charter member of the Transparency Initiative of the American Association for Public Opinion Research.

This work was supported in part by grants from the Chan Zuckerberg Initiative DAF (an advised fund of Silicon Valley Community Foundation), the Ford Foundation, and the Molina Family Foundation. We value our funders. KFF maintains full editorial control over all of its policy analysis, polling, and journalism activities.

GroupN (unweighted)M.O.S.E.
Total1,243± 4 percentage points
COVID-19 vaccination status
Have gotten at least one dose of the COVID-19 vaccine981± 4 percentage points
Have not gotten the COVID-19 vaccine259± 7 percentage points
Race/Ethnicity
White, non-Hispanic748± 5 percentage points
Black, non-Hispanic188± 10 percentage points
Hispanic213± 9 percentage points
Party identification
Democrat396± 6 percentage points
Republican321± 7 percentage points
Independent310± 8 percentage points
Registered voters
Total voters1,036± 4 percentage points
Democratic voters351± 7 percentage points
Republican voters293± 7 percentage points
Independent voters253± 9 percentage points


White House Releases FY 2023 Budget Request

Published: Mar 29, 2022

President Biden released the FY 2023 budget request to Congress on March 28, 2022. The request includes discretionary funding for U.S. global health programs at the State Department, the U.S. Agency for International Development (USAID), the Centers for Disease Control and Prevention (CDC), and the National Institutes of Health (NIH). In addition, the request includes newly proposed mandatory funding for pandemic preparedness activities. Key highlights for the known amounts are as follows (see tables for additional detail):

State Department & USAID:

Funding for global health programs through the Global Health Programs (GHP) account, which represents the bulk of global health assistance, totaled $10.6 billion, an increase of $746 million (8%) above the FY22 enacted level, almost all of which was for the Global Fund to Fight AIDS, Tuberculosis, and Malaria (Global Fund) and global health security. The FY23 request also included mandatory funding to support pandemic preparedness activities at the State Department and USAID (see below).

  • The request includes $2.0 billion for the U.S. contribution to the Global Fund to Fight AIDS, Tuberculosis and Malaria (Global Fund), an increase of $440 million (28%) above the FY22 enacted level, and states this funding would be the first contribution towards a $6 billion pledge to the Global Fund’s 7th Replenishment (2024-2026).
  • Funding for global health security totals $995 million, an increase of $295 million (42%) above the FY22 enacted level ($700 million).
  • Bilateral HIV funding through the President’s Emergency Plan for AIDS Relief (PEPFAR) is $4.7 billion, a slight decrease of $20 million (-0.4%) compared to the FY22 enacted level ($4.72 billion).
  • Funding for tuberculosis (TB) totals $350 million, a decline of $21 million (-6%) compared to the FY22 enacted level ($371 million).
  • Funding for malaria totals $780 million, a slight increase of $5 million (0.6%) compared to the FY22 enacted level ($775 million).
  • The request includes $880 million for maternal and child health (MCH), a slight decrease of $10.5 million (-1%) below the FY22 enacted level ($890 million). Other specific areas under MCH include multilateral contributions to:
    • Gavi, the Vaccine Alliance which totals $290 million, matching the FY22 enacted.
    • UNICEF which totals $135.5 million, a decline of $3.5 million (-3%) compared to the FY22 enacted level ($139 million).
  • Funding for the nutrition program totals $150 million, a decline of $5 million (-3%) compared to the FY22 enacted level ($155 million).
  • Bilateral family planning and reproductive health (FP/RH) funding totals $572 million through the GHP account (additional funding that may be provided through the ESF account is not yet known), an increase of $48 million (9%) above the FY22 enacted level ($524 million). Funding for multilateral contributions to the United Nations Population Fund (UNFPA) totals $56 million, $23.5 million (72%) above the FY22 enacted level ($32.5 million)
  • Funding for the vulnerable children program totals $25 million, a decline of $2.5 million (-9%) compared to the FY22 enacted level ($27.5 million).
  • Funding for neglected tropical diseases (NTDs) totals $114.5 million, an increase of $7 million (7%) compared to the FY22 enacted level ($107.5 million).
  • The request also included $10 million for a newly established Health Resilience Fund to “support cross-cutting health systems strengthening in challenging environments or countries emerging from crisis.”

Centers for Disease Control and Prevention (CDC): Funding for global health provided to the CDC totals $748 million, an increase of $101 million (16%) above the FY22 enacted level ($647 million), almost all of which ($100 million) is to support global health security activities; all other areas declined slightly except for parasitic diseases funding. The FY23 request also included mandatory funding to support pandemic preparedness activities at the CDC (see below).

National Institutes of Health (NIH) [i]: Funding for the Fogarty International Center (FIC) at NIH totals $96 million, $9 million (10%) above the FY22 enacted level ($87 million).

Mandatory Funding for Pandemic Preparedness: The FY23 budget request proposes to establish mandatory funding to support both domestic and international pandemic preparedness efforts including $6.5 billion at USAID and the State Department as well as significant additional resources at CDC (it is not possible to determine a specific amount for global activities at the CDC as some funding is designated to support both global and domestic efforts; the table below highlights funding that was designated as either 1) specifically for global efforts, or 2) could potentially be used to support global activities).

Resources:

Table 1 below compares global health funding in the FY 2023 request to the FY 2022 enacted funding amounts as outlined in the  “Consolidated Appropriations Act, 2022” (P.L. 117-103; KFF summary here). Note that total funding for global health is not currently available as some funding amounts provided through USAID, the Department of Health and Human Services (DHHS), and the Department of Defense (DoD) are not yet available. Table 2 below details mandatory funding for pandemic preparedness through the Department of State, USAID, and the Centers for Disease Control and Prevention in the FY 2023 request. The tables can be downloaded here.

See the KFF budget tracker for details on historical annual appropriations, including Senate and House amounts, for global health programs.

Table 1: KFF Analysis of Global Health Funding in the FY23 Budget Request
Department / Agency / AreaFY22Omnibusi(millions)FY23Request(millions)Difference: FY23 Request -FY22 Omnibus
State, Foreign Operations, and Related Programs (SFOPs) – Global Health
HIV/AIDS$4,720.0$4,700.0$-20 (-0.4%)
State Department$4,390.0$4,370.0$-20(-0.5%)
USAID$330.0$330.0$0(0%)
of which Microbicides$45.0$45.0$0(0%)
Global Fund$1,560.0$2,000.0$440 (28.2%)
Tuberculosisii
Global Health Programs (GHP) account$371.1$350.0$-21.1(-5.7%)
Economic Support Fund (ESF) accountNot specifiedNot specified
Malaria$775.0$780.0$5 (0.6%)
Maternal & Child Health (MCH)ii
GHP account$890.0$879.5$-10.5(-1.2%)
of which Gavi$290.0$290.0$0(0%)
of which Polio$75.0Not specified
UNICEFiii$139.0$135.5$-3.5(-2.5%)
ESF accountNot specifiedNot specified
of which PolioNot specifiedNot specified
Nutritionii
GHP account$155.0$150.0$-5(-3.2%)
ESF accountNot specifiedNot specified
Family Planning & Reproductive Health (FP/RH)iv$607.5
Bilateral FP/RHiv$575.0
GHP accountiv$524.0$572.0$48.1(9.2%)
ESF accountiv$51.1Not specified
UNFPAv$32.5$56.0$23.5(72.3%)
Vulnerable Children$27.5$25.0$-2.5 (-9.1%)
Neglected Tropical Diseases (NTDs)$107.5$114.5$7 (6.5%)
Global Health Security$700.0$995.0$295 (42.1%)
USAID GHP accountvi$700.0$745.0$45(6.4%)
State GHP accountvii$250.0
Emergency Reserve Fundviiiix
Health Resilience Fundx$10.0
SFOPs Total (GHP account only)xi$9,830.0$10,576.0$746 (7.6%)
Labor Health & Human Services (Labor HHS)
Centers for Disease Control & Prevention (CDC) – Total Global Health$646.8$747.8$101 (15.6%)
Global HIV/AIDS$128.9$128.4$-0.5(-0.4%)
Global Tuberculosis$9.7$9.2$-0.5(-5.1%)
Global Immunization$228.0$226.0$-2(-0.9%)
Polio$178.0$176.0$-2(-1.1%)
Other Global Vaccines/Measles$50.0$50.0$0(0%)
Parasitic Diseases$27.0$31.0$4(14.8%)
Global Public Health Protection$253.2$353.2$100(39.5%)
Global Disease Detection and Emergency ResponseNot specifiedNot specified
of which Global Health Security (GHS)Not specifiedNot specified
Global Public Health Capacity DevelopmentNot specifiedNot specified
National Institutes of Health (NIH) – Total Global Health
HIV/AIDSNot specified$614.8
MalariaNot specifiedNot specified
Fogarty International Center (FIC)$86.9$95.8$8.9(10.3%)
Labor HHS TotalNot yet knownNot yet known
Notes:
i – The FY22 Omnibus includes a provision giving the Secretary of State the ability to transfer up to $200,000,000 from the ‘Global Health Programs’, ‘Development Assistance’, ‘International Disaster Assistance’, ‘Complex Crises Fund’, ‘Economic Support Fund’, ‘Democracy Fund’, ‘Assistance for Europe, Eurasia and Central Asia’, ‘Migration and Refugee Assistance’, and ‘Millennium Challenge Corporation’ accounts “to respond to a Public Health Emergency of International Concern.”
ii – Some tuberculosis, MCH, and nutrition funding is provided under the ESF account, which is not earmarked by Congress in the annual appropriations bills and is determined at the agency level.
iii – UNICEF funding in the FY22 Omnibus includes an earmark of $5 million for programs addressing female genital mutilation.
iv – The FY22 Omnibus stated that “not less than $575,000,000 should be made available for family planning/reproductive health.”
v – The FY22 Omnibus states that if this funding is not provided to UNFPA it “shall be transferred to the ‘Global Health Programs’ account and shall be made available for family planning, maternal, and reproductive health activities.”
vi – According to the Department of State, Foreign Operations, and Related Programs FY23 Congressional Budget Justification, $250 million of this funding is “for contributions to support multilateral initiatives leading the global COVID response through the Act-Accelerator platform.”
vii – According to the Department of State, Foreign Operations, and Related Programs FY23 Congressional Budget Justification, this funding is “to support a new health security financing mechanism, being developed alongside U.S. partners and allies, to ensure global readiness to respond to the next outbreak.”
viii – The FY22 Omnibus states that “up to $100,000,000 of the funds made available under the heading ‘Global Health Programs’ may be made available for the Emergency Reserve Fund.”
ix – The FY23 Request states that “this request includes $90.0 million in non-expiring funds to replenish the Emergency Reserve Fund to ensure that USAID can quickly and effectively respond to emerging infectious disease outbreaks posing severe threats to human health.”
x – The FY23 Request states that the Health Resilience Fund (HRF) “will support cross-cutting health systems strengthening in challenging environments or countries emerging from crisis.”
xi – The FY22 Omnibus “includes $100,000,000 for a U.S. contribution to support a multilateral vaccine development partnership for epidemic preparedness innovations.”
Sources:
KFF analysis of data from the Office of Management and Budget, Agency Congressional Budget Justifications, Congressional Appropriations Bills, U.S. Foreign Assistance Dashboard, and personal communication.


Table 2: Mandatory Funding for Pandemic Preparedness
Department / Agency / ActivityFY23 Request(in millions)
Department of State and USAID
Global Health Programs Mandatory Budget Authority for Pandemic Preparedness$6,500
Global Health Security and Pandemic Preparedness Fund (GHP – State)$4,500
Research, Development, and Delivery (GHP – USAID)$500
Health Worker Initiative$1,000
GHP – State$250
GHP – USAID$750
Emergency Reserve Fund (GHP – USAID)$500
Centers for Disease Control and Prevention
Mandatory Funding for Pandemic Preparednessi$13,100
Global$6,850
Global MCM Capacity Development$5,700
Global Health Security Capacity$1,150
Global & Domestic$6,350
Domestic and Global Threat Detection$5,250
Antimicrobial Resistance (AMR)$1,000
Notes:
i – The FY23 CDC Congressional Justification includes a total of $28 billion in mandatory funding for pandemic preparedness. This table includes amounts that were designated as either 1) specifically for global efforts (e.g. “Global Health Security Capacity”), or 2) could potentially be used to support global activities (e.g. “Domestic and Global Threat Detection”).

[i] Total funding for global research activities (e.g. HIV/AIDS and malaria programs) at NIH is not yet known.

News Release

Many Uninsured People Could Lose Access to Free COVID-19 Testing, Treatment, and Vaccines as Federal Funding Runs Out

Published: Mar 28, 2022

With an impasse in Congress over additional COVID-19 emergency funding, uninsured people could lose access to free testing and treatment services, a new KFF brief explains.

For people without health insurance, the Health Resources and Services Administration (HRSA) COVID-19 Uninsured Program has reimbursed hospitals, doctors and other providers for the COVID-19 care and services that they provide to uninsured people. However, with federal funds running out, the program is no longer accepting new claims for testing and treatment services and will stop accepting claims for administering vaccines on April 5.

Many uninsured individuals would likely need to pay out of pocket for testing and some treatment services or rely on safety-net providers absorbing those additional costs without any way to get reimbursed. So long as supplies remain available, vaccines would continue to be paid for by the federal government and people could not be charged, but vaccine providers would not get paid for administering vaccines to uninsured people and could restrict access. This could exacerbate existing racial and ethnic disparities, as people of color are more likely than their White counterparts to be uninsured and face other potential barriers to accessing care.

The brief also outlines how the federal government has used previously authorized funds to purchase COVID-19 tests, medications, and vaccines, and the implications for efforts to help ensure equitable access to and ongoing availability of these resources as that funding runs out.

For people with health coverage, including Medicare and Medicaid, existing rules and protections will ensure that they will continue to have access to COVID-19 tests, treatment, and vaccines, though some limits on cost sharing will end when the ongoing federal COVID-19 Public Health Emergency ends. If the federal government is no longer able to pre-purchase tests, treatment medications, and vaccines, supplies may run short if and when the next COVID-19 wave hits and demand increases.