Ongoing Challenges with Hospital Price Transparency

Authors: Justin Lo, Gary Claxton, Emma Wager, Cynthia Cox, and Krutika Amin
Published: Feb 10, 2023

Since 2021, federal law has required hospitals to publicly post information about their standard prices and negotiated discount rates for common health services to encourage consumers to compare prices and to promote competition.

This analysis examines transparency data currently shared by hospitals to comply with the law and finds that they are messy, inconsistent and confusing, making it challenging, if not impossible, for patients or researchers to use them for their intended purpose. Drawing on hospital price transparency data compiled by Turquoise Health, the analysis includes examples that illustrate the difficulty in drawing meaningful conclusions from available data.

Many of these shortcomings stem from a lack of specificity and standardization in the requirements for what hospitals must report and how they report it. To address these challenges, federal regulators have suggested specific ways for hospitals to format and validate their data, but hospitals are not required to follow that guidance.

The analysis is available through the Peterson-KFF Health System Tracker, an online information hub that monitors and assesses the performance of the U.S. health system.

Claims Denials and Appeals in ACA Marketplace Plans in 2021

Authors: Karen Pollitz, Justin Lo, Rayna Wallace, and Salem Mengistu
Published: Feb 9, 2023

See KFF’s analysis of more recent data in Claims Denials and Appeals in ACA Marketplace Plans in 2023, published in January 2025.

In this brief, we analyze transparency data released by the Centers for Medicare and Medicaid Services (CMS) on claims denials and appeals for non-group qualified health plans (QHPs) offered on HealthCare.gov. Data were reported by insurers for the 2021 plan year and posted in a public use file in October 2022. We find that, across HealthCare.gov insurers with complete data, nearly 17% of in-network claims were denied in 2021. Insurer denial rates varied widely around this average, ranging from 2% to 49%.

CMS requires insurers to report the reasons for claims denials at the plan level. Of in-network claims, about 14% were denied because the claim was for an excluded service, 8% due to lack of preauthorization or referral, and only about 2% based on medical necessity. Most plan-reported denials (77%) were classified as ‘all other reasons.’

As in our previous analysis of claims denials, we find that consumers rarely appeal denied claims and when they do, insurers usually uphold their original decision. In 2021, HealthCare.gov consumers appealed less than two-tenths of 1% of denied in-network claims, and insurers upheld most (59%) denials on appeal.

The Affordable Care Act (ACA) requires transparency data reporting by all non-grandfathered employer-sponsored health plans and by non-group plans sold on and off the marketplace. Data are to inform regulators and consumers about how health plans work in practice. For example, transparency data could be helpful in oversight of compliance with the Mental Health Parity and Addiction Equity Act (MHPAEA), revealing how or whether claims denial rates differ for behavioral health vs other services. It could also make more transparent trends in the incidence and handling of claims for surprise medical bills, now protected under the No Surprises Act. Yet, the federal government’s broad authority to require transparency data reporting has not been fully implemented. Data to answer these questions are not collected; and data that are collected are not audited, for example, to ensure issuers report data consistently. Transparency data also are not used in oversight nor to develop other tools or indicators to help consumers see and compare differences across plans.

ACA Transparency Data

Under the ACA, required reporting fields for transparency-in-coverage data include:

  • Claims payment policies and practices
  • Periodic financial disclosures
  • Data on enrollment
  • Data on disenrollment
  • Data on the number of claims that are denied
  • Data on rating practices
  • Information on cost-sharing and payments with respect to any out-of-network coverage
  • Information on enrollee and participant rights under this title
  • Other information as determined appropriate by the Secretary

The law requires data to be available to state insurance regulators and to the public.

Partial implementation of ACA transparency data reporting began with the 2015 plan year. To date, reporting is required only by issuers for their qualified health plans (QHP) offered on HealthCare.gov. Issuers report only on the number of in-network claims submitted and denied, the number of such denials that are appealed, and the outcome of appeals. Aggregate data are reported at the issuer level. In 2022, issuers reported aggregated data on all HealthCare.gov QHPs they offered in 2021. Since 2018, issuers are also required to report data at the health plan level, including certain reasons for claims denials. Issuers only report plan-level transparency data plans they seek to offer on HealthCare.gov in the coming year. As a result, for any given issuer, the total plan-level claims reported may not equal the issuer-level claims reported for the 2021 coverage year.1  CMS does not collect data on all fields enumerated in the ACA, including out-of-network claims submitted and out-of-network enrollee cost sharing and payments. Nor has it required any further detailed reporting (e.g., on claims or appeals by type of service or diagnosis.) Federal agencies have yet to require transparency in coverage data reporting by other non-group plans or employer-sponsored plans.2 

Claims Denials and Appeals in 2021

This brief focuses on transparency data for the 2021 calendar year submitted by qualified health plans (QHPs) offered to individuals on HealthCare.gov as part of the 2023 plan certification process. Our analysis excludes stand-alone dental plans and issuers with incomplete data or less than 1,000 claims submitted. From the public use file, we developed a working file that is posted with this brief.

Claims submitted and denied

Of the 230 major medical issuers in HealthCare.gov states that reported for the 2021 plan year, 162 reported receiving at least 1,000 in-network claims and show data on claims received and denied. Together these issuers reported 291.6 million in-network claims received, of which 48.3 million were denied, for an average in-network claims denial rate of 16.6% (Figure 1)

HealthCare.gov Issuers Denied 17% of In-Network Claims in 2021

Issuer denial rates for in-network claims ranged from 2% to 49%. In 2021, 41 of the 162 reporting issuers had a denial rate of less than 10%, 65 issuers denied between 10% and 19% of in-network claims, 39 issuers denied 20-29%, and 17 issuers denied 30% or more of in-network claims. (Figure 2) Issuers that report denying one-third or more of all in-network claims in 2021 included Meridian Health Plan of Michigan, Absolute Total Care in South Carolina, Celtic Insurance in 7 states (FL, IL, IN, MO, NH, TN, TX), Ambetter Insurance in 3 states (GA, MS, NC), Optimum Choice in Virginia, Buckeye Community Health Plan in Ohio, Health Net of Arizona, and UnitedHealthcare of Arizona.

Denial Rate for In-Network Claims by HealthCare.gov Issuers, 2021

Table 1 shows denial rates for issuers who reported the highest volume of in-network claims in 2021, receiving over 5 million claims. Among these issuers, denial rates ranged from 5.7%. to 41.9%.

Denial Rates for Issuers Who Received More than 5 Million In-Network Claims in 2021

Denial rates also varied geographically. (Figure 3) State average denial rates can obscure variation within a state. For example, in Florida, where the average denial rate was 13% in 2021, the five issuers with largest market shares reported denial rates for in-network claims ranging from 15% to 42%.

Denial Rate for In-Network Claims by HealthCare.gov Issuers, 2021

Plan-level claims denial data

CMS also collects limited transparency data at the plan level. Of the 162 issuers reporting aggregate data, 158 report plan level data on in-network claims received and denied, as well as data on selected reasons for denials. Denial rates varied somewhat based on plan metal levels. On average, in 2021, HealthCare.gov issuers denied 15.9% of in-network claims in their bronze plans, 17.3% in silver plans, 17.1% in gold plans, 11.4% in platinum plans, and 19.7% in catastrophic plans.

Why do health plans deny claims?

HealthCare.gov plans also report on certain categories of reasons for in-network claims denials:

  • Denials due to lack of prior authorization or referral
  • Denials due to an out-of-network provider
  • Denials due to an exclusion of a service
  • Denials based on medical necessity (reported separately for behavioral health and other services)
  • Denials for all other reasons

A claim might be denied for more than one reason. In addition, insurers are required to report reasons for denials of claims that ultimately are paid. In all, insurers reported 41.7 million denied in-network claims at the plan level for the 2021 coverage year. Insurers also reported 44.7 million reasons for denying in-network claims, including roughly 3 million denials of claims that were later paid.

The distribution of in-network denials by reason is shown in Table 2. (We set aside data for out-of-network claim denials because CMS does not require issuers to report on the number of out-of-network claims received.) About 8% of these 44.7 million denials were for services that lacked prior-authorization or referral, 13.5% were for excluded services, 1.7% for medical necessity reasons, and 76.5% for all other reasons.

QHP-Reported In-Network Denials, by Reason, 2021

Again, totals obscure variation by plan. For example, while about 2% of all in-network claim denials by HealthCare.gov plans were based on medical necessity, several plans with large volume of denials (more than 75,000) reported much higher shares for medical necessity reasons, up to 37%. (Table 3)

Highest QHP-reported Share of Denials for Medical Necessity, 2021

Similarly, while about 9% of all in-network denials by HealthCare.gov plans were based on lack of prior-authorization or referral, some plans reported a much larger share of their denials were for that reason – as high as 24%. (Table 4)

Highest QHP-reported Share of Denials for Prior Authorization, 2021

The transparency data indicate that plans seem to apply utilization review techniques very differently. However, without more detail on the types of claims subject to these denials, it is not possible to discern what the implications for patients might be.

Of note, Connecticut regulators require health insurers in all market segments, including fully insured employer plans, to report annual data on claims payment practices, and other measures. Denial rates and reasons reported by Connecticut insurers are similar to those reported by HealthCare.gov QHPs. (Table 5)

Connecticut Health Insurer Claims Denied and Reasons, 2021

Appeals

ACA transparency data show the number of denied in-network claims that consumers appealed to the plan (internal appeals) and the number of denials overturned at internal appeal. Consumers whose denial is upheld at internal appeal sometimes have the right to an independent external appeal. (Under federal regulations, eligibility for external appeal is generally restricted to medical necessity denials, though in some states all denials can be externally appealed.) HealthCare.gov issuers also report the number of external appeals made by consumers, and the number of externally appealed denials that were overturned. The CMS public use file suppresses values lower than 10.

Consumers rarely appeal denied claims. Of the more than 48 million in-network denied claims in 2021, marketplace enrollees appealed 90,599 – an appeal rate of less than two-tenths of one percent. (Figure 4) Issuers upheld 59% of denials that were appealed.

Consumers rarely appeal denied health insurance claims

Marketplace consumers also rarely file external appeals. From ACA transparency data (and imputing a value of “5” for each cell where values were suppressed) we estimate just over 2,500 external appeals were filed by marketplace enrollees in 2021.

Discussion

Limited ACA transparency data collected by the federal government continues to show wide disparities in the rate at which marketplace plans pay claims. While on average HealthCare.gov insurers denied nearly 17% of in-network claims in 2021, some insurers report denying nearly half of in-network claims submitted. The federal government has not expanded or revised transparency data reporting requirements in years and does not appear to conduct any oversight using data that are reported by marketplace plans. As a result, consumers are not provided any information about how reliably marketplace plan options pay claims and plans reporting high claims denial rates do not appear to face any consequences.

  1. If an issuer offered a plan in 2021 that it no longer intends to offer in 2023, it should report issuer-level data for that 2021 plan, but no plan-level 2021 data will be reported for that plan. Similarly, if an issuer seeks to offer a plan in 2023 that it did not offer in 2021, it will report transparency data of “NA” for that plan in 2022.  Under these reporting rules, the total issuer-level claims data for 2021 may include plans that will not be offered in 2023; as a result the plan-level claims total may not equal the issuer-level claims total.  For more detailed transparency data reporting instructions, see “Qualified Health Plan Issuer Application Instructions, Plan Year 2023” starting at page 2E-1. ↩︎
  2. In 2020, the Trump Administration issued a final regulation requiring all non-grandfathered plans – including those sponsored by employers or offered by issuers outside of HealthCare.gov – to report billed charges and negotiated allowed amounts for covered items and services, enforceable beginning July 1, 2022. The regulation invokes ACA transparency data reporting authority but does not require plans to report prices to CMS; instead, price data must be posted online by each plan sponsor and issuer, making it unlikely that the price data across plans and issuers will be compiled into a single public use file provided by the federal government. ↩︎

Section 1115 Waiver Watch: How California Will Expand Medicaid Pre-Release Services for Incarcerated Populations

Authors: Sweta Haldar and Madeline Guth
Published: Feb 7, 2023

On January 26, the Centers for Medicare and Medicaid Services (CMS) approved California’s Section 1115 request to cover a package of reentry services for certain groups of incarcerated individuals 90 days prior to release. This approval is the first to include a partial waiver of the statutory Medicaid inmate exclusion policy, which prohibits Medicaid from paying for services provided during incarceration (except for inpatient services). Justice-involved individuals are disproportionately low-income and often have complex and/or chronic conditions, including behavioral health needs (mental health conditions and/or substance use disorder (SUD)). Reentry services aim to improve care transitions for these high-need Medicaid enrollees upon release and increase continuity of health coverage, prevent disruptions in care, and lead to improved health outcomes. This Waiver Watch summarizes the California approval and examines similar pending requests from 14 additional states to provide pre-release services.

What is the background?

The 2018 SUPPORT Act directed CMS to issue guidance on how waivers can improve care transitions for incarcerated individuals who are otherwise eligible for Medicaid. The SUPPORT Act required the Secretary of Health and Human Services (HHS) to convene a group of stakeholders to help inform the design of a demonstration opportunity to improve care transitions for individuals leaving incarceration. Findings from that convening were summarized in a report from the Office of the Assistant Secretary for Planning and Evaluation (ASPE), and the report includes promising practices and key considerations for the demonstration opportunity such as giving states options to customize the demonstration population, invest in data infrastructure, implement strategic partnerships, and include pre-arrest diversion activities. CMS has indicated that the guidance for the new waiver opportunity is forthcoming and will closely align with the approved approach to pre-release services in California.

States have used Medicaid strategies to help maintain eligibility and coordinate care for individuals transitioning from incarceration. While California is the first state to receive a partial waiver of the inmate exclusion, states can adopt other strategies to coordinate care for incarcerated Medicaid enrollees, such as by suspending (rather than terminating) eligibility for enrollees who became incarcerated and by developing managed care requirements and fee-for-service initiatives related to pre-release care coordination. The Biden Administration has encouraged states to propose waivers that address health-related social needs, expand coverage, and reduce health disparities, including by investing in initiatives for justice-involved populations.

What is included in the California waiver?

California estimates that approximately 200,000 people each year will be eligible to receive pre-release services under the demonstration waiver. While the waiver is complex and includes many provisions, key aspects of the “Reentry Demonstration Initiative” include the following:

  • Eligibility based on health needs: Services will be available to all Medicaid-eligible adults who are inmates in state prisons and county jails and meet health criteria, beginning 90 days prior to their expected date of release. The health criteria aim to identify inmates at high risk of adverse health outcomes pre- and post-release, including those with behavioral health needs or other chronic conditions. Also, all inmates of youth correctional facilities will be eligible for services 90 days pre-release, without meeting any clinical criteria.
  • Reentry benefit package: The limited benefit package is intended to improve care transitions for individuals upon release and prevent hospitalization as well as adverse outcomes including suicide, overdose, and recidivism. Covered services include case management, physical and behavioral health clinical consultation services, laboratory and radiology services, medications and medication administration, medication-assisted treatment (MAT) for substance use disorder, and Community Health Worker (CHW) services. Upon release, enrollees will also receive covered outpatient prescribed medications and over-the-counter drugs (a minimum 30-day supply, as clinically appropriate) and durable medical equipment (DME).
  • Implementation timing and funds: The waiver also includes authority to spend $410 million on pre-release application planning and information technology through California’s “Providing Access and Transforming Health” (PATH) initiative. California will use these funds to provide capacity grants and case management services beginning in April 2024, with the pre-release service package being phased in over two years. California also must provide pre-release education and outreach, along with Medicaid eligibility and enrollment support, to all incarcerated individuals while the demonstration functions.

CMS recognizes that effective implementation of California’s pre-release services program will require forging new partnerships with and providing significant technical assistance to correctional authorities, providers, and community-based organizations. To help ensure access to care upon release and for other Medicaid enrollees, California is also required to increase and (at least) sustain base Medicaid payment rates of at least 80% of Medicare rates for primary care, behavioral health, and obstetrics providers (this requirement is consistent with other states that recently received approvals to address health-related social needs).

What is pending in other states?

As of February 7, 14 additional states are also seeking partial waivers to the inmate exclusion policy to provide pre-release services to some eligible incarcerated individuals (Figure 1). The parameters of these proposals may change to reflect the California approval and upcoming CMS guidance. Currently, these pending requests vary in scope by pre-release period, eligibility and benefits:

Section 1115 Waivers Requesting Waiver of Inmate Exclusion Policy, as of January 27, 2023
  • Pre-release period. Most states (9 out of 15) intend to provide coverage to eligible inmates 30 days prior to release. Of the remaining states, three (New Hampshire, New Jersey, and Vermont) seek to provide coverage between 45 and 90 days prior to release. Kentucky proposes to provide fee-for-service benefits for the duration of an inmate’s commitment and through an MCO beginning 30 days prior to release. The other two states (Oregon and Massachusetts) would cover some inmates throughout the duration of their commitment, while covering other groups for a more limited pre-release period.
  • Eligibility. Four states (Oregon, Rhode Island, Vermont, and Washington) are seeking to provide benefits to all inmates of state and county facilities. The remaining states would limit these services to inmates who meet health or risk criteria (frequently related to behavioral health needs).
  • Benefits. Four states (Massachusetts, Rhode Island, Utah and Vermont) seek to provide full Medicaid State Plan benefits to eligible inmates during the pre-release period. Oregon proposes to provide full benefits to individuals in jail, while state prison inmates would receive a limited package of care coordination services. The remaining states would provide a limited benefit package for all eligible inmates (typically to include services such as reentry support, enhanced case management, and behavioral health care).

For further state-by-state details on Section 1115 pre-release requests, see Table 1.

Pending Section 1115 Waivers Requesting Waiver of Inmate Exclusion Policy, as of January 30, 2023
Poll Finding

KFF COVID-19 Vaccine Monitor: January 2023

Published: Feb 7, 2023

Findings

Key Findings

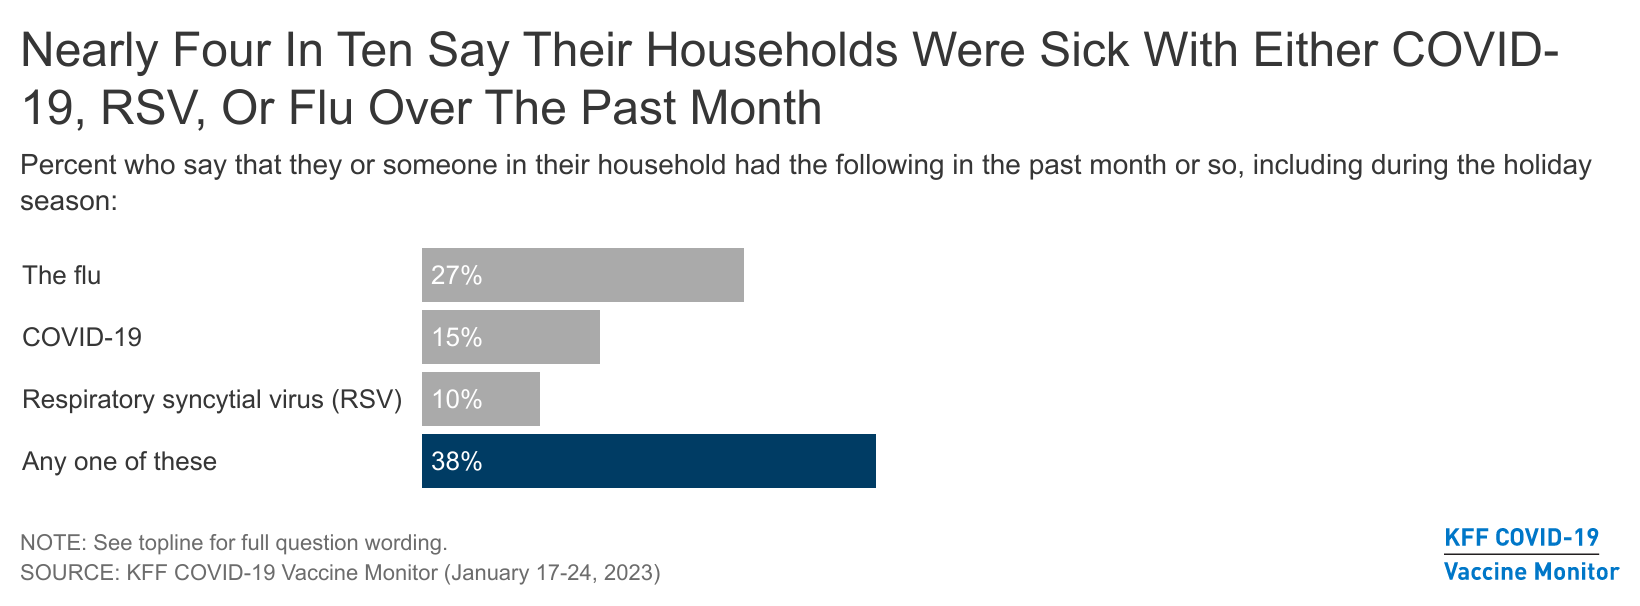
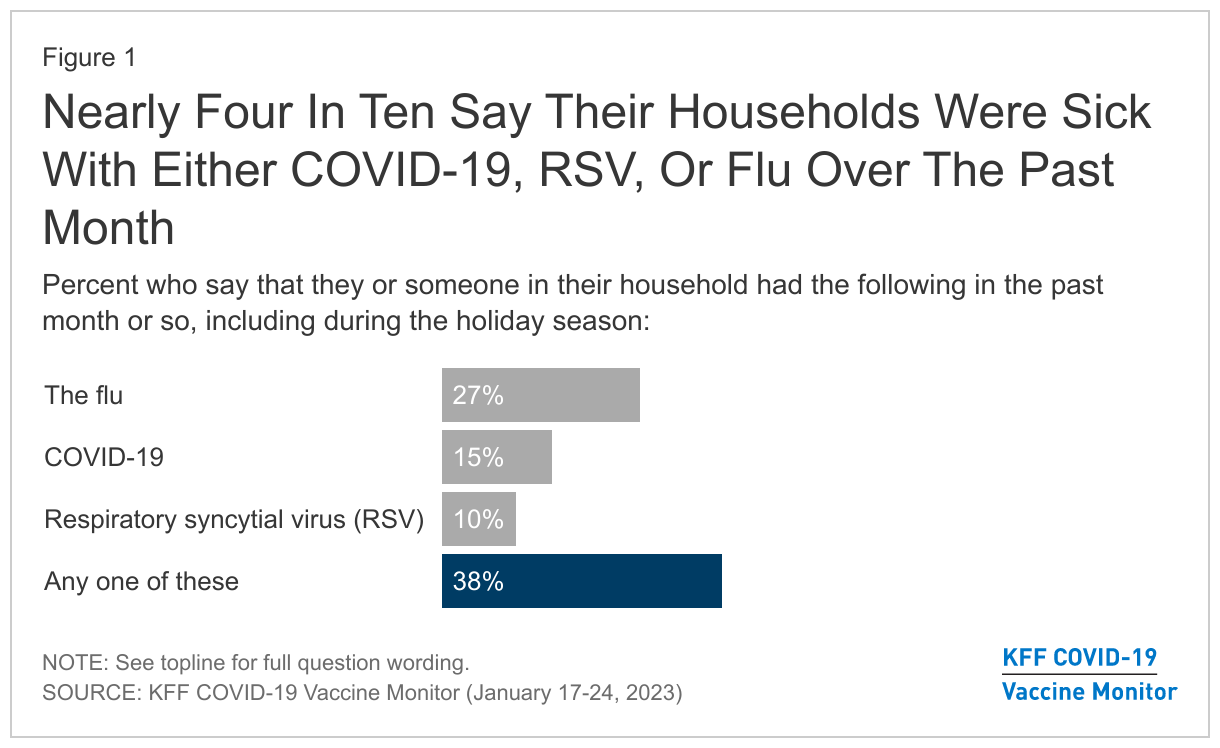
  • Nearly four in ten (38%) U.S. adults report that their households experienced either COVID-19, the flu, or RSV over the past month or so and the holiday season, including nearly three in ten (27%) who had someone who was sick with the flu, and one in ten or more who had COVID-19 (15%) or RSV (10%). Three in four (75%) adults in sick households tried to get common over-the-counter medicines like Tylenol or cough syrup when sick, but one in five of those who tried (20%) reported experiencing difficulties getting medicines. Few of those in households sick with COVID-19 or the flu tried to get Paxlovid (14%) or Tamiflu (16%), respectively.
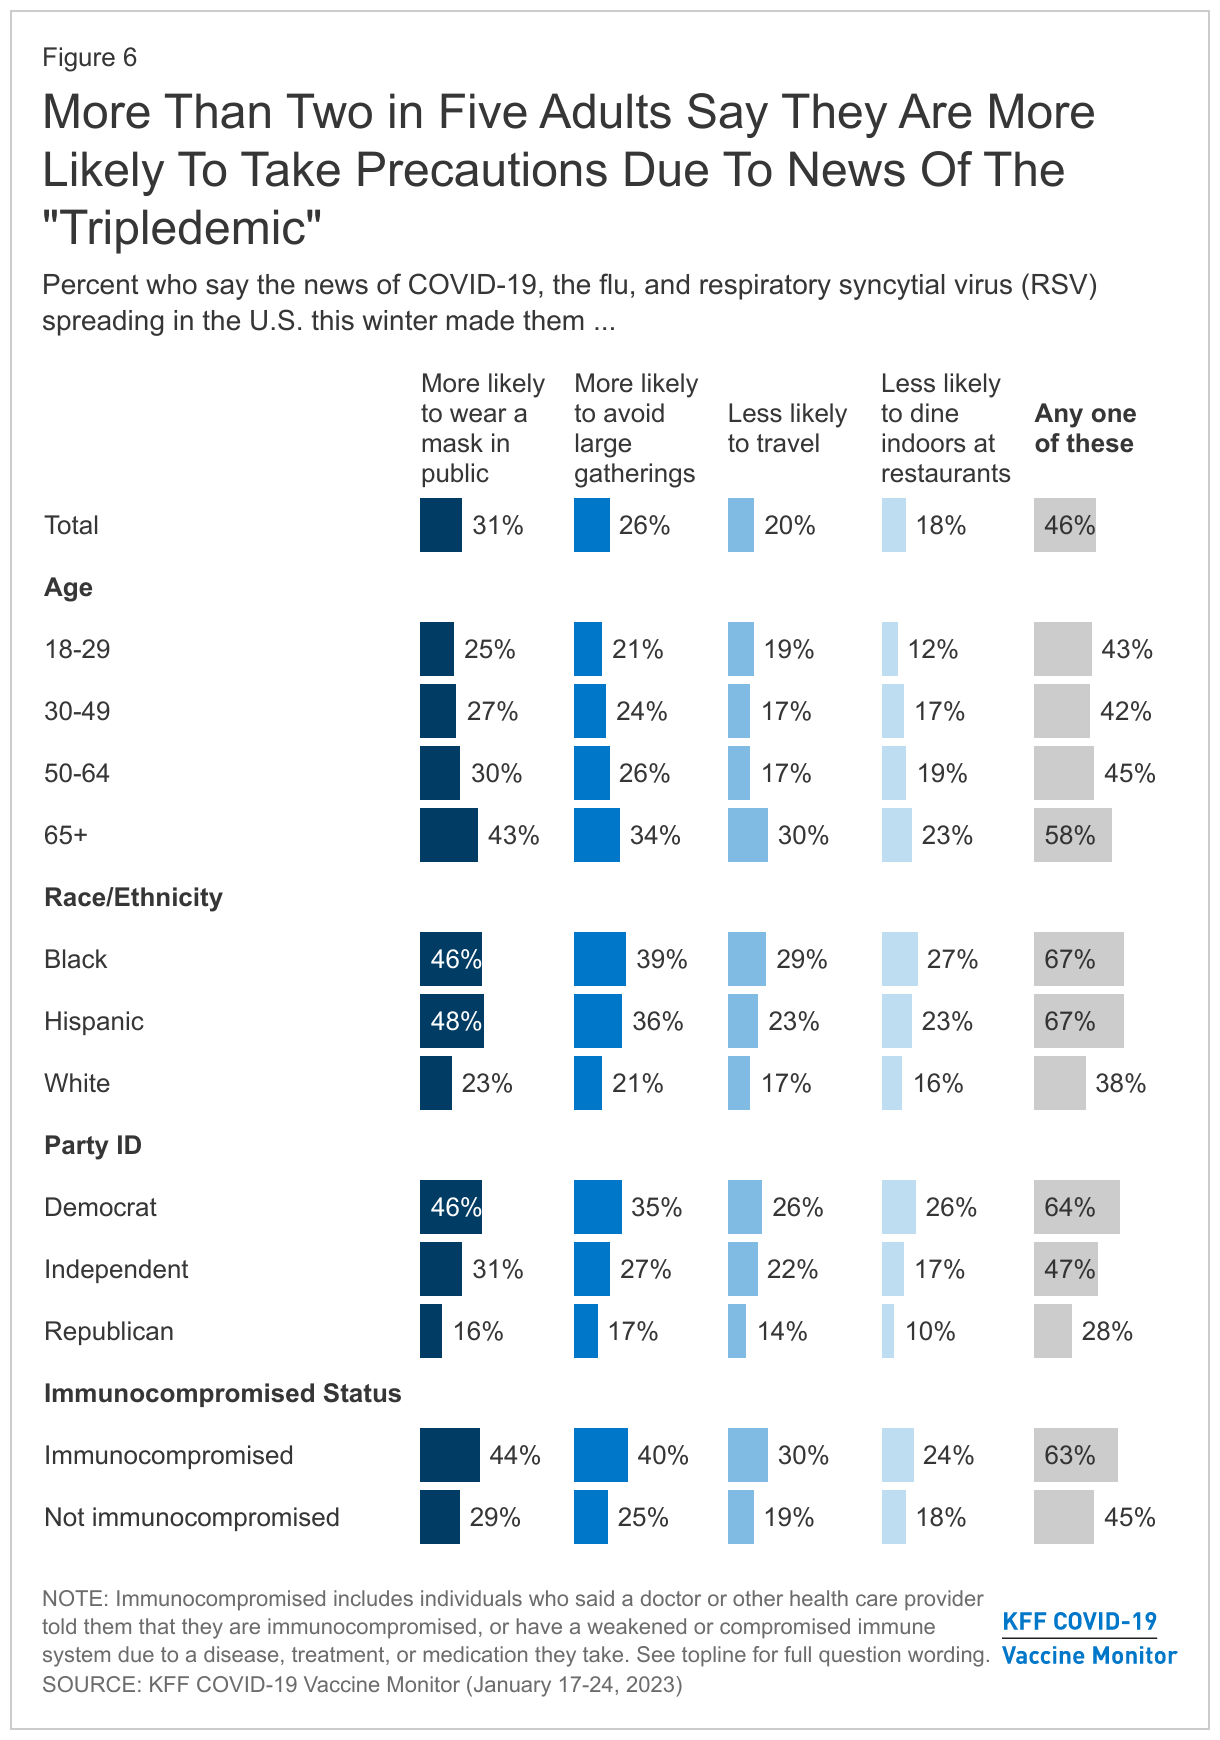
  • With the viruses spreading this winter, nearly half of adults (46%) say the news of COVID-19, flu, and RSV have made them more likely to take at least one protective measure. This includes three in ten (31%) who say they are more likely to wear a mask in public, avoid large gatherings (26%), and about one in five who say they are less likely to travel (20%) or eat indoors at restaurants (18%) because of the news of the viruses spreading. Six in ten (63%) immunocompromised people say the news of the viruses spreading has made them more likely to take at least one of these precautions, including four in ten (44%) who say they are more likely to wear a mask in public or avoid large gatherings (40%). While some people report being more likely to change their behavior due to concerns about the viruses, large majorities of those who have not been vaccinated or boosted for COVID-19, or received a flu shot this winter say the viruses spreading have not made much of a difference in their willingness to get these vaccines.
  • Despite the continued urging of public health officials for the public to get the updated bivalent booster, available since September 2022, uptake remains modest with about three in ten (28%) saying they have already gotten it, up from 22% in December. The overall rise in the share who say they have gotten the updated booster is driven largely by Republicans, of whom one in five (20%) now say they have gotten it, up from 12% in December. Still, about half of Republicans say they will get the booster only if required (20%) or are not eligible for the booster (31%) due to being unvaccinated or only partially vaccinated. Nearly half (47%) of seniors 65 and older now report having received the updated booster. And about half (52%) of immunocompromised adults say they have received the updated booster (36%) or plan to as soon as possible (16%).
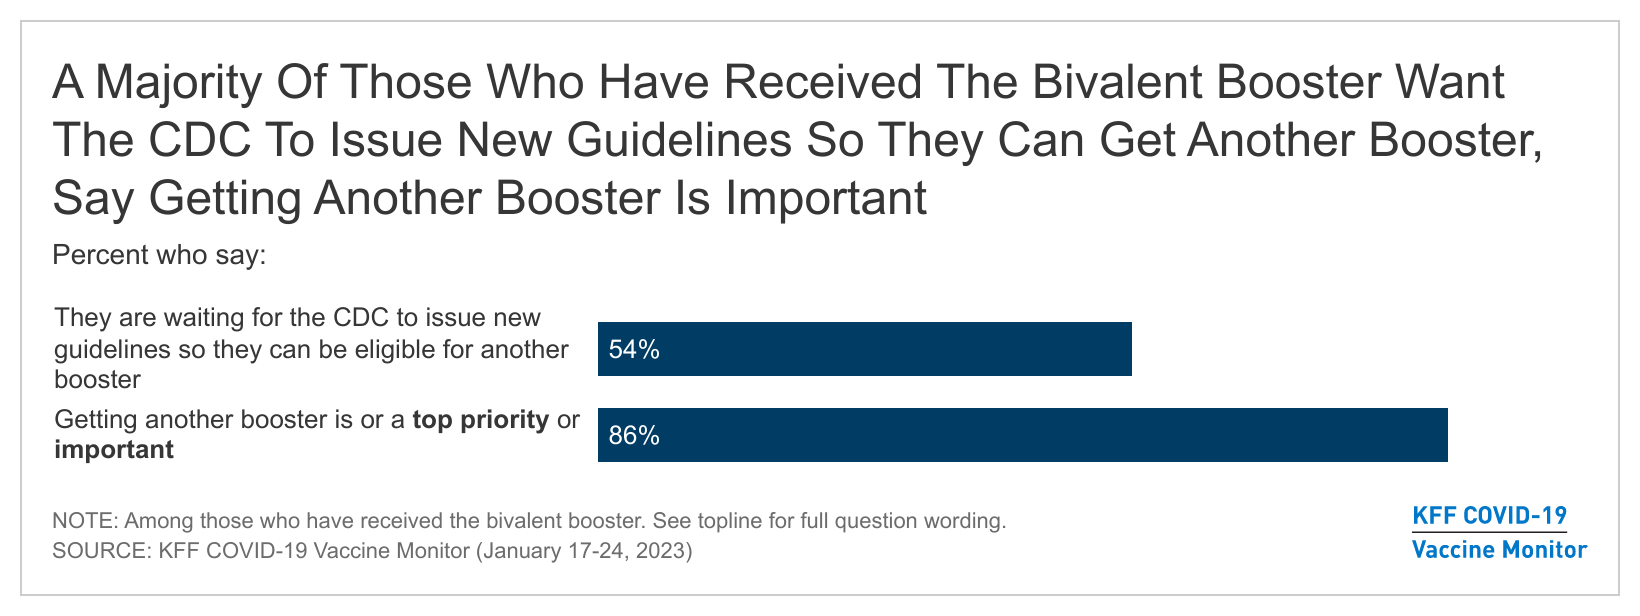
  • Many vaccinated adults who are eligible for the updated bivalent booster but have not yet gotten it say they feel they have enough protection from their initial COVID-19 vaccine or a prior infection of the virus (51%), or that they don’t think they need the new booster (44%). But there is still interest in getting an updated dose among some, as about three in ten (29%) say they are too busy or have not had time to get it yet. On the other hand, some are anxiously awaiting the rollout of another booster dose. More than half (54%) of adults who have received the bivalent booster (or 15% overall) say they are waiting on the CDC to issue new guidelines so they can be eligible for another booster. And when asked about getting another booster shot in the future, the vast majority of adults (86%) who have already gotten the bivalent booster say it’s important, including more than one third (37%) who say it is a top priority.

Nearly Four In Ten Adults Say Their Households Were Sick With COVID-19, RSV, Or The Flu During The Holidays And January

While reports have shown a recent decline in hospitalizations for COVID-19, flu, and RSV, the latest COVID Vaccine Monitor survey finds the so-called “tripledemic” was indeed a feature of most Americans lives over the past month or so, including the holiday season. Nearly four in ten (38%) U.S. adults report that their households had someone who was sick with at least one of these three viruses over the past several weeks. About three in ten (27%) adults say someone in their household was sick with the flu, and smaller, though substantial shares experienced COVID-19 (15%), or respiratory syncytial virus (RSV) (10%).

Nearly Four In Ten Say Their Households Were Sick With Either COVID-19, RSV, Or Flu Over The Past Month

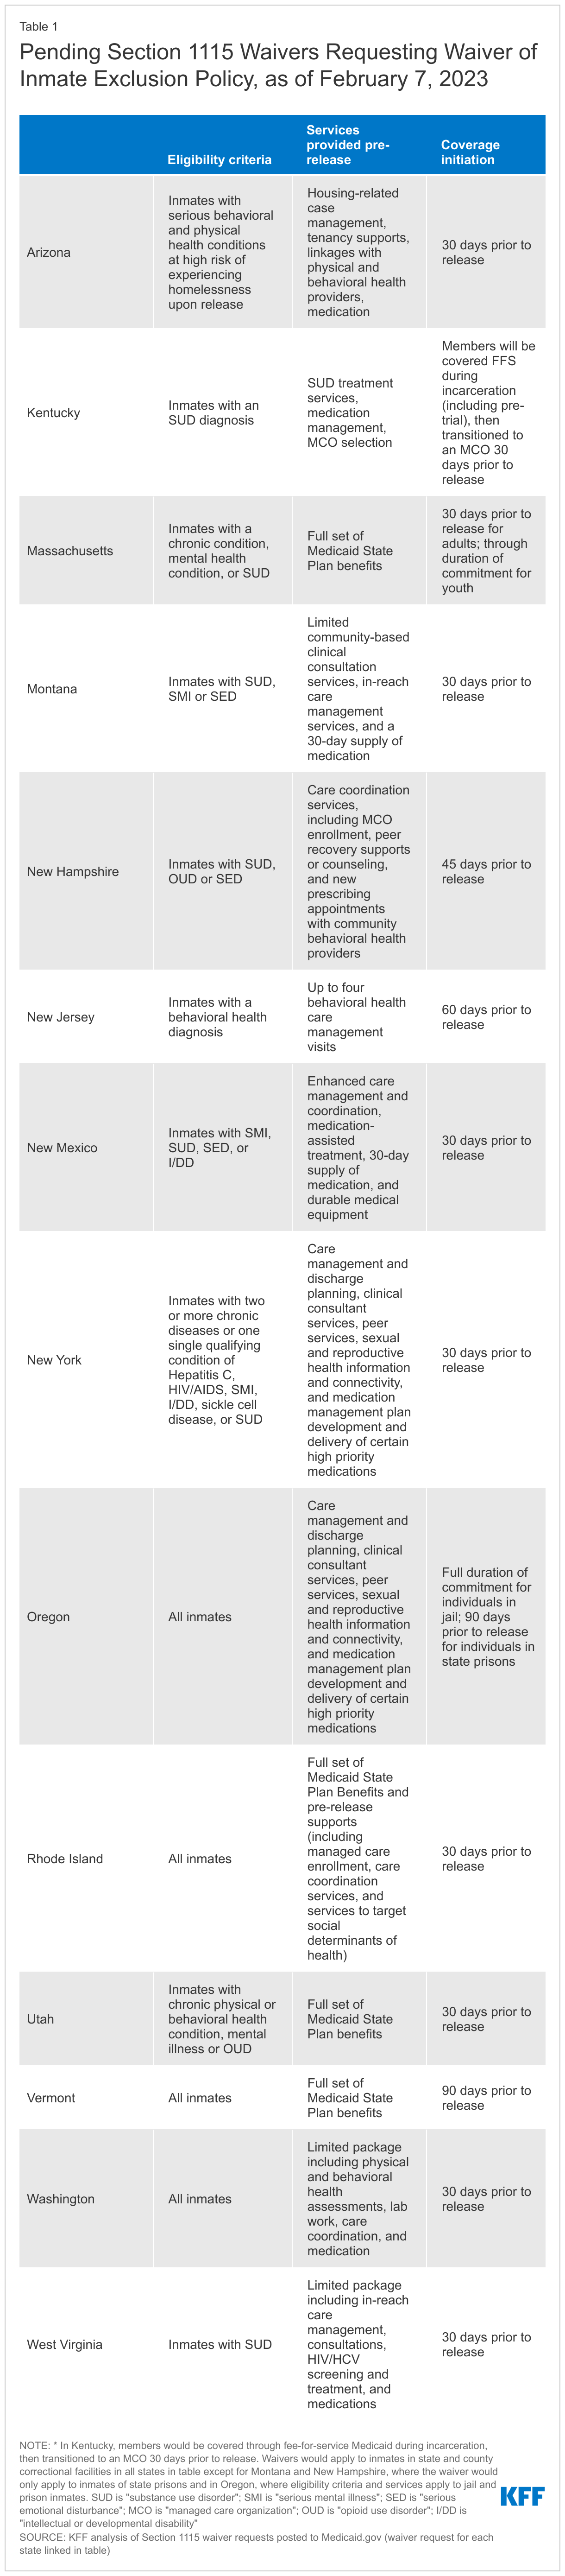
Over the past several weeks, news sources have reported that the country is experiencing a shortage in many common over the counter medicines, such as children’s Tylenol. Most (75%) adults living in households sick with any of the three viruses tried to get over-the-counter medicines to treat their illness, and one in five (20%) of those in households who reported being sick with at least one of the three and tried to get over-the-counter medicines had difficulty getting medicines when they were sick. Overall, 6% of U.S. adults reported difficulty getting over the counter medicines.

The share who said they had a hard time getting over-the-counter medicines is similar across income groups, but parents in sick households who tried to buy medicine are about twice as likely as non-parents (29% vs. 14%) to report difficulty getting medicine.

One In Five Adults Who Say Their Households Were Sick And Tried To Get Over-The-Counter Medicines Reported Difficulty

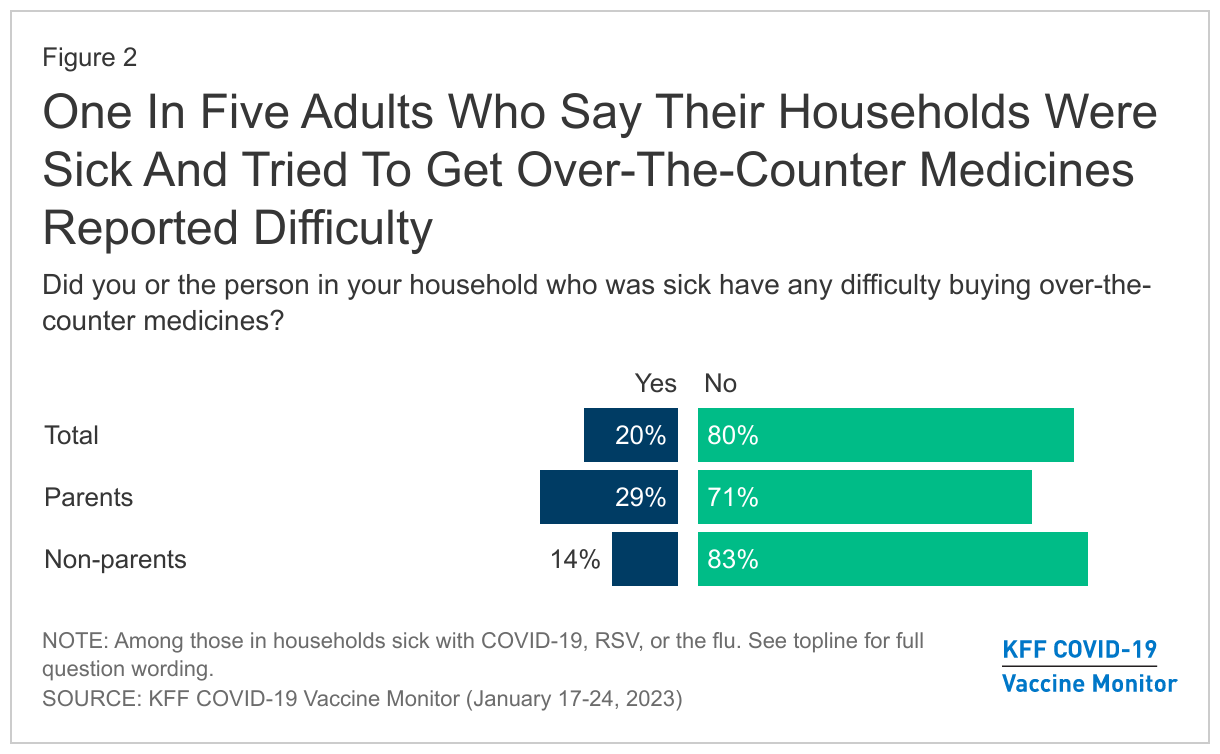
Few adults in households sick with COVID-19 or the flu tried to get anti-viral treatments that have been shown to reduce the severity and duration of illness. About one in seven (14%) adults in households sick with COVID-19 report they or the person in their house who was sick tried to get Paxlovid, the anti-viral pill used to treat COVID-19, while about three in four (77%) say they did not try to get it. A further one in ten (9%) said they have not heard of Paxlovid.

The January Covid Vaccine Monitor survey finds a similar pattern among those in households sick with the flu with attempts to get Tamiflu, an antiviral medicine used to treat the flu. While 16% of adults in households with the flu said they tried to Tamiflu, about seven in ten (71%) said they did not try to get it, while about one in ten (13%) said they had not heard of Tamiflu.

Three In Four Say Their Households Tried To Get Over-The-Counter Medicines When Sick, Far Fewer Tried To Get Anti-Viral Treatments

At Least One In Four Adults Are Worried About Getting Seriously Sick From COVID-19, The Flu, And RSV

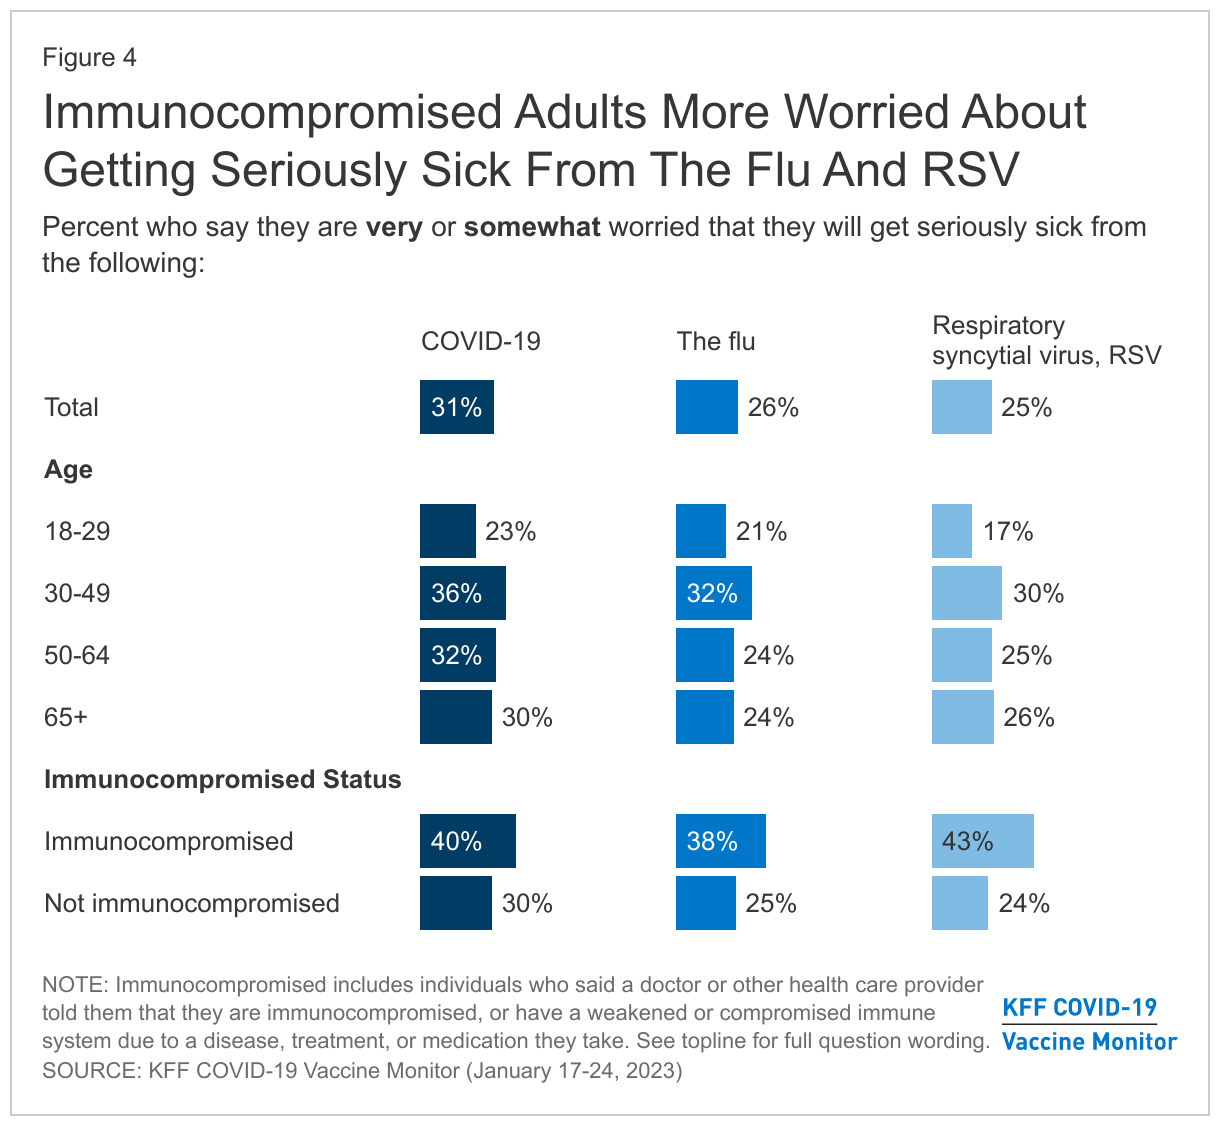
As the public health emergency order is set to end, at least a quarter of adults say they are worried about COVID-19, RSV, or the flu. Three in ten (31%) adults say they are “very worried” or “somewhat worried” about seriously getting sick with COVID-19, a slightly larger share than those who said the same of the flu (26%) and RSV (25%). The share who say they are worried about COVID-19 is still somewhat similar to the share (34%) who were concerned in January 2022 amid the surge in the Omicron variant of the virus.

Adults who report being immunocompromised1 , that is that a doctor has told them that they are immunocompromised, or have a weakened immune system due to a disease, treatment, or medication they take are more likely to be worried about getting seriously sick from RSV or the flu than non-immunocompromised adults. But adults who are immunocompromised and those who are not immunocompromised are equally worried about COVID-19. And, younger adults under age 30 are less likely than middle age adults 30-49 to say they are “very worried” or “somewhat worried” about getting seriously sick from COVID-19, the flu, and RSV.

Immunocompromised Adults More Worried About Getting Seriously Sick From The Flu And RSV

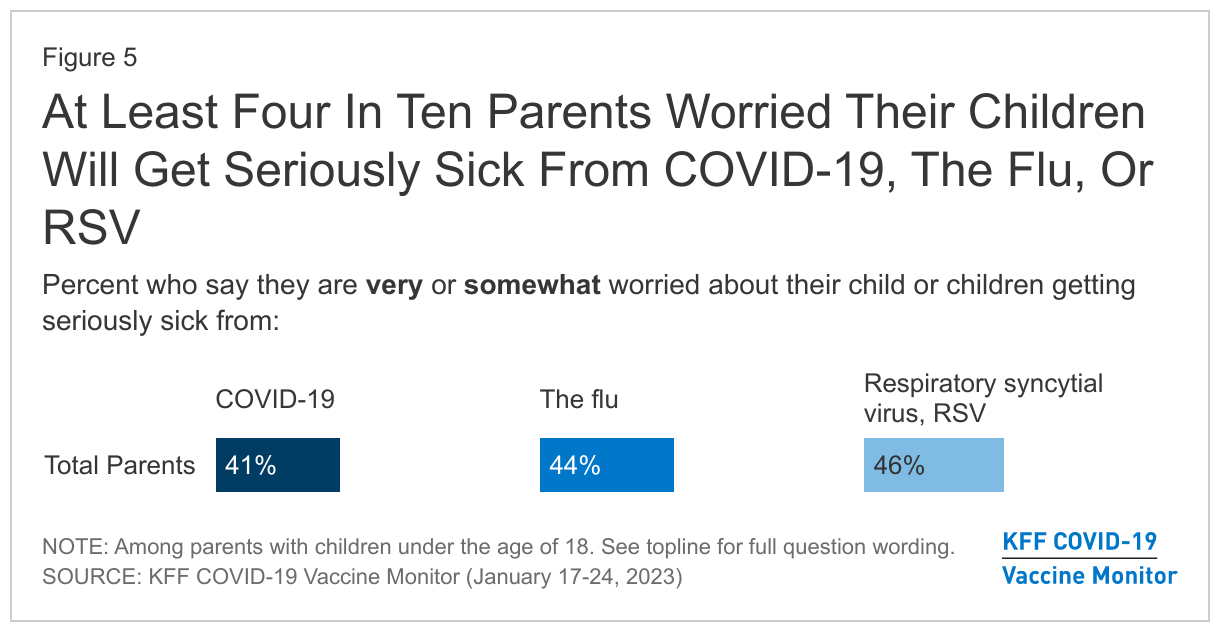
Parents are generally more worried about their children getting seriously sick than adults are about themselves, but parents are equally concerned about their children getting sick from each of the three viruses. Nearly half of parents say they are “very” or “somewhat” worried about their children getting sick with one of these viruses, including 46% who say they are worried about RSV, 44% about the flu, and 41% about COVID-19.

At Least Four In Ten Parents Worried Their Children Will Get Seriously Sick From COVID-19, The Flu, Or RSV

The Tripledemic’s Impact on Behaviors

When asked about the impact of the “tripledemic” viruses spreading this winter on their behaviors, about half of adults (46%) say the news of COVID-19, RSV, and the flu spreading this winter made them more likely to take at least one protective measure, including wearing a mask in public, avoiding large gatherings, traveling less, or avoiding dining indoors at restaurants. Of all the measures asked about, wearing a mask in public is the most often reported protective measure taken, across ages, race/ ethnicity, and partisanship. Three in ten adults (31%) say the viruses spreading have made them more likely to wear a mask, followed closely by avoiding large gatherings (26%). About one in five adults say the “tripledemic” has made them less likely to travel (20%), or to eat indoors at restaurants (18%).

The CDC advises immunocompromised individuals to take extra precautions to protect themselves from COVID-19 and other pathogens. The January COVID-19 Vaccine Monitor finds that nearly two-thirds (63%) of adults who say they are immunocompromised have modified at least one of their behaviors to be more cautious. And on each of the measures asked about, immunocompromised individuals are more likely to have taken a precautionary measure than those who are not immunocompromised, with the exception of indoor dining. Still, a substantial share (45%) of adults who are not immunocompromised have modified at least one of their behaviors as well.

Adults ages 65 and older are significantly more likely than their younger peers to say they have taken at least one of the precautions this winter. Nearly six in ten (58%) older adults say they have modified at least one of these behaviors, including 43% who say they are more likely to wear a mask in public and one in three (34%) who said they more likely to avoid large gatherings.

Black adults and Hispanic adults are more likely than White adults to say they have taken at least one of these precautionary measures. Two-thirds of Hispanic adults (67%) and Black adults (67%) say they have modified their behaviors to be more cautious, while about four in ten (38%) of White adults say the same.

More Than Two in Five Adults Say They Are More Likely To Take Precautions Due To News Of The "Tripledemic"

Democrats are more than twice as likely as Republicans to say the viruses spreading this winter have made them more likely to take at least one of these precautionary measures (64% vs. 28%). Continuing the trend of partisanship and mask-wearing, half of Democrats (46%) say following the news of the “tripledemic” that they are more likely to wear a mask in public, compared to just one in eight (16%) Republicans who say the same. A similar partisan divide is seen on each of the other measures tested, with Democrats being twice as likely or more to say they are changing their behavior compared to their Republican counterparts.

Uptake Of The Updated Bivalent COVID-19 Booster

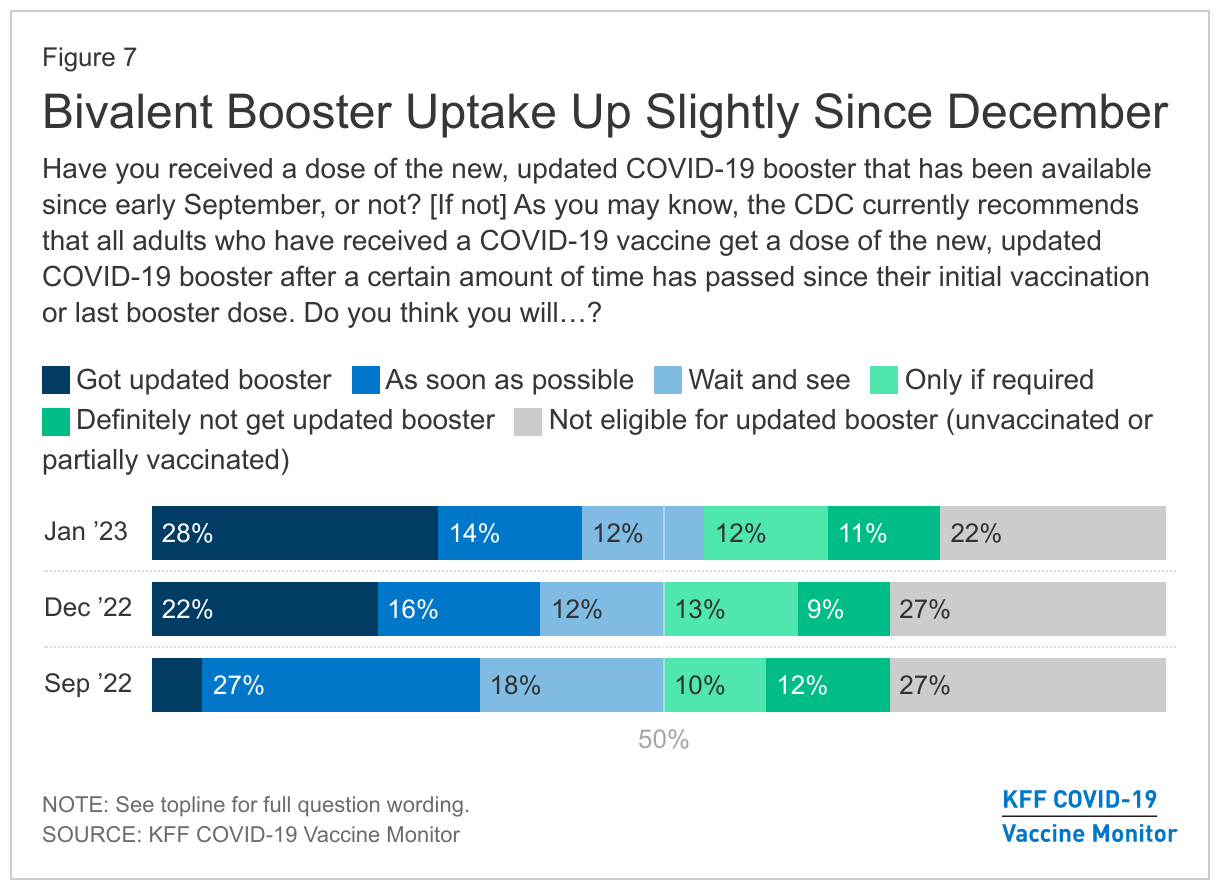
Although about half of adults (46%) say they are taking at least some protective measures given the news of COVID-19, RSV, and the flu spreading in the U.S. this winter, a smaller share of adults are doing the thing public officials are emphasizing the most: getting the updated bivalent booster. About four in ten adults say they have either received the updated bivalent COVID-19 booster dose (28%)2  or that they plan to get it “as soon as possible” (14%). In a slight uptick from last month’s Covid Vaccine Monitor, nearly three in ten (28%) adults now say they have already gotten the updated booster, up from 22% in December. Still, about one in ten adults say they want to “wait and see” before getting the updated shot (12%), and the same share (12%) says they will get it “only if required.” A further 11% say they will “definitely not” get the updated booster and about one in five (22%) adults are not eligible for the updated dose since they are unvaccinated or only partially vaccinated.

Bivalent Booster Uptake Up Slightly Since December

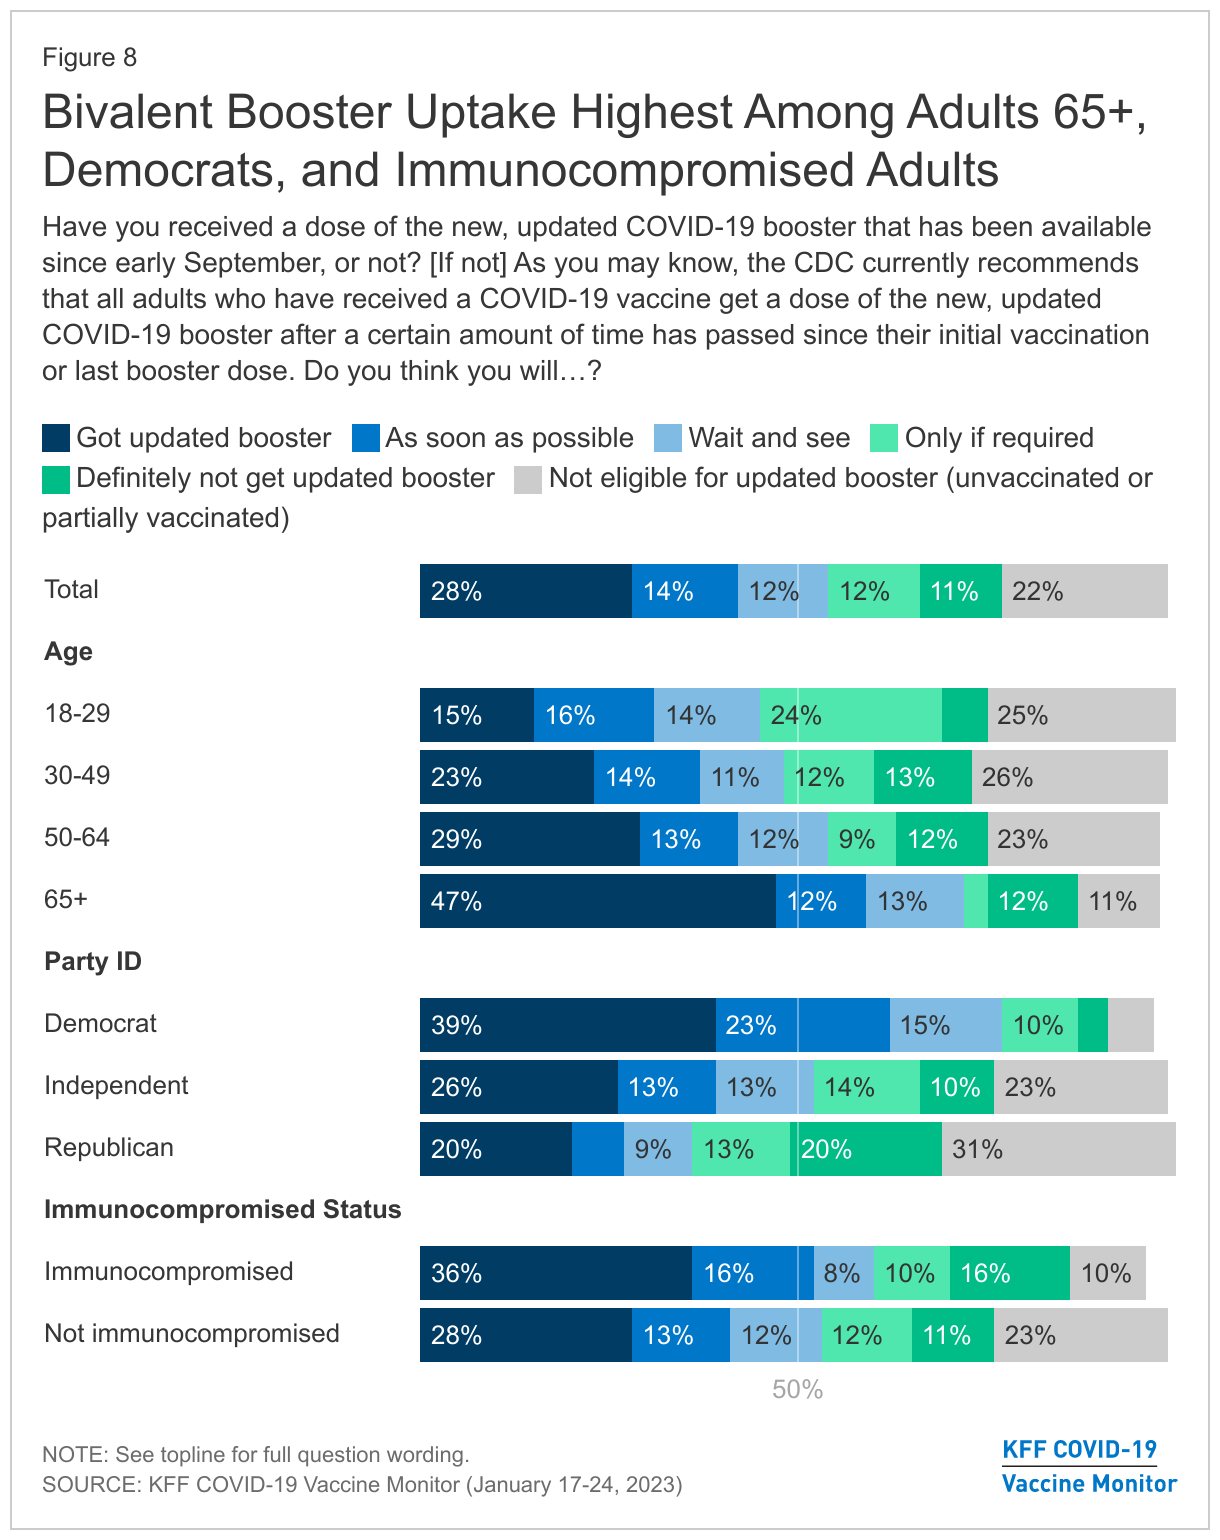
The Biden administration recently announced plans to target senior care facilities to further encourage uptake of the new booster among older adults. Nearly half (47%) of adults ages 65 and older say they have already gotten it, and a further one in ten (12%) say they plan to get it “as soon as possible.” Though relatively few (3%) say they will only get the updated vaccine if required, a further one in five adults 65 and older say either say they will “definitely not” get the updated booster (12%) or remain ineligible to receive it (11%), leaving a sizeable share of this vulnerable group without the protection of the vaccine.

Adults who say they are immunocompromised are no more likely to report that they have already received the updated bivalent booster than those who do not report being immunocompromised. About half of adults (52%) who say they are immunocompromised say they have either received the updated bivalent COVID-19 booster dose (36%) or that they plan to get it as soon as possible (16%).

The share of Democrats who have received the updated shot continues to outpace both Republicans and independents. However, the share of Democrats who say they have already gotten the booster (39%) has not changed since December (38%), while Republican uptake has increased. One in five Republicans (20%) now say they have gotten the updated booster compared to about one in ten last month (12%). Despite this uptick, overall Republican opposition to the booster remains staunch, as about half of the partisan group either say they will “definitely not” get the updated booster (20%) or are ineligible (31%) for the booster because they are either unvaccinated or are only partially vaccinated.

Bivalent Booster Uptake Highest Among Adults 65+, Democrats, and Immunocompromised Adults

Those who say they are worried about getting seriously sick from COVID-19 are more likely to have already received the updated bivalent booster (40%) than those who say they are not worried (23%).  However, for the most part, large majorities of those who have not been vaccinated or boosted for COVID-19, or received a flu shot this winter say the news of COVID-19, RSV, and the flu spreading this winter have not made much of a difference in their willingness to get these shots. Nearly nine in ten (87%) of those who are unvaccinated say the news has not made much of a difference in their likelihood of getting a shot. A similar share (82%) who have not gotten a flu shot for the current season also say the news has not made much of a difference in their likelihood to get a flu vaccine. However, about one in five adults (22%) who are vaccinated but haven’t gotten a COVID-19 booster dose say the news of the viruses spreading has made them more likely to get a COVID-19 booster.

Reasons For Not Getting The Updated Bivalent Booster

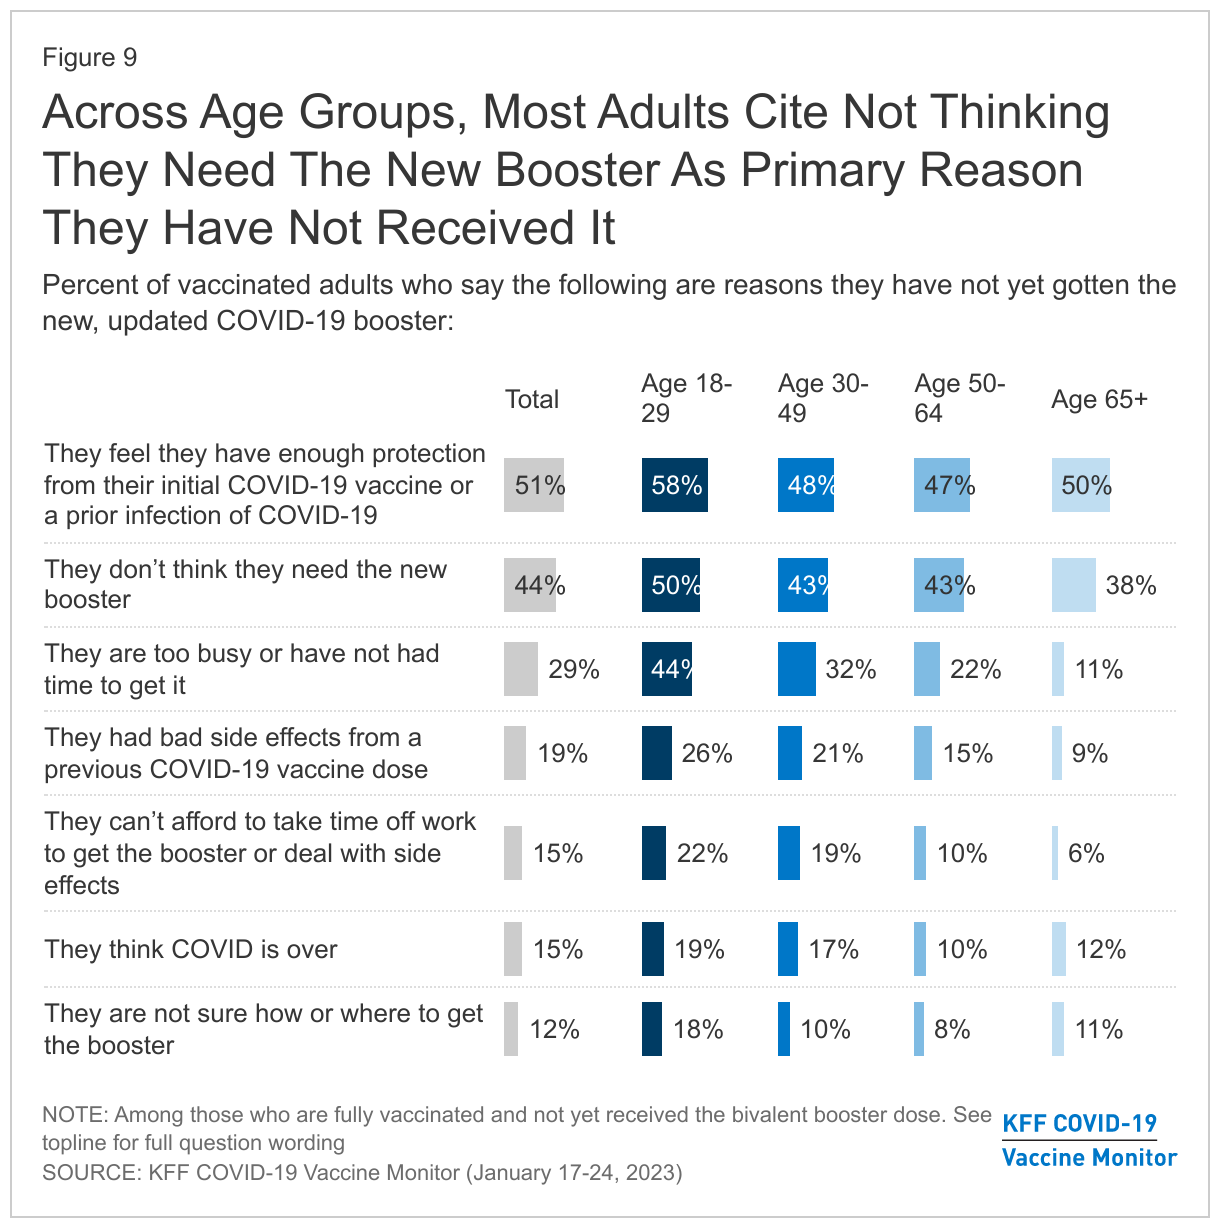
Adults who are vaccinated but have not yet received the updated bivalent booster cite a range of reasons for why they have not yet done so. About half (51%) say they feel they have enough protection from their initial COVID-19 vaccine or a prior infection of the virus, and about four in ten (44%) say they don’t think they need the new booster. Reflecting that there is still some interest in getting an updated dose, about three in ten (29%) say they are "too busy” or “have not had time to get it.” Other less frequently cited reasons include the nearly one in five (19%) of adults who say they had bad side effects from a previous COVID-19 dose, or they cannot afford to take time off work to get the booster or deal with the side effects of the vaccine (15%). Similar shares say they have not gotten an updated bivalent booster because they think “COVID is over” (15%), while about one in ten (12%) say they are not sure how or where to get the booster.

Reasons for not getting an updated booster shot vary little across age groups, though there are some notable exceptions. Compared to older adults, younger adults (ages 18-29) are significantly more likely to say they are too busy or have not had time to get it, or they had bad side effects from a previous dose. Despite the push from public health officials to boost adults 65 and older, half (50%) of vaccinated adults in this age group say they feel protected enough from a previous dose or prior infection, and nearly four in ten (38%) say they don’t think they need the new booster.

Across Age Groups, Most Adults Cite Not Thinking They Need The New Booster As Primary Reason They Have Not Received It

When asked in their own words for any other reason why they have not gotten a booster dose yet, few responses covered topics not already asked about explicitly. The most frequent cited other responses among those who are eligible but have not been boosted are concern about possible side effects of vaccination (7%). Less frequently mentioned responses include 4% say they distrust the vaccine, drug companies or the government, don’t think the vaccine is effective (3%), they need to wait to get a booster due to a recent COVID-19 infection or booster (3%), or didn’t know about the booster (1%). Another 5% gave a host of other reasons ranging from they are unclear if their insurance will cover the shot or not, to wanting to strengthen their immune system by other means, to that they think they are at low risk of complications from getting COVID.

In their own words: “Is there any other reason why have you not gotten another booster shot?”

“Covid is a virus, like the flu, that will be a part of our lives. I do not get flu vaccines and have chosen healthy ways to recover naturally and build natural immunity.” -50 year-old, female, Hispanic, Republican, Florida

“I didn’t know anything about it until now” –18 year-old, male, Hispanic, independent, California

“Unclear on insurance coverage” – 29 year-old, female, White, Democrat, Missouri

“I’ve had it twice now with no symptoms. I believe I don’t need it and am at low risk of complication from COVID.” – 40 year-old, female, White, Republican, Arizona

“I’ll get it if it’s extremely necessary” – 49 year-old, female, Hispanic, independent, Florida

“I am young and healthy and when I previously had COVID it was manageable. Additionally, I have the option to work remote so wouldn’t affect my job If I were to get it.” – 28 year-old, female, White, Democrat, Minnesota

“I keep forgetting to get it, I also don’t leave the house much so there’s a very small chance I catch it.” –20 year-old, male, Hispanic, other party, Ohio

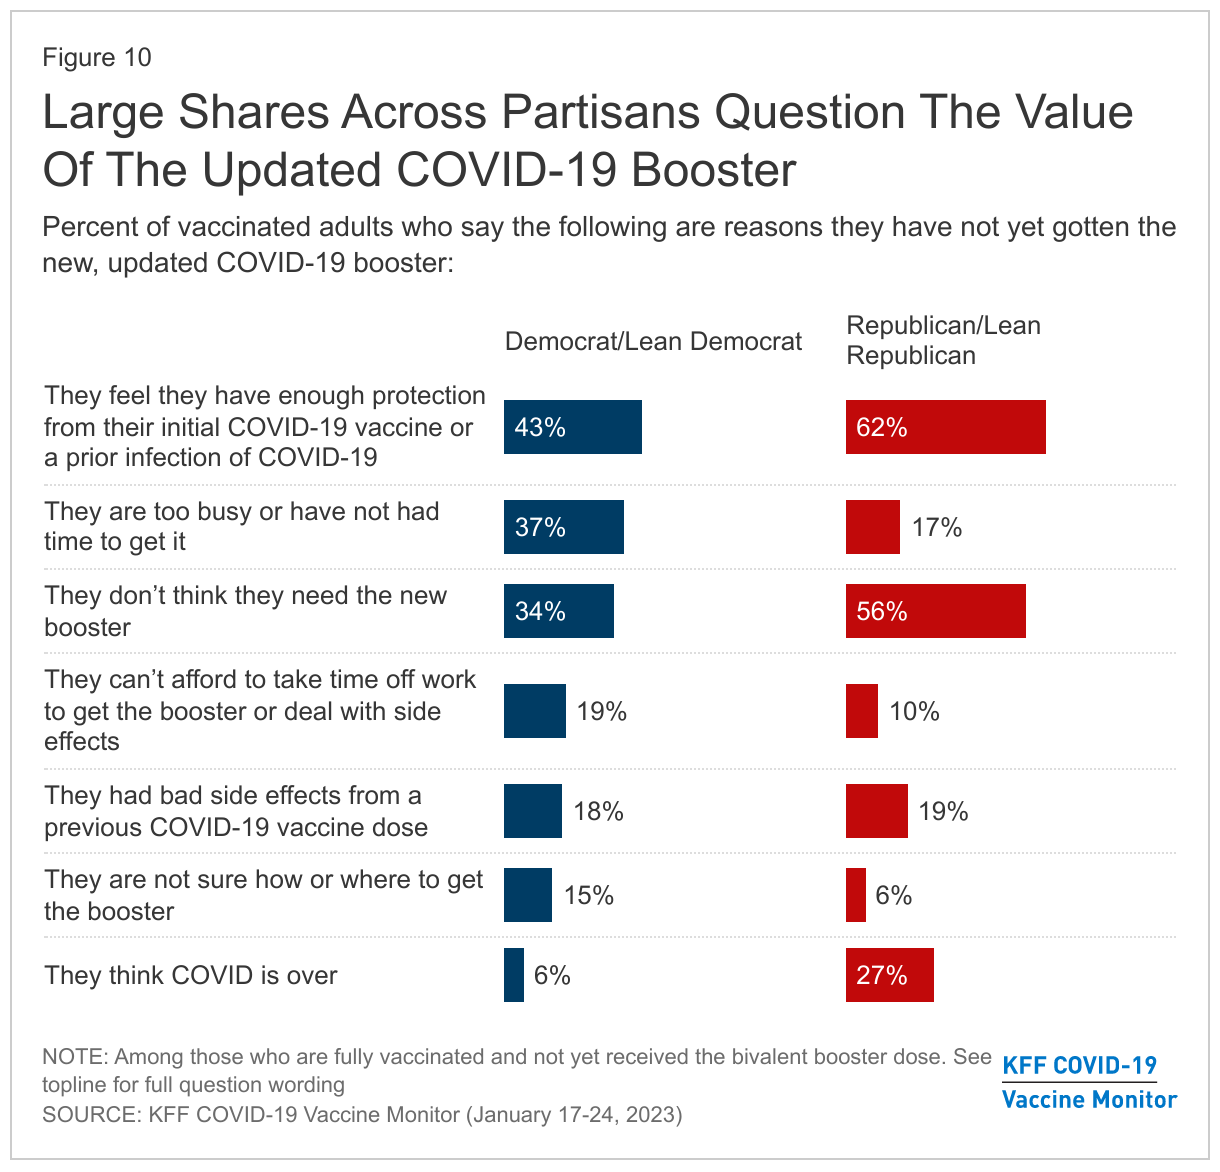
The top reasons given by those eligible for the new booster who have not yet gotten it are similar across partisans, but the share who say each reason varies. Majorities of Republicans or Republican-leaning independents say they have not gotten the booster because they feel they have enough protection from a previous dose or infection (62%), or they don’t think they need it (56%). These are also the top reasons given by Democrats and Democratic-leaning independents, but four in ten of this group (43%) say they feel they have enough protection and about one in three (34%) say they don’t think they need the new booster. Other reasons are more frequently mentioned by Democrats and Democratic-leaning independents than Republicans, including being too busy or not having time (37% vs. 17%), that they can’t afford to take time off work to get the booster or deal with side effects (19% vs. 10%), or they are not sure how or where to get the booster (15% vs. 6%). Notably, one-fourth (27%) of Republicans say they have not gotten a booster because they think “COVID is over.”

Large Shares Across Partisans  Question The Value Of The Updated COVID-19 Booster

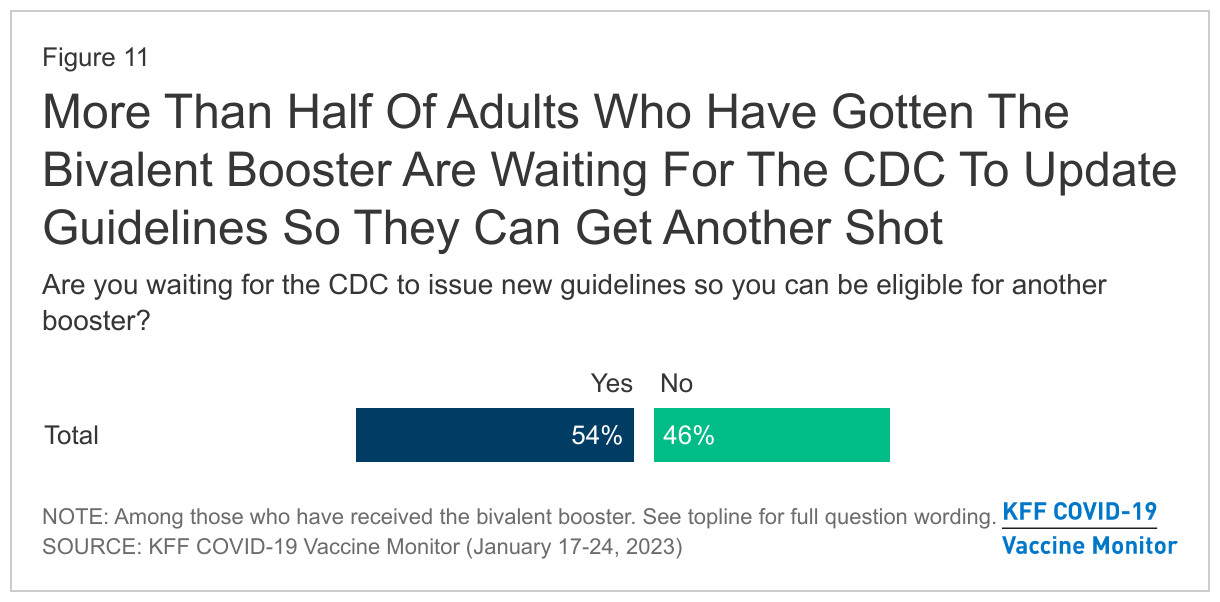
More Than Eight In Ten Boosted Adults Say It’s Important For Them To Get Another Booster, And More Than Half Say They Are Waiting On The CDC To Issue New Guidelines

While studies continue to investigate the longevity of the new updated bivalent booster, some consensus has emerged that immunity and protection against infection is likely short-term. The January COVID-19 Vaccine Monitor survey finds many who have already received the new booster are now eagerly awaiting guidance from the CDC about when they can be eligible for another shot. More than half (54%) of adults who have received the bivalent booster say they are waiting on the CDC to issue new guidelines so they can be eligible for another booster. Overall, 15% of U.S. adults say they are waiting on the CDC to issue new guidelines.

More Than Half Of Adults Who Have Gotten The Bivalent Booster Are Waiting For The CDC To Update Guidelines So They Can Get Another Shot

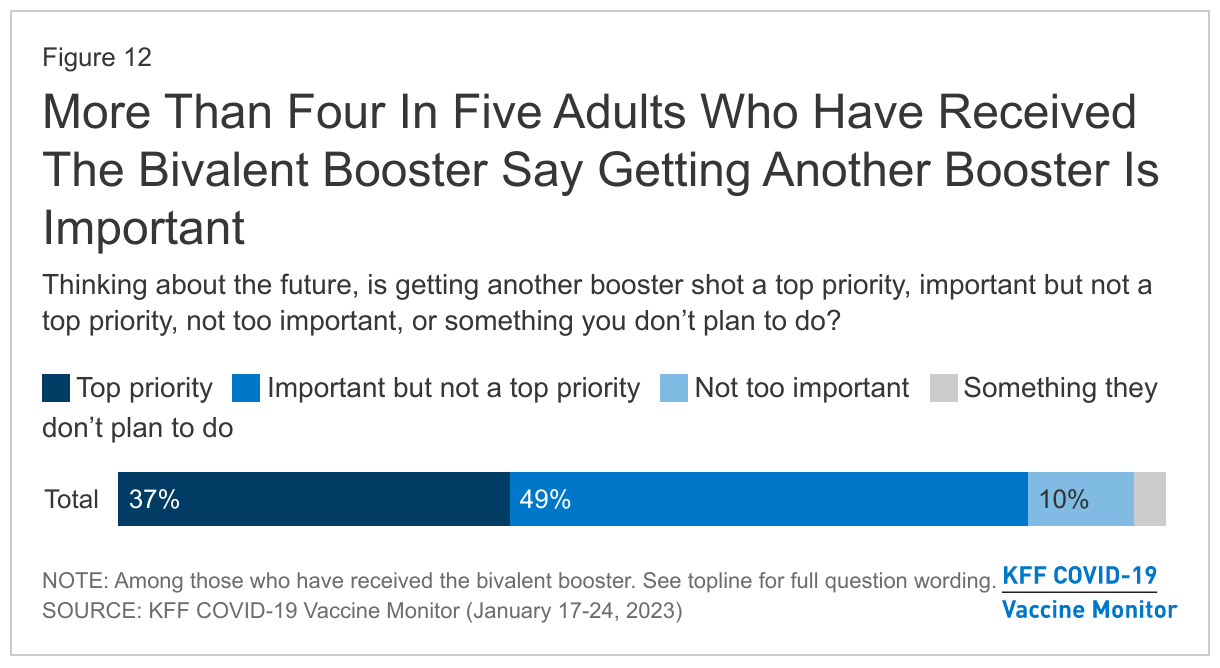
When asked about getting another booster shot in the future, the vast majority of adults (86%) who have already gotten the bivalent booster say it’s important, including more than one-third (37%) who say it is a “top priority” and half (49%) who say it is “important but not a top priority.” A further one in ten (10%) say it is “not too important,” while 3% say it is something they don’t plan to do.

More Than Four In Five Adults Who Have Received The Bivalent Booster Say Getting Another Booster Is Important

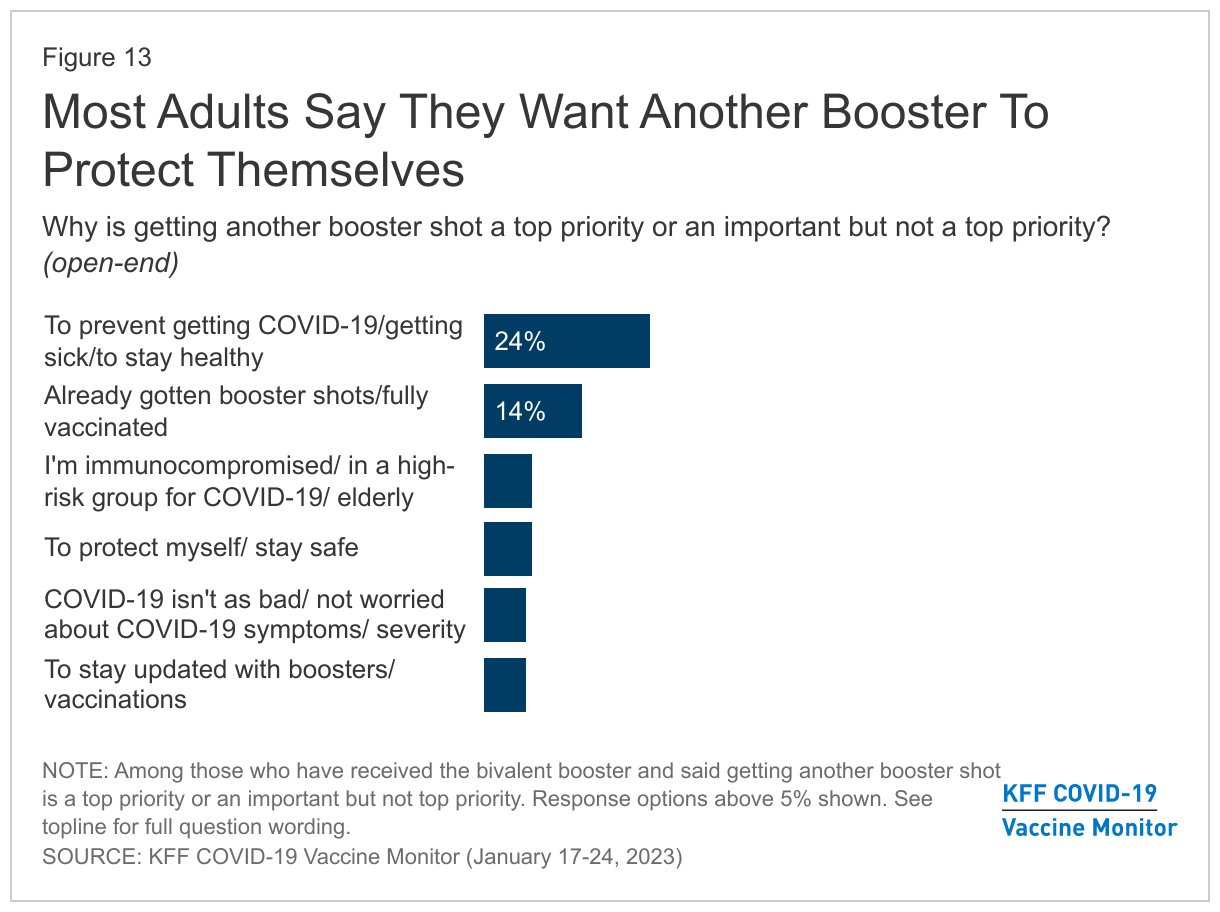
When asked why getting another booster shot is important to them, nearly all those asked provide responses related to the fact that they want to protect themselves from the virus. About one in four (24%) offer reasons like they want to get another shot to prevent getting COVID, to stay healthy, or avoid getting sick. Another 7% offer responses about wanting to protect themselves as much as possible, while a further 7% say they want another shot because they are immunocompromised, elderly, or in a high-risk group.

Other responses given about why getting another booster is a top priority or important but not a top priority touch on why boosted adults are not eager to get another one. About one in seven (14%) offer responses like they have already gotten multiple boosters and thus felt protected with the ones they have received thus far. Smaller shares gave other responses like that they don’t think COVID is that bad (6%), that it is a “mild disease.” Relatively few (13%) adults who have received the updated, bivalent booster say getting another shot is not too important or something they don’t plan to do, and explanations for why ranged from that they only get vaccinated as a condition of employment, to that they are unsure how effective the new booster is.

Most Adults Say They Want Another Booster To Protect Themselves

Methodology

This KFF Health Tracking Poll/COVID-19 Vaccine Monitor Poll was designed and analyzed by public opinion researchers at the Kaiser Family Foundation (KFF). The survey was conducted January 17 – January 24, 2023, online and by telephone among a nationally representative sample of 1,234 U.S. adults in English (1,180) and in Spanish (54). The sample includes 1,005 adults reached through the SSRS Opinion Panel either online or over the phone (n=25 in Spanish). The SSRS Opinion Panel is a nationally representative probability-based panel where panel members are recruited randomly in one of two ways: (a) Through invitations mailed to respondents randomly sampled from an Address-Based Sample (ABS) provided by Marketing Systems Groups (MSG) through the U.S. Postal Service’s Computerized Delivery Sequence (CDS); (b) from a dual-frame random digit dial (RDD) sample provided by MSG. For the online panel component, invitations were sent to panel members by email followed by up to three reminder emails. 980 panel members completed the survey online and panel members who do not use the internet were reached by phone (25).

Another 229 (n=29 in Spanish) interviews were conducted from a random digit dial telephone sample of prepaid cell phone numbers obtained through MSG. Phone numbers used for the prepaid cell phone component were randomly generated from a cell phone sampling frame with disproportionate stratification aimed at reaching Hispanic and non-Hispanic Black respondents. Stratification was based on incidence of the race/ethnicity groups within each frame. Respondents in the phone samples received a $15 incentive via a check received by mail, and web respondents received a $5 electronic gift card incentive (some harder-to-reach groups received a $10 electronic gift card).

The online questionnaire included two questions designed to establish that respondents were paying attention. Cases that failed both attention check questions, those with over 30% item non-response, and cases with a length less than one quarter of the mean length by mode were flagged and reviewed. Cases were removed from the data if they failed two or more of these quality checks. Based on this criterion, no cases were removed.

The combined cell phone and panel samples were weighted to match the sample’s demographics to the national U.S. adult population using data from the Census Bureau’s 2021 Current Population Survey (CPS). Weighting parameters included sex, age, education, race/ethnicity, region, and education. The sample was weighted to match patterns of civic engagement from the September 2017 Volunteering and Civic Life Supplement data from the CPS and to match frequency of internet use from the National Public Opinion Reference Survey (NPORS) for Pew Research Center.  Finally, the sample was weighted to match patterns of political party identification based on a parameter derived from recent ABS polls conducted by SSRS polls. The weights take into account differences in the probability of selection for each sample type (prepaid cell phone and panel). This includes adjustment for the sample design and geographic stratification of the cell phone sample, within household probability of selection, and the design of the panel-recruitment procedure.

The margin of sampling error including the design effect for the full sample is plus or minus 4 percentage points. Numbers of respondents and margins of sampling error for key subgroups are shown in the table below. For results based on other subgroups, the margin of sampling error may be higher. Sample sizes and margins of sampling error for other subgroups are available by request. Sampling error is only one of many potential sources of error and there may be other unmeasured error in this or any other public opinion poll. Kaiser Family Foundation public opinion and survey research is a charter member of the Transparency Initiative of the American Association for Public Opinion Research.

GroupN (unweighted)M.O.S.E.
Total1,234± 4 percentage points
Race/Ethnicity
White, non-Hispanic683± 5 percentage points
Black, non-Hispanic172± 11 percentage points
Hispanic281± 9 percentage points
 
Party identification
Democrat376± 7 percentage points
Republican317± 7 percentage points
Independent360± 7 percentage points
Democrats/Democratic-leaning independents562± 6 percentage points
Republicans/Republican-leaning independents451± 6 percentage points
Immunocompromised
Immunocompromised126± 12 percentage points
Not immunocompromised1,104± 4 percentage points
Gender
Total men565± 5 percentage points
Total women656± 5 percentage points
Women ages 18-49349± 7 percentage points
Women ages 50+307± 7 percentage points

Endnotes

  1. This is based upon adults who in the January 2023 KFF COVID-19 Vaccine Monitor survey reported they have ever been told by a doctor or health care provider that they are immunocompromised, or have a weakened or compromised immune system due to a disease, treatment, or medication they take. Estimates among immunocompromised people may differ from other clinical estimates of the share of immunocompromised adults based on specific conditions. ↩︎
  2. KFF’s COVID-19 Vaccine Monitor data on vaccine and bivalent booster uptake is based on self-reported responses and may differ data from the Centers for Disease Control which is based on administered doses reported by specific jurisdictions and providers. ↩︎
News Release

Nearly Four in Ten Say Their Households Were Sick with COVID-19, the Flu, or RSV Recently Even as Most People Say They Aren’t Too Worried About Getting Seriously Ill

In virus season, 46% of adults say they’re likely to take at least one protective measure, such as masking; immunocompromised people are inclined to do more

Published: Feb 7, 2023

Booster update remains modest; half of those already boosted are waiting for updated CDC guidelines to get another dose

Nearly four in ten (38%) people say their households were affected by this winter’s triple threat of viruses, with someone getting sick with the flu, COVID-19, or respiratory syncytial virus (RSV), and nearly half (46%) say the news of these three viruses spreading has made them more likely to wear masks or take other precautions to avoid getting sick, the latest KFF COVID-19 Vaccine Monitor survey finds.

At the same time, almost three years into the COVID-19 pandemic, most of the public says they are “not too” or “not at all” worried about getting seriously ill from the virus (69%), though 31% still say they are worried. That’s somewhat more than say the same about the flu (26%) or RSV (25%).

The flu affected the largest share of households over the past month or so (27%), with smaller shares saying someone in their homes got sick with COVID-19 (15%) or RSV (10%).

A relatively small share (14%) of adults in households affected by COVID-19 say they tried to get Paxlovid, the anti-viral prescription pill used to treat COVID-19. Similarly, among those households affected by the flu, 16% say they tried to get Tamiflu, an antiviral prescription medicine used to treat the flu.

Amid media reports of shortages of over-the-counter medicines often used to treat symptoms of these ailments, the survey finds that 75% of adults in affected households tried to obtain over-the-counter medicines such as Tylenol or cough syrup, including about one in five (representing 6% of all adults) who say they had difficulties getting that medicine.

News about the three viruses also made some people more likely to take preventive measures such as wearing a mask in public (31%), avoiding large gatherings (26%), traveling less (20%), or avoiding eating indoors at restaurants (18%).

People who say they are immunocompromised are more likely than those who aren’t to take many of those extra precautions. In addition, Black and Hispanic adults are more likely than White adults, and Democrats are more likely than Republicans, to say they are more likely to modify their behavior.

Nearly 3 in 10 Adults Now Say They’ve Gotten Updated Bivalent Booster Shot

As the federal government prepares to end its public health emergency declaration, the latest survey finds nearly three in ten (28%) adults report having received an updated COVID-19 bivalent vaccine booster shot, up slightly from December (22%). The increase largely reflects a shift in booster rates among Republicans (from 12% in December to 20% in January, though Democrats still are twice as likely to have gotten the updated booster (39%).

Among high-risk groups, nearly half (47%) of adults at least 65 years old, and about a third (36%) of those who are immunocompromised, say they have already received a bivalent booster dose.

Those who already received a bivalent booster are eager to get an additional booster in the future. The vast majority (86%) say that getting another shot is important to them, and just over half (54%) say they are waiting for the Centers for Disease Control and Prevention (CDC) to issue new guidelines to make them eligible for another booster.

On the other side, vaccinated adults who have not gotten the bivalent booster yet cite a number of reasons for why they haven’t done so.  Half (51%) say they feel they have enough protection from their initial vaccination or a prior infection, and nearly as many (44%) say they don’t think they need the new booster.

Smaller shares say that they have been too busy or have not had the time to get the updated booster (29%), that they had bad side effects from a previous dose (19%), or that they cannot afford to take time off work to get the shot and deal with side effects from the vaccine (15%).

Designed and analyzed by public opinion researchers at KFF, the survey was conducted from January 17-24, 2023, online and by telephone among a nationally representative sample of 1,234 U.S. adults, in English and in Spanish. The margin of sampling error is plus or minus 4 percentage points for the full sample. For results based on other subgroups, the margin of sampling error may be higher.

The KFF COVID-19 Vaccine Monitor is an ongoing research project tracking the public’s attitudes and experiences with COVID-19 vaccinations. Using a combination of surveys and qualitative research, this project tracks the dynamic nature of public opinion as vaccine development and distribution unfold, including vaccine confidence and acceptance, information needs, trusted messengers and messages, as well as the public’s experiences with vaccination.

The End of the COVID-19 Public Health Emergency: Details on Health Coverage and Access

Published: Feb 3, 2023

On Jan. 30, 2023, the Biden Administration announced it will end the public health emergency (and national emergency) declarations on May 11, 2023. Here’s what major health policies will and won’t change when the public health emergency ends.

Vaccines

What’s changing: Nothing. The availability, access, and costs of COVID-19 vaccines, including boosters, are determined by the supply of federally purchased vaccines, not the public health emergency.

What’s the same: As long as federally purchased vaccines last, COVID-19 vaccines will remain free to all people, regardless of insurance coverage. Providers of federally purchased vaccines are not allowed to charge patients or deny vaccines based on the recipient’s coverage or network status.

Although a federal rule temporarily required private insurers to reimburse out-of-network providers for vaccine administration during the public health emergency, vaccine access will be unaffected by insurers ending these payments, as long as federal supplies last, because vaccine providers are not allowed to deny anyone a federally purchased vaccine based the recipient’s coverage or network status and must not charge any out-of-pocket costs.

Due to the Affordable Care Act and other recent legislation, even after the federal supply of vaccines is gone, vaccines will continue to be free of charge to the vast majority of people with private and public insurance. However, costs may become a barrier for uninsured and underinsured adults when federally purchased doses are depleted, and privately insured people may then need to confirm their provider is in-network. For more on what happens after the federal supply of vaccines runs dry, see our briefs on the commercialization of COVID vaccines and the expected growth in prices for COVID vaccines.

Importantly, the Food and Drug Administration (FDA)’s emergency use authorizations for COVID-19 vaccines (and treatments and tests) will remain in effect, as they are tied to a separate emergency declaration, not the public health emergency that ends in May.

At-home COVID tests

What’s changing: At-home (or over-the-counter) tests may become more costly for people with insurance. After May 11, 2023, people with traditional Medicare will no longer receive free, at-home tests. Those with private insurance and Medicare Advantage (private Medicare plans) no longer will be guaranteed free at-home tests, but some insurers may continue to voluntarily cover them.

For those on Medicaid, at-home tests will be covered at no-cost through September 2024. After that date, home test coverage will vary by state.

A temporary Medicaid coverage option adopted by 15 states has given uninsured people access to COVID-19 testing services, including at-home tests, without cost-sharing but that program will end with the public health emergency.

What’s the same: Uninsured people in most states were already paying full price for at-home tests as they weren’t eligible for the temporary Medicaid coverage for COVID testing services. Uninsured and other people who cannot afford at-home tests may still be able to find them at a free clinic, community health center, public health department, library, or other local organization. Additionally, some tests have been provided by mail through the federal government, though supply is diminishing.

PCR and rapid tests ordered or administered by a health professional

What’s changing: Although most insured people will still have coverage of COVID tests ordered or administered by a health professional, these tests may no longer be free.

  • For people with traditional Medicare, there will be no cost for the test itself, but there could be cost-sharing for the associated doctor’s visit.
  • For people with Medicare Advantage and private insurance, the test and the associated doctor’s visit both might be subject to cost-sharing, depending on the plan. Additionally, some insurers might begin to limit the number of covered tests or require tests be done by in-network providers. People in grandfathered or non-ACA-compliant plans will have no guarantee of coverage for tests and may have to pay full-price.
  • For people with Medicaid, there will continue to be free tests through September 2024, after which point, states may limit the number of covered tests or impose nominal cost-sharing.
  • Uninsured people in the 15 states that have adopted the temporary Medicaid coverage option will no longer be able to obtain COVID-19 testing services, including at-home tests, with no cost-sharing as this program ends with the public health emergency.

What’s the same: Uninsured people in most states were not eligible for the temporary Medicaid pathway for COVID testing and therefore will continue to pay full price for tests unless they can get tested through a free clinic or community health center.

COVID Treatment

What’s changing: People with public coverage may start to face new cost-sharing for pharmaceutical COVID treatments (unless those doses were purchased by the federal government, as discussed below). Medicare beneficiaries may face cost-sharing requirements for certain COVID pharmaceutical treatments after May 11. Medicaid and CHIP programs will continue to cover all pharmaceutical treatments with no-cost sharing through September 2024. After that date, these treatments will continue to be covered; however, states may impose utilization limits and nominal cost-sharing.

What’s the same: Any pharmaceutical treatment doses (e.g. Paxlovid) purchased by the federal government are still free to all, regardless of insurance coverage. This is based on the availability of the federal supply and is not affected by the end of the public health emergency.

Most insured people already faced cost-sharing for hospitalizations and outpatient visits related to COVID treatment. Private insurers were never required to waive cost-sharing for any COVID treatment. Though some did so voluntarily, most insurers had already phased out these waivers more than a year ago.

Telemedicine

What’s changing: Some flexibilities associated with providing health care via telehealth during the public health emergency will end.

  • During the public health emergency, providers writing prescriptions for controlled substances were allowed to do so via telemedicine, but in-person visits will be required after May 11.
  • Because of the pandemic, all states and D.C. temporarily waived some aspects of state licensure requirements so that providers with equivalent licenses in other states could practice remotely via telehealth. Some states tied those policies to the end of the federal public health emergency so those policies may end unless those states change their policy.
  • The Department of Health and Human Services temporarily waived penalties against providers using technologies that don’t comply with federal privacy and security rues in the provision of telehealth services during the public health emergency. Enforcement of these rules when the public health emergency ends will restrict the provision of telehealth to so-called “HIPAA compliant” technologies and communication productions.

What’s the same: Expanded telehealth for Medicare beneficiaries was once tied to the public health emergency but, due to recent legislation, will remain unchanged through December 31, 2024. Most private insurers already covered telemedicine before the pandemic. In Medicaid, states have broad authority to cover telehealth without federal approval. Most states have made, or plan to make, some Medicaid telehealth flexibilities permanent.

Discussion

Overall, the widest ranging impact from the end of the public health emergency will likely be higher costs for COVID tests – both at-home tests and those performed by clinicians. As many Americans delay or go without needed care due to cost, the end of free COVID tests could have broad implications for the people’s ability to get timely COVID diagnoses or prevent transmission. Other changes to health policies that are tied to the public health emergency, national emergency, and other declarations are discussed in more detail in our earlier brief.

Further, and potentially more significant, changes will come when federal supplies of vaccines, treatments, and tests are depleted, though the timing of that is yet to be determined and is not tied to the public health emergency. The Biden administration has announced that it has no further funding for vaccines, tests, or treatments, and that Congress would need to make more funding available.

Importantly, continuous enrollment for Medicaid enrollees – which has led to record-high enrollment in Medicaid – was once tied to the end of the public health emergency. However, recent legislation decoupled this provision from the public health emergency and ends continuous enrollment on March 31, 2023. States can begin disenrolling people from Medicaid as early as April 1, 2023, though most states will take a year to complete these disenrollments. KFF has estimated that millions of people will lose Medicaid coverage during this unwinding period.

Gaps in Mental Health Care for Asian and Pacific Islander People and Other People of Color

Published: Feb 2, 2023

This year, the marking of Lunar New Year was marred by yet another tragic mass shooting in Monterey Park, California, which was closely followed by a second mass shooting in Half Moon Bay, California. Many, but not all, of the victims of both shootings were Asian, as were the perpetrators. These shootings occurred against the backdrop of rising racism and discrimination and hate crimes against Asian people amidst the pandemic. Motives for both shootings remain under investigation and mental illness is not a strong predictor of such shootings. However, as efforts are made to help the victims recover and to respond to the broader ripple effects of violence on the health and well-being in these communities, it is important to consider how our health care system meets the mental health care needs of Asian and Native Hawaiian and other Pacific Islander (NHOPI) people and other people of color and gaps that could be addressed to improve their care. This policy watch provides insight into these issues.

The COVID-19 pandemic has contributed to and coincided with worsening mental health across the population, including Asian and NHOPI people. In addition to the negative health and economic impacts of the pandemic experienced across the population, Asian people also have experienced increased discrimination and hate crimes, which research suggests have negatively impacted their mental health. These issues are not new, as Asian and NHOPI people have faced longstanding racism and discrimination among other challenges, including exclusionary immigration policies, internment, and stresses associated with the model minority stereotype, and acculturation. These experiences are linked to poor mental health.

Overall rates of mental illness are generally lower among Asian people compared to White people, but this may reflect underdiagnosis and undertreatment among the population. In 2021, 16% of Asian adults reported any mental illness in the past year compared to 24% of White adults; there was no statistically significant difference in rates of mental illness between NHOPI and White adults. The lower rate of mental illness among Asian adults may be reflective of underdiagnosis and underreporting. It also may mask variations in mental illness rates among subgroups of the population. Among people with mental illness, Asian people are less likely to utilize mental health services compared to other racial and ethnic groups. In 2021, among adults with any mental illness in the past year, only 25% of Asian adults reported receiving mental health services compared to 52% of White adults (Figure 1). Data on utilization were not available for NHOPI people. Moreover, data show rising rates of suicide death among Asian and Pacific Islander adolescents (ages 12-17). Although they have lower rates of suicide death compared to their White peers, suicides were the leading cause of death among Asian and Pacific Islander adolescents in 2020, and suicide death rates more than doubled among this population from 2010 (2.2 per 100,000) to 2020 (5.0 per 100,000).

Share of Adults (Ages 18 and up) with Any Mental Illness Who Received Mental Health Services in the Past Year, 2021

Gaps in the mental health care system pose an array of challenges to accessing care for Asian and NHOPI people. While stigma and cultural attitudes towards mental health are factors that may lead to lower reporting of mental health concerns and service utilization among Asian people, it is also important to consider how the health care system shapes their ability to identify needs and access care. For example, research points to the lack of a diverse mental health provider workforce and the absence of culturally informed treatment options for Asian people, which may contribute to lower utilization. Moreover, the Asian population is not a monolith. There is wide variation in the characteristics of Asian and NHOPI people that affects their experiences, health needs, and ability to access health care. Overall, over one in four Asian people is a noncitizen and nearly one in three speaks English less than very well, with even higher rates among some subgroups. Noncitizens and individuals with limited English proficiency may face increased barriers to accessing care, including immigration-related fears and lack of access to linguistically appropriate services. Additionally, some subgroups of Asian and NHOPI people have higher uninsured rates and are more likely to face social and economic challenges that may pose logistical and financial challenges to accessing care.

Research and data to understand mental health needs and care among Asian and NHOPI people remains limited. Many datasets have small samples of data for Asian and NHOPI people and some report data for these individuals in a combined group, limiting the ability to examine experiences of NHOPI people and variations in experiences among Asian subgroups. Moreover, some research suggests that underreporting of mental health concerns among Asian people in national survey data may, in part, be due to limited survey language options. Smaller studies offered in multiple languages have identified greater mental health concerns and underutilization of mental health services among Asian people.

Response to the victims and communities affected by recent mass shooting tragedies has turned national attention and focus to mental health care for Asian and NHOPI people, groups that too often remain overlooked and left out of data and policy discussions related to health disparities. As efforts unfold to assist the victims and prevent and respond to future events, it will be key to reflect on how the system can adapt to better meet the needs of a diverse population, including Asian and NHOPI people.

This work was supported in part by Well Being Trust. KFF maintains full editorial control over all of its policy analysis, polling, and journalism activities.

News Release

Medicare Advantage Plans Denied 2 Million Prior Authorization Requests in 2021, About 6% of Such Requests

Published: Feb 2, 2023

Medicare Advantage plans denied two million prior authorization requests for health care services in whole or in part in 2021, or about six percent of the 35 million requests submitted on behalf of enrollees that year, a new KFF analysis finds.

Prior authorization is intended to ensure that health care services are medically necessary by requiring providers to obtain approval before a service or other benefit is covered. While prior authorization has long been used to contain spending and prevent people from receiving unnecessary or low-value services, there are some concerns that it may create barriers to receiving necessary care. (Traditional Medicare does not require prior authorization except for a limited set of services.)

The analysis also finds variations in both the volume of prior authorization requests and denial rates across insurers. In general, insurers with higher numbers of prior authorization requests denied a lower share of those requests. The variation across insurers likely reflects differences in the services subject to prior authorization and the frequency with which contracted providers are exempted from these requirements, as well as variations in the use of other tools to manage utilization by plan enrollees.

Only about 11 percent of denials of prior authorization requests were appealed, the analysis finds. However, of the appeals that were filed, the vast majority (82%) resulted in fully or partially overturning the initial denial.

The high rate of successful appeals raises questions about whether a larger share of the initial prior authorization requests should have been approved. Alternatively, it could reflect problems with documentation that were subsequently rectified during the appeal. In either case, medical care ordered by physicians or other practitioners ultimately deemed necessary by the insurers was potentially delayed by the prior authorization process.

As Medicare Advantage enrollment continues to grow, a better understanding of prior authorization will help inform how the policy affects the use of health care services and the quality of the care that beneficiaries receive.

News Release

The Public, Including Women of Childbearing Age, Are Largely Confused About the Legality of Medication Abortion and Emergency Contraceptives in Their States

Even in States Where Abortion is Legal, Many are Uncertain about Legality of Medication Abortion

Published: Feb 1, 2023

More than six months since the Supreme Court issued their Dobbs decision which overturned Roe v. Wade, there is widespread public confusion about the medication abortion pill and whether it is legal at the state level, according to the latest KFF Health Tracking Poll. The poll also finds many are unsure about the legality of emergency contraceptive pills, sometimes called morning after pills or “Plan B,” and whether the pills can end a pregnancy.

Across the country at least four in ten U.S. adults say they are “not sure” whether mifepristone, the medication abortion drug, is legal where they live. Half of women (49%) are “unsure” about whether medication abortion is legal in the state they live in, including 41% of women ages 18-49.

In the 13 states where there are full abortion bans, including for medication abortion, most adults either wrongly believe that medical abortion is legal in their state (13%) or are “unsure” about whether it is legal or not (47%). Four in ten adults living in states with full abortion bans are aware medication abortion is illegal in their state.

In states where abortion is legal, fewer than half (44%) are aware that medication abortion is legal there. A similar share (44%) is “unsure” whether medication abortion is legal in their state, while one in ten incorrectly believe medication abortion is not legal in their state.

On January 3, the FDA approved a protocol to allow pharmacies that have been certified by the manufacturers to dispense mifepristone directly to the patients, with a prescription. Previously, the pills could be dispensed only by a certified healthcare provider and were not available through a retail pharmacy. Three-quarters of adults (73%) have not heard anything in the news about the decision, including nearly eight in ten (77%) women under the age of 50.

Awareness Of Plan B Is Widespread, But Many Are Unsure About Its Legality and Whether It Ends A Pregnancy

Most U.S. adults (93%) have heard of the morning after pill or “Plan B” and 62% who have heard of it are aware that the pills are not the same as the abortion pill. Nonetheless, a substantial share (73%) incorrectly think that emergency contraceptive pills can end a pregnancy in its early stages. This includes two-thirds of women of childbearing age (18-49) who incorrectly say emergency contraceptive pills can end a pregnancy in its early stages.

Emergency contraceptives like “Plan B” are legal in all 50 states. However, a third of adults (32%) say they are “unsure” if emergency contraceptive pills, or “Plan B,” are legal in their state or not, and five percent of adults incorrectly think emergency contraceptive pills are illegal in their state. Large shares of women, especially those under the age of 50, are among the groups most likely to be aware that emergency contraceptive pills are legal in their state but even among this group, about a quarter are either unsure about the legality of “Plan B” or incorrectly believe they are illegal. Confusion is more widespread in states where abortions are currently banned, with more than half of people living in those states, including half of women, unaware that “Plan B” is still legal.

Designed and analyzed by public opinion researchers at KFF, the survey was conducted from January 17-24, 2023, online and by telephone among a nationally representative sample of 1,234 U.S. adults, in English and in Spanish. The margin of sampling error is plus or minus 4 percentage points for the full sample. For results based on other subgroups, the margin of sampling error may be higher.

Poll Finding

KFF Health Tracking Poll: Early 2023 Update On Public Awareness On Abortion and Emergency Contraception

Published: Feb 1, 2023

Findings

Key Findings

  • The legality of medication abortion (mifepristone and misoprostol) and emergency contraceptives are a big source of confusion for adults in the U.S., including among women ages 18-49, who are their primary users. About half of adults report they are “unsure” as to whether medication abortion is legal in their state, including 41% of women ages 18 to 49. In addition, one in eight adults (13%), including one in 10 women, living in states where abortion is currently banned incorrectly believe medication abortion is legal in their state.
  • A popular type of emergency contraceptive pills, known commonly as the morning after pill or “Plan B,” is currently legal in all U.S. states and available over the counter, but a third of adults (32%) say they are “unsure” if emergency contraceptive pills are legal in their state and five percent incorrectly think emergency contraceptive pills are illegal in their state. Half of women living in states where abortion is currently banned either incorrectly think emergency contraceptive pills are illegal in their state (7%) or say they are unsure (43%).
  • Less than half of the public (39%) are aware that in states where abortion is legal, a prescription is still required in order to get medication abortion, including 44% of women ages 18-49. This leaves about six in ten either incorrectly saying a prescription is not needed (11%) or saying they are not sure whether a prescription is needed or not (49%).
  • A recent FDA policy change allows pharmacies that have been certified by the manufacturer to dispense mifepristone, or medication abortion pills, to patients who have a prescription. Three-quarters of adults (73%) have not heard anything in the news regarding the new option. This includes nearly eight in ten (77%) women under the age of 50, the most widely impacted group.

Awareness Around Legality and Availability of Medication Abortion in Post-Roe America

More than six months since the Supreme Court issued their Dobbs decision which overturned Roe v. Wade, the latest KFF Health Tracking Poll finds widespread public confusion around the use of mifepristone, the medication abortion pill, and the legality of the medication in their state.

Three in ten adults (31%) have heard of mifepristone, which accounts for more than half of all abortions in the U.S., including about half of women ages 18-49 (46%) have heard of the medication abortion pill.

Since the overturning of Roe, medication abortion has been the focus of policy debates at the state and federal level, yet there is widespread confusion on whether medication abortion is legal or illegal in states. Whether or not medication abortion is legal depends on state laws. Thirteen states have full bans on all abortions, which include both procedural and medication abortions. Across all states, at least four in ten U.S. adults say they are “not sure” whether the medication is legal where they live. Half of women (49%) are unsure as to whether medication abortion is legal in the state they live in, including 41% of women ages 18-49, and at least half of women ages 50 and older (58%), Black women (57%), Hispanic women (51%), and 48% of White women.

Women with lower levels of education are more likely to say they are “unsure” about the legality of medication abortion in their state, with over half (56%) of women without a college degree saying they aren’t sure if it’s legal or not, compared to four in ten (38%) of women with a college degree or higher.

About half (47%) of adults living in one of the states where abortion is banned are “unsure” whether medication abortion is legal in their state with an additional one in ten (13%) incorrectly believing medication abortion is legal in their state. Four in ten adults living in states with full abortion bans are aware medication abortion is illegal in their state. Most women living in states with full abortion bans either say they aren’t sure of the legality of medication abortion (50%) or incorrectly believe it is legal (10%).

There is also uncertainty about the legality of medication abortion in states without full abortion bans. Almost half (44%) of people living in those states said they are “unsure” whether medication abortion is legal in their state, while the same share are aware that medication abortion is legal in their state. One in ten adults living in states where abortion is legal incorrectly believe medication abortion is not legal in their state.

Nearly Half Of Adults Aren't Sure If Medication Abortion Is Legal In Their State

Over Half Are Unsure Or Incorrectly Say Medication Abortion Doesn’t Require A Prescription

The FDA requires medication abortion pills to be prescribed by a certified clinician. They have never been available over the counter. However, many people are uncertain about whether a prescription is required in order to get medication abortion. Two in five adults (39%) correctly identify that a prescription is still required to get a medication abortion. This leaves about six in ten either incorrectly saying a prescription is not needed (11%) or saying they are not sure (49%). More than half of women ages 18-49 either incorrectly think a prescription is not needed in order to get medication abortion pills (10%) or say they are “unsure” (46%).

Larger shares of college educated women than those without a college degree know that a prescription is required for medication abortion in states where abortion is legal, with about half of women with a college degree (51%) who say so compared to about a third (34%) of women without a college education.

Half Of Adults Aren't Sure If Medication Abortion Requires A Prescription

Until December 2021, the FDA only permitted medical providers that were certified by the manufacturer to dispense mifepristone, the abortion pill, to patients in-person. In 2021, the FDA removed the in person dispensing requirement and expanded the distribution to include certified pharmacies in addition to certified clinicians. On January 3, 2023, the FDA formally approved a new protocol to certify pharmacies to dispense mifepristone directly to the patients, in-store or by mail, to people who have a prescription for it. CVS and Walgreens have announced their intent for certain pharmacies to become certified to dispense mifepristone.

Three-quarters of adults (73%) have not heard anything in the news regarding the updated FDA policy allowing certified pharmacies to dispense medication abortion pills to patients who have a prescription. This includes nearly eight in ten (77%) women under the age of 50.

A slightly larger share of Democratic women than Republican or independent women have heard of the new FDA policy that would impact how abortion pills are dispensed, with a third of women who identify as Democrats who have heard of the new policy compared to around two in ten Republican women (21%) and independent women (19%).

Three In Four Adults Have Not Heard Of New FDA Policy Allowing Certified Pharmacies To Dispense Medication Abortion Pills

Awareness Of Emergency Contraceptive Pills Is Widespread, But Many Are Unsure About Its Legality and Whether Or Not It Can End A Pregnancy

The vast majority of U.S. adults (93%) have heard of emergency contraceptive (EC) pills, sometimes called the morning after pill or “Plan B.” Yet, while most adults have heard of the pills, knowledge gaps remain when it comes to accessing the medication and how it works.

Eight in ten (81%) of those who have heard of emergency contraceptive pills are aware that some types are available over-the-counter without a doctor’s prescription. In addition, a majority (62%) are aware emergency contraceptive pills are not the same as the abortion pill. However, a substantial share (73%) incorrectly think that emergency contraceptive pills can end a pregnancy in its early stages, while 27% know it can’t. This includes two-thirds (66%) of women ages 18-49 who incorrectly say emergency contraceptive pills can end a pregnancy in its early stages.

Majorities Are Aware That Emergency Contraceptive Pills Are Available Over-The-Counter And Are Not The Same As The Abortion Pill, Significantly Fewer Know They Cannot End A Pregnancy

While some state lawmakers have discussed the possibility of placing additional restrictions or limits on the access to emergency contraceptive pills, emergency contraceptives like “Plan B” are legal in all 50 states. A third of adults (32%) say they are “unsure” if emergency contraceptive pills, or “Plan B” are legal in their state or not, and five percent of adults incorrectly think emergency contraceptive pills are illegal in their state. Six in ten adults (62%) correctly identify that emergency contraceptive pills are legal in their state.

Large shares of women (65%), especially those under the age of 50 are among the groups most likely to be aware that emergency contraceptive pills are legal in their state. Three-fourths (77%) of women ages 18-49 are aware that emergency contraceptive pills are legal in their state. Whether adults know the legality of emergency contraceptives differs by income, partisan identification, community type, and education. Smaller shares of adults who live in rural areas (49%), Republicans (52%), those with lower incomes (55%), and those without a college degree (58%) are aware that emergency contraceptives are legal.

Additionally, smaller shares of women living in states where abortion has been banned are aware that emergency contraceptives are legal (49%) than those who live in a state where abortion has not been banned (70%).

Majorities Correctly Identify Emergency Contraceptives As Legal In Their State, But About Four In Ten Either Say They Are Illegal Or Are Unsure

Methodology

This KFF Health Tracking Poll was designed and analyzed by public opinion researchers at the Kaiser Family Foundation (KFF). The survey was conducted January 17 – January 24, 2023, online and by telephone among a nationally representative sample of 1,234 U.S. adults in English (1,180) and in Spanish (54). The sample includes 1,005 adults reached through the SSRS Opinion Panel either online or over the phone (n=25 in Spanish). The SSRS Opinion Panel is a nationally representative probability-based panel where panel members are recruited randomly in one of two ways: (a) Through invitations mailed to respondents randomly sampled from an Address-Based Sample (ABS) provided by Marketing Systems Groups (MSG) through the U.S. Postal Service’s Computerized Delivery Sequence (CDS); (b) from a dual-frame random digit dial (RDD) sample provided by MSG. For the online panel component, invitations were sent to panel members by email followed by up to three reminder emails. 980 panel members completed the survey online and panel members who do not use the internet were reached by phone (25).

Another 229 (n=29 in Spanish) interviews were conducted from a random digit dial telephone sample of prepaid cell phone numbers obtained through MSG. Phone numbers used for the prepaid cell phone component were randomly generated from a cell phone sampling frame with disproportionate stratification aimed at reaching Hispanic and non-Hispanic Black respondents. Stratification was based on incidence of the race/ethnicity groups within each frame. Respondents in the phone samples received a $15 incentive via a check received by mail, and web respondents received a $5 electronic gift card incentive (some harder-to-reach groups received a $10 electronic gift card).

The online questionnaire included two questions designed to establish that respondents were paying attention. Cases that failed both attention check questions, those with over 30% item non-response, and cases with a length less than one quarter of the mean length by mode were flagged and reviewed. Cases were removed from the data if they failed two or more of these quality checks. Based on this criterion, no cases were removed.

The combined cell phone and panel samples were weighted to match the sample’s demographics to the national U.S. adult population using data from the Census Bureau’s 2021 Current Population Survey (CPS). Weighting parameters included sex, age, education, race/ethnicity, region, and education. The sample was weighted to match patterns of civic engagement from the September 2017 Volunteering and Civic Life Supplement data from the CPS and to match frequency of internet use from the National Public Opinion Reference Survey (NPORS) for Pew Research Center.  Finally, the sample was weighted to match patterns of political party identification based on a parameter derived from recent ABS polls conducted by SSRS polls. The weights take into account differences in the probability of selection for each sample type (prepaid cell phone and panel). This includes adjustment for the sample design and geographic stratification of the cell phone sample, within household probability of selection, and the design of the panel-recruitment procedure.

The margin of sampling error including the design effect for the full sample is plus or minus 4 percentage points. Numbers of respondents and margins of sampling error for key subgroups are shown in the table below. For results based on other subgroups, the margin of sampling error may be higher. Sample sizes and margins of sampling error for other subgroups are available by request. Sampling error is only one of many potential sources of error and there may be other unmeasured error in this or any other public opinion poll. Kaiser Family Foundation public opinion and survey research is a charter member of the Transparency Initiative of the American Association for Public Opinion Research.

GroupN (unweighted)M.O.S.E.
Total1,234± 4 percentage points
Race/Ethnicity
White, non-Hispanic683± 5 percentage points
Black, non-Hispanic172± 11 percentage points
Hispanic281± 9 percentage points
 
Party identification
Democrat376± 7 percentage points
Republican317± 7 percentage points
Independent360± 7 percentage points
Gender
Total men565± 5 percentage points
Total women656± 5 percentage points
Women ages 18-49349± 7 percentage points
Women ages 50+307± 7 percentage points