State Medicaid Programs Respond to Meet COVID-19 Challenges: Results from a 50-State Medicaid Budget Survey for State Fiscal Years 2020 and 2021
Executive Summary
The coronavirus pandemic has generated both a public health crisis and an economic crisis, with major implications for Medicaid, a countercyclical program. During economic downturns, more people enroll in Medicaid, increasing program spending at the same time state tax revenues may be falling. As demand increases and state revenues decline, states face difficult budget decisions to meet balanced budget requirements. To help both support Medicaid and provide broad fiscal relief, the Families First Coronavirus Response Act (FFCRA)1 authorized a 6.2 percentage point increase in the federal match rate (“FMAP”)2 (retroactive to January 1, 2020) available if states meet certain “maintenance of eligibility” (MOE) requirements.3 The fiscal relief is in place until the end of the quarter in which the Public Health Emergency (PHE) ends. The current PHE is in effect through January 21, 2021 which means the enhanced FMAP is slated to expire at the end of March 2021 unless the PHE is renewed.4
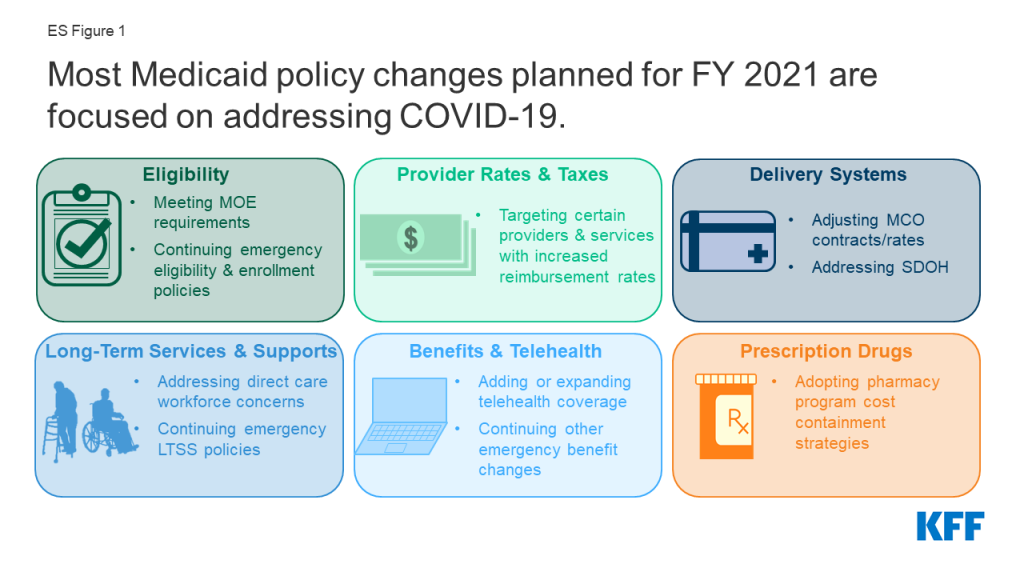
States ended state fiscal year (FY) 2020 and adopted budgets and policies for FY 2021, which began on July 1 for most states5 , while faced with uncertainty about the pandemic, the economy, and the duration of the PHE. This report examines Medicaid policy trends with a focus on planned changes for FY 2021 based on data provided by state Medicaid directors as part of the 20th annual survey of Medicaid directors in all 50 states and the District of Columbia. Unlike previous years, the survey instrument was modified to primarily collect information about policy changes planned for FY 2021, especially policies related to responding to the pandemic. Overall, 43 states6 responded to the survey by mid-August 2020, although response rates for specific questions varied. Key findings suggest that most policy changes and issues identified for FY 2021 were related to responding to the COVID-19 PHE (Figure 1).
Eligibility and Enrollment
As part of the federal response to the COVID-19 pandemic, states meeting certain “maintenance of eligibility” (MOE) conditions can access enhanced federal Medicaid funding.7 In addition to meeting the MOE requirements,8 some states are utilizing Medicaid emergency authorities to adopt an array of actions to help people obtain and maintain coverage.9 While many states remained undecided, five states reported plans to continue COVID-19 related changes to eligibility and enrollment policies after the PHE ends, such as allowing self-attestation of certain eligibility criteria. States reported a variety of outreach efforts to publicize COVID-19 related eligibility and enrollment changes, and 10 states reported expanding enrollment assistance or member call center capacity during the PHE. At the time of survey submission, thirteen states had an approved State Plan Amendment (SPA) in place for the new Uninsured Coronavirus Testing group;10 however, this option that allows states to access a 100% federal match rate for coronavirus diagnostic testing expires at the end of the PHE.
Non-emergency eligibility changes were limited, except for plans to implement the Medicaid expansion. To date, 39 states (including DC) have adopted the ACA Medicaid expansion.11 Of these, 37 states have implemented expansion coverage (including Idaho and Utah, which both implemented the expansion on January 1, 2020, and Nebraska, which implemented the expansion as of October 1, 2020). Two additional states, Missouri and Oklahoma, will implement the expansion in FY 2022 as a result of successful Medicaid expansion ballot initiatives. Six states reported plans to implement more narrow eligibility expansions. Only a few states reported planned eligibility restrictions or plans to simplify enrollment processes in FY 2021.
Provider Rates and Taxes
The COVID-19 pandemic has resulted in financial strain for Medicaid providers, so unlike in prior economic downturns more states are implementing policies to provide targeted support to providers rather than rate cuts. At the time of the survey, more responding states implemented or were planning fee-for-service (FFS) rate increases relative to rate restrictions in both FY 2020 and FY 2021. More than half of responding states indicated that one or more payment changes made in FY 2020 or FY 2021 were related in whole or in part to COVID-19. Many states adopted FFS payment changes in FY 2020 and/or planned to make changes in FY 2021 to provide additional relief to providers in response to the PHE. Still, three states have cut provider rates across all or nearly all provider categories and other states have indicated rate freezes or reductions were likely. Historically, states tend to increase or impose new provider taxes during economic downturns; however, only one state reported the addition of a new provider tax in FY 2021 and few states reported making significant changes to their provider tax structure in FY 2021. Impacts of COVID-19 on provider tax collections and provider rates are still emerging.
Nearly half of states reported that federal provider relief funds were not adequate for Medicaid providers, while other states did not know at the time of the survey. The Coronavirus Aid, Relief, and Economic Security (CARES) Act and the Paycheck Protection Program and Health Care Enhancement Act provide $175 billion in provider relief funds to reimburse eligible health care providers for health care related expenses or lost revenues that are attributable to the pandemic.12 Almost half of states responding to the survey reported that relief funds under the CARES Act have not been adequate to address the negative impact of COVID-19 faced by providers serving a high share of Medicaid and low-income patients.
Delivery Systems
Since nearly seven in ten Medicaid enrollees nationwide receive comprehensive acute care services (i.e., most hospital and physician services) through capitated managed care organizations (MCOs), these plans have played a critical role in responding to the COVID-19 pandemic.13 Twelve MCO states (of 31 responding) indicated plans to make adjustments to FY 2021 MCO contracts or rates in response to both COVID-related depressed utilization and unanticipated treatment costs. Fourteen MCO states (of 32 responding) reported implementing directed payments to selected provider types in response to the COVID-19 pandemic. MCO states reported a variety of programs, initiatives, or “value-added” services newly offered by MCOs in response to the PHE. Beyond addressing pandemic-related issues, twelve states in FY 2020 and seven in FY 2021 reported notable changes in the benefits and services covered under their MCO contracts.
The pandemic has elevated the importance of addressing social determinants of health (SDOH)14 to improve health and reduce longstanding disparities in health and health care. Nearly two-thirds of responding states reported implementation, expansion, or reform of a program or initiative to address Medicaid enrollees’ SDOH in response to COVID-19 (27 states).
Long-Term Services and Supports
The majority of responding states reported concerns about the pandemic’s impact on the long-term services and supports (LTSS) direct care workforce supply as well as concerns about access to personal protective equipment (PPE), access to COVID-19 testing, and risk of COVID-19 infections for LTSS direct care workers. Medicaid is the nation’s primary payer for LTSS.15 As the pandemic continues, states have taken a number of Medicaid policy actions to address the impact on seniors and people with disabilities who rely on LTSS to meet daily self-care and independent living needs.16 States noted plans to retain a variety of LTSS policy changes adopted in response to COVID-19 after the PHE period ends, most commonly citing the continuation of HCBS telehealth expansions.
Benefits, Cost-Sharing, and Telehealth
The majority of states added or expanded telehealth access in response to the pandemic, and many states plan to extend these and/or other benefit and cost-sharing changes beyond the PHE period. The majority of responding states report currently covering a range of FFS services delivered via telehealth when the originating site is the beneficiary’s home, most of which newly added or expanded this coverage in response to the COVID-19 pandemic. Most states reported that services delivered via telehealth from the beneficiary’s home have payment parity as compared to services delivered face-to-face, and just over half of states planned to extend newly added/expanded FFS telehealth coverage beyond the PHE period, at least in part and at least for some services. Approximately one-third of responding states noted plans to extend other benefit and cost-sharing changes adopted during the PHE period (15 states); most of these are pharmacy changes. Prior to the COVID-19 pandemic, state changes to Medicaid benefits most commonly pertained to enhanced mental health and substance use disorder (SUD) services.17 Less than one-third of responding states reported plans to make benefit or cost-sharing changes that are not related to the PHE in FY 2021 (13 states).
Prescription Drugs
States continued to adopt pharmacy program cost containment strategies despite the COVID-19 emergency and other competing priorities. Managing the Medicaid prescription drug benefit and pharmacy expenditures remains a policy priority for state Medicaid programs, and state policymakers remain concerned about Medicaid prescription drug spending growth. Thirty-three responding states reported plans to newly implement or expand upon at least one initiative to contain prescription drug costs in FY 2021.
Challenges and Priorities
Nearly all states reported significant adverse economic and state budgetary impacts driven by the pandemic, as well as uncertainty about the future. In the face of the COVID-19 pandemic, states continue to encounter challenges to provide Medicaid coverage and access for a growing number of Americans, while also facing plummeting revenues and deepening state budget gaps. State Medicaid officials highlighted swift and effective state responses to the pandemic, such as the rapid expansion of telehealth, as well as ongoing efforts to advance delivery system reforms and to address health disparities and other public health challenges. In these ways, the pandemic has demonstrated how Medicaid can quickly evolve to address the nation’s most pressing health care challenges. However, the ability of states to sustain policies adopted in response to the pandemic (including through emergency authorities) may be tied to the duration of the PHE as well as the availability of additional federal fiscal relief and support. Looking ahead, great uncertainty remains regarding the future course of the pandemic, the scope and length of federal fiscal relief efforts, and what the “new normal” will be in terms of service provision and demand. Results of the November 2020 elections could also have significant implications for the direction of federal Medicaid policy in the years ahead.
Acknowledgements
Pulling together this report is a substantial effort, and the final product represents contributions from many people. The combined analytic team from KFF and Health Management Associates (HMA) would like to thank the state Medicaid directors and staff who participated in this effort. In a time of limited resources and challenging workloads, we truly appreciate the time and effort provided by these dedicated public servants to complete the survey and respond to our follow-up questions. Their work made this report possible. We also thank the leadership and staff at the National Association of Medicaid Directors (NAMD) for their collaboration on this survey. We offer special thanks to Jim McEvoy at HMA who developed and managed the survey database and whose work is invaluable to us.
Introduction
Like all other aspects of the American health landscape, the COVID-19 pandemic and subsequent public health emergency (PHE) declaration18 have dramatically impacted state Medicaid programs, requiring states to rapidly adapt to meet the changing needs of their Medicaid beneficiaries and providers. Nationwide, Medicaid provides health insurance coverage to about one in five Americans19 and accounts for nearly one-sixth of all U.S. health care expenditures.20 Prior to the pandemic, the Medicaid program had a history of constantly evolving to react to changes in federal and state policies, the economy, and other state budget and policy priorities. The current pandemic, however, has generated both a public health crisis and an economic crisis with increased unemployment, which contributes to growth in Medicaid enrollment and spending at the same time state tax revenues may be falling.
In response to the pandemic, Congress has authorized changes to Medicaid through the Families First Coronavirus Response Act (FFCRA)21 and Coronavirus Aid, Relief, and Economic Security (CARES) Act,22 including a 6.2 percentage point increase in federal Medicaid matching funds (FMAP) (retroactive to January 1, 2020) available to states that meet five “maintenance of eligibility” (MOE) conditions that ensure continued coverage for current enrollees as well as coverage of coronavirus testing and treatment.23 This fiscal relief is in place until the end of the quarter in which the PHE ends, which means it is currently slated to expire at the end of March 2021. Beginning early in the pandemic, states have adopted Medicaid policies to respond to COVID-19 through a variety of emergency authorities (Disaster-Relief State Plan Amendments (SPAs), traditional SPAs, other administrative authorities, HCBS waiver Appendix K, Section 1115 demonstration waivers, and Section 1135 waivers).24 The beginning and end dates for these actions vary by authority and many are tied to the PHE.25
This report draws upon findings from the 20th annual budget survey of Medicaid officials in all 50 states and the District of Columbia conducted by KFF and Health Management Associates (HMA), in collaboration with the National Association of Medicaid Directors (NAMD). (Previous reports are archived here.26 ) This year’s survey instrument was modified to focus on policy changes planned for FY 2021 and policies adopted in response to the pandemic, and was sent to each state Medicaid director in June 2020. Overall, 43 states27 responded by mid-August 2020, although response rates for specific questions varied. Given differences in the financing structure of their programs, the U.S. territories were not included in this analysis. An acronym glossary and the survey instrument are included as appendices to this report.
This report highlights policy changes in place or planned for FY 2021 (which began for most states on July 1, 2020).28 Key findings, along with state-by-state tables, are included in the following sections:
Eligibility And Enrollment
As part of the federal response to the COVID-19 pandemic, states meeting certain “maintenance of eligibility” (MOE) conditions can access enhanced federal Medicaid funding. The Families First Coronavirus Response Act,29 amended by the Coronavirus Aid, Relief, and Economic Security (CARES) Act,30 authorizes a 6.2 percentage point increase in the federal Medicaid match rate (“FMAP”)31 (retroactive to January 1, 2020) through the end of the quarter in which the public health emergency ends. To qualify for the enhanced funds, states must ensure continued coverage for current enrollees and are prohibited from increasing premiums or making eligibility standards, methodologies, or procedures more restrictive than those in effect on January 1, 2020, among other requirements.32
The MOE requirements33 contribute to enrollment increases34 by eliminating the usual enrollment churn that occurs when some individuals lose eligibility and are dis-enrolled from Medicaid each month. In the past, some eligibility churn occurred when otherwise eligible individuals lost coverage because they encountered barriers preventing them from timely documenting continued eligibility during the eligibility renewal process or when states conducted periodic data matches between renewals.35 Prior to the pandemic, these types of barriers were potentially depressing overall Medicaid enrollment levels.36
In addition to the MOE requirements, some states are utilizing Medicaid emergency authorities to take other actions to help people obtain and maintain coverage. These include actions to expand eligibility and make it easier to apply such as allowing for self-attestation of eligibility criteria; eliminating premiums; expanding the use of presumptive eligibility; and otherwise simplifying application processes.37 The beginning and ending dates of these policies vary by authority38 and many will expire with the end of the public health emergency (PHE) declaration (currently set for January 21, 2020).39
Survey Findings
We asked states to report any non-emergency eligibility changes planned for FY 2021, including eligibility expansions, eligibility restrictions, and changes to enrollment processes. We also asked about changes to eligibility policies made in response to the COVID-19 pandemic and, specifically, whether states planned to adopt these changes on a more permanent basis. Finally, we asked states to report on outreach efforts to publicize COVID-19 related eligibility changes and/or the availability of Medicaid coverage following the economic downturn.
Non-Emergency Eligibility Changes
Seven states reported non-emergency plans to expand eligibility in FY 2021. As of October 2020, 39 states (including DC) have adopted the ACA Medicaid expansion (Figure 1).40 Of these, 37 states to date have implemented expansion coverage to 138% FPL ($17,609 per year for an individual in 2020),41 ) including Idaho and Utah, which both implemented the expansion on January 1, 2020 (FY 2020), and Nebraska, which implemented on October 1, 2020 (FY 2021). Two additional states, Oklahoma and Missouri, will implement the expansion in FY 2022 as a result of successful Medicaid expansion ballot initiatives.
- Nebraska implemented the expansion on October 1, 2020 (FY 2021) pursuant to a ballot measure passed in November 2018. The state is currently seeking a Section 1115 waiver to implement its expansion with program elements that differ from what is allowed under federal law.
- Oklahoma voters approved a ballot measure on June 30, 2020 which adds Medicaid expansion to the state’s constitution and requires coverage to begin no later than July 1, 2021. The ballot measure language also prohibits the imposition of any additional burdens or restrictions on eligibility or enrollment for the expansion population. The Oklahoma Health Care Authority intended to submit the necessary State Plan Amendments (SPAs) for expansion by September 30, 2020 with an effective date of July 1, 2021 (FY 2022).42
- Missouri voters similarly approved a ballot measure on August 4, 2020 which adds the expansion to the state’s constitution with coverage to begin July 1, 2021 (FY 2022). Like Oklahoma’s, Missouri’s approved ballot measure prohibits the imposition of any additional burdens or restrictions on eligibility or enrollment for the expansion population.

Six states reported plans to implement the following more narrow eligibility expansions in FY 2021. These other expansions include the following:
- Expanding coverage for parent/caretaker relatives and other low-income adults. One non-expansion state (South Carolina) has an approved Section 1115 waiver and plans to increase the income limit for parent/caretaker relative enrollees from 67% to 100% FPL and also to provide coverage with an enrollment cap for a new Targeted Adult group. Both expansions of eligibility are contingent on compliance with a work requirement. As a result of both the pandemic and litigation,43 no states are currently implementing approved work requirements.44
- Expanding coverage for postpartum women. Two states are expanding coverage for postpartum women beyond the 60 days provided under federal rules: Pending waiver approval, Georgia and New Jersey are extending to six months.45 (Additionally, Indiana reported plans to extend postpartum coverage to one year beginning in FY 2022.)
- Expanding coverage for certain older adults and people with disabilities. California is expanding income eligibility for the optional aged, blind, and disabled (ABD) population from 100% to 138% FPL and also creating a new ABD income disregard in the amount of the individual’s Medicare Part B premium (which is paid by Medicaid). The new disregard in California is expected to allow individuals to retain eligibility in the ABD pathway and reduce churn between the ABD and medically needy with share of costs pathways and administrative burden. New Hampshire reported plans to implement its “Medicaid for Employed Older Adults with Disabilities” program, which will expand Medicaid buy-in coverage for working people with disabilities to include those ages 65 and older with incomes up to 250% FPL. (New Hampshire already covers working people with disabilities ages 18 to 64 up to 250% FPL.) Louisiana is expanding HCBS waiver coverage for children with significant disabilities without regard to household income and assets for children who live at home but would otherwise qualify for institutional placement in a hospital, skilled nursing facility, or intermediate care facility for individuals with intellectual disabilities.
Only two states reported a planned eligibility restriction in FY 2021 after the expiration of the PHE. Missouri reported that scheduled premium increases would go forward after the PHE ended and Montana reported plans to implement a community engagement/work requirement and premium changes for expansion adults pending CMS approval of the state’s Section 1115 waiver renewal.
Although not counted as an eligibility expansion or a restriction for purposes of this survey, Texas reported that it would implement changes (including applying modified adjusted gross income (MAGI) financial eligibility methodologies to individuals eligible for family planning-only services) to its Healthy Texas Women (HTW) Section 1115 waiver program as required under the waiver’s January 2020 approval from CMS.46 The approved HTW waiver extended eligibility for family planning services to women age 18-44 up to 200% FPL not otherwise eligible for Medicaid and allowed Texas to waive non-emergency medical transportation (NEMT); retroactive eligibility; early and periodic screening, diagnostic, and treatment (EPSDT) coverage; and freedom of choice of provider for family planning services.
Two states reported non-emergency plans to simplify enrollment processes in FY 2021. Montana reported plans to implement an auto-renewal process for non-MAGI eligibility groups and Virginia reported plans to expand ex parte auto-renewals when individuals experience changes such as reaching the end of their postpartum coverage period or attaining an age requiring evaluation in other covered groups. While Virginia did not characterize this change as the extension of an emergency authority, the state did note that the proposed changes are intended to reduce caseworker caseloads when the PHE period ends.
Eligibility Changes in Response to COVID-19
Only five states47 reported plans to continue COVID-19 emergency changes related to eligibility and enrollment policies beyond the PHE period. One state (Vermont) noted that a variety of certain emergency flexibilities would likely extend beyond the PHE period due to the time required to re-implement prior policies. A few states reported specific plans for the continuation of policies to simplify/expedite enrollment processes:
- Massachusetts intends to continue allowing self-attestation of all eligibility criteria except for citizenship and immigration status.
- Washington is working to adopt self-attestation of income and resources for aged, blind, and disabled (ABD) populations. Washington also reported working to adopt hospital presumptive eligibility for ABD populations and post-enrollment verification of assets for ABD populations.
- Arizona indicated that it would continue allowing electronic signatures on eligibility documents for its long-term care program (institutional and HCBS).
- Virginia intends to continue allowing applicants and enrollees to verbally appoint/authorize assisters, advocates, and other individuals.
Another 12 states reported that the continuation of emergency eligibility and enrollment policies remained undetermined. Indiana and Louisiana reported that more time could be needed to re-implement their prior policies; Missouri indicated that it may continue to allow self-attestation of most eligibility factors for ABD and MAGI populations; and a few states (West Virginia, Kansas, and Missouri) reported potential plans to further extend renewal timelines.48
At the time of survey completion, thirteen states had approved State Plan Amendments (SPAs) in place for the new Uninsured Coronavirus Testing group at the time of survey submission. This new optional eligibility pathway provides 100% federal matching funds for states to cover coronavirus testing and testing-related services for uninsured individuals through the end of the PHE. 49 In addition to this option, providers can alternatively obtain reimbursement for coronavirus testing and treatment provided to uninsured individuals from additional federal funds through the Health Resources and Services Administration.50 One state (California) reported covering a significant number of persons under its Uninsured Coronavirus Testing group as of June 30, 2020 (6,390). All other states reported more modest enrollments: Colorado, Louisiana, and Minnesota reported covering between 50 and 450 individuals and Maine reported covering approximately 850 individuals. Other states that had adopted the option (including Alabama, Iowa, Montana, Nevada, New Hampshire, South Carolina, and West Virginia) reported between zero and 50 persons covered and Washington has an approved SPA for this group but did not report the number of individuals covered. Since the time of survey submission, two additional responding states (Connecticut and North Carolina) have received SPA approvals for this group.51
States reported a variety of outreach efforts to publicize COVID-19 related eligibility and enrollment changes, and ten states reported expanding enrollment assistance or member call center capacity during the PHE. Most states reported using their websites and social media platforms to provide COVID-19 related enrollment information. Many states also cited working with provider groups and advocacy organizations to disseminate information in addition to direct mailings to members and applicants and provider notices and alerts. A few states also commented on their managed care organizations’ (MCO) outreach efforts. Additionally, ten states (California, Florida, Indiana, Kentucky, Maryland, Missouri, Nebraska, South Carolina, Texas, and Virginia) reported expanding enrollment assistance or member call center capacity. Very few states reported experiencing application processing delays due to COVID-19 at the time of survey completion.
Oregon COVID-19 Medicaid Outreach
The Oregon Health Authority (OHA) created targeted messaging for potential applicants who may have recently lost a job, had a change in hours, or had a change in unemployment benefits and also created messaging about changes in eligibility for Medicaid, including changes in income, stimulus payments, and suspending case closure. The state has and continues to disseminate this messaging through customer service talking points, fact sheets and webpages, social media, e-bulletins, and plan and provider talking points, as well as through the statewide network of community assisters. The state also plans to send a direct mailing with this information to all Medicaid households. The OHA is also fostering a partnership with Oregon’s employment agency to ensure cross-promotion of vital information about eligibility and unemployment.
Provider Rates And Taxes
The coronavirus pandemic has resulted in financial strain for Medicaid providers. In prior economic downturns, states have typically resorted to provider rate reductions as well as cuts to optional benefits, restoring those rates and benefits when economic conditions improved.52 Provider rate cuts may be harder to implement during the current downturn, however, due to the fiscal strain the pandemic has placed on many providers, particularly those serving Medicaid enrollees. While some providers are dealing with both increased utilization and costs related to COVID-19 testing and treatment, others have experienced substantial revenue losses as utilization has declined for non-urgent care. Providers that predominantly serve Medicaid enrollees and/or deliver services primarily financed by Medicaid, such as behavioral health or long-term care providers, may face disproportionate risks to their continued financial viability as their pre-pandemic operating margins were already modest due to lower Medicaid reimbursement levels relative to costs. To address the current fiscal challenges faced by providers, states have implemented various options to support providers53 directly or by directing plans to do so. 54 ,55
The Coronavirus Aid, Relief, and Economic Security (CARES) Act and the Paycheck Protection Program and Health Care Enhancement Act provide $175 billion in provider relief funds to reimburse eligible health care providers for health care related expenses or lost revenues attributable to coronavirus.56 Specifically, funds are available for building or constructing temporary structures, leasing properties, medical supplies and equipment including personal protective equipment (PPE) and testing supplies, increased workforce and trainings, emergency operation centers, retrofitting facilities, and surge capacity. In June 2020, CMS announced the allocation of $15 billion in provider relief funds specifically for Medicaid/CHIP providers that were not funded in a prior distribution to Medicare fee-for-service providers, addressing concerns that Medicaid providers had been disadvantaged in prior distributions, both in the amount and timing of funding received.57
States can use provider taxes and intergovernmental transfers (IGTs) to help finance the state share of Medicaid.58 Over time, states have increased their reliance on provider taxes, especially during economic downturns.59 States also have some flexibility to use funding from local governments to help finance the state share of Medicaid. All states (except Alaska) have at least one provider tax in place and many states have more than three.60 On September 14, 2020, CMS withdrew the proposed Medicaid Fiscal Accountability Regulation, providing at least some stability for states with one or more provider taxes at risk under the proposed rule.
Survey Findings
Provider Rates
This survey examines rate changes across major provider categories: inpatient hospitals, outpatient hospitals, nursing facilities, primary care physicians, specialists, obstetricians and gynecologists (OB/GYNs), dentists, and home and community-based services (HCBS) providers. States were asked to report aggregate rate changes for each provider category in their fee-for-service (FFS) programs and whether these or other payment changes (e.g., retainer payments, interim payments) were adopted in response to the COVID-19 emergency. States were also asked to describe whether provider relief funds made available under the CARES Act were adequate.
At the time of the survey, more responding states implemented or were planning FFS rate increases relative to rate restrictions in both FY 2020 and FY 2021 (Tables 1 and 2). Out of the 43 states responding to this year’s survey, 41 states reported implementing rate increases for at least one category of provider in FY 2020 and 17 states reported implementing rate restrictions in FY 2020. In FY 2021, fewer states reported at least one planned rate increase (35 states) and the number of states planning to restrict rates increased (21 states). Most of the rate restrictions are freezes in rates for inpatient hospitals and nursing facilities that are counted as restrictions. Three states (Colorado, Nevada, and Wyoming) reported rate reductions across all or nearly all provider categories. These reductions were related to the states’ budget shortfalls for FY 2021. Six of the responding states did not report payment changes planned for FY 2021 in one or more categories of providers, but two of these states identified that rate freezes or reductions were likely pending final budget negotiations.
More than half of the responding states indicated that one or more payment changes made in FY 2020 or FY 2021 are related in whole or in part to COVID-19. Twenty-four out of the 43 responding states indicated that one or more provider rate changes implemented in FY 2020 and/or FY 2021 were related to COVID-19 at least in part. COVID-19 related payment changes were most commonly associated with nursing facilities (20 states) and HCBS providers (18 states) followed by inpatient hospital services (11 states).
At the time of the survey, many states adopted FFS payment changes in FY 2020 and/or are planning to make changes in FY 2021 to provide additional relief to providers in response to the COVID-19 emergency. These changes include increasing payment rates (per diem or percentage rate increases) and providing retainer payments, directed payments, or interim payments to certain provider types. Additional payments in some states are associated with facilities, services, or patients with a COVID-19 diagnosis (California, Florida, Indiana, Louisiana, Kentucky, Massachusetts, and Michigan).
At least 16 states have instituted retainer payments for HCBS providers61 and 19 states are providing rate increases, interim payments, or add-on payments to nursing facilities and other long-term care facilities.62 A few states did not specifically update long-term care facility rates in response to COVID-19 but describe that their cost-based reimbursement systems improve payment due to inflation or COVID-19 related expenses. Other examples of COVID-19 related payment changes across state Medicaid programs include:
- Alaska adjusted its pharmacy reimbursement methodology and professional dispensing fees to address drug shortages, social distancing and increases in prescription drug deliveries.
- California and Louisiana are reimbursing COVID-19 related lab services at 100% of the Medicare payment rate.
- Oklahoma waived hospital penalties related to potential preventable readmissions and is allowing additional therapeutic leave days for certain long-term care facilities.
- Indiana and Washington increased payment rates for emergency medical service providers (EMS) and ambulance providers for transporting COVID-19 positive patients.
- Kentucky and West Virginia increased inpatient reimbursement for Diagnosis Related Groups (DRGs) with a COVID-19 diagnosis by 20%.
- Michigan increased the FFS rate for personal care services by $2/hour.
Almost half of states responding to the survey reported that relief funds under the CARES Act have not been adequate to address the negative impact of COVID-19 faced by providers serving a high share of Medicaid and low-income patients while others were uncertain. About half of states reported that the provider relief funds were inadequate, while the other half of states reported they did not know. In the states that did not believe funding was adequate, dental providers, long-term care facilities, HCBS providers, primary care providers, behavioral health providers, and non-emergency transportation were the most often cited provider types needing relief or additional funding. Many of these provider types are dependent on Medicaid reimbursement. States also explained that providers faced challenges in understanding whether they qualified for funding, resulting in missed opportunities for qualified providers. A few states noted that the funding methodology potentially disadvantaged Medicaid providers who did not serve a large Medicare patient population and that limiting relief to the 2% of net patient revenue may not be sufficient for some providers or to offset losses.
Provider Taxes
States were asked to report any provider tax changes in FY 2021. States were also asked to report any impacts related to COVID-19 on tax collections.
Only one state reported the addition of a new provider tax in FY 2021. Arizona added a new hospital tax on outpatient services in FY 2021 to raise additional money for its Medicaid program. However, two states (Hawaii and Wyoming) reported that they are investigating opportunities to add new provider taxes, or increase existing provider taxes, to address expected shortfalls related to COVID-19’s negative impact on the economy and available state general funds.
Few states reported making significant changes to the provider tax structure in FY 2021. Nine states reported planned increases to one or more provider taxes (Alabama, California, Colorado, Georgia, Hawaii, Idaho, Louisiana, Missouri, and New Jersey) in FY 2021, while four states reported provider tax decreases (Maryland, North Carolina, Oklahoma, and Pennsylvania). Montana reports that it is eliminating its provider tax for intermediate care facilities for individuals with intellectual disabilities (ICF-IDs) in FY 2021.
Impacts of COVID-19 on provider tax collections are still emerging. States were asked to describe any COVID-19 related impacts on provider tax collections anticipated in FY 2021. Some states anticipated no material impact, while a few states identified that the impact was yet to be determined. For states that reported a change in provider tax collections related to COVID-19, the impact was mixed and varied by the type of provider tax and the state. For example, Washington noted that the number of nursing facility bed days was on the decline, resulting in reduced revenue attributed to its Safety Net Assessment fee, while California observed an increase in nursing facility and ICF-ID provider tax collections due to corresponding rate increases for these providers. States noted that COVID-19 impacted provider tax collections in other ways, with providers in some states receiving partial refunds (Oklahoma) or deferring payments (Connecticut). Vermont reported a decrease in provider tax revenue collection and delays in payment and is working with providers to develop repayment plans. At least one state increased its hospital provider tax to generate additional revenue and protect providers from further rate cuts (Colorado).
TABLE 1: PROVIDER RATE CHANGES IN ALL 50 STATES AND DC*, FY 2020
| States | Inpatient Hospital | Outpatient Hospital | Primary Care Physicians | Specialists | OB/GYNs | Dentists | Nursing Facilities | HCBS | Any Provider | |||||||||
| Rate Change | + | – | + | – | + | – | + | – | + | – | + | – | + | – | + | – | + | – |
| Alabama | X | X | X | X | X | X | X | |||||||||||
| Alaska | X | X | X | X | X | X | X | X | X | X | ||||||||
| Arizona | X | X | X | X | ||||||||||||||
| Arkansas | X | X | X | X | X | |||||||||||||
| California | X | X | X | X | X | |||||||||||||
| Colorado | X | X | X | X | X | X | X | X | X | |||||||||
| Connecticut | X | X | X | X | ||||||||||||||
| DC* | ||||||||||||||||||
| Delaware* | ||||||||||||||||||
| Florida | X | X | X | X | X | X | ||||||||||||
| Georgia | X | X | X | NR | X | |||||||||||||
| Hawaii | X | X | X | X | X | X | ||||||||||||
| Idaho | X | X | X | X | X | X | ||||||||||||
| Illinois* | ||||||||||||||||||
| Indiana | X | X | X | X | X | |||||||||||||
| Iowa | X | X | X | X | ||||||||||||||
| Kansas | X | X | X | X | X | |||||||||||||
| Kentucky | X | X | X | X | X | X | ||||||||||||
| Louisiana | X | X | X | X | ||||||||||||||
| Maine | X | X | X | X | X | X | ||||||||||||
| Maryland | X | X | X | X | X | X | X | X | ||||||||||
| Massachusetts | X | X | X | X | X | X | X | X | ||||||||||
| Michigan | X | X | X | X | X | X | X | |||||||||||
| Minnesota | X | X | X | X | X | |||||||||||||
| Mississippi | X | X | X | X | X | |||||||||||||
| Missouri | X | X | X | X | X | X | X | X | X | X | ||||||||
| Montana | X | X | X | X | X | X | X | X | X | |||||||||
| Nebraska | X | X | X | X | X | X | X | X | X | |||||||||
| Nevada | X | X | X | X | X | |||||||||||||
| New Hampshire | X | X | X | X | X | X | X | X | X | |||||||||
| New Jersey | X | X | X | X | X | X | X | X | X | |||||||||
| New Mexico* | ||||||||||||||||||
| New York* | ||||||||||||||||||
| North Carolina | X | X | X | X | X | X | X | X | X | |||||||||
| North Dakota | X | X | X | X | X | X | X | X | X | |||||||||
| Ohio* | ||||||||||||||||||
| Oklahoma | X | X | X | X | X | X | X | X | ||||||||||
| Oregon | X | X | X | X | ||||||||||||||
| Pennsylvania | X | X | X | |||||||||||||||
| Rhode Island* | ||||||||||||||||||
| South Carolina | X | X | X | X | X | X | X | X | ||||||||||
| South Dakota | X | X | X | X | X | X | X | X | X | |||||||||
| Tennessee | X | X | X | |||||||||||||||
| Texas | X | NR | NR | NR | NR | X | X | X | ||||||||||
| Utah* | ||||||||||||||||||
| Vermont | X | X | X | X | X | X | X | X | X | |||||||||
| Virginia | X | X | X | X | X | X | X | |||||||||||
| Washington | X | X | X | X | X | X | ||||||||||||
| West Virginia | X | X | X | X | X | X | X | X | ||||||||||
| Wisconsin | X | X | X | X | X | |||||||||||||
| Wyoming | X | X | X | X | X | |||||||||||||
| Totals | 29 | 14 | 25 | 3 | 21 | 0 | 17 | 1 | 17 | 0 | 14 | 1 | 37 | 6 | 33 | 1 | 41 | 17 |
| NOTES: “+” refers to provider rate increases and “-” refers to provider rate restrictions. OB/GYNs: Obstetricians and gynecologists. HCBS: Home and community-based services. For the purposes of this report, provider rate restrictions include cuts to rates for physicians, dentists, outpatient hospitals, and HCBS providers as well as both cuts or freezes in rates for inpatient hospitals and nursing facilities. NR: State submitted a survey, but did not report data for this provider type and/or FY. “*” indicates the state did not submit a survey by mid-August 2020 (DC, DE, IL, NM, NY, OH, RI, UT).SOURCE: KFF Survey of Medicaid Officials in 50 states and DC conducted by Health Management Associates, October 2020. | ||||||||||||||||||
TABLE 2: PROVIDER RATE CHANGES IN ALL 50 STATES AND DC*, FY 2021
| States | Inpatient Hospital | Outpatient Hospital | Primary Care Physicians | Specialists | OB/GYNs | Dentists | Nursing Facilities | HCBS | Any Provider | |||||||||
| Rate Change | + | – | + | – | + | – | + | – | + | – | + | – | + | – | + | – | + | – |
| Alabama | X | X | X | X | X | |||||||||||||
| Alaska | X | X | X | X | X | X | X | X | X | |||||||||
| Arizona | X | X | X | X | X | X | X | X | ||||||||||
| Arkansas | X | X | X | X | X | |||||||||||||
| California | X | X | X | X | X | |||||||||||||
| Colorado | X | X | X | X | X | X | X | X | X | X | ||||||||
| Connecticut | X | X | X | X | ||||||||||||||
| DC* | ||||||||||||||||||
| Delaware* | ||||||||||||||||||
| Florida | X | X | X | X | X | |||||||||||||
| Georgia | X | X | X | X | NR | X | ||||||||||||
| Hawaii | NR | NR | NR | NR | NR | NR | NR | NR | ||||||||||
| Idaho | X | X | X | X | X | X | ||||||||||||
| Illinois* | ||||||||||||||||||
| Indiana | X | X | X | |||||||||||||||
| Iowa | X | X | X | X | ||||||||||||||
| Kansas | X | X | X | X | X | X | ||||||||||||
| Kentucky | X | X | X | X | X | X | ||||||||||||
| Louisiana | X | X | X | |||||||||||||||
| Maine | X | X | X | X | X | X | ||||||||||||
| Maryland | X | X | X | X | X | X | ||||||||||||
| Massachusetts | X | X | X | X | X | X | X | X | X | |||||||||
| Michigan | X | X | X | TBD | X | X | ||||||||||||
| Minnesota | X | X | X | X | X | |||||||||||||
| Mississippi | X | X | X | X | X | |||||||||||||
| Missouri | X | X | X | |||||||||||||||
| Montana | X | X | X | X | X | X | X | X | X | |||||||||
| Nebraska | X | X | X | X | X | X | X | X | X | |||||||||
| Nevada | X | X | X | X | X | X | X | X | X | |||||||||
| New Hampshire | X | X | X | X | X | X | X | X | X | |||||||||
| New Jersey | X | X | X | X | X | X | X | X | X | |||||||||
| New Mexico* | ||||||||||||||||||
| New York* | ||||||||||||||||||
| North Carolina | X | X | X | X | ||||||||||||||
| North Dakota | X | X | X | X | X | X | X | X | X | |||||||||
| Ohio* | ||||||||||||||||||
| Oklahoma | X | X | X | |||||||||||||||
| Oregon | TBD | TBD | TBD | TBD | TBD | X | TBD | TBD | X | |||||||||
| Pennsylvania | X | X | X | |||||||||||||||
| Rhode Island* | ||||||||||||||||||
| South Carolina | X | X | X | X | X | X | ||||||||||||
| South Dakota | X | X | X | X | X | X | X | X | X | |||||||||
| Tennessee | X | X | X | |||||||||||||||
| Texas | X | NR | NR | NR | NR | TBD | X | X | ||||||||||
| Utah* | ||||||||||||||||||
| Vermont | NR | NR | NR | NR | NR | NR | NR | NR | ||||||||||
| Virginia | X | X | X | X | X | |||||||||||||
| Washington | X | X | X | X | X | |||||||||||||
| West Virginia | X | X | X | X | X | X | X | X | X | |||||||||
| Wisconsin | X | X | X | X | X | |||||||||||||
| Wyoming | X | X | X | X | X | X | X | X | X | |||||||||
| Totals | 20 | 20 | 20 | 4 | 13 | 3 | 12 | 3 | 10 | 3 | 12 | 3 | 30 | 9 | 22 | 3 | 35 | 21 |
| NOTES: “+” refers to provider rate increases and “-” refers to provider rate restrictions. OB/GYNs: Obstetricians and gynecologists. HCBS: Home and community-based services. For the purposes of this report, provider rate restrictions include cuts to rates for physicians, dentists, outpatient hospitals, and HCBS providers as well as both cuts or freezes in rates for inpatient hospitals and nursing facilities. NR: State submitted a survey, but did not report data for this provider type and/or FY. “*” indicates the state did not submit a survey by mid-August 2020 (DC, DE, IL, NM, NY, OH, RI, UT). SOURCE: KFF Survey of Medicaid Officials in 50 states and DC conducted by Health Management Associates, October 2020. | ||||||||||||||||||
Delivery Systems
Managed Care
Capitated managed care remains the predominant delivery system for Medicaid in most states. As of July 2019, 40 states were contracting with comprehensive risk-based managed care organizations (MCOs).63 MCOs provide comprehensive acute care (i.e., most physician and hospital services) and in some cases long-term services and supports (LTSS) to Medicaid beneficiaries. Among the 40 states with MCOs, 33 states reported that 75% or more of their Medicaid beneficiaries were enrolled in MCOs. As of July 1, 2019, 28 states were contracting with one or more limited benefit prepaid health plans (PHPs) to provide Medicaid benefits including behavioral health care, dental care, vision care, non-emergency medical transportation (NEMT), or LTSS. Twelve states reported operating a primary care case management (PCCM) program. PCCM is a managed fee-for-service (FFS) based system in which beneficiaries are enrolled with a primary care provider who is paid a small monthly fee to provide case management services in addition to primary care.
With 69% of Medicaid beneficiaries enrolled in MCOs nationally, MCOs play a critical role in responding to the COVID-19 pandemic and its fiscal implications for states.64 Given unanticipated costs related to COVID-19 testing and treatment, as well as depressed utilization affecting the financial stability of many Medicaid providers, many states are currently evaluating options to adjust current MCO payment rates and/or risk sharing mechanisms.65 CMS has outlined state options to modify managed care contracts and rates in response to COVID-19 including risk mitigation strategies, adjusting capitation rates, covering COVID-19 costs on a non-risk basis, and carving out costs related to COVID-19 from MCO contracts.66 States can also direct that managed care plans make payments to their network providers (known as “state directed payments”) using methodologies approved by CMS to further state goals and priorities, including COVID-19 response.67 States can therefore impose state directed payment requirements on MCOs to help mitigate the impacts of the PHE on providers that are experiencing decreased utilization and reimbursement while non-urgent services are suspended or patients are hesitant to seek care.
Survey Findings
On this year’s survey, states were asked to identify any acute care MCO policy changes in FY 2020 or planned for FY 2021, including changes to increase enrollment in MCOs or changes to the benefits or services carved-in or out of MCO contracts. States were also asked to describe any other managed care changes (e.g., implementing, expanding, reducing, or terminating a PCCM program or limited-benefit prepaid health plan (PHP)) made in FY 2020 or planned for FY 2021.
In response to the COVID-19 pandemic, states were also asked whether adjustments to FY 2021 MCO contracts or rates have been made or are planned in response to unanticipated COVID-19 related testing and treatment costs or depressed utilization and whether they have imposed or plan to impose new provider payment requirements on MCOs. Finally, states were asked to describe any other COVID-19 related MCO policy changes made in response to the pandemic and to identify any COVID-19 related initiatives newly offered by MCOs.
Non-Emergency Acute Care MCO Policy Changes
Reflecting nearly full MCO saturation in most MCO states, only three states reported changes to expand comprehensive managed care as a delivery system in FY 2020 or FY2021. In FY 2020, Pennsylvania implemented the third phase of Community HealthChoices (a program covering both acute care and LTSS for full benefit dual eligible beneficiaries and individuals receiving LTSS), to new geographic areas of the state, while West Virginia began mandatorily enrolling foster care youth into MCOs. In FY 2021, Nebraska reported plans to enroll all expansion adults into MCOs upon the implementation of its ACA Medicaid expansion in October 2020. North Carolina reported delays to its MCO implementation plans noting its new managed care contracts will be effective in FY 2022.
Although MCOs provide comprehensive services to beneficiaries, states may carve specific services out of MCO contracts to FFS systems or limited-benefit plans. Services frequently carved out include behavioral health, pharmacy, dental, and LTSS. However, there has been significant movement across states in recent years to carve these services in to MCOs.
Twelve states in FY 2020 and seven in FY 2021 reported notable changes in the benefits and services covered under their MCO contracts (Exhibit 1).
- Pharmacy drugs. The most frequently reported changes were to carve in or carve out one or more pharmacy drug products (especially high cost/specialty drugs). Two states reported carve-outs of the entire pharmacy benefit (North Dakota in FY 2020 and California in FY 2021) and Missouri reported plans to carve out outpatient hospital drugs in FY 2021 (in addition to other covered outpatient drugs which were already carved out and covered on a FFS basis). (See Pharmacy Cost Containment Actions section for more information on pharmacy changes.)
- Behavioral health services. Four states reported changes related to behavioral health services. In FY 2020, New Jersey added autism benefits; Washington carved in high intensity behavioral health benefits in three geographic regions, but also carved out out-of-state inpatient psychiatric services for children; Wisconsin added sub-acute psychiatric services as an in-lieu of benefit for the BadgerCare Plus population; and West Virginia added services authorized under its Substance Use Disorder (SUD) and Children with Serious Emotional Disorder (SED) waivers. In FY 2021, Oregon is adding care coordination for persons with severe and persistent mental illness (SPMI), children with SED, and individuals with SUD receiving medication assisted treatment (MAT).
| Exhibit 1: MCO-Covered Benefit/Service Changes, FY 2020 and FY 2021 (n = 32 MCO states) | ||
| Benefit/Service Carve-ins | FY 2020 | FY 2021 |
| Behavioral health | NJ, WA, WI, WV | OR |
| Pharmacy drugs | MD, SC | — |
| Non-emergency medical transportation | NE | TX |
| Community supports | HI, ND | — |
| Other68 | MO, SC | NJ |
| Benefit/Service Carve-outs | FY 2020 | FY 2021 |
| Behavioral health | WA | — |
| Pharmacy drugs | HI, ND | CA, MD, MO, SC, TX |
| Transplants | AR, WA | — |
| Other 69 | CA | NJ |
Other Non-Emergency Managed Care Changes – PCCM & PHP
Four states reported making changes to their PCCM programs or limited benefit PHP programs. In FY 2020, Alabama replaced its previous PCCM program (Patient 1st) and Maternity PHP program with a new PCCM entity program (the Alabama Coordinated Health Network) that covers care coordination services for most of the traditional Medicaid population including maternity, family planning, behavioral, and physical health care coordination services. In FY 2020, Washington reported eliminating its remaining three regional behavioral health PHP contracts, which had been providing non-integrated behavioral health benefits. As a result, Washington MCOs now provide integrated physical health and behavioral health statewide. In FY 2021, Texas will expand from two to three dental MCOs and Louisiana will move from one to two. Also, Texas will eliminate its NEMT PHP while adding NEMT services to its MCO contracts.
COVID-19 Related MCO Policy Changes & MCO Initiatives
Twelve MCO states (of 31 responding) indicated plans to make payment adjustments to FY 2021 MCO contracts or rates in response to both COVID-19 related depressed utilization and unanticipated treatment costs (Exhibit 2). Sixteen states reported plans to make payment adjustments to FY 2021 MCO contracts or rates in response to COVID-19 related depressed utilization while 14 states reported plans to make payment adjustments in response to unanticipated COVID-19 related testing and treatment costs. Many states remained undetermined about adjustments to FY 2021 MCO contracts at the time of survey completion. COVID-19 related payment adjustments could include risk corridors, capitation rate adjustments (upward or downward), carve-outs, or covering costs on a non-risk basis.70 States planning to make payment adjustments to FY 2021 MCO contracts were asked to describe the contract and/or rate adjustments planned. A majority of states described plans to implement or tighten risk corridors, often specifying two-sided risk corridors which aim to mitigate risk to both MCOs and states. In addition to adjustments planned for FY 2021 MCO contracts, several states also reported implementing retroactive risk mitigation and/or rate adjustment strategies for FY 2020 MCO contracts.71
| Exhibit 2: MCO States Reporting Adjustments to FY 2021 MCO Contracts or Rates in Response to COVID-19 (n = 31 MCO states) | ||||
| States reporting adjustments to reflect: | ||||
| Testing and treatment costs | Depressed utilization | |||
| Yes | 14 states | AR, GA, HI, IN, KY, LA, MA, MD, MI, MS, NV, SC, TN, WV | 16 states | AR, GA, HI, IN, KS, KY, LA, MD, MI, MN, MS, NH, NJ, NV, SC, TN |
| No | 5 states | CA, MN, ND, OR, VA | 3 states | ND, OR, VA |
Fourteen MCO states (of 32 responding) reported implementing directed payments to selected provider types in response to the COVID-19 pandemic. Under certain circumstances, federal regulations permit states to direct MCOs to make specific provider payments (“state directed payments”).72 In response to the COVID-19 pandemic, 12 states in FY 2020 and three in FY 2021 reported implementing state directed payments (usually noted as temporary) for selected provided types (Exhibit 3). The most frequently identified provider type was for certain home and community-based services (HCBS) (8 states) followed by nursing facilities (5 states). Six of the eight states noting HCBS-related directed payments (Arizona, Florida, Iowa, Kansas, Massachusetts, and Tennessee) reported requiring MCOs to make retainer payments to allow certain HCBS providers to continue to bill for individuals when circumstances prevent these individuals from receiving these services.
| Exhibit 3: MCO Directed Payments Implemented in Response to the COVID-19 Emergency, FY 2020 and FY 2021 (n = 32 MCO states) | ||
| FY 2020 | FY 2021 | |
| Home and community-based services | AZ, FL, IA KS, MA, MI, NJ, TN | AZ |
| Nursing facility | IA, MI, TN, VA | AZ |
| Hospital | MA, WV | LA |
| Physician, PCP, or providers of evaluation & management services | MA, TN, VA | — |
| Behavioral health | MA, TN, WV | — |
| Ambulance | MA, WV | KY |
| Dental | TN, WV | — |
| Laboratory | MD | — |
| Other (unspecified provider types) | NH, WV | — |
MCO states reported a variety of other MCO policy changes implemented to respond to the COVID-19 pandemic. In many cases, MCO states reported that emergency authorities obtained by the states were applied to MCOs (see Introduction for more information on Medicaid emergency authorities). These include requirements to lift prior authorization requirements, waive cost sharing requirements, and relax certain provider credentialing requirements. Many MCO states also reported requiring MCOs to expand telehealth access, consistent with changes adopted for the FFS delivery system (see Benefits, Cost-Sharing, and Telehealth section for more information). Additional contract changes reported include:
- restructuring of provider incentive arrangements or suspension of provider performance penalties;
- changes to required MCO quality metric reporting and incentive programs;
- relaxation of certain reporting requirements;
- suspension of capitation withholds; and
- adjustments to the minimum medical loss ratio (MLR) requirement from a three-year standard to a one-year standard.
Massachusetts also directed its MCOs to contract with Community Support Program providers working in emergency overnight shelters that were expanded as a result of the pandemic.73
Tennessee: Response to COVID-19 through Managed Care
Tennessee reported many MCO policy changes in response to COVID-19, including:
Provider Support
- Refraining from denying claims or conducting normal utilization management-level of care reviews
- Eliminating the requirement of authorization reviews before patients would be moved from an acute level setting to the appropriate post-acute care setting
- Suspending requests of medical records to reduce administrative burdens on hospitals
- Suspending site of service reviews and postponing manual collection of medical records for Healthcare Effectiveness Data and Information Set (HEDIS) and in-office reviews
- Postponing audits and recoupments related to medical claims
- Suspending all re-credentialing requirements for providers and refraining from denying services if they were provided in an unlicensed space or non-traditional location
- Expediting the review of requests for use of experimental drugs and devices
- Supporting hospitals in establishing new service locations in non-traditional areas
Payment
- Creating new COVID-19 testing and diagnosis codes
- Accelerating claims processing to decrease interruption to cashflow
- Paying for all COVID-19 related services performed by hospital providers who do not yet have credentialing but do have a Medicaid provider ID
MCO states reported a variety of programs, initiatives, or value-added services newly offered by MCOs in response to the COVID-19 emergency. Although federal reimbursement rules prohibit expenditures for most non-medical services, plans may use administrative savings or state funds to provide these services. “Value-added” services are extra services outside of covered contract services and do not qualify as a covered service for the purposes of capitation rate setting. The most frequently mentioned offerings and initiatives were food assistance and home delivered meals (11 states) and enhanced MCO care management and outreach efforts often targeting persons at high risk for COVID-19 infection or complications or persons testing positive for COVID-19 (8 states). Other examples include states reporting MCO provision of personal protective equipment (4 states), expanded MCO telehealth and remote supports (3 states), expanded pharmacy home deliveries (3 states), and MCO-provided gift cards for members to purchase food and other goods (2 states).74 Texas, a state with a uniform preferred drug list (PDL) across FFS and its MCOs, reported coordinating with its MCOs to identify drug shortages to enable the state to adjust its formulary and uniform PDL accordingly.
Social Determinants of Health
Social determinants of health (SDOH) are the conditions in which people are born, grow, live, work, and age that shape health.75 Addressing SDOH is important for improving health and reducing longstanding disparities in health and health care. SDOH include but are not limited to housing, food, education, employment, healthy behaviors, transportation, and personal safety. Within the health care system, there are multi-payer federal and state initiatives as well as Medicaid-specific initiatives focused on addressing social needs. Although federal Medicaid reimbursement rules prohibit expenditures for most non-medical services,76 states have been developing strategies to identify and address enrollee social needs both within and outside of managed care. Medicaid MCOs may use administrative savings or state funds to provide some of these services.77
The pandemic has exacerbated the challenges for state Medicaid programs related to health care access and other SDOH and has shined a light on persistent health inequities and disparities due to the disparate impact of COVID-19 on people of color.78 Access to food, for example, is one area of growing need as many people have lost jobs and income and many children have lost access to school-provided meals due to school closures. At the same time, community food resources are facing higher service demands. Among Medicaid adults, 23% reported food insufficiency in the week ending July 21, 2020.79
SURVEY FINDINGS
Nearly two-thirds of responding states reported implementation, expansion, or reform of a program or initiative to address Medicaid enrollees’ SDOH in response to COVID-19 (27 states).80 States were asked whether the COVID-19 emergency caused their state to implement, expand, or reform a program or initiative to address enrollees’ SDOH, particularly related to housing and/or food insecurity. States reported a variety of initiatives, including many initiatives which are broader than Medicaid but may help Medicaid enrollees. Sixteen states reported efforts to address food insecurity and nine states reported efforts to address housing insecurity and homelessness. Four states implemented or enhanced technology platforms and phone call-in lines that support assistance identifying community resources to address SDOH (Exhibit 4).
| Exhibit 4: SDOH Programs and Initiatives Implemented in Response to COVID-19 (n = 43 states) | ||
| # of States | States | |
| Food insecurity | 16 | AK, AZ, HI, IA, IN, KS, MA, MI, MN, MT, NC, ND, NH, NJ, SC, VA |
| Housing insecurity and homelessness | 9 | AZ, CA, CT, HI, MA, MI, MN, NH, WA |
| Technology platforms or phone call-in that support identifying community resources to address SDOH | 4 | MI, NE, NC, PA |
| Increased SDOH survey, screenings, and assessments | 4 | KY, PA, VA, WV |
| Targeting social needs of people under quarantine | 2 | ME, NC |
Examples of new initiatives or policies states reported related to SDOH implemented during the public health emergency (PHE) include:
- Food Insecurity. Arizona expanded home-delivered meals to people with intellectual and developmental disabilities (I/DD). Minnesota created the Food Security Work Group, an interagency governmental structure to strategize, share information and leverage funds. This group will work to support food banks; to support and expand access to SNAP and school meals; and to increase access to food for seniors, individuals in homeless shelters, and Native American Indians.81 Montana, through the state’s Senior and Long-Term Care Division, sends frozen meals to very isolated individuals on the Northern Cheyenne and Crow reservations.
- Housing/Homelessness. Michigan put an eviction and foreclosure ban in place through July 15, 2020 and set up an eviction diversion program for households up to 100 percent of Area Median Income (AMI)82 facing eviction after the ban expired. California implemented Project RoomKey to fund hotel and motel rooms around the state that provide non-congregate shelter options for the sick and medically vulnerable who lack stable housing.83
- Social Services Referrals. North Carolina fast-tracked84 the rollout of NCCARE360, the country’s first statewide technology platform connecting health care and human services. This platform makes it easier for providers, insurers, and community-based organizations to connect residents with the community resources they need during the COVID-19 pandemic. Pennsylvania added requirements to Medicaid MCO agreements that MCOs must work with community-based organizations to address key SDOH, with their reimbursement tied to moderate and high-risk value-based payment arrangements which will increase over time. Virginia’s Medicaid MCOs have created a grant program for community- and faith-based organizations to support outreach programs related to SDOH.
Managed Long-Term Services and Supports
About half of the states have a capitated managed long-term services and supports (MLTSS) program in place. As of July 1, 2019, 27 states reported having an MLTSS program.85 Two states (Alabama and Washington) reported having a managed fee-for-service MLTSS model while the remaining 25 states covered LTSS through one or more of the following types of capitated managed care arrangements: Medicaid MCO covering Medicaid acute care and LTSS; PHP covering only Medicaid LTSS; MCO arrangement for dual eligible beneficiaries covering Medicaid and Medicare acute care and Medicaid LTSS services in a single, financially aligned contract under the federal Financial Alignment Initiative (FAI).
SURVEY FINDINGS
Non-Emergency MLTSS Policy Changes
States were asked to identify MLTSS policy changes in FY 2020 or planned for FY 2021 including changes to increase enrollment in capitated MLTSS contracts or to carve benefits/services in or out of MLTSS contracts.
Six states reported changes to their MLTSS programs in FY 2020 or FY 2021 (Exhibit 5). No states reported implementation of capitated MLTSS contracts or making enrollment mandatory for an additional population for the first time in FY 2020 or in FY 2021.
- Geographic expansions. Two states (Idaho and Pennsylvania) reported MLTSS expansion into new geographic regions in FY 2020 while one state (Massachusetts) reported geographic expansion in FY 2020 and planned geographic expansion in FY 2021. Idaho expanded IMPlus to an additional 13 counties in April 2020, while Pennsylvania completed the third phase of implementation of its MCO-based MLTSS program, Community HealthChoices, on January 1, 2020. One Care, Massachusetts’ MCO-based capitated FAI,86 expanded to an additional county in FY 2020 and proposed to fully expand to another two counties in FY 2021.
- Benefit/service changes. Three states (Arizona, Massachusetts, and New Jersey) carved in additional benefits/services to MLTSS contracts in FY 2020 while one state (Wisconsin) carved out benefits in FY 2020. Massachusetts added services to One Care (transitional living program, high intensity residential services, enhanced residential rehabilitation services to ensure member medical, mental health, and addiction needs are addressed, and recovery coaching). Arizona integrated behavioral health services into contracts with the Arizona Department of Economic Security Division of Development Disabilities (DDD). Arizona DDD contracted with MCOs effective October 1, 2019 to offer eligible members physical and behavioral health services, children’s rehabilitative services, and limited LTSS.87 New Jersey carved in autism services and some SUD services. In FY 2020, Wisconsin carved out most prescription outpatient drugs from Family Care Partnership, its integrated Medicare-Medicaid MLTSS program serving frail elderly and people with disabilities.88
| Exhibit 5: MLTSS Policy Changes, FY 2020 and FY 2021 (n = 19 states)* | ||
| FY 2020 | FY 2021 | |
| Implemented MCO contracts for the first time | – | – |
| Made enrollment mandatory for additional population(s) | – | – |
| Expanded MLTSS to new geographic region(s) | ID, MA, PA | MA |
| Carved in additional benefits/services | AZ, MA, NJ | – |
| Carved out benefits/services | WI | – |
| *n=19 states only include states that cover LTSS through MCO and/or PHP | ||
Long-term Services And Supports
Medicaid is the nation’s primary payer for long-term services and supports (LTSS).89 State Medicaid programs must cover LTSS in nursing homes, while most home and community-based services (HCBS) are optional, which results in considerable differences among states in HCBS eligibility, scope of benefits, and delivery systems.90 The COVID-19 pandemic has greater implications for people who utilize LTSS, who may be at increased risk for adverse health outcomes if infected with coronavirus due to their older age, underlying health conditions, and/or residence in congregate settings. Members of the long-term care (LTC) workforce—which is predominantly female and low wage, and disproportionately Black—are also at elevated risk of coronavirus infection.91 LTC facilities have implemented many protocols to mitigate the spread of the virus, such as visitor restrictions and universal testing of residents and staff. These new measures have played an important role in reducing the number of new LTC cases and deaths in later months of the pandemic. 92 However, given the close relationship between community transmission and LTC cases and deaths, there is still enormous state-level variation in patterns of new cases and deaths in LTC facilities. Notably, LTC cases and deaths continue to rise faster in “hotspot” states than “non-hotspot” states.93 As of October 8, 2020, LTC facilities across the country had reported a total of over 500,000 cases of COVID-19 as well as nearly 85,000 deaths related to the virus.94
As the pandemic continues, states have taken a number of Medicaid policy actions to address the impact on seniors and people with disabilities who rely on LTSS to meet daily self-care and independent living needs. These actions include expanding eligibility and streamlining enrollment, easing premium and/or cost-sharing requirements, enhancing benefits, increasing provider payment, modifying provider qualifications, and altering reporting requirements. Many of these policy changes have been adopted through temporary authorities that, according to CMS guidance,95 will expire when the COVID-19 public health emergency (PHE) declaration ends or are otherwise time-limited. Prior to that time, policymakers will need to assess whether any changes can or should be retained and transitioned to other authorities.96
Survey Findings
To better understand the impact of COVID-19 on the LTSS direct care workforce, we asked states to indicate whether they had a variety of concerns about the pandemic’s impact on HCBS and institutional direct care workers. We also asked states about whether COVID-19 has impacted institutional/HCBS rebalancing efforts and whether it has impacted access to non-home and residential HCBS settings. Finally, we asked states to identify the top three LTSS policy changes adopted in response to COVID-19 that they plan to retain after the PHE period.
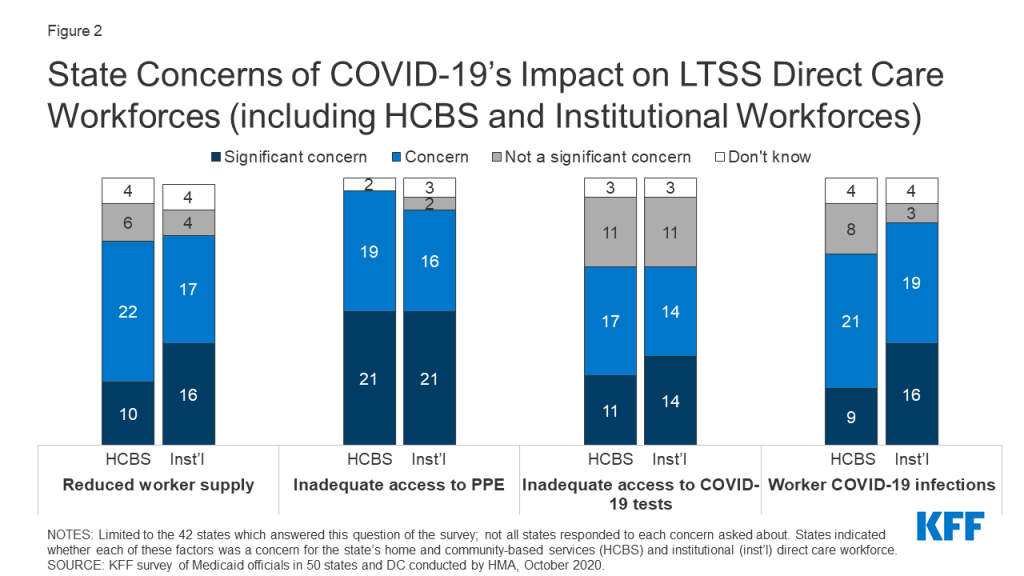
The majority of responding states reported concerns about the pandemic’s impact on the LTSS direct care workforce, with similar issues across HCBS and institutional settings (Figure 2). Specifically, states reported the following concerns:
- More than three-quarters of states reported concerns about reductions in LTSS direct care workforce supply as a result of the pandemic. At least five states reported that the LTSS direct care workforce supply was an issue prior to COVID-19 but has become a greater issue during the pandemic; in general, LTSS direct care workforce supply was an issue for many states prior to the pandemic.97 Using HCBS Appendix K emergency authority, some states are providing overtime and the use of legally responsible relatives (such as parents or spouses) as paid caregivers to address workforce supply issues.98
- Nearly all states reported concerns about access to personal protective equipment (PPE) for LTSS direct care workers. A few states noted that they were prioritizing supply of PPE for workers in institutional or congregate settings.99
- Nearly three-quarters of states reported concerns about access to COVID-19 tests for LTSS direct care workers. Several states reported the length of COVID-19 test processing times as a particular challenge.
- Over two-thirds of states reported concerns about COVID-19 infections among LTSS direct care workers. Several states noted that better access to PPE and testing would help mitigate concern about infections.
Some states noted some improvements since the beginning of the pandemic in workforce supply, access to PPE and testing, and ability to control infection rates, while a few states identified specific LTSS populations or geographic areas that presented particular issues or concerns. For example, a few states reported issues with workforce, testing, and infection rates specifically for the population with intellectual and developmental disabilities (I/DD). A small number of states noted that workforce issues, distribution of PPE, and testing (due to lack of transportation to testing sites) were of greater concern for rural areas.
State responses regarding COVID-19 implications on state institutional/HCBS rebalancing efforts were mixed. Most frequently, states did not expect the pandemic to have an impact on rebalancing efforts to support more people in community-based over institutional settings. Several states, however, indicated that the pandemic would halt or delay HCBS expansion and others reported that fewer nursing facility transitions to the community would occur. Fewer states indicated that the pandemic would likely drive further rebalancing. Several states reported that the potential impact was unknown and/or was under review. Finally, a few states specifically indicated that negative fiscal and budget impacts resulting from the pandemic may delay rebalancing. When asked about access to existing HCBS services, nearly all responding states reported reduced access to non-home HCBS settings such as adult day health and day habilitation as a result of the COVID-19 pandemic, while fewer states reported reduced access to residential HCBS settings. Although residential settings were less likely to be closed or eliminated in response to the pandemic, these settings were still impacted by the pandemic including by its effects on the direct care workforce (as described above).
States noted plans to retain a variety of LTSS policy changes adopted in response to COVID-19 after the PHE period ends, most commonly citing the continuation of telehealth expansions. As many LTSS emergency policy changes were adopted through time-limited temporary authorities (some of which will expire with the end of the PHE), states may need to assess how to retain changes and transition to other authorities.100 Fourteen states reported they are still evaluating whether LTSS policy changes will be continued and three states reported that there are no plans to retain LTSS policy changes after the PHE declaration or other Medicaid emergency authority (such as HCBS waiver Appendix K) expires. The remaining states indicated plans to continue policy changes including:
- Telehealth expansions. The majority of responding states reported plans to retain telehealth or remote provision of HCBS services (21 states), far exceeding all other types of LTSS policy changes reported. For example, a few states mentioned plans to continue allowing personal care monitoring to be delivered via telehealth. (See Benefits, Cost-Sharing, and Telehealth section for more information on state expansions of telehealth for services including HCBS.)
- Streamlined processes for LTSS eligibility determinations and service authorizations. Six states cited continued remote delivery of assessments, reassessments, and case management (Connecticut, Minnesota, North Carolina, North Dakota, Oklahoma, and Oregon). A small number of states also mentioned continuing to allow verbal consent and electronic signatures, accepting self-attestation to verify Medicaid applications for aged, blind and disabled populations, and streamlining utilization review. (See Eligibility section for more information on changes to eligibility determination processes.)
- Changes to provider enrollment processes. Five states reported an intent to keep changes made to LTSS provider enrollment and training processes including simplification, modified qualifications, and recruitment techniques (Florida, New Hampshire, North Dakota, Oregon, and Washington). A couple of states also mentioned an intent to retain remote provider site inspections.
- Increased access to paid family caregiver services. Three states reported plans to continue allowing family members to provide certain services (Connecticut, Maine,101 and North Dakota).102
- Other LTSS policy changes. Other types of policies cited for retention by one or two states include modifications to provider payments (such as providing overtime or tying nursing facility reimbursement to quality and infection control), expansions of settings where HCBS may be delivered (such as acute hospital settings), and increased access to certain benefits (such as home delivered meals and assistive technology).
Benefits, Cost-sharing, And Telehealth
Prior to the COVID-19 pandemic, the most common state changes to Medicaid benefits were enhancements of mental health and substance use disorder (SUD) services. In recent years, the number of states reporting benefit expansions outpaced the number of states reporting benefit restrictions. For FY 2019 and FY 2020, more states reported policies to eliminate or reduce cost-sharing requirements than those that reported new or increased cost-sharing requirements.103 The COVID-19 pandemic has shifted state priorities for Medicaid benefits and cost-sharing, with states utilizing Medicaid emergency authorities to adopt new benefits, adjust existing benefits, and/or waive prior authorization requirements.104
In particular, states have focused on expanding telehealth access for Medicaid beneficiaries to increase health care accessibility and limit risk of exposure during the pandemic.105 Prior to the pandemic, the use of telehealth in Medicaid was becoming more common and all states had some form of Medicaid coverage for services delivered via telehealth; however, the scope of this coverage varied widely across states and many included restrictions on allowable services, providers, and originating sites.106 In response to COVID-19, states have utilized Medicaid emergency authorities to expand telehealth107 as well as taken advantage of broad authority to further expand telehealth without the need for CMS approval. To guide states considering telehealth expansions, CMS released a State Medicaid & CHIP Telehealth Toolkit on April 23, 2020 which identified key areas of telehealth for state consideration, including what services can be delivered via telehealth; what kinds of sites can serve as originating sites (patient location); payment rates for services; technological modalities that can be used to deliver services; and whether Medicaid managed care organizations (MCOs) are required to cover all services that are available in fee-for-service (FFS) Medicaid.108
Survey Findings
We asked states about non-emergency benefit and cost-sharing changes unrelated to COVID-19 planned for FY 2021. Further, to better understand the impact of COVID-19 on Medicaid benefit design and coverage policy, we asked about emergency benefit and cost-sharing changes made in response to the pandemic and, specifically, whether states planned to adopt the changes on a more permanent basis. Finally, we asked states about recent changes in FFS telehealth coverage policy and whether these changes were likely to continue past the public health emergency (PHE) period.
Non-Emergency Changes to Benefits and Cost-Sharing
Less than one-third of responding states plan to make benefit or cost-sharing changes that are not related to the COVID-19 pandemic in FY 2021 (12 states). Many states have not determined whether they will adopt any non-emergency benefit or cost-sharing changes (12 states), with at least one state noting that uncertainty regarding the length of the PHE period and its budgetary impact is a barrier to determining FY 2021 benefit and cost-sharing changes. Key reported changes for FY 2021, excluding telehealth coverage changes, include the following:
- Seven states are adding or expanding benefits (Alaska, California, Hawaii, Idaho, Montana, Texas, and Wisconsin). Reported benefit changes include expanded home and community-based (HCBS) services as well as behavioral health (BH) and SUD services, consistent with findings in prior years.109
- Two states are eliminating or restricting benefits (Alaska and Wyoming). Alaska is adding prior authorization requirements for benefits that include non-preventive dental, vision, and therapies. Wyoming is removing its chiropractic benefit for all individuals, limiting some HCBS services, and reducing its adult vision and dental benefits.
- Four states (Colorado, Idaho, Michigan, and South Dakota) will be implementing new or expanded co-payments for a variety of services, or other cost-sharing. Idaho and Michigan report that these changes will apply to the Medicaid expansion population.
- Two states (California and Massachusetts) will be eliminating or reducing certain co-payments in FY 2021.
Benefit Changes in Response to COVID-19
Approximately one-third of responding states intend to extend other benefit and cost-sharing changes adopted during the PHE period (15 states); many of these are pharmacy changes. (See the Pharmacy Cost Containment Actions section of this report for more information on state pharmacy changes.) Similar numbers of states said they would not extend changes adopted in response to the PHE (15 states) or that they had not yet determined whether the changes would be extended (13 states). The benefit changes states were most likely to extend beyond the PHE period include covering a 90-day drug supply (five states), relaxing various documentation and other authorization or referral requirements to qualify for long-term care or HCBS (six states), and relaxing or waiving certain prior authorization requirements for some services (five states). A few states also indicated they would retain other pharmacy changes, including paying for prescription deliveries (two states), allowing pharmacists to administer medications and/or vaccines (two states), and covering additional types of medication (two states).
Telehealth Policy Changes in Response to COVID-19
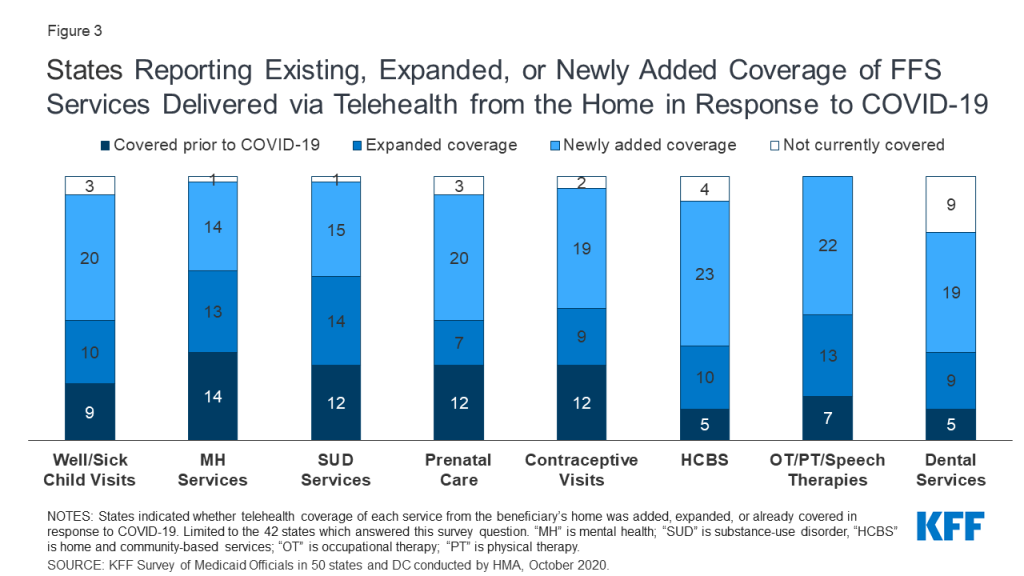
The majority of responding states report covering a range of FFS services delivered via telehealth when the originating site is the beneficiary’s home; most of these states newly added or expanded this coverage in response to the COVID-19 pandemic (Figure 3). States most commonly reported adding or expanding telehealth delivery from the beneficiary’s home for occupational therapy (OT), physical therapy (PT), and speech therapy (35 states), followed by home and community-based services (HCBS) (33 states) and well/sick child visits (30 states). Several states noted they had utilized Section 1915 (c) Appendix K emergency authority to expand telehealth in their HCBS waivers.110
Most states reported that FFS services delivered via telehealth from the beneficiary’s home have payment parity as compared to services delivered face-to-face. Payment parity for telehealth increases access for patients by incentivizing providers to offer services delivered via telehealth.111 Most states reported that reimbursement was the same for telehealth and in-person delivery of all FFS services asked about (well/sick child visits, mental health services, SUD services, prenatal care, contraceptive visits, HCBS, OT/PT/speech therapies, and dental services).
Just over half of responding states report plans to extend newly added/expanded FFS telehealth coverage when the beneficiary’s home is the originating site beyond the PHE period (Figure 4 and Table 3). Twenty-two states report that they will continue newly added/expanded telehealth coverage, at least in part and at least for some services. For most services with newly added/expanded coverage, however, the majority of states have not yet determined whether this coverage will continue beyond the PHE period. (See the Long-Term Services and Supports section for more information on state plans to retain telehealth or remote provision of long-term services and supports including HCBS after the end of the PHE).
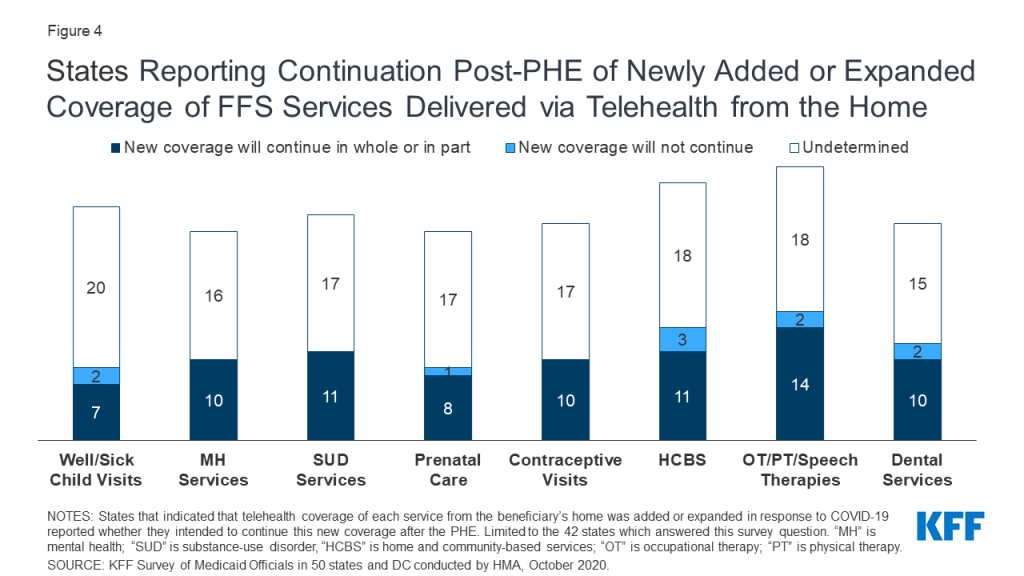
States also reported other policies aimed at making telehealth widely accessible in response to COVID-19. Thirty-nine out of 42 responding states expanded available telehealth modalities in response to the pandemic, with telephone (or voice-only) most frequently reported. As one state noted, this expansion is important because beneficiaries may lack access to broadband internet. States also reported covering digital platforms, such as FaceTime, Zoom, and Skype. At least two states, Florida and Virginia, began allowing remote patient monitoring as a type of newly expanded telehealth service delivery. All responding states that contract with managed care organizations (MCOs) required MCOs to implement newly adopted FFS telehealth changes; three of these states required MCOs only to implement FFS telehealth changes in part. Tennessee, a state with 100% of its beneficiaries enrolled in managed care, indicated it worked closely with its MCOs to coordinate and increase use of telehealth.112 In Minnesota, some contracted MCOs cover virtual e-visits as an “in lieu of” services.113
TABLE 3: STATES PLANNING TO CONTINUE NEWLY ADDED OR EXPANDED COVERAGE OF FFS SERVICES DELIVERED VIA TELEHEALTH FROM THE BENEFICIARY’S HOME
| Does State Plan to Continue Newly Added/Expanded Telehealth Coverage From the Home Post-PHE? | ||||||||
| States | Well/Sick Child Visits | Mental Health Services | SUD Services | Prenatal Care Visits | Contraceptive Visits | HCBS | OT, PT, Speech Therapies | Dental Services |
| Alabama | ? | ? | ? | ? | ? | ? | ? | ? |
| Alaska | NA | ? | ? | ? | ? | Yes, in part | Yes, in part | NA |
| Arizona | Covered Pre-PHE | Covered Pre-PHE | Covered Pre-PHE | NA | NA | Covered Pre-PHE | Covered Pre-PHE | Covered Pre-PHE |
| Arkansas | ? | ? | ? | ? | ? | NA | ? | NA |
| California | ? | Covered Pre-PHE | ? | Covered Pre-PHE | Covered Pre-PHE | ? | Covered Pre-PHE | ? |
| Colorado | NA | Covered Pre-PHE | Covered Pre-PHE | Covered Pre-PHE | Covered Pre-PHE | Yes | Yes | ? |
| Connecticut | ? | Covered Pre-PHE | Covered Pre-PHE | ? | ? | Yes, in part | ? | NA |
| Delaware* | ||||||||
| DC* | ||||||||
| Florida | ? | ? | ? | NA | ? | ? | ? | Covered Pre-PHE |
| Georgia | ? | ? | ? | ? | ? | Covered Pre-PHE | ? | Covered Pre-PHE |
| Hawaii | Covered Pre-PHE | Covered Pre-PHE | Covered Pre-PHE | Covered Pre-PHE | Covered Pre-PHE | NA | ? | ? |
| Idaho | Covered Pre-PHE | Covered Pre-PHE | Yes, in part | Yes, in part | Yes, in part | Yes, in part | Yes, in part | ? |
| Illinois* | ||||||||
| Indiana | ? | Yes, in part | Yes, in part | ? | ? | ? | Yes, in part | NA |
| Iowa | ? | ? | ? | ? | ? | ? | ? | Yes |
| Kansas | NA | ? | ? | NA | NA | ? | ? | NA |
| Kentucky | ? | ? | ? | ? | Covered Pre-PHE | ? | Covered Pre-PHE | ? |
| Louisiana | ? | NA | NA | ? | ? | ? | ? | ? |
| Maine | Covered Pre-PHE | Covered Pre-PHE | Covered Pre-PHE | Covered Pre-PHE | Covered Pre-PHE | Yes | Covered Pre-PHE | Yes |
| Maryland | ||||||||
| Massachusetts | Yes | Yes | Yes | Yes | Yes | ? | Yes | ? |
| Michigan | Yes | Yes | Yes | Yes | Yes | ? | ? | ? |
| Minnesota | ? | ? | ? | ? | ? | ? | ? | ? |
| Mississippi | ? | ? | ? | ? | ? | ? | ? | NA |
| Missouri | Covered Pre-PHE | Covered Pre-PHE | Covered Pre-PHE | Covered Pre-PHE | Covered Pre-PHE | Covered Pre-PHE | Yes | Yes |
| Montana | Covered Pre-PHE | ? | ? | Covered Pre-PHE | Covered Pre-PHE | ? | Covered Pre-PHE | Yes |
| Nebraska | ? | Yes, in part | Yes, in part | ? | ? | NA | Yes, in part | Yes, in part |
| Nevada | Covered Pre-PHE | Covered Pre-PHE | Covered Pre-PHE | Covered Pre-PHE | Covered Pre-PHE | ? | ? | Covered Pre-PHE |
| New Hampshire | Yes, in part | Yes, in part | Yes, in part | Yes, in part | Yes, in part | Yes, in part | Yes, in part | Yes, in part |
| New Jersey | ? | ? | ? | ? | ? | ? | ? | ? |
| New Mexico* | ||||||||
| New York* | ||||||||
| North Carolina | No | Yes, in part | Yes, in part | No | Yes, in part | Yes, in part | Yes, in part | No |
| North Dakota | ? | ? | ? | ? | ? | No | ? | NA |
| Ohio* | ||||||||
| Oklahoma | No | Yes, in part | Yes, in part | Yes | Yes | Yes | No | No |
| Oregon | Yes, in part | Yes, in part | Yes, in part | Yes, in part | Yes, in part | Yes | Yes, in part | Yes, in part |
| Pennsylvania | Yes | Yes, in part | Yes, in part | Yes | Yes | ? | Yes | Yes |
| Rhode Island* | ||||||||
| South Carolina | ? | ? | ? | ? | ? | No | ? | ? |
| South Dakota | ? | Covered Pre-PHE | Covered Pre-PHE | Covered Pre-PHE | Covered Pre-PHE | NA | Yes, in part | ? |
| Tennessee | ||||||||
| Texas | ? | Covered Pre-PHE | Covered Pre-PHE | Covered Pre-PHE | Covered Pre-PHE | No | No | NA |
| Utah* | ||||||||
| Vermont | Covered Pre-PHE | Covered Pre-PHE | Covered Pre-PHE | Covered Pre-PHE | Covered Pre-PHE | Covered Pre-PHE | Covered Pre-PHE | Covered Pre-PHE |
| Virginia | ? | ? | ? | ? | ? | ? | ? | Yes |
| Washington | Yes, in part | Covered Pre-PHE | Covered Pre-PHE | Covered Pre-PHE | Yes, in part | Covered Pre-PHE | Covered Pre-PHE | ? |
| West Virginia | ? | ? | ? | ? | ? | ? | ? | ? |
| Wisconsin | Yes | Yes | Yes, in part | Yes | Yes | Yes, in part | Yes | Yes, in part |
| Wyoming | Covered Pre-PHE | Covered Pre-PHE | Covered Pre-PHE | Covered Pre-PHE | Covered Pre-PHE | Yes, in part | Yes, in part | NA |
| Yes, in all or part | 7 | 10 | 11 | 8 | 10 | 11 | 14 | 10 |
| No | 2 | 0 | 0 | 1 | 0 | 3 | 2 | 2 |
| Undetermined (?) | 20 | 16 | 17 | 17 | 17 | 18 | 18 | 15 |
| Covered Pre-PHE | 9 | 14 | 12 | 12 | 12 | 5 | 7 | 5 |
| NA, not covered | 3 | 1 | 1 | 3 | 2 | 4 | 0 | 9 |
| NOTES: States were asked whether newly added/expanded FFS telehealth coverage of each service from the beneficary’s home would continue after the PHE. SUD: Substance-use disorder. HCBS: Home and community-based services. OT: Occupational therapy. PT: Physical therapy. NA: State does not cover this service delivered via telehealth from the beneficiary’s home. Covered Pre-PHE (pre-public health emergency): the state covers this service delivered via telehealth from the beneficary’s home, but this coverage was not newly added/expanded in response to the PHE. “?” indicates that the state has newly added or expanded coverage of this service delievered via telehealth from the beneficiary’s home in response to the PHE, but has not yet determined whether to continue this coverage. “”*” indicates the state did not submit a survey by mid-August 2020 (DC, DE, IL, NM, NY, OH, RI, UT). Additionally, MD and TN submitted surveys but did not report data for this question.SOURCE: KFF Survey of Medicaid Officials in 50 states and DC conducted by Health Management Associates, October 2020 | ||||||||
Pharmacy Cost Containment Actions
Managing the Medicaid prescription drug benefit and pharmacy expenditures remains a policy priority for state Medicaid programs, and state policymakers remain concerned about Medicaid prescription drug spending growth. Because state Medicaid programs are required to cover all drugs from manufacturers that have entered into a federal rebate agreement (in both managed care and FFS settings), states cannot limit the scope of covered drugs to control drug costs. Instead, states use an array of payment strategies and utilization controls to manage pharmacy expenditures, including preferred drug lists (PDLs), multi-state purchasing pools, and managed care pharmacy carve-outs.114 States continue to update and refine their drug utilization controls to respond to changes, especially new product offerings, in the pharmaceutical marketplace.
Survey Findings
In this year’s survey, states were asked to describe any new or expanded pharmacy program cost containment strategies planned for FY 2021. States were asked to exclude routine updates to PDLs or state maximum allowable cost programs as these utilization management strategies are employed by states regularly and are not typically considered major new policy initiatives.
Thirty-three out of 43 responding states reported newly implementing or expanding upon at least one initiative to contain costs in the area of prescription drugs in FY 2021. Pharmacy cost containment actions included implementation of new policies (23 states) as well as expansion of policies adopted in prior years (19 states). Frequently reported pharmacy cost containment strategies include expanded PDLs (11 states), new or expanded value-based purchasing arrangements that link pharmacy reimbursement to patient outcomes (11 states), and targeted reforms to address transparency or other pharmacy benefit manager (PBM) concerns (7 states).115
Three states report adopting a uniform PDL in FY 2021 (Kentucky, Massachusetts, and Michigan) and North Carolina plans to use a uniform PDL for FFS and managed care when it implements managed care in FY 2022. In FY 2021, one state is carving the prescription drug benefit out of managed care organization (MCO) contracts (California) and three states report newly carving out certain high cost drugs (Iowa, Maryland, and South Carolina). North Dakota implemented a pharmacy carve out in FY 2020 and Nevada plans to carve out the prescription drug benefit effective in FY 2023, when MCO contracts are renewed. Both Michigan and Missouri will be partnering with other state agencies or initiatives to purchase drugs at lower costs, including Michigan’s Hepatitis C initiative aimed at reducing pharmacy and medical costs associated with the disease and working to eliminate Hepatitis C altogether.
Challenges And Priorities In Fy 2021 And Beyond Reported By Medicaid Directors And Conclusion
Most state Medicaid officials remained heavily focused on their response to the COVID-19 public health emergency (PHE), taking action to assure health care access for a growing number of Medicaid beneficiaries while working to maintain the fiscal integrity of their programs. At the same time, many states also reported plans to move forward on other high priority initiatives.
Nearly all states reported significant adverse economic and state budgetary impacts driven by the pandemic, as well as uncertainty about the future. Many states commented on dramatic declines in state revenue collections leading to significant state budget shortfalls. While the full scope and extent of the economic downturn remains unknown, nine states indicated that its negative impacts were likely to exceed those of the Great Recession and nine states reported planning for or expecting future Medicaid budget reductions. At the same time, many states commented on the increased Medicaid enrollment expected to occur as a result of the economic downturn and high unemployment rates, placing added fiscal pressure on state Medicaid programs. Most responding states reported that dealing with state Medicaid budget and fiscal concerns was one of the biggest challenges facing the states in the coming year. Many states also commented on the great fiscal uncertainties that states currently face including how long the current enhanced FMAP will remain in place and how the course of the pandemic will continue to impact state economies and unemployment rates.
Many states reported the need for ongoing or greater fiscal relief as well as the need to strengthen the provider relief program for Medicaid-dependent providers to be able to continue to address the pandemic. Most states noted that state and federal responses to the pandemic were effective, but some states also identified needs related to improving or expanding federal communication efforts and guidance, further streamlining the emergency authority process, and receiving advance notice regarding when the PHE period will end. A few states were critical of the federal response regarding public health guidance (including mask wearing), the availability of personal protective equipment, and testing (e.g., supplies, distribution, inconsistent advice, and effectiveness of the tests).
At the time states responded to this survey in late July and early August, most indicated that the worst effects of the pandemic were likely still ahead or were unknown. Several states also commented on future challenges to treat the lingering impacts of COVID-19 infections as well as the population health impacts resulting from delayed health care utilization. A few states also expressed concern regarding the longer-term impact of the COVID-19 pandemic on the Medicaid provider network and access due, for example, to business closures. States also mentioned key priorities such as restoring utilization of preventive and routine care and transitioning from emergency authorities after the PHE ends.
Nearly half of responding states indicated that delivery system and payment reforms are a key priority. Efforts to better align payment with quality and improved health outcomes remain an important focus area for many states. States are pursuing these goals in part through managed care contract changes focused on value-based payment initiatives and the social determinants of health. States also mentioned efforts to integrate physical health and behavioral health, expand Health Homes116 , reform provider reimbursement methodologies, implement substance use disorder initiatives, and develop maternal health initiatives. Ten states also reported that assessing and/or expanding telehealth was a priority. Other priorities mentioned by multiple states include: implementation or pursuit of Section 1115 demonstration waivers, waiver amendments, or waiver renewals; technology projects (e.g., Medicaid Management Information System replacements and integrated eligibility and enrollment systems); improving quality metrics and eliminating health disparities and inequities; long-term services and supports reforms; and implementing or advocating for the ACA Medicaid expansion in states that have not adopted the expansion.
Conclusion
In the face of the COVID-19 pandemic, states continue to encounter challenges to provide Medicaid coverage and access for a growing number of Americans, while also facing plummeting revenues and deepening state budget gaps. State Medicaid officials highlighted swift and effective state responses to the pandemic, such as the rapid expansion of telehealth, as well as ongoing efforts to advance delivery system reforms and to address health disparities and other public health challenges. In these ways, the pandemic has demonstrated how Medicaid can quickly evolve to address the nation’s most pressing health care challenges. However, the ability of states to sustain policies adopted in response to the pandemic (including through emergency authorities) may be tied to the length of the public health emergency (PHE) as well as the availability of additional federal fiscal relief and support. Looking ahead, great uncertainty remains regarding the future course of the pandemic, the scope and length of federal fiscal relief efforts, and what the “new normal” will be in terms of service provision and demand. Results of the November 2020 elections could also have significant implications for the direction of federal Medicaid policy in the years ahead.
Methods
KFF commissioned Health Management Associates (HMA) to survey Medicaid directors in all 50 states and the District of Columbia to identify and track trends in Medicaid spending, enrollment, and policy making. This is the 20th annual survey, each conducted at the beginning of the state fiscal year from FY 2002 through FY 2021. Additionally, eight mid-fiscal year surveys were conducted during state fiscal years 2002-2004 and 2009-2013, when a large share of states were considering mid-year Medicaid policy changes due to state budget and revenue shortfalls. Findings from previous surveys are referenced in this report when they help to highlight current trends. Archived copies of past reports are available on the following page.117
The KFF/HMA Medicaid survey on which this report is based was conducted from June through August 2020. The survey instrument (in Appendix B) was designed to primarily document policy actions implemented or adopted for FY 2021 (which began for most states on July 1, 2020).118 The survey captures information consistent with previous surveys, particularly for eligibility, provider payment rates, benefits, long-term care, and managed care, to provide some trend information. Each year, questions are added or revised to address current issues. This year, in light of the ongoing COVID-19 pandemic, the survey was scaled back in length and scope and a number of questions were added or reframed to capture information regarding state actions taken or planned in response to the pandemic.
Medicaid directors and staff provided data for this report in response to a written survey and, in some cases, follow-up emails seeking additional information or clarifications. Unlike the surveys conducted in prior years, the project team did not conduct follow-up telephone interviews. The survey was sent to each Medicaid director in June 2020 and 43 states 119 provided responses by mid-August 2020.
The survey does not attempt to catalog all Medicaid policies in place for each state. This report highlights certain policies in place in state Medicaid programs in FY 2020 and policy changes implemented or planned for FY 2021. Experience has shown that adopted policies are sometimes delayed or not implemented for reasons related to legal, fiscal, administrative, systems, or political considerations, or due to delays in approval from CMS. Policy changes under consideration without a definite decision to implement are not included in the survey. Given differences in the financing structure of their programs, the U.S. territories were not included in this analysis.
Appendix A: Acronym Glossary
ABD – aged, blind, and disabled
ACA – Affordable Care Act
AMI – Area Median Income
BH – behavioral health
CARES – Coronavirus Aid, Relief, and Economic Security Act
CDC – The Centers for Disease Control and Prevention
CHIP – Children’s Health Insurance Program
CMS – The Centers for Medicare and Medicaid Services
DRG – Diagnosis Related Group
EMS – emergency medical services
EPSDT – Early and Periodic Screening, Diagnostic, and Treatment
FAI – Financial Alignment Initiative
FFCRA – Families First Coronavirus Response Act
FFS – fee-for-service
FMAP – Federal Medicaid Assistance Percentage
FPL – federal poverty level
FY – state fiscal year
HCBS – home and community-based services
HEDIS – Healthcare Effectiveness Data and Information Set
ICF-ID – intermediate care facility for individuals with intellectual disabilities
I/DD – intellectual and developmental disabilities
IGT – intergovernmental transfer
LTC – long-term care
LTSS – long-term services and supports
MAGI – modified adjusted gross income
MAT – medication assisted treatment
MCO – managed care organization
MLTSS – managed long-term services and supports
MLR – medical loss ratio
MOE – maintenance of eligibility
NEMT – non-emergency medical transportation
OB/GYN – obstetrician and gynecologist OT – occupational therapy
PBM – pharmacy benefit manager
PCCM – primary care case management
PCP – primary care physician
PDL – preferred drug list
PHE – public health emergency
PHP – prepaid health plan
PPE – personal protective equipment PT – physical therapy
SDOH – social determinants of health
SED – serious emotional disturbance
SNAP – Supplemental Nutrition Assistance Program
SPA – State Plan Amendment
SPMI – severe and persistent mental illness
SUD – substance use disorder
Appendix B: Survey Instrument
Download the Survey (.pdf)
Endnotes
- Pub. L. 116-127 (March 18, 2020), https://www.congress.gov/116/plaws/publ127/PLAW-116publ127.pdf. ↩︎
- FMAP = Federal Medicaid Assistance Percentage ↩︎
- MaryBeth Musumeci, Key Questions About the New Increase in Federal Medicaid Matching Funds for COVID-19 (Washington, DC: KFF, May 4, 2020), https://modern.kff.org/coronavirus-covid-19/issue-brief/key-questions-about-the-new-increase-in-federal-medicaid-matching-funds-for-covid-19/ ↩︎
- US Department of Health and Human Services, Renewal of Determination That A Public Health Emergency Exists (October 2, 2020), https://www.phe.gov/emergency/news/healthactions/phe/Pages/covid19-2Oct2020.aspx ↩︎
- State fiscal years begin on July 1 except for these states: New York on April 1; Texas on September 1; Alabama, Michigan, and DC on October 1. ↩︎
- The eight states that did not respond by mid-August 2020 are: Delaware, District of Columbia, Illinois, Ohio, New Mexico, New York, Rhode Island, and Utah. ↩︎
- MaryBeth Musumeci, Key Questions About the New Increase in Federal Medicaid Matching Funds for COVID-19 (Washington, DC: KFF, May 4, 2020), https://modern.kff.org/coronavirus-covid-19/issue-brief/key-questions-about-the-new-increase-in-federal-medicaid-matching-funds-for-covid-19/ ↩︎
- Rachel Dolan, Robin Rudowitz, and Samantha Artiga, Medicaid Maintenance of Eligibility (MOE) Requirements: Issues to Watch When They End (Washington, DC: KFF, September 22, 2020), https://modern.kff.org/medicaid/issue-brief/medicaid-maintenance-of-eligibility-requirements-issues-to-watch-when-they-end/ ↩︎
- KFF, “Medicaid Emergency Authority Tracker: Approved State Actions to Address COVID-19,” last updated October 7, 2020, https://modern.kff.org/medicaid/issue-brief/medicaid-emergency-authority-tracker-approved-state-actions-to-address-covid-19/ ↩︎
- Since the time of survey submission, two additional responding states (Connecticut and North Carolina) have received SPA approvals for this group. For an updated count of states with SPA approval to cover the new Uninsured Coronavirus Testing group, see: KFF, “Medicaid Emergency Authority Tracker: Approved State Actions to Address COVID-19,” last updated October 7, 2020, https://modern.kff.org/medicaid/issue-brief/medicaid-emergency-authority-tracker-approved-state-actions-to-address-covid-19/ ↩︎
- KFF, “Status of State Medicaid Expansion Decisions”, last updated October 1, 2020, https://modern.kff.org/medicaid/issue-brief/status-of-state-medicaid-expansion-decisions-interactive-map/ ↩︎
- Karyn Schwartz, Jennifer Tolbert, Karen Pollitz, and Tricia Neuman, Update on COVID-19 Funding for Hospitals and Other Providers (Washington, DC: KFF, April 24, 2020), https://modern.kff.org/policy-watch/update-on-covid-19-funding-for-hospitals-and-other-providers/ ↩︎
- KFF, “Total Medicaid MCO Enrollment,” 2018, https://modern.kff.org/other/state-indicator/total-medicaid-mco-enrollment/?currentTimeframe=0&sortModel=%7B%22colId%22:%22Location%22,%22sort%22:%22asc%22%7D ↩︎
- Samantha Artiga and Elizabeth Hinton, Beyond Health Care: The Role of Social Determinants in Promoting Health and Health Equity (Washington, DC: KFF, May 10, 2018), https://modern.kff.org/racial-equity-and-health-policy/issue-brief/beyond-health-care-the-role-of-social-determinants-in-promoting-health-and-health-equity/ ↩︎
- Molly O’Malley Watts, MaryBeth Musumeci, and Priya Chidambaram, Medicaid Home and Community-Based Services Enrollment and Spending (Washington, DC: KFF, February 4, 2020), https://modern.kff.org/report-section/medicaid-home-and-community-based-services-enrollment-and-spending-issue-brief/ ↩︎
- MaryBeth Musumeci, Rachel Dolan, and Madeline Guth, State Actions to Sustain Medicaid Long-Term Services and Supports During COVID-19 (Washington, DC: KFF, August 26, 2020), https://modern.kff.org/medicaid/issue-brief/state-actions-to-sustain-medicaid-long-term-services-and-supports-during-covid-19/ ↩︎
- Kathleen Gifford et al., “Benefits and Cost-Sharing,” A View from the States: Key Medicaid Policy Changes (Washington, DC: KFF, October 18, 2019), https://modern.kff.org/report-section/a-view-from-the-states-key-medicaid-policy-changes-benefits-and-cost-sharing/ ↩︎
- US Department of Health and Human Services, Renewal of Determination That A Public Health Emergency Exists (October 2, 2020), https://www.phe.gov/emergency/news/healthactions/phe/Pages/covid19-2Oct2020.aspx ↩︎
- KFF, “Health Insurance Coverage of the Total Population,” 2018, https://modern.kff.org/other/state-indicator/total-population/?currentTimeframe=0&sortModel=%7B%22colId%22:%22Location%22,%22sort%22:%22asc%22%7D ↩︎
- U.S. Centers for Medicare & Medicaid Services (CMS). National Health Expenditure Data Fact Sheet: Table 4, National Health Expenditures by Source of Funds and Type of Expenditure: Calendar Years 2011-2018 (CMS, March 2020), https://www.cms.gov/Research-Statistics-Data-and-Systems/Statistics-Trends-and-Reports/NationalHealthExpendData/NHE-Fact-Sheet.html ↩︎
- Pub. L. 116-127 (March 18, 2020), https://www.congress.gov/116/plaws/publ127/PLAW-116publ127.pdf. ↩︎
- Pub. L. 116-136 (March 27, 2020), https://www.congress.gov/116/bills/hr748/BILLS-116hr748enr.pdf. ↩︎
- MaryBeth Musumeci, Key Questions About the New Increase in Federal Medicaid Matching Funds for COVID-19 (Washington, DC: KFF, May 4, 2020), https://modern.kff.org/coronavirus-covid-19/issue-brief/key-questions-about-the-new-increase-in-federal-medicaid-matching-funds-for-covid-19/ ↩︎
- KFF, “Medicaid Emergency Authority Tracker: Approved State Actions to Address COVID-19,” last updated October 7, 2020, https://modern.kff.org/medicaid/issue-brief/medicaid-emergency-authority-tracker-approved-state-actions-to-address-covid-19/ ↩︎
- MaryBeth Musumeci, Rachel Dolan, and Madeline Guth, Appendix to State Actions to Sustain Medicaid Long-Term Services and Supports During COVID-19 (Washington, DC: KFF, August 26, 2020), https://modern.kff.org/report-section/state-actions-to-sustain-medicaid-long-term-services-and-supports-during-covid-19-appendix/ ↩︎
- KFF 50-State Medicaid Budget Survey Archives (Washington, DC: KFF, October 2020), https://modern.kff.org/medicaid/report/medicaid-budget-survey-archives/. ↩︎
- The eight states that did not respond by mid-August 2020 are: Delaware, District of Columbia, Illinois, Ohio, New Mexico, New York, Rhode Island, and Utah. ↩︎
- State fiscal years begin on July 1 except for these states: New York on April 1; Texas on September 1; Alabama, Michigan, and DC on October 1. ↩︎
- Pub. L. 116-127 (March 18, 2020), https://www.congress.gov/116/plaws/publ127/PLAW-116publ127.pdf. ↩︎
- Pub. L. 116-136 (March 27, 2020), https://www.congress.gov/116/bills/hr748/BILLS-116hr748enr.pdf. ↩︎
- FMAP = Federal Medicaid Assistance Percentage ↩︎
- MaryBeth Musumeci, Key Questions About the New Increase in Federal Medicaid Matching Funds for COVID-19 (Washington, DC: KFF, May 4, 2020), https://modern.kff.org/coronavirus-covid-19/issue-brief/key-questions-about-the-new-increase-in-federal-medicaid-matching-funds-for-covid-19/ ↩︎
- Rachel Dolan, Robin Rudowitz, and Samantha Artiga, Medicaid Maintenance of Eligibility (MOE) Requirements (Washington, DC: KFF, September 22, 2020), https://modern.kff.org/medicaid/issue-brief/medicaid-maintenance-of-eligibility-requirements-issues-to-watch-when-they-end/ ↩︎
- Robin Rudowitz, Bradley Corallo, and Samantha Artiga, Analysis of Recent National Trends in Medicaid and CHIP Enrollment: Issues to Watch When They End (Washington, DC: KFF, August 24, 2020), https://modern.kff.org/coronavirus-covid-19/issue-brief/analysis-of-recent-national-trends-in-medicaid-and-chip-enrollment/ ↩︎
- Tricia Brooks, Lauren Roygardner, Samantha Artiga, Olivia Pham, and Rachel Dolan, Medicaid and CHIP Eligibility, Enrollment, and Cost Sharing Policies as of January 2020: Findings from a 50-State Survey (Washington, DC: KFF, March 26, 2020), https://modern.kff.org/medicaid/report/medicaid-and-chip-eligibility-enrollment-and-cost-sharing-policies-as-of-january-2020-findings-from-a-50-state-survey/ ↩︎
- Robin Rudowitz and Elizabeth Hinton, Early Look at Medicaid Spending and Enrollment Trends Amid COVID-19 (Washington, DC: KFF, May 15, 2020), https://modern.kff.org/coronavirus-covid-19/issue-brief/early-look-at-medicaid-spending-and-enrollment-trends-amid-covid-19/ ↩︎
- KFF, “Medicaid Emergency Authority Tracker: Approved State Actions to Address COVID-19,” last updated October 7, 2020, https://modern.kff.org/medicaid/issue-brief/medicaid-emergency-authority-tracker-approved-state-actions-to-address-covid-19/ ↩︎
- MaryBeth Musumeci, Rachel Dolan, and Madeline Guth, Appendix to State Actions to Sustain Medicaid Long-Term Services and Supports During COVID-19 (Washington, DC: KFF, August 26, 2020), https://modern.kff.org/report-section/state-actions-to-sustain-medicaid-long-term-services-and-supports-during-covid-19-appendix/ ↩︎
- US Department of Health and Human Services, Renewal of Determination That A Public Health Emergency Exists (October 2, 2020), https://www.phe.gov/emergency/news/healthactions/phe/Pages/covid19-2Oct2020.aspx ↩︎
- KFF, “Status of State Medicaid Expansion Decisions”, last updated October 1, 2020, https://modern.kff.org/medicaid/issue-brief/status-of-state-medicaid-expansion-decisions-interactive-map/ ↩︎
- Calculated based on the 2020 Federal Poverty Level (FPL) of $12,760 per year for an individual in 2020, in the 48 contiguous states and DC. See: U.S. Department of Health & Human Services, Office of the Assistant Secretary for Planning and Evaluation, U.S. Federal Poverty Guidelines Used to Determine Financial Eligibility for Certain Federal Programs (January 2020), https://aspe.hhs.gov/poverty-guidelines ↩︎
- Oklahoma Healthcare Authority, Public Notice: Medicaid Adult Expansion, July 31, 2020, http://www.okhca.org/WorkArea/linkit.aspx?LinkIdentifier=id&ItemID=24995&libID=23981 ↩︎
- MaryBeth Musumeci, 3 Key Questions About the Arkansas Medicaid Work and Reporting Requirements Case (Washington, DC: KFF, March 6, 2020), https://modern.kff.org/medicaid/issue-brief/3-key-questions-about-the-arkansas-medicaid-work-and-reporting-requirements-case/ ↩︎
- For more information on South Carolina’s and other Section 1115 waivers, including the status of work requirements, see: KFF, “Medicaid Waiver Tracker: Approved and Pending Section 1115 Waivers by State”, last updated September 1, 2020, https://modern.kff.org/medicaid/issue-brief/medicaid-waiver-tracker-approved-and-pending-section-1115-waivers-by-state/ ↩︎
- Georgia is extending coverage for postpartum women to 6 months and New Jersey is extending this coverage to 180 days. ↩︎
- Centers for Medicare and Medicaid Services, Letter to Stephanie Muth, Associate Commissioner, Medicaid/CHIP, Texas Health and Human Services Commission, from CMS Administrator, Seema Verma (January 22, 2020), https://www.medicaid.gov/Medicaid-CHIP-Program-Information/By-Topics/Waivers/1115/downloads/tx/tx-healthy-women-ca.pdf. The HTW Program provides coverage of family planning services to low-income women who are not otherwise eligible for Medicaid coverage. ↩︎
- New Hampshire also reported plans to continue coverage of COVID-19 diagnostic testing, testing-related services, and treatment services for the uninsured but is not counted here as authority for this coverage, created by the Families First Coronavirus Response Act, continues only through the end of the PHE period. ↩︎
- Additionally, Nevada noted that eligibility for the new uninsured COVID-19 group may continue for up to 90 days after the end of the PHE period to allow for prior medical requests to cover testing and diagnostic services. Per the Families First Coronavirus Response Act, authority to cover the uninsured COVID-19 testing group will not extend past the end of the PHE. ↩︎
- Marybeth Musumeci, Key Questions About the New Medicaid Eligibility Pathway for Uninsured Coronavirus Testing (Washington, DC: KFF, May 4, 2020), https://modern.kff.org/coronavirus-covid-19/issue-brief/key-questions-about-the-new-medicaid-eligibility-pathway-for-uninsured-coronavirus-testing/ ↩︎
- U.S. Department of Health & Human Services, Health Resources & Services Administration, “COVID-19 Claims Reimbursement to Health Care Providers and Facilities for Testing and Treatment of the Uninsured,” last updated May 2020, https://www.hrsa.gov/CovidUninsuredClaim ↩︎
- For an updated count of states with SPA approval to cover the new Uninsured Coronavirus Testing group, see: KFF, “Medicaid Emergency Authority Tracker: Approved State Actions to Address COVID-19,” last updated October 7, 2020, https://modern.kff.org/medicaid/issue-brief/medicaid-emergency-authority-tracker-approved-state-actions-to-address-covid-19/ ↩︎
- Laura Snyder and Robin Rudowitz, Trends in State Medicaid Programs: Looking Back and Looking Ahead (Washington, DC: KFF, June 21, 2016), https://modern.kff.org/medicaid/issue-brief/trends-in-state-medicaid-programs-looking-back-and-looking-ahead/ ↩︎
- MaryBeth Musumeci, Robin Rudowitz, Elizabeth Hinton, Rachel Dolan, and Olivia Pham, Options to Support Medicaid Providers in Response to COVID-19 (Washington, DC: KFF, June 17, 2020), https://modern.kff.org/coronavirus-covid-19/issue-brief/options-to-support-medicaid-providers-in-response-to-covid-19/ ↩︎
- Elizabeth Hinton and MaryBeth Musumeci, Medicaid Managed Care Rates and Flexibilities: State Options to Respond to COVID-19 Pandemic (Washington, DC: KFF, September 9, 2020), https://modern.kff.org/medicaid/issue-brief/medicaid-managed-care-rates-and-flexibilities-state-options-to-respond-to-covid-19-pandemic/ ↩︎
- CMS has described some of these options in the following two resources: Centers for Medicare and Medicaid (CMS), “COVID-19 Frequently Asked Questions (FAQs)”, last updated June 30, 2020, https://www.medicaid.gov/state-resource-center/downloads/covid-19-faqs.pdf Centers for Medicare and Medicaid (CMS), “Medicaid Managed Care Options in Responding to COVID-19,” last updated May 14, 2020, https://www.medicaid.gov/sites/default/files/Federal-Policy-Guidance/Downloads/cib051420.pdf ↩︎
- Karyn Schwartz, Jennifer Tolbert, Karen Pollitz, and Tricia Neuman, Update on COVID-19 Funding for Hospitals and Other Providers (Washington, DC: KFF, April 24, 2020), https://modern.kff.org/policy-watch/update-on-covid-19-funding-for-hospitals-and-other-providers/ ↩︎
- U.S. Department of Health & Human Services, “HHS Announces Enhanced Provider Portal, Relief Fund Payments for Safety Net Hospitals, Medicaid & CHIP Providers,” June 9, 2020, https://www.hhs.gov/about/news/2020/06/09/hhs-announces-enhanced-provider-portal-relief-fund-payments-for-safety-net-hospitals-medicaid-chip-providers.html ↩︎
- Robin Rudowitz, Kendal Orgera, and Elizabeth Hinton, Medicaid Financing: The Basics (Washington, DC: KFF, March 21, 2019), https://modern.kff.org/report-section/medicaid-financing-the-basics-issue-brief/ ↩︎
- Laura Snyder and Robin Rudowitz, Trends in State Medicaid Programs: Looking Back and Looking Ahead (Washington, DC: KFF, June 21, 2016), https://modern.kff.org/medicaid/issue-brief/trends-in-state-medicaid-programs-looking-back-and-looking-ahead/ ↩︎
- Kathleen Gifford et al., A View from the States: Key Medicaid Policy Changes (Washington, DC: KFF, October 18, 2019), https://modern.kff.org/medicaid/report/a-view-from-the-states-key-medicaid-policy-changes-results-from-a-50-state-medicaid-budget-survey-for-state-fiscal-years-2019-and-2020/ ↩︎
- These 16 states are: Arizona, California, Colorado, Florida, Georgia, Hawaii, Iowa, Kansas, Massachusetts, Montana, New Jersey, Pennsylvania, South Carolina, South Dakota, West Virginia, and Virginia. ↩︎
- These 19 states are: California, Colorado, Connecticut, Florida, Georgia, Indiana, Iowa, Kentucky, Louisiana, Maine, Michigan, Montana, North Carolina, Oregon, South Carolina, Texas, Virginia, West Virginia, and Wyoming. ↩︎
- Kathleen Gifford et al., “Delivery Systems,” A View from the States: Key Medicaid Policy Changes (Washington, DC: KFF, October 18, 2019), https://modern.kff.org/report-section/a-view-from-the-states-key-medicaid-policy-changes-delivery-systems/ ↩︎
- KFF, “Total Medicaid MCO Enrollment,” 2018, https://modern.kff.org/other/state-indicator/total-medicaid-mco-enrollment/?currentTimeframe=0&sortModel=%7B%22colId%22:%22Location%22,%22sort%22:%22asc%22%7D ↩︎
- Elizabeth Hinton and MaryBeth Musumeci, Medicaid Managed Care Rates and Flexibilities: State Options to Respond to COVID-19 Pandemic (Washington, DC: KFF, September 9, 2020), https://modern.kff.org/medicaid/issue-brief/medicaid-managed-care-rates-and-flexibilities-state-options-to-respond-to-covid-19-pandemic/ ↩︎
- Centers for Medicare and Medicaid (CMS), “COVID-19 Medicaid & CHIP All State Call,” April 10, 2020, https://www.cms.gov/files/zip/covid19allstatecall04102020.zip ↩︎
- Centers for Medicare and Medicaid (CMS), “Medicaid Managed Care Options in Responding to COVID-19,” last updated May 14, 2020, https://www.medicaid.gov/sites/default/files/Federal-Policy-Guidance/Downloads/cib051420.pdf ↩︎
- “Other” carve-ins reported include chiropractic, “treat-no transport” ambulance services, and diabetes prevention services (Missouri), doula services (New Jersey), and adult podiatry services (South Carolina). ↩︎
- “Other” carve-outs reported were lens fabrications from selected plans (California) and elective C-sections (New Jersey). ↩︎
- Elizabeth Hinton and MaryBeth Musumeci, Medicaid Managed Care Rates and Flexibilities: State Options to Respond to COVID-19 Pandemic (Washington, DC: KFF, September 9, 2020), https://modern.kff.org/medicaid/issue-brief/medicaid-managed-care-rates-and-flexibilities-state-options-to-respond-to-covid-19-pandemic/ ↩︎
- The survey did not ask states to specify whether MCO contract or rate adjustments were made to FY 2020 MCO contracts so we are unable to report this information comprehensively. ↩︎
- Elizabeth Hinton and MaryBeth Musumeci, Medicaid Managed Care Rates and Flexibilities: State Options to Respond to COVID-19 Pandemic (Washington, DC: KFF, September 9, 2020), https://modern.kff.org/medicaid/issue-brief/medicaid-managed-care-rates-and-flexibilities-state-options-to-respond-to-covid-19-pandemic/ ↩︎
- MassHealth Managed Care Entity Bulletin 36, “Community Support Program for Homeless Individuals Residing in Department of Housing and Community Development-Funded New Temporary Shelters,” July 2020, https://www.mass.gov/doc/managed-care-entity-bulletin-36-community-support-program-for-homeless-individuals-residing-0/download ↩︎
- The 11 MCO states that reported food assistance or home delivered meal initiatives are: Hawaii, Indiana, Kansas, Massachusetts, Michigan, Missouri, Nebraska, New Jersey, South Carolina, Virginia, and Wisconsin. The eight MCO states that reported enhanced MCO care management and outreach efforts often targeting persons at high risk for COVID-19 are: California, Colorado, Indiana, Kentucky, Missouri, Nebraska, Pennsylvania, and West Virginia. The four MCO states that reported provisions of PPE are: Arizona, Kansas, Kentucky, and Pennsylvania. The three MCO states that expanded telehealth and remote support are: Nebraska, Wisconsin, and West Virginia. The three MCO states that reported expanded pharmacy home deliveries are: Kansas, Nebraska, and West Virginia. The two MCO states that reported MCO-provided gift cards are: Kentucky and Virginia. ↩︎
- Samantha Artiga and Elizabeth Hinton, Beyond Health Care: The Role of Social Determinants in Promoting Health and Health Equity (Washington, DC: KFF, May 10, 2018), https://modern.kff.org/racial-equity-and-health-policy/issue-brief/beyond-health-care-the-role-of-social-determinants-in-promoting-health-and-health-equity/ ↩︎
- In June 2015, CMS issued an Informational Bulletin to clarify when and how Medicaid reimburses for certain housing-related activities, including individual housing transition services, individual housing and tenancy sustaining services, and state-level housing related collaborative activities. In January 2018, CMS issued a State Medicaid Director Letter providing guidance on state Section 1115 waiver proposals to condition Medicaid on meeting a work requirement. CMS explicitly stated the demonstration opportunity does not provide states with the authority to use Medicaid funding to finance employment support services. Predating this guidance, a few states implemented voluntary work referral programs. Federal Medicaid funds also cannot be used to finance work referral programs. Centers for Medicare and Medicaid (CMS), “Coverage of Housing-Related Activities and Services for Individuals with Disabilities,” June 26, 2015, https://www.medicaid.gov/federal-policy-guidance/downloads/cib-06-26-2015.pdf Centers for Medicare and Medicaid (CMS), “RE: Opportunities to Promote Work and Community Engagement Among Medicaid Beneficiaries,” January 11, 2018,, https://www.medicaid.gov/federal-policy-guidance/downloads/cib-06-26-2015.pdf ↩︎
- Under federal Medicaid managed care rules, Medicaid MCOs may have flexibility to pay for non-medical services through “in-lieu-of” authority and/or “value-added” services. “In-lieu-of” services are a substitute for covered services and may qualify as a covered service for the purposes of capitation rate setting. “Value-added” services are extra services outside of covered contract services and do not qualify as a covered service for the purposes of capitation rate setting. ↩︎
- Samantha Artiga, Bradley Corallo, and Olivia Pham, Racial Disparities in COVID-19: Key Findings from Available Data and Analysis (Washington, DC: KFF, August 17, 2020), https://modern.kff.org/racial-equity-and-health-policy/issue-brief/racial-disparities-covid-19-key-findings-available-data-analysis/ ↩︎
- Cornelia Hall, Samantha Artiga, Kendal Orgera, and Rachel Garfield, Food Insecurity and Health: Addressing Food Needs for Medicaid Enrollees as Part of COVID-19 Response Efforts (Washington, DC: KFF, August 14, 2020), https://modern.kff.org/report-section/food-insecurity-and-health-addressing-food-needs-for-medicaid-enrollees-as-part-of-covid-19-response-efforts-issue-brief/ ↩︎
- Oklahoma and Missouri responded that “yes” the COVID-19 emergency caused the state to implement, expand, or reform a program or initiative to address enrollees’ social determinants of health but did not describe specific related actions and are therefore not included in Exhibit 4, but are included in count of 27 states. ↩︎
- Minnesota Governor Walz directed more the 75 billion dollars in Coronavirus Relief funding toward food security. ↩︎
- The area median income (AMI) is the household income for the median, or middle, household in a region and is calculated annually by the Department of Housing and Urban Development for every metropolitan region in the country. See: Brian McCabe, “The Area Medium Income (AMI), Explained,” (Washington, DC: Greater Greater Washington: September 1, 2016), https://ggwash.org/view/42671/the-area-median-income-ami-explained ↩︎
- California Department of Social Services, “Project Roomkey: Emergency Housing for Immediate Protection Fact Sheet,” https://www.cdss.ca.gov/Portals/9/FEMA/Project-Roomkey-Fact-Sheet.pdf ↩︎
- North Carolina implemented NCCARE360 six months ahead of schedule. ↩︎
- Kathleen Gifford et al., “Long-Term Services and Supports,” A View from the States: Key Medicaid Policy Changes (Washington, DC: KFF, October 18, 2019), https://modern.kff.org/report-section/a-view-from-the-states-key-medicaid-policy-changes-long-term-services-and-supports/ ↩︎
- Centers for Medicare and Medicaid (CMS), “Financial Alignment Initiative (FAI),” last updated September 28, 2020, https://www.cms.gov/Medicare-Medicaid-Coordination/Medicare-and-Medicaid-Coordination/Medicare-Medicaid-Coordination-Office/FinancialAlignmentInitiative/FinancialModelstoSupportStatesEffortsinCareCoordination ↩︎
- Arizona Department of Economic Security, “DDD Health Plans,” website, https://des.az.gov/services/disabilities/developmental-disabilities/new-ddd-health-plans ↩︎
- Wisconsin Department of Health services, “Family Care Partnership Program,” last updated January 28, 2020, https://www.dhs.wisconsin.gov/familycare/fcp-index.htm ↩︎
- Molly O’Malley Watts, MaryBeth Musumeci, and Priya Chidambaram, Medicaid Home and Community-Based Services Enrollment and Spending (Washington, DC: KFF, February 4, 2020), https://modern.kff.org/report-section/medicaid-home-and-community-based-services-enrollment-and-spending-issue-brief/ ↩︎
- MaryBeth Musumeci, Molly O’Malley Watts, and Priya Chidambaram, Key State Policy Choices About Medicaid Home and Community-Based Services (Washington, DC: KFF, February 4, 2020), https://modern.kff.org/medicaid/issue-brief/key-state-policy-choices-about-medicaid-home-and-community-based-services/ ↩︎
- Sarah True et al., COVID-19 and Workers at Risk: Examining the Long-Term Care Workforce (Washington, DC: KFF, April 23, 2020), https://modern.kff.org/coronavirus-covid-19/issue-brief/covid-19-and-workers-at-risk-examining-the-long-term-care-workforce/ ↩︎
- Priya Chidambaram, Key Questions About the Impact of Coronavirus on Long-Term Care Facilities Over Time (Washington, DC: KFF, September 1, 2020), https://modern.kff.org/coronavirus-covid-19/issue-brief/key-questions-about-the-impact-of-coronavirus-on-long-term-care-facilities-over-time/ ↩︎
- Priya Chidambaram, Rising Cases in Long-term Care Facilities Are Cause for Concern (Washington, DC: KFF, July 21, 2020), https://modern.kff.org/coronavirus-covid-19/issue-brief/rising-cases-in-long-term-care-facilities-are-cause-for-concern/ ↩︎
- KFF, COVID-19: Long-Term Care Facilities from “State Data and Policy Actions to Address Coronavirus,” last updated October 8, 2020, https://modern.kff.org/coronavirus-covid-19/issue-brief/state-data-and-policy-actions-to-address-coronavirus/ ↩︎
- Centers for Medicare and Medicaid (CMS), “COVID-19 Frequently Asked Questions (FAQs)”, last updated June 30, 2020, https://www.medicaid.gov/state-resource-center/downloads/covid-19-faqs.pdf ↩︎
- MaryBeth Musumeci, Rachel Dolan, and Madeline Guth, State Actions to Sustain Medicaid Long-Term Services and Supports During COVID-19 (Washington, DC: KFF, August 26, 2020), https://modern.kff.org/medicaid/issue-brief/state-actions-to-sustain-medicaid-long-term-services-and-supports-during-covid-19/ ↩︎
- Kathleen Gifford et al., “Long-Term Services and Supports,” A View from the States: Key Medicaid Policy Changes (Washington, DC: KFF, October 18, 2019), https://modern.kff.org/report-section/a-view-from-the-states-key-medicaid-policy-changes-long-term-services-and-supports/ ↩︎
- For updated counts of states taking this action using Medicaid emergency authorities, see: KFF, “Medicaid Emergency Authority Tracker: Approved State Actions to Address COVID-19,” last updated October 7, 2020, https://modern.kff.org/medicaid/issue-brief/medicaid-emergency-authority-tracker-approved-state-actions-to-address-covid-19/ ↩︎
- Examples of congregate settings include assisted living facilities for seniors and group homes for individuals with disabilities. ↩︎
- MaryBeth Musumeci, Rachel Dolan, and Madeline Guth, State Actions to Sustain Medicaid Long-Term Services and Supports During COVID-19 (Washington, DC: KFF, August 26, 2020), https://modern.kff.org/medicaid/issue-brief/state-actions-to-sustain-medicaid-long-term-services-and-supports-during-covid-19/ ↩︎
- Maine reported plans to increase access to its shared living model, in which a family member can serve as a live-in paid caretaker. ↩︎
- A number of states allowed legally responsible relatives to be paid providers prior to the COVID-19 pandemic. For more on this and other pre-pandemic HCBS policies, see: MaryBeth Musumeci, Molly O’Malley Watts, and Priya Chidambaram, Key State Policy Choices About Medicaid Home and Community-Based Services (Washington, DC: KFF, February 4, 2020), https://modern.kff.org/medicaid/issue-brief/key-state-policy-choices-about-medicaid-home-and-community-based-services/ ↩︎
- Kathleen Gifford et al., “Benefits and Cost-Sharing,” A View from the States: Key Medicaid Policy Changes (Washington, DC: KFF, October 18, 2019), https://modern.kff.org/report-section/a-view-from-the-states-key-medicaid-policy-changes-benefits-and-cost-sharing/ ↩︎
- KFF, “Medicaid Emergency Authority Tracker: Approved State Actions to Address COVID-19,” last updated October 7, 2020, https://modern.kff.org/medicaid/issue-brief/medicaid-emergency-authority-tracker-approved-state-actions-to-address-covid-19/ ↩︎
- Madeline Guth and Elizabeth Hinton, State Efforts to Expand Medicaid Coverage & Access to Telehealth in Response to COVID-19 (Washington, DC: KFF, June 22, 2020), https://modern.kff.org/coronavirus-covid-19/issue-brief/state-efforts-to-expand-medicaid-coverage-access-to-telehealth-in-response-to-covid-19/ ↩︎
- State Telehealth Laws & Reimbursement Policies (Center for Connected Health Policy, Spring 2020), https://www.cchpca.org/sites/default/files/2020-05/CCHP_%2050_STATE_REPORT_SPRING_2020_FINAL.pdf ↩︎
- KFF, “Medicaid Emergency Authority Tracker: Approved State Actions to Address COVID-19,” last updated October 7, 2020, https://modern.kff.org/medicaid/issue-brief/medicaid-emergency-authority-tracker-approved-state-actions-to-address-covid-19/ ↩︎
- Centers for Medicare and Medicaid (CMS), “State Medicaid & CHIP Telehealth Toolkit,” last updated April 23, 2020, https://www.medicaid.gov/state-resource-center/downloads/covid-19-faqs.pdf ↩︎
- Kathleen Gifford et al., “Benefits and Cost-Sharing,” A View from the States: Key Medicaid Policy Changes (Washington, DC: KFF, October 18, 2019), https://modern.kff.org/report-section/a-view-from-the-states-key-medicaid-policy-changes-benefits-and-cost-sharing/ ↩︎
- For more information on this emergency authority, see KFF, Table: Approved Section 1915 (c) Waiver Appendix K Strategies to Address COVID-19 from “Medicaid Emergency Authority Tracker: Approved State Actions to Address COVID-19,” last updated October 7, 2020, https://modern.kff.org/medicaid/issue-brief/medicaid-emergency-authority-tracker-approved-state-actions-to-address-covid-19/ ↩︎
- Gabriela Weigel et al., Opportunities and Barriers for Telemedicine in the U.S. During the COVID-19 Emergency and Beyond (Washington, DC: KFF, May 11, 2020), https://modern.kff.org/womens-health-policy/issue-brief/opportunities-and-barriers-for-telemedicine-in-the-u-s-during-the-covid-19-emergency-and-beyond/ ↩︎
- Because 100% of Tennessee’s Medicaid beneficiaries are enrolled in managed care, the state has no fee-for-service telehealth policies and thus is not included elsewhere in this write-up of emergency telehealth policies. ↩︎
- For more information on how states can implement or update Medicaid managed care telehealth policies, see: Centers for Medicare and Medicaid (CMS), “COVID-19 Frequently Asked Questions (FAQs)”, question V.A.1, last updated June 30, 2020, https://www.medicaid.gov/state-resource-center/downloads/covid-19-faqs.pdf ↩︎
- Kathleen Gifford et al., How State Medicaid Programs are Managing Prescription Drug Costs (Washington, DC: KFF, April 29, 2020), https://modern.kff.org/report-section/how-state-medicaid-programs-are-managing-prescription-drug-costs-introduction/ ↩︎
- The 11 states that expanded PDLs are: Alaska, California, Colorado, Connecticut, Louisiana, Massachusetts, Missouri, Mississippi, Nebraska, New Hampshire, and Washington. The 11 states that had new or expanded value-based purchasing arrangements are: Alaska, Arizona, Colorado, Indiana, Massachusetts, Michigan, Nevada, North Carolina, Texas, Virginia, and Vermont. The seven states that had targeted reforms to address transparency and other PBM concerns are: Arizona, Kentucky, Maryland, Massachusetts, Mississippi, South Carolina, and Virginia. ↩︎
- Health Homes (created under Section 2703 of the ACA) target beneficiaries who have at least two chronic conditions (or one and risk of a second, or a serious and persistent mental health condition), and provide a person-centered system of care that facilitates access to and coordination of the full array of primary and acute physical health services, behavioral health care, and social and long-term services and supports. ↩︎
- KFF, 50-State Medicaid Budget Survey Archives, (Washington, DC: KFF, October 2020), https://modern.kff.org/medicaid/report/medicaid-budget-survey-archives/. ↩︎
- State fiscal years begin on July 1 except for these states: New York on April 1; Texas on September 1; Alabama, Michigan, and DC on October 1. ↩︎
- The eight states that did not respond by mid-August 2020 are: Delaware, District of Columbia, Illinois, Ohio, New Mexico, New York, Rhode Island, and Utah. ↩︎