News Release

As Open Enrollment Begins, KFF’s Updated Subsidy Calculator and 300+ FAQs Demystify ACA Marketplaces

Unsubsidized premiums are rising by an average of 5% in the Marketplaces, due in part to inflation

Published: Oct 30, 2023

A recent KFF survey found one-in-three people with Marketplace coverage say it is somewhat or very difficult to find a plan that meets their needs. With ACA enrollment beginning November 1, KFF has updated its most-used Marketplace tools and published an explainer on key changes and issues to watch in this year’s open enrollment season.

Tools for Open Enrollment>> KFF’s Health Insurance Marketplace Calculator provides estimates of 2024 health insurance premiums and subsidies for people purchasing their own insurance in the Marketplaces. Users can enter their age, income, zip code, and family size to check their eligibility for Marketplace subsidies or Medicaid and estimate their premium costs. The calculator reflects the premiums available in local markets and the impact of the enhanced tax credits available through 2026.>> The Marketplace FAQs cover a wide range of topics related to obtaining or renewing health insurance in the Marketplace. It has been updated to include information about expanded Marketplace enrollment opportunities for people who have lost Medicaid coverage due to the Medicaid unwinding. More than 200 of the FAQs are available in Spanish.

What to Watch for Open EnrollmentEven after a decade of operation, there continue to be changes in the Marketplaces. KFF’s new explainer highlights nine key changes and issues to watch in the 2024 open enrollment period, including a look at the impact of the 5% average rise in unsubsidized premiums as well as who will be affected by this year’s state-level policy changes and the new auto-reenrollment policy on Healthcare.gov.

KFF also offers an overview of the financial assistance available for people purchasing their own coverage, including premium tax credits and cost-sharing subsidies and has updated select State Health Facts indicators with relevant data.

Open enrollment runs November 1 through January 15 for healthcare.gov and most state-run marketplaces. Organizations assisting consumers are encouraged to link to KFF’s Marketplace FAQs. Each question and answer can be shared individually by direct link.

What to Watch in the 2024 ACA Open Enrollment

Authors: Cynthia Cox, Kaye Pestaina, Krutika Amin, and Jared Ortaliza
Published: Oct 30, 2023

With the start of the 2024 Affordable Care Act open enrollment, the Marketplaces have been operating for a full decade and are heading into their eleventh year. This year’s open enrollment season will last from November 1, 2023 to January 16, 2024 in most states and longer in some state-based marketplaces. (Due to the federal holiday on January 15, state marketplaces are allowed to extend the deadline for Open Enrollment to January 16.) Even after a decade of operation, there continue to be changes in these markets. Here’s what to watch in 2024:

  1. Unsubsidized premiums in the ACA Marketplaces are rising due in part to inflation. Premiums are rising by an average of 5% in 2024 for the second-lowest cost silver plan (the benchmark against which subsidies are calculated). Premiums for the lowest cost bronze plans (the least expensive plans on the Marketplaces) are similarly rising 6%. (State-level data are available here). An earlier KFF analysis of premium rate filings found the primary drivers of premium growth heading into 2024 are rising prices paid to health care providers, driven in part by inflation in the rest of the economy, and a rebound in utilization coming out of the pandemic. However, other factors like the reduced use of COVID-related care are having a downward effect on premiums. Although unsubsidized premiums are rising, the Inflation Reduction Act’s temporary enhancement of subsidies continues to make the vast majority of Marketplace shoppers eligible for financial help with the cost of coverage. These subsidies cap how much enrollees must spend on a benchmark silver plan premium as a share of their household income, meaning that most enrollees will be sheltered from the increases in the sticker price of the premium.
  1. 2024 could be another record-setting year for enrollment. The number of people who enrolled in Marketplace coverage earlier this year reached 15.7 million, surpassing prior record-setting years in 2021 and 2022. During the pandemic, state Medicaid programs suspended annual renewal requirements for Medicaid and kept everyone continuously enrolled. Now, states are resuming renewal requirements and will end Medicaid coverage if people are no longer eligible or if they do not complete renewal forms (sometimes called “procedural reasons”). So far this year, more than 9.5 million adults and children have been disenrolled from Medicaid and CHIP, mostly due to procedural reasons, and millions more will likely be disenrolled in the coming months. Some may find themselves eligible for Marketplace subsidies, further boosting enrollment in the coming year, though there may be challenges in ensuring people losing Medicaid are aware of their options for coverage through the Marketplaces.
Affordable Care Act Marketplace Enrollment
  1. Insurer participation in 2024 will be more robust than in recent years. There are more insurers entering new markets than there are plans exiting from the Marketplace. Notably, Oscar Health is withdrawing from the California individual insurance market after profits fell short of expectations. Cigna is also exiting from Kansas’s and Missouri’s markets. At the same time, other insurers are entering several states, such as California, Colorado, Delaware, Indiana, Maryland, Nevada, New Jersey, New Mexico, Oklahoma, Pennsylvania, South Carolina, Utah and Wisconsin.
  1. State-level policy changes will affect what coverage some residents are eligible for, how much it costs, and how they sign up. For example, Virginia plans to start using its own enrollment platform with the 2024 open enrollment cycle, rather than relying on the federal Healthcare.gov platform. California will begin offering additional cost-sharing reduction subsidies that eliminate deductibles and lower other out-of-pocket expenses for about 4 in 10 Covered California enrollees. Massachusetts is increasing the income limit for additional state subsidies. Washington is allowing undocumented immigrants to enroll in Marketplace plans with state income-based subsidies starting in 2024. And North Carolina will expand Medicaid starting December 1, 2023, to residents with incomes up to 138% of the poverty level. Some low-income people enrolled in Marketplace plans in North Carolina will move to Medicaid.
  1. A new auto-reenrollment policy on Healthcare.gov will save some consumers money on their deductibles. People who are enrolled in Marketplace plans now and who do not act during Open Enrollment to renew or change their coverage will, in many cases, be automatically reenrolled by the Marketplace on December 16 so coverage will continue in 2024. In the past, people were usually automatically re-enrolled in the same plan. This year, the federal Marketplace (healthcare.gov) will first check to see if people currently enrolled in bronze plans have income at or below 250% of the federal poverty level, which would make them eligible for a cost-sharing reduction, or CSR, plan. If these individuals do not act by December 15 to select another plan or renew their bronze plan coverage for 2024, the Marketplace will automatically re-enroll them in a silver level plan offered by the same insurer and with the same provider network if the premium for that silver plan (taking into account APTC) will be the same or lower than their bronze plan. Deductibles and other cost sharing in silver CSR plans are much lower than in bronze plans. Those who are automatically re-enrolled in this way but want to select a different plan will still have until the end of Open Enrollment (January 15, 2024) to make a change.
  1. Marketplace shoppers will have extra time to submit proof of income. Marketplaces automatically check trusted data sources (such as the IRS and Social Security) to verify the income of enrollees. If the Marketplace cannot verify the income on a given application, the applicant may be asked to submit more documentation. Until this year, the Marketplace has given people 90 days to submit requested documentation, but regulators noticed many people were missing this deadline. Starting this fall, Marketplace shoppers will be given an automatic 60-day extension (for a total of 150 days) to submit documentation of their income. This change applies to all Marketplaces, including those run by states. Coverage will continue during this period, but financial assistance may be reduced or terminated if the requested documentation is not received by the deadline.
  1. Young adults turning 26 in 2024 will have until the next open enrollment to move off of their parents’ Marketplace plans. Private health plans must permit young adults the option of remaining covered as a dependent under their parent’s policy until they turn age 26. Starting in 2024, though, federal Marketplace health plans will officially not be allowed to terminate coverage for young adult dependents mid-year on their 26th birthday. Instead, they will have to continue the dependent coverage through the end of the calendar year. The federal Marketplace has already been keeping these individuals on the plan until the end of the year, and then automatically enrolling them in their own exchange coverage the following year, but this rule codifies that practice.
  1. Some people will have a chance to sign up or change plans outside of the open enrollment window. In states that use Healthcare.gov, the federal government is making changes to some special enrollment periods (SEPs) that allow certain people to sign up for coverage outside of the Open Enrollment period. Generally, state-based marketplaces can also offer these and other SEPs but don’t have to. These special enrollment periods differ depending on the qualifying reason:

Medicaid disenrollment: Under a new, temporary “Medicaid Unwinding Special Enrollment Period” people losing Medicaid between March 31, 2023 and July 31, 2024 can apply to the Marketplace, check the box attesting to the fact that they lost Medicaid or CHIP, and select a new plan within 60 days of applying for Marketplace coverage. In the long-run an additional, permanent change was made to extend the amount of time people disenrolled from Medicaid have to sign up for Marketplace coverage, from 60 days following loss of Medicaid to at least 90 days. In addition, like last year, people with low incomes will still be able to sign up for Marketplace coverage or change plans throughout the year. This “low-income special enrollment period (SEP)” is available to people in HealthCare.gov states who are eligible for premium tax credits and whose 2024 income will be no more than 150% of the federal poverty level ($21,870 for a single person, $37,290 for a family of 3). Coverage will begin the first day of the following month.

Natural disasters: People recently affected by natural disasters, such as the Maui wildfires, are eligible for an exceptional circumstances SEP that will give them more time to apply for Marketplace coverage. To be eligible they must live in or have moved away from an area designated by the Federal Emergency Management Association (FEMA) as eligible for individual or public assistance.

Loss of other coverage SEP: People who lose other coverage, such as job-based plans or Medicaid, are eligible for a special enrollment period to join the Marketplace, and people who anticipate loss of other coverage are eligible to apply for Marketplace coverage up to 60 days in advance of the date current coverage will end.  In the past, when people applied for this coverage loss SEP in advance, new marketplace coverage would take effect on the first day of the month after current coverage ends.  However, sometimes, current coverage ends in the middle of a month, leaving a gap in coverage of several days or weeks.  Starting in 2024, to avoid this gap in coverage, people applying in advance for the coverage loss SEP can ask to have marketplace coverage take effect on the first day of the month that current coverage ends.

Pandemic: During the Public Health Emergency (PHE), every county in the USA had a FEMA designation that made people eligible for the exceptional circumstances SEP due to COVID. However, since the PHE has ended, this COVID SEP is no longer available.

  1. Tax credit recipients must again file tax returns to maintain eligibility for subsidies. It has long been the case that people who receive advanced premium tax credits (APTC) in a year must file their federal tax return the following spring in order to continue receiving an APTC. This “file and reconcile” requirement was temporarily waived during the pandemic, but it is back in force with a change. Now people who fail to file and reconcile for two consecutive years will be ineligible for APTC the following year.

Signing Up for Marketplace Coverage Remains a Challenge for Many Consumers

Published: Oct 30, 2023

With the eleventh Marketplace Open Enrollment underway, attention is focused on the experiences of consumers when they try to enroll in this type of coverage. With an overwhelming number of plans to choose from in some Marketplaces, complicated rules to determine eligibility for financial assistance, and a limited window of time to make plan selections, it is not a surprise that problems persist.

Across a variety of measures, people with Marketplace coverage were more likely than people with other sources of health coverage to express difficulties in shopping for and enrolling in their health plan, according to data from the 2023 KFF Survey of Consumer Experience with Health Insurance.

While there have been some changes to ease the process of plan selection, subsidy determination, and enrollment, there is a high degree of churn in and out of Marketplace coverage, and enrollment difficulties continue for many consumers.

Experiences Signing Up for Marketplace Coverage

The KFF Survey of Consumer Experiences with Health Insurance is a nationally representative survey of 3,605 U.S. adults with health insurance. Of those surveyed, 880 adults were enrolled in Marketplace coverage, including in states that offer coverage on the federal platform (healthcare.gov) as well as states that operate their own Marketplace (state-based Marketplaces or SBMs). The survey, fielded from February 21, 2023 to March 14, 2023, asked a series of questions about Marketplace enrollees’ experiences when they signed up for their health insurance coverage.

More than one-third (35%) of those with Marketplace coverage found it somewhat or very difficult to find a plan that meets their needs.

Making an appropriate choice among plan options is often difficult. Finding an appropriate plan among the choices available is a problem for over a third of Marketplace enrollees surveyed. About twice as many Marketplace enrollees (35%) said they had a somewhat or very difficult time finding a plan that meets their needs compared to those with Medicare (15%), Medicaid (19%) or Employer-sponsored plan (17%) enrollees.

A Larger Share of People with Marketplace Coverage Reported That It Was Very or Somewhat Difficult to Find a Plan That Met Their Needs

Applying for coverage and financial assistance

One in four (25%) Marketplace enrollees said it was either very or somewhat difficult to complete the application or enrollment process. That is compared to 12% of people with Medicare and 12% of people with employer-sponsored coverage who indicated difficulty in enrolling. Twenty percent (20%) of people with Medicaid indicated either a very or somewhat difficult application or enrollment process.

One in three people with Marketplace coverage (32%) said it was either very or somewhat difficult to figure out if their income qualified them for financial assistance compared to 20% of Medicaid enrollees, 16% of ESI enrollees, and 14% of those with Medicare.

A Notable Share of Marketplace Enrollees Has Some Difficulty in Signing Up for Insurance and Figuring Out If Their Income Qualified Them for Financial Assistance

Comparing options

A large share (41%) of people with Marketplace coverage said it was very or somewhat difficult to compare the doctors, hospitals, and other health care providers you could see for each option compared to fewer adults with Employer-sponsored coverage (32%), Medicaid (27%) and Medicare (19%) who said the same.

Nearly one in three adults with Marketplace coverage (31%) found it very or somewhat difficult to compare copays and deductibles under their plan options, and one in four (25%) found it very or somewhat difficult to compare monthly premiums.

A Large Share of Enrollees With Marketplace Coverage Reported That It Was Somewhat to Very Difficult to Compare Health Care Providers for Each Insurance Option

Looking Forward

As the Marketplace has reached record high enrollment in recent years, its importance as a coverage option continues to grow. Nine in ten Marketplace enrollees receive some form of financial assistance through premium tax credits, often with cost sharing reductions as well. Marketplace coverage is unique as it often operates as a transitional source of coverage for millions of people when they find themselves ineligible for employer-sponsored coverage or coverage such as Medicaid or Medicare. There is a high degree of churn in and out of Marketplace coverage, and those signing up for the first time for this coverage will be unfamiliar with the process. In addition, there is likely some variation in consumer sign up experiences across different Marketplaces, as some state Marketplaces have more effective outreach and enrollment strategies.

This survey captures the experience of people who made it through the sign-up process and enrolled. An earlier KFF survey found 6 in 10 uninsured people who tried to sign up for Medicaid or Marketplace coverage said it was somewhat or very difficult to find a plan that met their needs. Even for those familiar with sign-up requirements, complicated and ever-changing rules for Marketplace plan selection and enrollment can make it difficult for many people to find an affordable plan that includes needed providers, even with financial assistance. Efforts to address common problems have developed over time, and will likely continue to focus on these key areas:

Option overload. According to CMS, consumers on the healthcare.gov platform had on average more than 113 plan options to choose from for the 2023 plan year. Too many plan choices with few obvious differences have the potential to result in poor consumer plan selection. Requirements restarted last year for most Marketplaces to have standardized plan options, called “Easy Pricing” plans, combined with a new requirement for 2024 and beyond to limit the number of non-standardized plans available, could help to reduce plan overload. However, these requirements might not reduce the number of choices enough to make a big difference for consumers. New rules for Open Enrollment in federal Marketplace plans this year will automatically reenroll certain individuals with bronze plan coverage into silver plans, where they will receive cost sharing help.

Difficult comparisons. Changes in the works for the coming Marketplace year seek to improve consumers’ ability to understand and compare plans. New plan marketing rules would prevent plans from having deceptive or misleading plan names that do not accurately describe plan attributes. For instance, a plan can no longer have as a marketing name, “$0 cost sharing” plan if only certain services are available for no cost sharing for only a certain number of visits.

Tricky transitions. This Open Enrollment will coincide with the Medicaid unwinding, which is resulting in the largest Medicaid coverage losses in the history of the program. The ability to transition from Medicaid to Marketplace coverage without coverage gaps will test the eligibility and enrollment processes put in place by the Affordable Care Act. New special enrollment opportunities are now available for Medicaid beneficiaries to move to Marketplace coverage. Transitions from employer-sponsored coverage to Marketplace coverage can also prove difficult, including a multi-step process to determine whether a full-time employee with access to employer coverage can qualify for Marketplace financial assistance, and limited standardized information for these employees about how to enroll in Marketplace coverage. For example, a Department of Labor Employer Notice, designed to provide employees with information about Marketplaces, has not been updated to provide information about last year’s changes concerning the “family glitch.”

One-on-one help from Marketplace assisters, including Navigators, will continue to serve a valuable role, alongside efforts to streamline and simplify Marketplace enrollment and educate consumers on the sign- up process.

This work was supported in part by the Robert Wood Johnson Foundation. KFF maintains full editorial control over all of its policy analysis, polling, and journalism activities.

Overall Satisfaction with Medicare is High, But Beneficiaries Under Age 65 With Disabilities Experience More Insurance Problems Than Older Beneficiaries

Published: Oct 26, 2023

While most people with Medicare are adults age 65 or older, Medicare also covers millions of younger people who qualify for Medicare based on having a long-term disability, or diagnosis with End-Stage Renal Disease (ESRD) or Amyotrophic Lateral Sclerosis (ALS, also known as Lou Gehrig’s disease). In 2022, 7.7 million people under age 65 with disabilities were covered by Medicare, representing 12% of all Medicare beneficiaries. Younger beneficiaries who qualify for Medicare because of disability are more likely than those who qualify based on age to have lower incomes and education levels, to be Black or Hispanic, and to be in worse health.

Medicare covers the same benefits for people of all ages, regardless of how they qualified for Medicare, and Medicare coverage options and financial assistance programs are generally the same – the main exception being that people under age 65 with disabilities do not have a guaranteed issue right to purchase Medigap supplemental policies. However, perhaps related to their different pathways to Medicare eligibility and because the program was originally designed to cover older adults, with coverage for younger people with disabilities added later, Medicare generally does not work as well for people under age 65 with disabilities. This conclusion is based on KFF analysis of surveys dating back to 2008 but not more recent than 2019. According to previous analysis, beneficiaries under age 65 with disabilities have reported worse access to care, more cost concerns, and lower satisfaction with care than those age 65 or older.

To get a more current understanding of how Medicare is working for older adults and younger people with disabilities, this brief analyzes data from the 2023 KFF Survey of Consumer Experiences with Health Insurance, a nationally representative survey of 3,605 U.S. adults with health insurance. This brief focuses specifically on the 885 adults with Medicare, including 165 adults under the age of 65 with disabilities.

This analysis provides a window into the challenges facing people with disabilities as they navigate the health insurance system by focusing on the experiences of younger adults on Medicare who qualify for the program due to having a long-term disability. The analysis highlights the ways in which beneficiaries under age 65 with disabilities may be less well served by the Medicare program than older beneficiaries. (While people with disabilities are also included among the population of Medicare beneficiaries age 65 or older, the survey sample is insufficient to focus on this group specifically.) People with disabilities who are covered by private insurance or Medicaid are likely to face similar challenges using their coverage. Insights from this analysis could help to inform efforts to strengthen the Medicare program, particularly for younger adults with disabilities.

Key Takeaways

  • Overall, people with Medicare are more satisfied with their health insurance coverage than adults with other types of insurance, but among people with Medicare, those under age 65 with disabilities are less likely than those age 65 or older to give positive ratings to the overall performance of their insurance coverage (79% vs. 92%) and some features of it, such as the quality and availability of providers.
  • Overall, a majority of Medicare beneficiaries under age 65 with disabilities say they experienced a problem with their health insurance in the last year (70%), compared to half (49%) of those age 65 or older. This includes a larger share of those under age 65 with disabilities who say they experienced denials or delays in getting prior approval (27% vs. 9%) or insurance not paying for care they received that they thought was covered (24% vs. 8%).
  • A relatively small share of all Medicare beneficiaries who said they had a problem with health insurance in the past year reported difficulty accessing care as a direct result of these problems, but access problems were more likely to be reported by Medicare beneficiaries under age 65 with disabilities than those 65 or older. At least one in five Medicare beneficiaries under age 65 with disabilities who reported problems say they were unable to receive recommended treatment (24%) or experienced significant delays in receiving medical care or treatment (21%), compared to very small shares of those 65 or older who said the same (6% for both).
  • Medicare beneficiaries under 65 with disabilities were more likely to experience difficulty with the health insurance enrollment process and comparing insurance options compared to beneficiaries age 65 or older, including figuring out if their income qualifies them for financial assistance (30% vs. 11%).
  • Cost concerns related to insurance are an issue for Medicare beneficiaries of all ages, particularly when it comes to monthly premiums and out-of-pocket costs for prescription drugs, but a larger share of people with Medicare under age 65 with disabilities than those age 65 or older report certain problems. More than one in three people with Medicare under age 65 with disabilities report they had a problem paying a medical bill in the past 12 months (35%), compared to one in ten (9%) of those 65 or older. People with Medicare under age 65 with disabilities were also more likely to report delaying or going without specific health care services due to cost, such as dental care (42% vs. 24%), prescription drugs (18% vs. 10%), and doctor visits (14% vs. 4%).
  • About half of people with Medicare under age 65 with disabilities self-report fair or poor physical health, compared to 19% of those age 65 or older, since, by definition, people under age 65 qualify for Medicare based on having a long-term disability. The higher rate of poorer self-reported health among beneficiaries under age 65 could contribute to a higher rate of health insurance problems.
  • Three in 10 people with Medicare under age 65 with disabilities self-report fair or poor mental health status, compared to 1 in 10 (9%) of those age 65 or older, and a larger share also report problems related to mental health care availability and access, including reporting that there was a mental health therapist or treatment they needed that wasn’t covered by insurance (27% vs. 7%), and being unable to receive mental health services or medication in the past year they thought they needed (18% vs. 5%).

Satisfaction with Coverage

People with Medicare are more satisfied with their health insurance coverage than those with employer-sponsored insurance, Marketplace coverage, and Medicaid. And while majorities of people with Medicare of all ages rate Medicare positively, those under age 65 with disabilities are less likely than older beneficiaries to give positive ratings to Medicare and some features of it. While 92% of beneficiaries age 65 or older rate Medicare’s performance positively, a smaller share, but still a majority (79%) of Medicare beneficiaries under 65 with disabilities rated Medicare’s performance as excellent or good (Figure 1). A smaller share of Medicare beneficiaries under 65 with disabilities than those 65 or older rated both the availability and the quality of doctors, hospitals, and other medical providers as excellent or good.

While Most People with Medicare Give the Program Positive Ratings, Beneficiaries Under Age 65 with Disabilities are Less Likely to Do So Than Older Beneficiaries

Problems with Health Insurance

Overall, a somewhat smaller share of people with Medicare than people with employer-sponsored insurance, Marketplace coverage, or Medicaid report experiencing any problems with their health insurance in the past 12 months (51% compared to 60%, 56%, and 58%, respectively). Among Medicare beneficiaries, a majority (70%) of those under age 65 with disabilities say they experienced any problem, compared to half (49%) of those 65 or older. Because a larger share of beneficiaries under age 65 with disabilities report that they are in fair or poor physical and mental health and have severe chronic conditions compared to beneficiaries age 65 or older (Appendix Figure 1), those under age 65 with disabilities may be more likely to have multiple encounters with the health care system during the year and encounter specific problems when they do.

For example, more than one-fourth (27%) of Medicare beneficiaries under age 65 with disabilities said their health insurance denied or delayed prior approval for a treatment, service, visit, or drug before they received it, compared to just under one in 10 (9%) beneficiaries 65 or older (Figure 2). Similarly, a larger share of beneficiaries under 65 with disabilities than those 65 or older reported that their insurance didn’t pay for care they received that they thought was covered (24% vs. 8%). But one problem, in particular, was reported by a similar share of both groups: 34% of beneficiaries under age 65 with disabilities and 26% of those age 65 or older reported that insurance didn’t cover or required a high copay for a prescription drug.

To the extent that people under 65 with disabilities are seeking medical care more often, or seeking more specialized medical care, than those age 65 or older, insurance problems could be exacerbated for those under age 65 who are enrolled in Medicare Advantage plans, which may have limited networks of doctors and hospitals and can impose prior authorization requirements on Medicare-covered services. (Due to sample size limitations, this analysis by age group is not able to be stratified by enrollment in traditional Medicare and Medicare Advantage.)

Interactive DataWrapper Embed

Experiences with Enrollment and Comparing Options

Medicare beneficiaries under age 65 with disabilities are more likely to experience difficulty with the Medicare enrollment process and comparing Medicare coverage options compared to beneficiaries age 65 or older. The percentage of beneficiaries under 65 with disabilities who had difficulty enrolling in Medicare (26%) or figuring out if their income qualified them for financial assistance (30%) was substantially larger than among those 65 or older (10% and 11%, respectively) (Figure 3). Similarly, nearly a quarter of those under 65 with disabilities reported that it was somewhat or very difficult to find insurance to meet their needs (23%), compared to 14% of those age 65 or older. This difficulty could reflect the wide array of coverage options that Medicare beneficiaries face, including the choice of whether to enroll in traditional Medicare or Medicare Advantage, and choosing among Medicare Advantage and Part D drug plan options. It might also reflect difficulties among low-income beneficiaries related to enrolling in Medicaid, the Medicare Savings Programs, or the Part D Low-Income Subsidy program for additional benefits and financial assistance.

People with Medicare Under Age 65 with Disabilities Are More Likely Than Those Age 65 or Older to Experience Difficulties with the Health Insurance Enrollment Process and Comparing Insurance Options

Understanding of Insurance

Overall, a smaller share of people with Medicare than those with other types of insurance report difficulty understanding various aspects of health insurance, but among those with Medicare, a larger share of people under 65 with disabilities than those age 65 or older say they find it difficult to understand various aspects of health insurance. Specifically, Medicare beneficiaries under 65 with disabilities are more likely to say they have difficulty understanding specific insurance terms such as “deductible” and “prior authorization” (34% vs. 17%), how much they will have to pay out-of-pocket when they use health care (32% vs. 18%), insurance statements outlining whether care will be covered and how much insurance will pay (31% vs. 17%), and how to find information on which providers are covered in their insurance network (28% vs. 13%) (Figure 4).

A Larger Share of People with Medicare Under Age 65 with Disabilities Than Those Age 65 or Older Find Certain Aspects of Health Insurance Difficult to Understand

Consequences of Problems with Health Insurance

Overall, a relatively small share of Medicare beneficiaries who said they had any problem with health insurance in the past 12 months reported delays getting (9%) or being unable to get medical care (9%) as a direct result of these problems, but these access problems were more likely to be reported by Medicare beneficiaries under age 65 with disabilities than those 65 or older. Among the 70% of people under age 65 with disabilities with Medicare who said they had a problem with insurance in the past 12 months, nearly one fourth (24%) reported they were unable to receive care in the past 12 months as a direct result of these problems. By comparison, among the 49% of people age 65 or older on Medicare, 6% reported being unable to receive care as a result (Figure 5). Similarly, among Medicare beneficiaries who had a problem with their insurance in the past year, a much larger share of those under age 65 with disabilities than those age 65 or older reported delays in receiving care in the past 12 months due to health insurance problems (21% vs. 6%).

A Substantially Larger Share of People with Medicare Under Age 65 with Disabilities Than Those 65 or Older Reported Delays or Not Receiving Care as a Direct Result of Problems with Health Insurance

People with Medicare under age 65 with disabilities are more likely than those age 65 or older to report problems related to mental health care availability and access. Three in 10 (30%) of Medicare beneficiaries under age 65 with disabilities self-report fair or poor mental health status compared to 9% of those age 65 or older, making it more likely that they would seek mental health treatment (Appendix Figure 1). This could be a factor in greater dissatisfaction among people with Medicare under age 65 with disabilities when it comes to both the availability and quality of mental health therapists and professionals covered by their insurance: those under 65 with disabilities are more likely than those 65 or older to rate insurance as fair or poor when it comes to the availability (37% vs. 20%) and the quality (35% vs. 16%) of mental health providers covered by insurance (Figure 6).

Furthermore, more than a quarter (27%) of Medicare beneficiaries under 65 with disabilities reported there was a mental health therapist or treatment they needed that wasn’t covered by insurance, and nearly 1 in 5 (18%) said they were unable to receive mental health services or medication in the past year they thought they needed. Substantially smaller shares of beneficiaries age 65 or older reported these problems (7% and 5%, respectively). (Due to sample size restrictions, this analysis by age group is not able to be stratified by mental health status or limited to those who rate their mental health as fair or poor).

People with Medicare Under Age 65 with Disabilities Are More Likely Than Those Age 65 or Older to Report Problems Related to Mental Health Care Availability and Access

Affordability Concerns

Cost concerns related to insurance are an issue for Medicare beneficiaries of all ages, particularly when it comes to monthly premiums and out-of-pocket costs for prescription drugs. Overall, around one-fourth of Medicare beneficiaries gave their insurance a “fair” or “poor” rating on these measures. However, some cost concerns are experienced by a larger share of people with Medicare under age 65 with disabilities than those age 65 or older, which is likely related to a substantially greater percentage of those under age 65 with disabilities having incomes below 200% of poverty compared to those age 65 or older (77% vs. 44%) (Appendix Figure 1). For example, 36% of those under 65 with disabilities gave a negative rating to their insurance when it comes to the out-of-pocket cost they have to pay to see a doctor, compared to 19% of those 65 or older (Figure 7). Similarly, over one-third (35%) of people under age 65 with disabilities said that in the past year they had problems paying or were unable to pay any medical bills, compared to one in 10 (9%) of those age 65 or older.

People with Medicare Under Age 65 with Disabilities Are More Likely Than Those Age 65 or Older to Report Concerns Related to How Much They Have to Pay for Medical Care

Overall, a small share of Medicare beneficiaries report delaying or going without doctor’s visits or prescription drugs in the past year due to cost, but these percentages increase somewhat when it comes to services that Medicare doesn’t cover, especially dental care. Nearly one fourth (24%) of Medicare beneficiaries age 65 or older say they delayed or went without dental care in the past year due to cost, and this share rises to 42% among those under age 65 with disabilities (Figure 8). Similarly, larger shares of people with Medicare under age 65 with disabilities than those age 65 or older say they delayed or went without vision services, which are also not covered by Medicare (25% vs. 13%), prescription drugs (18% vs. 10%), and doctor’s office visits (14% vs. 4%) in the past year because of cost.

Larger Percentages of People with Medicare Under Age 65 with Disabilities than Those Age 65 or Older Say They Delayed or Went Without Certain Health Care Services Due to Cost in the Past Year

Conclusion

Results from the 2023 KFF Survey of Consumer Experiences with Health Insurance show people with Medicare are more satisfied with their health insurance coverage than those with other types of insurance, but among people with Medicare, those under age 65 with disabilities are less likely than those age 65 or older to rate Medicare positively when it comes to the overall performance of their insurance and various features of it. Medicare beneficiaries under age 65 with disabilities are more likely than those age 65 or older to experience access and cost problems when using their insurance.

Because a larger share of people with Medicare under age 65 with disabilities report that they are in fair or poor physical and mental health and have severe chronic conditions compared to people age 65 or older, those under age 65 with disabilities may be more likely to have multiple encounters with the health care system during the year and encounter problems when they do. And with a greater share of beneficiaries under age 65 with disabilities than those 65 or older having relatively low incomes, people under age 65 are more likely to have problems affording health care costs.

Addressing areas of particular concern for beneficiaries under age 65 with disabilities – including policies that address issues related to provider access and availability, improve the process of comparing plans and enrolling, enhance understanding of various features of Medicare, including out-of-pocket costs and provider network restrictions (for Medicare Advantage plans), and improve access to financial assistance programs that help with affordability – could lead to better experiences with Medicare for beneficiaries under age 65 with disabilities.

This work was supported in part by the Robert Wood Johnson Foundation. KFF maintains full editorial control over all of its policy analysis, polling, and journalism activities.

A Larger Percentage of People with Medicare Under Age 65 with Disabilities Than Those Age 65 or Older Have Income Below 200 Percent of Poverty and Report Fair or Poor Physical and Mental Health

Methodology

This KFF Survey of Consumer Experiences with Health Insurance was designed and analyzed by researchers at KFF. The survey was designed to reach a representative sample of insured adults in the U.S. The survey was conducted February 21–March 14, 2023, online and by telephone among a nationally representative sample of 3,605 U.S. adults who have employer sponsored insurance plans (978), Medicaid (815), Medicare (885), Marketplace plans (880), or a Military plan (47). The Medicare sample includes 720 respondents age 65 or older and 165 respondents under age 65 with disabilities. The margin of sampling error is plus or minus 2 percentage points for the full sample, and plus or minus 4 percentage points for adults with Medicare. The margin of sampling error is plus or minus 11 percentage points for adults under the age of 65 with Medicare and plus or minus 5 percentage points for adults age 65 or older with Medicare. For results based on other subgroups, the margin of sampling error may be higher.

The sample includes 2,595 insured adults reached through the SSRS Opinion Panel either online or over the phone (n=75 in Spanish). Another 504 respondents were reached online through the Ipsos Knowledge Panel. Another 289 (n=10 in Spanish) interviews were conducted from a random digit dial (RDD) of prepaid cell phone numbers (n=190) and landline telephone numbers (n=99). An additional 217 respondents were reached by calling back respondents who said they were insured in previous KFF probability-based polls.

Respondents were weighted separately to match each group’s demographics using data from the 2021 American Community Survey (ACS). Weighting parameters included gender, age, education, race/ethnicity, and region.

For full details on the survey methodology, see the Methodology tab of the KFF Survey of Consumer Experiences with Health Insurance.

News Release

KFF Examines How Abortion Bans, Misinformation, and State Actions May Affect Access to Contraception

Published: Oct 26, 2023

Following the Supreme Court’s ruling overturning Roe v. Wade, uncertainty has emerged over whether the right to contraception could also be limited. Justice Thomas’ concurring opinion in Dobbs renewed attention and raised the possibility that other Supreme Court precedents relying on the same principles as Roe, such as the right of people to obtain contraceptives, could also be overturned. In response, legislative bodies at the state and federal level have debated, and in some cases enacted, protections for contraception.

A new KFF analysis finds that across the United States, 13 states—California, Colorado, Florida, Illinois, Massachusetts, Michigan, Minnesota, New Jersey, New Mexico, Oregon, Rhode Island, Vermont, and Washington—and the District of Columbia have specific legal or constitutional protections for the right to contraception. In addition, two states (Nevada and Maryland) have started the process of adding a constitutional amendment.

Except for Florida, none of the states that ban or severely restrict access to abortion have state level policies on the books protecting the right to obtain contraceptives, leaving access to some methods vulnerable to future attempts to limit them.  

Fundamental misunderstandings about how contraceptives work—particularly intrauterine devices (IUDs) and emergency contraceptive pills—increase the likelihood that legislators and regulatory agencies might conflate abortion and contraception, and potentially restrict people’s ability to access these methods in some states. A February KFF poll indicates that 73% of people incorrectly think emergency contraceptive pills can end a pregnancy in its early stages when they cannot. Additionally, studies suggest some people wrongly believe that IUDs work primarily by preventing implantation of a fertilized egg in the uterine lining.

Leading medical organizations define pregnancy to begin at the implantation of a fertilized egg. Some state abortion bans, however, define pregnancy to begin at the moment of fertilization and define embryonic cells as people. These definitions, coupled with the misinformation that certain contraceptives can end a pregnancy, have been interpreted, in some circumstances, to restrict access to or payment for those methods.

Read the brief, “The Right to Contraception: State and Federal Actions, Misinformation, and the Courts,” which explains how misinformation about contraceptives and how pregnancy is defined in state abortion bans may impact contraceptive access and outlines the legal protections some states have established to affirm the right to obtain contraceptives.

Complexity in Our Health Care System is the Enemy of Access and Affordability

Published: Oct 26, 2023

In this JAMA Health Forum column, KFF’s Drew Altman and Larry Levitt examine how the complexity of the health care system  – with all of its red tape – can be as big a problem for patients as the traditional big three problems of costs, quality and access, and makes those problems worse. The column also explores how simplifying the system not only could ease patients’ frustrations but also help to address those other challenges.

Has Marriage Equality for LGBTQ People Impacted Access to Domestic Partner Health Benefits?

Published: Oct 26, 2023

Prior to marriage equality, LGBTQ people had limited access to dependent health benefits compared to opposite-sex couples as there were no requirements that they be offered in the workplace. Some employers aimed to mediate this disparity, in part, by offering unmarried couples domestic partner health insurance benefits. Questions have since been raised about whether these benefits would remain following marriage equality and civil rights decisions. In this data note, based on KFF’s 2023 Employer Health Benefit Survey, we assess the current status of domestic partner health insurance benefit offerings for same-sex spouses against this backdrop.

Access to employer-sponsored health insurance for same-sex couples was fundamentally transformed by the Supreme Court rulings on same-sex marriage (United States v. Windsor, in 2013, which permitted states to perform same-sex marriages and Obergefell v. Hodges, in 2015, which made same-sex marriage legal nationwide). Marriage equality brought with it new access to certain benefits for LGBTQ people, including dependent health insurance. In addition, a more recent Supreme Court case, Bostock v. Clayton County (2020), held that federal civil rights law prohibiting sex discrimination in employment includes protections based on sexual orientation or gender identity.1  Together, these decisions mean that access to same-sex spousal employment benefits are likely required when they are also offered to opposite-sex couples by moderate-sized employers.2 

In the early 2000’s, prior to the state and federal marriage decisions, about one-third of large firms offered domestic partner health insurance benefits to same-sex couples. The share of large firms offering same-sex domestic partner health benefits increased from 34% in 2011 to 42% in 2012, the year prior to the Windsor decision, potentially reflecting greater attention to the rights of LGBTQ people as marriage equality was being debated nationwide.

Since that time, there have been no significant year-to-year changes in the share of firms offering same-sex couples domestic partner health benefits, with 45% of firms offering in 2023. In other words, following the Supreme Court decisions securing protections for LGBTQ people, the share of firms offering same-sex domestic partner health benefits has not declined, as might have been expected.

Large Firm Offer of Same-Sex Domestic Partner Health Insurance Benefits

It is likely that firms continue to make this coverage available because it provides employees with a benefit irrespective of marital status, and may allow employers that historically offered domestic partner benefits to continue to make a statement about equity. In addition, some states, such as California, require certain employers to offer such coverage. Further, because almost all (96%) employers require some employee contributions toward dependent coverage, employers do not absorb the full cost of providing this benefit, which may increase their willingness to offer access. For employees, the retention of domestic partner health insurance coverage benefits while also offering coverage to same-sex spouses provides broader options for coverage in households regardless of marital status.

  1. These protections, provided via Title VII of the Civil Rights Act, apply to employers with at least 15 workers. ↩︎
  2. In 2023, almost all (99%) large firms in the U.S report offering dependent health coverage. ↩︎

Payment Rates for Medicaid Home- and Community-Based Services: States’ Responses to Workforce Challenges

Authors: Alice Burns, Maiss Mohamed, and Molly O’Malley Watts
Published: Oct 24, 2023

Issue Brief

Long-standing workforce challenges in Medicaid home- and community-based services (HCBS) were exacerbated by the pandemic and addressing them is the top priority for most state HCBS programs. New flexibilities combined with funding provided through the American Rescue Plan Act helped states enact new policies to address those issues during the pandemic, but many of those policies are ending and federal funding will expire. This issue brief describes states’ ongoing efforts to respond to the workforce crunch and how they pay HCBS workers, which are central challenges in ensuring that HCBS services are accessible to the 4 million Medicaid enrollees who use them. The data come from the 21st KFF survey of officials administering Medicaid HCBS programs in all 50 states and the District of Columbia, which states completed between May and August 2023. The survey was sent to each state official responsible for overseeing the administration of HCBS benefits (including home health, personal care, and waiver services for specific populations such as people with physical disabilities). All states except Florida responded to the 2023 survey, but response rates for certain questions were lower. Key takeaways include:

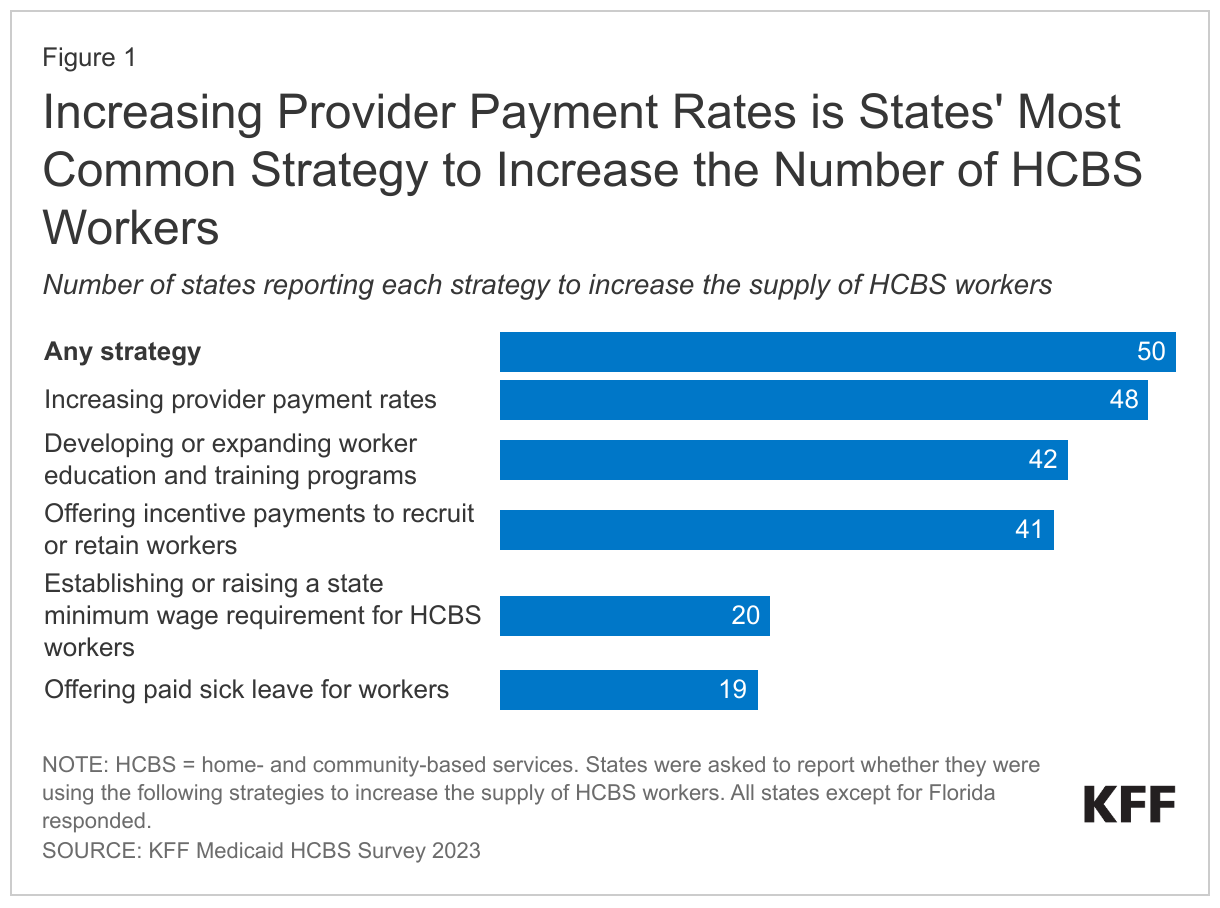
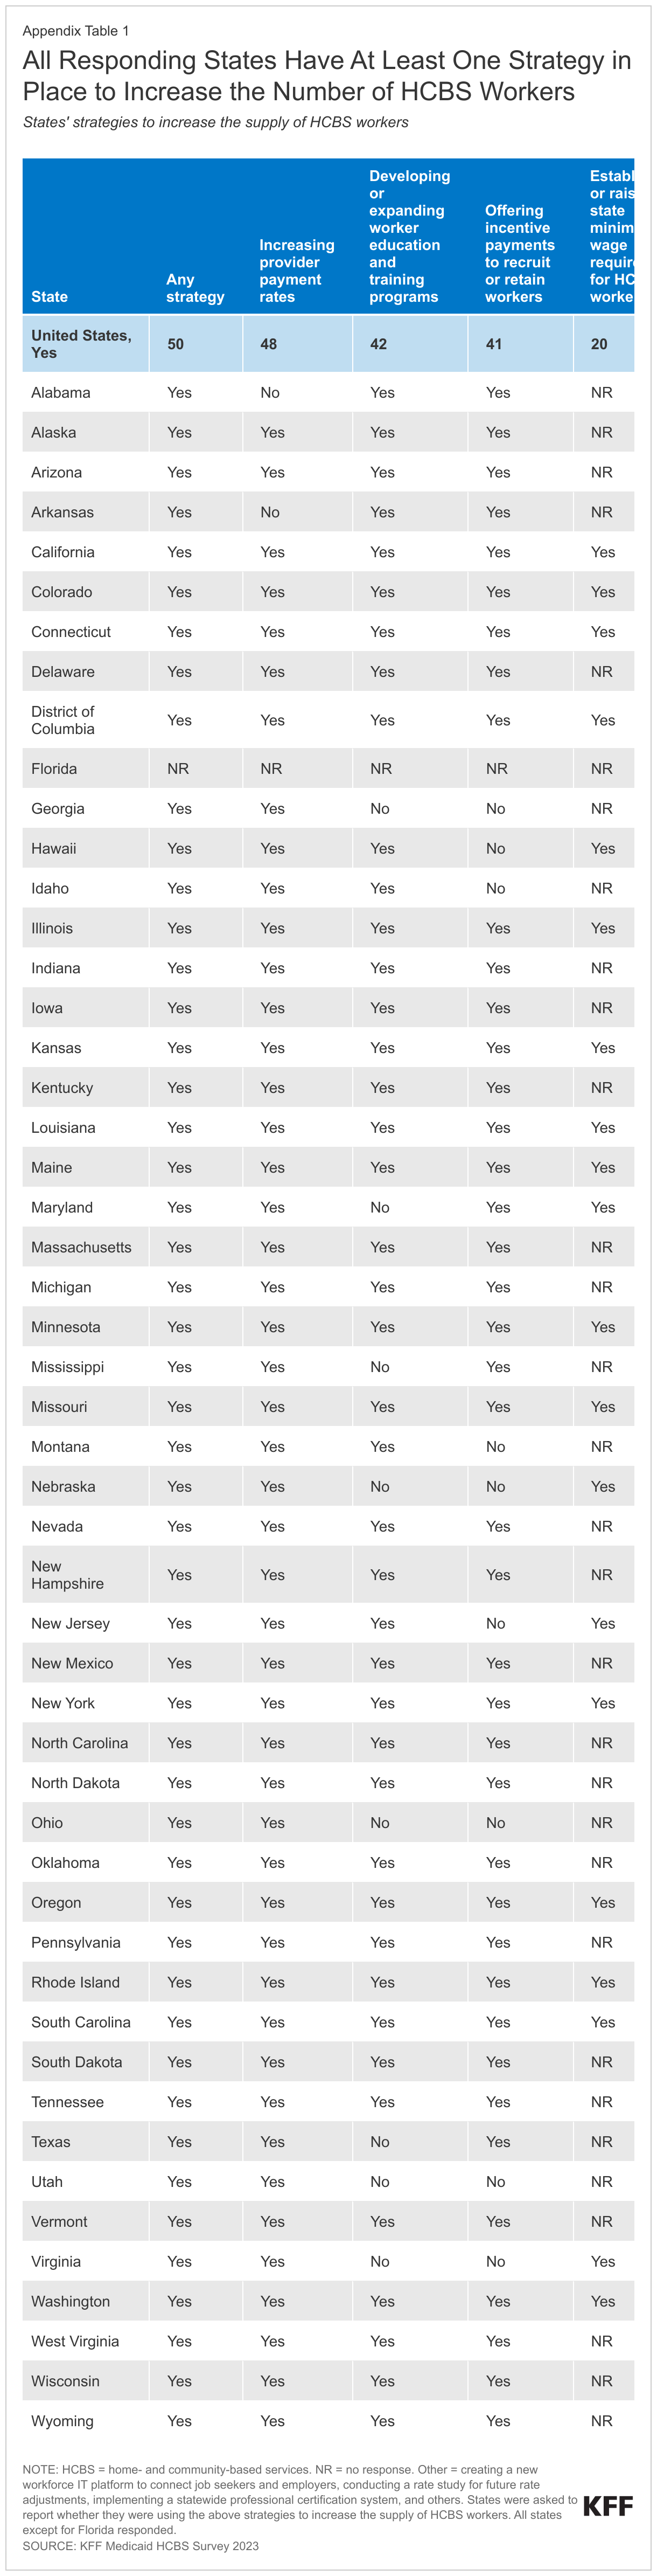
  • All responding states (which includes the District of Columbia) reported taking actions to address workforce shortages, including raising payment rates in most states (Figure 1).
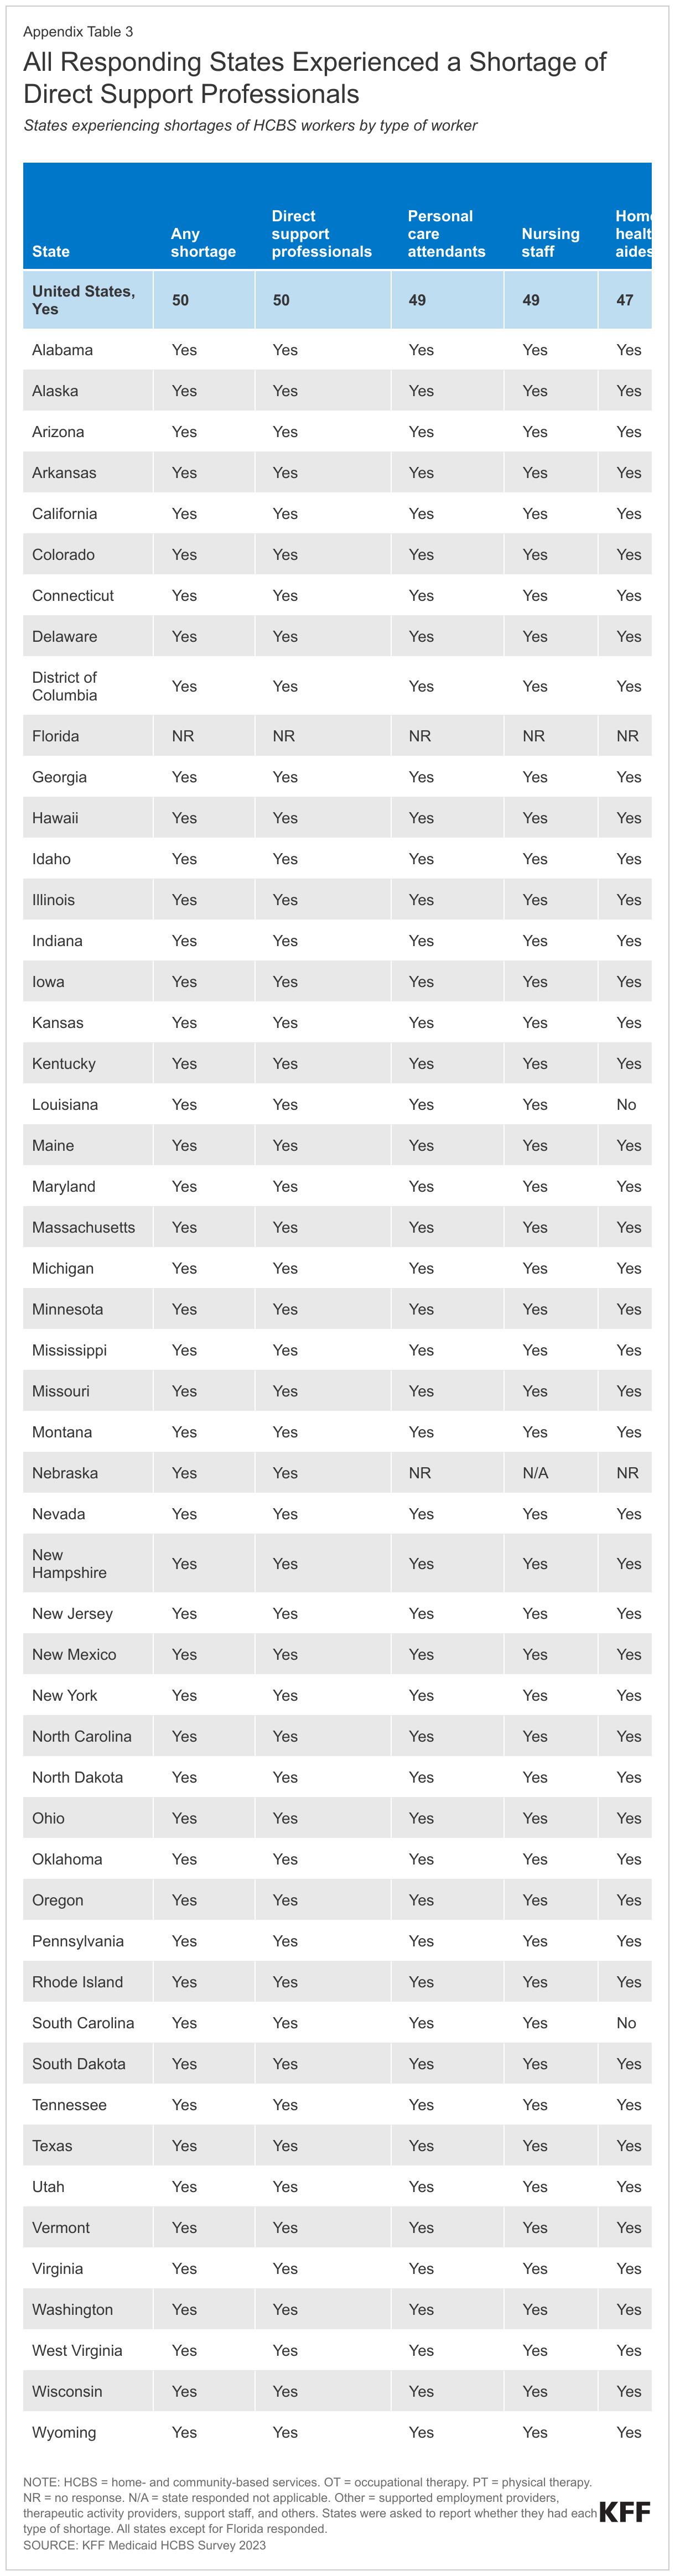
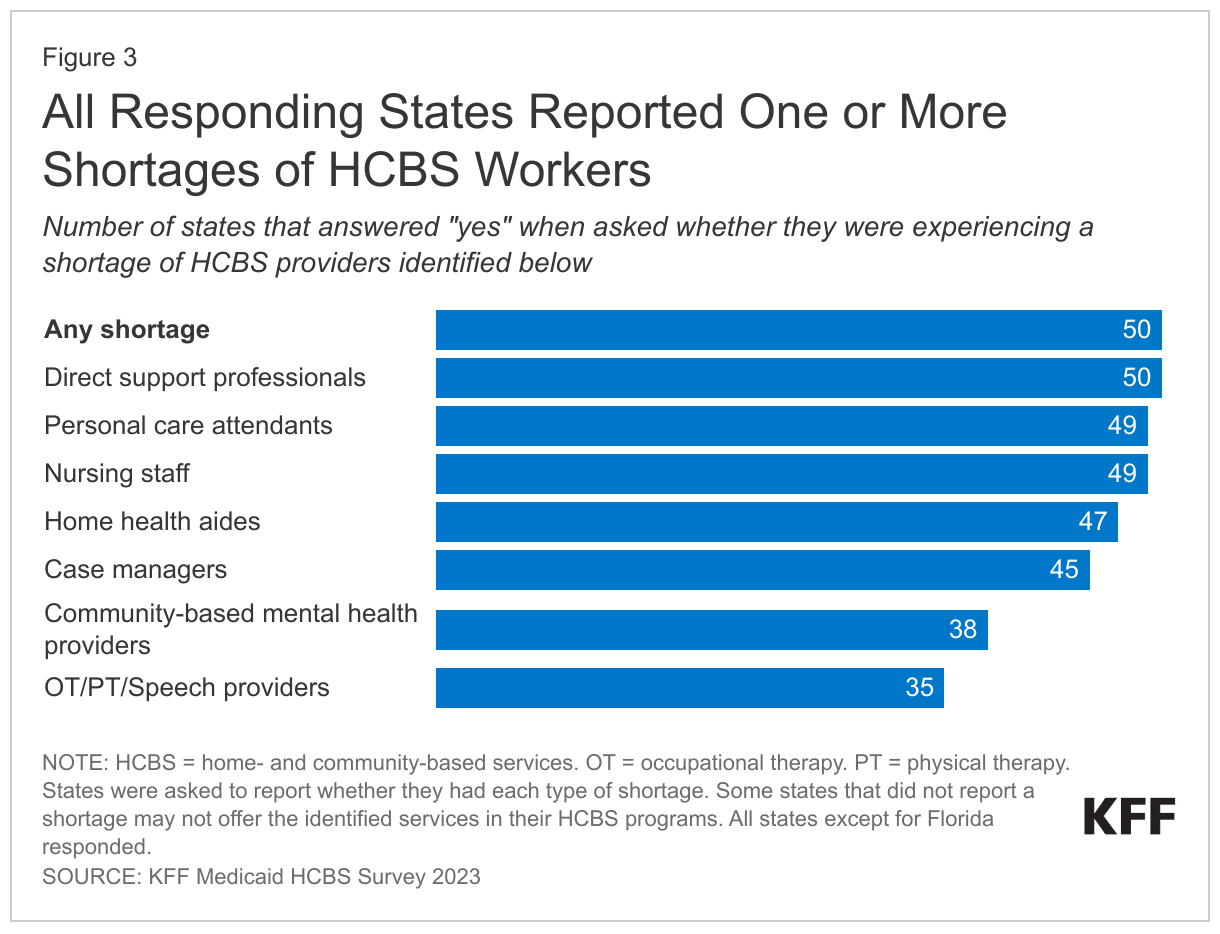
  • All states reported shortages of HCBS workers, most frequently among direct support professionals, personal care attendants, nursing staff, and home health aides.
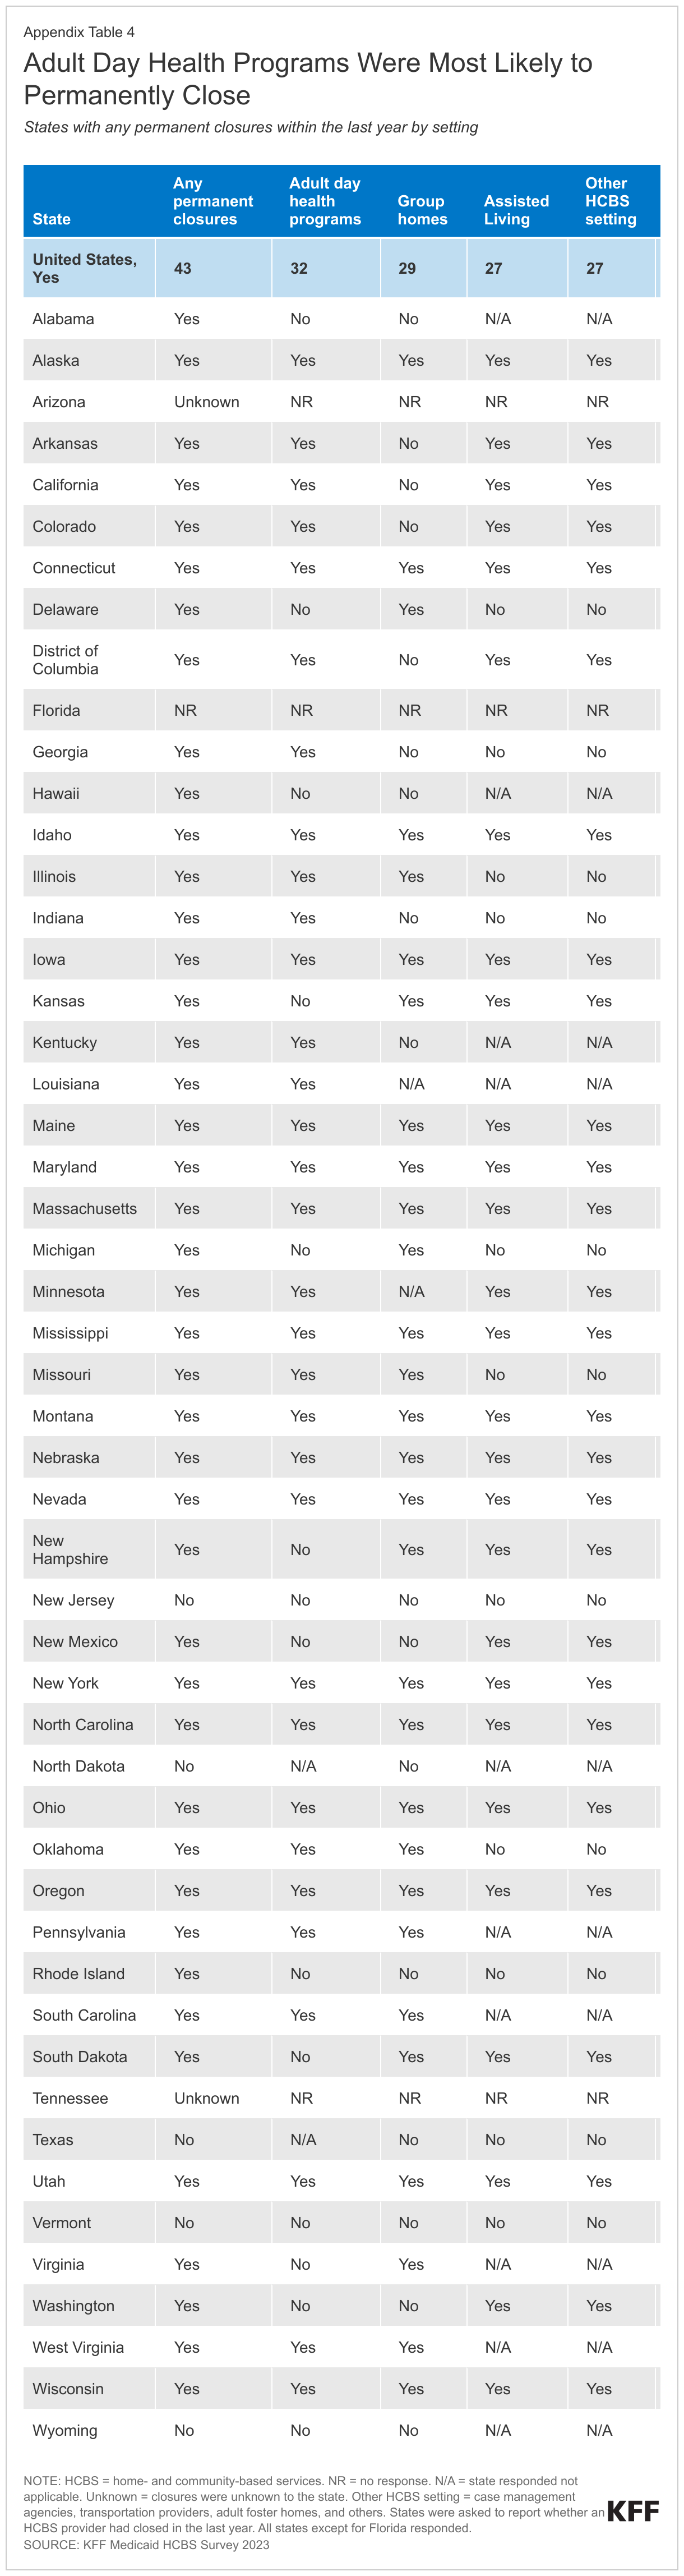
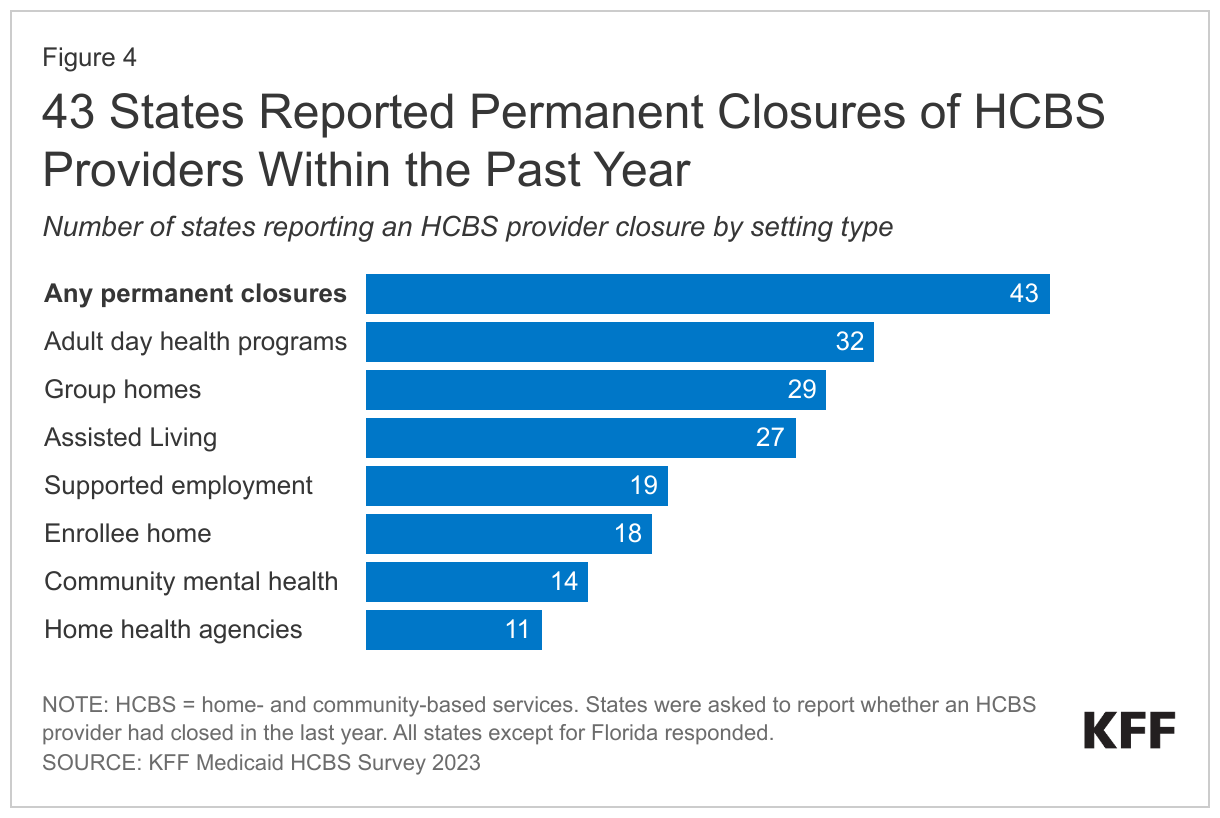
  • Most (43) states reported permanent closures of HCBS providers within the last year.
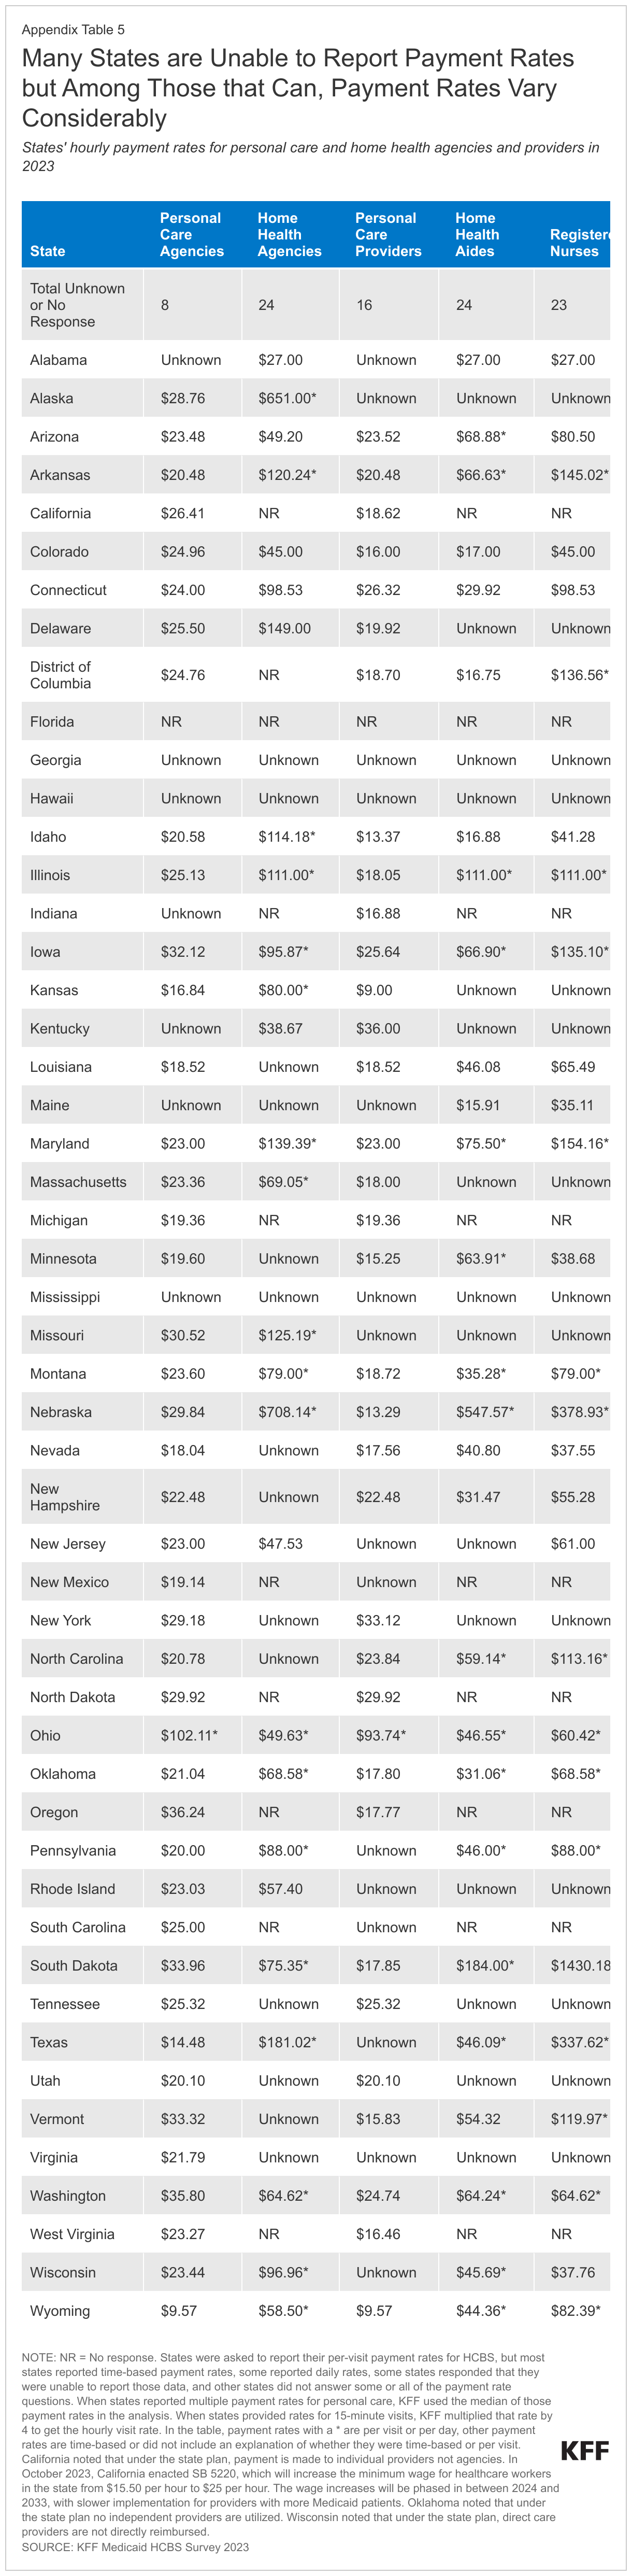
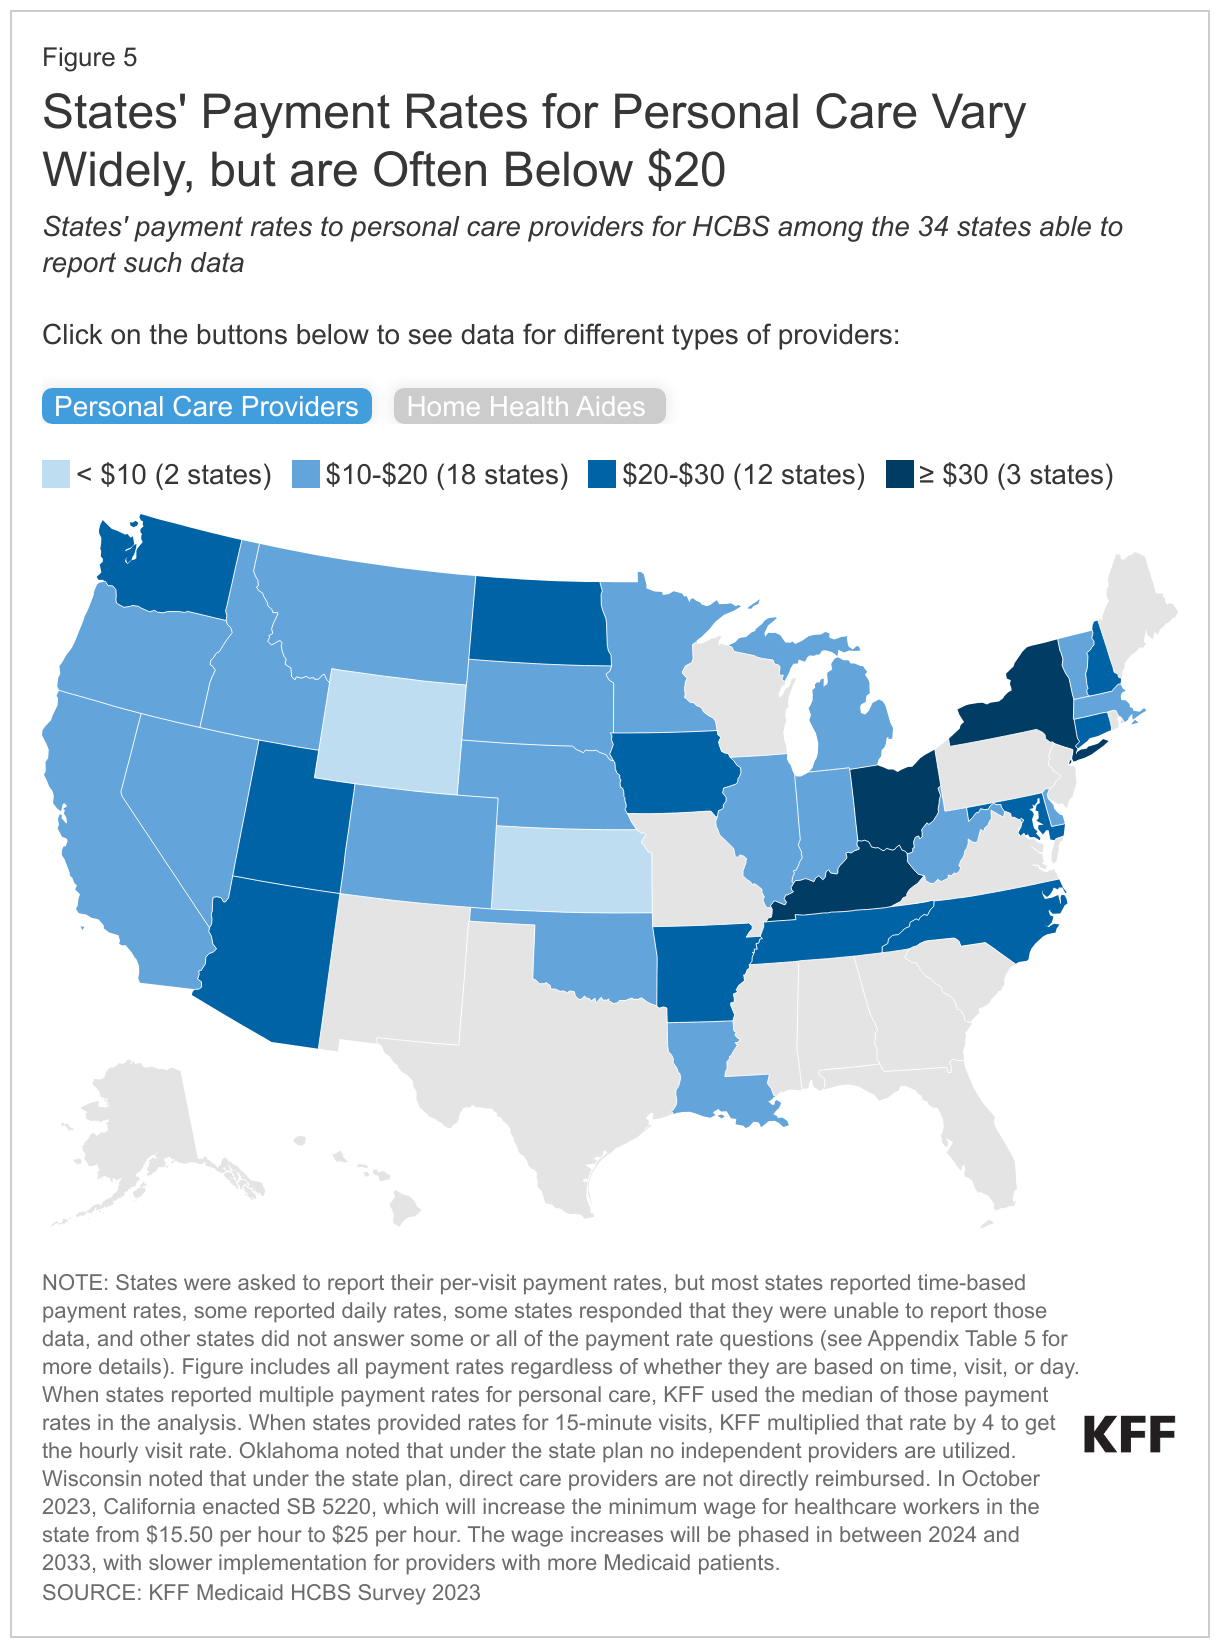
  • Among the 34 states that reported time-based payment rates for personal care providers, most pay less than $20 per hour.

Increasing Provider Payment Rates is States' Most Common Strategy to Increase the Number of HCBS Workers

What are Medicaid HCBS and how are they provided and paid for?

HCBS are one type of long-term services and supports (LTSS), which encompass a broad range of paid and unpaid medical and personal care services. LTSS assist with activities of daily living (such as eating, bathing, and dressing) and instrumental activities of daily living (such as preparing meals, managing medication, and housekeeping). They are provided to people who need such services because of aging, chronic illness, or disability and may be provided in institutional settings such as nursing facilities or in people’s homes and the community. Services provided in non-institutional settings are usually referred to as HCBS and include a wide range of services such as adult daycare, home health, personal care, transportation, and supported employment. A wide variety of workers provide HCBS, and most positions require minimal training and education (see Box 1). In 2020, Medicaid was the primary payer for LTSS, covering over half of all spending in in the U.S.

Box 1: The HCBS Workforce

The HCBS workforce is diverse and encompasses individuals with a variety of job titles. Depending on the state and the specific services offered, the people who provide HCBS include personal care aides, direct support professionals, home health aides, certified nursing assistants, and independent providers. Different types of providers are paid differently and are subject to different training and certification requirements. Home health aides and certified nursing assistants are the only types of providers that must comply with federal training and certification standards.

  • Personal care aides assist with the activities of daily living, housekeeping tasks, meal preparation, and medication management.
  • Direct support professionals provide a broader range of services than personal care aides such as employment supports.
  • Home health aides and certified nursing assistants provide clinical care in community settings and help with the activities of daily living.
  • Independent providers are employed directly by the people who are receiving HCBS through what are called “self-directed services.” Some independent providers are family caregivers, who may be paid by the Medicaid program for the services they provide.

People who provide HCBS are nearly all female (85% in 2021) and nonwhite. Most have less than an associate degree and although over half work full time, many receive public assistance such as Medicaid or food and nutrition assistance.

All HCBS are optional except for the mandatory home health benefit, and most benefits—including personal care—first became available through optional Medicaid “waiver” programs. If services are provided through a state plan, they must be offered to all eligible individuals. In contrast, services provided under waivers, such as 1115s or 1915(c)s, may be restricted to specific groups based on geographic region, income, or type of disability. Waivers may also include a wider range of service types than can be provided under state plans. Because all HCBS besides home health were first available through waivers, services were generally tailored to certain types of Medicaid enrollees such as those with intellectual disabilities or those with physical disabilities, and benefit packages were also specific to those groups’ needs. Many HCBS are now available through Medicaid state plans and available to all enrollees in the state. KFF estimates that over 4 million Medicaid enrollees use HCBS, and that the numbers of people using HCBS through the state plan are similar to the numbers using HCBS through waivers.

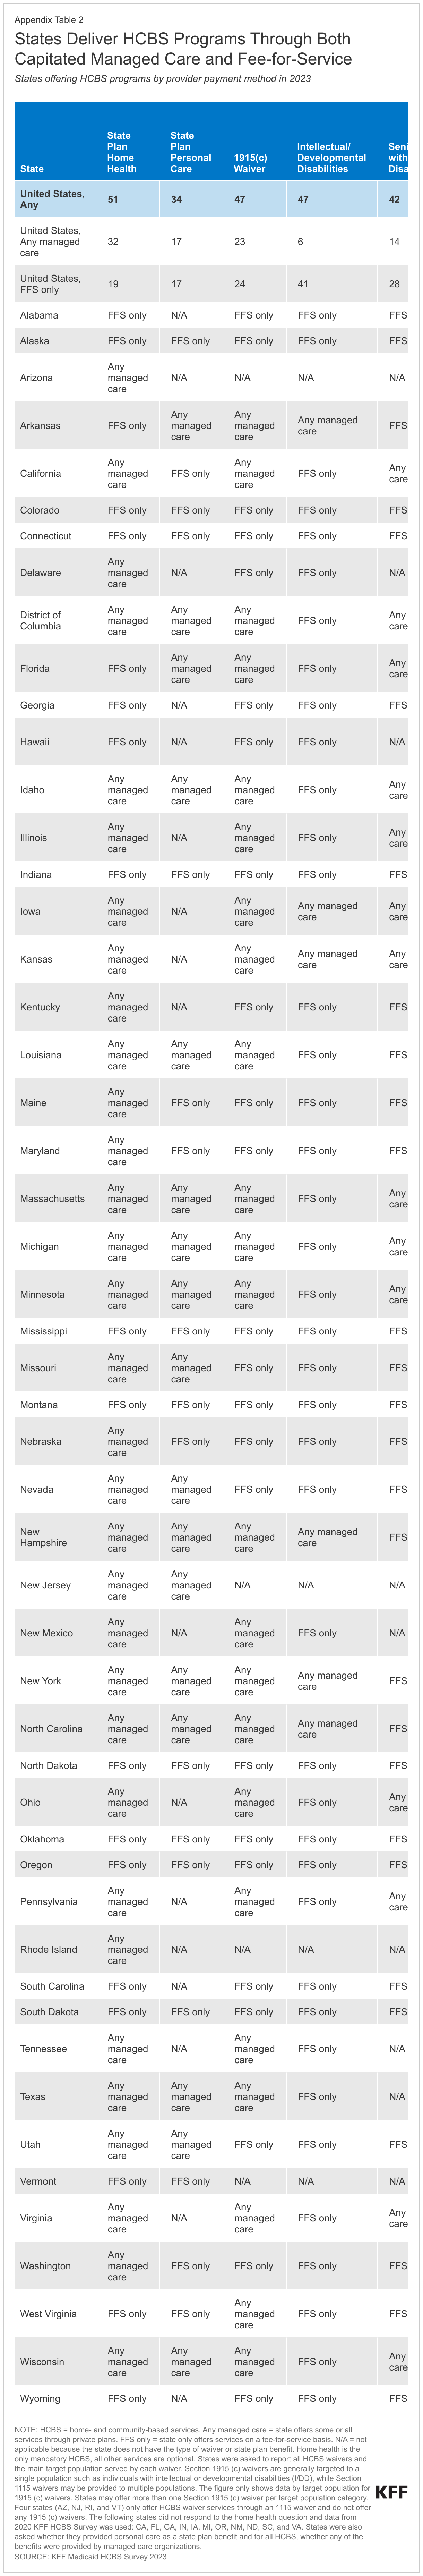
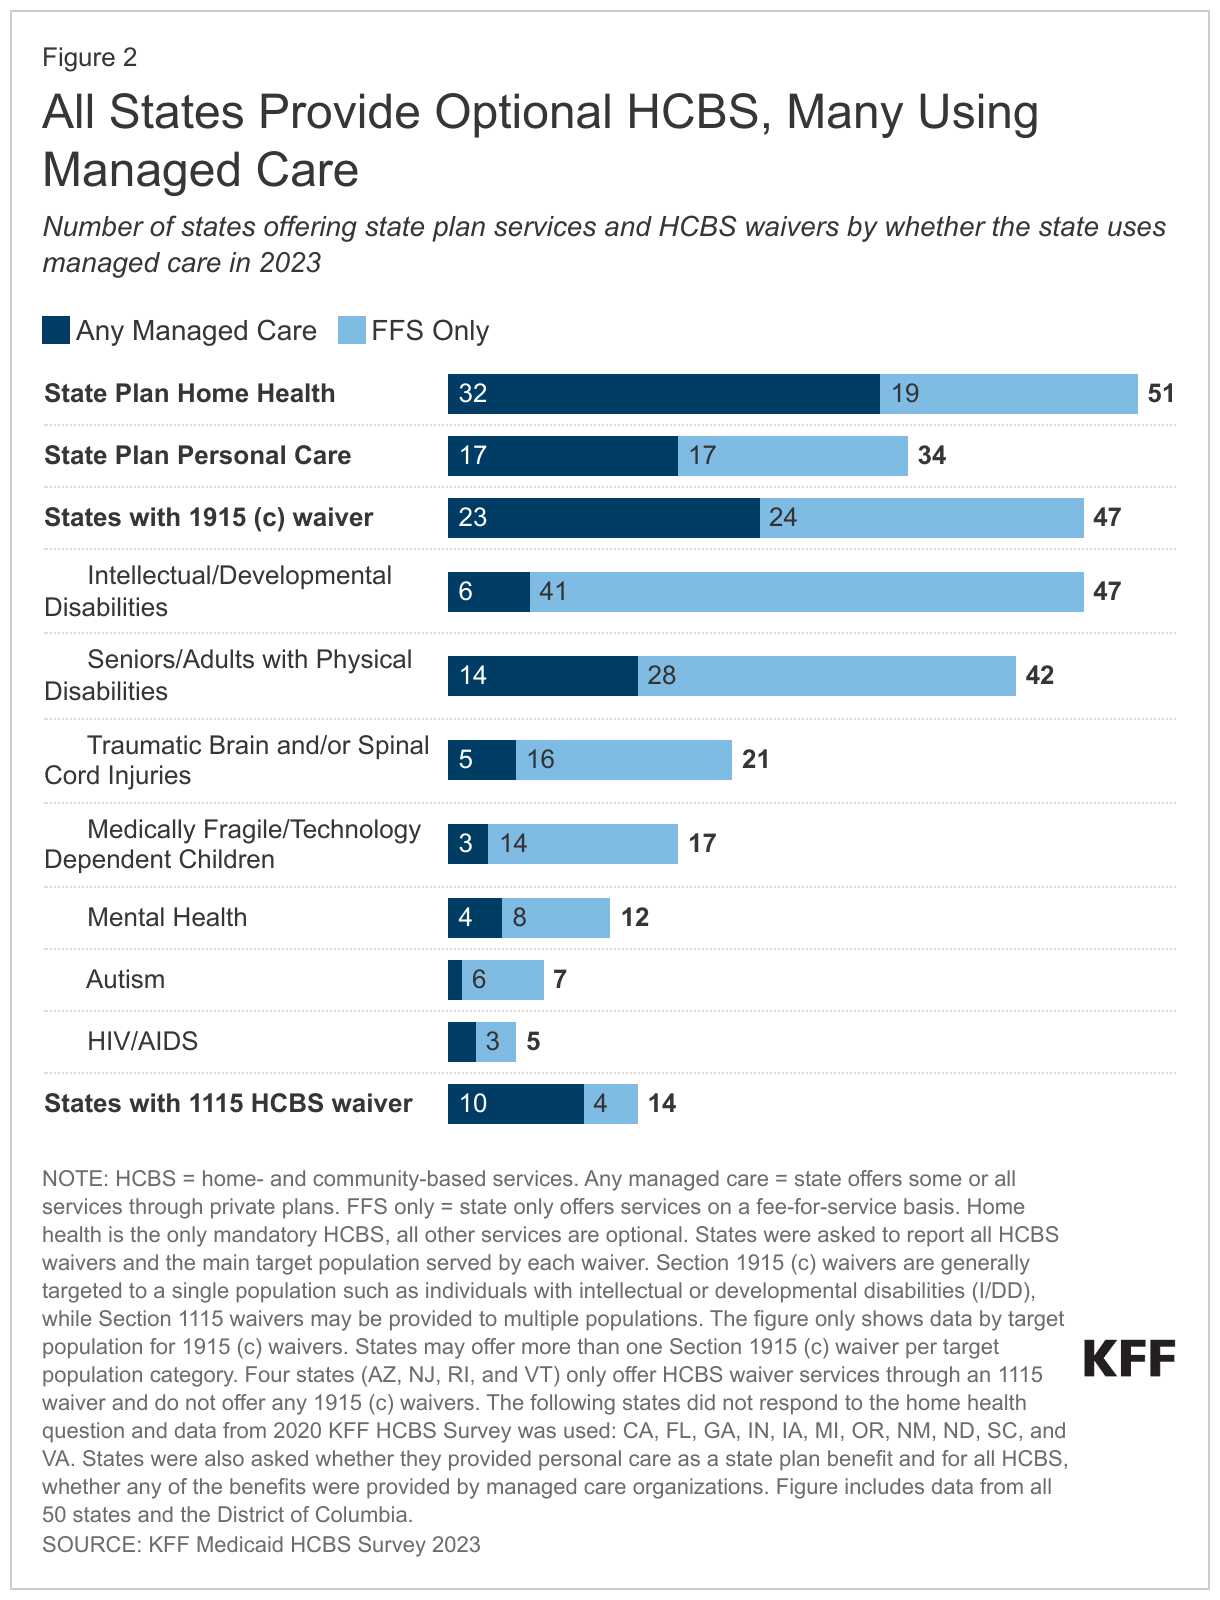
In KFF’s 2023 survey of state HCBS programs, all states reported offering personal care and other optional HCBS, most commonly through 1915(c) waivers (Figure 2, Appendix Table 2). States are required to offer home health through their Medicaid state plan and 34 states also offer personal care through the state plan. All states also offer HCBS waivers—either an 1115 waiver (14 states with one waiver in each state) and/or a 1915(c) waiver (47 states and 258 waivers total). Most 1915(c) waivers serve specific populations, with 47 states having waivers for people with intellectual or developmental disabilities and 42 states having waivers for people who are ages 65 and older or have physical disabilities. Ohio was the only state to report a new 1915(c) waiver in 2023, serving people under age 21 who have complex behavioral health needs that would require an inpatient level of psychiatric care.

Over half of states use managed care to provide at least some HCBS, particularly for benefits provided through the state plan or 1115 waivers. In managed care, states pay managed care plans a set fee—often called a capitation payment—for each person enrolled and the managed care plans are responsible for providing all services to enrollees. Use of managed care to provide HCBS has been growing over time, with states using managed care to make their Medicaid spending more predictable and to help coordinate the services enrollees use. Among the 14 states with 1115 waivers, 10 use managed care plans to provide at least some of the HCBS and over half of states use managed care plans to provide at least some home health and personal care. Managed care was much less common under the 1915(c) waivers, particularly for waivers serving people with intellectual or developmental disabilities—of the 47 states with such waivers, only 6 provided any of the benefits through managed care.

All States Provide Optional HCBS, Many Using Managed Care

How are states addressing the workforce challenges in HCBS?

All responding states reported workforce shortages in 2023, with the most common shortages being among direct support professionals (50 states), personal care attendants (49 states), and nursing staff (49 states) (Figure 3, Appendix Table 3). States were asked if they had shortages of each type of provider but were not provided with a definition of shortage. Most states also reported shortages in home health aides (47 states), case managers (45 states), community-based mental health providers (38 states), and occupational, physical, and speech therapy providers (35 states). In some cases, states may not have reported a shortage of a particular type of provider because that type of service is not offered through the HCBS program.

All states but one (Nebraska) reported shortages for more than one type of provider and 48 states reported shortages among five or more provider types. Such shortages may reflect ongoing effects from the pandemic, but also low levels of compensation coupled with increasing requirements of providers. In the summer of 2021, HCBS providers in focus groups reported that their jobs had high physical demands and mental demands that were often “overwhelming.” The groups described their wages as low, particularly given the demands of their jobs; and how staffing shortages made their jobs harder because they may not know if they would be able to leave work at the end of their shift. Similarly, in the 2023 survey, California reported “difficult finding qualified providers due to low Medi-Cal reimbursement rates, losing providers due to Electronic Visit Verification (EVV) requirements, and finding qualified homemaker and attendant care providers post-COVID.” (Electronic visit verification requires providers to document electronically the services provided, the recipient, the provider, and the time, date, and location of services. The federal requirement took effect in January 2020 for personal care and in January 2023 for home health services.)

All Responding States Reported One or More Shortages of HCBS Workers

Within the last year, 43 states experienced permanent closures of HCBS providers, which were most common among adult day health programs (32 states), group homes (29 states), and assisted living facilities (27 states) (Figure 4, Appendix Table 4). States were asked if there were any permanent closures of providers within each type of setting that provides HCBS. Between 10 and 20 states reported closures of supported employment providers (19 states), providers working in enrollees’ homes (18 states), community mental health providers (14 states), and home health agencies (11 states). Arizona and Tennessee reported that closures were unknown to the state.

Most states reported closures among more than one type of provider: 37 states reported closures among two or more provider types, 23 states reported closures among 4 or more provider types, and 1 state (Maine) reported closures among all eight provider types. Some closures reflect provider shortages: Minnesota reported that “providers have downsized to coordinate locations due to staffing shortages.” On the other hand, some closures reflect the fact that many companies struggled during the pandemic and have not recovered: Louisiana reported that day services were not a feasible business model during the pandemic because of “limited to no attendance.” (Day services, also known as day care, are provided to people in centers rather than in people’s homes. The services are intended to support independence and socialization while also providing family caregivers with a break during the day.)

43 States Reported Permanent Closures of HCBS Providers Within the Past Year

All responding states reported taking actions to address provider shortages, with 48 states increasing payment rates, 42 states developing or expanding worker education and training programs, and 41 states offering incentive payments to recruit or retain workers (Figure 1, Appendix Table 1). Less common initiatives included establishing or raising the state minimum wage (20 states) and offering paid sick leave for workers (19 states). States also reported several other types of initiatives to strengthen the workforce, including creating platforms or support systems to connect job seekers with employers and positions, launching a social media campaign, and providing outreach to prospective employees.

Some states have permanent payment rate increases in place for providers, but 13 states reported that payment rate increases for at least some of the workers were temporary. Only 14 states have payment formulas that automatically increase with the costs of living, but those formulas do not apply across all types of workers.

How much do states pay for Medicaid HCBS?

KFF asked states to report their average dollar rate per visit paid to two types of HCBS provider agencies (personal care agencies and home health agencies) and three types of specific HCBS providers (personal care providers, home health aides, and registered nurses), but many states were unable to report all rates (Figure 5, Appendix Table 5). The number of states that did not provide payment rates or reported that payment rates were unknown was 8 for personal care agencies and 24 for home health agencies. Even more states did not provide payment rates for specific provider types: For each specific type of provider, nearly half of states did not provide payment rate information or reported that payment rates were unknown.

If provisions of a proposed Biden Administration rule are finalized, states would be required to report such detailed payment rates (see Box 2). If that rule is finalized as proposed, states would be required to report payment rates for certain HCBS and to demonstrate that at least 80% of the payments went to compensation for providers, also described as “direct care workers.” Meeting that requirement would require states to know both agency and provider payment rates. Among the states that were able to report payment rates, only 15 could report payment rates for personal care agencies, home health agencies, personal care providers, and home health aides, all of which would be required under the rule. Those 15 states include states that reported a mix of time-based and visit-based rates, which makes comparisons between provider and agency rates more complicated. Given the challenges for states in collecting such data, federal guidance might be required to achieve consistent reporting across states.

Box 2: Proposed Rule on Access to HCBS

On May 3, 2023, the Biden Administration released a proposed rule aimed at ensuring access to Medicaid services, which has several notable provisions aimed at addressing HCBS workforce challenges. States would be required to report payment rates for personal care, home health aide, and homemaker services to increase transparency around payment rates. For services provided through 1915(c) waivers and through the 1915 state plan authorities, the proposed rule has additional requirements related to the HCBS workforce, including the following.

  • The proposed rule would require states to demonstrate that payment rates are “adequate to ensure a sufficient direct care workforce to meet the needs of beneficiaries and provide access to services in the amount, duration, and scope specified in the person-centered plan.”
  • The rule would also require states to demonstrate that at least 80 percent of total payments for homemaker services, home health aide services, and personal care services are compensation to direct care workers.
  • States would be required to report the number of people on waiting lists for services.
  •  States would also have to report the average amount of time from when homemaker services, home health aide services, or personal care services are initially approved to when services begin and the percentage of authorized hours that are provided.

The proposed rule also includes provisions that would strengthen requirements around person-centered planning and needs assessment, create new requirements around incident management, establish requirements for people to file grievances if they are receiving HCBS from the state Medicaid program, and require states to report on nationally-standardized quality measures. Provisions would take effect on a rolling basis, between 2 and 4 years after the rule is finalized.

States reported many reasons why it was difficult to report payment rates, including the following.

  • Some states reported that services were bundled together in various ways and therefore, the payment rates were not distinguishable. For example, New Hampshire wrote: “as personal care is not a distinct service, this data cannot be determined.”
  • Among states with managed care, some states responded that they did not know the payment rates for agencies because the services were paid for by managed care plans and they did not have access to those payment rates.
  • Other states responded that they knew the payment rates for agencies but not what the agencies paid their direct care workers. Multiple states reported that they do not “dictate” what agencies pay to providers or that individual providers negotiate their own payment rates with the agencies.
  • Still other states reported that payment rates were too varied across providers and individuals. For example, Indiana reported that payment rates varied from $400 to $6,000 per month: That variation reflected the fact that there are over 400 personal care agencies, and each person has different levels of needs which vary week to week. Hawaii reported that visits vary in terms of what is provided and that the five managed care plans providing HCBS use different methodologies for collecting data, making it impossible to provide “an accurate dollar average.”

In addition to having difficulty reporting payment rates, many states reported different payment rates for personal care across different waivers and the waiver payment rates often differ from the payment rates for personal care provided through the state plan. When states reported multiple payment rates for personal care, KFF used the median of those payment rates in the analysis.

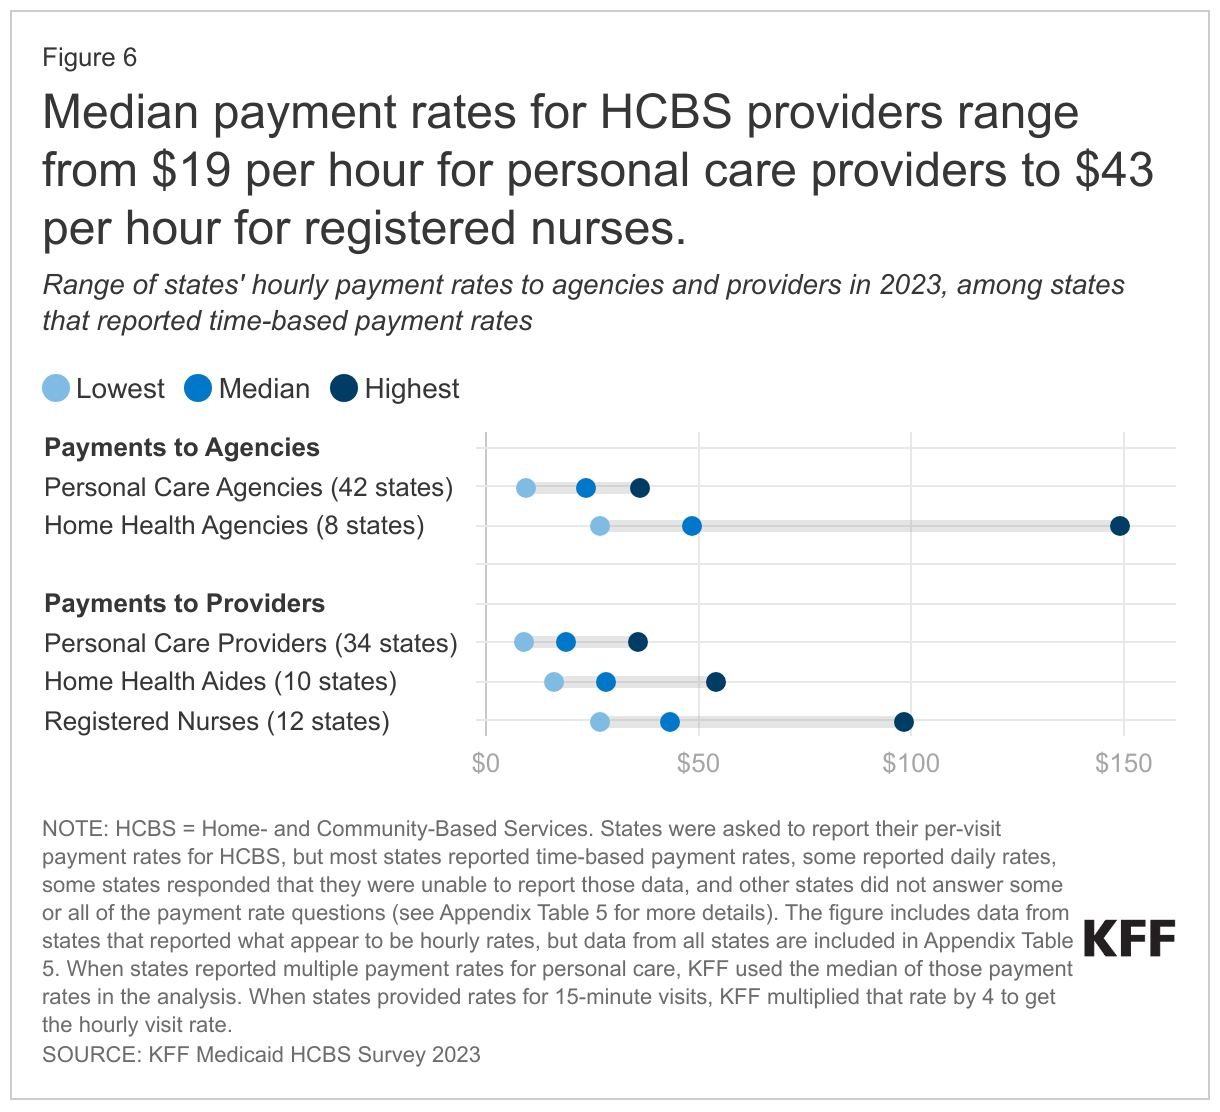
Although KFF asked states to report the average dollar rate per visit, states varied in their reporting of payment rates, with most states reporting payment rates by time (either 15 minutes or one hour), and a smaller number of states reporting rates that were per visit or per day. Most states reported payment rates by time and among those states, payments for personal care workers are generally below $20 per hour. Rates for home health aides are somewhat higher, reflecting the additional training requirements for such workers. Among the states with payment rates in the highest category, some reported that the rates were per visit or per day. Others did not indicate whether their rates were based on time or another basis, but it is likely that most payment rates in the highest category are per visit or per day.

States' Payment Rates for Personal Care Vary Widely, but are Often Below $20

Payment rates to home health agencies are generally larger than those to personal care agencies, but there is considerable variation in both (Figure 6). Across the states, the median hourly payment rates to home health agencies range from $27 to $149 among most states whereas those for personal care agencies range from $10 to $36.

The payment rates to HCBS providers also show considerable variation and are somewhat higher than those reported by other organizations on account of differences in reporting and provider categorization (Figure 6). KFF’s survey estimates that median payment rates to providers are $19 per hour for personal care providers, $28 for home health aides, and $43 for registered nurses. It is difficult to compare those numbers to those of other organizations for the following reasons.

  • Other organizations group classes of providers together differently. PHI recently reported that in 2022, home care workers made an average of $14.50 per hour and residential care aides made $15.39 per hour. The Bureau of Labor Statistics reports $14.51 per hour for home health and personal care aides in 2022.
  • Other organizations include payment rates for workers regardless of the source of payment whereas KFF rates only reflect the Medicaid rates and Medicaid often covers more intensive personal care services than other payers.

Median payment rates for HCBS providers range from $19 per hour for personal care providers to $43 per hour for registered nurses.

Among states that deliver HCBS through managed care, 20 states reported that the fee-for-service payment rate is the minimum amount MCOs could pay providers. Out of the 36 states that use managed care to provide at least some HCBS, none of the states reported that fee-for-service rates were the maximum amount that managed care plans could pay providers. There were 20 states that reported fee-for-service rates were the minimum payment rates, 13 states that reported there was no relationship between the fee-for-service and managed care rates, and 3 states that reported the answer was unknown or did not respond to the question. Even among states that do not directly tie fee-for-service rates to managed care rates, the fee-for-service rates may affect negotiations between health plans and HCBS providers, thereby, affecting the managed care rates. For example, Texas reported that “the Medicaid fee schedule serves as a primary negotiating tool for both MCOs [managed care plans] and providers in Texas. Many MCO/provider reimbursement contracts are directly tied to the Medicaid FFS [fee-for-service] fee schedule through established percentages (e.g., 100%, 102%, 95%, etc.). Furthermore, it is common for provider reimbursement contracts that are directly tied to the Medicaid fee schedule (i.e., set at a % of Medicaid) to automatically adjust when the Medicaid fee schedule changes.”

What may happen to the Medicaid HCBS workforce in the next few years?

How does the workforce shortage for Medicaid HCBS fit in with the broader staffing challenges for long-term services and supports (LTSS)? Recent analysis on the Peterson-KFF Health System Tracker shows that, as of June 2023, the number of workers in LTSS settings was measurably lower than in early 2020. Shortages and high turnover among LTSS workers reflect demanding working conditions and relatively low wages. The Biden Administration has released a proposed rule that would increase nursing facility staffing levels. KFF analysis shows that fewer than 1 in 5 nursing facilities would currently meet the levels of staffing that have been recommended, and concerns have been raised that there are not enough workers for nursing facilities to hire. Immigrants could help fill some of those positions, but a backlog of green card petitions prompted the State Department to cutoff eligibility for anyone who applied after June 1, 2022. There are concerns that the freeze on green card petitions will further exacerbate nursing shortages across both health and long-term care sectors. These challenges will only grow as the population ages: Arizona estimates that it will need to increase the workforce by over 35,000 positions to meet the demands of a growing population of older adults. Such factors highlight that the workforce crisis in Medicaid HCBS is part of an overall crisis in the LTSS sector.

How will states continue to address workforce challenges in Medicaid HCBS as pandemic-era flexibilities and funding come to an end? Many of the payment rate increases and bonuses for retention and recruitment were funded by extra federal funding available through the American Rescue Plan Act, but as that funding expires, states will have to find alternative funding sources if they want to maintain spending levels. The state of New York reported: “Workforce issues are paramount and the State is making major investments to strengthen the workforce through APRA [American Rescue Plan Act] initiatives.” States also used pandemic-era authorities to expand access to HCBS, in particular, by allowing family caregivers to be paid providers and increasing payment rates. Those authorities will all end by November 11, 2023, and it is unknown whether the expiration of those authorities will increase challenges in accessing Medicaid HCBS.

How will proposed requirements for reporting LTSS payment rates affect states’ payments for Medicaid LTSS? Current proposed rules aim to address workforce shortages in the nursing facility and HCBS sectors by requiring states to report more information about Medicaid payment rates and the percentage of states’ payments that go towards worker compensation. It is unknown how requirements in the final rules will compare with the proposed rules (including the timeline for states to meet the new requirements), and whether reporting requirements will affect the ways in which states pay for LTSS. Both new rules are likely to put upward pressure on payment rates and spending on LTSS but there is no new federal funding for Medicaid’s costs, which are shared between the federal and state governments, so it is unknown where the new funding may come from. Also unknown is whether the need to report payment rates could deter states from pursuing alternative payment approaches such as value-based care or bundled payments, which aim to promote improved health and well-being for people but often obscure payment rates for specific services or providers.

Appendix Tables

All Responding States Have At Least One Strategy in Place to Increase the Number of HCBS Workers

States Deliver HCBS Programs Through Both Capitated Managed Care and Fee-for-Service

All Responding States Experienced a Shortage of Direct Support Professionals

Adult Day Health Programs Were Most Likely to Permanently Close

Many States are Unable to Report Payment Rates but Among Those that Can, Payment Rates Vary Considerably
News Release

In Response to Home-Care Workforce Shortages, Most States Report Increasing Medicaid’s Payment Rates and Expanding Worker Opportunities

Published: Oct 24, 2023

Almost every state reported increasing Medicaid payment rates for home- and community-based services to recruit and retain workers as part of their strategy to address long-standing workforce challenges, according to a new report from a survey of state officials administrating those programs. Most states also report developing or expanding worker education and training programs and offering incentive payments to recruit or retain workers.

The bar chart compares the number of states reporting each strategy to increase the number of workers in home and community-based services programs. Increasing provider payment rates is states' most common strategy to increase the supply of these workers, followed by offering education and training.

All surveyed states reported shortages of care workers and most (43 states) experienced permanent closures of providers over the last year. Staff shortages were most common among direct support professionals, personal care attendants, nursing staff, and home health aides. Closures were most common among adult day health programs (32 states), group homes (29 states), and assisted living facilities (27 states.)

Even with increased payment rates, among the 34 states that reported time-based payment rates for personal care providers, 20 pay less than $20 per hour. Based on survey results, KFF estimates that median Medicaid payment rates to home- and community-based service providers are $19 per hour for personal care providers, $28 for home health aides, and $43 for registered nurses providing home and community-based care. There is considerable variation in provider payment rates and state officials say it is difficult to report these numbers.

The home-care workforce is diverse and encompasses individuals with a variety of job titles, including personal care aides, direct support professionals, home health aides, certified nursing assistants, and independent providers. Pay rates and training and certification requirements vary across roles. Home health aides and certified nursing assistants are the only types of providers that must comply with federal training and certification standards.

All states (except Florida) and the District of Columbia responded to the 2023 survey, though response rates varied by question.