Section 1115 Medicaid Waiver Watch: A Closer Look at Recent Approvals to Address Health-Related Social Needs (HRSN)

Published: Mar 4, 2024

Note: For the latest information on states with approved HRSN waivers, view our  Section 1115 tracker “Key Themes Maps.

In December 2022, the Centers for Medicare and Medicaid Services (CMS) announced a Section 1115 demonstration waiver opportunity to expand the tools available to states to address enrollee health-related social needs (or “HRSN”). In November 2023, CMS released a detailed Medicaid and CHIP HRSN Framework accompanied by an Informational Bulletin (CIB). CMS defines health-related social needs as an individual’s unmet, adverse social conditions (e.g., housing instability, homelessness, nutrition insecurity) that contribute to poor health and are a result of underlying social determinants of health (SDOH). CMS outlines federal guardrails and requirements attached to the new demonstration opportunity (e.g., expenditure limits, service delivery requirements, and monitoring and evaluation requirements). CMS indicates broadening the availability of HRSN services is “expected to promote coverage and access to care, improve health outcomes, reduce health disparities, and create long-term, more cost-effective alternatives or supplements to traditional medical services.” While health programs like Medicaid can play a supporting role, CMS stresses the new HRSN initiatives are not designed to replace other federal, state, and local social service programs but rather to complement and coordinate with these efforts. And, the amount of funding allocated to HRSN programs is modest as a share Medicaid spending in states with approved waivers.

This issue brief identifies states with approved and pending Medicaid 1115 waivers with SDOH-related provisions and summarizes approvals under the new Biden administration HRSN 1115 framework, highlighting approved services, target populations, and key requirements related to financing HRSN services.

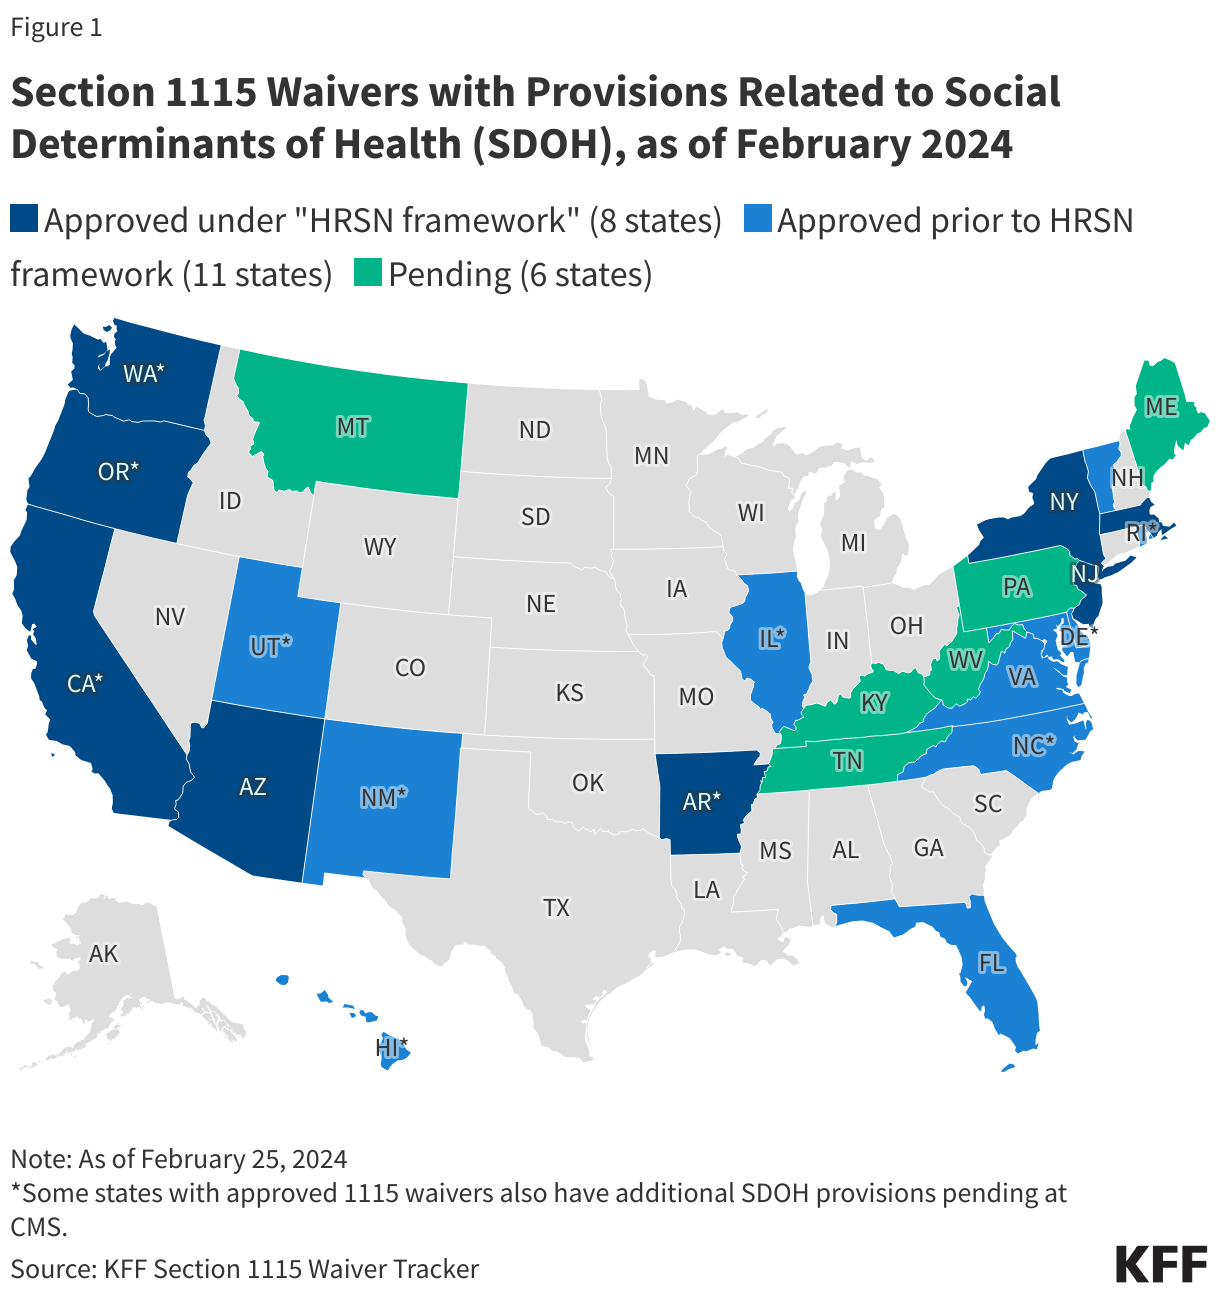
As of February 2024, the Biden administration has approved eight 1115 demonstrations under the new HRSN waiver framework (Figure 1). These waivers authorize evidence-based housing and nutrition services for specific high-need populations. Several approvals build on prior 1115 waiver initiatives (including California’s “CalAIM” transformation). Approvals include coverage of rent/temporary housing and utilities for up to 6 months and meal support up to three meals per day (for up to 6 months), departing from longstanding prohibitions on payment of “room and board” in Medicaid.1  Eleven other states have approved 1115 waivers with SDOH-related provisions that pre-date the new Biden administration HRSN framework. These waivers are generally narrower in scope (services and target populations) or pilot programs targeting specific regions. For example, in October 2018, CMS approved North Carolina’s Healthy Opportunities Pilots, that operate in three geographic regions. Six additional states have SDOH-related 1115 waivers pending review at CMS.

Section 1115 Waivers with Provisions Related to Social Determinants of Health (SDOH), as of February 2024


The remainder of this brief highlights key provisions approved under the new HRSN 1115 framework in eight states (Arizona, Arkansas, California, Massachusetts, New Jersey, New York, Oregon, and Washington).

What HRSN services are states covering through recently approved 1115 waivers?

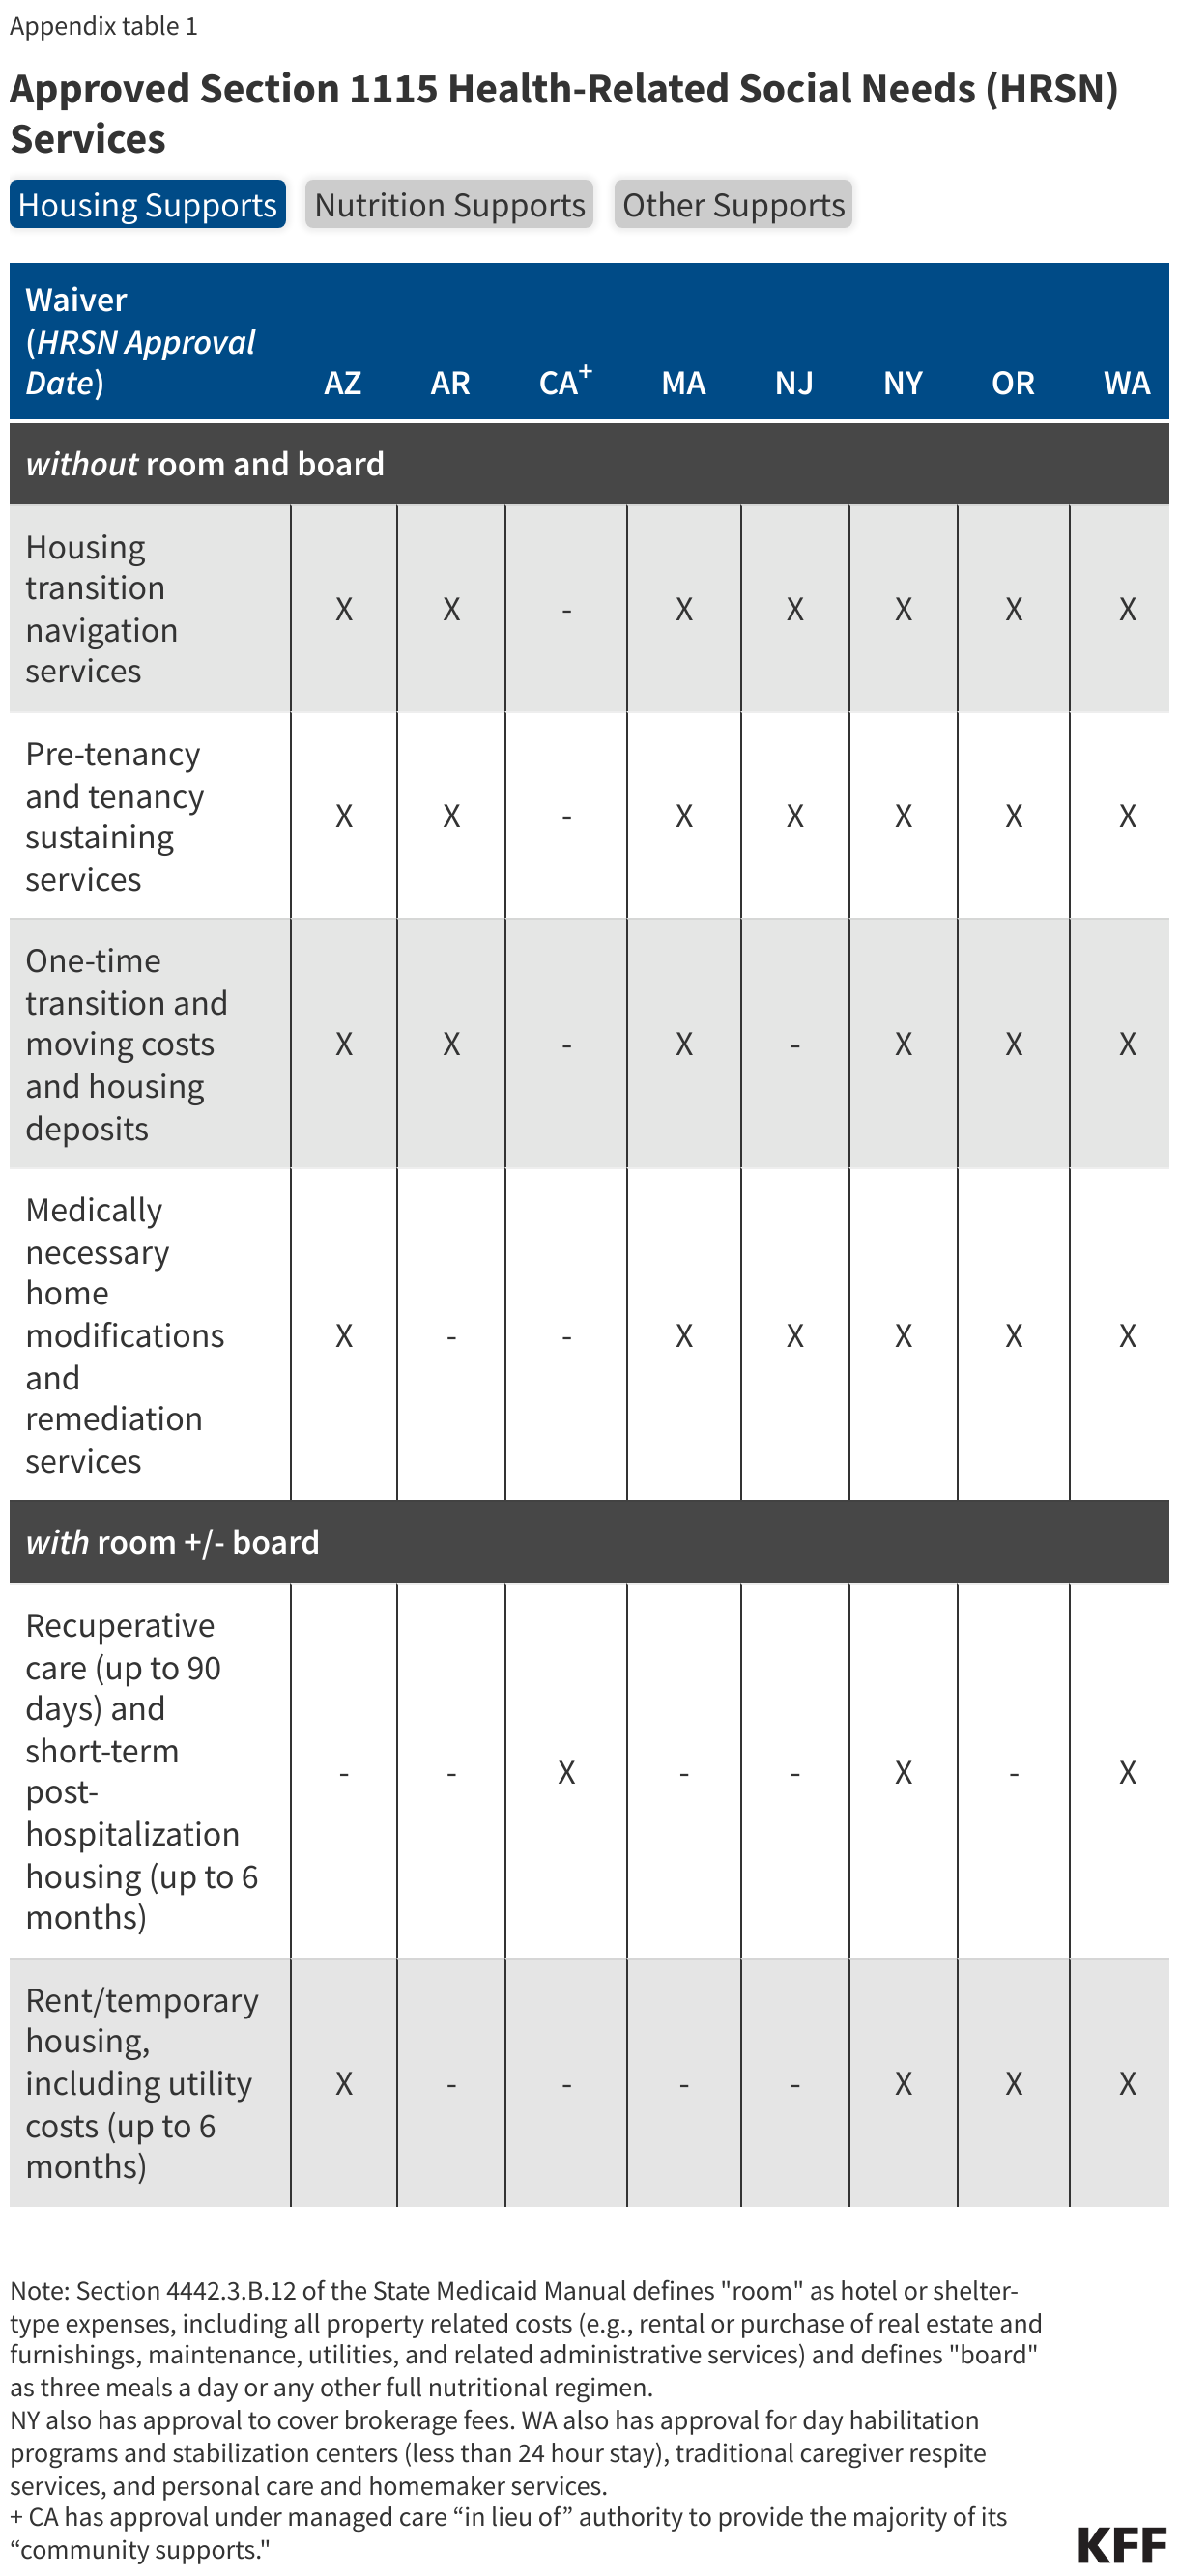
Authorized HRSN services include housing supports, nutrition supports, and case management but specific services offered vary by state demonstration (Appendix Table 1). States can add HRSN services to the benefit package and may require managed care plans to offer the services to enrollees who meet state criteria.

  • Housing Supports. All states have approval to provide housing supports without “room and board” such as housing transition and navigation services, tenancy sustaining services (e.g., tenant rights education, eviction prevention), one-time transition and moving costs, home remediations, and home accessibility modifications. Some states have approval to provide housing supports with “room and board” including recuperative care (also called medical respite) and short-term housing and utility assistance (up to 6 months). As of February 2024, four states (Arizona, New York, Oregon, and Washington) have CMS approval to cover rent/temporary housing and utility costs for up to 6 months. Three states (California, New York, and Washington) have approval to cover recuperative care (up to 90 days) and short-term post-hospitalization housing (up to 6 months).
  • Nutrition Supports. Approved nutrition services include nutrition counseling, home delivered meals or pantry stocking, nutrition prescriptions, and grocery provisions (meal/nutrition supports approved up to 3 meals/day, for up to 6 months). Nutrition services are frequently tailored to health risk or designed to support individuals with specific nutrition-sensitive health conditions (e.g., diabetes). Two states (Massachusetts and New York) have approval to provide additional meal/nutrition support for a household with a high-risk child or pregnant individual.

All states will also provide HRSN case management, outreach, and education services. A few states also have approval to cover transportation to HRSN services (Massachusetts, New York, and Washington). All states have CMS approval for HRSN infrastructure expenditures to support the implementation and delivery of HRSN services. Infrastructure investments may include technology; development of business or operational practices; workforce development; and outreach, education and stakeholder convening.

What populations will have access to HRSN services?

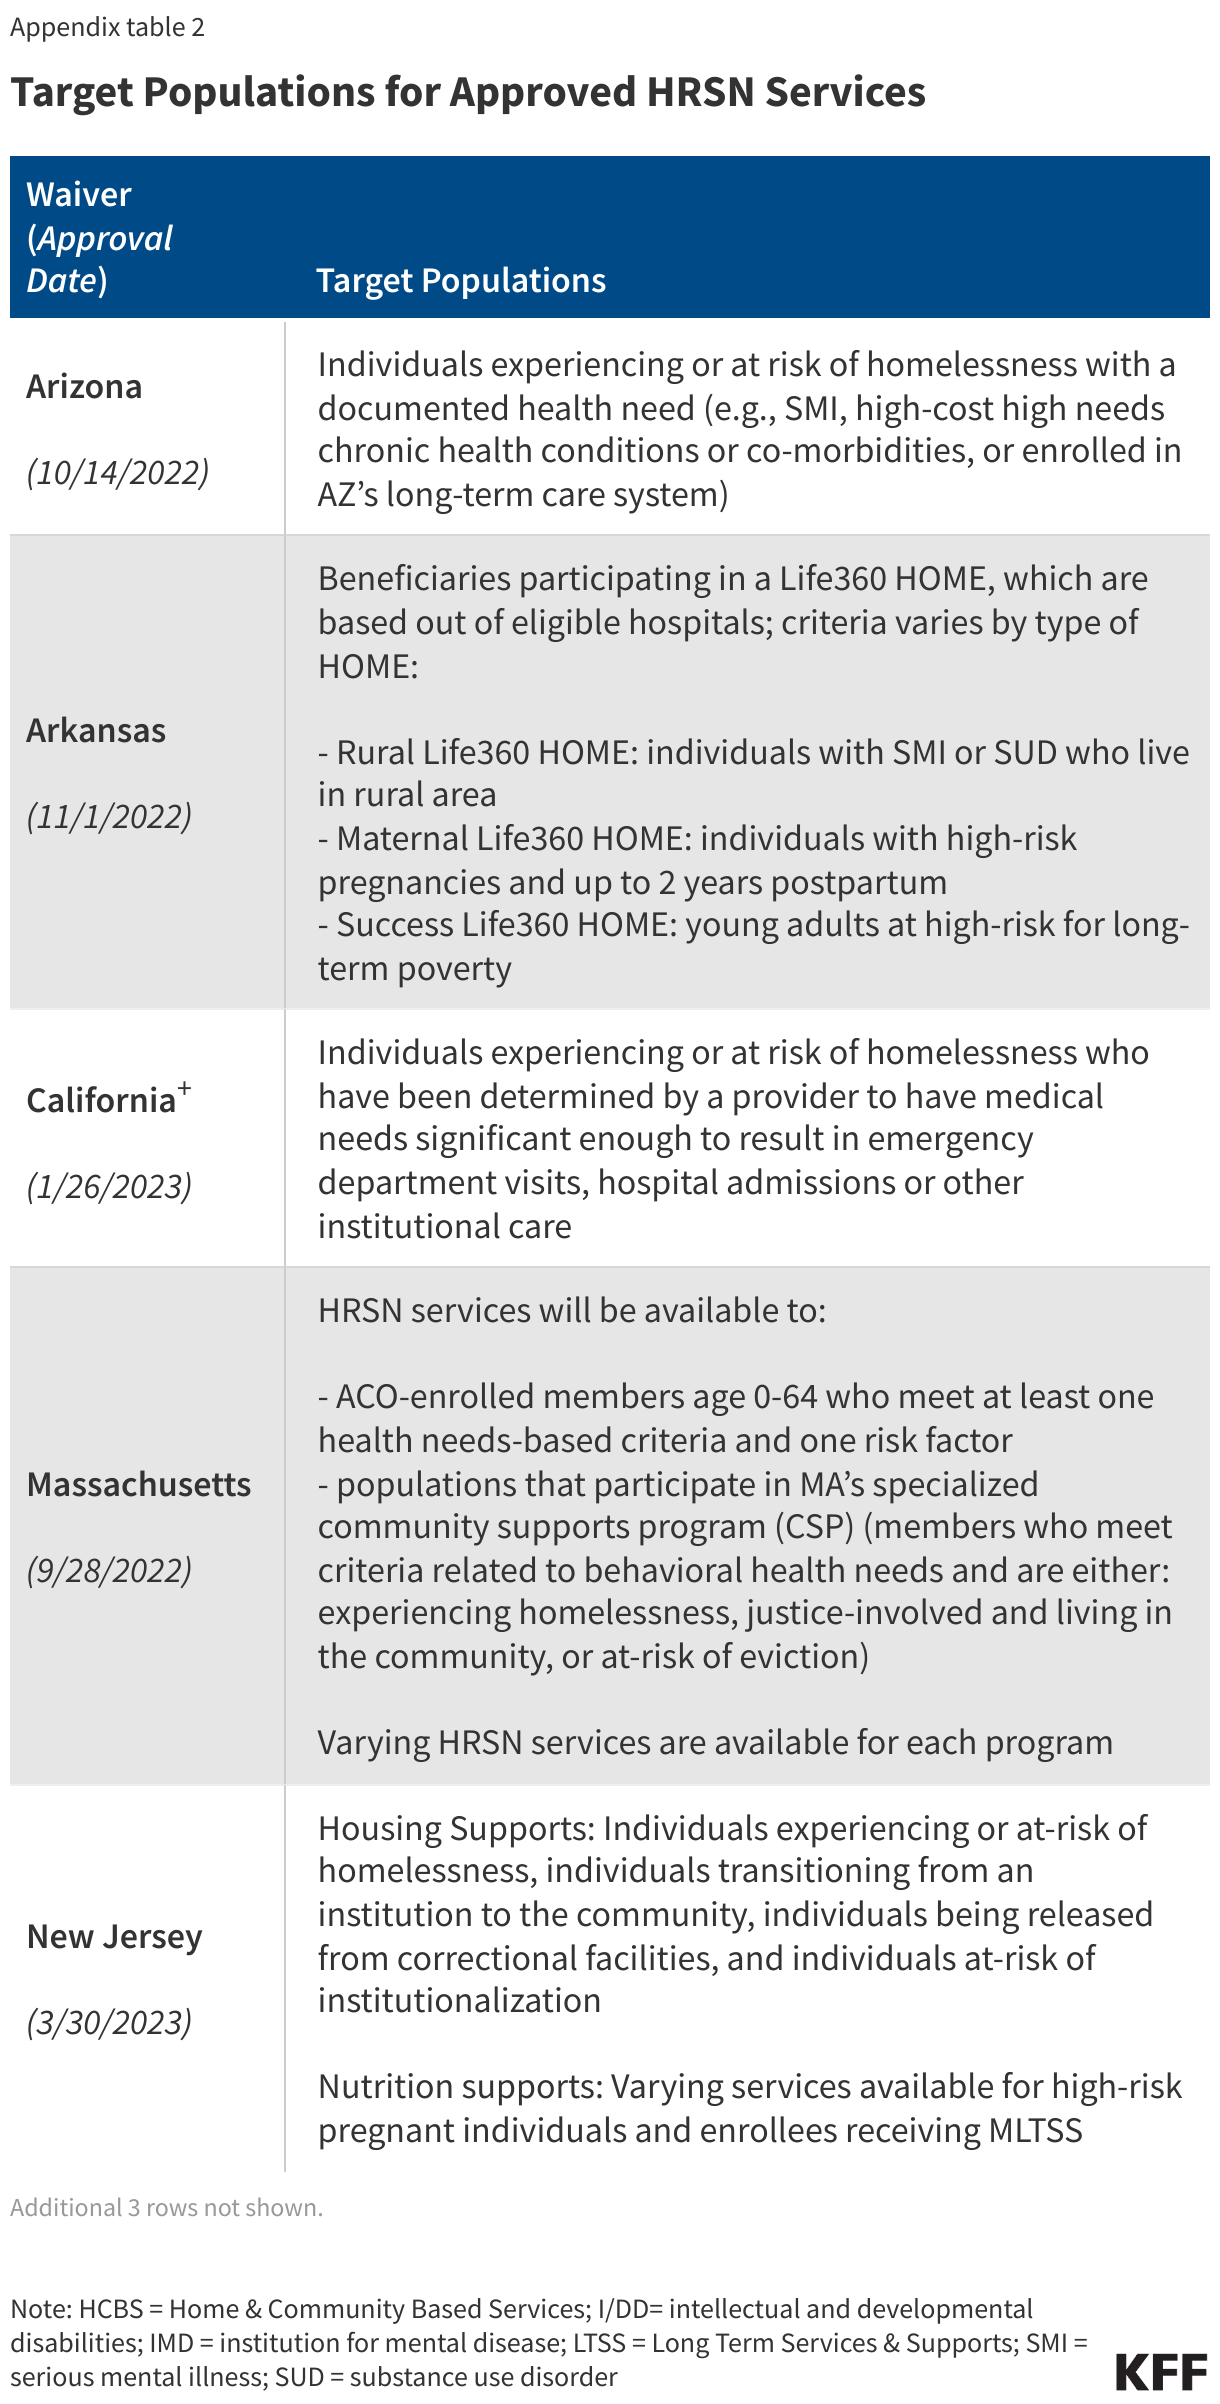
The target populations for HRSN services vary but in all instances are narrowly defined groups that must meet specified health and social risk criteria (Appendix Table 2). Subject to CMS approval, states have flexibility to define the target populations eligible to receive HRSN services, using clinical and social risk criteria. HRSN services must be medically appropriate and voluntary for enrollees. Target populations approved include individuals who are or are at risk of becoming homeless, individuals with serious mental illness (SMI) and/or substance use disorder (SUD), high-risk pregnant individuals, high-risk children/youth, and individuals experiencing high-risk care transitions (e.g., from institutional care, correctional setting, or child welfare system). CMS guidance specifies housing services that include “room and board” may only be offered to populations experiencing certain housing or care transitions (e.g., individuals experiencing homelessness, or individuals transitioning from institutions to the community).2 

Recent CMS changes to budget neutrality policy may create broader opportunities for states to pursue HRSN initiatives, but guidance also sets financing limits and guardrails. While not set in statute or regulation, a longstanding component of Section 1115 waiver policy is that waivers must be budget neutral for the federal government (i.e., federal costs under a waiver must not exceed what they would have been for that state without the waiver). In its approvals, CMS has indicated that HRSN spending will not require offsetting savings. In addition, CMS has specified that states may access federal matching funds for spending on “Designated State Health Programs (DSHP)” (which may free up state funds to finance HRSN initiatives), a policy that was phased out under the Trump administration. In conjunction with policies to broaden financing opportunities for HRSN, CMS has also included fiscal guardrails and requirements aimed at ensuring states prioritize coverage and access to basic medical services and ensuring HRSN spending complements, rather than supplants, existing local, state, and federal social supports. Key requirements include:

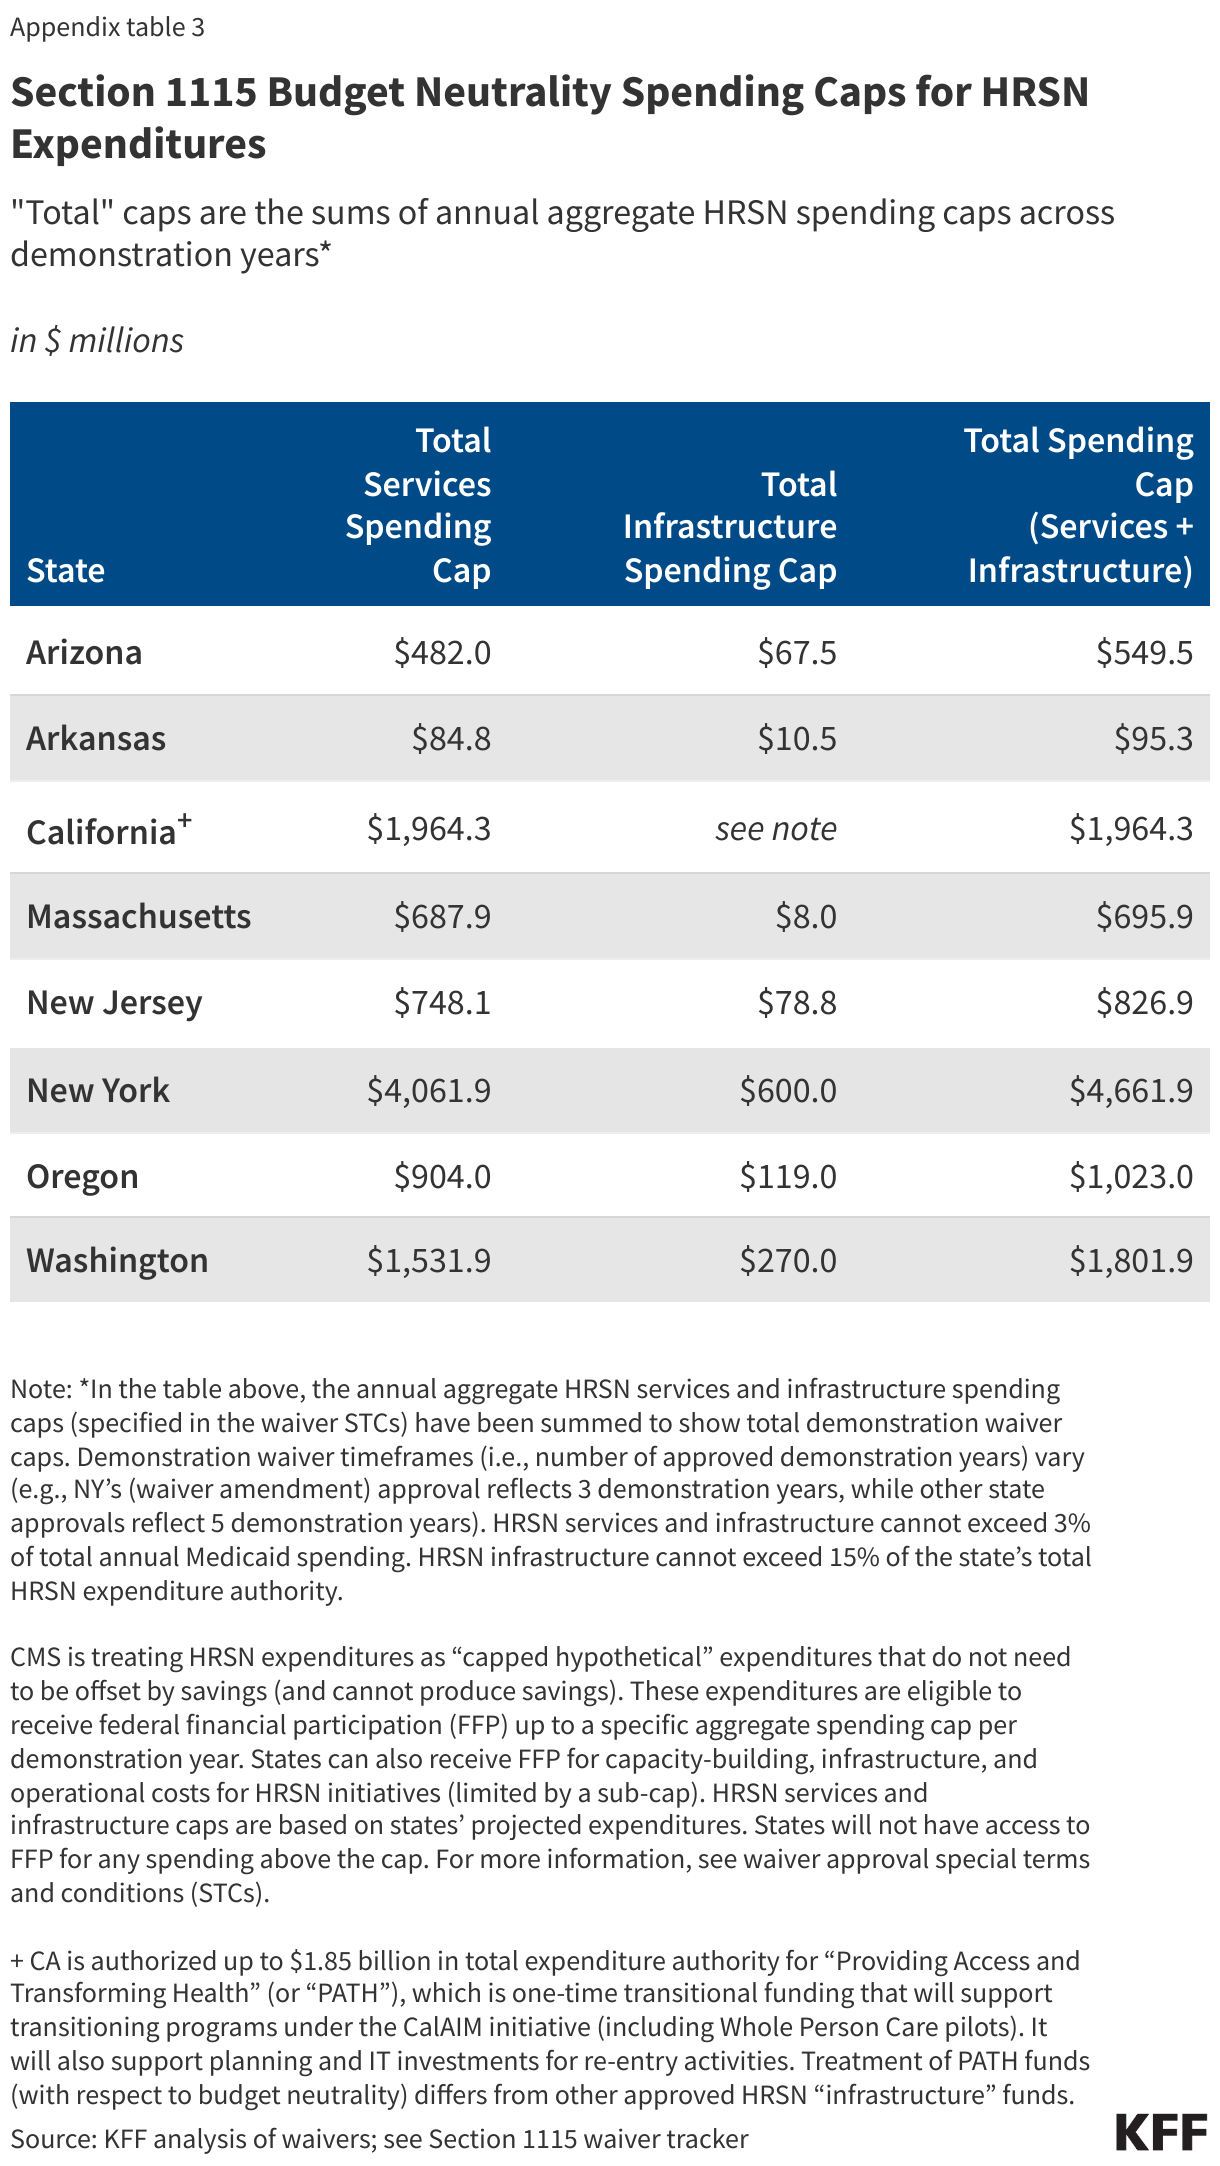
  • CMS is limiting how much Medicaid funding a state can use for HRSN initiatives. CMS guidance specifies spending for HRSN services and infrastructure cannot exceed 3% of total annual Medicaid spending. HRSN infrastructure cannot exceed 15% of the state’s total HRSN expenditure authority. Waivers include spending caps (based on a state’s projected expenditures) for HRSN services and infrastructure (Appendix Table 3). States will not have access to federal matching funds for any spending above the cap. In its approvals, CMS indicates the HRSN spending caps “will ensure the state maintains its investment in the state plan benefits to which enrollees are entitled while testing the benefit of the HRSN services.”
  • CMS is requiring states to meet provider payment rate requirements for core Medicaid services. To maintain and/or improve access to quality care for enrollees, as a condition of approval, states are required to maintain base Medicaid payment rates (fee-for-service and managed care) of at least 80% of Medicare rates for primary care, behavioral health, and obstetrics services and must increase rates that are below this level.
  • Medicaid-covered HRSN services should complement but not supplant the work or funding of other federal or state non-Medicaid agencies. In addition, CMS guidance outlines state spending on related social services (before the waiver) must be maintained or increased.

What to watch as HRSN waivers move to implementation?

Looking ahead, the results of required monitoring and evaluation of HRSN initiatives could help inform future policy decisions about whether and how to use Medicaid to address enrollees’ health-related social needs. States are required to submit implementation plans and protocols to CMS for review and approval that provide operational details for new initiatives. States are also required to submit quarterly and annual monitoring reports to CMS that provide information on HRSN service implementation, HRSN service utilization, and quality of services. Finally, states must submit an evaluation strategy to CMS for review and approval. Independent evaluations must test whether HRSN services effectively address unmet HRSN, reduce potentially avoidable, high-cost services, and/or improve physical and mental health outcomes. States will also be required to report on health equity metrics. Implementation timing will vary across states. California began implementation of its “community supports” in 2022 (authorized under 1115 and managed care “in lieu of” authorities). Available implementation plans suggest two states (Arizona and Oregon) expect to roll out HRSN services in 2024, while Massachusetts plans to begin offering HRSN services in 2025. Implementation information from remaining states is forthcoming. Waiver priorities often shift from one presidential administration to another, so states’ ability to continue to pursue these initiatives may hinge on the outcome of the 2024 election.

Appendix Tables

Approved Section 1115 Health-Related Social Needs (HRSN) Services

Target Populations for Approved HRSN Services

Section 1115 Budget Neutrality Spending Caps for HRSN Expenditures
  1. Federal financial participation is not available to state Medicaid programs for room and board except in certain medical institutions, as codified in multiple regulatory provisions. See, for example, 42 CFR § 441.310(a)(2) and 42 CFR §441.360(b). CMS defines board as three meals a day or any other full nutritional regimen, and room as hotel or shelter type expenses including all property related costs such as rental or purchase of real estate and furnishings, maintenance, utilities, and related administrative services. See section 4442.3 of the State Medicaid Manual at www.cms.gov/regulations-andguidance/guidance/manuals/paper-based-manuals-items/cms021927. ↩︎
  2. Allowable transitions include out of institutional care (NFs, IMDs, ICFs, acute care hospital); out of congregate residential settings such as large group homes; individuals who are homeless, at risk of homelessness, or transitioning out of an emergency shelter as defined by 24 CFR 91.5; out of carceral settings; and individuals transitioning out of the child welfare setting including foster care. https://www.medicaid.gov/sites/default/files/2023-11/hrsn-coverage-table.pdf ↩︎

Employer Responsibility Under the Affordable Care Act

Published: Feb 29, 2024

The Affordable Care Act does not require businesses to provide health benefits to their workers, but applicable large employers may face penalties if they don’t make affordable coverage available. The employer shared responsibility provision of the Affordable Care Act penalizes employers who either do not offer coverage or do not offer coverage that meets minimum value and affordability standards. These penalties apply to firms with 50 or more full-time equivalent employees. This flowchart illustrates how those employer responsibilities work.


Poll Finding

Five Key Facts About Immigrants’ Understanding of U.S. Immigration Laws, Including Public Charge

Published: Feb 29, 2024

Figure 5 was updated on March 11, 2024, to correct an error in the bar showing data for immigrants who speak English exclusively or very well.

Immigration has been a hot-button issue in U.S. political debate for decades, with immigration policy at the federal level often shifting dramatically between presidential administrations. For example, under longstanding U.S. policy, federal officials can deny an individual entry to the U.S. or adjustment to lawful permanent status (a green card) if they determine the individual is a “public charge” based on their likelihood of becoming primarily dependent on the government for subsistence. In 2019, the Trump Administration made changes to this policy to newly consider the use of noncash assistance programs, including Medicaid, in public charge determinations. In 2022, the Biden Administration reversed these changes, but many immigrant families remain confused and uncertain about the policy.

Political debates and campaign statements about immigration can further contribute to confusion and fear among immigrant families. Immigration has emerged as a key issue in the 2024 presidential election campaign, with Donald Trump indicating plans to vastly restrict immigration and conduct mass deportations of undocumented immigrants if elected, and with President Biden facing criticism over the crisis at the U.S.-Mexico border. Amid this environment, immigrants’ understanding of immigration laws has implications for their feelings of security and willingness to access assistance programs that may support their and their children’s well-being. Below are five key facts about immigrants understanding of U.S. immigration laws drawing on the 2023 KFF/LA Times Survey of Immigrants. For methodological details of the survey, more KFF analysis, and reporting from the LA Times, please visit the overview report, Understanding the U.S. Immigrant Experience.

About half of immigrants say they do not have enough information to understand how U.S. immigration policies impact them and their families.

This share rises to seven in ten (69%) immigrants who are likely undocumented and six in ten of those with limited English proficiency (58%) or lower incomes (57%) (Figure 1). Confusion and lack of information may contribute to fears among immigrant families and lead some immigrants to avoid accessing assistance programs that could ease financial challenges and facilitate access to health care for themselves and their children, who are often U.S.-born. Confusion and fears may escalate amid growing immigration policy debates.

Most Immigrants Who Are Undocumented, Have LEP, Or Lower Incomes Lack Information On U.S. Immigration Policy

About six in ten (58%) immigrants are not sure whether use of government programs that help pay for health care, housing, or food will decrease an immigrant’s chance of getting a green card.

Another 16% incorrectly believe this to be the case. Among immigrants who are likely undocumented, nine in ten are either unsure (68%) or incorrectly believe use of these types of public programs will decrease their chances for green card approval (22%). These findings highlight the importance of continued outreach and education efforts to help immigrants understand public charge policies.

About Six In Ten Immigrants Are Not Sure About Public Charge Rules

One in twelve immigrants say they have avoided noncash government assistance programs because they didn’t want to draw attention to their or a family member’s immigration status, rising to one in five among those who believe the use of noncash assistance will decrease one’s chances of getting a green card.

These shares are even higher among immigrants in households with incomes below $40,000 and those who are noncitizens, suggesting that immigration-related fears and confusion about public charge rules have consequences, particularly for immigrants who may have the greatest need for these assistance programs.

Fears And Confusion Lead Some Immigrants To Avoid Accessing Assistance Programs

One in four immigrants with limited English proficiency (LEP) say that difficulty speaking or understanding English has made it hard for them to apply for government financial help with food, housing, or health coverage.

This includes three in ten (31%) immigrants with LEP who have household incomes under $40,000. Beyond fears and confusion, lack of linguistically accessible information and assistance may serve as an additional barrier for immigrants to access assistance programs. Among immigrants with LEP, about six in ten (62%) speak Spanish, 7% speak a dialect of Chinese, 4% speak Vietnamese, and smaller shares speak a variety of other languages, highlighting the importance of accessible information in multiple languages.

One In Three Immigrants With LEP In Lower Income Households Say Language Barriers Have Prevented Them From Getting Assistance

Immigrants say they use a variety of sources for information on U.S. immigration policy, including search engines, U.S. government websites, and attorneys or other professionals.

Asked where they would go if they had a question about U.S. immigration policy, about one third of immigrants say they would go to a search engine such as Google first; another third say they would go directly to a U.S. government website. One in six (16%), rising to nearly four in ten likely undocumented immigrants (38%), say they would consult an attorney or other professional. Immigrants with LEP are split between using a search engine like Google (30%), a U.S. government website (26%) or an attorney or other professional (24%). The findings highlight the importance of having accurate and trusted online information sources for immigrants that are available in multiple languages. They also illustrate the potential vulnerability of immigrants to misinformation online and immigration scams.

Immigrants Seek Immigration Policy Information From Varied Sources
News Release

Since Dobbs, Few Large Firms Have Changed Their Plan’s Abortion Coverage Policy

Published: Feb 29, 2024

According to an analysis of responses to KFF’s Employer Health Benefits Survey in 2023, relatively few (8%) large firms (with 200 or more workers) offering health benefits report reducing or expanding coverage for abortion since the U.S. Supreme Court overturned Roe v. Wade with the Dobbs v. Jackson ruling.

Since Dobbs, 3% of these large firms reduced or eliminated coverage for abortion where it is legal. Meanwhile, 12% of large firms whose largest plan covers abortion under most or all circumstances, added or expanded abortion coverage following the ruling.

One-third (32%) of large firms that offer health benefits cover abortion in most or all circumstances in their largest health plan, while almost as many (28%) cover it under limited circumstances or not at all.

The survey also revealed a general lack of awareness of abortion coverage among respondents at large firms that offer health benefits. Forty percent said they didn’t know if their largest plan covers abortion. A possible reason for this could be because of limited information about abortion coverage in plan documents unless abortion is explicitly excluded. Additionally, survey respondents are generally human resources or benefits managers, though they are typically not legal experts.

With abortion banned or severely limited in some states, people residing in those states must now also shoulder costs related to traveling to states where abortion is legal. Seven percent of large employers offering health benefits say they provide, or plan to provide, financial assistance for travel expenses for enrollees who must go out of state to obtain a legal abortion. Very large employers (with 5,000 or more workers) are most likely to provide, or plan to provide, such travel reimbursements (19%).

Reflecting the politics around abortion policies, larger shares of large firms offering health benefits that are headquartered in the Northeast (56%) and West (44%)—where few states ban abortion—provide coverage of abortion in their largest health plan in most or all circumstances. This finding contrasts with large firms in the Midwest (20%) and South (18%). Relatedly, a small fraction of large firms that offer health benefits that are headquartered in the Northeast (2%) and West (4%) didn’t cover abortion under any circumstances, compared to slightly larger shares in the Midwest (14%) and South (15%).

Coverage of Abortion in Large Employer-Sponsored Plans in 2023

Published: Feb 29, 2024

Employer-sponsored health insurance is the largest source of coverage in the United States, covering 153 million people younger than age 65 in 2023. For 25 years, the annual KFF Employer Health Benefits Survey has asked private firms and non–federal government employers with three or more employees about the characteristics of their health plans. The specific benefits and services covered by those plans are shaped by many factors including costs, employer policies and beliefs, and state and federal regulations. Since the June 2022 U.S. Supreme Court’s Dobbs v. Jackson ruling overturning Roe v. Wade, there has been increased public and media attention about people with no or limited access to abortion, but little is known about abortion coverage in employer-sponsored plans.

This brief presents findings from the 2023 KFF Employer Health Benefits Survey on coverage of abortion services in large employer-sponsored health plans, changes employers made to abortion coverage since the 2022 Supreme Court ruling, and employers’ provision of financial assistance for travel out of state to obtain an abortion. This is the first survey of its kind to analyze coverage for abortion in employer-sponsored health plans. The survey was fielded from January through July 2023 and asked employers with 200 or more employees about their coverage policies for abortion.

Background

Ten states have laws that prohibit all state-regulated private plans from including abortion coverage. Most, but not all, have exceptions for pregnancies resulting from rape or incest or in cases in which it poses a threat to the life of the pregnant person. Conversely, ten states have enacted policies that require coverage of abortion services in all state-regulated private plans. In addition to individual and fully-insured group plans, states also regulate plans offered to state and local government employees.

However, neither the state-level abortion coverage inclusion nor prohibition requirements apply to all plans offered to workers in these states. Self-funding health care services for workers instead of purchasing a health insurance plan is a common practice among larger employers and those type of arrangements are regulated by the federal Employee Retirement Income Security Act of 1974 (ERISA). This law generally exempts self-funded plans offered by private employers from state insurance regulations. In total, 67% of covered workers at large firms are enrolled in a plan that is preempted from state insurance laws because their plan sponsors are non-public employers and the plan is self-funded.

Absent state insurance laws requiring or prohibiting coverage of abortion in state regulated plans, private employers offering self-funded plans may choose whether to offer coverage for abortion, or to only cover it under limited circumstances such as in cases of rape or incest or health endangerment of the pregnant person. The federal Pregnancy Discrimination Act states that employer health benefits plans that cover pregnancy services shall cover abortion in cases of life endangerment of the pregnant person or where medical complications have arisen from an abortion.

Findings

Coverage for Abortion Services

Ten percent of large firms (200 or more workers) that offer health benefits do not cover legally provided abortions under any circumstance in their largest plan; 18% cover abortion only under limited circumstances, such as rape, incest, or health/life endangerment; and 32% cover abortion in most or all circumstances (Table 1). Notably, 40% of those responding on behalf of large firms that offer health benefits do not know if their largest plan covers abortions, part of which could be attributed to lack of information about coverage for abortion in plan documents unless abortion is explicitly excluded. Survey respondents are generally human resources or benefits managers, though they are typically not legal experts (we ask to speak with the person at the firm who is most knowledgeable about the firm’s health benefits).

Among Large Firms Offering Health Benefits, Percentage Whose Largest Plan Covers Legally Provided Abortion, by Firm Characteristics, 2023

Forty-three percent of the largest firms with 5,000 or more workers that offer health benefits report that they cover abortion in most or all circumstances, compared to 34% of firms with 1,000-4,999 workers and 31% of firms with 200-999 workers (Table 1). A higher share of firms with 5,000 or more workers (30%) that offer health benefits cover abortion in limited circumstances only compared to firms with 1,000-4,999 workers (19%) and firms with 200-999 workers (17%). This juxtaposition can be attributed in part to the substantially higher share of smaller large firms reporting that they do not know if their largest plan covers abortion compared to the largest firms. Knowledge of the plan’s abortion benefits increases with firm size. Forty-two percent of large firms offering health benefits with 200-999 workers responded “Don’t know” to this question, decreasing to 18% of firms with 5,000 or more workers.

In addition, a large share of public firms (51%) reported that they do not know if their plan covers abortion, a significantly higher share than private for-profit (37%) and private not-for-profit firms (39%). Large public firms (23%), such as state and local governments, that offer health benefits are less likely to cover legally provided abortions in most or all circumstances in their largest plan than private for-profit (34%) or private not-for-profit firms (32%) (Table 1).

More large firms whose largest plan is self-funded (12%) report that they do not cover legally provided abortions under any circumstance than firms whose largest plan is fully-insured (6%), or that they cover abortion only in limited circumstances (21% vs. 14%) in their largest plan (Table 1). However, 49% of employers whose largest plan is fully-insured and 33% whose largest plan is self-funded report not knowing whether abortion is covered in their largest plan. On average, larger firms are more likely to be self-funded and larger firms are more likely to cover abortion. Therefore, differences by firm funding may be related to characteristics other than how the firm structures the plan.

Looking at the region in which the firm is headquartered, more than half (56%) of large firms offering health benefits and headquartered in the Northeast cover abortion in most or all circumstances in their largest plan, compared to those in the West (44%), Midwest (20%), and the South (18%). Large firms offering health benefits in the South (15%) and Midwest (14%) are more likely than firms headquartered in other regions of the country not to cover abortion under any circumstance in their largest plan (Table 1). A larger share of firms headquartered in the South (47%) than those headquartered in other regions of the country report that they do not know if their plan covers abortion, perhaps reflecting the complexity and changing landscape of abortion laws in many of these states. Although where a firm is headquartered is not necessarily where its largest plan is offered, these findings do largely mirror trends related to abortion rights and abortion coverage laws in states in these regions. See the survey methodology section for the classification of states into regions.

Changes in Coverage for Abortion Since the Dobbs v. Jackson ruling

The 2023 KFF Employer Health Benefits Survey also asked firms whether they had made any changes to their largest plan’s coverage of abortion following the U.S. Supreme Court’s ruling in Dobbs v. Jackson.

The ruling made national headlines and resulted in considerable changes in state-level abortion laws, which may have prompted some employers to review their plan’s abortion coverage, but overall, relatively few (8%) large firms offering health benefits report reducing or expanding coverage for abortion since the ruling. The vast majority of large firms whose largest plan does not cover abortion or only covers it in limited circumstances already had this coverage restriction prior to the Dobbs v. Jackson ruling (Figure 1). Overall, just 3% of these firms reduced or eliminated coverage for abortion where it could legally be provided since the ruling. Conversely, 12% of large firms whose largest plan covers abortion under most or all circumstances added or expanded this coverage following the ruling.

Share of Large Firms Offering Health Benefits That Made Changes to Their Largest Plan's Abortion Coverage After Dobbs v. Jackson Decision

Financial Assistance for Out-of-State Travel for Abortion

Another aspect of employer coverage of abortion that has garnered increased public attention since the Dobbs v. Jackson ruling is employers providing financial assistance for travel expenses, such as airfare and lodging, for enrollees who have to travel out of state to obtain an abortion. In response to a growing number of state bans and restrictions that have made it more difficult to obtain an abortion in some states, several large companies announced that they would begin offering this benefit. Currently, fourteen states have banned abortion except in limited circumstances and many more have implemented restrictions such as early gestational stage limits, and additional requirements such as waiting periods and ultrasounds for obtaining an abortion, leading some pregnant people to have to travel to another state to obtain abortion care.

Overall, few firms offer this travel benefit. Among large firms that offer health benefits, only 7% said they provide or plan to provide financial assistance for travel expenses for enrollees who travel out of state to obtain an abortion if they do not have access near their home (Table 2). Twenty-seven percent of large firms offering health benefits do not know if the firm provides or plans to provide this assistance.

This benefit is significantly more common among firms with 5,000 or more workers (19%) than firms with 1,000-4,999 workers (10%) or firms with 200-999 workers (6%). Public firms (1%) are substantially less likely than private for-profit firms (8%) and private not-for-profit firms (10%) to cover out-of-state travel for abortion. A larger share of firms offering health benefits headquartered in the Northeast (13%) offer this benefit compared to those headquartered in other regions of the country. There are no statistically significant differences in firms offering this benefit by plan funding arrangement.

Eighteen percent of large firms that cover abortion in most or all circumstances in their largest plan also provide, or plan to provide, enrollees financial assistance for travel out of state to obtain an abortion, compared to 4% of those that cover abortion only in limited circumstances and 1% of those that do not cover abortion under any circumstances (data not shown).

Among Large Firms Offering Health Benefits, Percentage of Firms That Provide, or Plan to Provide, Financial Assistance for Travel Expenses for Enrollees Who Travel Out of State to Obtain an Abortion, by Firm Characteristics, 2023

Discussion

The majority of people in the U.S. have employer sponsored health insurance, so the coverage decisions that employers make play a role in access to care, including for abortion services, for covered workers and their enrolled dependents.

One-third of large firms that offer health benefits cover abortion in most or all circumstances in their largest health plan, while almost as many cover it under limited circumstances or not at all. However, four in ten respondents do not know whether their largest plan covers abortion. In some cases, this could be because plan documents such as summaries of benefits do not always contain information about coverage for abortion. The changing legal landscape in many states and the complexity of the issue could also explain some of respondents indicating they did not know. Survey respondents are generally human resources or benefits managers, though they are typically not legal experts.

If coverage for abortion is not mentioned in enrollee-facing plan documents, plan enrollees also may not be aware of their plan’s coverage policy for abortion without having to ask the plan (or third-party administrator) or their employer. This issue has gained more importance to policyholders, as 9 states have instituted laws that require state-regulated plans to include abortion as a covered benefit and to cover abortion care without cost-sharing, including copayments, coinsurance, or deductibles.

A less discussed law that could also affect coverage of abortion in certain cases is the Pregnancy Discrimination Act (PDA), which applies to employers with 15 or more workers. The PDA requires employer-sponsored health insurance to cover abortion in cases where the life of the pregnant person is endangered if the fetus were carried to term or where medical complications have arisen from an abortion. Some survey respondents may be unfamiliar with the Pregnancy Discrimination Act’s requirements when, in fact, the plan or third-party administrator must cover abortion in these very limited situations.

While the ruling in Dobbs v. Jackson and subsequent state activities pertaining to abortion have increased public interest in how abortion services are covered by employer-provided plans, so far, relatively few employers have changed their plan’s existing coverage for abortion since this ruling or decided to offer financial assistance for travel. This could be in part because employers are still considering their options under the current legal landscape (e.g., employers that choose to cover abortion services may still be subject to state civil and criminal penalties in states that prohibit “aiding or abetting” an abortion) or because benefits for the 2023 plan year may have already been finalized by the time Dobbs was decided. The extent to which employers continue to change their plan’s coverage for abortion or begin covering certain travel expenses, and the extent to which enrollees utilize these benefits, is not yet known.

Three Questions About Medicaid Unwinding: What We Know and What to Expect

Published: Feb 28, 2024

During the COVID public health emergency, states were prohibited from disenrolling people from Medicaid in exchange for a substantial increase in federal funding. When continuous enrollment ended in March, states began the process of reviewing eligibility for people enrolled in the program and disenrolling those who were no longer eligible or who did not complete the renewal process. Ten months into the unwinding of the Medicaid continuous enrollment provision, states have conducted renewals for roughly half of all enrollees in the program. This policy watch examines three key questions to monitor as the unwinding continues.

1. What do we know about changes in Medicaid enrollment so far during unwinding?

Overall, Medicaid enrollment has declined by nearly 10% across states since the start of unwinding, a decline of almost 10 million people; however, the national decline in Medicaid enrollment masks significant variation across states. Changes in net enrollment reflect the people who are dropped from Medicaid as well as those who newly enroll, and those who re-enroll within a short timeframe following disenrollment, also known as “churn.” Because of churn and new enrollees — and lags in reporting — the change in net Medicaid enrollment is lower than the total number of people who have been dropped through the unwinding (which is currently more than 17 million). Unlike other types of coverage, there is no open enrollment period in Medicaid, so individuals can apply for coverage at any time. KFF research shows that pre-pandemic, one in ten enrollees disenrolled and re-enrolled in less than 12 months and children and adults had higher rates of churn compared to people who qualify for Medicaid based on age or disability. Enrollment declines vary tremendously by state. Since the start of unwinding, the decline in Medicaid enrollment across states ranges from 31% in Idaho to 0.5% in Hawaii. Net enrollment declines are measured against each state’s baseline enrollment, which is enrollment in the month prior to when the state resumed disenrollments.

State policy choices may be a better predictor of variation in state enrollment changes than how far along states are in processing renewals. While some variation in enrollment declines may reflect when states resumed disenrolling people as well as differences in the pace of processing renewals, this does not go far in explaining the variation in enrollment declines across states.  For example, some states — most notably, Texas — that still have about half of renewals yet to be completed have net enrollment declines that exceed 20% or double the national average of 10% (Figure 1).  Conversely, some states, such as Oregon, are quite far along in completing renewals, yet have seen a very small drop in enrollment. The Centers for Medicare and Medicaid Services (CMS) has released guidance and identified five strategies as most impactful in protecting coverage for children: improving auto-renewal or ex parte rates, adopting unwinding waivers, partnering with managed care plans to help people eligible for Medicaid use and keep their coverage, reducing call center wait times, and supporting coverage transitions for people no longer eligible for Medicaid. States are implementing many of these strategies, often multiple strategies at the same time, as well as others, such as enhanced outreach efforts to improve renewal processes. Ultimately, how states are proceeding with renewals will likely have a substantial effect on the number of people who are dropped from Medicaid, particularly for “procedural” disenrollments, where the renewal process is not completed and there is no way to tell if the person is still eligible for Medicaid or not. Overall, about 70% of disenrollments so far have been “procedural,” but the rate varies substantially across states.

Across States, Medicaid Enrollment Declines Are Not Correlated to How Far Along States Are in Processing Renewals

2. Where will Medicaid enrollment wind up at the end of unwinding?

It is highly uncertain what national Medicaid enrollment will be at the end of unwinding. With about half of renewals left to complete, Medicaid enrollment will likely continue to decline. However, it is unknown how many of those who are procedurally disenrolled will regain Medicaid coverage and how many new enrollees may come on to the program. During the pandemic, Medicaid enrollment increased by 23 million or 32% from pre-pandemic levels. Given that unwinding is about halfway over – judged by the share of renewals that have been conducted so far – it’s possible that Medicaid enrollment could end up at roughly the same level as before the pandemic. In some respects, this could be considered a success. The continuous enrollment provision was intended as a temporary measure to ensure people didn’t lose Medicaid coverage during a public health crisis. A return to pre-pandemic enrollment levels is not an unreasonable outcome, particularly in an environment of low unemployment. However, those pre-pandemic Medicaid enrollment levels are not necessarily a good baseline for measuring success. Roughly one-quarter of people who are uninsured are eligible for Medicaid and not enrolled, suggesting that Medicaid was not reaching everyone who could be helped by the program before the pandemic. And, while there was churn prior to the pandemic and some churn is to be expected, rates may have been too high, resulting in eligible people losing coverage for short periods of time.

There is likely to be a lot of variation in where individual state enrollment lands relative to pre-pandemic due to unwinding and other policy changes. Some states are taking advantage of the unwinding to put in place policies that stabilize or increase Medicaid enrollment, and there is reason to believe that those states will end up with higher enrollment than pre-pandemic. However, other states are likely to see enrollment fall below pre-pandemic levels, resulting in more people uninsured than before the public health emergency. In addition, two states, South Dakota and North Carolina, implemented the Medicaid expansion during the unwinding (in July and December 2023, respectively), which should mitigate enrollment declines in these states. Other policies, such as mandatory 12-month continuous eligibility for children, optional 12-month postpartum coverage and broad state interest in pursuing multi-year continuous eligibility for children or other continuous coverage for adults, may help to reduce churn.

3. What will happen to coverage more broadly?

While changes in Medicaid enrollment are important, those numbers will matter less than what happens with the number of people who are uninsured.  The number of people without insurance and the uninsured rate dropped to record lows because of pandemic-era coverage policies, including the continuous enrollment provision in Medicaid and enhanced premium subsidies in the Affordable Care Act (ACA) Marketplaces. Unwinding will likely contribute to increases in the number of people who are uninsured and in the uninsured rate. Changes in the uninsured will depend on whether individuals who are no longer eligible and are disenrolled from Medicaid transition to other coverage, including employer plans and the Marketplace. Recent data show that Marketplace signups have reached 21.3 million people, exceeding last year’s record high by another 5 million people. Medicaid unwinding is only one factor contributing to that growth, and a relatively small share of people disenrolled from Medicaid are transitioning to Marketplace or Basic Health Plan coverage. Federal survey data that can show changes in employer coverage is lagged, so it will be quite some time until we understand the full picture of coverage trends. In addition, federal surveys are based on self-reported health coverage, which is subject to error, particularly in an environment like now, when so many transitions are occurring. As data become available, it will be important to assess how coverage changes vary across states and populations and how those changes affect children, low-income people, people of color, people with disabilities, and other groups that disproportionately rely on Medicaid.

Preventive Services Covered by Private Health Plans under the Affordable Care Act

Published: Feb 28, 2024

Note:  This content was updated on February 28, 2024  to incorporate new FAQs from CMS. Tables 1 and 2 were also updated to include updated recommendations.

It has been more than ten years since the Affordable Care Act (ACA) required private insurance plans to cover recommended preventive services without any patient cost-sharing. Research has shown that evidence-based preventive services can save lives and improve health by identifying illnesses earlier, managing them more effectively, and treating them before they develop into more complicated, debilitating conditions, and that some services are also cost-effective. Since the preventive services coverage policy went into effect, there have been numerous additions, changes, and updates to the policy as well as specific recommendations. There have also been legal challenges over elements of the preventive services requirement, including in the pending case, Braidwood Management Inc. v. Becerra. This fact sheet summarizes the federal requirements for coverage for preventive services in private plans, major updates to the requirement, and recent policy activities on this front.

ACA Requirements for Coverage of Preventive Services

Under Section 2713 of the ACA, private health plans must provide coverage for a range of recommended preventive services and may not impose cost-sharing (such as copayments, deductibles, or co-insurance) on patients receiving these services.1  These requirements apply to all private plans—fully insured and self-insured plans in the individual, small group, and large group markets, except those that maintain “grandfathered” status. In 2019, 13% of workers covered in employer sponsored plans were still in grandfathered plans. The requirements also apply to the Medicaid expansion eligibility pathway.

The required preventive services come from recommendations issued by four expert medical and scientific bodies—the U.S. Preventive Services Task Force (USPSTF), the Advisory Committee on Immunization Practices (ACIP), the Health Resources and Services Administration’s (HRSA’s) Bright Futures Project, and the HRSA-sponsored Women’s Preventive Services Initiative (WPSI). Individual and small group plans in the health insurance marketplaces are also required to cover an essential health benefit (EHB) package—that includes the full range of preventive requirements described in this fact sheet.

Clinical Preventive Services for Adults and Children

The ACA requires private plans to cover the following four broad categories of services for adults and children (summarized in Tables 1 and 2):

I. Evidence-Based Screenings and Counseling

Insurers must cover evidence-based services for adults that have a rating of “A” or “B” in the current recommendations of USPSTF, an independent panel of clinicians and scientists commissioned by the federal Agency for Healthcare Research and Quality. An “A” or “B” letter grade indicates that the panel finds there is high certainty that the services have a substantial or moderate net health benefit. The services required to be covered without cost-sharing include screenings for depression, diabetes, obesity, various cancers, and sexually transmitted infections (STIs), prenatal tests, medications that can help prevent HIV, breast cancer, and heart disease, as well as counseling for drug and tobacco use, healthy eating, and other common health concerns. The effective date for a new recommendation from USPSTF is considered to be the last day of the month in which it is published or otherwise released.

II. Routine Immunizations

Health plans must also provide coverage without cost-sharing for immunizations that are recommended and determined to be for routine use by the ACIP, a federal committee comprised of immunization experts that is convened by the Centers for Disease Control and Prevention (CDC). A new ACIP recommendation is considered to be issued on the date that it is adopted by the Director of the CDC. The preventive services guidelines require coverage for adults and children and include immunizations such as influenza, meningitis, tetanus, HPV, hepatitis A and B, measles, mumps, rubella, varicella, and COVID-19. With regard to the COVID-19 vaccine, Congress waived the typical one year delay in implementation and required private insurance plans to begin full coverage 15 days after ACIP recommendation. Going forward, any COVID-19 vaccine recommended by ACIP, including updated boosters, will continue to be fully covered for people enrolled in non-grandfathered plans starting 15 days after the vaccine is recommended by ACIP, irrespective of whether the vaccine is under an emergency use authorization or fully approved by the FDA.

III. Preventive Services for Women

In addition to the recommendations issued by USPSTF and ACIP, the ACA authorized HRSA to make coverage requirements for women for services not addressed by the other recommending bodies. HRSA turns to evidence-based recommendations issued by the Women’s Preventive Services Initiative (WPSI), to identify gaps in recommendations for women and review the evidence regarding the effectiveness of the recommendations. Current recommendations include well-woman visits, all FDA-approved, -granted, or -cleared contraceptives and related services, breastfeeding support and supplies, broader screening and counseling for a range of conditions, including intimate partner violence, urinary incontinence, anxiety, STIs and HIV. Some of the HRSA recommendations for women are similar to recommendations from USPSTF, but with slight variations in the population that is addressed.

Table 1 summarizes the full slate of adult preventive services subject to the preventive services coverage requirements.

Summary of Selected Preventive Services for Adults Covered by Non-Grandfathered Private Plans without Cost Sharing

IV. Preventive Services for Children and Youth

In addition to services for adults, the ACA requires that private plans cover without cost-sharing the preventive services recommended by the HRSA’s Bright Futures Project, which provides evidence-informed recommendations to improve the health and wellbeing of infants, children, and adolescents. The preventive services covered for children and adolescents include well child visits, immunization and screening services, behavioral and developmental assessments, fluoride supplements, and screening for autism, vision impairment, lipid disorders, tuberculosis, and certain genetic diseases. immunization and screening services, behavioral and developmental assessments, fluoride supplements, and screening for autism, vision impairment, lipid disorders, tuberculosis, and certain genetic diseases.

Table 2 summarizes the full slate of preventive services for children and adolescents.   

Summary of Selected Preventive Services for Children Covered by Non-Grandfathered Private Plans without Cost Sharing

Coverage Rules and Clarifications

The recommending bodies periodically issue new recommendations and update existing ones based on advances in research. Plans are required to provide full coverage for new and updated recommendations one year after the latest issue date, beginning in the next plan year.2  If a recommendation is changed during a plan year or a new recommendation is issued, an issuer is not required to make changes in the middle of the plan year, unless one of the recommending bodies determines that a service is discouraged because it is harmful or poses a significant safety concern.3  In these circumstances, federal guidance will be issued. There are limited circumstances under which insurers may charge copayments and use other forms of cost-sharing for preventive services:

  • If the primary reason for the visit is not the preventive service, patients may have to pay for the office visit. For example, if an adult man sees a clinician for ongoing management of a chronic condition such as diabetes and also receives a COVID vaccine at that appointment, the plan may charge a co-payment for the office visit but may not charge for the vaccine, which is a recommended preventive service.
  • If the preventive service is performed by an out-of-network provider when an in-network provider is available to perform the service, insurers may charge patients for the office visit and the preventive service. However, if an out-of-network provider is used because there is no in-network provider able to provide the service then cost-sharing cannot be charged.
  • If a treatment is given as the result of a recommended preventive service, but is not the recommended preventive service itself, cost-sharing may be charged in some cases. For example, the USPSTF recommends a CT scan for some adults to screen for lung cancer. If cancer is detected during the scan, treatments such as surgery or medication may be prescribed. While plans must cover the screening test services in full, they may charge for the treatments.

The Public Health Service Act (PHSA) and federal regulations also allow plans to use “reasonable medical management” techniques to determine the frequency, method, treatment, or setting for a preventive item or service to the extent it is not specified in a recommendation or guideline. While there is no formal regulatory definition or parameters for reasonable medical management, medical management techniques are typically used by plans to control cost and utilization of care or comparable drug use. For example, plans can impose limits on number of visits or tests if unspecified by a recommendation, cover only generics or selected brands of pharmaceuticals, or require prior authorization to acquire a preferred brand drug. If a plan makes any material modifications that would affect the content of the plan’s Summary of Benefits and Coverage (SBC) during the plan year, the plan must notify enrollees of the change at least 60 days before it takes effect.

Since the policy took effect, a number of questions have arisen about how plans should implement the preventive services policy and the extent to which plans can use medical management practices to limit the frequency, range of covered services, and the types of providers that are subject to the policy. Over the years, the Departments of Health and Human Services, Labor, and Treasury have jointly issued a number of clarifications as” about different aspects of coverage of preventive services.

Notable highlights from clarifying documents include:

  • Colon cancer screening – USPSTF recommends screening for colorectal cancer in adults ages 45-75 using either stool-based testing or procedural screening, such as sigmoidoscopy or colonoscopy. There have been some cases of insured asymptomatic patients being charged unexpected cost-sharing for anesthesia and polyp removal during screening colonoscopies. The federal government has clarified multiple times that insurers must cover the full cost of medically necessary anesthesia services, polyp removal and related pathology performed in connection with a preventive colonoscopy in asymptomatic individuals, and follow up colonoscopies in the event of positive findings on stool-based tests, CT, or sigmoidoscopy.
  • Well-woman visits – The HRSA clinical preventive services for women include coverage for at least one well-woman preventive care visit for adult women. WPSI has clarified that a series of well-woman visits may be required to fulfill all necessary preventive services and should be provided without cost-sharing as needed, determined by clinical expertise. Furthermore, the most recent recommendation states that prenatal visits are considered well woman visits, as are pre-pregnancy, postpartum, and interpartum visits WPSI has also published recommendations for services to be provided as part of well woman care.
  • Testing and medications for the risk reduction of breast cancer – Federal guidance reinforces the USPSTF recommendation that women with family history of breast, ovarian, or peritoneal cancer should be screened for BRCA-related cancer, and those with positive results should receive genetic counseling and testing without cost-sharing when the services are medically appropriate and recommended by her provider. USPSTF also recommends the provision of chemo-preventive medications, such as tamoxifen and raloxifene, for women who are at increased risk for breast cancer and at low risk for adverse effects.
  • Special populations – Some of the recommendations subject to the preventive services requirement apply to a certain population, such as “high risk” individuals. The government has clarified that it is up to the health care provider to determine whether a patient belongs to the population in consideration and that plans must cover services accordingly. An individual’s sex assigned at birth or gender identity also cannot limit them from a recommended preventive service that is medically appropriate for that individual; for example, a transgender man who has breast tissue or an intact cervix and meets other requirements for mammography or cervical cancer screening must receive those services without cost sharing regardless of sex at birth.
  • Contraceptive coverage – Contraceptive services and supplies for women is one of the recommendations from HRSA, and since it was first issued there have been numerous federal clarifications. Plans must cover without cost sharing at least one product within each FDA-approved, granted, or cleared contraceptive method for women as prescribed. In addition to covering the cost of the contraceptive supplies, plans must cover related counseling, insertion, removal, and follow up services. While insurers may use reasonable medical management to limit full coverage to generic drugs within a method category, federal clarifications also state that plans must cover any contraceptive if deemed “medically necessary” by a health care provider. This means that plans must cover the following: brand name drugs if a generic is not available, a clinician-recommended brand name product, and contraceptive products that are not specifically identified by HRSA, such as new contraceptive products approved by the FDA. Some plans may choose to cover only one product within a category of contraceptives that has other therapeutic equivalent products. If this is the case, the plan must have a process in place to make exceptions for an individual who wants to access a therapeutic equivalent product if it is determined to be medically necessary by the individual’s clinician.  Any “exceptions process” must be accessible and timely for patients and providers to request coverage for a medically necessary contraceptive.
  • Houses of worship have always been exempted from the contraceptive requirement, and religiously affiliated nonprofit employers have had an accommodation if they have a religious objection to contraceptives. Some employers have challenged this regulation, claiming the accommodation offered by the government (where the method is covered by their plan but they are not required to pay towards its coverage as part of the premium) makes them complicit in the provision of contraception, a service they object to on religious or moral grounds. The federal policy regarding contraceptive coverage requirements for employer plans has undergone multiple changes in federal regulations and been contested in numerous legal cases, including three that reached the Supreme Court. The current regulations were issued during the Trump Administration and exempt nearly any employer that claims to have a religious or moral objection from providing contraceptive coverage.
  • Coverage for HIV Preexposure Prophylaxis (PrEP) – In June 2019, PrEP, medications which can help prevent HIV, received an “A”’ grade recommendation from the USPSTF as “effective antiretroviral therapy to persons who are at high risk of HIV acquisition.” Plans or policy years beginning on or after June 30, 2020, must cover PrEP (consistent with the USPSTF recommendation) without cost sharing. Federal guidance clarified that plans and insurers must also cover ancillary and support services for PrEP, such as adherence counseling and risk-reduction strategies, without cost sharing, and cannot use reasonable medical management techniques to restrict access to these services.

Impact of the Preventive Services Rules

The federal HHS Assistant Secretary for Planning and Evaluation (ASPE) estimates that in 2020, approximately 151.6 million people (58 million women, 57 million men, and 37 million children) currently are enrolled in non-grandfathered private health insurance plans that cover preventive services with no-cost sharing. Research has documented the impact of the policy on access to care in some areas, including utilization of cancer screening and contraceptives.

The evidence on cancer screening utilization after the elimination of cost-sharing is mixed and varies by cancer type. Some studies have shown that while screening rates for colorectal cancer among privately insured individuals increased since the passage of the ACA, rates for Pap testing decreased. However, it is difficult to assess the impact of the coverage provision since the recommendations for cervical cancer screening have been revised since the policy went into effect. Screening rates for breast cancer remained stable, though one study found that mammography screening among African American women significantly increased after ACA implementation. Likewise, the elimination of cost-sharing is associated with increases in BRCA genetic testing which helps identify women who are at elevated risk for breast and ovarian cancer. Studies have also indicated that increased access to and affordability of preventive services has helped cancer survivors obtain necessary care.

Several studies found that the contraceptive coverage requirement under the ACA has dramatically reduced OOP spending for contraceptives, including OOP spending for oral contraceptives (Figure 2). Multiple studies have shown increases in utilization for short-term birth control methods such as birth control pills, patches, and diaphragms. Studies have found that utilization of long-acting reversible contraceptives (LARCs), such as intrauterine devices (IUDs) and implants, increased after ACA implementation. Additional research also shows that OOP costs for LARCs—some of the most effective forms of pregnancy prevention—were also reduced under the ACA. These findings suggest that the lowered OOP costs from the contraceptive coverage requirement has improved contraception use and adherence.

Share of oral contraceptive users with out-of-pocket spending by year, IBM MarketScan Commercial Claims and Encounters 2003–2018

The preventive services coverage policy has become an established part of health coverage for most people in the United States. Yet, the policy is currently facing legal challenges, notably in the case Braidwood Management Inc v. Becerra. The outcome of the latest legal challenge could affect whether people will continue to have full no-cost coverage for recommended preventive services in the future.

  1. Note that the rules described in this fact sheet apply to private insurers, self-insured employer plans, and are separate from preventive requirements for public programs like Medicare or Medicaid. ↩︎
  2. The final issue date for new or updated recommendations varies by recommending body. Recommendations are considered to be issued on the last day of the month on which the USPSTF publishes or releases the recommendation; recommendations from ACIP are considered issued on the date it is adopted by the Director of the CDC; and a recommendation or guideline supported by HRSA is considered to be issued on the date on which it is accepted by the Administrator of HRSA or, if applicable, adopted by the Secretary of HHS. Federal Register, Vol. 80, NO. 134, July 14, 2015. ↩︎
  3. These circumstances include downgrade of a USPSTF service from a rating of “A” or “B” to “D” (which means that USPTF has determined that there is strong evidence that there is no net benefit, or that the harms outweigh the benefits, and therefore discourages the use of this service), or a service is the subject of a safety recall or otherwise determined to pose a significant safety concern by a federal agency authorized to regulate that item or service. ↩︎
Poll Finding

KFF Survey on Racism, Discrimination and Health: Views on Racism and Trust in Key U.S. Institutions

Authors: Ana Gonzalez-Barrera, Liz Hamel, Samantha Artiga, and Marley Presiado
Published: Feb 26, 2024

Findings

Introduction

In recent years, there has been increased attention to the ongoing impacts of racism and discrimination in U.S. society. In the wake of the killings of George Floyd and Breonna Taylor and the underlying inequities exposed by the COVID-19 pandemic, there have been calls for recognizing structural racism and bias and taking action to address them. In health care, specifically, there is a long history of policies and events that contributed to present-day disparities, and race continues to permeate clinical decision making and treatment in multiple ways.

This report examines U.S. adults’ views on racism in major aspects of U.S. society, including politics, the criminal justice system, policing, education, housing, employment, and health care and how they vary by race and ethnicity, other demographics, experiences with discrimination, and political identity. It also explores the level of trust in health care providers, the police and the courts and how levels of trust vary by race and ethnicity and other demographics, as well as experiences with discrimination and unfair treatment.

These findings come from KFF’s 2023 Racism, Discrimination, and Health Survey, which documents the extent and implications of racism and discrimination, particularly with respect to people’s interactions with the health care system. A previous report from the survey focused on individuals’ experiences with racism and discrimination in health care and more broadly, and the relationship of those experiences to health and well-being.

Key Takeaways

Large majorities of adults say racism is at least a minor problem in U.S. politics, criminal justice, policing, education, housing, employment, and health care, and Black adults are much more likely to view racism as a major problem in each area. Majorities of Black adults see racism as a major problem in each of these areas, and Black adults are at least 20 percentage point more likely than White adults to hold this view. Substantial shares of Hispanic, Asian, and American Indian and Alaska Native (AIAN) adults view racism as a problem in these areas, while White adults are generally less likely than other groups to see racism as a problem.

At least half of adults say racism is a major problem in U.S. politics (56%), criminal justice (54%), and policing (51%), while a smaller share (32%) see racism as a major problem in health care. More than seven in ten Black adults, majorities of Hispanic, Asian, and AIAN adults, and about half of White adults say racism is a major problem in politics, the criminal justice system, and policing. The smaller share seeing racism as a problem in health care relative to other areas may reflect higher levels of trust in health care providers, particularly compared to the police and the courts.

Partisanship is one of the strongest predictors of views of racism in U.S. society today, but among Republicans, these views differ by race and ethnicity. Across most aspects of society included in the survey, majorities of Democrats across racial and ethnic groups see racism as a major problem. Republicans overall are much less likely to view racism as a problem, but among Republicans, Black, Hispanic and Asian adults are more likely than White adults to say racism is a major problem across most of these areas. In addition to partisan differences, women, LGBT adults, and those with a college degree or higher are more likely to view racism as a major problem.

Adults who have experienced discrimination in their daily lives generally and in health care, policing, and employment specifically are more likely than those without these experiences to say racism is a major problem in these areas. For example, adults who say they were treated unfairly or with disrespect by a health care provider in the past three years are more likely than those who haven’t had this experience to say racism is a major problem in health care.

Majorities of adults across racial and ethnic groups say they trust doctors and health care providers to do what is right for them and their community all or most of the time. At least two-thirds of adults across racial and ethnic groups say they trust doctors and other health care providers almost all or most of the time. This relatively high level of trust in health care providers may be one reason that fewer adults see racism as a problem in health care compared to other areas of society.

Black adults, those with darker skin color and adults with experiences of discrimination are less likely than their counterparts to trust health care providers. Black adults are somewhat less likely than White adults to trust health care providers, and among Black and Hispanic adults, those with self-reported darker skin color are less likely than those with lighter skin color to say they trust providers. Past experiences with discrimination also are associated with lower trust in health care providers. Across groups, adults who say they were treated unfairly or with disrespect by a health care provider in the past three years are less likely than those who do not report a negative experience to say they trust providers to do what is right for their community all or most of the time.

Having more visits with providers who have a shared racial background or language is associated with higher levels of trust in doctors and health care providers. Black and Asian adults who have more visits with providers who share their racial background, as well as Spanish-speaking Hispanic adults who have more visits with providers who speak their language, are more likely than their counterparts who have fewer visits with providers who share their racial background or language to say they trust doctors and other health care providers to do what is right for them and their community all or most of the time.

Levels of trust in the police and the courts are lower among U.S. adults overall and across racial and ethnic groups compared with trust in health care providers, which may reflect higher shares who view racism as a major problem in these institutions. Two-thirds of adults say they trust the police all or most of the time to do what is right for their community and about half say the same about the U.S. courts, with substantially lower shares among Black adults (45% and 37%, respectively). Among Black adults who say they or a family member was threatened or mistreated by police in the past year (11% of all Black adults), just one in five say they trust the police all or most of the time.

Implications

These findings illustrate that, despite increased calls to address racism in recent years, many adults continue to see racism as a problem across aspects of U.S. society. While adults who experience more racism in their lives are more likely to view it as a major problem, these views are shared across groups, with roughly half of White adults viewing racism as a major problem in in politics, the criminal justice system, and policing. There is a stark partisan divide in views on racism, but among Republicans, Black, Hispanic, and Asian adults are much more apt to identify racism as an institutional problem compared to their White counterparts.

These findings underscore the importance of continued efforts to address structural and systemic racism across multiple aspects of society and particularly in politics, policing, and the criminal justice system. Compared to these areas of society, fewer adults see racism as a major problem in health care and trust in health care providers is relatively high, particularly in contrast to trust in the police and the courts. Still, the survey suggests pathways for improvement on both these measures. Those who have had past experiences with unfair treatment in health care settings are more likely to view racism as a problem in health care, and earlier analysis identified that these experiences remain common and are associated with negative impacts on health and well-being. Having a provider with a shared racial background and language further increases levels of trust, highlighting the importance of continuing to diversify the health care workforce and enhancing the ability of all providers to provide culturally and linguistically appropriate care.

Notes on Racial and Ethnic Groups Included in This Report

Many surveys and data analyses classify individuals into non-overlapping racial and ethnic categories using single-race and Hispanic ethnicity categories and grouping those who identify as more than one race into a “multiracial” or “other” category. To allow for better representation of experiences of the growing shares of people who identify as multiracial, this report uses an “alone or in combination” approach for classifying individuals so that they are represented within each racial and ethnic group with which they identify, resulting in overlapping racial and ethnic categories. For example, responses from someone who identifies as both Black and Asian are included in the results for both Black adults and Asian adults, and responses from someone who identifies as American Indian and Hispanic are included in the results for both AIAN adults and Hispanic adults. The exception is reporting on White adults, who in this report are defined as those who identify as non-Hispanic and select White as their only race.

The sample sizes for Hispanic adults and Black adults (more than 1,750 each) allow for detailed subgroup reporting, including by age, gender, income, LGBT identity, and urbanicity. The sample of Asian adults (693) allows for a narrower set of demographic breaks within this group. Because of the smaller sample of AIAN adults (267), results are shown for this population as a whole and demographic breaks are not provided.

In addition, the sample of AIAN adults has some limitations and caution should be exercised when interpreting these results. Given ongoing concerns about data erasure and invisibility of smaller populations, including Indigenous people, KFF has decided to include results for the AIAN population in this report despite these limitations.

Views of Racism in U.S. Society

Large majorities of adults say racism is at least a minor problem in U.S. politics, criminal justice, policing, education, housing, employment, and health care. The shares viewing racism as a major problem in each of these areas varies, with fewer than three in ten saying racism is not a problem at all in each area.

At least half of adults say racism is a major problem in U.S. politics (56%), criminal justice (54%), and policing (51%), while a smaller share (32%) see racism as a major problem in health care. The smaller share seeing racism as a problem in health care relative to other areas may reflect higher levels of trust in health care providers, particularly compared to the police and the courts (see findings below).

Majorities Of Adults Say Racism Is A Major Problem In Politics, The Criminal Justice System And Policing

Across racial and ethnic groups, substantial shares of adults view racism as a major problem in various aspects of U.S. society, with Black adults at least 20 percentage points more likely than White adults to view racism as a major problem in each area. Substantial shares of Hispanic, Asian, and American Indian and Alaska Native (AIAN) adults view racism as a problem in all aspects of society included in the survey, including more than half of each of these groups who say racism is a major problem in U.S. politics, the criminal justice system, and policing. While White adults are generally less likely than other groups to see racism as a problem, about half of White adults say it is a major problem in politics, the criminal justice system, and policing.

Black Adults More Likely Than Other Adults To Say Racism Is A Major Problem In All Aspects In Survey

Women, LGBT adults, U.S.-born adults, and adults with a college degree or higher are more likely than their counterparts to say racism is a major problem in most aspects of U.S. society. Black women are particularly likely to view racism as a problem, including over three quarters who view it as a major problem in politics, criminal justice, and policing. LGBT adults are also more likely than non-LGBT adults to say racism is a major problem in various aspects of U.S. society, a pattern that is driven largely by Hispanic and White LGBT adults. For example, eight in ten White adults who identify as LGBT say racism is a major problem in the criminal justice system, politics and policing compared with half or less among White adults who do not identify as LGBT. U.S.-born Asian and Hispanic adults are more likely than their immigrant counterparts to say racism is a major problem in most aspects of society. Overall, adults with a college degree or higher are more likely to say that racism is a major problem in all areas included in the survey than those who have not obtained a college degree. This pattern generally holds across Black, Hispanic, and White adults but is not evident among Asian adults. (See Appendix 1 for more details)

Majorities of Democrats across racial and ethnic groups see racism as a major problem across most areas asked about in the survey, while among Republicans, views on racism differ by racial and ethnic group with smaller shares of White Republicans saying racism is a major problem across most areas. For example, seven in ten Black Republicans (70%) say racism is a major problem in the criminal justice system, while 27% of White Republicans say this. Similarly, Asian adults who identify as Republican or lean Republican are twice as likely as White Republicans to say racism is a major problem in education (40% vs. 20%).

Put another way, across racial and ethnic groups, differences in views of racism between Democrats and Republicans are largest within White adults. For example, about three times as many White Democrats as White Republicans say racism is a major problem in policing (74% vs. 23%). Among Black Republicans the gap is much smaller (77% vs. 64%).

Democrats More Likely Than Republicans To See Racism As Major Problem Across Most Aspects Of Society

Adults who experience discrimination in their daily lives are more likely than those who rarely or never have these experiences to say racism is a major problem in all aspects of society included in the survey, a pattern that holds among Black, Hispanic, Asian and White adults. As previously reported, four in ten adults say they have experienced at least one type of discrimination in daily life at least a few times in the past year, including larger shares of Hispanic, Black, and AIAN adults compared to White adults. Such discrimination includes things like receiving poorer service at restaurants or stores, people acting as if they were afraid of them, or being threatened or harassed. This analysis finds a link between these experiences and people’s views of racism as a problem in U.S. society. For example, seven in ten Asian adults who have experienced at least one form of discrimination in their daily lives say racism is a major problem in politics, compared with less than half (45%) of Asian adults who have not had any of these experiences. Similarly, six in ten (61%) Black adults who report experiences of discrimination say racism is a major problem in housing, compared with about half (48%) of those who do not report any experiences of discrimination.

Adults Who Experienced Discrimination In Daily Life At Least A Few Times In The Past Year Are More Likely To View Racism As A Major Problem

Adults who say they were treated unfairly or with disrespect by a health care provider in the past three years are more likely than those who haven’t had these experiences to say racism is a major problem in health care, particularly among Black and Hispanic adults. Among Black and Hispanic adults, those who have experienced unfair treatment in health care settings are about 30 percentage points more likely than those who have not had these experiences to say racism is a major problem in health care in the U.S. today (74% vs. 46% for Black adults and 58% vs. 30 for Hispanic adults). Similarly, Asian and White adults who have experienced unfair treatment are about 15 percentage points more likely to say racism is a big problem in health care than those who haven’t had these experiences. Notably, however, Black adults stand out as being most likely to view racism as a major problem in health care, regardless of whether they personally report experiencing unfair treatment in health care settings.

For example, even among those who do not report personal experiences of unfair treatment, about half of Black adults (46%) say racism is a major problem in U.S. health care compared to smaller shares of Hispanic (30%), Asian (33%), and White adults (25%) who have not experienced unfair treatment.

Adults Who Have Been Treated Unfairly Or With Disrespect By Health Care Provider More Likely To Say Racism Is A Major Problem In Health Care

Overall and among Black and Hispanic adults, those who say they or a family member has been threatened or mistreated by the police in the last year are more likely than those who do not report these experiences to say racism is a major problem in policing. As previously reported, Black and Hispanic adults, and particularly those with self-reported darker skin tones, are more likely than White adults to report personal or family experiences with police mistreatment in the past year. While majorities of Black and Hispanic adults view racism as a major problem in policing, the shares are even higher among those who say they or a family member was threatened or mistreated by the police in the past year, rising to nine in ten (89%) among Black adults who have had this experience.

Black And Hispanic Adults Who Have Negative Experiences With Police More Likely To View Racism In Policing As A Major Problem

Experiences with unfair treatment on the job are also associated with views of racism as a problem in employment. While about a third (35%) of adults overall view racism as a major problem in employment in the U.S., the share rises to nearly half (45%) among those who say they were ever fired or denied a job or promotion for unfair reasons. Among Black adults, two-thirds (68%) of those who have experienced this type of unfair treatment say racism is a major problem in employment compared to half of those who have not had this experience. Similarly, Hispanic adults who have experienced unfair treatment in employment are about 15 percentage points more likely to say racism is a major problem in employment than those who haven’t experienced this.

Black And Hispanic Adults Who Have Experienced Unfair Treatment In The Workplace Are More Likely To Say Racism Is A Major Issue In Employment

Trust in Doctors and Other Health Care Providers

Despite differences in views of racism as a problem in health care, majorities of adults across racial and ethnic groups say they trust doctors and health care providers to do what is right for them and their community all or most of the time. About seven in ten adults across racial and ethnic groups say they trust doctors and other health care providers all or most of the time. This relatively high level of trust in health care providers may be one reason that fewer adults see racism as a problem in health care compared to other areas of society. Still, nearly three in ten adults overall say they trust health care providers only some of the time or never, including a somewhat larger share of Black adults (32%) compared to White (27%) adults. Notably, Black adults who say their skin color is very dark or dark are less likely to say they usually trust health care providers to do what is right for them and their community compared with those who describe their skin color as very light or light (64% vs. 75% respectively).

Seven In Ten U.S. Adults Say They Trust Doctors And Other Health Care Providers Almost All or Most of The Time

Overall, women, adults who identify as LGBT, those between the ages of 30-49, the uninsured, and those in fair or poor health are less likely than their counterparts to trust doctors and other health care providers to do what is right for them or their community. Notably, fewer than two-thirds of Black women (64%), Hispanic and Black LGBT adults (54% and 60%, respectively), and Black adults ages 30-49 (62%) say they trust providers almost all or most of the time. (See Appendix 2 for more details.)

Overall, and among Black, Asian, and White adults, those who have more health care visits with providers who share their racial and ethnic background are more likely to say they trust doctors and other health care providers to do what is right for them and their community. For example, three-quarters (74%) of Black adults who say at least half of their recent health care visits were with a provider who shared their racial background say they trust health care providers to do what is right for their community almost all or most of the time, compared with two-thirds (65%) of Black adults who have fewer visits with racially concordant providers. Among Asian adults, those shares are 83% and 71%, respectively. Although no there are no significant differences for Hispanic adults whose providers shared their race and ethnicity, among Spanish-speaking Hispanic adults, having a health care provider who speaks one’s preferred language is associated with higher levels of trust. Hispanic adults who completed the survey in Spanish and report that at least half of their recent health care visits were with a provider who spoke their preferred language are more likely say they trust health care providers to do what is right for them and their community compared with those who have fewer visits with providers who speak their language (76% vs. 59%).

Adults Who Had Visits With Health Care Providers Of Same Race Or Ethnicity As Themselves Are More Likely To Trust Health Care Providers

Across racial and ethnic groups, those who report being treated unfairly or with disrespect by a health care provider are less likely to say they trust health providers to do what is right for them and their community. Overall, about half of adults who report experiencing unfair treatment in the past three years say they trust health care providers all or most of the time, compared with about three-quarters of those who have not experienced such treatment. These shares are similar among Hispanic, Black, Asian, and White adults.

Adults Who Have Were Treated Unfairly Or With Disrespect By Health Care Provider Are Less Likely To Trust Doctors And Other Health Care Providers

Trust in the Police and the Courts

In contrast with the relatively high levels of trust most U.S. adults have for doctors and other health care providers, levels of trust in the police and the courts are lower and differ more across racial and ethnic groups, perhaps reflecting larger shares viewing racism as a problem within these institutions and past negative experiences. Overall, about two thirds of adults say they trust the police to do what is right for them and their community almost all or most of the time, but this share drops to 45% among Black adults compared with roughly three quarters (74%) of White adults. Trust in the courts is split with about half of adults saying they trust the courts almost all or most of the time and the other half saying they trust them only some of the time or never. Again, the shares trusting the courts fall to 37% among Black adults and 39% among AIAN adults compared with over half (53%) of White adults.

Most Black Adults Do Not Trust The Police Or The Courts To Do What Is Right For Them Or Their Community

Men, older adults, and Republicans report higher levels of trust in the police compared with women, younger adults, and Democrats. However, these differences are generally less pronounced among Black adults, who report lower levels of trust in the police across demographics. Overall, 71% of men say they trust the police all or most of the time to do what is right for their community compared with 64% of women. Older adults are also more trusting of the police with eight in ten of those ages 65 and over saying they trust the police at least most of the time compared with just over half (55%) of 18–29-year-olds. Republicans are also more likely than Democrats to say they trust the police. Across all these demographics, Black adults stand out as less trusting than the other groups.

Men, Older Adults, And Republicans Are More Likely To Trust The Police To Do What Is Right

Overall and among Black and Hispanic adults, those who say they or a family member experienced police mistreatment are less likely to say they trust the police to do what is right for their communities. Among Black adults who say they or a family member was threatened or mistreated by police in the past 12 months (11% of all Black adults), just one in five say they trust the police to do what is right for their community all or most of the time. Among Hispanic adults who say they or a family member have experienced police mistreatment (8% of all Hispanic adults), trust is also relatively low with 33% saying they trust the police all or most of the time. These differences in levels of trust in the police mirror the differences found in views of racism as a major problem in U.S. policing.

Adults With Personal Or Family Experience Of Police Mistreatment Are Less Likely To Trust The Police

Methodology

The Survey on Racism, Discrimination, and Health was designed and analyzed by researchers at KFF. The survey was conducted June 6 – August 14, 2023, online and by telephone among a nationally representative sample of 6,292 U.S. adults in English (5,706), Spanish (520), Chinese (37), Korean (16), and Vietnamese (13).

The sample includes 5,073 adults who were reached through an address-based sample (ABS) and completed the survey online (4,529) or over the phone (544). An additional 1,219 adults were reached through a random digit dial telephone (RDD) sample of prepaid (pay-as-you-go) cell phone numbers. Marketing Systems Groups (MSG) provided both the ABS and RDD sample. All fieldwork was managed by SSRS of Glen Mills, PA; sampling design and weighting was done in collaboration with KFF.

Sampling strategy:The project was designed to reach a large sample of Black adults, Hispanic adults, and Asian adults. To accomplish this, the sampling strategy included increased efforts to reach geographic areas with larger shares of the population having less than a college education and larger shares of households with a Hispanic, Black, and/or Asian resident within the ABS sample, and geographic areas with larger shares of Hispanic and non-Hispanic Black adults within the RDD sample.

The ABS was divided into areas (strata) based on the share of households with a Hispanic, Black, and/or Asian resident, as well as the share of the population with a college degree within each Census block group. To increase the likelihood of reaching the populations of interest, strata with higher incidence of Hispanic, Black, and Asian households, and with lower educational attainment, were oversampled in the ABS design. The RDD sample of prepaid (pay-as-you-go) cell phone numbers was disproportionately stratified to reach Hispanic and non-Hispanic Black respondents based on incidence of these populations at the county level.

Incentives:Respondents received a $10 incentive for their participation, with interviews completed by phone receiving a mailed check and web respondents receiving a $10 electronic gift card incentive to their choice of six companies, a Visa gift card, or a CharityChoice donation.

Community and expert input:Input from organizations and individuals that directly serve or have expertise in issues facing historically underserved or marginalized populations helped shape the questionnaire and reporting. These community representatives were offered a modest honorarium for their time and effort to provide input, attend meetings, and offer their expertise on dissemination of findings.

Translation:After the content of the questionnaire was largely finalized, SSRS conducted a telephone pretest in English and adjustments were made to the questionnaire. Following the English pretest, Cetra Language Solutions translated the survey instrument from English into the four languages outlined above and checked the CATI and web programming to ensure translations were properly overlayed. Additionally, phone interviewing supervisors fluent in each language reviewed the final programmed survey to ensure all translations were accurate and reflected the same meaning as the English version of the survey.

Data quality check:A series of data quality checks were run on the final data. The online questionnaire included two questions designed to establish that respondents were paying attention and cases were monitored for data quality including item non-response, mean length, and straight lining. Cases were removed from the data if they failed two or more of these quality checks. Based on this criterion, 4 cases were removed.

Weighting:The combined cell phone and ABS samples were weighted to match the sample’s demographics to the national U.S. adult population using data from the Census Bureau’s 2021 Current Population Survey (CPS). The combined sample was divided into five groups based on race or ethnicity (White alone, non-Hispanic; Hispanic; Black alone, non-Hispanic; Asian alone, non-Hispanic; and other race or multi-racial, non-Hispanic) and each group was weighted separately. Within each group, the weighting parameters included sex, age, education, nativity, citizenship, census region, urbanicity, and household tenure. For the Hispanic and Asian groups, English language proficiency and country of origin were also included in the weighting adjustment. The general population weight combines the five groups and weights them proportionally to their population size.

A separate weight was created for the American Indian and Alaska Native (AIAN) sample using data from the Census Bureau’s 2022 American Community Survey (ACS). The weighting parameters for this group included sex, education, race and ethnicity, region, nativity, and citizenship. For more information on the AIAN sample including some limitations, adjustments made to make the sample more representative, and considerations for data interpretation, see Appendix 2.

All weights also take into account differences in the probability of selection for each sample type (ABS and prepaid cell phone). This includes adjustment for the sample design and geographic stratification of the samples, and within household probability of selection.

The margin of sampling error including the design effect for the full sample is plus or minus 2 percentage points. Numbers of respondents and margins of sampling error for key subgroups are shown in the table below. Appendix 1 provides more detail on how race and ethnicity was measured in this survey and the coding of the analysis groups. For results based on other subgroups, the margin of sampling error may be higher. All tests of statistical significance account for the design effect due to weighting. Dependent t-tests were used to test for statistical significance across the overlapping groups.

Sample sizes and margins of sampling error for other subgroups are available by request. Sampling error is only one of many potential sources of error and there may be other unmeasured error in this or any other public opinion poll. KFF public opinion and survey research is a charter member of the Transparency Initiative of the American Association for Public Opinion Research.

GroupN (unweighted)M.O.S.E.
Total6,292± 2 percentage points
Race/Ethnicity
White, non-Hispanic (alone)1,725± 3 percentage points
Black (alone or in combination)1,991± 3 percentage points
Hispanic1,775± 3 percentage points
Asian (alone or in combination)693± 5 percentage points
American Indian and Alaska Native (alone or in combination)267± 8 percentage points

Appendix

Appendix 1. Additional Figures of Views of Racism in U.S. Society

Views Of Racism In Aspects Of U.S. Society By Nativity, Within Racial And Ethnic Groups
Views Of Racism In Aspects Of U.S. Society By Gender, Within Racial And Ethnic Groups
Views Of Racism In Aspects Of U.S. Society By Education, Within Racial And Ethnic Groups
Views Of Racism In Aspects Of U.S. Society By LGBT Identification, Within Racial And Ethnic Groups

Appendix 2. Detailed Charts and Tables of Trust in Health Care Providers

Trust In Health Care Providers By Demographic Groups
Trust in Health Care Providers By Gender, LGBT Identity, And Age Within Racial And Ethnic Groups
News Release

A Third of the Public View Racism as a Major Problem in Health Care; Larger Shares See Racism as a Major Problem in Politics, Criminal Justice, and Other Areas

Black Adults and Those Who Report Being Treated Unfairly or With Disrespect by a Health Care Provider Are More Likely to See Racism in Health Care as a Major Problem

Published: Feb 26, 2024

About a third (32%) of the public view racism as a major problem in health care, fewer than say the same about politics (56%), the criminal justice system (54%), and policing (51%), a new KFF report on the public’s views of racism finds. The lower levels of perceived racism in health care may reflect high levels of trust in doctors and health care providers across racial and ethnic groups.

Overall, Black adults are much more likely than White adults to say racism is a major problem in each of these areas, while Hispanic, Asian, and American Indian and Alaska Native adults are generally somewhat more likely than White adults to say so.

Partisanship is one of the strongest predictors of views of racism in U.S. society, with White Democrats much more likely than White Republicans to see racism as a major problem across each aspect of society asked about in the survey. Among Republicans, Black, Hispanic and Asian adults are more likely than White adults to say racism is a major problem.

People who report experiencing racism or discrimination in their daily lives are much more likely to say racism is a major problem across different aspects of society, including in health care. 

For example, among all adults, those who say they were treated unfairly or with disrespect by a health care provider recently are much more likely than those who haven’t to say racism is a major problem in health care (49% and 28%, respectively). The same pattern holds for Black adults (74% and 46%), Hispanic adults (58% and 30%), and Asian adults (48% and 33%).

Despite differences in views of racism in health care, about 7 in 10 adults across racial and ethnic groups say they trust doctors and health care providers to do what is right for them and their community all or most of the time. 

Black adults, those with darker skin color, and adults who report experiencing unfair treatment in a health care setting are less likely than their counterparts to trust health care providers. Among Black and Asian adults, those who mostly visit health care providers who share their racial identity are more likely to say they trust providers than those who don’t.

The new report draws on data from KFF’s 2023 Survey on Racism, Discrimination and Health, which documents the extent and implications of racism and discrimination in society, including in people’s interactions with the health care system.

KFF also released two additional reports—one on racial disparities in access to medical advancements and technologies and another that examines how the history of policies and events have contributed to disparities, which builds upon an interactive timeline exploring history’s impact on health disparities.

The KFF Survey on Racism, Discrimination and Health is a probability-based survey conducted online and via telephone with a total of 6,292 adults, including oversamples of Hispanic, Black, and Asian adults conducted June 6-August 14, 2023. Respondents were contacted via mail or telephone; and had the choice to complete the survey in English, Spanish, Chinese, Korean, or Vietnamese. Survey methodology was developed by KFF researchers in collaboration with SSRS, and SSRS managed sampling, data collection, weighting, and tabulation. The margin of sampling error is plus or minus two percentage points for results based on the full sample; three percentage points for results based on Hispanic adults (n=1,775), Black adults (n=1,991) or White adults (n=1,725); five percentage points for results based on Asian adults (n=693); and eight percentage points for results based on American Indian and Alaska Native adults (n=267). 

News Release

Want to Learn About Women’s Health in your State? Check out KFF’s Updated Interactive Dashboard

Published: Feb 22, 2024

KFF recently updated its interactive dashboard with national and state data on women’s health, as well as information about various policies that affect women’s health.

The dashboard provides instant access the most up-to-date state level indicators of women’s health in the U.S. Many of the indicators also provide national and state-level information for women of different racial and ethnic groups.

Dashboard topics include:

  • Abortion availability, coverage, and use by race/ethnicity.
  • Maternal and infant mortality, preterm births, teen births, and Medicaid eligibility policies for pregnancy-related care.
  • Health coverage and use of preventive services such as mammograms and pap smear
  • Contraceptive coverage policies under Medicaid and state-regulated insurance plans.
  • Health status, including mental health.
  • HIV rates and other chronic conditions including hypertension, diabetes, and cancer rates.

Each chart or graph is available for download or sharing on social media.