2024 Women’s Health Survey

The 2024 KFF Women’s Health Survey (WHS) is the latest in a series of nationally representative surveys on women’s health conducted by KFF since 2001. The survey’s objective is to track and document women’s experiences and knowledge related to health and well-being. The 2024 survey includes a nationally representative sample of 6,246 adults ages 18 to 64, including 5,055 women and 1,191 men, and was conducted from May 15 to June 18, 2024. To better understand health care disparities, the survey includes representative samples of Black, Hispanic, and Asian or Pacific Islander women as well as those who identify as LGBT+. Briefs are focused on abortion experiences, knowledge, and attitudes among reproductive age women in the U.S., as well Florida and Arizona. Additional areas of focus include women’s experiences with contraception, and fertility services, mental health, and intimate partner violence and other topics related to health care access, cost, and insurance coverage.

ABORTION

Women and Abortion in the U.S.

Information from the 2024 KFF Women’s Health Survey about women’s experiences with abortion, the fallout of overturning Roe v. Wade, women’s knowledge about abortion laws in their states including medication abortion, as well as their opinions on the legality of abortion.

Women and Abortion in Florida

This brief provides information about abortion experiences, awareness, and attitudes of Florida women ages 18 to 49, based on findings from the 2024 KFF Women’s Health Survey, a nationally representative survey on health care issues.

Women and Abortion in Arizona

Information about abortion experiences, awareness, and attitudes of Arizona women ages 18 to 49, based on findings from the 2024 KFF Women’s Health Survey, a nationally representative survey on health care issues.

ACCESS

Access to Pregnancy and Parenting Support Services

This analysis, based on findings from the 2024 KFF Women’s Health Survey, focuses on women with children ages 5 & under and their perceptions on how easy or difficult they feel it is to access a range of services that are important to the health of women and families, including maternity care, Medicaid coverage, food stamps, contraceptive services, and affordable childcare.

Access to Fertility Care

This brief provides new data from the 2024 KFF Women’s Health Survey on access to fertility care, including women’s opinions about access in their state, cost barriers, and the range of fertility services that women use.


CONTRACEPTION

Contraceptive Experiences, Coverage, and Preferences

This brief offers a close examination of women’s experiences with contraception, insurance coverage, contraceptive preferences, and interactions with the health care system. We also explore the influence and reach of contraceptive information on social media.

A Spotlight on Vasectomy

As part of the 2024 KFF Women’s Health Survey, a nationally representative sample of 1,191 men ages 18 to 64 were surveyed on a broad range of health issues. This data note highlights their responses to their experiences, knowledge, and perspectives about vasectomy services.


EXPERIENCES

Women’s Experiences with Intimate Partner Violence

This analysis provides data on women experiencing intimate partner violence (IPV) and reports on a range of health topics affecting women who experienced IPV in the past five years, including their health care needs and use, barriers, and mental health.

LGBT

News Release

Similar Shares of Republican, Democratic, and Independent Women (One in Seven) Report Having Had an Abortion

More than Six in Ten Women of Reproductive Age Are Concerned About Access to Abortion If It Was Needed to Preserve Their Own Life or Health or That of Someone Close to Them

Published: Aug 14, 2024

A new nationally representative KFF Women’s Health Survey, which explores the extensive implications of Roe v. Wade being overturned by the Supreme Court, reveals that one in seven (14%) women of reproductive age report having had an abortion at some point in their life. Across partisanship, similar shares of Republican women (12%), Democratic women (14%), and independents (15%) report having had an abortion.

The survey uncovered concern over access to abortion services in emergencies. More than six in 10 women of reproductive-age (18-49 years old) across the United States (63%) are concerned that they, or someone close to them, would not be able to get an abortion if it was needed to preserve their life or health. They are also concerned that abortion bans may affect the safety of a potential future pregnancy for themselves or someone close to them (64%).

Nationally, three-quarters of reproductive-age women who are Democrats and six in 10 independent women are concerned about abortion access in cases of pregnancy-related emergencies. A sizable minority of Republican women in this age group nationally (42%) also share these concerns.

A cross-partisan trend emerged in whether abortion policy should be left up to individual states, a policy that former President Trump has said he supports, which allows the current bans and restrictions to stay in effect across half the country. The survey shows that seven in 10 reproductive-age women (74%) oppose leaving abortion policy up to the individual states to determine, including most Republicans (53%), Democrats (86%), and independents (73%).

In addition, many women across the U.S. are unaware of the status of abortion policy in their state (45%), how to obtain an abortion if they need one in the near future (26%), or that people in their state can get medication abortion pills online (19%). Since Roe v. Wade was overturned, the landscape involving abortion bans and restrictions at the state level has been shifting rapidly.

The survey also explores the abortion experiences and perspectives of women in Florida—where it is on the ballot this November—and Arizona, a swing state that may have an abortion ballot initiative this fall. Nearly one in five (18%) reproductive-age women in Florida report they have had an abortion. Among women of reproductive-age in Arizona, 15% say they have had an abortion at some point in their lives. Seven in 10 women in Arizona (70%) and Florida (72%) say abortion should be legal in all or most cases.

Additional findings include:

  • In Florida, only one in five (18%) are aware medication abortion is still legal in their state (abortion is available until six weeks in Florida). About a third (34%) don’t know where to get an abortion or where to find the information should they need one, and only one in ten (9%) are aware that medication abortion pills can be obtained online. Awareness is similarly limited in Arizona (where abortion is currently available up to 15 weeks), particularly among women with lower incomes who are affected disproportionately by restrictions on abortion, have lower awareness about abortion access in their state, and have more significant concerns about pregnancy safety.
  • The fallout from the overturning of Roe v. Wade has resulted in a substantial number of women who report struggling themselves—or knowing someone who struggled—to get an abortion. Nearly one in ten (8%) women of reproductive age in the United States personally know someone, including themselves, who has had difficulty getting an abortion since Roe v. Wade was overturned, including 11% of Hispanic women and 13% of women living in states with abortion bans. Among the barriers cited were traveling out of state for care, not knowing where to go, and lacking the money to cover the cost.
  • Across the United States, 17% of reproductive-age women report changing their contraceptive practices as a result of Roe v. Wade being overturned. Actions taken include starting birth control, getting a sterilization procedure, switching to a more effective method, or purchasing emergency contraceptive pills to have on hand.

Periodically conducted since 2001, this 2024 KFF Women’s Health Survey analysis includes a nationally representative sample of 3,901 women ages 18 to 49. The survey was fielded from May 15 to June 18, 2024, and was developed and analyzed by KFF staff.

Read the three reports:

Abortion Experiences, Knowledge, and Attitudes Among Women in the U.S.: Findings from the 2024 KFF Women’s Health Survey

Women and Abortion in Florida: Findings from the 2024 KFF Women’s Health Survey 

Women and Abortion in Arizona: Findings from the 2024 KFF Women’s Health Survey 

Women and Abortion in Florida: Findings from the 2024 KFF Women’s Health Survey

Published: Aug 14, 2024

Findings

Key Takeaways

  • Nearly one in five (18%) reproductive age women in Florida say they have had an abortion. Similar shares of Republican (20%) and Democratic (19%) women report having an abortion.
  • One in ten (10%) reproductive age women in Florida know someone, including themselves, who has had difficulty getting an abortion since Roe v. Wade was overturned and over a third (34%) of women would not know where they could get an abortion or find the information if they wanted or needed one.
  • Six in ten women of reproductive age in Florida are concerned that they or someone close to them would not be able to get an abortion if it was needed to preserve their life or health (60%) and that abortion bans may affect the safety of a potential future pregnancy for themselves or someone close to them, such as a family or close friend (62%).
  • Two-thirds (65%) of reproductive age women in Florida have heard of medication abortion. Only one in five (18%) are aware it is still legal in their state and one in ten (9%) are aware they could access pills online if they wanted or needed them.
  • Nearly three in four (72%) reproductive age women in Florida think abortion should be legal in all or most cases, including the majority of Republican (51%) and Democratic (86%) women.
  • Two-thirds (67%) support a nationwide right to abortion, including large shares of Republican (49%) and Democratic (79%) women. Over half (57%) oppose a nationwide ban on abortion at 15 weeks and nearly seven in ten (69%) oppose leaving it up to the states to decide whether abortion is legal or not in each state. The majority of Republican (54%) and Democratic (79%) women oppose leaving it up to the states.

Introduction

Abortion is a key issue in the upcoming 2024 election and voters in up to 11 states across the U.S. may have an opportunity to vote on abortion-related ballot measures. On May 1, 2024, Florida’s 6-week abortion ban went into effect, limiting abortion before many women know they are pregnant and restricting access for women who were traveling to Florida to access abortion from across the South. This November, Florida voters will have an opportunity to vote on a citizen-initiated ballot measure that would protect the right to abortion up to viability (around 24 weeks of pregnancy) and when necessary, after that point to safeguard the pregnant person’s health.

This brief presents findings from the 2024 KFF Women’s Health Survey for 512 reproductive age women in Florida to provide state representative estimates of women’s experiences with and views on abortion among women in the state. The survey was fielded from May 13 to June 18, 2024, before Biden withdrew from the presidential race. While the survey asked about many topics related to women’s experiences around a broad set of health topics, this brief focuses on women’s experiences and knowledge around abortion in Florida. An analysis of the findings for women in the United States and also in Arizona are also available. See the methodology section for detailed definitions, sampling design, and margins of sampling error.

The findings in this brief are focused on a state-representative sample of 512 reproductive age (18-49 years old) women in Florida (Figure 1). Findings for White and Hispanic women are presented where there was a large enough share to report on with nearly a third (31%) of reproductive age women in Florida identifying as Hispanic and 45% as non-Hispanic White. Over four in ten (41%) reproductive age women in Florida have incomes below 200% of the federal poverty level (FPL), which is $29,160 in 2024. Nearly half (46%) of reproductive age women in Florida are Democrats or Democrat-leaning, while 35% are Republican or Republican-leaning, and 19% are independents. These demographics are similar to the U.S. demographics overall, aside from race/ethnicity, where 21% are Hispanic and 54% as non-Hispanic White.

Findings

Women’s Experiences with Abortion

Nearly one in five reproductive age women in Florida report they have ever had an abortion (Figure 2). Similar shares of women across income and party ID report having had an abortion. Smaller shares of women who identify as pro-life say they have had an abortion compared to women who identify as pro-choice.

Nearly One in Five Reproductive Age Women in Florida Report Having an Abortion

Among those who say they have wanted or needed an abortion, 14% say they were unable get one (3% among all reproductive age women). Among the reasons women cite for not getting an abortion include not being able to afford it, being too far along, not being in a position to care for a child and being pro-life or having religious reasons.

One in ten (10%) women in Florida know someone, including themselves, who has had difficulty getting an abortion since Roe v. Wade was overturned, similar to the U.S. share (8%) (Figure 3). Larger shares of Democratic women say they know someone, including themselves, who has had difficulty getting an abortion compared to Republican women (15% vs. 5%).

One in Ten Reproductive Age Women in Florida Personally Know Someone Who Has Had Difficulty Getting an Abortion Since Roe v. Wade was Overturned

When asked about ease or difficulty accessing abortion services in Florida, nearly half (48%) say abortion services are difficult to access, and another 42% say they don’t know (Figure 4). Larger shares of Democratic women (60%) and those who identify as pro-choice (59%) say it is difficult to access these services compared to Republican women (34%) and those who identify as pro-life (23%). When the survey was fielded, Florida had just instituted a 6-week LMP abortion ban after having a 15-week ban in place since 2022.

Nearly Half of Reproductive Age Women in Florida Say It Is Difficult to Get Abortion Services in Their State, But Many Don't Know

The majority of women in Florida are concerned about the impact of abortion restrictions on health and safety for themselves and loved ones. Florida currently limits abortions to 6-weeks of pregnancy with exceptions for life, physical health, rape/incest, and lethal fetal anomalies after that gestational limit. Six in ten reproductive age women in Florida say they are concerned (60%) they or someone close to them would not be able to get an abortion if it was needed to preserve their life or health, including a third (35%) who say they are very concerned (Figure 5). Nearly three in four Hispanic women (72%) and women who identify as pro-choice (75%), as well as eight in ten (81%) Democratic women are concerned.

Florida Amendment 4, the Right to Abortion InitiativeFlorida Amendment 4, a citizen-initiated ballot measure, will appear on the November 2024 ballot in Florida. Abortion access is currently limited to the first 6 weeks of pregnancy, but a “yes” vote in the election will support the establishment of a constitutional right to abortion before fetal viability (around 24 weeks of pregnancy) or when necessary to protect the patient’s health, as determined by the patient’s healthcare provider. It will need 60% of Florida voters to vote “yes” in order to pass.

Six in Ten Reproductive Age Women in Florida Are Concerned They or Someone Close to Them Would Not Be Able to Get an Abortion if It Was Needed to Preserve Their Life or Health

Nearly two-thirds (62%) of reproductive age women in Florida say they are concerned about the impact abortion bans may have on the safety of a potential future pregnancy for themselves or someone close to them (Figure 6). Seven in ten Hispanic women (71%), Democratic women (78%), and women who identify as pro-choice (76%) are concerned compared to 58% of White women, 44% of Republican women, and 29% of women who identify as pro-life.

Six in Ten Reproductive Age Women in Florida Are Concerned That Abortion Bans May Affect the Safety of a Potential Future Pregnancy for Themselves or Someone Close to Them

About one in five (19%) reproductive age women in Florida have changed their contraceptive practices as a result of the overturning Roe v. Wade. Women report either obtaining emergency contraception to have on hand, having a procedure for permanent birth control, switching to a more effective method of birth control, or starting using birth control since the overturning of Roe v. Wade (Figure 7). One in four (26%) reproductive age women with low incomes (below 200% of the FPL) report taking one of these actions, double the rate of women with higher incomes (13%) (data not shown). Women with low incomes report getting emergency contraception at more than twice the rate of women with higher incomes (11% vs. 4%) (data not shown).

Nearly One in Five Reproductive Age Women in Florida Have Changed Their Contraceptive Practices as a Result of the Overturning of Roe v. Wade

Awareness of Abortion Availability and Policy

Many women reproductive age women in Florida are unsure about the status of abortion availability in the state. When this survey was fielded, Florida’s 6-week LMP ban had recently taken effect. Four in ten women in Florida (40%) correctly describe the status of abortion in Florida as available but limited to earlier in pregnancy (Figure 8). Nearly a quarter (24%) of women describe abortion as generally unavailable, with few exceptions, which for many is an accurate description of a 6-week ban. Another three in ten (29%) are not sure of the status of abortion in Florida and 7% incorrectly respond that abortion is available with few or no restrictions. About four in ten women with lower incomes (39%) and women who identify as pro-life (38%) are not sure of the status of abortion in Florida compared to 17% of women with higher incomes and 25% of women who identify as pro-life.

Over One in Four Reproductive Age Women in Florida Are Not Sure About the Status of Abortion Restrictions in Their State

A third (34%) of reproductive age women in Florida say they would not know where they could get an abortion nor where to find the information about getting one if they wanted or needed an abortion in the near future (Figure 9). Websites like Plan C , AbortionFinder  and ineedana.com, identify the nearest online and bricks-and-mortar abortion providers, as well as funding assistance. These websites also identify how people can find medication abortion pills online.

A Third of Reproductive Age Women in Florida Say That If They Wanted or Needed an Abortion In the Near Future, They Do Not Know Where They Could Get One and Wouldn't Know Where to Find That Information

Two-thirds (65%) of women of reproductive age in Florida have heard of medication abortion, with awareness highest among White women, those with higher incomes and Democrats (Figure 10). The overall share of reproductive age women in Florida who have heard of medication abortion is similar to the overall share across the U.S (67%).

Two-Thirds of Reproductive Age Women in Florida Have Heard of Medication Abortion, but Knowledge Is Lower Among Hispanic and Low Income Women

Although medication abortion is a legal option in Florida for abortions up to six weeks of pregnancy, only one in five (18%) reproductive age women are aware that it is the case. A larger share of women who identify as pro-choice are aware compared to women who identify as pro-life (21% vs. 14%) (Figure 11).

Only One in Five Reproductive Age Women in Florida Are Aware of the Legal Status of Medication Abortion in Their State

Few are aware of the availability of medication abortion pills online. In Florida, medication abortion is permitted up to six weeks of pregnancy, but only from an in-person clinic. The law that bans abortions after six weeks of pregnancy also prohibits providers from using telehealth to offer abortion services, requiring that physicians dispense medication abortion pills to their patients in person. There are websites, however, such as Plan C, ineedana, or AbortionFinder, that provide information for people seeking to buy medication abortion pills online and have them sent to Florida. However, awareness of these online services is low. Only one in ten (9%) reproductive age women in Florida are aware that someone could get medication abortion pills online if they wanted or needed them (Figure 12). Awareness is similarly low across age, race/ethnicity, income, party ID, and people’s views on abortion.

Only One in Ten Reproductive Age Women in Florida Are Are Aware That Someone in Their State Can Get Medication Abortion Pills Online if They Wanted or Needed Them

Opinions on Abortion Policy

Seven in ten (72%) of reproductive age women living in Florida think abortion should be legal in all or most cases (Figure 13). Notably, half of reproductive age women who are Republican in the state say they believe abortion should be legal in most or all cases. Even among women who say they are “pro-life, one in four believe abortion should be legal in most cases. Nearly three in four women who identify as pro-life (73%), and half (48%) of Republican women think abortion should be illegal in all or most cases.

Seven in Ten Reproductive Age Women in Florida Think Abortion Should Be Legal in All or Most Cases

Since the Supreme Court’s Dobbs decision, there have been calls to establish a nationwide right to abortion, which is supported by two-thirds of reproductive age women in Florida. Not surprisingly, higher shares of Democratic women in Florida support a national guarantee of abortion rights compared to Republican women (79% vs. 49%) and larger shares of women who identify as pro-choice compared to pro-life (83% vs. 30%) (Figure 14). The majority of Hispanic and White women in Florida, as well as women across incomes, support a law guaranteeing a nationwide right to abortion.

Two-Thirds of Reproductive Age Women in Florida Support a Law Guaranteeing a Nationwide Right to Abortion

Support for a nationwide ban on abortion at 15 weeks is weak in Florida. Early in the campaign, Former President Trump said he would consider supporting a national 15 or 16-week ban on abortion, but more recently has said he supports leaving abortion policy to states, which allows full bans and gestational restrictions to stay in effect. While a higher share of Republican women (60%) and women who identify as pro-life (68%) would support it, over half (57%) of reproductive age women in Florida oppose a law establishing a nationwide ban on abortion at 15 weeks (Figure 15).

Over Half of Reproductive Age Women in Florida Oppose A Law Establishing a Nationwide Ban on Abortion at 15 Weeks

Over two-thirds (69%) of women in Florida oppose leaving it up to the states to decide the legality of abortion, a policy that has been supported by former President Donald Trump (Figure 16). This policy, however, is somewhat or strongly supported by 54% of reproductive age Republican women. Larger shares of women who identify as pro-life support leaving it up to the states compared to women who identify as pro-choice (57% vs. 19%).

Over Two-Thirds of Reproductive Age Women in Florida Oppose Leaving It up to the States to Decide Whether Abortion Is Legal or Not in Each State

After six months of living with a highly restrictive abortion law that limits abortion access to the first six weeks of pregnancy, voters will have an opportunity to cast a vote regarding whether the right to abortion up to viability will be enshrined in their state constitution. If the amendment gets the support of 60 percent of voters, it will reverse the current 6-week ban and protect abortion rights until the point of viability, considered to be about 24 weeks.

Methodology

The 2024 KFF Women’s Health Survey was designed and analyzed by women’s health researchers at KFF. The survey was conducted from May 13 – June 18, 2024, online and by telephone among a nationally representative sample of 6,246 adults ages 18 to 64, including 3,901 women ages 18 to 49. Women include anyone who selected woman as their gender (n = 3,867) or who said they were non-binary (n = 26), transgender (n = 4), or another gender (n = 3) and chose to answer the female set of questions with regard to sexual and reproductive health. The project includes oversamples of women ages 18 to 49 in Arizona (n = 298) and Florida (n = 512). Sampling, data collection, weighting, tabulation, and IRB approval by the University of Southern Maine’s Collaborative Institutional Review Board were managed by SSRS of Glenn Mills, Pennsylvania in collaboration with women’s health researchers at KFF.

Throughout the reports of findings, we refer to “women”. This includes respondents who said their gender is “woman,” plus those who said their gender is “transgender,” or “non-binary,” or another gender and that they prefer to answer the survey’s set of questions for females. We followed this approach to try to include as many people as possible but recognize that some people who need and seek abortion and other reproductive health care services may not be represented in the findings or identify as women.

The national sample as well as the samples in Arizona and Florida were drawn from two nationally representative probability-based panels: the SSRS Opinion Panel and the Ipsos KnowledgePanel. The SSRS Opinion Panel is a nationally representative probability-based panel where panel members are recruited randomly in one of two ways: (a) Through invitations mailed to respondents randomly sampled from an Address-Based Sample (ABS) provided by Marketing Systems Groups (MSG) through the U.S. Postal Service’s Computerized Delivery Sequence (CDS); (b) from a dual-frame random digit dial (RDD) sample provided by MSG. For the online panel component, invitations were sent to panel members by email followed by up to five reminder emails. 5,276 panel members completed the survey online and panel members who do not use the internet were reached by phone (175). Another 970 respondents were reached online through the Ipsos Knowledge Panel to help reach adequate sample sizes among subgroups of interest, specifically women ages 18 to 49. This panel is recruited using ABS, based on a stratified sample from the CDS. The questionnaire was translated into Spanish, so respondents were able to complete the survey in English or Spanish.

The national sample was weighted by splitting the sample into three groups: [1] Women 18-49, [2] Women 50-64, and [3] Men 18-64 and each group was separately weighted to match known population parameters (see table below for weighting variables and sources). Weights within the three groups were then trimmed at the 4th and 96th percentiles, to ensure that individual respondents do not have too much influence on survey-derived estimates. After the weights were trimmed, the samples were combined, and the weights adjusted, so that the groups were represented in their proper proportions for a final combined, gender by age-adjusted weight. Lastly, two additional weights for interviews among women 18-49 in Arizona and Florida were calculated for analyses among those specific sub-groups. Each of the state-specific weights were trimmed at the 2nd and 98th percentiles, to ensure that individual respondents do not have too much influence on survey-derived estimates.

DimensionsSource
AgeCPS 2023 ASEC
Education
Age by Education
Age by Gender
Census Region
Race/Ethnicity by Nativity
Home Tenure
Civic EngagementCPS 2021 Volunteering & Civic Engagement Supplement
Internet FrequencySSRS Opinion Panel Database 2024
Population DensityACS 206-2020 5-year data
NEP RegionsCensus Planning Database 2022
Voter RegistrationCPS 2022 Voting & Registration Supplement

The margins of sampling error for the national sample of reproductive age women, Arizona reproductive age women, and Florida reproductive age women are plus or minus 2 percentage points, 8 percentage points, and 6 percentage points respectively. Numbers of respondents and margins of sampling error for key subgroups are shown in the table below. For results based on other subgroups, the margin of sampling error may be higher. Sampling error is only one of many potential sources of error and there may be other unmeasured error in this survey.

 GroupN (unweighted)M.O.S.E.
National Women Ages 18-493901± 2 percentage points
White, non-Hispanic1856± 3 percentage points
Black, non-Hispanic603± 5 percentage points
Hispanic963± 4 percentage points
Asian286± 7 percentage points
<200% FPL1667± 3 percentage points
200%+ FPL1974± 3 percentage points
Pro-life1074± 4 percentage points
Pro-choice2815± 2 percentage points
Republican/Republican-leaning1076± 4 percentage points
Democrat/Democrat-leaning1803± 3 percentage points
Urban/Suburban3379± 2 percentage points
Rural473± 6 percentage points
Lives in a state where abortion is banned857± 4 percentage points
Lives in a state where abortion has gestational limits 6-12 weeks819± 5 percentage points
Lives in a state where abortion has gestational limits 15-22 weeks594± 6 percentage points
Lives in a state where gestational limited are 24+ weeks or none1631± 3 percentage points
Arizona Women Ages 18-49298± 8 percentage points
<200% FPL121± 12 percentage points
200%+ FPL162± 10 percentage points
Florida Women Ages 18-49512± 6 percentage points
White, non-Hispanic229± 9 percentage points
Hispanic155± 11 percentage points
<200% FPL182± 10 percentage points
200%+ FPL297± 8 percentage points
Pro-life143± 12 percentage points
Pro-choice366± 7 percentage points
Republican/Republican-leaning169± 11 percentage points
Democrat/Democrat-leaning231± 9 percentage points


Abortion Experiences, Knowledge, and Attitudes Among Women in the U.S.: Findings from the 2024 KFF Women’s Health Survey

Published: Aug 14, 2024

Findings

Key Takeaways

  • Among women of reproductive age, one in seven (14%) have had an abortion at some point in their life. Larger shares of Black (21%) and Hispanic (19%) women report having had an abortion compared to 11% of White women. Across partisanship, similar shares of Republican women, Democratic women, and independents report having had an abortion.
  • Nearly one in ten (8%) women of reproductive age personally know someone who has had difficulty getting an abortion since Roe v. Wade was overturned, including 11% of Hispanic women and 13% of women living in states with abortion bans.
  • Among women of reproductive age who report knowing someone personally who has had difficulty getting an abortion since Roe v. Wade was overturned, many say they had to travel out of state for care (68%), did not know where to go (40%), and/or did not have the money to cover the cost (35%).
  • More than six in ten women of reproductive age are concerned that they, or someone close to them, would not be able to get an abortion if it was needed to preserve their life or health (63%) and that abortion bans may affect the safety of a potential future pregnancy for themselves or someone close to them (64%).
  • Less than half of reproductive age women in the United States are aware of the current status of abortion policy in their state (45%). Nearly a quarter describe the status incorrectly (23%) and a third are unsure about the status of abortion in their state (32%).
  • One in four (26%) reproductive age women say if they needed or wanted an abortion they would not know where to go nor where to find information.
  • Nearly one in five women (17%) of reproductive age report they have changed their contraceptive practices as a result of Roe being overturned. Actions taken include starting birth control, getting a sterilization procedure, switching to a more effective method, or purchasing emergency contraceptive pills to have on hand.
  • While two-thirds of women have heard about medication abortion pills, only 19% of women say people in their state can get medication abortion pills online.
  • Three in four reproductive age women in the United States think abortion should be legal in most or all cases (74%). The majority support a nationwide right to abortion (70%), oppose a nationwide abortion ban at 15 weeks (64%), and oppose leaving it up to the states to determine the legality of abortion (74%). This is the case for the majority of women who are Democrats and independents as well as smaller but still substantial shares of Republicans.

Introduction

In the two years since the Dobbs decision, which overturned Roe and eliminated the federal standards that had protected the right to abortion for almost 50 years, the abortion landscape in the United States has drastically changed. Abortion is banned in 14 states and an additional six states have implemented early gestational limits between 6 and 15 weeks.

Abortion will likely be a key issue in the upcoming 2024 election. The Democratic and Republican parties have starkly different visions of what access to abortion in the U.S. should look like. Vice President and Democratic Nominee Kamala Harris has been an outspoken advocate of abortion rights and has thrown her support behind efforts to restore Roe v. Wade’s abortion standards in all states. Former President Donald Trump endorses leaving abortion policy up to states, allowing full bans to stay in effect, although he has also previously said he would consider a 15 or 16-week national ban on abortion. At the state level, voters in up to 11 states will vote on abortion-related ballot initiatives that will shape access to abortion in their states.

This brief provides new information about women’s experiences with abortion, the fallout of overturning Roe v. Wade, women’s knowledge about abortion laws in their states including medication abortion, as well as their opinions on the legality of abortion. The 2024 KFF Women’s Health Survey was fielded from May 15 to June 18, 2024, before President Biden withdrew from the 2024 Presidential race, and was developed and analyzed by KFF staff. It is a nationally representative survey of 5,055 women and 1,191 men ages 18 to 64, and the findings in this brief are based on a sample of 3,901 women ages 18 to 49. See the methodology section for detailed definitions, sampling design, and margins of sampling error.

Findings

Women’s Experiences With Abortion

Among women of reproductive age, one in seven (14%) report having had an abortion at some point in their life. Larger shares of Black (21%) and Hispanic (19%) women report having had an abortion compared to 11% of White women (Figure 1). A higher share of women with lower incomes had an abortion (17%) compared to women with higher incomes (13%).

Smaller shares of women living in rural areas report having had an abortion compared to those living in urban/suburban areas (7% vs. 15%, respectively). Many rural women face long travel distances to access abortion services.

Similar shares of Republican women (12%), independent women (15%), and Democratic women (14%) say they have had an abortion. Throughout this brief, partisans include independents who lean to either party, while independents are individuals who say they do not lean toward either political party. Nearly one in 10 women (8%) who currently identify as pro-life say they have had an abortion compared to almost one in five (17%) who currently identify as pro-choice.

Smaller shares of women living in states with abortion bans or gestational limits between 15 and 22 weeks have had an abortion compared to women living in states with gestational limits at or after 24 weeks or without any gestational limits. Even before the Dobbs decision, abortion access was very limited in many of the states that currently ban abortion or have gestational limits before viability. Most of these states had laws restricting access to abortion, including waiting periods, counseling and ultrasound requirements, and insurance coverage restrictions which resulted in the closure of many abortion clinics in the years preceding the Dobbs decision.

Among Women of Reproductive Age, One in Seven Report They Have Had An Abortion

Among women who say they have ever wanted or needed an abortion, 15% (2% of all reproductive age women) report that at some point in their lives, they have wanted or needed an abortion that they did not get (Figure 2). A larger share of Black women (24%) (5% of all Black women of reproductive age) who have ever been pregnant and have wanted or needed an abortion report that they have wanted or needed an abortion they did not get compared to White women (12%) (1% of all White women of reproductive age). When asked why they did not get a wanted or needed abortion, a third (33%) report access and affordability issues, with affordability issues making up the majority of the category. One in five women also identify religious, moral, or societal pressures as the reason why they did not get the abortion, and another 16% say they changed their mind or couldn’t go through with the abortion. One in 10 women say they were too far along to end the pregnancy. Among the women who report ever wanting or needing an abortion they did not get, 31% say they had an abortion at some other time (data not shown).

Over a Third of Women Who Wanted or Needed an Abortion They Did Not Get Identify Access and Affordability as the Reason

In their own words: There are many reasons why someone may not get an abortion. What was the reason you did not get the abortion(s)?

“Unable to afford the procedure and would be reaching [the] point where it would be too late to complete if able.”

“Was a day over the amount of days in order to have an abortion. I waited too long to get it.”

“Changed my mind. Decided to keep the baby but was initially scared and unsure of what to do.”

“I decided I wanted to keep and raise my child despite societal pressures that would advise against it (I was a minor).”

“My family made me feel like I couldn’t and I was scared so I followed through with my pregnancy.”

“I was intimidated by the child’s father showing up at the clinic.”

“I could not afford to go out of state and had no way out of [the] state.”

“Ended up miscarrying before proceeding with appointment.”

“I was too far along in the pregnancy when I found out I was pregnant”

“Religious reasons. We are Catholic and it’s not an option for us.”

“The service wasn’t easily accessible to me, and my partner’s family pressured me into having the child.”

“Guilt, moral compass”

“Nurse convinced me not to get it.”

“I could not afford it at the time and unsure if I really wanted to do it.”

“Family pressure, difficulty finding a place to perform an abortion.”

“I lived an hour and a half from the location and my ride didn’t show up.”

The Impact of Overturning Roe

Two years after the Supreme Court overturned the constitutional right to abortion, 14 states have banned abortion, and 11 states have implemented gestational restrictions between 6 and 22 weeks LMP (last menstrual period). Nationally, 8% of reproductive age women say they personally know someone, including themselves, who has had difficulty getting abortion care since Roe was overturned due to the restrictions in their state (Figure 3). Larger shares of Hispanic women (11%) than White women (8%) report knowing someone who has experienced difficulty getting an abortion. Similarly, larger shares of women living in states with abortion bans (13%) and women living in states with gestational limits between 6 and 12 weeks (11%) report knowing someone who has experienced difficulty compared to women living in states with gestational limits at or after 24 weeks or without gestational limits (6%). Even in states with few abortion restrictions, access to abortion services can be limited by lack of providers, poor coverage, and other factors.

Nearly One in 10 Women of Reproductive Age Know Someone Who Has Had Difficulty Getting an Abortion Since  Roe v. Wade Was Overturned

Among those who say they know someone (including themselves) who had difficulty getting abortion care since Roe was overturned, the majority report they (or the person they knew) had to travel out of state (68%) (Figure 4). Women with higher incomes who say they or someone they know had difficulty accessing abortion care are more likely to report that they or the person they know had to travel out of state compared to women with lower incomes (75% vs. 62%). Many abortion patients living in states with abortion bans or restrictions have to travel to neighboring states to get abortion care, while others may need to travel farther.

Among women who say they or someone they know had difficulty accessing abortion, four in ten women say they or a person they know did not know where to go when trying to get an abortion (40%), three in ten women say they could not afford the cost (35%), and nearly three in ten say they had to take time off work (28%).

Since Roe was Overturned, Travel, Cost, and Lack of Knowledge About Where to Go are Leading Reasons for Difficulty in Getting an Abortion

When asked about women’s ability to get abortion services in their state, more than half of women residing in states with abortion bans (57%) and over four in ten women in states with gestational limits say it is difficult to access abortion care in their state (Figure 5). Notably, one in five (21%) women residing in states with gestational limits at or after 24 weeks or without gestational limits say it is difficult to get abortion services in their state. While abortion may not be restricted, limitations on Medicaid and insurance coverage of abortion, the scarcity of abortion providers in rural communities, stigma, and other factors (such as the need to take time off from work and childcare costs) are still barriers to abortion.

Nationally, Over One Third of Women Say It Is Difficult to Get Abortion Services in Their State

Over six in ten reproductive age women in the U.S. (63%) are concerned that they or someone close to them would not be able to get an abortion if it was needed to preserve their life or health (Figure 6). While all states with abortion bans and abortion restrictions have an exception in their law to “prevent the death” or “preserve the life” of the pregnant person, six states with abortion bans or early gestational restrictions do not have health exceptions. In general, health exceptions have often proven to be unworkable except in the most extreme circumstances. The abortion policies in these states are generally unclear about how ill or close to death a pregnant person would have to be to qualify for the exception.

With the exception of Republican women, a majority of reproductive age women in all subgroups report that they are very or somewhat concerned about access to abortion if it was needed to preserve their life or health. Larger shares of Asian or Pacific Islander women (75%) than White women (61%) are concerned, and smaller shares of women residing in rural areas (52%) are concerned compared to those residing in urban/suburban areas (65%). Compared to Democratic women (78%), smaller shares of women who identify as independent (61%) are concerned that they or someone close to them would not be able to get an abortion if it was needed to preserve their life or health; however, less than half of Republican women report being somewhat or very concerned (41%).

More Than Six in Ten Reproductive Age Women Are Concerned That They or Someone Close to Them Would Not Be Able to Get an Abortion if it Was Needed to Preserve Their Life or Health

Similarly, over 6 in 10 (64%) reproductive age women say they are concerned that abortion bans may affect the safety of a potential future pregnancy for themselves or someone close to them (Figure 7). Across most subgroups—except across party affiliation— majorities of women say that they are somewhat or very concerned. Four in ten (39%) Republican women say they are concerned about the impact of abortion bans on the safety of potential pregnancies for themselves or someone close to them, compared to almost eight in 10 Democratic women and six in 10 independent women.

More Than Six in Ten Reproductive Age Women Are Concerned That Abortion Bans May Affect the Safety of a Future Pregnancy for Themselves or Someone Close to Them

Nearly one in five women (17%) of reproductive age report they have changed their contraceptive practices as a result of Roe being overturned. Larger shares of Asian or Pacific Islander, Black, and Hispanic women report they started to use birth control (9%, 10%, and 7%, respectively) compared to White women (3%) (Table 1). A higher share of Asian or Pacific Islander women report that they have switched to a more effective method of birth control compared to White women (6% vs. 3%), and 7% of Hispanic women report that they have gotten emergency contraception to have on hand compared to 4% of White women.

Nearly One in Five Women Report That They Have Changed Their Contraceptive Practices as a Result of the Overturn of Roe

Awareness of Abortion Availability and Policy

Nationally, most women of reproductive age are unaware of the status of abortion legality in the state they live in. While 45% can correctly describe the status of abortion in their state, 23% of reproductive age women could not answer correctly and another third (33%) say they are not sure (Figure 8). Awareness is highest among women who live in states where abortion is fully banned (51%) or in states with gestational limits at or after 24 weeks or without bans (47%). Smaller shares of women living in states with gestational limits at 15 to 22 weeks (33%) and limits at 6 to 12 weeks (38%) are aware of the status of abortion in their state. Consistently across state abortion groupings, about a third of women say they are not sure on the status of abortion in their state.

Only 4 in 10 Women Correctly Describe the Status of Abortion in The State They Live

One in four (26%) women of reproductive age in the U.S. report that if they needed or wanted an abortion in the near future they would not know where to go or where to find the information (Figure 9). A quarter of women say they would know where to go for an abortion and half (49%) say they would not know where to go, but would know where to find that information. Since the Dobbs decision, websites like abortionfinder.org and ineedana.com provide individuals seeking abortion services with directories of abortion clinics and services that provide medication abortion via telehealth.

Over a third of Hispanic women (37%) and a third of Black women (33%) report that if they wanted or needed an abortion in the near future, they wouldn’t know where to find information compared to 23% of White women. More women with lower incomes (37%) and women living in rural areas (35%) report they wouldn’t know where to go or find that information compared to women with higher incomes (19%) and women living in urban/suburban areas (25%). Over four in 10 (43%) women living in states where abortion is banned say they wouldn’t know where to find information compared to 17% of women in states with gestational limits at or after 24 weeks or without gestational limits. Women living in banned states seeking abortion services must either travel out of state or obtain medication abortion drugs from companies that will ship pills without requiring a clinician visit or from clinicians practicing in states with shield-laws, which offer clinicians a measure of legal protection from attempts by law authorities in abortion ban states to enforce bans in states that support abortion access.

A Quarter of Women Say They Wouldn't Know Where to Get an Abortion or Where to Find the Information if They Needed an Abortion in the Near Future

In the United States, medication abortion is the most common abortion method. It involves taking two different medications, mifepristone and misoprostol, and it has been approved by the FDA to end pregnancies up to 10 weeks gestation. Two-thirds (67%) of women of reproductive age report that they have heard about medication abortion (Figure 10). While still majorities, relatively smaller shares of Asian or Pacific Islander (62%), Black (64%), and Hispanic (59%) women report having heard about medication abortion compared to White women (72%). Similarly, smaller shares of women with lower incomes (60%) have heard about medication abortion compared to women with higher incomes (74%). Compared to women who identify as pro-choice (72%) and women who are Democrats (77%), smaller shares of women who identify as pro-life (56%) or are Republican/Republican leaning (62%) or independents (60%) report hearing of medication abortion.

Most Reproductive Age Women Have Heard of Medication Abortion

The majority of women are unsure of the legal status of abortion in their state. While neither mifepristone nor misoprostol are explicitly banned in any state and the drugs can still be used for miscarriage management treatment, their use for abortion is banned in the 14 states with abortion bans. Medication abortion, for the purposes of abortion, is legal in all states with gestational restrictions as well as states without any limits, but is not legal to use for abortion after the state’s gestational limit (for example, after 6 weeks LMP in Iowa, Florida, Georgia, and South Carolina).

The majority of women of reproductive age are unclear about the legal status of medication abortion in their state, regardless of the legal status of abortion in their state (Figure 11). A larger share of women living in states with gestational limits at 24 weeks or without gestational limits (43%) report that medication abortion is legal in their state compared to women living in states with gestational limits between 6 to 12 weeks (19%) and gestational limits between 15 to 22 weeks (18%). Among women living in states where abortion is banned, 6% say medication abortion is legal in their state and 27% say it is illegal. Regardless of the status of abortion in their state of residence, majorities of women of reproductive age are not aware of the legal status of medication abortion in their state or have never heard of medication abortion.

Regardless of Abortion Legality in Their State, the Majority of Women of Reproductive Age Are Unclear of the Legal Status of Medication Abortion

Overall, only one in five (19%) women of reproductive age are aware that medication abortion pills are available online. Since state abortion bans and restrictions have gone into effect, new online services have been created that sell medication abortion pills through online organizations. Among women of reproductive age, 10% say individuals in their state cannot get medication abortion pills online and about three-quarter (71%) were unsure or had never heard of medication abortion (Figure 12). Small shares of women living in states where abortion is banned or states with gestational limits know that people in their states can get medication abortion pills online compared to women living in states without any gestational limits or limits after 24 weeks.

Only One in Five Women are Aware that People in Their State Can Get Medication Abortion Pills Online

Opinions on Abortion Policy

Three in four (75%) women of reproductive age in the United States, the age group that is most directly impacted by state abortion policies, think that abortion should be legal in most or all cases—38% say legal in all cases and 37% legal in most cases. Only 8% of women say that abortion should be illegal in all cases. This trend is consistent with prior polls which have found that the majority of Americans believe that abortion should be legal.

Across various subgroups, except those who identify as Republican or pro-life, majorities of reproductive age women think abortion should be legal in all or most cases. Among those ages 18 to 49, over eight in 10 Black women (83%) and Asian or Pacific Islander women (83%), and almost three-quarters of Hispanic women (73%) and White women (72%) think abortion should be legal (Figure 13). In contrast, slightly less than half (48%) of Republican women of reproductive age think abortion should be legal, 36% say abortion should be illegal in most cases and 17% say abortion should be illegal in all cases. Not surprisingly, among women who identify as pro-life, 74% say that abortion should be illegal in all or most cases, but one in four (25%) believe that abortion should be legal in all or most cases.

Three Quarters of Reproductive Age Women Think Abortion Should Be Legal in Most or All Cases

Seven in ten reproductive age women (70%) support a law guaranteeing a federal right to abortion, with half (50%) saying they strongly support this (Figure 17). While similar shares of Asian, Black, Hispanic, and White reproductive age women support a nationwide right to abortion, support varies widely by income, urbanicity, and party affiliation (Figure 14). Though still a majority, smaller shares of reproductive age women with lower incomes (64%) and women who live in rural communities (62%) support a nationwide right to abortion compared to their urban/suburban (71%) and higher income counterparts (74%). Support is strongest among Democratic (84%) women, but two thirds (64%) of women who identify as independents and nearly half of Republican women (48%) strongly or somewhat support establishing a federal right to abortion. More than three times as many Democrats (71%) than Republicans (22%) strongly support a law that would guarantee this right.

More than half of all women of reproductive age support a law establishing a nationwide right to abortion, regardless of the abortion status in their state of residence. While there are smaller shares of support among women who reside in states with bans and gestational limits before viability, over four in 10 women in these states strongly support a law guaranteeing a federal right to abortion.

Majority of Women Ages 18 to 49 in the U.S. Support a Law Establishing a Nationwide Right to Abortion

On the issue of abortion, former President Trump has previously said he would consider a national ban at 15 or 16 weeks, a position also proposed by other Republican elected officials. Overall, six in ten women of reproductive age (63%) oppose a law that would establish a nationwide ban on abortion at 15 weeks (Figure 15). While still a majority, smaller shares of those with lower incomes (58%) and those who reside in rural areas (55%) oppose a national abortion ban at 15 weeks. Six in ten women in states with abortion bans and gestational limits before viability oppose a national ban on abortion at 15 weeks.

Majority of Women Oppose A Law Establishing a Nationwide Ban on Abortion at 15 Weeks

Most recently, former President Trump announced he supports leaving abortion policy up to the individual states, allowing the current bans and restrictions to stay in effect across half the country. Overall, nearly three in four women of reproductive age (74%) oppose this approach (Figure 16). Similar shares of Asian (72%), Black (75%), Hispanic (75%), and White (72%) reproductive age women oppose leaving abortion policy up to the states. Compared to their counterparts, larger shares of women with higher incomes (76%) and those who live in urban/suburban communities (74%) oppose having states decide whether abortion should be legal or illegal in their states.

At least half of all women oppose this approach regardless of party affiliation, but opposition is highest among Democratic women (88%). While there is slight variation in support/opposition by abortion status in a woman’s state of residence, over two thirds of those in states with abortion bans and gestational limits oppose leaving the legality of abortion up to individual states.

Nearly Three in Four Women Oppose Leaving It Up to the States to Determine the Legality of Abortion

Appendix

Characteristics of Survey Respondents

Methodology

The 2024 KFF Women’s Health Survey was designed and analyzed by women’s health researchers at KFF. The survey was conducted from May 13 – June 18, 2024, online and by telephone among a nationally representative sample of 6,246 adults ages 18 to 64, including 3,901 women ages 18 to 49. Women include anyone who selected woman as their gender (n = 3,867) or who said they were non-binary (n = 26), transgender (n = 4), or another gender (n = 3) and chose to answer the female set of questions with regard to sexual and reproductive health. The project includes oversamples of women ages 18 to 49 in Arizona (n = 298) and Florida (n = 512). Sampling, data collection, weighting, tabulation, and IRB approval by the University of Southern Maine’s Collaborative Institutional Review Board were managed by SSRS of Glenn Mills, Pennsylvania in collaboration with women’s health researchers at KFF.

Throughout the reports of findings, we refer to “women”. This includes respondents who said their gender is “woman,” plus those who said their gender is “transgender,” or “non-binary,” or another gender and that they prefer to answer the survey’s set of questions for females. We followed this approach to try to include as many people as possible but recognize that some people who need and seek abortion and other reproductive health care services may not be represented in the findings or identify as women.

The national sample as well as the samples in Arizona and Florida were drawn from two nationally representative probability-based panels: the SSRS Opinion Panel and the Ipsos KnowledgePanel. The SSRS Opinion Panel is a nationally representative probability-based panel where panel members are recruited randomly in one of two ways: (a) Through invitations mailed to respondents randomly sampled from an Address-Based Sample (ABS) provided by Marketing Systems Groups (MSG) through the U.S. Postal Service’s Computerized Delivery Sequence (CDS); (b) from a dual-frame random digit dial (RDD) sample provided by MSG. For the online panel component, invitations were sent to panel members by email followed by up to five reminder emails. 5,276 panel members completed the survey online and panel members who do not use the internet were reached by phone (175). Another 970 respondents were reached online through the Ipsos Knowledge Panel to help reach adequate sample sizes among subgroups of interest, specifically women ages 18 to 49. This panel is recruited using ABS, based on a stratified sample from the CDS. The questionnaire was translated into Spanish, so respondents were able to complete the survey in English or Spanish.

The national sample was weighted by splitting the sample into three groups: [1] Women 18-49, [2] Women 50-64, and [3] Men 18-64 and each group was separately weighted to match known population parameters (see table below for weighting variables and sources). Weights within the three groups were then trimmed at the 4th and 96th percentiles, to ensure that individual respondents do not have too much influence on survey-derived estimates. After the weights were trimmed, the samples were combined, and the weights adjusted, so that the groups were represented in their proper proportions for a final combined, gender by age-adjusted weight. Lastly, two additional weights for interviews among women 18-49 in Arizona and Florida were calculated for analyses among those specific sub-groups. Each of the state-specific weights were trimmed at the 2nd and 98th percentiles, to ensure that individual respondents do not have too much influence on survey-derived estimates.

DimensionsSource
AgeCPS 2023 ASEC
Education
Age by Education
Age by Gender
Census Region
Race/Ethnicity by Nativity
Home Tenure
Civic EngagementCPS 2021 Volunteering & Civic Engagement Supplement
Internet FrequencySSRS Opinion Panel Database 2024
Population DensityACS 206-2020 5-year data
NEP RegionsCensus Planning Database 2022
Voter RegistrationCPS 2022 Voting & Registration Supplement

The margins of sampling error for the national sample of reproductive age women, Arizona reproductive age women, and Florida reproductive age women are plus or minus 2 percentage points, 8 percentage points, and 6 percentage points respectively. Numbers of respondents and margins of sampling error for key subgroups are shown in the table below. For results based on other subgroups, the margin of sampling error may be higher. Sampling error is only one of many potential sources of error and there may be other unmeasured error in this survey.

 GroupN (unweighted)M.O.S.E.
National Women Ages 18-493901± 2 percentage points
White, non-Hispanic1856± 3 percentage points
Black, non-Hispanic603± 5 percentage points
Hispanic963± 4 percentage points
Asian286± 7 percentage points
<200% FPL1667± 3 percentage points
200%+ FPL1974± 3 percentage points
Pro-life1074± 4 percentage points
Pro-choice2815± 2 percentage points
Republican/Republican-leaning1076± 4 percentage points
Democrat/Democrat-leaning1803± 3 percentage points
Urban/Suburban3379± 2 percentage points
Rural473± 6 percentage points
Lives in a state where abortion is banned857± 4 percentage points
Lives in a state where abortion has gestational limits 6-12 weeks819± 5 percentage points
Lives in a state where abortion has gestational limits 15-22 weeks594± 6 percentage points
Lives in a state where gestational limited are 24+ weeks or none1631± 3 percentage points
Arizona Women Ages 18-49298± 8 percentage points
<200% FPL121± 12 percentage points
200%+ FPL162± 10 percentage points
Florida Women Ages 18-49512± 6 percentage points
White, non-Hispanic229± 9 percentage points
Hispanic155± 11 percentage points
<200% FPL182± 10 percentage points
200%+ FPL297± 8 percentage points
Pro-life143± 12 percentage points
Pro-choice366± 7 percentage points
Republican/Republican-leaning169± 11 percentage points
Democrat/Democrat-leaning231± 9 percentage points


Women and Abortion in Arizona: Findings from the 2024 KFF Women’s Health Survey

Published: Aug 14, 2024

Findings

Key Takeaways

  • Among women ages 18 to 49 in Arizona, 15% say they have had an abortion at some point in their lives.
  • Women in Arizona are concerned about the impact of abortion restrictions on health and safety. Over six in ten (64%) are very or somewhat concerned that a ban may affect the safety of a potential future pregnancy for them or someone close to them, and 69% express concern that they or someone close to them would not be able to obtain an abortion if it was needed to preserve their life or health.
  • Awareness of abortion availability is limited among reproductive age women in Arizona. Nearly six in ten (58%) have heard of medication abortion, but just over one in ten are aware that it is legal in the state and can be obtained online.
  • Women with lower incomes in Arizona, who are disproportionately affected by restrictions on abortion, have lower awareness about abortion access in their state and greater concerns about pregnancy safety.
  • Substantial majorities of reproductive age women in Arizona think abortion should be legal in all or most cases (70%), support a nationwide right to abortion (66%), and oppose leaving abortion policy to the states (67%).

Introduction

Many people across the nation are watching the state of Arizona in the 2024 election. Arizona is considered a swing state in the Presidential contest between Democratic nominee Vice President Kamala Harris and former President Donald Trump, the Republican nominee. President Biden won the state in 2020 with a narrow <1% margin. Vice President Harris has been outspoken in support of abortion access in all states and is expected to campaign heavily on the topic, while former President Trump claims credit for appointing Supreme Court justices that overturned Roe v. Wade, allowing states to ban abortion completely and restrict it before fetal viability. This year, the state also has a widely watched Senate race that could tip the very slim margin the Democrats currently hold in the Senate, another important factor in abortion access, as the next President is likely to nominate multiple federal judges and possibly at least one Supreme Court justice.

The election comes at the end of a tumultuous year in Arizona, during which the state’s Supreme Court decided to reinstate a law from the Civil War era that would have outlawed all abortions with nearly no exceptions. After much public outrage at the ruling and debate within the state, the legislature passed a bill repealing the 1864 law which the governor signed, effectively nulling the state Supreme court decision. The status quo remains in place, and currently, abortion is legal up to 15 weeks’ gestation in Arizona. However, the state will have a ballot measure on abortion legality in this year’s election that, if passed, would make abortion legal in the state up to viability, generally considered around 24 weeks gestation (See Box).

This brief provides information about abortion experiences, awareness, and attitudes of Arizona women ages 18 to 49, based on findings from the 2024 KFF Women’s Health Survey, a nationally representative survey on health care issues, developed and analyzed by KFF, fielded from May 13 to June 18, 2024, before President Biden withdrew from the 2024 Presidential campaign. This analysis is based on survey responses from 298 women ages 18 to 49 in Arizona. The data for Arizona were weighted to represent women ages 18 to 49 in the state, based on benchmarks from the U.S. Census Bureau’s Current Population Survey. One half of women ages 18 to 49 in Arizona have incomes below 200% of the federal poverty level (FPL), 44% are White, 39% are Hispanic, and 7% are Black (Figure 1). See the methodology section for more information on definitions, sampling design, and margins of sampling error.

Figure 1 is titled "Selected Characteristics of Reproductive Age Women in Arizona" and shows three pie charts breaking down the demographic categories of Race/Ethnicity, Income, and Party ID.

Findings

Women’s Experiences with Abortion

Among women ages 18 to 49 living in Arizona, 15% say they have had an abortion at some point in their life. Another 52% of reproductive age women in the state have been pregnant and not had an abortion, and one-third of women have never been pregnant (Figure 2).

Among Reproductive Age Women in Arizona, 15% Say They Have Had An Abortion at Some Point in Their Life

Almost half of reproductive age women in the state say that it is difficult to obtain an abortion in the state. When asked about the ability to obtain abortion services in their state, 46% of reproductive age women say it is somewhat or very difficult (Figure 3). One in ten describe it as very or somewhat easy, and a sizable share (44%) say they don’t know. Additionally, more than one in ten (13%) say that they personally know someone who has had difficulty obtaining an abortion since Roe was overturned. State policies on abortion, as well as cost, insurance coverage, availability of services, knowledge and awareness all play a role in women’s ability to find and obtain abortion care.

Nearly Half of Reproductive Age Women in Arizona Say it Is Difficult to Obtain Abortion Care in the State

On the Ballot: Arizona Abortion Access Act (Proposition 139)

Abortion rights advocates in Arizona certified enough signatures in the state to include a measure on the 2024 ballot that would amend the state’s constitution to protect abortion up to viability and in cases when needed to protect the life or health of the pregnant person. A majority (50%) of voter approval is needed for passage.

Most women in Arizona are concerned about the impact of abortion restrictions on health and safety for themselves and loved ones. The safety of pregnancy has come squarely into the limelight since the Dobbs ruling, with multiple high profile cases of pregnant people suffering major complications yet being denied abortion care because of bans in their states that do not allow abortions even in cases of emergencies when the pregnant person’s health is threatened. All states have exceptions to their abortion bans and restrictions to preserve the life of a pregnant person, and some states also have exceptions to preserve the health of the pregnant person or for pregnancy resulting from rape or incest. However, these exceptions are narrow, vague, and have been hard to interpret, with many clinicians unable to determine when someone is sick enough that their life is on the line. As a result, there are multiple lawsuits pending over the conflict between abortion bans and the federal requirement for hospitals to provide all patients with lifesaving and stabilizing emergency medical care. Arizona’s 15-week limit allows exceptions for life and health but does not have exceptions for cases of rape and incest.

About seven in ten (69%) Arizona women say they are very or somewhat concerned that they or someone close to them would not be able to obtain an abortion if it was needed to preserve their life or health (Figure 4). Similarly, about two-thirds (64%) are concerned that a ban may affect the safety of a potential pregnancy in the future for them or someone close to them. Notably, higher shares of women with lower incomes express concerns about the impact of abortion bans on safety and health for pregnant people compared to women with higher incomes (Figure 5).

More Than Six in Ten Arizona Women are Concerned About Impact of Abortion Access on Safety for Pregnancy
More Women With Lower Incomes Are Concerned About Impact of Abortion Restrictions on Health and Safety

Overturning of Roe has affected contraceptive practices among some Arizona women. One in five (20%) Arizona women say that since the ruling, they or their partner have changed a contraceptive practice, such as starting contraception, switching to a more effective method, having their tubes tied or getting a vasectomy, or obtaining emergency contraception. This is similar between women of different income levels – 21% of women with incomes less than 200% FPL and 16% of women with higher incomes report a change in contraception practices (data not shown).

Awareness of Abortion Availability and Policy

Awareness of abortion availability is limited among reproductive age women in Arizona. Abortion is legal in Arizona through 15 weeks gestation, but most women in the state are not aware of this (Figure 6). When asked to describe the status of abortion policy in their state, nearly one in ten (7%) incorrectly think that abortion is available with few restrictions, and another one in three believe that abortion is generally unavailable with few exceptions. Four in ten say they don’t know. Only one in five (21%) women of reproductive age in Arizona say correctly that abortion is available but limited to earlier in pregnancy. However, there is a significant difference in awareness between women in different income levels. Three in ten women with incomes above 200% of the FPL answer correctly, twice the share of women with lower incomes (15%).

Most Reproductive Age Women in Arizona Do Not Know the Status of Abortion Policy in Their State

Awareness of abortion policy has been variable in Arizona because of the extreme uncertainty resulting from a state supreme court ruling earlier in the year that would have reinstated an 1864 law banning all abortions in the state. Following that ruling, there was widespread publicity that if it had taken effect, abortion would be banned under nearly all circumstances. The state legislature revoked the law before it went into effect, and abortion remains legal up to 15 weeks gestation. The state policy may change in the future if voters in the state approve the upcoming ballot initiative to legalize abortion up to viability, generally considered around 24 weeks of pregnancy.

Four in ten reproductive age women in Arizona say they would not know where to get an abortion if they needed one and wouldn’t know where they could find the information. For many women, finding abortion care is not easy. Abortion is an unplanned health care need, there are limited clinicians offering care in many areas, stigma has limited conversation, education and openness about abortion, and there is also extensive misinformation and active censorship of abortion information in many venues.

In recent years, and particularly since the Dobbs decision, there are more websites like Plan C and ineedana.com that provide directories of local abortion clinics, information about companies that offer telehealth appointments, and links to websites to purchase pills without a clinician visit.

However, this information may not necessarily be reaching everyone. One in ten women say they know where they could get an abortion if they needed one in the near future, and another 47% say they could find the information (Figure 7). Yet, four in ten (42%) do not know where to go or how to find the information.

More Than Four in Ten Reproductive Age Women in Arizona Say They Wouldn't Know Where to Obtain an Abortion or Find the Information if They Needed One

About six in ten reproductive age women in Arizona have heard of medication abortion pills. More than 20 years ago, the FDA approved the use of the medication mifepristone for abortion through 10 weeks gestation. Since then, medication abortion has become the most common method of abortion in the country. In recent years, there has been greater attention on medication abortion, with many conservative and anti-choice leaders opposing its use and trying to implement restrictions. In 2023-2024, the U.S. Supreme Court heard a case about the approval process of medication abortion. While there was no ruling in that case, access to medication abortion continues to be discussed in the courts, among federal and state policymakers, and in the media.

More than half (58%) of reproductive age women in Arizona say they have heard of medication abortion (Figure 8), lower than the national share (67%). There is also less awareness among women with lower incomes, with just over half (53%) saying they have heard of medication abortion, compared to seven in ten women with higher incomes (69%).

Lower Shares of Women in Arizona Have Heard of Medication Abortion, Especially Women with Lower Incomes

Few reproductive age women in Arizona know that medication abortion is legal in the state and that pills can be obtained online. Medication abortion can be used through 10 weeks of pregnancy, which is within Arizona‘s gestational limit of 15 weeks, so it is legal in the state. Yet just over one in ten (14%) of reproductive age women in the state are aware that it is legal. A similar share (15%) erroneously believe it is illegal, and seven in ten (71%) don’t know if it’s legal or haven’t heard of it (Figure 9).

Women in Arizona seeking medication abortion pills can obtain them from a clinician in person. Additionally, websites like Plan C, ineedana.com, and AbortionFinder provide information about online clinics and websites that sell medication abortion pills online and mail them to all states in the U.S. However, just about one in ten (11%) reproductive age women in Arizona know that medication abortion pills can be obtained online. Over one in ten (14%) say that this is not an option for women in the state, and three in four are not sure or haven’t heard of medication abortion.

Few Women in Arizona Know that Medication Abortion Pills are Legal in the State and Can be Obtained Online

Opinions on Abortion Policy

The majority of reproductive age women in Arizona think abortion should be legal in all or most cases (Figure 10). Seven in ten women ages 18 to 49 in Arizona say that abortion should be legal in all cases (30%) or most cases (40%) (Figure 10). Conversely, three in ten women say abortion should be illegal in all (9%) or most cases (21%). This is similar to women in the United States, three quarters of whom say abortion should be legal and 26% who think it should be illegal in all or most cases.

Currently, abortion is legal up to 15 weeks gestation in Arizona. Beyond that time, abortion is allowed only in the event of medical emergencies. The upcoming ballot initiative on abortion would protect the right to abortion up to viability if approved. A previous KFF survey found that two-thirds of women voters in the state support the initiative and that six in ten (58%) say they would be more motivated to vote in the election if the measure appears on the ballot.

Seven in Ten Women in Arizona Think Abortion Should be Legal in All or Most Cases

The majority of women in Arizona support a nationwide right to abortion and oppose leaving abortion policy to the states. In this year’s election, Vice President Harris and leaders in the Democratic party support reinstating the standards of Roe v. Wade, which provided a nationwide right to abortion up to viability before it was overturned by the Dobbs decision. The majority of Arizona women are in favor of a national right, with two-thirds (66%) of women ages 18 to 49 in Arizona saying they strongly or somewhat support a law that would establish a nationwide right to abortion (Figure 11).

In contrast, former President Trump and the newly revamped Republican party platform support leaving it up to states to decide whether abortion is legal, which two-thirds (67%) of Arizona women oppose. Six in ten Arizona reproductive age women (61%) also oppose a nationwide ban on abortion after 15 weeks gestation, a position promoted by some Republican lawmakers, including former President Trump, at times. When looking at women in different income groups, one in five (21%) women of reproductive age with incomes above 200% of the FPL say they strongly support a national ban at 15 weeks, but a majority (58%) still strongly or somewhat oppose this policy.

Majority of Reproductive Age Women in Arizona Support A Nationwide Right to Abortion and Oppose Nationwide Ban at 15 Weeks or Leaving it up to States

****

Abortion and reproductive health issues will be on the ballot this year in the battleground state of Arizona. Should voters in the state vote to pass the proposed constitutional amendment, abortion access in Arizona would be protected through viability, in line with the platform of the Democratic party and Presidential nominee Kamala Harris. If it does not secure the needed majority, then abortion will remain limited to 15 weeks with the possibility that future state legislatures could vote to roll back the limit to early gestational periods, as has been done in many states across the country.

Methodology

The 2024 KFF Women’s Health Survey was designed and analyzed by women’s health researchers at KFF. The survey was conducted from May 13 – June 18, 2024, online and by telephone among a nationally representative sample of 6,246 adults ages 18 to 64, including 3,901 women ages 18 to 49. Women include anyone who selected woman as their gender (n = 3,867) or who said they were non-binary (n = 26), transgender (n = 4), or another gender (n = 3) and chose to answer the female set of questions with regard to sexual and reproductive health. The project includes oversamples of women ages 18 to 49 in Arizona (n = 298) and Florida (n = 512). Sampling, data collection, weighting, tabulation, and IRB approval by the University of Southern Maine’s Collaborative Institutional Review Board were managed by SSRS of Glenn Mills, Pennsylvania in collaboration with women’s health researchers at KFF.

Throughout the reports of findings, we refer to “women”. This includes respondents who said their gender is “woman,” plus those who said their gender is “transgender,” or “non-binary,” or another gender and that they prefer to answer the survey’s set of questions for females. We followed this approach to try to include as many people as possible but recognize that some people who need and seek abortion and other reproductive health care services may not be represented in the findings or identify as women.

The national sample as well as the samples in Arizona and Florida were drawn from two nationally representative probability-based panels: the SSRS Opinion Panel and the Ipsos KnowledgePanel. The SSRS Opinion Panel is a nationally representative probability-based panel where panel members are recruited randomly in one of two ways: (a) Through invitations mailed to respondents randomly sampled from an Address-Based Sample (ABS) provided by Marketing Systems Groups (MSG) through the U.S. Postal Service’s Computerized Delivery Sequence (CDS); (b) from a dual-frame random digit dial (RDD) sample provided by MSG. For the online panel component, invitations were sent to panel members by email followed by up to five reminder emails. 5,276 panel members completed the survey online and panel members who do not use the internet were reached by phone (175). Another 970 respondents were reached online through the Ipsos Knowledge Panel to help reach adequate sample sizes among subgroups of interest, specifically women ages 18 to 49. This panel is recruited using ABS, based on a stratified sample from the CDS. The questionnaire was translated into Spanish, so respondents were able to complete the survey in English or Spanish.

The national sample was weighted by splitting the sample into three groups: [1] Women 18-49, [2] Women 50-64, and [3] Men 18-64 and each group was separately weighted to match known population parameters (see table below for weighting variables and sources). Weights within the three groups were then trimmed at the 4th and 96th percentiles, to ensure that individual respondents do not have too much influence on survey-derived estimates. After the weights were trimmed, the samples were combined, and the weights adjusted, so that the groups were represented in their proper proportions for a final combined, gender by age-adjusted weight. Lastly, two additional weights for interviews among women 18-49 in Arizona and Florida were calculated for analyses among those specific sub-groups. Each of the state-specific weights were trimmed at the 2nd and 98th percentiles, to ensure that individual respondents do not have too much influence on survey-derived estimates.

DimensionsSource
AgeCPS 2023 ASEC
Education
Age by Education
Age by Gender
Census Region
Race/Ethnicity by Nativity
Home Tenure
Civic EngagementCPS 2021 Volunteering & Civic Engagement Supplement
Internet FrequencySSRS Opinion Panel Database 2024
Population DensityACS 206-2020 5-year data
NEP RegionsCensus Planning Database 2022
Voter RegistrationCPS 2022 Voting & Registration Supplement

The margins of sampling error for the national sample of reproductive age women, Arizona reproductive age women, and Florida reproductive age women are plus or minus 2 percentage points, 8 percentage points, and 6 percentage points respectively. Numbers of respondents and margins of sampling error for key subgroups are shown in the table below. For results based on other subgroups, the margin of sampling error may be higher. Sampling error is only one of many potential sources of error and there may be other unmeasured error in this survey.

 GroupN (unweighted)M.O.S.E.
National Women Ages 18-493901± 2 percentage points
White, non-Hispanic1856± 3 percentage points
Black, non-Hispanic603± 5 percentage points
Hispanic963± 4 percentage points
Asian286± 7 percentage points
<200% FPL1667± 3 percentage points
200%+ FPL1974± 3 percentage points
Pro-life1074± 4 percentage points
Pro-choice2815± 2 percentage points
Republican/Republican-leaning1076± 4 percentage points
Democrat/Democrat-leaning1803± 3 percentage points
Urban/Suburban3379± 2 percentage points
Rural473± 6 percentage points
Lives in a state where abortion is banned857± 4 percentage points
Lives in a state where abortion has gestational limits 6-12 weeks819± 5 percentage points
Lives in a state where abortion has gestational limits 15-22 weeks594± 6 percentage points
Lives in a state where gestational limited are 24+ weeks or none1631± 3 percentage points
Arizona Women Ages 18-49298± 8 percentage points
<200% FPL121± 12 percentage points
200%+ FPL162± 10 percentage points
Florida Women Ages 18-49512± 6 percentage points
White, non-Hispanic229± 9 percentage points
Hispanic155± 11 percentage points
<200% FPL182± 10 percentage points
200%+ FPL297± 8 percentage points
Pro-life143± 12 percentage points
Pro-choice366± 7 percentage points
Republican/Republican-leaning169± 11 percentage points
Democrat/Democrat-leaning231± 9 percentage points


News Release

Medicare Advantage Plans Denied a Larger Share of Prior Authorization Requests in 2022 Than in Prior Years

Published: Aug 8, 2024

Medicare Advantage plans denied 3.4 million prior authorization requests for health care services in whole or in part in 2022, or 7.4% of the 46.2 million requests submitted on behalf of enrollees that year, according to a new KFF analysis of federal data.

That was a higher share of denials than in recent years. The share of all prior authorization requests denied by Medicare Advantage plans increased from 5.7% in 2019, 5.6% in 2020 and 5.8% in 2021.

Prior authorization is intended to ensure that health care services are medically necessary by requiring providers to obtain approval before a service or other benefit is covered. While prior authorization has long been used to contain spending and prevent people from receiving unnecessary or low-value services, it also has been subject to criticism that it may create barriers to receiving necessary care. (Traditional Medicare does not require prior authorization except for a limited set of services.)

Prior authorization practices have attracted the attention of the Biden Administration and lawmakers in Congress. The administration recently finalized rules to increase the timeliness and transparency of prior authorization decisions and require Medicare Advantage plans to evaluate the effect of prior authorization policies on people with certain social risk factors. Lawmakers have introduced bills to codify many of these changes into law.

Other key takeaways from the KFF analysis include:

  • Just one in 10 (9.9%) prior authorization requests that were denied were appealed in 2022. That represents an increase since 2019, when 7.5% of denied prior authorization requests were appealed.
  • The vast majority of appeals (83.2%) in 2022 resulted in overturning the initial decision, similar to the shares overturned and in each year between 2019 and 2021.
  • Patients may have different experiences depending on the Medicare Advantage plan in which they are enrolled. The volume of prior authorization determinations varied across Medicare Advantage insurers, as did the share of requests that were denied, the share of denials that were appealed, and the share of decisions that were overturned upon appeal.

Two other KFF analyses released today also examine the latest data about Medicare Advantage.

  • The first provides information and trends about current Medicare Advantage enrollment, by plan type and firm, and by state and county. It shows that in 2024, more than half (54%) of eligible Medicare beneficiaries are enrolled in Medicare Advantage. The share of beneficiaries in Medicare Advantage plans varies across states ranging from 2% in Alaska to 63% in Alabama, Connecticut and Michigan. Medicare Advantage enrollment is highly concentrated among a small number of firms, with UnitedHealthcare and Humana accounting for nearly half (47%) of all Medicare Advantage enrollment nationwide.
  • The second companion analysis describes Medicare Advantage premiums, out-of-pocket limits, supplemental benefits offered, and prior authorization requirements. In 2024, three quarters (75%) of enrollees in individual Medicare Advantage plans with prescription drug coverage pay no premium other than the Medicare Part B premium, which is a big selling point for many beneficiaries. Most Medicare Advantage enrollees are in plans that offer supplemental benefits not covered by traditional Medicare, such as vision, hearing and dental. And nearly all Medicare Advantage enrollees (99%) are in plans that require prior authorization for some services.

Medicare Advantage in 2024: Enrollment Update and Key Trends

Authors: Meredith Freed, Jeannie Fuglesten Biniek, Anthony Damico, and Tricia Neuman
Published: Aug 8, 2024

Medicare Advantage enrollment has been on a steady climb for the past two decades following changes in policy designed to encourage a robust role for private plan options in Medicare. After a period of some instability in terms of plan participation and enrollment, The Medicare Modernization Act of 2003 created stronger financial incentives for plans to participate in the program throughout the country and renamed private Medicare plans Medicare Advantage. In 2024, 32.8 million people are enrolled in a Medicare Advantage plan, accounting for more than half, or 54 percent, of the eligible Medicare population, and $462 billion (or 54%) of total federal Medicare spending (net of offsetting receipts, such as premiums). Medicare Advantage enrolls a disproportionate share of people of color in Medicare as well as an increasing number of dual eligible beneficiaries. The average Medicare beneficiary in 2024 has access to 43 Medicare Advantage plans, the same as in 2023, but more than double the number of plans offered in 2018.

The growth in Medicare Advantage enrollment is due to a number of factors, including the availability of plans that charge no premium (other than the Part B premium), and extra benefits offered by most Medicare Advantage plans. Nearly all Medicare Advantage plans offer some benefits not included in traditional Medicare, such as coverage of dental, vision, or hearing services, often for no additional premium. Medicare beneficiaries are also drawn to the financial protection that comes with an out-of-pocket limit, which Medicare Advantage plans are required to provide, while traditional Medicare has no out-of-pocket cap on spending. On the other hand, Medicare Advantage plans have limited provider networks and apply cost management tools such as prior authorization, which traditional Medicare does not.

Generally, research shows that Medicare pays more to private Medicare Advantage plans for enrollees than their costs would be in traditional Medicare. The Medicare Payment Advisory Commission (MedPAC) reports that plans receive payments from CMS that are 122% of spending for similar beneficiaries in traditional Medicare, on average, translating to an estimated $83 billion in higher spending in 2024. As Medicare Advantage takes on a more dominant presence in the Medicare program, and with current payments to plans higher for Medicare Advantage than for traditional Medicare for similar beneficiaries, policymakers have become increasingly focused on how well Medicare’s current payment methodology for Medicare Advantage is working to enhance efficiency and hold down beneficiary costs and Medicare spending.

To better understand trends in the growth of the program, this brief provides current information about Medicare Advantage enrollment, by plan type and firm, and shows how enrollment varies by state and county. A second, companion analysis describes Medicare Advantage premiums, out-of-pocket limits, supplemental benefits offered, and prior authorization requirements in 2024. This analysis does not provide detailed information by enrollee characteristics, such as race/ethnicity, income, or dual status, because that information is not available.

Highlights for 2024:

  • More than half (54%) of eligible Medicare beneficiaries are enrolled in Medicare Advantage in 2024. The share of Medicare beneficiaries in Medicare Advantage plans varies across states, ranging from 2% to 63%. In 7 states, AL, CT, MI, HI, ME, FL, RI (and Puerto Rico), 60% or more of all Medicare beneficiaries are enrolled in Medicare Advantage plans, an increase from 3 states in 2023.
  • More than one-third (37%) of Medicare beneficiaries live in a county where at least 60 percent of all Medicare beneficiaries are enrolled in Medicare Advantage plans. Three counties (excluding those in Puerto Rico) enroll 80% or more of Medicare beneficiaries in Medicare Advantage plans: Monroe County, NY (Rochester; 82%), Starr, Texas (81%), and Miami-Dade County, Florida (80%). At the same time, 8 percent of all Medicare beneficiaries nationwide live in a county with relatively low enrollment, where less than one third of all Medicare beneficiaries are enrolled in Medicare Advantage plans. The wide variation in county enrollment rates reflect several factors, such as differences in firm strategy, urbanicity of the county, Medicare payment rates, number of Medicare beneficiaries, health care use patterns, and historical Medicare Advantage market penetration.
  • Medicare Advantage enrollment is highly concentrated among a small number of firms, with UnitedHealthcare and Humana accounting for nearly half (47%) of all Medicare Advantage enrollees nationwide. In more than a quarter of all U.S. counties (29%; or 931 counties), these two firms account for at least 75 percent of Medicare Advantage enrollment. Since 2017, the market share for UnitedHealthcare and CVS Health has increased (25% to 29% and 8% to 12%, respectively), Humana (18%) and Cigna (2%) have held steady, while other firms’ share of total enrollment has slightly decreased (Blue Cross Blue Shield (BCBS) affiliates, Kaiser Permanente, and Centene). Small firms (which each account for less than 2% of enrollment) have a smaller share of the market in 2024 than in 2017 (19% to 16%).

More than half of eligible Medicare beneficiaries are enrolled in Medicare Advantage in 2024

In 2024, more than half (54%) of eligible Medicare beneficiaries – 32.8 million people out of 61.2 million Medicare beneficiaries with both Medicare Parts A and B – are enrolled in Medicare Advantage plans. Medicare Advantage enrollment as a share of the eligible Medicare population has jumped from 19% in 2007 to 54% in 2024 (Figure 1).

Total Medicare Advantage Enrollment, 2007-2024

Between 2023 and 2024, total Medicare Advantage enrollment grew by about 2.1 million beneficiaries, or 7 percent – a similar growth rate as the prior year (8%). The Congressional Budget Office (CBO) projects that the share of all Medicare beneficiaries enrolled in Medicare Advantage plans will rise to 64% by 2034 (Figure 2).

Medicare Advantage and Traditional Medicare Enrollment, Past and Projected

In 2024, nearly two-thirds of Medicare Advantage enrollees are in individual plans that are open for general enrollment.

More than 6 in 10 Medicare Advantage enrollees (62%), or 20.5 million people, are in plans generally available to all beneficiaries for individual enrollment (Figure 3). That is an increase of 0.9 million enrollees compared to 2023. Individual plans have declined as a share of total Medicare Advantage enrollment since 2010 (71%).

Distribution of Medicare Advantage Enrollment, 2010-2024

More than 6.6 million Medicare beneficiaries are enrolled in special needs plans in 2024, more than double the enrollment in 2019.

More than 6.6 million Medicare beneficiaries are enrolled in special needs plans (SNPs). SNPs restrict enrollment to specific types of beneficiaries with significant or relatively specialized care needs, or who qualify because they are eligible for both Medicare and Medicaid. Enrollment in SNPs increased by 16 percent between 2023 and 2024, and accounts for 20 percent of total Medicare Advantage enrollment in 2024, an increase from 12 percent in 2010. Since 2019, SNP enrollment has more than doubled from 2.92 million to 6.64 million (Figure 4). This increase is due in part to the increasing number of SNP plans  available on average and more dual eligible individuals having access to these plans.

Most SNP enrollees (88%) are in plans for beneficiaries dually enrolled in both Medicare and Medicaid (D-SNPs). Another 10 percent of SNP enrollees are in plans for people with severe chronic or disabling conditions (C-SNPs) and 2 percent are in plans for beneficiaries requiring a nursing home or institutional level of care (I-SNPs).

While D-SNPs are designed specifically for dually-eligible individuals, 1.2 million Medicare beneficiaries with full Medicaid benefits were enrolled in Medicare Advantage plans generally available to all beneficiaries (not designed specifically for this population) in 2021, while 2.3 million full dual eligible individuals were in D-SNPs. D-SNPs have increasingly become the main source of Medicare Advantage coverage for dual eligible individuals.

Number of Beneficiaries in Special Needs Plans, 2010-2024

SNP enrollment varies across states. In the District of Columbia and Puerto Rico, SNP enrollees comprise about half of all Medicare Advantage enrollees (49% in DC and 51% in PR). In nine states, SNP enrollment accounts for at least a quarter of Medicare Advantage enrollment: 46% in MS, 34% in AR, 33% in LA and NY, 28% in FL and GA, and 25% in CT, SC and AL.

C-SNP enrollment in 2024 (about 675,000 people) is 45% higher than it was in 2023 – an increase of about 210,000 enrollees. Nearly all (97%) C-SNP enrollees are in plans for people with diabetes or cardiovascular conditions in 2024. Enrollment in I-SNPs has been increasing slightly, with approximately 115,000 enrollees in 2024, up from about 103,000 in 2023.

Slightly less than one in five (17% or about 5.7 million) Medicare Advantage enrollees are in a group plan offered to retirees by an employer or union.

Group enrollment as a share of total Medicare Advantage enrollment has fluctuated between 17% to 20% since 2010, but the actual number has increased from 1.8 million in 2010 to 5.7 million in 2024 (Figure 5). With a group plan, an employer or union contracts with an insurer and Medicare pays the insurer a fixed amount per enrollee to provide benefits covered by Medicare. For example, 13 states provide health insurance benefits to their Medicare-eligible retirees exclusively through Medicare Advantage plans.

Number of Beneficiaries in Employer Group or Union-Sponsored Health Plans, 2010-2024

As with other Medicare Advantage plans, employer and union group plans may provide additional benefits and/or lower cost sharing than traditional Medicare and are eligible for bonus payments if they obtain required quality scores. The employer or union (and sometimes the retiree) may also pay an additional premium for these supplemental benefits. Group enrollees comprise a quarter or more of Medicare Advantage enrollees in nine states: Alaska (100%), Michigan (38%), New Jersey (33%), West Virginia (31%), Maryland (30%), Illinois (29%), Vermont (27%), Kentucky (26%), and Connecticut (25%).

The share of Medicare beneficiaries in Medicare Advantage plans varies by state and county

The share of Medicare beneficiaries in Medicare Advantage plans varies across states, ranging from 2% to 63%.

In 30 states, Medicare Advantage enrollees account for more than half of all Medicare beneficiaries, including in 7 states, AL, CT, MI, HI, ME, FL, RI (and Puerto Rico) where 60% or more of all Medicare beneficiaries are enrolled in Medicare Advantage plans (Figure 6). In contrast, Medicare Advantage enrollment is relatively low (less than 40%) in 13 states, including five states with less than 30% of beneficiaries enrolled in a Medicare Advantage plan – AK, MD, ND, SD, and WY – all of which (beside MD) are mostly rural. Overall, Puerto Rico has the highest Medicare Advantage penetration, with 95 percent of Medicare beneficiaries enrolled in a Medicare Advantage plan. A decade ago, the share of Medicare beneficiaries in Medicare Advantage plans did not exceed 50 percent in any state (other than Puerto Rico).

Share of Beneficiaries Enrolled in Medicare Advantage in 2024, by State

The share of Medicare beneficiaries enrolled in Medicare Advantage varies widely across counties.

For example, in Florida, 60% of all Medicare beneficiaries in the state are enrolled in Medicare Advantage, ranging from 21% in Monroe County (Key West) to 80% in Miami-Dade County (Figure 7). In Ohio, 57% of all Medicare beneficiaries are enrolled in Medicare Advantage, with the share ranging from 32% in Mercer County (Celina) to 69% in Stark County (Canton).

In 2024, more than a third (37%) of Medicare beneficiaries live in a county where at least 60 percent of all Medicare beneficiaries in that county are enrolled in Medicare Advantage plans (618 counties). That is substantially more than in 2010 when just 3 percent of the Medicare population lived in a county where 60 percent or more of Medicare beneficiaries were enrolled in a Medicare Advantage plan (83 counties). Many counties with high Medicare Advantage penetration are centered around relatively large, urban areas, such as Monroe County, NY (82%), which includes Rochester, and Allegheny County, PA (74%), which includes Pittsburgh. In contrast, 8 percent of Medicare beneficiaries live in a county where less than one third of all Medicare beneficiaries in that county are enrolled in Medicare Advantage plans (849 counties). Counties with relatively low enrollment tend to be less populated rural areas. However, others, such Montgomery County, MD (27%) and Suffolk, NY (31%), which includes much of Long Island, are in more populous areas. (This county-level analysis excludes Medicare Advantage enrollment in Connecticut. See methods for more details.)

Variation in the share of eligible Medicare beneficiaries who are enrolled in a Medicare Advantage plan is explained by a combination of factors, including firm-level strategies to target particular geographic areas, the urbanicity of the county and state, variation in Medicare payment rates, the number and characteristics of people eligible for Medicare, health care use patterns, and the historical Medicare Advantage market penetration.

Medicare Advantage Penetration, by County, 2024

Medicare Advantage enrollment is highly concentrated among a small number of firms

The average Medicare beneficiary is able to choose from Medicare Advantage plans offered by 8 firms in 2024, one fewer than in 2023 and 2022, and one-third of beneficiaries (33%) can choose among Medicare Advantage plans offered by 10 or more firms.

UnitedHealthcare and Humana account for nearly half of all Medicare Advantage enrollees nationwide in 2024.

Despite most beneficiaries having access to plans operated by several different firms, Medicare Advantage enrollment is highly concentrated among a small number of firms. UnitedHealthcare, alone, accounts for 29% of all Medicare Advantage enrollment in 2024, or 9.4 million enrollees. Together, UnitedHealthcare and Humana (18%) account for nearly half (47%) of all Medicare Advantage enrollees nationwide, the same as in 2023. In more than a quarter of counties (29%; or 931 counties), these two firms account for at least 75% of Medicare Advantage enrollment. These counties include East Baton Rouge (Baton Rouge), LA (81%), Clark County (Las Vegas), NV (79%), Travis County (Austin), FL (78%), and El Paso County (Colorado Springs), CO (76%). (Again, this county-level analysis does not include Connecticut.)

BCBS affiliates (including Anthem BCBS plans) account for 14% of enrollment, and four firms (CVS Health, Kaiser Permanente, Centene, and Cigna) account for another 23% of enrollment in 2024.

Medicare Advantage Enrollment by Firm or Affiliate, 2024

UnitedHealthcare and Humana have consistently accounted for a relatively large share of Medicare Advantage enrollment.

UnitedHealthcare has had the largest share of Medicare Advantage enrollment and largest growth in enrollment since 2010, increasing from 20 percent of all Medicare Advantage enrollment in 2010 to 29 percent in 2024. Humana has also had a high share of Medicare Advantage enrollment, though its share of enrollment has grown more slowly, from 16 percent in 2010 to 18 percent in 2024. BCBS plans share of enrollment has been more constant over time but has declined moderately since 2014.

CVS Health, which purchased Aetna in 2018, has seen its share of enrollment double from 6 percent in 2010 to 12 percent in 2024. Kaiser Permanente now accounts for 6 percent of total enrollment, a moderate decline as a share of total Medicare Advantage enrollment since 2010 (9%), mainly due to the growth of enrollment in plans offered by other insurers and only a modest increase in enrollment growth for Kaiser Permanente over that time. However, for those insurers that have seen declines in their overall share of enrollment, the actual number of enrollees for each insurer is larger than it was in 2010.

Medicare Advantage Enrollment by Firm or Affiliate, 2010-2024

By absolute numbers, CVS Health had the largest growth in plan year enrollment, increasing by 758,000 beneficiaries between March 2023 and March 2024. Humana had the second largest growth in plan year enrollment, with an increase of about 472,000 beneficiaries between March 2023 and March 2024. UnitedHealthcare plans had the third highest growth in plan year enrollment, increasing by 456,000 beneficiaries – the first time in 8 years it did not have the largest plan growth among all firms. BCBS plans had the fourth largest growth in plan enrollment with an increase of about 283,000, followed by Kaiser Permanente, increasing by about 45,000 beneficiaries between March 2023 and March 2024. However, Centene had fewer enrollees, with enrollment declining by about 202,000 between March 2023 and March 2024.

Medicare Advantage Enrollment by Firm or Affiliate, 2010-2024

Meredith Freed, Jeannie Fuglesten Biniek, and Tricia Neuman are with KFF. Anthony Damico is an independent consultant.

Methods

This analysis uses data from the Centers for Medicare & Medicaid Services (CMS) Medicare Advantage Enrollment, Benefit and Landscape files for the respective year. KFF uses the Medicare Enrollment Dashboard for enrollment data for March 2023 and 2024, and the CMS Chronic Conditions Data Warehouse Master Beneficiary Summary File (MBSF) for March for earlier years. Trend analysis begins in 2007 because that was the earliest year of data that was based on March enrollment. Enrollment data is only provided for plan-county combinations that have at least 11 beneficiaries; thus, this analysis excludes approximately 400,000 individuals who reside in a county where county-wide plan enrollment does not meet this threshold. Connecticut is excluded from the analysis of Medicare Advantage penetration at the county level due to a change in FIPS codes that are in the Medicare Enrollment Dashboard data but are not yet reflected in the Medicare Advantage enrollment data.

KFF calculates the share of eligible Medicare beneficiaries enrolled in Medicare Advantage, meaning they must have both Part A and B coverage. The share of enrollees in Medicare Advantage would be somewhat smaller if based on the total Medicare population that includes 5.9 million beneficiaries with Part A only or Part B only (in 2024) who are not generally eligible to enroll in a Medicare Advantage plan.

In previous years, KFF calculated the share of Medicare beneficiaries enrolled in Medicare Advantage by including Medicare beneficiaries with either Part A and/or B coverage. We modified our approach in 2022 to estimate the share enrolled among beneficiaries eligible for Medicare Advantage who have both Medicare Part A and Medicare B. In the past, the number of beneficiaries enrolled in Medicare Advantage was smaller and therefore the difference between the share enrolled with Part A and/or B vs Part A and B was also smaller. For example, in 2010, 24% of all Medicare enrollees were enrolled in Medicare Advantage versus 25% with just Parts A and B. However, these shares have diverged over time: in 2024, 49% of all Medicare beneficiaries were enrolled in Medicare Advantage versus 54% with just Parts A and B. These changes are reflected in all data displayed trending back to 2007.

Additionally, in previous years, KFF had used the term Medicare Advantage to refer to Medicare Advantage plans as well as other types of private plans, including cost plans, PACE plans, and HCPPs. However, cost plans, PACE plans, and HCPPs are now excluded from this analysis in addition to MMPs. In this analysis, KFF excludes these other plans as some may have different enrollment requirements than Medicare Advantage plans (e.g., may be available to beneficiaries with only Part B coverage) and in some cases, may be paid differently than Medicare Advantage plans. These exclusions are reflected in all data displayed trending back to 2007.

Medicare projections for 2025-2033 are from the June Congressional Budget Office (CBO) Medicare Baseline for 2024. Using the CBO baseline, Medicare enrollment is based on individuals who are enrolled in Part B, which is designed to include only individuals who are eligible for Medicare Advantage and exclude those who only have Part A only (~5 million people in 2025) and cannot enroll in Medicare Advantage. However, it may include some individuals who have Part B only and also are not eligible for Medicare Advantage.

Enrollment counts in publications by firms operating in the Medicare Advantage market, such as company financial statements, might differ from KFF estimates due to inclusion or exclusion of certain plan types, such as SNPs or employer group health plans.


Medicare Advantage in 2024: Premiums, Out-of-Pocket Limits, Supplemental Benefits, and Prior Authorization

Authors: Meredith Freed, Jeannie Fuglesten Biniek, Anthony Damico, and Tricia Neuman
Published: Aug 8, 2024

People with Medicare have the option of receiving their Medicare benefits through the traditional Medicare program administered by the federal government or through a private Medicare Advantage plan, such as an HMO or PPO. In Medicare Advantage, the federal government contracts with private insurers to provide Medicare benefits to enrollees. Medicare pays insurers a set amount per enrollee per month, which varies depending on the county in which the plan is located, the health status of the plan’s enrollees, and the plan’s estimated costs of covering Medicare Part A and Part B services.

The plans use these payments to pay for Medicare-covered services, and in most cases, also pay for supplemental benefits, reduced cost sharing and lower out-of-pocket limits, which are attractive to enrollees. Plans are able to offer these additional benefits, often without charging an additional premium for Part D prescription drugs or supplemental benefits, because they receive an additional $2,329 per enrollee above their estimated costs of providing Medicare-covered services. This portion of plan payments, also called the rebate, has increased substantially in the last several years, more than doubling since 2018. At the same time, Medicare Advantage plans can use cost management tools, such as prior authorization requirements, which can impose barriers to receiving care, and limited networks of providers, which can restrict beneficiary choice of physicians and hospitals. More than half (56%) of Medicare Advantage beneficiaries are enrolled in HMO plans that typically do not cover out-of-network services.

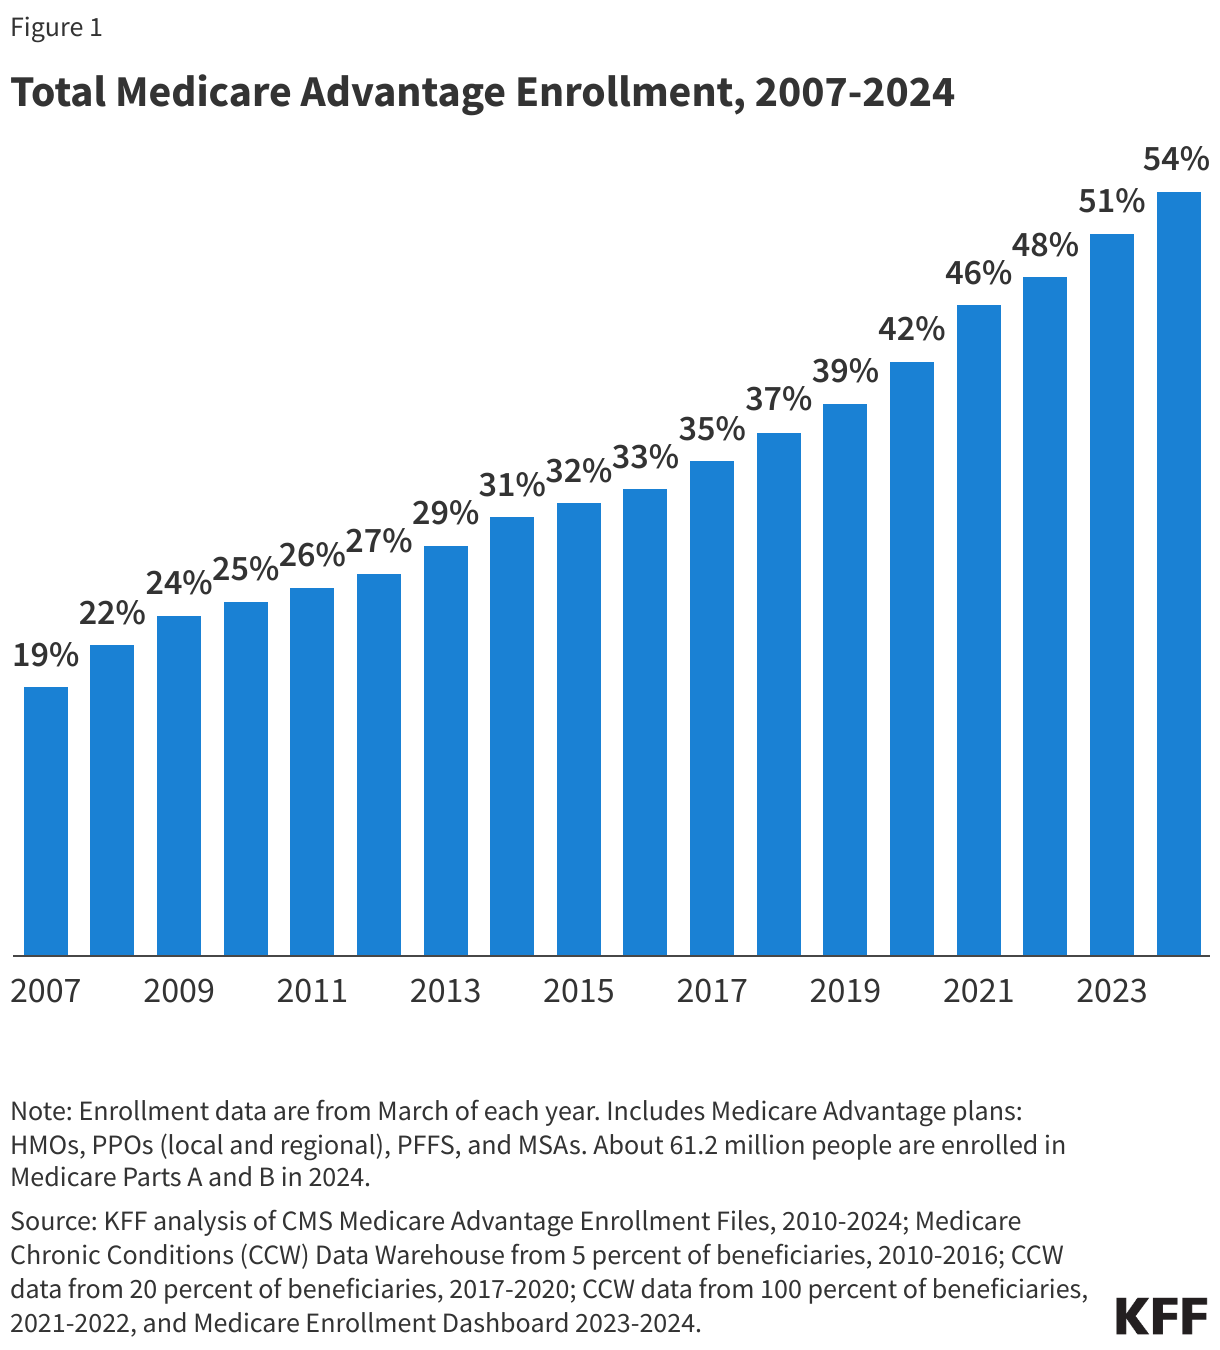
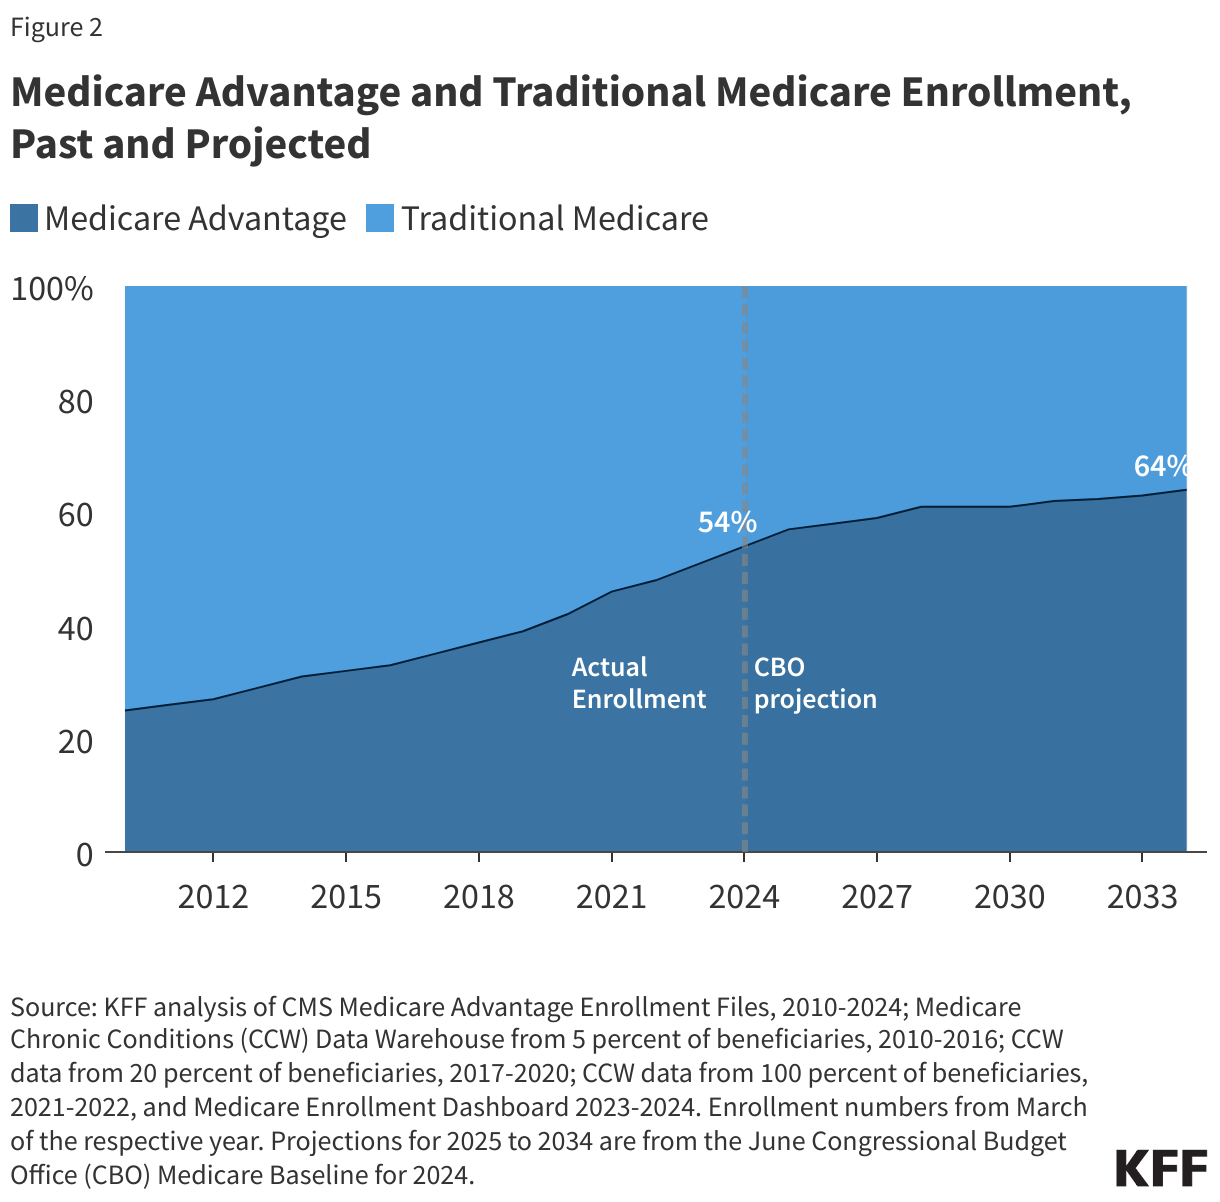
This brief provides information about Medicare Advantage plans in 2024, including premiums, out-of-pocket limits, supplemental benefits, and prior authorization, as well as trends over time. A companion analysis examines trends in Medicare Advantage enrollment.

While data on Medicare Advantage plan availability, enrollment and plan offerings is robust, the same cannot be said about service utilization (especially for supplemental benefits) and out-of-pocket spending patterns (though some of this data is starting to be collected), which would allow assessment of how well the program is meeting its goals in terms of value and quality and help Medicare beneficiaries compare coverage options. As enrollment in Medicare Advantage and federal payments to private plans continue to grow, greater transparency and more comprehensive information will become increasingly relevant for people with Medicare program oversight.

Highlights for 2024:

  • In 2024, three quarters (75%) of enrollees in individual Medicare Advantage plans with prescription drug coverage pay no premium other than the Medicare Part B premium, which is a big selling point for beneficiaries, particularly those living on modest incomes and savings.
  • Most Medicare Advantage enrollees are in plans that offer supplemental benefits not covered by traditional Medicare, such as vision, hearing and dental. From 2023 to 2024, Medicare Advantage enrollees overall did not experience a significant loss in benefits despite concerns that changes in Medicare Advantage payment would lead to a drastic reduction in benefits or increase in premiums, though there were small declines in the share of enrollees in plans with access to some benefits from 2023 to 2024.
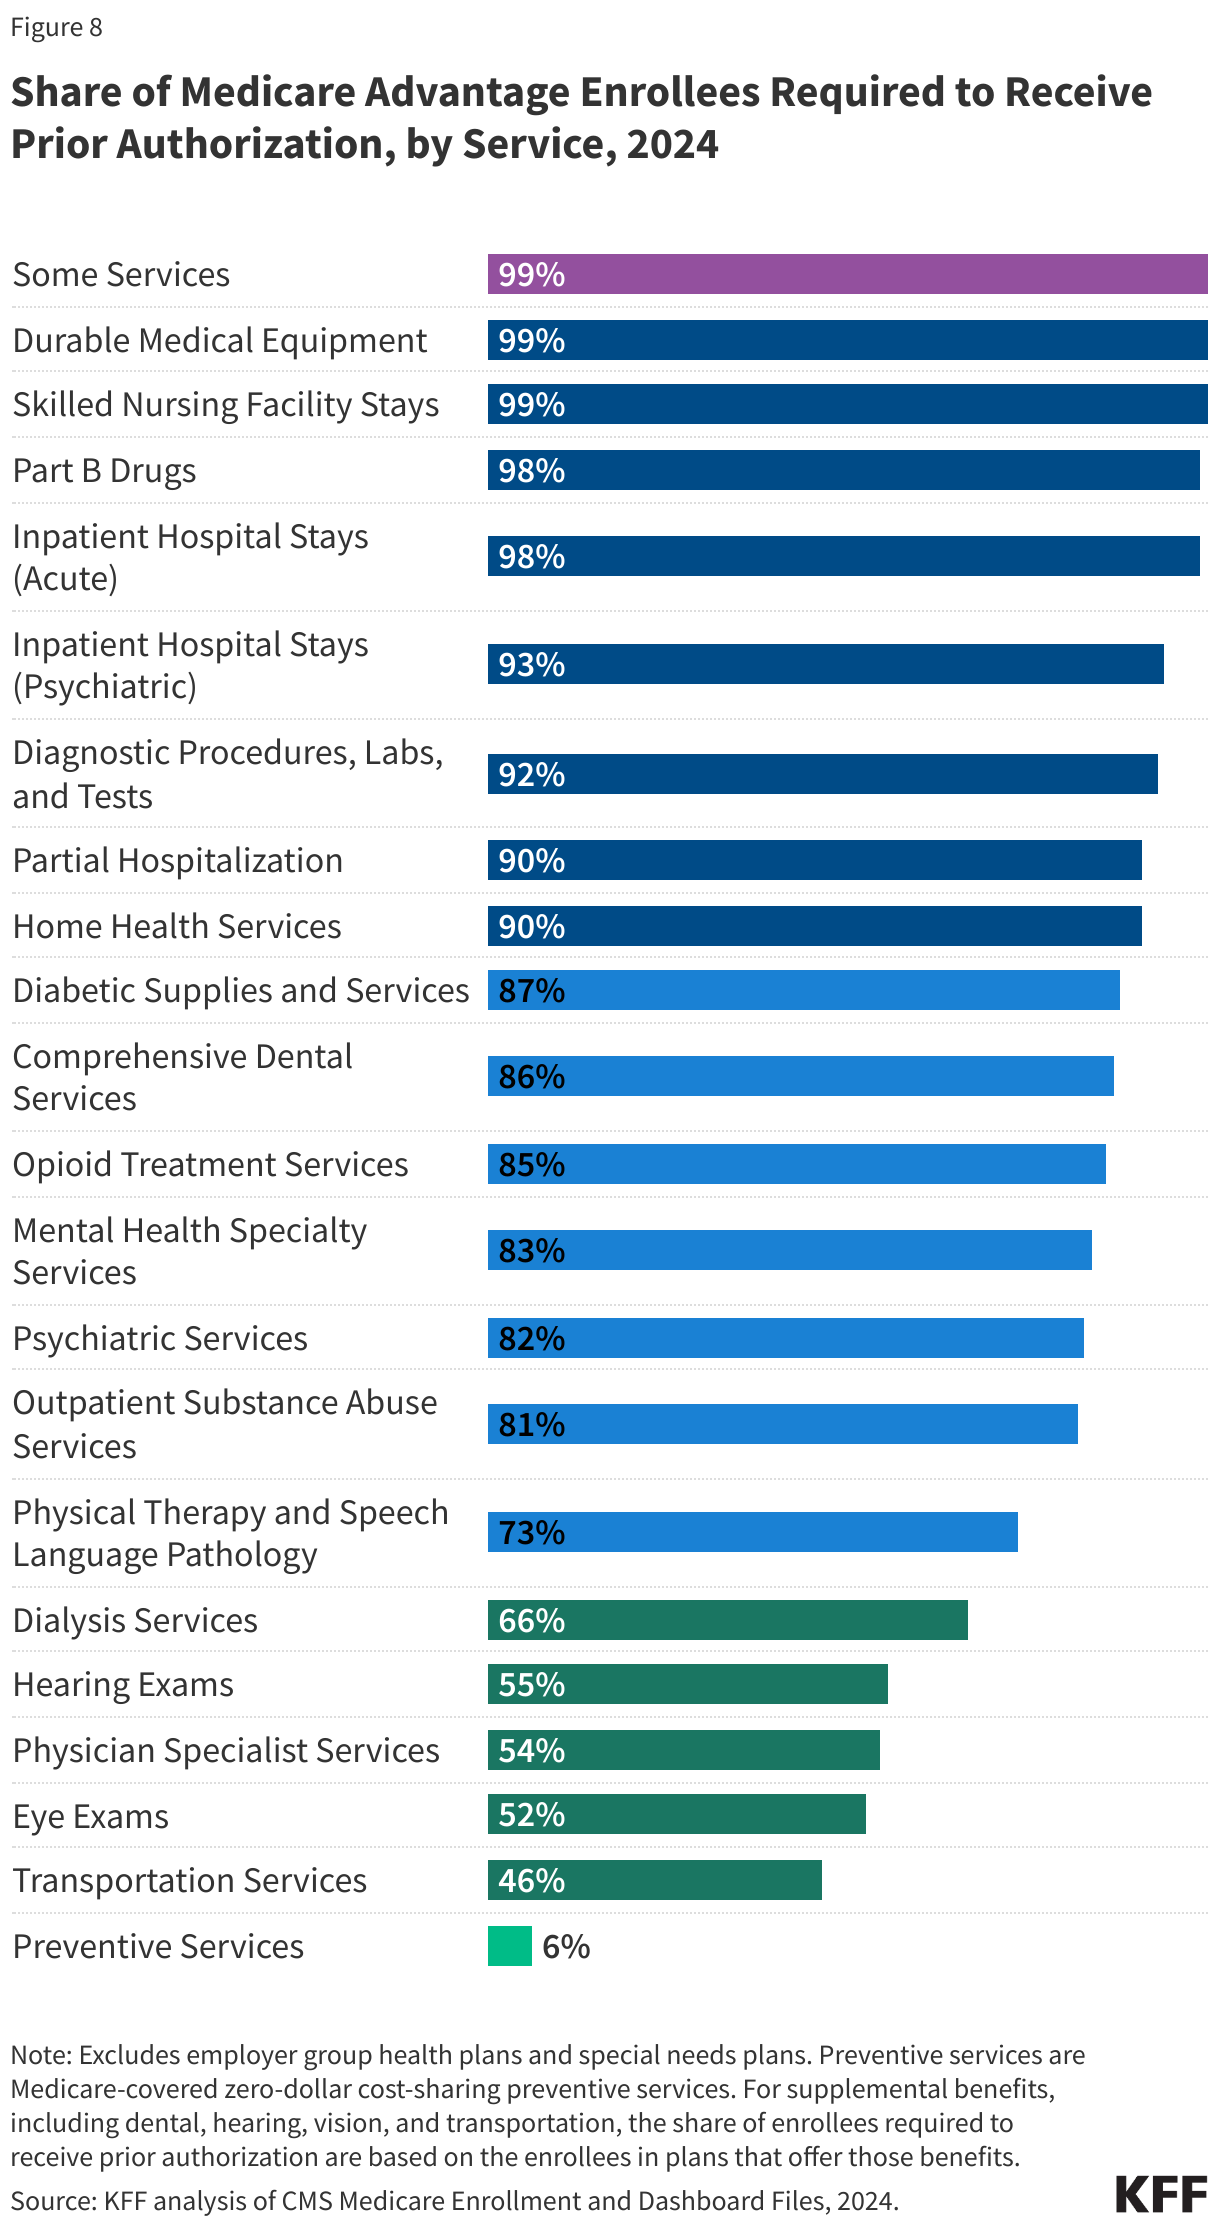
  • Nearly all Medicare Advantage enrollees (99%) are in plans that require prior authorization for some services, which is generally not used in traditional Medicare. Prior authorization is most often required for relatively expensive services, such as skilled nursing facility stays (99%), Part B drugs (98%), inpatient hospital stays (acute: 98%; psychiatric: 93%) and outpatient psychiatric services (82%) and is rarely required for preventive services (6%).

In 2024, three quarters of Medicare Advantage enrollees (75%) are in plans with no supplemental premium (other than the Part B premium)

In 2024, most people (75%) enrolled in individual Medicare Advantage plans with prescription drug coverage (MA-PDs) pay no premium other than the Medicare Part B premium ($174.70 in 2024) (Figure 1). The MA-PD premium includes both the cost of Medicare-covered Part A and Part B benefits and Part D prescription drug coverage. In 2024, 97% of Medicare Advantage enrollees in individual plans open for general enrollment are in plans that offer prescription drug coverage.

Distribution of Medicare Advantage Prescription Drug Plan (MA-PD) Enrollees, by Premium, 2024

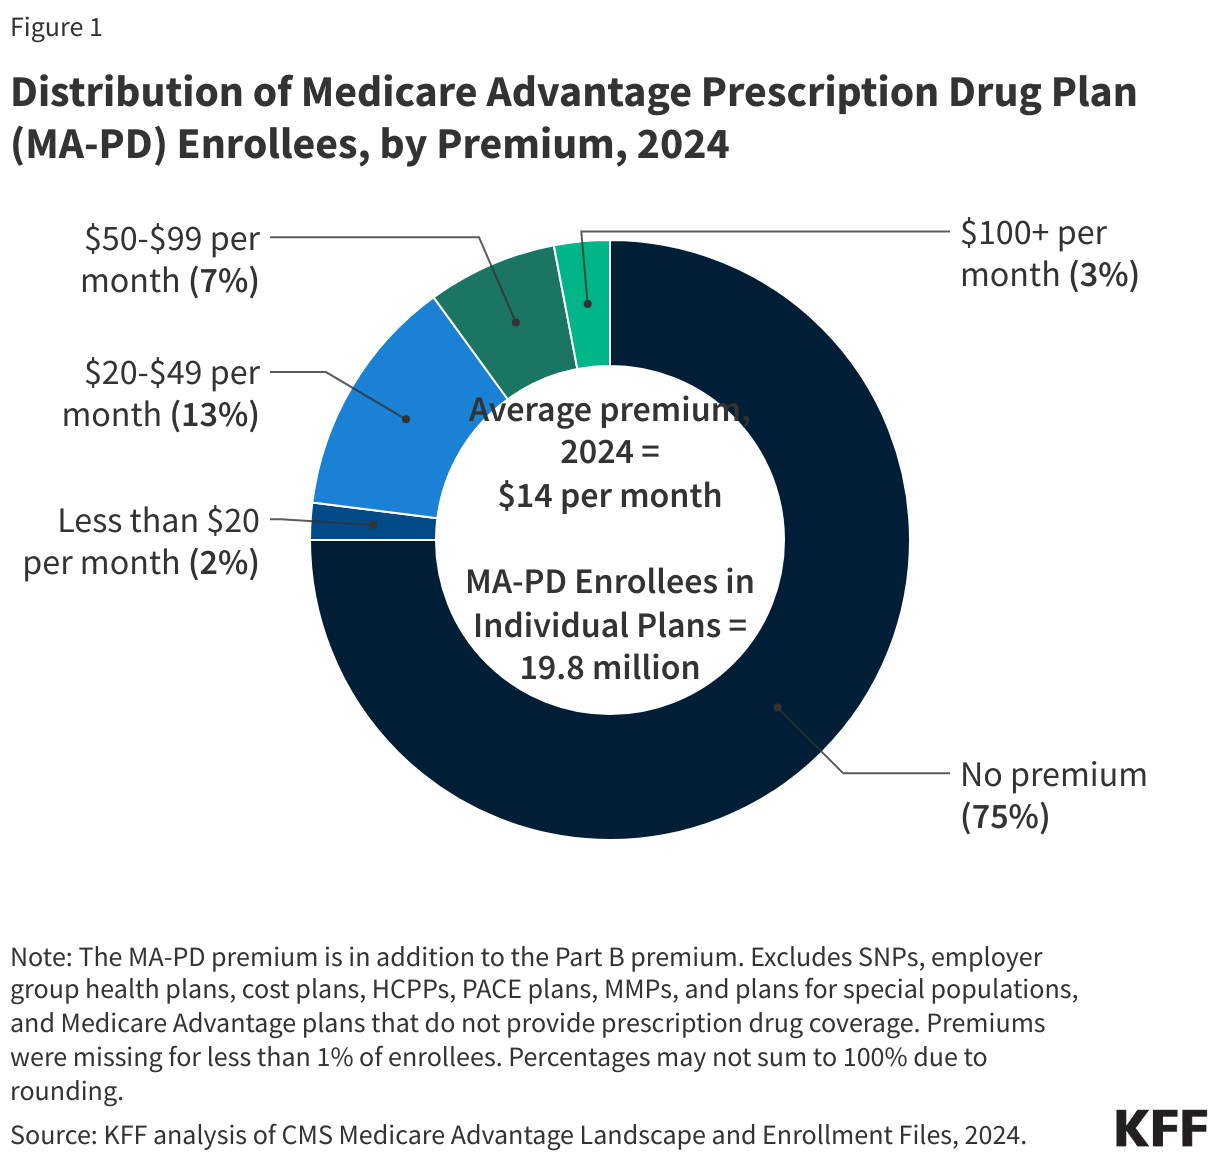
Altogether, including those who do not pay a premium, the average enrollment-weighted premium in 2024 is $14 per month, and averages $9 per month for just the Part D portion of covered benefits, substantially lower than the average premium of $43 for stand-alone prescription drug plans (PDP) in 2024. Higher average PDP premiums compared to the MA-PD drug portion of premiums is due in part to the ability of MA-PD sponsors to use rebate dollars from Medicare payments to lower their Part D premiums. When a plan’s estimated costs for Medicare-covered services are below the maximum amount the federal government will pay private plans in an area (known as the benchmark), the plan retains a portion of the difference, known as the “rebate”. According to the Medicare Payment Advisory Commission (MedPAC), rebates average over $2,300 per enrollee in 2024.

For the remaining 25% of beneficiaries who are in plans with a MA-PD premium (5.0 million), the average premium is $56 per month, and averages $36 for the Part D portion of covered benefits.

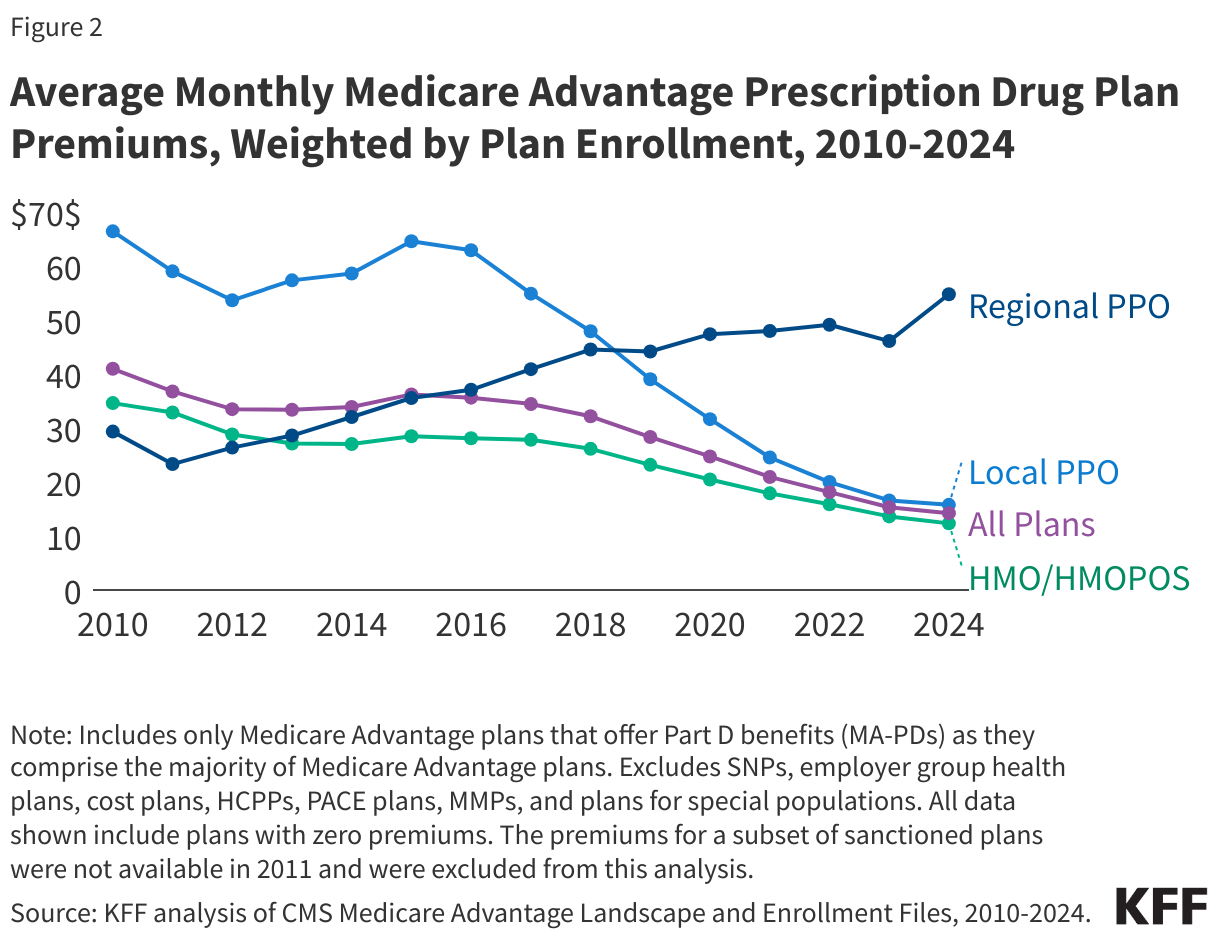
Premiums paid by Medicare Advantage enrollees have declined since 2015.

Average MA-PD premiums have declined from $36 per month in 2015 to $14 per month in 2024. Average MA-PD premiums have declined markedly for local PPOs, declining from $65 per month in 2015 to $16 per month in 2024. Premiums for HMOs have also declined steadily from $28 per month in 2015 to $12 per month in 2024. Only regional PPOs, which represent a very small and declining share of enrollment, have seen an increase in plan premiums over this time from $36 per month in 2015 to $55 per month in 2024. Nearly 6 in 10 Medicare Advantage enrollees are in HMOs (56%), 43% are in local PPOs, and 1% are in regional PPOs in 2024. The reduction for nearly all plans is driven in part by the decline in premiums for local PPOs and HMOs, that account for a rising share of enrollment over this time period, as well as the increase in rebates paid by Medicare to these plans.

Since 2015, a rising share of plans estimate that their cost of providing Medicare Part A and Part B services (the “bid”) is below the maximum amount that CMS will pay in the area where the plan operates (the “benchmark”). The difference between bids and benchmarks enables plans to offer coverage that typically includes extra benefits without charging an additional premium. As plan bids have declined, the rebate portion of plan payments has increased, and plans are allocating some of those rebate dollars to lower the part D portion of the MA-PD premium. According to MedPAC, rebates have increased from an average of about $900 per enrollee in 2015 to over $2,300 per enrollee in 2024. This trend contributes to greater availability of zero-premium plans, which brings down average premiums.

Average Monthly Medicare Advantage Prescription Drug Plan Premiums, Weighted by Plan Enrollment, 2010-2024

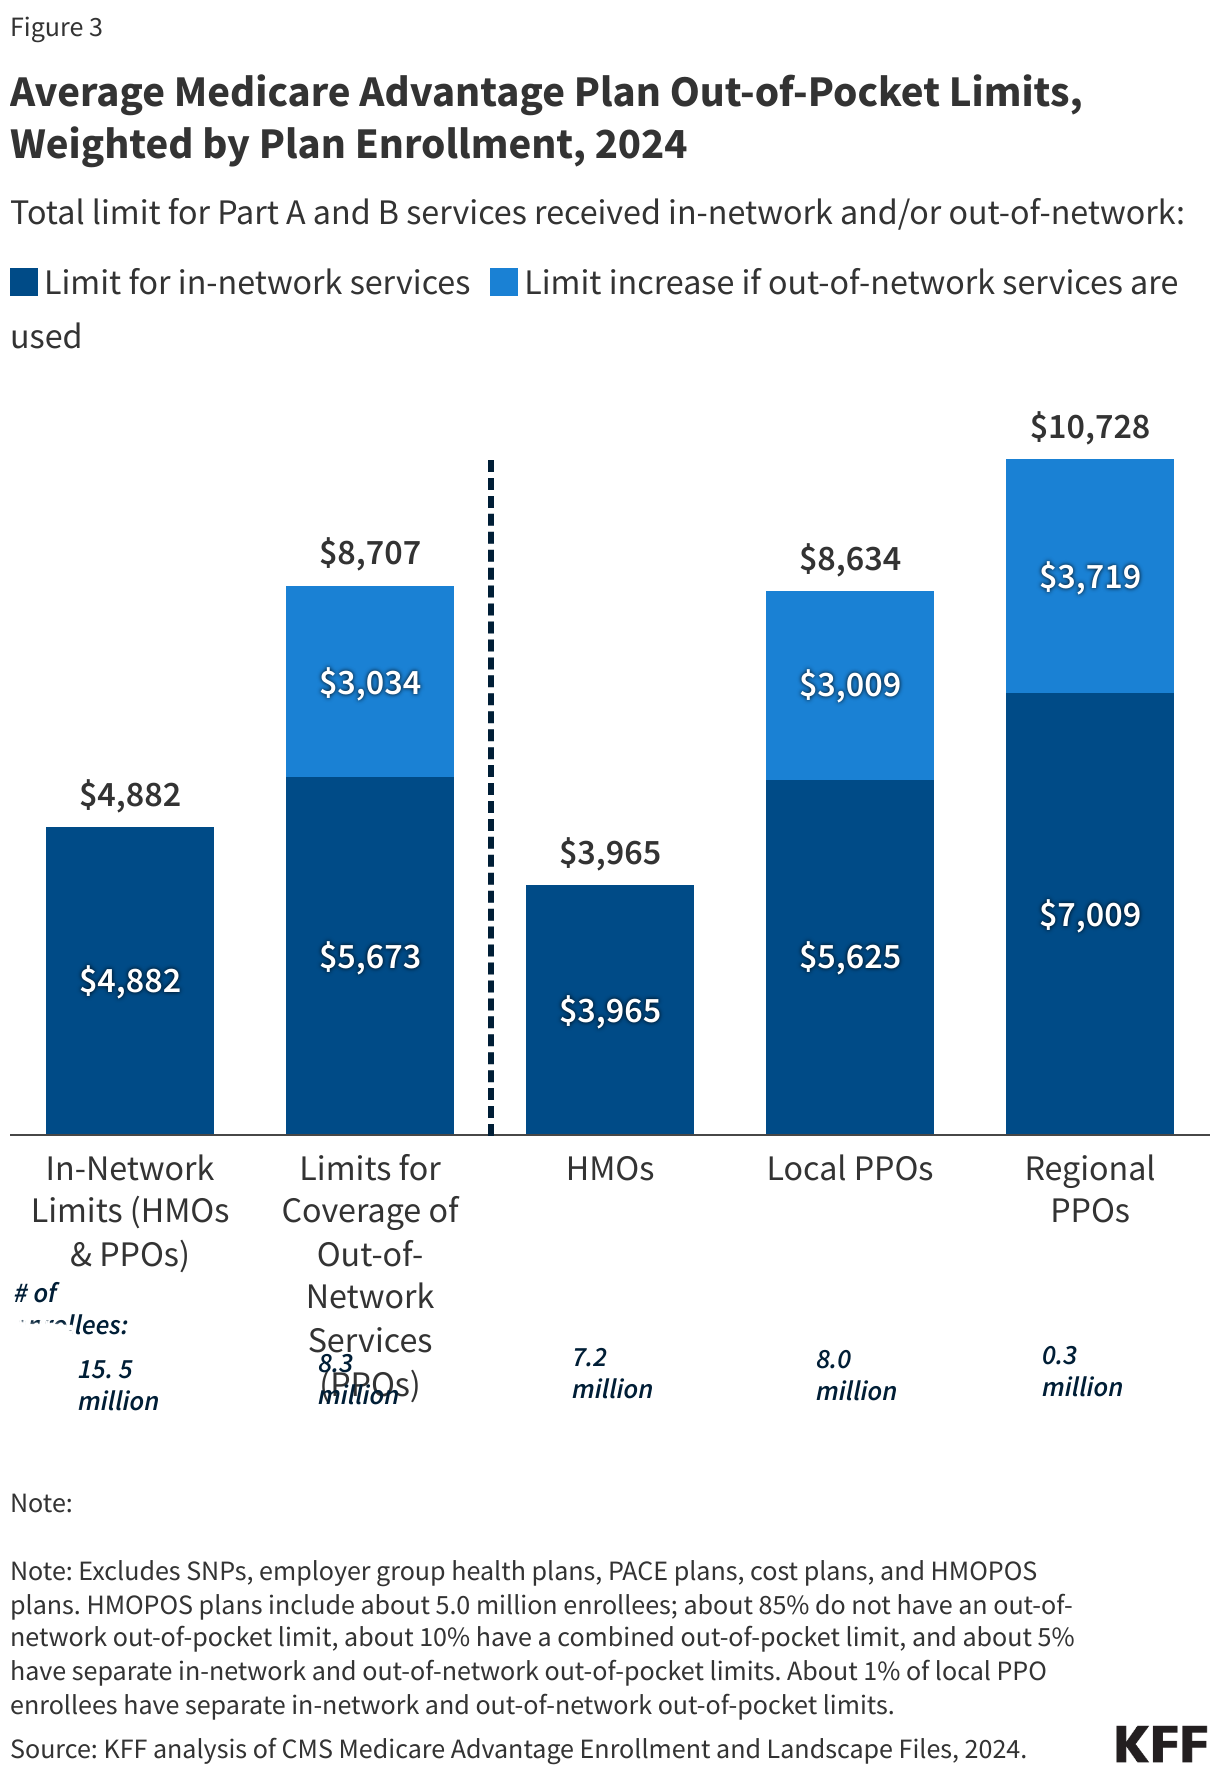
The average out-of-pocket limit for Medicare Advantage enrollees is $4,882 for in-network services and $8,707 for both in-network and out-of-network services (PPOs).

Since 2011, federal regulation has required Medicare Advantage plans to provide an out-of-pocket limit for services covered under Parts A and B. In contrast, traditional Medicare does not have an out-of-pocket limit for covered services.

In 2024, the out-of-pocket limit for Medicare Advantage plans may not exceed $8,850 for in-network services and $13,300 for in-network and out-of-network services combined. These out-of-pocket limits apply to Part A and B services only, and do not apply to Part D spending. Due to a provision in the Inflation Reduction Act, there is a cap in Part D spending of around $3,300 in 2024, and in 2025, Medicare beneficiaries will pay no more than $2,000 out of pocket for prescription drugs covered under Part D.

HMOs generally only cover services provided by in-network providers so typically do not have a limit for out-of-network services. However, about 5 million Medicare Advantage enrollees are in HMOs that are Point-of-Service plans (HMOPOS), which allow out-of-network care for certain services, though they typically cost more than services received in-network. PPOs also cover services delivered by out-of-network providers but charge enrollees higher cost sharing for this care. The size of Medicare Advantage provider networks for physicians and hospitals vary greatly both across counties and across plans in the same county.

In 2024, the enrollment-weighted average for out-of-pocket limits for Medicare Advantage enrollees is $4,882 for in-network services and $8,707 for in-network and out-of-network services combined. For enrollees in HMOs, the average out-of-pocket (in-network) limit is $3,965 (Figure 3). Enrollees in HMOs are generally responsible for 100% of costs incurred for out-of-network care. For local and regional PPO enrollees, the average out-of-pocket limit for both in-network and out-of-network services is $8,634, and $10,728, respectively.

Average Medicare Advantage Plan Out-of-Pocket Limits, Weighted by Plan Enrollment, 2024

The average out-of-pocket limit for in-network services has generally trended down from 2017 ($5,297), though increased slightly from $4,835 in 2023 to 4,882 to 2024. The average combined in- and out-of-network limit for PPOs slightly increased from $8,659 in 2023 to $8,707 in 2024.

Most Medicare Advantage enrollees, including enrollees in special needs plans (SNPs), are in plans that offer some benefits not covered by traditional Medicare in 2024

Virtually all enrollees in individual Medicare Advantage plans (those generally available to Medicare beneficiaries) are in plans that offer primarily health related supplemental benefits including eye exams and/or glasses (more than 99%), dental care (98%) hearing exams and/or aids (96%), and a fitness benefit (95%) (Figure 4). Similarly, most enrollees in SNPs are in plans that offer these benefits. However, benefits such as Part B drug rebate are less common for enrollees in both individual plans (12%) and SNPs (7%). This analysis excludes employer-group health plans because employer plans do not submit bids, and available data on supplemental benefits may not be reflective of what employer plans actually offer.

Though these benefits are widely available, the scope of specific services varies. For example, a dental benefit may include preventive services only, such as cleanings or x-rays, or more comprehensive coverage, such as crowns or dentures. Plans also vary in terms of cost sharing for various services and limits on the number of services covered per year, many impose an annual dollar cap on the amount the plan will pay toward covered service, and some have networks of dental providers beneficiaries must choose from.

Enrollees in SNPs have greater access than other Medicare Advantage enrollees to transportation (91% vs 36%), meal benefits (85% vs 74%), bathroom safety devices (49% vs 31%), and in-home support services (23% vs 9%). However, as noted above, it is not known what share of enrollees have used these benefits because data are not yet available.

Share of Medicare Advantage Enrollees in Plans with Extra Benefits by Benefit and Plan Type, 2024

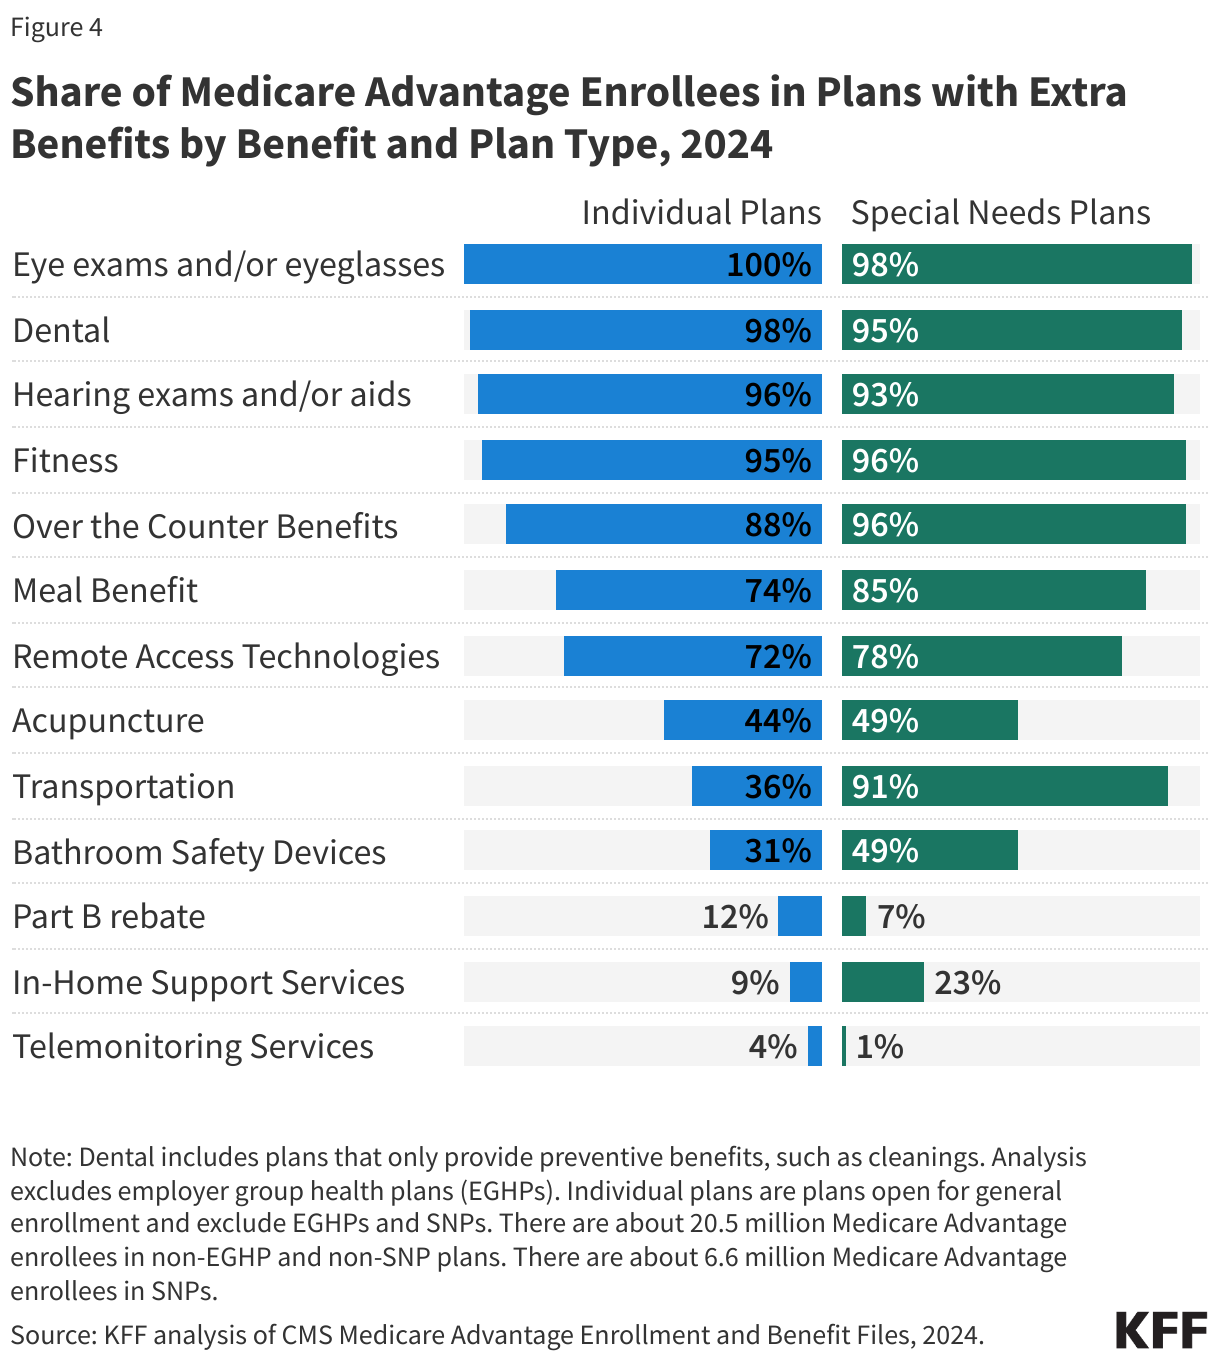
As of 2020, Medicare Advantage plans have been allowed to include telehealth benefits as part of the basic Medicare Part A and B benefit package – beyond what was allowed under traditional Medicare prior to the public health emergency, and was extended to December 2024. Therefore, these benefits are not included in the figure above because their cost is not covered by either rebates or supplemental premiums. Medicare Advantage plans may also offer supplemental telehealth benefits via remote access technologies and/or telemonitoring services, which can be used for those services that do not meet the requirements for coverage under traditional Medicare or the requirements for additional telehealth benefits (such as the requirement of being covered by Medicare Part B when provided in-person). The majority of enrollees in both individual plans and SNPs are in plans that offer remote access technologies (72% and 78%, respectively), but just 4% of enrollees in individual plans and 1% of enrollees in SNPs have access to telemonitoring services.

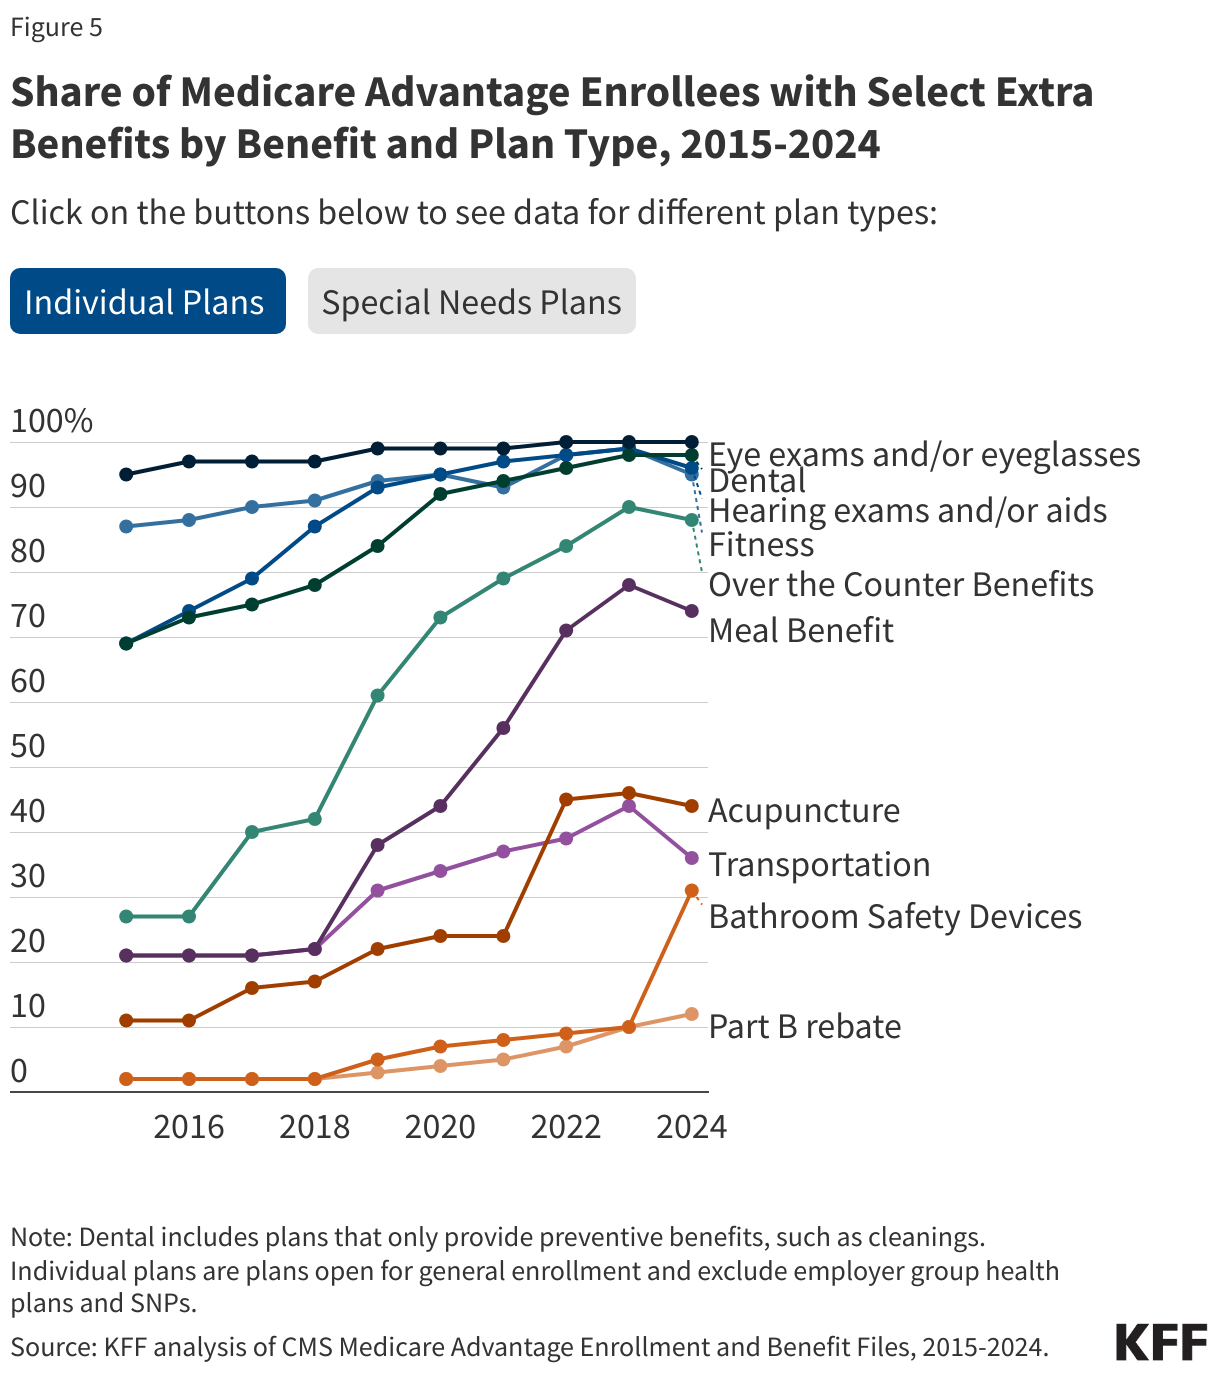
Nearly all Medicare Advantage enrollees are in plans that offer vision, dental, and hearing benefits, similar to 2023, with the share of enrollees in plans that offer many benefits increasing substantially since 2015.

In 2024, there were modest changes to the share of enrollees in plans that offer specific benefits compared to 2023. Similar shares of enrollees in individual plans are in plans that offer eye exams and/or eyeglasses (100% in 2023 and 2024), dental benefits (98% in 2023 and 2024), and hearing exams and/or aids (99% in 2023 vs 96% in 2024) (Figure 5). Smaller shares of enrollees are in plans that offer transportation benefits (44% in 2023 vs 36% in 2024) while a larger share of enrollees is in plans that offer bathroom safety devices (10% in 2023 vs 31% in 2024).

For those in Special Needs Plans, similar shares of enrollees are in plans that offer eye exams and/or eyeglasses (97% in 2023 vs 98% in 2024), dental benefits (95% in 2023 and 2024), and hearing exams and/or aids (92% in 2023 vs 93% in 2024). Larger shares of SNP enrollees are in plans that offer over the counter benefits (84% in 2023 vs 96% in 2024) and bathroom safety devices (15% in 2023 vs 49% in 2024).

Overall, Medicare Advantage enrollees have not experienced a significant loss in benefits despite concerns that changes in Medicare Advantage payment would lead to a drastic reduction in benefits or increase in premiums. While the share enrolled in plans that offer benefits appears to have remained mostly stable from 2023 to 2024 and has increased substantially from 2015 for many benefits, this analysis does not account for any changes to the design of benefits, which could be less robust, even if the benefits are still offered by the plan, such as restrictions on eligibility for these benefits, narrower networks of providers or less comprehensive coverage.

Share of Medicare Advantage Enrollees in Individual Plans with Select Extra Benefits by Benefit and Plan Type, 2015-2024

Enrollees in SNPs are more likely to be in plans that offer Special Supplemental Benefits for the Chronically Ill (SSBCI) than other Medicare Advantage enrollees.

Beginning in 2020, Medicare Advantage plans have also been able to offer supplemental benefits that are not primarily health related for chronically ill beneficiaries, known as Special Supplemental Benefits for the Chronically Ill (SSBCI). In addition, Medicare Advantage plans participating in the Value-Based Insurance Design Model may also offer these non-primarily health related supplemental benefits to their enrollees, but can use different eligibility criteria than required for SSBCI, including offering them based on an enrollee’s socioeconomic status (e.g., LIS eligibility) or whether the enrollee lives in an underserved area.

The vast majority of individual plan enrollees and about half of SNP Medicare Advantage enrollees are in plans that do not offer these benefits. However, while the share in plans that are offered these benefits varies widely, this often translates to a similar number of enrollees. For example, the share of Medicare Advantage enrollees who are offered SSBCI benefits in 2024 is highest for food and produce – 15% for individual plans or about 3.1 million enrollees, while 49% of SNP enrollees are offered these benefits, or about 3.3 million enrollees (Figure 6).

The other SSBCI benefits that are most commonly offered are general supports for living (e.g., housing, utilities) (10% in individual plans and 43% for SNPs) and transportation for non-medical needs (9% for individual plans and 29% for SNPs). A similar share of enrollees in individual plans (5%) are offered pest control, a social needs benefit (e.g., community programs), and meals beyond a limited basis though the share of enrollees in SNPs who have access to these benefits is higher (17%, 15%, and 12%, respectively). Smaller shares of enrollees are in plans that offer indoor air quality equipment and services (e.g., air conditioning units) (4% in individual plans and 12% for SNPs), services supporting self-direction (e.g., power of attorney for health services, financial literacy classes) (3% in individual plans and 12% for SNPs), complementary therapies (those offered alongside traditional medical treatment) (3% in individual plans and 12% for SNPs) and structural home modifications (0.02% for individual plans and 1% for SNPs).

Share of Medicare Advantage Enrollees in Plans with Special Supplemental Benefits for the Chronically Ill (SSBCI), by Benefit and Plan Type, 2024

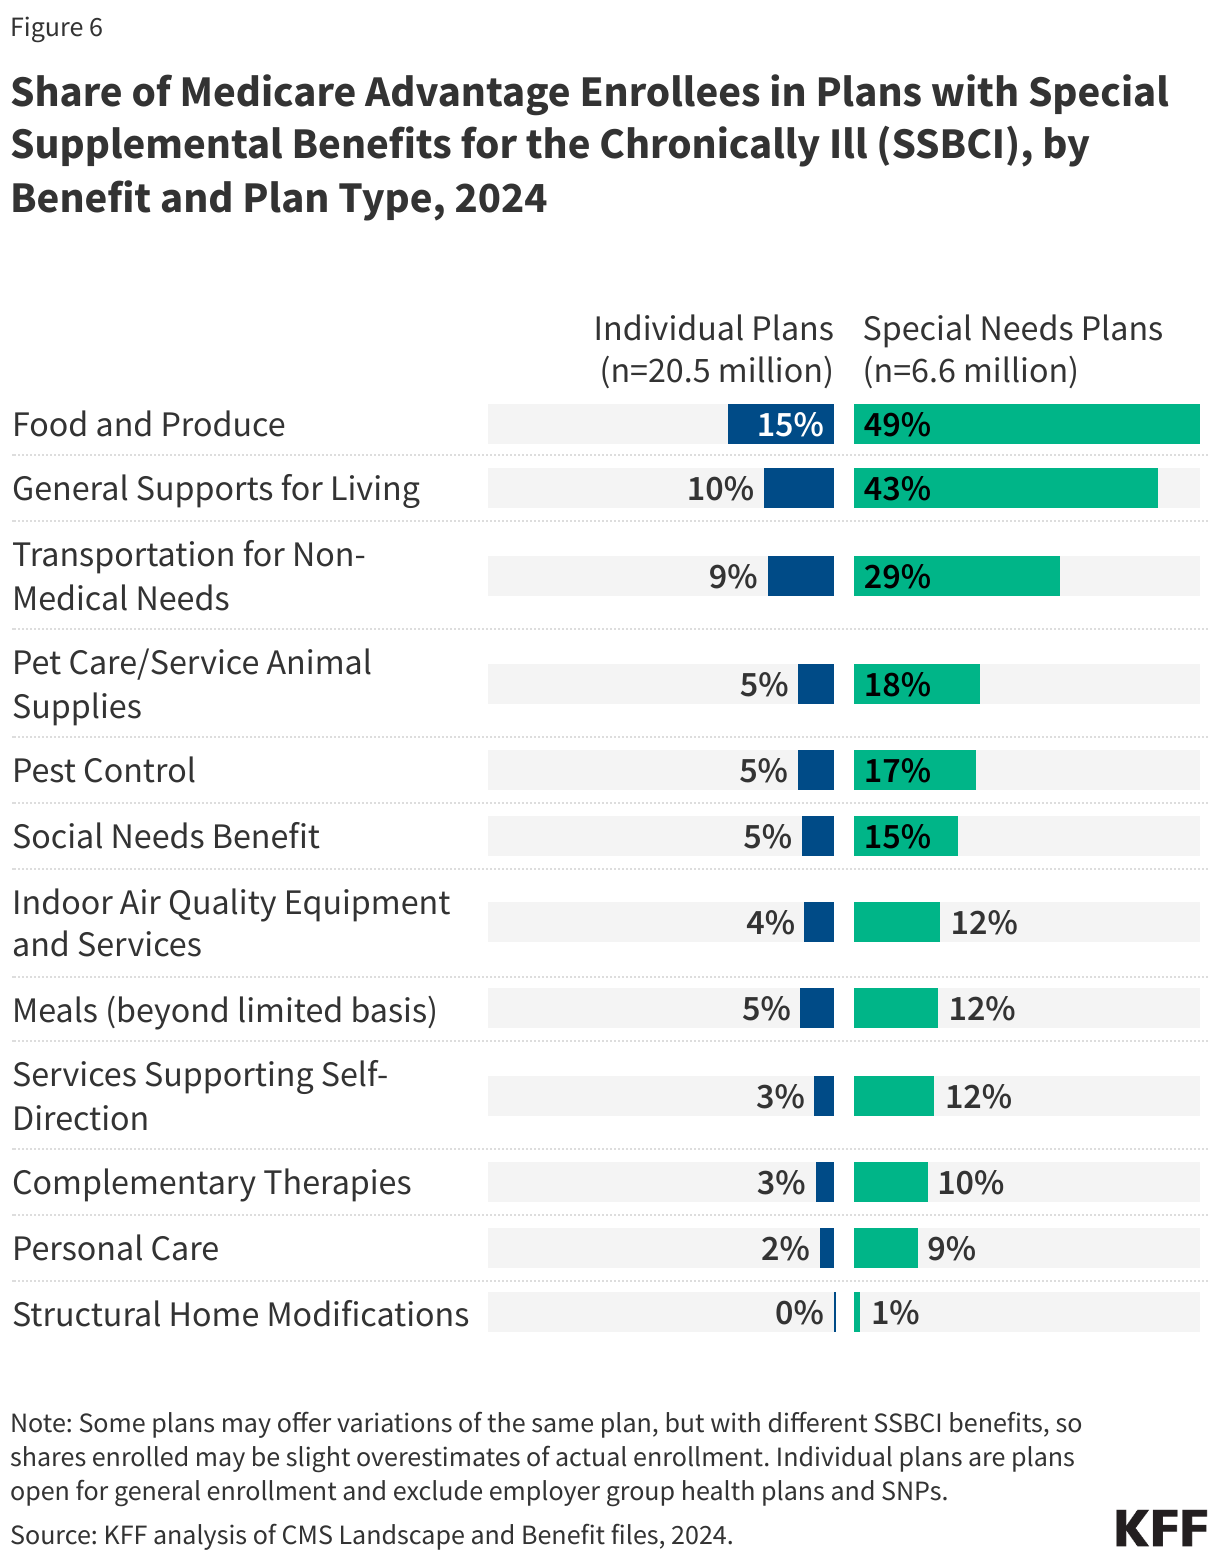
In addition to the 10 initially enumerated examples of SSBCI provided by CMS, plans are also able to offer “other” extra benefits specified by the plan, including pet care/service animal supplies (5% in individual plans and 18% for SNPs) and personal care (2% in individual plans and 9% for SNPs)(Figure 6). About 2% of SNP enrollees are in plans that offer roadside and travel assistance and home cleaning (less than 1% in individual plans), and less than 1% are in SNPs or individual plans that offer hairstyling and beauty care (data not shown), though this is not an exhaustive list of additional benefits plans may offer.

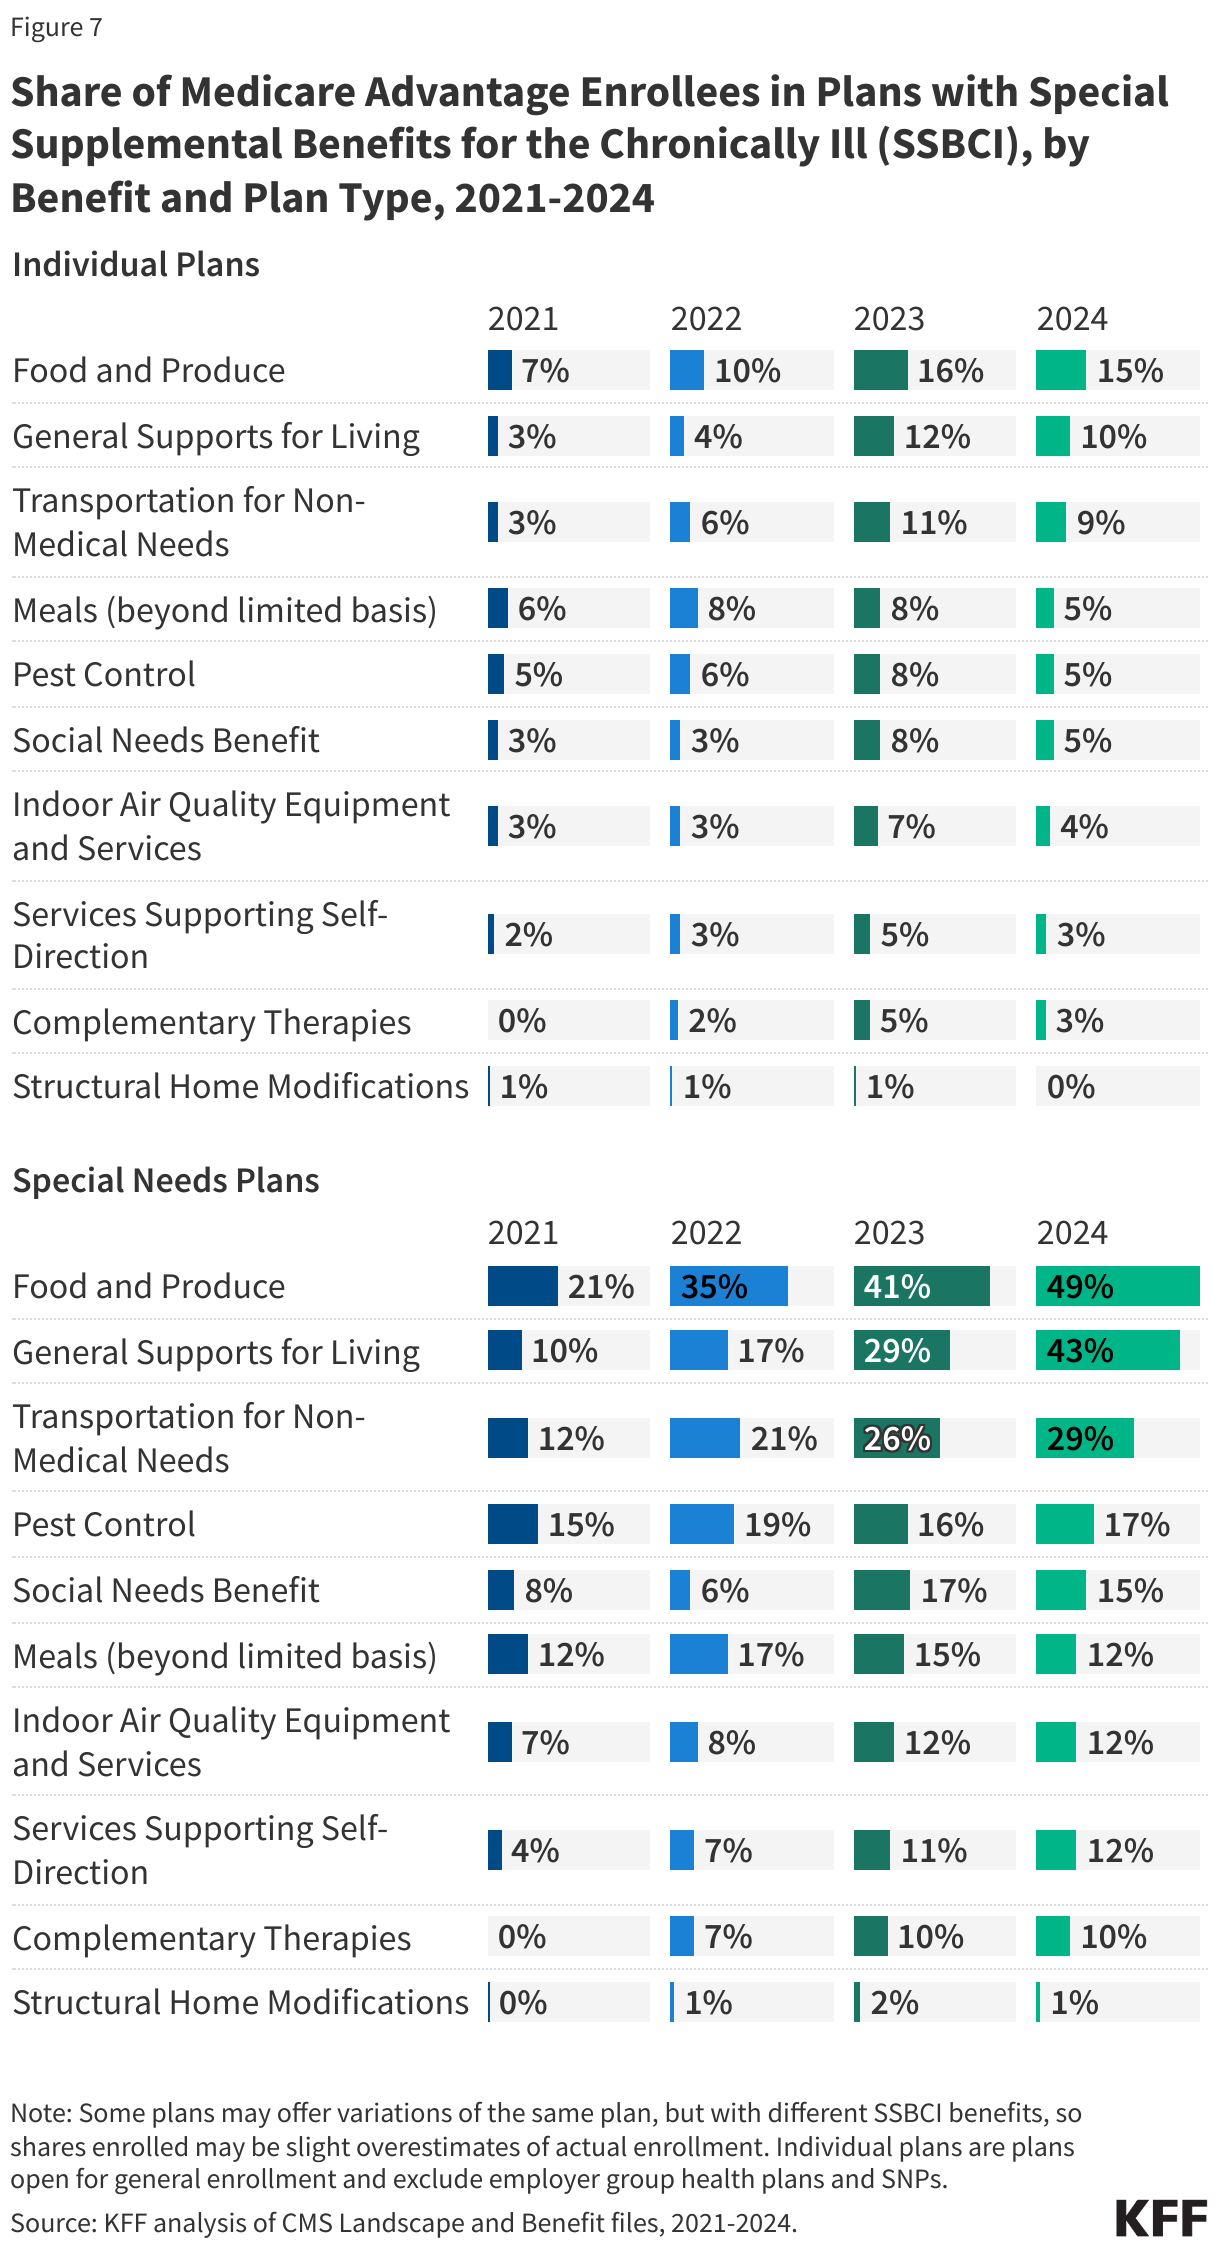
While the share of enrollees with plans that offer some SSBCI benefits has increased since 2021, such as food and produce, growth for other benefits has been much slower.

Though the share of SNP enrollees in plans with food and produce benefits, general supports for living benefits, and transportation for non-medical needs has grown considerably since 2021, the share of enrollment in plans for other SSBCI benefits has grown much more slowly, particularly for enrollees in individual plans (Figure 7). For example, the share of SNP Medicare Advantage enrollees with food and produce benefits in SNPs has more than doubled from 21% in 2021 to 49% in 2024, while for individual plans, the share of enrollees with these benefits has also doubled, but only from 7% to 15%. For general supports for living benefits, the share of SNP Medicare Advantage enrollees with these benefits has more than quadrupled from 10% to 43%, while for individual plans, the share has more than tripled, but only from 3% to 10%.

Like for other supplemental benefits, the scope of services for SSBCI benefits varies. For example, many plans offer a specified dollar amount that enrollees can use toward a variety of benefits, such as food and produce, utility bills, rent assistance, and transportation for non-medical needs, among others. This dollar amount is often loaded onto a flex card or spending card that can be used at participating stores and retailers, which can vary depending on the vendor administering the benefit. Depending on the plan, this may be a monthly allowance that expires at the end of each month or rolls over month to month until the end of the year, when any unused amount expires.

Share of Medicare Advantage Enrollees in Plans with Special Supplemental Benefits for the Chronically Ill (SSBCI), by Benefit and Plan Type, 2021-2024

Nearly all Medicare Advantage enrollees are in plans that require prior authorization for many higher-cost services

Medicare Advantage plans can require enrollees to receive prior authorization before a service will be covered, and nearly all Medicare Advantage enrollees (99%) are in plans that require prior authorization for some services in 2024 (Figure 8). Prior authorization is most often required for relatively expensive services, such as skilled nursing facility stays (99%), Part B drugs (98%), inpatient hospital stays (acute: 98%; psychiatric: 93%) and outpatient psychiatric services (82%) and is rarely required for preventive services (6%). Prior authorization is also required for the majority of enrollees for some extra benefits (in plans that offer these benefits), including comprehensive dental services, and hearing and eye exams. The number of enrollees in plans that require prior authorization for one or more services stayed around the same from 2023 to 2024. In contrast to Medicare Advantage plans, traditional Medicare does not generally require prior authorization for services and does not require step therapy for Part B drugs.

Share of Medicare Advantage Enrollees Required to Receive Prior Authorization, by Service, 2024

Meredith Freed, Jeannie Fuglesten Biniek, and Tricia Neuman are with KFF. Anthony Damico is an independent consultant.

Methods

This analysis uses data from the Centers for Medicare & Medicaid Services (CMS) Medicare Advantage Enrollment, Benefit and Landscape files for the respective year.

In previous years, KFF had used the term Medicare Advantage to refer to Medicare Advantage plans as well as other types of private plans, including cost plans, PACE plans, and HCPPs. However, since 2022, KFF has excluded cost plans, PACE plans, HCPPs in addition to MMPs. We exclude these other plans as some may have different enrollment requirements than Medicare Advantage plans (e.g., may be available to beneficiaries with only Part B coverage) and in some cases, may be paid differently than Medicare Advantage plans. These exclusions are reflected in both current data as well as data displayed trending back to 2010.


A Closer Look at Rape and Incest Exceptions in States with Abortion Bans and Early Gestational Restrictions

Authors: Mabel Felix, Laurie Sobel, and Alina Salganicoff
Published: Aug 7, 2024

Since Roe v. Wade was overturned in June 2022, there has been considerable media attention and legal scrutiny of the health and life exceptions to state abortion bans. This may emerge as an election issue as Former President Trump has stated that he supports rape exceptions to abortion bans, but the 2024 Republican party platform says states should decide their own abortion laws – with no mention of exceptions. The vast majority of Americans – about 8 in 10 – support legal access to abortion for pregnancies resulting from rape or incest. While rape and incest exceptions have been part of the political debate, the feasibility of accessing abortion care under these exceptions has garnered much less attention.

Despite broad support for legal access to abortion in cases of rape or incest, 10 of the 21 states with abortion bans or gestational limits do not have an exception for pregnancies resulting from sexual assault. In the 11 states with rape and incest exceptions, lack of provider availability, law enforcement reporting requirements, and early pregnancy gestational limits can make access to abortion care unattainable for pregnant survivors of sexual assault (Figure 1).

Rape and Incest Exceptions to State Abortion Bans and Restrictions

Rape and incest exceptions to state abortion bans or gestational limits are often restricted to abortion early in pregnancy. Among the 21 states with abortion bans or early gestational limits, 11 make exceptions for pregnancies resulting from rape or incest and 10 do not. Of the 14 states with total abortion bans, nine (Alabama, Arkansas, Kentucky, Louisiana, Missouri, Oklahoma, South Dakota, Tennessee, and Texas) lack a rape or incest exception. The remaining 5 (Idaho, Indiana, Mississippi, North Dakota, and West Virginia) have exceptions for cases of rape or incest but limit these exceptions to the earlier stages of pregnancy. Most pregnant people discover they are pregnant at 5.5 weeks LMP, though people living on lower incomes, younger people, Black and Hispanic people, and those experiencing unintended pregnancies often discover their pregnancies later. Of the 7 states with overall gestational limits between 6 and 15 weeks LMP, six (Florida, Georgia, Iowa, Nebraska, North Carolina, and South Carolina) have rape or incest exceptions. Arizona does not have a rape or incest exception in its law.

Most rape or incest exceptions require involvement of law enforcement, which can restrict abortion access for those who have become pregnant as a result sexual assault. In 5 of the states with rape or incest exceptions – Florida, Georgia, Idaho, Mississippi, and West Virginia – pregnant people must report the sexual assault to law enforcement before they can receive abortion care. Many of these states additionally require that the pregnant person provide the physician a copy of the report ahead of receiving care. In Iowa, sexual assault survivors must report the incident “to law enforcement or a public or private health agency which may include a family physician”– within 45 days of the incident (140 days for cases of incest). In South Carolina, survivors are not required to report their assault to law enforcement before receiving abortion care, but physicians who perform abortions under the rape/incest exception must report the allegation of sexual assault to the sheriff in the county in which the abortion was provided.

It is estimated that only 21% of sexual assaults are reported. Survivors are often afraid to report sexual violence to the police due to fear of retaliation and the belief that law enforcement would not do anything to help.

These requirements can also delay care. There are no clear guidelines specifying how quickly law enforcement must issue a copy of the report in these states. Advocates argue it is difficult to get a copy of a police report while the sexual assault is still being investigated. Among the states that require law enforcement reporting, only Idaho specifies that survivors of sexual assault are entitled to receiving a copy of the report within 72 hours of making the request.

Pregnant people may face difficulty finding an abortion provider or securing an appointment. In states with total abortion bans, few abortion providers remain. Providers in states with early gestational limits (and the few remaining providers in states with total bans) may be unwilling  to provide abortion care in instances of rape or incest – even when there is an exception – out of fear of prosecution. The sexual assault exceptions often do not specifically outline how physicians can ensure that they will not be prosecuted for providing an abortion that falls under the exceptions. In Idaho, Mississippi, and North Dakota clinics and abortion funds have counseled patients to leave the state to obtain abortion care because they have found that it is easier for people to obtain abortion care out of state than to attempt to receive care in-state under the exception.

It is instructive to consider a hypothetical scenario in West Virginia, an abortion ban state with a rape/incest exception.  The state’s total abortion ban has an exception for pregnancies resulting from rape or incest, but only up to 8 weeks LMP (Last Menstrual Period) for adults, typically about 4 weeks after a missed period. Because most people discover they are pregnant at 5.5 weeks LMP, a person who is pregnant as a result of rape or incest in West Virginia typically would have only 2.5 weeks to:

  1. Find and secure and appointment with a physician who is willing and able to provide the abortion
  2. File a report of the assault to law enforcement and retrieve a copy of the report to provide to the physician performing the abortion at least 48 hours before receiving the abortion
  3. Secure sufficient funding to pay for the abortion
  4. Manage other logistical challenges, such as arranging childcare and time off work.

West Virginia’s ban is layered on top of the abortion restrictions implemented before the Dobbs decision: a 24-hour waiting period, mandatory counseling, an ultrasound offer, and for minors, parental or legal guardian notification or a judge’s approval.  The flow chart below shows how tight this timing is. (Figure 2)

Medicaid coverage for abortion care may be inaccessible, even for enrollees who qualify for a rape or incest exception. Although the federal Hyde Amendment requires state Medicaid programs to cover abortions in cases where the pregnancy resulted from rape or incest, many state Medicaid programs impose pre-authorization requirements and medically unnecessary restrictions. As a result, few, if any, pregnant people obtain Medicaid coverage for their abortion care.  For low-income survivors of sexual assault, cost can be an insurmountable barrier to accessing abortion care. In 2021, the median cost of abortion services exceeded $500. However, 43% of women ages 18-49 cannot cover an emergency expense of at least $500 using their current savings, with even larger shares of Black and Hispanic women (57% and 58%, respectively) being unable to cover such an emergency medical expense.

Few people have accessed abortion care under the rape or incest exceptions to state abortion bans. While data from states with abortion bans and exceptions for rape or incest is scant, estimates show that very few abortions are provided in states with total abortion bans, even in those with sexual assault exceptions. For example, Mississippi and Idaho each had 5 documented abortions in 2023, though neither specify the exception under which the abortions were provided. In West Virginia, 23 abortions were provided from January 2023 through June 2024, but none are reported to have been provided under the state’s rape/incest exception. Since Indiana’s total ban went into effect in late August 2023, providers have reported that 5 abortions were provided due to rape or incest.  The true number of pregnancies that result from rape is unknown. Given the extremely low number of abortions states have reported as qualifying for rape exceptions to abortion bans and what is known about the high rates of sexual violence that women experience, it would appear that these exceptions have not provided the level of access to abortion for pregnant rape survivors that the laws presumably are designed to protect.

Gestational Limits and Reporting Requirements in Rape and Incest Exceptions to Abortion Bans

The HPV Vaccine: Access and Use in the U.S.

Published: Aug 5, 2024

Note: This factsheet was updated on October 08, 2024 to incorporate new data on HPV vaccine utilization.The human papillomavirus (HPV) vaccine is the first and only vaccination that helps protect individuals from getting several cancers that are associated with different HPV strains. The vaccine protects young people against infection from certain strains of HPV, the most common sexually transmitted infection (STI) in the United States. Since HPV vaccines were first introduced in the U.S. in 2006, there have been changes in the range of protection they offer and the dosing regimen. The vaccines were originally recommended only for girls and young women and were subsequently broadened to include boys, young men, and people of all genders. This factsheet discusses HPV and related cancers, use of the HPV vaccines for both females and males, and insurance coverage and access to the vaccines.

HPV and Cancer

HPV is the most common STI in the U.S. and is often acquired soon after initiating sexual activity. Approximately 42.5 million Americans are infected with HPV and there are at least 13 million new infections annually. There are more than 200 known strains of HPV, and while most cases of HPV infection usually resolve on their own, persistent infection with high-risk strains can cause cancer. HPV-related cancers have increased significantly in the past two decades — between 2015 and 2019, over 47,000 people in the United States developed an HPV-related cancer compared to 30,000 in 1999. While HPV-related cervical and vaginal cancer rates have decreased since 1999, rates for oropharyngeal and anal HPV-related cancers have increased.

Cervical Cancer

HPV is related to over 90% of cervical cancer cases, with two strains (16 and 18) responsible for approximat­­ely 66% of cervical cancer cases worldwide. In the U.S., it is estimated that 13,820 new cervical cancer cases will be diagnosed in 2024. While cervical cancer is usually treatable, especially when detected early, approximately 4,360 deaths from cervical cancer will occur in 2024. Current guidelines by the U.S. Preventive Services Task Force (USPSTF) and Women’s Preventive Services Initiative (WPSI) recommend that most women ages 21 to 65 receive Pap test once every three years and recommends that women over 30 get a high-risk HPV test every 5 years.

U.S. Preventive Services Task Force Cervical Cancer Screening Recommendation

The USPSTF recommends screening for cervical cancer in women age 21 to 29 years with cytology (pap smear) every 3 years, and for women 30 to 65 a screening with cytology alone every 3 years, or a high risk human papillomavirus (hrHPV) test every 5 years, or cytology in combination with a hrHPV every 5 years.

Despite widespread availability of Pap testing, racial disparities in cervical cancer incidence and mortality rates persist in the U.S. For example, although Hispanic women have the highest incidence rate of cervical cancer, their cervical cancer mortality rates are comparable to the national mortality rate. Black women, on the other hand, have the third highest incidence rate of cervical cancer, yet have the highest mortality rates of the disease (Figure 1). One notable paradox is that Black women also have the highest rates of recent Pap testing. In 2022, 64% of Black women ages 18 to 64 reported having received a Pap smear in the past two years compared to 59% of White women, 60% of Hispanic women, and 57% of Asian women. Lower rates in follow-up treatment after an abnormal pap smear, differences in treatment options, diagnosis at later stages of disease progression, and distrust in the medical system may account for some of the disproportionate impact of cervical cancer on Black women.

Cervical Cancer Incidence and Mortality Rates by Race/Ethnicity, 2018-2022

More than half of cervical cancer cases are detected in women who have never been screened or have not been screened as frequently as recommended in guidelines. Higher shares of Hispanic and Black women have never been screened for cervical cancer compared to White women (14% and 12% percent, respectively, compared to 6% of White women). Additionally, Hispanic women have one of the highest uninsured rates in the country (20%) compared to 6% of White women and 10% of Black women. Compared to women with insurance, uninsured women and women with Medicaid were less likely to access preventive health services such as Pap tests in 2022.

Cervical cancer screening rates declined during the early part of the COVID-19 pandemic. While cervical cancer screening rates have rebounded to a degree, they have not returned to pre-pandemic levels. A KFF survey of OBGYNs found that 71% of physicians reported that it was difficult to provide preventive reproductive health care services, like STI and cervical cancer screenings, during the COVID-19 pandemic. In that same survey, 38% of OBGYNs said they were somewhat or very worried that their patients who experienced delays in following up on abnormal pap smears because of the pandemic would face negative health care consequences.

In May 2024, the U.S. Food and Drug Administration (FDA) approved the use of HPV self-collection methods in healthcare settings, though these methods are not yet widely available. Self-collection will allow women to collect a vaginal swab sample within a healthcare facility without having to see a gynecologist. However, they would not replace screening with pap tests or traditional HPV testing; rather, they would provide patients with a more private, comfortable, and convenient option to test for cervical cancer as well as improve earlier detection of the disease. Currently, the National Cancer Institute is conducting a study to gauge the usability, acceptability, and effectiveness of self-collection methods throughout the United States.

Oropharyngeal and Anal Cancers

Approximately 20,805 cases of oropharyngeal (throat) cancer occur annually in the U.S, most of which (70%) are probably caused by HPV. Oropharyngeal cancers are the most common HPV-associated cancer among men and are more common among men than women (Figure 2). However, it’s important to note that anyone who heavily uses both tobacco and alcohol is at much higher risk of developing these cancers. Research suggests that HPV vaccines can help protect against throat cancer, since many are associated with HPV 16 and 18, two of the strains that the vaccine protects against.

HPV is also responsible for the majority (91%) of the over 7,500 annual cases of anal cancer in the U.S. Most cases of anal cancer are among women (Figure 2), but men who have sex with men are also at higher risk of HPV strains 16 and 18. Additional risk factors for anal cancer include a history of cervical cancer and having a suppressed immune system. Like oropharyngeal cancer, there has been an increase in the rate of anal cancers in the past 15 years.

Rates of HPV-Associated Oropharyngeal and Anal Cancers Among Men and Women, 2015-2019

HPV Vaccines

Since 2016, Gardasil®9 is the only HPV vaccine available in the U.S. The HPV vaccine, as well as all other routine vaccines, may be administered on the same day as any of the COVID-19 vaccines.

The FDA approved first-generation Gardasil®—produced by Merck—in 2006, which prevented infection of four strains of HPV: 6, 11, 16, and 18. In December 2014, Gardasil®9 was approved by the FDA. This vaccine protects against 9 strains of HPV: the four strains approved in the previous Gardasil vaccine, as well as 31, 33, 45, 52, and 58. These strains are associated with the majority of cervical cancer, anal cancer, and throat cancer cases as well as most genital warts cases and some other HPV-associated ano-genital diseases. The vaccine was initially approved for cervical cancer prevention, but in 2020 the FDA broadened its approval to include the prevention of oropharyngeal cancer and other head and neck cancers.

Gardasil®9 has been approved by the FDA for use in individuals ages nine to 45 years (Table 1). The federal Advisory Committee on Immunization Practices (ACIP)—an independent body of experts that issues immunization recommendations for the U.S. population—recommends that all girls and boys get vaccinated at age 11 or 12, or as early as age nine, and that adolescents and young adults ages 13 to 26 be given a “catch-up” vaccination series. ACIP recommends a two-dose series over 6 to 12 months for individuals who received their first vaccine at ages nine to 14. Teens and young adults who initiate vaccination at age 15 or older should receive three doses over six months. These recommendations are designed to promote immunization when the vaccine is most effective – before the initiation of sexual activity. Those already infected with HPV can also benefit from the vaccine because it can prevent infection against HPV strains they may not have contracted, but the vaccine does not treat existing HPV infections.

HPV Vaccine Recommendations by Age

While the FDA expanded it’s approval of the HPV vaccine to include adults ages 27 to 45, ACIP does not recommend routine catch-up vaccinations for all adults in this age group. ACIP recommends that adults ages 27 to 45 who have not been properly vaccinated and who may be at risk for new HPV infections consult with a medical professional about receiving the vaccine.

Current global research suggests Gardasil®9 protection is long-lasting: more than 10 years of follow-up data in both boys and girls indicate the vaccines are still effective and there is no evidence of waning protection, although it is still unknown if recipients will need a booster in the future. Other HPV vaccines show similar effectiveness. In Scotland, recipients of the bivalent HPV vaccine Cervarix®—which protects against HPV 16 and 18—who became fully vaccinated against HPV at age 12 or 13 have had no cases of cervical cancer since the vaccine program started in 2008. Additionally, new data from the American Society of Clinical Oncology shows that the vaccine reduced the risk of all HPV-associated cancers—including oropharyngeal, head, and neck cancers—by 50% in men.

Outreach and Utilization

HPV vaccination rates vary by state, from a low of 39% of adolescents being HPV UTD in Mississippi to a high of 85% in Rhode Island (Figure 3). Some states, such as Hawaii, Rhode Island, Virginia, and D.C., have laws that require HPV vaccination for school entry. In California, the Cancer Prevention Act requires schools to notify families of 6th grade children about HPV vaccine recommendations and advise them to follow guidelines but does not require them to adhere to them for school entry. Vaccine exemptions due to religious or personal beliefs are permitted in most states.

Figure 3 is a map figure titled "HPV Vaccination Rates of Adolescents by State" and breaks down the percentage by state. The 2022 US Average = 62.6%.

Some people begin the vaccine series but do not complete it. In 2023, 78.5% of adolescent girls and 75% of boys received at least one dose of the HPV vaccine. Trends in vaccination coverage show that overall HPV vaccination initiation slightly declined in 2022 for the first time since 2013 among some subgroups of adolescents aged 13-17. While vaccine initiation among adolescents overall remained steady, initiation rates in 2022 decreased among adolescents who were uninsured or covered by Medicaid (Figure 4).

Data from the Vaccines for Children Program (VFC), a federally-funded program that covers the cost of ACIP-recommended vaccines for eligible populations through age 18, show that, compared to 2019, VFC provider orders for the HPV vaccine decreased from 2020 to 2022. Research suggests that the COVID-19 pandemic disrupted the delivery and administration of the HPV vaccine, as well as parents’ and patients’ abilities to attend well-child visits before vaccines became overdue, resulting in lower rates of vaccination.

Vaccine hesitancy during this time may have also contributed to the decline in HPV vaccine initiation. Prior to the COVID-19 pandemic, parents’ top reasons for not vaccinating their children were perceptions of safety concerns and the belief that the vaccine was not needed. Since the COVID-19 pandemic began, some providers have observed an increase in vaccine hesitancy or refusal in parents of adolescents due to difficulties caused by COVID-19 or mistrust in vaccines.

Rates of HPV Vaccine Initiation Among Adolescents Ages 13-17 in the U.S., by Insurance Status

Compared to 2022, national HPV UTD rates among adolescents aged 13-17 remained steady in 2023, with just over 60% being up-to-date. HPV vaccination rates among teen boys are lower than for girls (59% vs. 64% HPV UTD in 2023), but they have been rapidly rising since 2016.  Although HPV UTD rates in adolescents overall has remained steady, recent data shows a decline in vaccination rates by birth year. Compared to 13-year-olds born in 2007, HPV UTD coverage in 13-year-olds born in 2010 decreased by 7.1% overall and 10.3% among those eligible for the VFC program. The Centers for Disease Control and Prevention (CDC) suggest that additional outreach focused on populations that experienced declines in vaccination is needed to further understand the impact of the COVID-19 pandemic on access to and initiation of recommended vaccines.

Vaccine Financing

There are multiple sources of private and public financing that assure that nearly all children and young adults in the U.S. have coverage for the HPV vaccine. Many of the financing entities base their coverage on ACIP recommendations.

The Affordable Care Act (ACA) requires public and private insurance plans to cover a range of recommended preventive services and ACIP recommended immunizations without consumer cost-sharing. Plans must cover the full charge for the HPV vaccine, as well as pap tests and HPV testing for women.

Public Financing

Vaccines for Children — Through the VFC program, the CDC purchases vaccines at a discounted rate and distributes them to participating healthcare providers. All children are eligible through age 18 if they are uninsured, underinsured, Medicaid-eligible, Medicaid-enrolled, or American Indian or Alaska Native.

Medicaid — Medicaid covers ACIP recommended vaccines for enrolled individuals under age 21 through the Early and Periodic Screening Diagnosis and Treatment program (EPSDT). Adults 21 and older who are insured through Medicaid are covered for approved adult ACIP-recommended vaccinations without cost-sharing.

Public Health Service Act — Section 317 of the Public Health Service Act provides grants to states and local agencies to help extend the availability of vaccines to uninsured adults in the United States. These are often directed towards meeting the needs of priority populations, such as underinsured children and uninsured adults.

Merck Vaccine Patient Assistance ProgramMerck has established assistance programs to provide free vaccines in the United States. To qualify, individuals must be aged 19 or older, uninsured, and low-income.

Children’s Health Insurance Program (CHIP) — Children who qualify for CHIP are part of families whose incomes are too high to qualify for Medicaid but too low to afford private insurance. Each state has its own set of specific qualifications for CHIP. The program is managed by the states and is jointly funded by the states and the federal government. CHIP programs that are separate from the Medicaid Expansion must cover ACIP-recommended vaccines for beneficiaries since they are not eligible for coverage under the federal VFC.

The HPV vaccine has been available in the U.S. for nearly two decades and uptake has risen over that time, though more recently since the COVID-19 pandemic there have been notable declines in vaccination rates. Since its introduction in 2006, the vaccine covers more strains of HPV, its use has been extended to males, the dosage has dropped from three to two shots, and the cost is fully covered by private insurance and public programs. With these improvements, the vaccine holds the promise to safely and dramatically reduce the rates of and prevent many kinds of cancers that have long been responsible for the deaths of women and men.