Medicaid Coverage of Pregnancy and Perinatal Benefits: Results from a State Survey

Authors: Kathy Gifford, Jenna Walls, Usha Ranji, Alina Salganicoff, and Ivette Gomez
Published: Apr 27, 2017

Executive Summary

An updated version of this report was released on May 19, 2022 and can be found here.

Correction: While KY and MS responded to the survey that their states cover doula services, subsequent research has found that the states do not cover doula services. To our knowledge, OR and MN, and as of January 2021, NJ, are the only states currently covering doula services.

Overview

Maternity care has emerged as a key issue in the current policy debates about the future of the Affordable Care Act (ACA) and Medicaid restructuring. While the inclusion of maternity care as an essential health benefit has been important to many women who gained private coverage because of the ACA coverage expansion, Medicaid has been the primary funding source for perinatal and maternal services for low-income women in the US for several decades. In 2010, Medicaid financed nearly 45% of all births in the United States.1  By federal law, all states provide Medicaid coverage for pregnancy-related services to pregnant women with incomes up to 133% of the federal poverty level (FPL) and cover them up to 60 days postpartum. All states must provide some level of maternity care free of cost-sharing to eligible pregnant women, although there are state level variations in the scope and type of services that states offer. In addition, many states extend eligibility to pregnant women with incomes considerably higher than this threshold. The ACA broadened Medicaid eligibility by allowing states to extend continuous Medicaid eligibility in 2014 to individuals with family income at or below 138% FPL and 31 states and the District of Columbia (DC) have adopted Medicaid expansion programs which extended coverage for new mothers beyond the postpartum period, where historically many women lost coverage. 2 

Because there is no formal federal definition of what services states must cover for pregnant women beyond inpatient and outpatient hospital care, states have considerable discretion to determine the specific scope of maternity care benefits. While the ACA also does not define maternity benefits, states that have expanded Medicaid eligibility under the ACA must cover all preventive services recommended by the United States Preventive Services Task Force (USPSTF) for beneficiaries that qualify as a result of the ACA expansion. These now include many pregnancy-related services, such as prenatal screenings, folic acid supplements, and breastfeeding supports for those who qualify for Medicaid as a result of the expansion. This coverage requirement, however, does not apply to any of the Medicaid eligibility pathways that were available prior to the ACA (i.e., for parents or pregnant women). As a result, there is leeway for states to vary coverage standards for different Medicaid eligibility pathways (e.g. traditional Medicaid available prior to the ACA, ACA Medicaid expansion, or pregnancy-related eligibility).

To understand how states were covering services under Medicaid in the wake of the ACA expansions, the Kaiser Family Foundation and Health Management Associates conducted a survey of states about the status of Medicaid benefit policies for perinatal and family planning services across the nation. With 31 states and DC adopting Medicaid expansions, the extent to which states had decided to make their programs consistent across the different eligibility categories was unknown. This report, a companion to the Family Planning Report, asked states about benefits in place as of July 1, 2015 for women enrolled in fee-for-service Medicaid through different eligibility pathways, including traditional pre-ACA Medicaid pathways, expansion, and pregnancy-related eligibility for the following services: basic prenatal care, counseling and support services, delivery and postpartum care, and breastfeeding supports. This report presents survey findings for the 40 states and DC that provided responses to the survey. Throughout the report, DC is counted as a state, totaling 41 respondents. As illustrated in Figure 1, of the 41 respondents, 24 states and DC had adopted the ACA Medicaid expansion as of July 1, 2015. This report is the only one we know of that has examined Medicaid benefits for maternity care since the ACA’s passage.
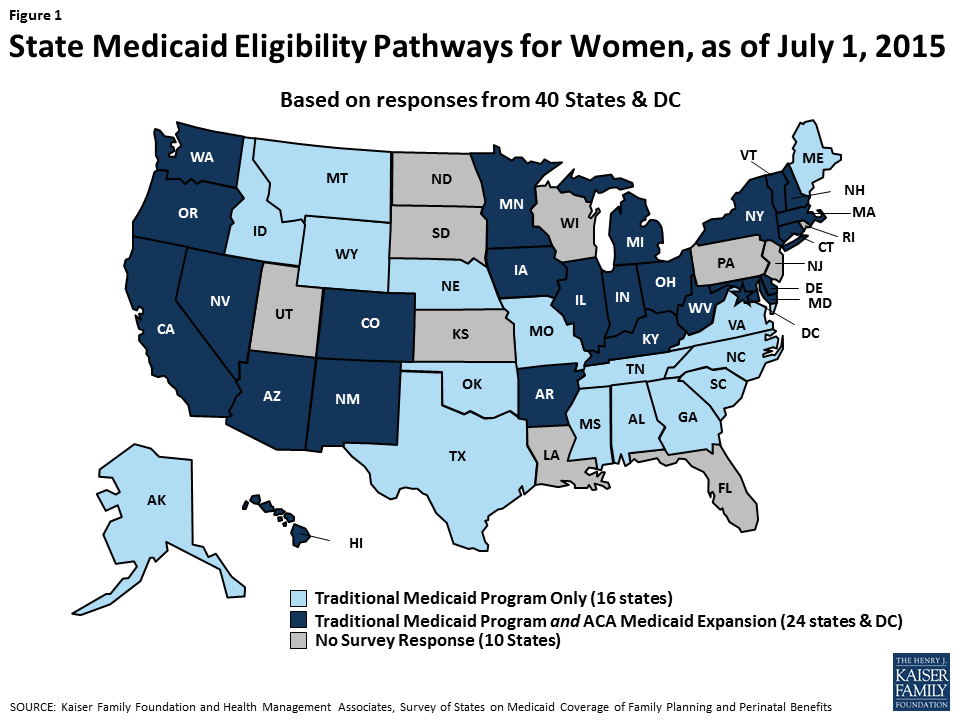
Figure 1: State Medicaid Eligibility Pathways for Women, as of July 1, 2015

Key Findings

While the benefits requirements vary between eligibility pathways, one overarching finding from the survey is that most states provide the same benefits to beneficiaries who qualify through Medicaid’s pregnancy eligibility pathway and adult pathway. Some states reported that in fact, they do not distinguish between the traditional full-scope Medicaid and pregnancy eligibility pathways in terms of the covered benefits. The survey questions covered four broad topics: prenatal services, counseling and support services, delivery and postpartum care, and breastfeeding services. Key findings on these topics are:

Prenatal Services

Prenatal care services monitor the progress of a pregnancy and identify and address potential problems before they become serious for either the mother or baby. Routine prenatal care encompasses a variety of services, including provider counseling, assessment of fetal development, genetic screening and testing, prenatal vitamins that contain folic acid and other nutrients, and ultrasounds, which provide important information about the progress of the pregnancy.

  • All survey states reported that they cover prenatal vitamins and ultrasounds for pregnant women. However, some states impose quantity limits or require a prescription for vitamins.
  • Nearly all responding states (38/41) reported covering amniocentesis and chorionic villus sampling (CVS) tests across all eligibility pathways available in the state, but fewer states (33/41) reported covering genetic counseling, some of which limit the service to women with higher risk or that have a positive result in genetic screens.

Counseling and Support Services

There are a variety of support services that can aid pregnant and postpartum women with pregnancy, delivery, and child rearing and improve birth outcomes. These include educational classes on childbirth and infant care, transportation to appointments, and home visits during or after pregnancy to assist with basic medical care, counseling on healthy behaviors, and in-person infant care assistance.

  • Less than half of the responding states report that they provide education services to support childbirth, infant care or parenting in any of the Medicaid eligibility pathways. However, in some states services may be available through other public programs.
  • Nearly all responding states provide substance or alcohol abuse treatment services for pregnant or postpartum women in most of the Medicaid eligibility pathways.
  • Approximately three-fourths of the responding states cover prenatal and postpartum home visits, which give the opportunity for nurses and other clinicians to assist pregnant women and new parents in their homes with pregnancy management and child rearing skills.

Delivery and Postpartum Care

While all states are required to cover inpatient hospital care for Medicaid enrollees, there is more variation in coverage for delivery at birth centers or home births. Coverage for deliveries at birth centers is required in all states that license such facilities. In addition, coverage for doula assistance, which pays for a trained non-clinician to assist a woman before, during and/or after childbirth, by providing physical assistance, labor coaching, emotional support, and postpartum care is rare.

  • A majority of responding states cover deliveries in birth centers, while half of the states cover home deliveries.
  • Of all the services covered in the survey, coverage was lowest for doula Only four states reported that they cover doula assistance for women.

Breastfeeding Services

  • There is a range of supports that have been found to help women initiate and maintain breastfeeding. These include breast pumps, lactation counseling by certified consultants both inpatient and outpatient after delivery, and educational programs, which can begin during pregnancy and continue after the birth of a child. States are required to cover breast pumps and consultation services for Medicaid expansion beneficiaries under the ACA’s preventive services requirement. A majority of responding states cover both electric and manual breast pumps, but some report using various utilization controls such as prior authorization and quantity limits.
  • While most responding states report that breastfeeding education and hospital-based lactation consultations are covered under traditional Medicaid, far fewer states continue coverage once the woman goes home.

Conclusion

The analysis of state responses to this survey found that overall most states cover a broad range of perinatal services in their full scope traditional Medicaid program, under full scope ACA Medicaid expansion, and pregnancy-related eligibility pathways. Most, but not all, of the 41 surveyed states report that they cover basic prenatal services such as ultrasounds and vitamins, prenatal genetic testing, home visits, delivery in birth centers, postpartum visits, and breast pumps for nursing mothers. Many states recognize that these services are critical to improving birth outcomes. Coverage for services that help women and their families care for their children after delivery, such as childbirth and parenting classes, breastfeeding education and lactation consultation is less common (Table 1). Only half of reporting states cover home births, and very few states cover doula supports despite research suggesting that this assistance results in better health outcomes.3  While coverage requirements differ between eligibility pathways, in general, there is strong alignment within states across the various pathways.

The Medicaid program has a long history and excellent record of providing coverage for low-income pregnant women, with nearly half of all births nationwide provided through the program. Regardless of the outcome of current debates over the future of Medicaid or the ACA, the millions of low-income pregnant women that are served by Medicaid will continue to need to have access to coverage that includes the broad range of pregnancy-related services that help assure healthy maternal and infant outcomes.

Table 1: Summary Results on Coverage of Selected Perinatal Services
States Reporting Coverage Under Traditional Medicaid:
Prenatal Services
Genetic Counseling (33/41 states)AR, CA, CO, CT, DC, DE, GA, HI, IA, IL, IN, KY, MA, MD, ME, MI, MN, MO, MS, MT, NC, NH, NV, NY, OH, OK, OR, SC, TN, TX, VA, VT, WA
Chronic Villus Sampling and Amniocentesis (38/41 states)AK, AR, AZ, CA, CO, CT, DC, DE, GA, HI, IA, ID, IL, IN, KY, MA, MD, ME, MI, MN, MO, MS, MT, NC, NH, NM, NV, NY, OH, OK, OR, SC, TN, TX, VA, VT, WA, WV
Counseling and Support Services
Case Management (35/41 states)AK, AL, AR, AZ, CA, CO, DC, DE, GA, IA, ID, IL, IN, KY, MA, ME, MN, MO, MS, MT, NC, NE, NM, NV, NY, OH, OK, OR, TN, TX, VA, VT, WA, WV, WY
Substance Alcohol Abuse Treatment (40/41 states)AK, AL, AR, AZ, CA, CO, CT, DC, DE, GA, HI, IA, ID, IL, IN, KY, MA, MD, ME, MI, MN, MO, MS, MT, NC, NE, NM, NV, NY, OH, OK, OR, SC, TN, TX, VA, VT, WA, WV, WY
Prenatal and Postpartum Home Visits (30/41 states)AK, AR, CA, CT, DC, DE, GA, IA, ID, IL, IN, MA, MI, MN, MO, MS, MT, NC, NE, NH, NM, NY, OH, OK, OR, SC, VA, VT, WA, WV
Childbirth Education Classes (14/41states)AR, CA, DC, DE, GA, HI, MI, MN, MS, NC, OH, OR, VA, WA
Infant Care/ Parenting Education (17/41 states)AL, AR, CA, DC, DE, GA, HI, KY, MI, MN, MS, NM, NV, OH, OR, VA, WA
Deliveries and Postpartum care
Birth Center Deliveries (32/41 states)AK, AL, AZ, CA, CO, CT, DC, DE, GA, IA, IL, IN, KY, MA, MD, MN, MO, MT, NC, NE, NH, NM, NV, NY, OH, OK, OR, SC, TN, TX, WA, WV
Home Births (21/ 41 states)AK, AZ, CA, CO, CT, IA, ID, IL, MD, MO, NH, NM, NY, OH, OR, SC, TX, VA, VT, WA, WV
Doula Services (4/41 states)KY, MN, MS, OR
Postpartum Visit (41/41 states)AK, AL, AR, AZ, CA, CO, CT, DC, DE, GA, HI, IA, ID, IL, IN, KY, MA, MD, ME, MI, MN, MO, MS, MT, NC, NE, NH, NM, NV, NY, OH, OK, OR, SC, TN, TX, VA, VT, WA, WV, WY
Breastfeeding Services
Breastfeeding Education (27/41 states)AK, AL, AR, AZ, CA, CO, CT, DC, DE, GA, HI, ID, IN, MA, MI, MN, MO, MS, NC, NV, NY, OH, OK, OR, SC, TN, VA
Electric Breast Pumps in Traditional Medicaid Program (35/41 states)AK, AZ, CA, CO, CT, DC, DE, GA, HI, ID, IL, IN, KY, MA, MD, ME, MI, MN, MO, MS, MT, NE, NH, NM, NY, OH, OK, OR, TN, TX, VA, VT, WA, WV, WY
Lactation Consultation in Hospital (26/41 states)AK, AR, AZ, CA, CO, CT, DC, DE, HI, ID, IN, KY, MI, MN, MO, MS, NC, NE, NY, OH, OK, OR, SC, TN, VA, WA
Lactation Consultation in clinic and/or at home (16/41 states)AR, CA, CO*, CT, DC, DE, HI, MN, MS, NC*, NY, OH, OK*, OR, VA*, WA*
NOTES: *CO, NC, OK, VA, & WA cover lactation consultation in clinic, but not in a home visit.

***

Introduction

Overview

Medicaid is the leading source of financing for births in the U.S., covering nearly half in 2010.4  While the federal and state governments jointly finance the program, states operate their programs and establish benefits, eligibility and coverage policies subject to broad federal guidelines. While states must provide eligible pregnant women with coverage of inpatient and outpatient medical care, they can make different choices regarding the broad range of pregnancy-related support services and other non-hospital care offered to pregnant women. To understand variations in the scope of coverage for perinatal and family planning services and related state Medicaid policies across the nation, the staff of the Kaiser Family Foundation and Health Management Associates surveyed states about perinatal and family planning services benefit policies that were in place as of July 1, 2015.

The survey was conducted between October 2015 and February 2016. Forty states and the District of Columbia (DC) responded to the survey. Non-responding states are: Florida, Kansas, Louisiana, New Jersey, North Dakota, Pennsylvania, Rhode Island, South Dakota, Utah and Wisconsin. The survey asked states to consider only state Medicaid policies under fee-for-service when responding to the questions. As illustrated in Figure 2, of the 41 respondents, as of July 1, 2015, 24 states and DC had adopted the ACA’s Medicaid expansion and 16 states had not.5 

Figure 2: State Medicaid Eligibility Pathways for Women, as of July 1, 2015

This report presents the survey findings on 41 states’ Medicaid coverage of perinatal services under fee-for-service as of July 2015 (DC is referred to as a state throughout this report, for simplicity). Summary tables are presented throughout the report and more detailed, state-level tables are presented in Appendix A. A companion report summarizing state Medicaid coverage of family planning services is available on the Kaiser Family Foundation’s website.

Background

For decades, Medicaid has been a critical safety net program for pregnant women. In response to increasing rates of infant mortality, Medicaid eligibility levels were increased incrementally throughout the late 1980s and early 1990s to promote access to early prenatal care and to improve birth outcomes. Prior to the ACA, federal law extended mandatory categorical Medicaid eligibility to pregnant women with family incomes up to 133% of the Federal Poverty Level (FPL), although states had the option of setting income thresholds above this level. Furthermore, pregnancy was considered a preexisting condition in the individual insurance market, and most individual policies required a waiting period or costly riders for maternity coverage. Therefore, Medicaid was virtually the only pathway to coverage for uninsured, low-income, pregnant women.

Coverage under the pre-ACA eligibility pathway for “pregnancy-related services” continued for up to 60 days postpartum. At that point, some women qualified for traditional Medicaid coverage as the parent of a dependent child, but many did not as the income threshold for parents was typically much lower than for pregnant women. This means that some women lost Medicaid coverage 60 days after the birth of a child, although their infant would remain eligible for one year.

The ACA allowed states to extend Medicaid coverage to nearly all individuals with incomes up to 138% FPL regardless of category, creating the structure for continuous coverage before, during, and after pregnancy for many more low-income women. In the 19 states that have not adopted the ACA’s Medicaid expansion, pregnant women typically still lose coverage after the 60-day postpartum period because they are no longer eligible for coverage. Since the ACA’s passage, there are now three major pathways to obtain Medicaid coverage for pregnant women (Table 2).

Table 2: Medicaid Eligibility Pathways for Pregnant Women
Pregnancy-only eligibility – Medicaid coverage available prior to the ACA for pregnant women through 60 days postpartum; all states required to cover pregnant women up to at least 133% FPL
Traditional Medicaid – Medicaid coverage available prior to the Affordable Care Act (ACA) based on an individual having income below a state’s threshold as well as being in one of the program’s eligibility categories: pregnant woman, parent of children 18 and younger, disabled, or over age 65
ACA Medicaid Expansion – The ACA allowed states to eliminate categorical requirements and extend Medicaid to most women and men with family income at or below 138% FPL. States that have adopted this expansion must cover all recommended preventive services without cost sharing for beneficiaries in this pathway.

In addition to increasing income eligibility levels, states have taken other steps to facilitate Medicaid coverage for pregnant women, such as presumptive eligibility, which allows providers to grant immediate, temporary Medicaid coverage to women who meet certain criteria while a formal eligibility determination is being made. For example, regular Medicaid coverage may overlay the presumptive eligibility period and provide a full range of services including prenatal vitamins, genetic counseling, case management services for high risk women, non-emergency medical transportation, and substance or alcohol abuse treatment. Pregnant beneficiaries also cannot be charged any cost-sharing under Medicaid.

Prior to the ACA, there were no federal requirements regarding the scope of services provided to pregnant women in traditional Medicaid or under the pregnancy-only pathway and no requirement to standardize coverage across the pathways. For the ACA Medicaid expansion population, however, the law defines a minimum “Alternative Benefit Plan” (ABP) that states must provide to beneficiaries under the Medicaid expansion option. The ACA specifies that the ABP must include 10 “essential health benefits,” including maternity care and preventive care which must be provided at no cost to the patient.6  The preventive care under this policy includes several services related to maternity care, such as prenatal visits, screening tests, folic acid supplements, and breastfeeding supports and equipment rental (Table 3). Benefit policies for traditional (pre-ACA) Medicaid programs and for pregnancy-only eligibility programs, are not bound by the ABP requirements, which means that the benefit packages can vary within states for different Medicaid populations based on their eligibility pathway.

Table 3: Preventive Services for Pregnant Women Required for Coverage under ACA Medicaid Expansion
Anemia screening on a routine basis for pregnant women
Bacteriuria urinary tract or other infection for pregnant women
Breastfeeding comprehensive support and counseling from trained providers, as well as access to breastfeeding supplies including pumps, for pregnant and nursing women
Depression Screening for all adults, including pregnant and postpartum women
Folic Acid supplements for women who may become pregnant
Gestational diabetes screening for women 24-28 weeks pregnant and those at high risk of developing gestational diabetes
Hepatitis B screening for pregnant women at their first prenatal visit
HIV screening for all pregnant women, including those in labor who are untested or with unknown HIV Status
Rh Incompatibility screening for all pregnant women, and follow-testing for women at higher risk
Tobacco use screening and interventions for all women, and expanded for pregnant tobacco users
Syphilis screening for all pregnant women and other women at increased risk
SOURCE: HHS, Preventive Services Covered Under the Affordable Care Act, September 27, 2012

This survey asked states about the scope of coverage for pregnancy-related benefits under multiple eligibility pathways for Medicaid. Detailed findings from 40 states and DC on commonalities and differences between and within states are presented for routine prenatal services, counseling and support services, delivery and postpartum care, and breastfeeding supports. Coverage of postpartum contraception is discussed in a companion report on coverage of family planning services, available on the Kaiser Family Foundation’s website.

Survey Results

Correction: While KY and MS responded to the survey that their states cover doula services, subsequent research has found that the states do not cover doula services. To our knowledge, OR and MN, and as of January 2021, NJ, are the only states currently covering doula services.

Prenatal Services

Prenatal care services monitor the progress of a pregnancy and identify and address potential problems before they become serious for either the mother or baby. Increasing the share of pregnant women who begin care in the first trimester is one of the national objectives of the federal government’s Healthy People 2020 initiative.7  Routine prenatal care encompasses a variety of services, including provider counseling, assessment of fetal development, screening for genetic anomalies, prenatal vitamins that contain folic acid and other nutrients, and ultrasounds, which provide important information about the progress of the pregnancy.

PRENATAL VITAMINS AND ULTRASOUND

Key Finding: Prenatal Vitamins and Ultrasound

All states cover prenatal vitamins and ultrasounds for pregnant women. Some states impose quantity limits or require a prescription for vitamins.

All states that responded to the survey reported that they cover prenatal vitamins and ultrasounds for pregnant women regardless of eligibility pathway (Table 4). Some states impose limitations on this coverage however, such as requiring a prescription for prenatal vitamins or limits on the number of ultrasounds allowed during the course of a pregnancy.

Table 4: Coverage and Utilization Controls for Prenatal Vitamins and Ultrasounds
Traditional Medicaid(n=41)Medicaid ACA Expansion(n=25)Pregnancy Only Medicaid(n=41)
Prenatal Vitamins412541
Ultrasound412541
Limitations and Utilization Controls
 Prenatal VitaminsUltrasound
Prescription or other documentation (4)AK, CO, CT, NY
Price/quantity controls (6)ARAL, CO, MO, SC, TX
Prior Authorization to exceed state quantity limits (3)AL, SC, TX
Age limitations (1)MS – limited to ages 8-50
Preferred Drug List (PDL) (1)MS
Pregnancy status (e.g. high-risk) (2)TX, WV

Appendix Table A1 provides state detail for states’ prenatal service coverage policies.

Genetic Screening Services

Key Finding: Genetic Screening Services

Nearly all responding states reported covering CVS and amniocentesis across all eligibility pathways available in the state, but fewer states reported covering genetic counseling service, which is generally limited to women with higher risk or for those that have a positive result in genetic screens.

Table 5: State Coverage for Genetic Lab and Counseling Services
Traditional Medicaid(n=41)ACA Medicaid Expansion(n=25)Pregnancy Only(n=41)Not Covered in Any Pathway(n=41)
Genetic Counseling3321338
Chronic Villus Sampling3824383
Amniocentesis3924392

Routine prenatal care typically includes ultrasound and blood marker analysis to determine the risk of certain birth defects such as sickle cell, down syndrome, or other birth abnormalities. While these tests are effective screening tools to determine risk, they are not diagnostic. If the results of screening tests are abnormal, genetic counseling is recommended and additional testing such as chorionic villus sampling (CVS) or amniocentesis may be needed.

States were questioned about their policies with respect to genetic counseling, CVS, and amniocentesis testing for pregnant women. Of the 41 responding states, 33 reported covering all three services across all eligibility pathways (Table 5). Genetic counseling is covered in fewer states than either of the screening tests. The eight states that do not provide genetic counseling services through any Medicaid pathway are Alabama, Alaska, Arizona, Idaho, Nebraska, New Mexico, West Virginia, and Wyoming. Only one state, Nebraska, does not cover any of the three services under any of its eligibility pathways, but the state noted that genetic testing is covered for the mother and baby with prior authorization after delivery. Few states reported utilization controls or limitations. Medical necessity and an indication of risk for genetic anomalies were the most frequently noted restrictions. Appendix Table A2 provides detail on state Medicaid policies for genetic testing and counseling.

Counseling and Support Services

There are a variety of support services that can aid pregnant and postpartum women with pregnancy, delivery, and child rearing. These include educational classes on childbirth and infant care, transportation to appointments, and home visits during or after pregnancy to assist with basic medical care, counseling on healthy behaviors, and in person infant care assistance.

Childbirth and Parenting Education

Key Finding: Childbirth & Parenting Education

Less than half of the responding states report that they provide education services to support childbirth, infant care or parenting in any of the Medicaid eligibility pathways.

Less than half of responding states reported that they cover childbirth and parenting education for pregnant women (Table 6). The 13 states that cover both services are: Arkansas, California, District of Columbia, Delaware, Georgia, Hawaii, Michigan, Minnesota, Mississippi, Ohio, Oregon, Virginia and Washington. Conversely, two-thirds of states indicated they do not cover childbirth education in any of their programs (27 of 41 states) and over half indicated they do not cover formal or standalone infant care or parenting education (24 of 41 states). Among the states that reported that they do not cover educational services, some stated that such services are available through other public programs and some reported they provide education as part of prenatal visits. See Appendix Table A3 for details on states’ coverage of childbirth and parenting education.

Table 6: State Coverage for Childbirth and Parenting Education Services
Traditional Medicaid(n=41)Medicaid ACA Expansion(n=25)Pregnancy Only Medicaid(n=41)Not Covered in AnyMedicaid Program
Childbirth Education1491427
Infant care/Parenting education17121724

Case Management and Substance Abuse Treatment

Key Finding: Case Management and Substance Abuse Services

Over three quarters of responding states indicated that they cover case management services for pregnant women across all Medicaid eligibility pathways. Nearly all states surveyed reported that they cover substance/alcohol abuse treatment for pregnant women

Case management can help pregnant women obtain and coordinate services that may be available from multiple providers. Six states do not provide case management in any Medicaid pathway: Connecticut, Hawaii, Maryland, Michigan, New Hampshire, and South Carolina. While the service is not separately billable, Connecticut notes that case management would be covered as part of a hospital admission or through a clinic or office visit. Most of the remaining 35 states provide case management through all eligibility pathways, with exceptions noted in Appendix Table A4.

Case management is often limited to women at higher health risk, or with medical conditions. For instance, Missouri noted that participants must qualify for case management services; Nebraska does not provide the benefit universally, rather it is based on the need of the individual; West Virginia provides the service through its targeted case management program based on medical need. Four states also noted that the case management benefit is provided through managed care or utilization management contracts.

Misuse of alcohol and other substances during pregnancy is correlated with a wide range of negative infant outcomes, including premature birth, fetal alcohol syndrome, and infant drug withdrawal. The ACA requires states to cover counseling services for alcohol misuse for beneficiaries enrolled under the ACA’s Medicaid expansion option.

All states surveyed reported that they cover substance/alcohol abuse treatment for pregnant women in at least one Medicaid eligibility pathway and most states align coverage across pathways (Table 7). New Hampshire is the only state that reported it does not cover substance abuse treatment in its traditional Medicaid pathway. Appendix Table A4 provides detail around state coverage of case management services and substance and alcohol use treatment for pregnant women.

Table 7: Number of States Covering Counseling and Support Services
Traditional Medicaid(n=41)ACA Medicaid Expansion(n=25)Pregnancy Only(n=41)Not Covered in Any Program(n=41)Utilization Controls
Case Management3519326
  • High risk or other medical criteria (AZ, MO, MT, NE, WV)
  • Components of contracted services (DC, GA, MS, WY)
  • Not separately billable (CT)
Substance/ Alcohol Abuse Treatment 40Required38

Home Visiting Services

Key Finding: Home Visiting Services

Most of the responding states indicated they cover prenatal and postpartum home visits.

Home visits both during and after pregnancy can help pregnant and postpartum women care for themselves as well as their newborns. Typically conducted by nurses and social workers, they may use the time at home visits to counsel new and expectant parents on a wide range of subjects related to healthy pregnancies and raising healthy children, such as diet and nutrition, basic infant care, breastfeeding, and positive child development. These visits are meant to provide the time for deeper, one-on-one contact and counseling that pregnant women and new parents may not have during routine prenatal and well-baby appointments. Research has found that home visits are associated with a variety of positive outcomes, including lower severity of postpartum depression and improved mother-child interactions.8  Home visits may also cover management of substance abuse, depression, and other chronic conditions. As shown in Table 8, over a quarter of responding states do not provide prenatal home visit supports in any Medicaid program (11 of 41 states). Nearly one fifth (8 of 41 states) do not provide postpartum home visit supports. Of the 30 states that cover both prenatal and postpartum home visits, nearly all provide the service across all eligibility pathways.

Three states provide postpartum home visits but do not provide prenatal home visits through any pathway: Alabama, Maryland and Tennessee. Some states cover prenatal or postpartum home visits under limited circumstances. For example, Michigan notes that the state allows three postpartum home visits only when a physician has determined the mother or newborn to be at risk. Appendix Table A5 details state coverage policies on home visiting services.

Table 8: Number of States Covering Prenatal and Postpartum Home Visits
 Traditional Medicaid(n=41)ACA Medicaid Expansion(n=25)Pregnancy Only(n=41)Not Covered in Any Program(n=41)Utilization Controls
Home Visit- Prenatal30172911
  • High risk or other medical criteria (CT, MI, MT)
  • A component of contracted services (GA)
  • Quantity controls or requirements (MI)
Home Visit- Postpartum3319318
  • High risk or other medical criteria (CT, MI)
  • A component of contracted services (GA)
  • Quantity controls or requirements (MI, NY, WV)
  • Not separately billable (AL)

Delivery and Postpartum Care

Key Finding: Delivery & Postpartum Care

A majority of responding states reported that they cover deliveries in birth centers but only half cover home deliveries. Very few states noted utilization controls for delivery options, and usually restrictions are related to provider requirements. Four states reported covering doula assistance.

The survey questioned states about the provision of specific delivery services including deliveries at birth centers, home births, doula assistance, and postpartum visits. A doula is a trained non-clinician who assists a woman before, during and/or after childbirth, by providing physical assistance, labor coaching, emotional support, and postpartum care.

Birth center delivery is more likely to be a covered benefit than is home birthing (Table 9). Over three-quarters of responding states (32 of 41) cover deliveries in birth centers compared with about half (21 of 41) covering home births. All states that cover the options within their traditional Medicaid program also provide coverage across all eligibility pathways available within the state. Per the ACA, coverage for deliveries at birth centers is required in all states that license such facilities. There is no comparable requirement for coverage of home births, but in states that have chosen to cover home births, some such as Colorado and Virginia reported that the births must be performed by Certified Nurse Midwives.

All states covered postpartum visits in all eligibility pathways except Oklahoma which does not cover the benefit in its program for pregnant women. Illinois and Texas allow reimbursement for one postpartum procedure per pregnancy. In Texas, the reimbursement covers all postpartum care regardless of the number of visits provided.

Conversely, the only states that cover doula services are Kentucky, Minnesota, Mississippi and Oregon, and they cover the service in all available eligibility pathways.9  Appendix Table A6 presents state coverage of delivery options and postpartum care.

Table 9: States Covering Delivery Services
 Traditional Medicaid(n=41)ACA Medicaid Expansion(n=25)Pregnancy Only Medicaid(n=41)Not Covered in Any Program
Birth Centers3221329
Home Births21152120
Doula Services43437
Postpartum Visit4125400

Breastfeeding Services

Raising breastfeeding rates is one of the country’s national Healthy People 2020 goals.10  There is a range of supports that have been found to help women initiate and maintain breastfeeding, including breast pumps, lactation counseling by certified consultants both inpatient and outpatient after delivery, and educational programs, which can begin during pregnancy and continue after the birth of a child. States are required to cover breast pumps and consultation services for Medicaid expansion beneficiaries under the ACA’s preventive services requirement.

Breast Pumps

Key Finding: Breast Pump Coverage

A majority of responding states cover both electric and manual breast pumps, but some report using various utilization controls such as prior authorization or quantity limits.

Most responding states report that they cover electric breast pumps (35 of 41 states) and manual pumps (31 of 41 states) in their traditional Medicaid program (Table 10).11  All states that cover pumps in their traditional Medicaid program also cover the benefit in all eligibility pathways except Illinois and Oklahoma, which do not provide the benefit in their program for pregnant women. Six states do not provide either electric or manual pumps under either their traditional Medicaid program or their pregnancy-only eligibility pathway: Alabama, Arkansas, Iowa, North Carolina, Nevada, and South Carolina (Figure 3).12 

Figure 3: Traditional Medicaid Coverage of Breastfeeding Pumps
Table 10: Breastfeeding Supplies
Traditional Medicaid(n=41)Pregnancy Only Medicaid(n=41)Not Covered in Any Pathway(n=41)
Electric Breast Pump35336
Manual Breast Pump312910
*While coverage of breast pumps is required for all ACA Medicaid expansion enrollees, coverage detail regarding the type of pump covered was not reported by Arkansas, Iowa or Nevada.
Breast Pump Utilization Controls

Several states reported utilization controls for breast pumps. As shown in Table 11, prior authorization is the most frequently employed utilization control, followed by quantity/time limits. Some states noted multiple utilization policies. For instance, Colorado requires prior authorization for electric pumps. The state allows rental or purchase of a breast pump based on the situation of the infant or mother. The state covers rental of an electric pump when the infant is expected to be hospitalized for less than 54 days, but allows breast pump purchase for hospital stays expected to last longer than this.

For quantity/time limits, Massachusetts limits the purchase of either an electric pump or manual to one per member every five years. Ohio limits electric pumps to one every five years, and a manual pump to one every 24 months but did not specify rental or purchase requirements. Texas limits the purchase of an electric or manual breast pump to one every three years, but does not time-limit the rental of a hospital grade pump. Appendix Table A7 provides policy detail around state Medicaid coverage for breast pumps.

Table 11: Utilization Controls Applied to Breast Pump Benefit
Utilization ControlStates with Utilization Policy
Prior Authorization (7)CO, MA*, MI*, MO, MT, OH*, WA
Limited to mothers with critical care/NICU infants (3)CO, MI, TN
Quantity/time limits (4)MA, MI, OH, TX,
Conditions determine rental or purchase (3)CO, MI, TX*
Limited to rental (2)Rental: MT, WA
*MI: Prior authorization is not required when standards of care are met. It is required for rental beyond 3 months.MA and OH: Prior authorization required to exceed quantity limit.TX: Purchase of a breast pump is limited to one per three years. Rental is not time-limited.

Breastfeeding Education and Lactation Consultation

Key Finding: Breastfeeding Education and Lactation Consultation

Most responding states reported that breastfeeding education and hospital-based lactation consulting services are covered under traditional Medicaid, but most states do not provide lactation consultation in settings other than a hospital.

The survey asked about coverage for breastfeeding education such as classes and about coverage for lactation consultation in the hospital, clinic/outpatient, and home settings. There is more variation across the states in the coverage of breastfeeding education and consultation than for breast pumps. As shown in Table 12, 27 of 41 responding states cover breastfeeding education under traditional Medicaid. Individual lactation consultant services are most likely to be covered in the hospital setting. Nearly two-thirds of states responding to the survey stated they cover services in the hospital compared with a little over one-third of responding states providing the service in an outpatient/clinic setting, and less than a quarter of states providing the benefit for postpartum women in their homes.

States did not report utilization controls for breastfeeding support services but a few states noted provider requirements. For example, Connecticut allows the services in hospital and clinic settings if provided by any of these licensed provider types: Physician, DO, Physician Assistant, Advanced Practice Registered Nurse (APRN), or Certified Nurse Midwife (CNM), and is a component of the hospital or clinic reimbursed services. In New York, qualified practitioners for Medicaid reimbursable lactation counseling must be state licensed, registered, or certified health care professionals who are International Board Certified Lactation Consultants (IBCLCs) credentialed by the International Board of Lactation Consultant Examiners (IBLCE) and one of the following: Physician, Nurse Practitioner, Midwife, Physician Assistant, Registered Nurse.

Table 12: State Coverage for Breastfeeding Support Services
Traditional Medicaid(n=41)ACA Medicaid Expansion(n=25)Pregnancy-OnlyMedicaid(n=41)Not Covered in Any Program(n=41)
Breastfeeding Education 27152614
Individual Lactation Consultation
  • Hospital Based
26162515
  • Outpatient Clinic
16121525
  • Home Visit
11101130
Alignment Across Eligibility Pathways and Reimbursement Mechanisms

In the 27 states that cover breastfeeding education in their traditional Medicaid program, coverage is aligned across the three Medicaid eligibility pathways, except in Nevada, which provides the service under traditional Medicaid, but not through the ACA Medicaid expansion or through the state’s program for pregnant women.

However, there is more variation between eligibility pathways for coverage of lactation consultation. Of the 26 states that cover individual lactation services, only 11 cover hospital-based, outpatient, and home consultations services in all of the eligibility pathways available in the state: Arkansas, California, Connecticut, District of Columbia, Delaware, Hawaii, Minnesota, Mississippi, New York, Ohio, and Oregon. All of the 26 states cover inpatient consultation in all of their pathways, with the exception of Oklahoma in the pregnancy only pathway.

Many states reported that reimbursement for lactation consultation is not a separately reimbursable service but is included as a component of other services provided (Table 13), most frequently as a component of hospital reimbursement (11 states). For example, Connecticut noted that the service is not a separately billable service but it is covered as part of a clinic/office visit or hospital stay.

Table 13: Reimbursement Methodologies for Lactation Consultant Services
Included in Hospital DRG or Global Fee (10)Included in Outpatient Clinic Visit (3)Included in Home Visit (2)
  • Arkansas
  • Arizona
  • Colorado*
  • Connecticut
  • Kentucky
  • Michigan
  • Missouri
  • Oklahoma
  • Virginia
  • Washington


  • Arkansas
  • Colorado*
  • Connecticut


  • Arkansas
  • Connecticut
* Colorado provides the service as a part of problem specific care, or a special program service such as the Nurse Home Visitor Program but not separately reimbursable.

Appendix Table A8 reports coverage policies for breastfeeding education services across the states. Appendix Table A9 presents information on states’ coverage of lactation consultation and Appendix Table A10 compares coverage within states between eligibility pathways.

Conclusion

The survey of state responses found that in 2015, most states cover a broad range of perinatal services in their full scope traditional Medicaid program, under full scope ACA Medicaid expansion, and pregnancy-related eligibility pathways. Most of the 41 surveyed states report that they cover basic prenatal services such as ultrasounds and vitamins, prenatal genetic testing, home visits, delivery in birth centers, postpartum visits, and breast pumps for nursing mothers. Coverage for services that help women and their families care for their children after delivery, such as childbirth and parenting classes, breastfeeding education and lactation consultation is less common. In particular, very few states cover doula supports despite research suggesting that this assistance results in better health outcomes.13  While coverage requirements differ between eligibility pathways in some cases, for the most part, there is strong alignment within states for the various pathways.

Maternity care is typically reimbursed with a global fee that covers all care for pregnant women through the postpartum period. Some states reported that support services, such as childbirth and breastfeeding education are included in the global fee and are not reimbursed separately. In these cases, the structure of the benefit is not clear, particularly who would provide these services and the scope of services available to beneficiaries.

Medicaid enrollment across the country has risen significantly since the ACA’s passage but in states that have not expanded eligibility under the ACA, many women lose coverage after 60 days postpartum and become uninsured. Furthermore, it is important to recognize the ACA’s role in establishing a floor of benefits for pregnant women enrolled in the program in expansion states. The ACA’s requirement that newly eligible beneficiaries are covered for federally recommended preventive services means that pregnant women on the program in expansion states are guaranteed coverage for folic acid supplements, breast pumps, and several screening tests. Many states have structured their programs so all pregnant women on Medicaid are covered for their services regardless of the eligibility pathway that qualifies them for coverage.

The Medicaid program has a long history and excellent record of providing coverage for low-income pregnant women, with almost half of the nation’s birth covered under the program. Regardless of the outcome of current debates over the future of Medicaid or the ACA, the millions of low-income pregnant women that are served by Medicaid will continue to need to have access to coverage that includes the broad range of pregnancy-related services that help assure healthy maternal and infant outcomes.

Acknowledgements

The authors express appreciation for the assistance of several individuals who assisted with the preparation, testing, and refinement of the survey instrument, including Yali Bair of Ursa Consulting, Amy Moy from the California Family Health Council, Tasmeen Weik of the federal Office of Population Affairs, Melanie Reece of Colorado’s Department of Health Care Policy and Financing, and Lisa DiLernia of Michigan’s Department of Health and Human Services.

We thank the following colleagues from Health Management Associates: Joan Henneberry for guidance and subject matter expertise; Dennis Roberts for database development and management; and Nicole McMahon for assistance with compiling the state data tables.

We also thank the Medicaid directors and staff in the 40 states and the District of Columbia who completed the survey on which this brief is based.

Endnotes

  1. Kaiser Family Foundation; Births Financed by Medicaid ↩︎
  2. Kaiser Family Foundation; Status of State Action on the Medicaid Expansion Decision. ↩︎
  3. The American Congress of Obstetricians and Gynecologists. Safe Prevention of the Primary Cesarean Delivery. March 2014. ↩︎
  4. Markus AR, Andres E, West KD, Garro N, Pellegrini C. Medicaid Covered Births, 2008 Through 2010, in the Context of the Implementation of Health Reform. Women’s Health Issues. Sept-Oct 2013 ↩︎
  5. Kaiser Family Foundation; Status of State Action on the Medicaid Expansion Decision; As of January 12, 2016; Since July 1, 2015 Alaska implemented a Medicaid expansion (9/1/2015) as did Montana (1/1/2016) and Louisiana (7/1/2016). ↩︎
  6. Kaiser Family Foundation. Women’s Health Insurance Coverage. October 2016. ↩︎
  7. Healthy People 2020. Maternal, Infant, and Child Health. Office of Disease Prevention and Health Promotion. ↩︎
  8. Horowitz JA, Murphy CA, Gregory K, Wojcik J, Pulcini J, & Solon L. (2013). Nurse Home Visits Improve Maternal-Infant Interaction and Decrease Severity of Postpartum Depression. Journal of Obstetric, Gynecologic, & Neonatal Nursing. 42(3), pp 287-300. ↩︎
  9. New Mexico reported that some managed care entities provide Doula services but it is not a Medicaid covered benefit. Ohio noted that there are no certified Doulas in the state currently. ↩︎
  10. Healthy People 2020: Breastfeeding Objectives. ↩︎
  11. Virginia reported that both electric and manual pumps are covered as a benefit through managed care. Fee-for-service coverage was added effective 1/1/2016. ↩︎
  12. Alabama notes that breast pumps are provided through the WIC program and through the Alabama Department of Public Health. South Carolina also noted provision through its Health Department. ↩︎
  13. The American Congress of Obstetricians and Gynecologists. Safe Prevention of the Primary Cesarean Delivery. March 2014. ↩︎

Medicaid Family Planning Programs: Case Studies of Six States After ACA Implementation

Authors: Jocelyn Guyer, Elizabeth Osius, Sharon Woda, Jacqueline Marks, Usha Ranji, and Alina Salganicoff
Published: Apr 27, 2017

Executive Summary

Overview

The Affordable Care Act brought sweeping changes to the Medicaid program that have had profound implications for family planning coverage, services, and providers. In particular, in the 17 states with family planning programs that have expanded Medicaid, many women have moved from limited benefit family planning programs into full-scope Medicaid or Marketplace insurance and now have comprehensive coverage, although it is less focused on family planning services. In light of the coverage trends and other ACA-related changes, this paper describes the impact on women and their partners, as well as family planning providers, of the shifting landscape for family planning. It is based largely on interviews with state officials, providers and consumer advocates in Alabama, California, Connecticut, Illinois, Missouri and Virginia – a cross-section of states in terms of geography, Medicaid expansion status, and implementation of a Medicaid family planning program. State interviews were supplemented by interviews with national experts, policymakers and family planning provider organizations. This study was conducted in Summer 2016 before the Presidential election.

Key findings

Nationwide, states that had Medicaid family planning programs prior to passage of the ACA have generally elected to maintain them, reflecting a belief that they still have an important role to play for low-income women. Maintaining a family planning program in a non-expansion state—where the program serves women who often otherwise do not qualify for Medicaid or may find Marketplace coverage unaffordable—is a relatively easy decision. In states with Medicaid expansion, however, the role of family planning programs is a more complex decision. In California, which has retained its family planning program, interviewees explained that the program serves a unique role in helping women secure high-quality, confidential family planning services. On the other hand, Illinois terminated its program one year after Medicaid expansion on the grounds that women would be able to secure family planning services through comprehensive Medicaid or a Marketplace plan. A number of interviewees supported the decision, but others expressed concern that it has resulted in diluted access to family planning services.

The ACA’s reforms to eligibility and enrollment procedures have changed how many women learn about and enroll in Medicaid, creating new opportunities and challenges. For example, the requirement that Medicaid and Marketplaces use a “single, streamlined application” helps applicants avoid submitting duplicative applications with multiple entities and facilitates enrollment into comprehensive coverage. However, the “single, streamlined application” is also much longer and more complicated than many states’ pre-ACA family planning applications, potentially discouraging people from applying for family planning coverage. Additionally, interviewees noted that HealthCare.gov is not yet able to assess eligibility for Medicaid family planning programs, creating a missed opportunity to connect women to family planning coverage. In particular, in non-expansion states such as Alabama that rely on HealthCare.gov to conduct final determinations of Medicaid eligibility, women who fall into the coverage gap are turned away by HealthCare.gov without any coverage even though they could be enrolled in a family planning program.

Despite strong federal protections, interviewees in some states raised concerns about affordability challenges in Marketplace plans for low income women in need of family planning services. Interviewees in several states expressed concerns about cost barriers for low-income enrollees in Marketplace plans. In particular, interviewees reported that low-income women cannot always afford Marketplace plans even with premium tax credits and suggested that for these women in particular it is important to retain Medicaid family planning programs.

Stakeholders across the board reported that full-scope Medicaid and family planning programs generally cover the full range of family planning benefits that women are likely to require. Additionally, interviewees in all states indicated that very minor differences exist between the benefits offered in family planning programs and full-scope Medicaid, despite the fact that states have fairly wide discretion within federal guidelines to develop their family planning benefit packages. On the other hand, states vary in their coverage of “family planning-related” services, which include, for example, treatment of a sexually transmitted disease or infection identified during a family planning visit. In many respects, states have not yet fully caught up with the evolving definition of what constitutes comprehensive family planning services, which, as described in a 2014 report released by the Centers for Disease Control and Prevention and the Office of Population Affairs, increasingly includes providing preconception health services to improve infant and maternal health outcomes, offering a full range of contraceptive methods and providing sexually transmitted disease screening and treatment services to prevent infertility and improve health.

Interviewees suggested that women had access to family planning services from a range of providers that participate in family planning programs, but also raised concerns about access to services in the context of Medicaid managed care. Most interviewees reported that beneficiaries are able to obtain services due to the well-established infrastructure of states’ family planning programs as well as the mission-oriented nature of many of the programs’ providers. In Medicaid expansion states, enrollees have been transitioning from limited benefit programs to full-scope Medicaid and, in most instances, enrolling in Medicaid managed care organizations (MCOs). In California, where three-quarters of Medicaid enrollees are in MCOs, interviewees expressed concern that women are being assigned to primary care providers they do not know or who are difficult to get to and that MCOs are imposing step therapy and other forms of utilization review inconsistent with state and federal policy. Interviewees across states also noted that Medicaid’s “freedom of choice” provision, which provides coverage for out-of-network family planning providers, is not well understood by enrollees, providers or MCOs.

There is a need for more consistent, reliable and comprehensive data on the Medicaid program’s role in family planning. Limited data has made it difficult for states to draw conclusions on a range of important issues, including service utilization by type, wait times, geographic proximity of providers to enrollees, appropriateness of care, ability to see the provider of an individual’s choosing, and the frequency with which people take advantage of the “freedom of choice” provision. There are notable exceptions however. California’s previous evaluation efforts through the University of California at San Francisco and Alabama’s annual waiver analysis reports have documented the role of the family planning programs in providing contraceptives and other services to low-income women and men. However, the lack of recent, uniform data makes it difficult to comprehensively assess how the ACA-related changes have affected access to and use of family planning services.

Family planning providers continue to face an uncertain future. Many family planning providers have long been accustomed to working in an environment dominated by fee-for-service Medicaid payments, Title X grant funding and self-pay patients, but the ACA has markedly increased the need to contract with Medicaid MCOs and Marketplace plans. Many family planning providers are seeking to re-position themselves as providers of a broader array of services, building stronger partnership and referral relationships with other providers, and increasing their capacity to contract directly with Medicaid MCOs and Marketplace plans. Others, however, are not interested in or able to adopt these types of changes, including those who work in rural markets that do not support service expansion or in urban markets where other primary care providers already provide a full array of services. These family planning providers tend to be more focused on maintaining core family planning services and increasing reimbursement and awareness of those services. Regardless of their approach to adapting to these circumstances, family planning providers see themselves as the frontline providers of care for many low income women and are increasingly making the case to payers and policymakers who want to prevent unintended pregnancies about the value they can offer, highlighting their deep experience and training to provide family planning services, including those that pose stumbling blocks for other primary care providers (e.g., contraceptive counseling, LARC insertion), the ability to offer same-day access to family planning services, and a unique understanding of what differentiates family planning services from other medical services.

Moreover, family planning providers sit at the center of state and federal political controversies around abortion services and face significant uncertainty about funding and sustainability. While federal law guarantees that Medicaid beneficiaries can see any qualified family provider they choose, there have been efforts at the state and federal levels to eliminate some providers from the program. This will be particularly important to monitor in the months ahead, as President Trump has voiced his intention to bar federal funds to Planned Parenthood, a major provider of family planning services for Medicaid beneficiaries.

Across interviewee states, family planning issues and providers are not at the table for broad Medicaid delivery system reform efforts. Most of the states interviewed for this analysis were engaged in or exploring Medicaid delivery system reform, but none had significant initiatives that include family planning issues and providers. As with most delivery system reform efforts, they were heavily focused on the most expensive enrollees and services, not the often younger and relatively healthy Medicaid beneficiaries who use family planning services. For many interviewees, the exclusion of family planning issues from delivery system reform is a missed opportunity given that family planning can be a major gateway into the healthcare system for low income and racially and ethnically diverse women of reproductive age. Family planning providers also note that they can help Medicaid programs avoid the delivery costs associated with unintended pregnancies. Finally, interviewees highlighted that the lack of family planning specific quality measures has been a hurdle for inclusion in delivery reform efforts, as current efforts strive to provide incentives to meet target quality measures.

Long-acting reversible contraception (LARC) continues to garner significant attention from states. Many of the states in this analysis are actively reviewing their Medicaid LARC policies to reduce access barriers, recognizing LARC’s high effectiveness rates and potential to reduce unintended pregnancies; however, states are also seeking to ensure women are presented with a range of contraceptive options and not unduly pressured to select a LARC. Interviewees highlighted existing barriers to accessing LARC, including: a shortage of providers trained to insert LARC methods; the high upfront cost of LARC devices for providers; and low Medicaid reimbursement rates for these procedures. A number of states are working to address these issues. For example, Illinois raised Medicaid reimbursement rates for insertions and removals of LARC devices in October 2014, and in July 2015, began allowing hospitals to receive a separate payment for LARC devices, making it more financially attractive for providers to insert LARC after delivery.

Conclusion

This study reviews the important role that Medicaid continues to play in delivery of family planning services to low-income women and how it has evolved since the passage of the ACA. Shifts in the coverage landscape, federal efforts to reduce spending on discretionary programs such as Title X, the focus on broad delivery system reform, and clinical and political trends have created an uncertain future for many family planning providers. States, enrollees, and providers have been adapting to these changes and continue to do so to ensure family planning services remain accessible to low-income women and men.

The Trump Administration has signaled its willingness to put more decisions about the program’s benefits, eligibility, and distribution of funds in the hands of state policymakers. As we see in this study, several states have used the 1115 waiver process to extend Medicaid coverage for family planning services to groups that have historically been ineligible for full scope Medicaid coverage. Alternatively, state and federal policymakers could structure an 1115 waiver to scale back the range of participating providers, covered services, or eligibility criteria.

This study shows that when states have choices in crafting family planning benefits under Medicaid, the results can vary widely. Moving forward, it will be important to continue to monitor the impact of Medicaid policy changes at the state and federal levels to assess the impact of policy decisions on access to family planning services for low-income women and men.

Introduction

Overview

The passage of the Affordable Care Act (ACA) in 2010 made changes to the Medicaid program that have had considerable implications for family planning coverage and services available to low-income women. Prior to the ACA, over 3 million low income women received family planning services through stand alone, limited Medicaid benefit family planning programs.1  The ACA enabled many low and modest-income women who were previously only eligible for family planning coverage to obtain full-scope insurance through Medicaid or the Marketplaces for the first time. These changes have altered the role of family planning programs within many states and created a more complex environment for family planning providers.

While still responding to coverage changes created by the ACA, family planning programs and providers are also facing new, emerging changes brought about by other industry trends. The ACA’s delivery system reform provisions sparked changes in how care is paid for and delivered. Family planning programs traditionally operated through specialty “stand alone” providers with direct contracts with the state. These providers are now grappling with how to integrate into the broader delivery system and, in states that have expanded Medicaid, how to work with Medicaid managed care organizations (MCOs) and the transition from uninsured or limited family planning benefit packages to comprehensive Medicaid coverage. These changes are impacting how family planning providers interact and contract with Medicaid MCOs and other payers, how they are reimbursed for care, the scope of services they provide and how they form and value relationships with other providers. Besides ACA changes, Congressional and federal efforts to “defund” Planned Parenthood through limits on Medicaid and Title X funding would limit access to family planning services for women living in certain communities across the country. This study addresses the shifting landscape in which family planning services are being provided, including routes to coverage; eligibility and enrollment; benefits; access; impact on providers of changes; and delivery system reform. Based on case studies in six states and interviews with national experts, providers, advocates and government officials, it describes major trends in how women secure Medicaid family planning coverage and services and the implications of ACA-related changes for family planning providers and the role of family planning more broadly in Medicaid delivery system reform initiatives.

This study was conducted in the summer of 2016 before the November election changed the outlook for the ACA and Medicaid. The Trump Administration has signaled that they intend to give states considerably more flexibility to reshape their Medicaid programs and to block federal funding to Planned Parenthood, a leading source of family planning care for low-income women. With Medicaid reform under debate at the federal and state levels, it is important to understand the role of family planning programs and how they could be affected by Medicaid restructuring.

Background and Context

Prior to the ACA’s passage, Medicaid was already the single most important payer of publicly-funded family planning services in the United States, financing more than 75% of all publicly-funded family planning services.2  Family planning services long have had a special role within Medicaid, reflecting recognition by policymakers that there are significant social and economic consequences to unintended pregnancies, including greater poverty and reliance on public benefit programs.3  Family planning services have been a mandatory benefit in Medicaid since 1972 and are reimbursed by the federal government at a 90% matching rate. Federal law also requires that family planning services be exempt from cost-sharing and that beneficiaries have the right to secure the services from the providers of their choice, a provision known as the “freedom-of-choice” requirement.

Until the 1990s, however, many women simply did not qualify for Medicaid family planning services because they did not meet categorical eligibility rules that limited Medicaid eligibility to adults who were pregnant, parents/caretaker relatives, disabled or elderly. Then, with California in the lead, a number of states sought and secured Medicaid 1115 waivers to establish family planning programs that could serve low-income women, and sometimes men, beyond Medicaid categorical eligibility rules. By 2009, the year prior to passage of the ACA, at least 24 states had family planning waivers,4  and over 3 million women had gained coverage for family planning services through these programs. California’s program, FamilyPACT, was the largest, with 2.5 million enrollees, while there were approximately 942,000 enrollees in all other programs combined.5 

Impacts of ACA Coverage Changes on Medicaid Family Planning

While family planning was not the primary focus of the Affordable Care Act (ACA), the law has had sizable implications for how many women receive family planning services and for family planning providers. The ACA extended eligibility for full-scope Medicaid to adults under 138% FPL and also created new Marketplaces that offer subsidized coverage up to 400% FPL. Although Medicaid expansion now is optional as a result of the 2012 Supreme Court decision on the ACA, the District of Columbia and 31 states have elected to expand Medicaid. In these states, many women who previously qualified only for a Medicaid family planning program have been able to secure coverage that offers a comprehensive benefit package (i.e., “full-scope” Medicaid).

The ACA also gives states the option to establish family planning programs through a simpler mechanism than a complex and lengthy waiver application process that needed to be renewed and evaluated periodically. By enacting a state plan amendment (SPA), states could base eligibility solely on income, while waivers may limit eligibility by other criteria such as age and sex. States using the SPA option must also set the eligibility threshold for their family planning program at or below the income threshold for pregnant women in the state. Fourteen states have transitioned to or have newly established a SPA family planning program since the option became available.6 ,7 

Finally, the ACA established integrated, modernized and streamlined standards for eligibility and enrollment processes that are used to evaluate eligibility for Medicaid, Marketplace coverage and related subsidies, and the Children’s Health Insurance Program (CHIP). Medicaid agencies and Marketplaces are required to use a “single, streamlined application,” to ensure individuals end up enrolled in whichever program for which they are eligible regardless of whether they submit their application to a Medicaid agency or a Marketplace. As a result, many more people are finding their way to coverage by applying through Marketplaces, raising the importance of understanding how Marketplace web sites and related eligibility and enrollment procedures work for women who qualify for full-scope Medicaid or family planning programs.

Other Developments

Family planning is garnering more attention than ever before at both state and national levels. In the political realm, highly controversial videos on the role of Planned Parenthood staff in disposing of fetal tissues have generated heated debate over the role of Planned Parenthood affiliates in Medicaid family planning programs. Some states have sought to ban Planned Parenthood providers from receiving any Medicaid funds while other states have ongoing inquiries into the role of clinics that offer abortion services within family planning programs. For example, Oklahoma’s Medicaid agency announced it was terminating its contracts with Planned Parenthood until, two months later, the agency reversed course and entered into “conditional one-year Provider Agreements” with the two Planned Parenthood affiliates in the State.8  In Missouri, the Legislature passed a fiscal year 2017 budget that effectively converts the Medicaid family planning program (supported by a combination of federal and State funds) into a fully State-funded program and excludes providers who offer abortion services.

In the past few years, CMS has issued a number of regulations and informational bulletins aimed at strengthening access to family planning services. In April 2016, CMS released a final Medicaid managed care rules that includes several provisions directly relevant to family planning services.9  As described in more detail later in the report, these include: new requirements for Medicaid MCOs to inform beneficiaries of the freedom-of-choice provision; stronger network adequacy standards for family planning providers; and, a reiteration of the importance of ensuring that beneficiaries can elect the family planning method of their choice. CMS also released three informational bulletins in 2016 on family planning: (1) reminding states that they cannot exclude family planning providers from Medicaid unless they are unfit to provide a covered service;10  (2) encouraging best practices for promoting access to long-acting reversible contraception (LARC);11  and (3) highlighting that states cannot employ utilization controls, such as step therapy, that would interfere with a beneficiary’s right to choose her preferred method of family planning, regardless of whether a state operates a managed care or fee-for-service program.12 

Methodology

This study is based largely on interviews with state officials, providers and consumer advocates in Alabama, California, Connecticut, Illinois, Missouri and Virginia.13  The in-depth state case studies were supplemented by interviews with national experts, family planning provider organizations and federal policymakers with expertise on Medicaid and family planning services, quality metrics, eligibility and enrollment issues, and waivers. Using a standardized questionnaire, interviewees were asked about their perspective on a range of issues, including: the implications of the ACA for how low-income women secure family planning services; family planning benefits and access to care; the role of family planning issues in broader delivery system reform; and impacts on family planning providers. A full list of interviewees is attached as Appendix C.

These six states were selected to represent a cross-section in terms of geography, Medicaid expansion status, implementation of a Medicaid family planning program and whether that program was established via a waiver or a SPA. Table 1 displays the characteristics of the states included in the analysis. Three of the selected states expanded Medicaid (California, Connecticut, and Illinois); two converted Medicaid family planning waivers to the state plan option (California and Virginia); one newly established a Medicaid family planning program post ACA enactment (Connecticut); two continued existing Medicaid family planning programs operated under waivers (Alabama, Missouri); and one terminated its program after expanding Medicaid (Illinois).

Table 1: Interviewees’ Medicaid Family Planning Program and State Characteristics
 Medicaid Family Planning (FP) ProgramFull Scope Medicaid Expansion% of Medicaid enrollees in Managed Care14 Rely on HealthCare.gov?
NameWaiveror SPAGender/Age EligibilityIncome EligibilityFP-Related Benefits?
AlabamaPlan FirstWaiver(Established in 2000)Women, 19-55

Men, 21 and older (only for vasectomies)

141% FPLNo15 No0%Yes
CaliforniaFamily PACTSPA(Converted from waiver in 2011)Women, no age restrictions

Men, no age restrictions

200% FPLYesYes77%No
ConnecticutN/ASPA (Established in 2012)Women, no age restrictions

Men, no age restrictions

263% FPLYesYes0%No
Illinois16 N/AN/A(Waiver terminated in 2014)N/AN/AN/AYes53%Yes
MissouriN/AWaiver(Established in 1998)Women, 18-55201% FPLYesNo51%Yes
VirginiaPlan FirstSPA(Converted from waiver in 2011)Women, no age restrictions

Men, no age restrictions

200% FPLNoNo66%Yes

Report

Based on the six states as case studies, a number of key trends in Medicaid’s role in family planning were identified, including: the role of Medicaid family planning programs now that many people have coverage through full-scope Medicaid and Marketplace plans; eligibility and enrollment changes brought about by the ACA; growing interest in LARC; access to services, and the intersection between family planning services and broader delivery system reform. To a notable degree, interviewees based observations of their personal experiences, reflecting a dearth of state-specific data on how women access family planning services, the providers that they use, the type of family planning services that are most common, the role of managed care plans in providing family planning services, and the cost-effectiveness of family planning programs.

Role of Family Planning Programs

Nationwide, states that had Medicaid family planning programs prior to passage of the ACA have generally elected to maintain them, reflecting a belief that they still have an important role to play for low-income women. In non-expansion states, the decision to maintain a family planning program is a relatively easy one. As interviewees in Alabama, Missouri and Virginia explained, their programs provide important family planning services for women who otherwise do not qualify for Medicaid or who may find Marketplace coverage unaffordable. Alabama and Missouri simply maintained their existing waiver programs while Virginia opted to convert its waiver to a SPA, anticipating that its family planning program would shrink after Medicaid expansion. Now, without a Medicaid expansion, many Virginians applying for health insurance at the Marketplace fall into the “coverage gap,” and are instead enrolled in the state’s family planning program. As a result, the state experienced a sharp increase in enrollment, although many beneficiaries are not using the coverage to secure family planning services, suggesting that they may be unsure of exactly what coverage they have (see further discussion below).

In states with Medicaid expansion, the ongoing role of family planning programs is more complex. In these states, many women who previously qualified only for a Medicaid family planning program are now able to secure full-scope Medicaid which provides them with a broad array of services that go well beyond family planning. Still, the vast majority of states expanding Medicaid that had family planning programs that predated the ACA have opted to maintain them. As California stakeholders explained, this is because family planning programs serve a unique role in helping women to secure high-quality family planning services, creating a natural focus on improving family planning services and for oversight and training. California’s family planning program is particularly essential for women who remain outside of comprehensive coverage due affordability issues. Even among women who have affordable, comprehensive coverage, they sometimes elect to use California’s family planning program because it is carefully designed to ensure confidentiality and privacy, even relative to a beneficiary’s spouse or parents.

One Medicaid expansion state in this analysis, Illinois, opted to drop its family planning program entirely. Many Illinois interviewees viewed this decision as appropriate given that, upon expanding Medicaid and establishing a Marketplace, low-income women became eligible for full-scope Medicaid or could enroll in Marketplace plans. Some Illinois providers and advocates, however, called for a re-examination of the decision. They cited their experience that some women are having difficulty securing family planning services, particularly for women with incomes above Medicaid thresholds, because they cannot afford Marketplace premiums.

Application, Eligibility and Enrollment

The ACA’s reforms to eligibility and enrollment procedures have changed how many women find out about and enroll in Medicaid (full-scope and family planning programs), creating both new opportunities and challenges. The ACA required states to adopt strategies to simplify the process of enrolling in Medicaid and Marketplace coverage including use of the “single, streamlined application.” These changes have many advantages for enrollees and states alike. Most importantly, the use of a single, streamlined application allows people to be evaluated for Medicaid, Marketplace coverage, and CHIP without requiring them to fill out and submit multiple, duplicative applications. At the same time, the “single, streamlined” application is actually significantly longer and more burdensome than states’ pre-ACA family planning applications, making it harder for people to apply specifically for family planning services and for family planning providers to assist with Medicaid applications. As stakeholders gain greater and greater familiarity with ACA eligibility and enrollment procedures, states, federal officials and advocates are looking for ways to have the best of both worlds – access to comprehensive coverage whenever possible but, for those who only qualify for family planning programs, a quick and efficient way to sign up.

Intersection with the Federally-facilitated Marketplace (FFM)

Nearly 70% of people in the country now live in states that rely on the Federally-facilitated Marketplace (FFM) and its eligibility and enrollment website, HealthCare.gov, as a primary vehicle for finding out about and enrolling in coverage.17 ,18  When an individual applies for coverage at HealthCare.gov and is determined ineligible for Marketplace coverage, the FFM also checks eligibility for Medicaid; however, the FFM is only able to review eligibility for major Medicaid eligibility categories – such as children, pregnant women and expansion adults. It is not yet able to determine eligibility for Medicaid family planning programs, a significant gap for women in states that have not yet expanded Medicaid.

Additionally, states that rely on the FFM have chosen whether the FFM can “assess” eligibility for Medicaid or “determine” eligibility for Medicaid. In states where the FFM “assesses” eligibility, the FFM transfers to the Medicaid agency all accounts that the FFM reviewed for Medicaid eligibility to enable the state to run its own eligibility determination processes. In doing so, the state can evaluate eligibility for all Medicaid categories, including for a family planning program. In states where the FFM “determines” eligibility, the FFM does not transfer accounts for anyone that the FFM “determined” ineligible for Medicaid.

This process creates particularly notable concern in the eight states that are “determination model” states – including Alabama.19  Alabama residents who apply for coverage at HealthCare.gov and are found ineligible for full-scope Medicaid are told they are ineligible for Medicaid by HealthCare.gov; they are not transferred to the Alabama Medicaid agency to allow the state to determine eligibility for and enroll them in the family planning program.20  Alabama interviewees expressed great concern about losing the opportunity to educate and enroll these individuals. In contrast, Virginia – an assessment state – receives accounts from the FFM for individuals who were found ineligible for full-scope Medicaid; the state then conducts its own processes to determine eligibility and may find the individual eligible for the family planning program.

Confusion About Coverage Status

Particularly in states that have not expanded Medicaid, interviewees highlighted that beneficiaries and providers are sometimes confused about the limited nature of the coverage available to family planning enrollees. Virginia, for example, a non-expansion state, has taken steps to ensure that low-income individuals who fall into the coverage gap are enrolled in the state’s Medicaid family planning program. With significant numbers of people stepping forward and seeking coverage through HealthCare.gov, this has resulted in family planning program enrollment in Virginia increasing from 8,000 in 2011 to 110,000 in 2016. The state, however, has not experienced a corollary increase in service utilization, suggesting that new enrollees may not be fully aware of how to use their limited coverage or may not be seeking family planning services. In response, the state has undertaken an effort to educate beneficiaries and providers about how to use the family planning program. It has created a family planning member identification card that is easily distinguishable from the card used for people with full-scope coverage, developed a separate Medicaid family planning handbook and will be conducting a survey and reviewing claims data to determine if member confusion has decreased.

Even prior to ACA implementation, Alabama found significant numbers of individuals were enrolled in the Medicaid family planning program but not utilizing services. The State now requires individuals to affirmatively request an eligibility determination for the family planning program by checking a specific box on the Medicaid application.21 

Strategies to Increase Family Planning Enrollment

To address the challenges created by new eligibility and enrollment procedures, some states are relying on proven strategies that were in use prior to the ACA, such as on-site enrollment and presumptive eligibility. In California, for example, the state continues to allow applicants to enroll by completing a short application at their provider’s office to immediately secure coverage for their visit. California interviewees routinely praised the process for its success in helping women gain prompt access to family planning services, but also noted that the State continues to work to ensure providers assist applicants with enrolling in full coverage – rather than family planning-only. Similarly, Connecticut uses presumptive eligibility for its Medicaid family planning program, allowing women to be signed up for temporary coverage at their providers’ offices. In this instance, providers said that they view the presumptive eligibility policy as “crucial” to the success of the program, highlighting that people who are enrolled temporarily, begin taking advantage of their coverage, and find they are likely eligible for ongoing coverage are more motivated to complete the full application.22 

Despite strong federal protections, interviewees in some states raised concerns about affordability challenges in Marketplace plans for low-income women in need of family planning services. Despite the availability of premium tax credits and cost-sharing subsidies for low- and moderate-income individuals in ACA Marketplaces, interviewees raised significant concerns about the affordability of Marketplace plans. In states with family planning programs, women who cannot afford Marketplace plans may still be able to directly secure family planning services through the family planning program.23  Given these issues, advocates and providers in Illinois would like the state to re-consider its decision to eliminate the state’s family planning program.

Even when women are able to purchase Marketplace plans, some interviewees raised concerns about ensuring access to family planning services. For example, Missouri advocates expressed concerned that Marketplace plans exclude many of the state’s family planning providers while some California interviewees reported that Marketplace plans often require prior authorization for LARCs. To address these issues, advocates and other interviewees are looking for increased oversight and monitoring of Marketplace plans’ compliance with family planning coverage and cost-sharing requirements. While state insurance departments may be the logical entity to provide this oversight, they have not traditionally served, or been asked to serve, this role and so may currently lack the staff and expertise to monitor how family planning benefits are provided.

Finally, there is heightened interest in dual enrollment in Marketplace plans and Medicaid family planning programs. If women can enroll in both, then the Medicaid family planning program may be able to assure continuity of care as well as offset any gaps in Marketplace plan coverage, such as narrow provider networks. While individuals are permitted to be concurrently enrolled in Medicaid family planning and Marketplace coverage in many states,24  this is not widely understood by beneficiaries, plans, or policymakers. Alabama officials, for example, reported they are actively working with the Centers for Medicare and Medicaid Services (CMS) to ensure that the FFM’s call center staff are aware that people may be enrolled in both forms of coverage and accurately inform callers of this possibility.

Benefits

Stakeholders across the board reported that full-scope Medicaid and family planning programs generally cover the full range of family planning benefits that women are likely to require. “Family planning services” are defined broadly in federal law and guidance to include the full array of contraceptive devices and procedures (e.g., IUDs, birth control pills, condoms and other forms of over-the-counter methods), exams, counseling services, laboratory tests, and other services that women and their partners might need. Within these requirements, however, states have discretion to develop their family planning benefit packages, as well as to allow them to vary between full-scope Medicaid and a family planning program (e.g., in the selection of contraceptive options or in the number of cycles of contraception that can be dispensed at one time).25  In practice, though, interviews revealed that very minor differences exist, if any, between the benefits offered in family planning programs and full-scope Medicaid. While there have been some differences in the past, the states in this analysis have actively worked to eliminate them. California, for example, has fully aligned benefits in recent years by adding a broader range of contraceptive methods to full-scope Medicaid (e.g., the ring and patch) and allowing women to obtain up to 13 cycles of oral contraceptives in a single dispensation. In Virginia, where modest differences in family planning benefits between the family planning program and full-scope Medicaid still exist, the Department of Medical Assistance is working to align benefits between the programs.

On the other hand, there was variation across the six states in coverage of “family planning-related” services. States that choose to operate family planning programs are not required to cover “family planning-related” services. If they do, those services are reimbursed at regular Medicaid matching rates (while family planning services are matched at the enhanced 90% Medicaid matching rate). CMS has defined family planning-related services as “medical diagnosis and treatment services that are provided pursuant to a family planning service in a family planning setting.”26  Examples of family planning-related services include the treatment of sexually transmitted disease and infections (STIs) identified as the result of a family planning visit and complications arising from use of a birth control method. Preventive services routinely provided pursuant to a family planning service are also “related” services, including vaccinations to prevent cervical cancer.

Text Box 1: Quality Family Planning Guidelines

In 2014, the Centers for Disease Control and Prevention (CDC) and the Office of Population Affairs (OPA) jointly released a set of recommendations addressing how family planning providers can deliver high-quality family planning services that help “women, men and couples achieve their desired number and spacing of children and increase the likelihood that those children are born healthy.” According to the report, family planning services should include:

  • Providing contraception to help plan and space births, prevent unintended pregnancies and reduce the number of abortions—emphasizing offering a full range of contraceptive methods;
  • Offering pregnancy testing and counseling;
  • Helping clients who want to conceive;
  • Providing basic infertility services;
  • Providing preconception health services to improve infant and maternal health outcomes and improve women’s and men’s health; and,
  • Providing sexually transmitted disease screening and treatment services to prevent tubal infertility and improve health.

The definition of comprehensive family planning services has moved beyond contraceptive methods to include screening and treatment for diseases that impact women’s and men’s ability and likelihood to conceive and the health of babies (see Text Box 1). Some states, like Virginia and Alabama, do not cover family planning-related services in their programs, which some interviewees pointed out limits women’s access to important services and may contribute to confusion about the role of the family planning program.27  States that do cover family planning-related services differ in what services they choose to cover.

For example, while all interviewee states cover the Human Papillomavirus (HPV) vaccine in full-scope Medicaid, only three states cover this service in their family planning program. Again, while all interviewee states cover colposcopies as a result of an abnormal pap smear, only three cover this service in their family planning program.28 

Access to Family Planning Services

Interviewees suggested that women had access to services at a variety of provider sites that participate in family planning programs. Based on their experiences, most interviewees credited the well-established infrastructure of family planning programs, as well as the mission-oriented nature of many family planning providers. That said, interviewees across states varied significantly in where they believed that women usually received care. In Virginia, for example, interviewees reported that beneficiaries mostly receive services at private provider offices; in Alabama, more commonly through county-run public health agencies; and, in California, through a broad mix of public and private providers, with beneficiaries in some parts of the state relying heavily on traditional family planning clinics and federally qualified health centers (FQHCs). As discussed in more detail in the next section, however, data were notably lacking in most of the states on key access issues such as site of care, wait times, proximity of providers to beneficiaries, and use of the freedom of choice provision.

Medicaid Managed Care

In the midst of this generally positive portrait, interviewees raised a number of concerns about access, particularly in the context of Medicaid managed care. In managed care states, advocates reported that women who have switched from a family planning program into full-scope Medicaid, and therefore into a Medicaid MCO, often have more trouble securing family planning services through their MCO. In California, interviewees suggested that access issues arise because women are assigned to primary care providers they do not know or are far from their homes. More generally, they cited that MCO assignment algorithms do not take into account that the only provider many women of child-bearing age see is their OB/GYN, not a primary care provider. Interviewees were also concerned that MCOs sometimes impose step-therapy or other forms of utilization review inconsistent with state policy and federal regulations. Notably, Connecticut interviewees explained that the state discontinued its Medicaid managed care delivery system and moved back to direct state oversight in part because it was difficult to ensure that MCOs implemented the state’s policies as intended. Now, the Connecticut Medicaid agency can directly address any concerns providers or beneficiaries identify regarding barriers to accessing family planning services. Advocates and providers agreed it has become increasingly important to monitor how MCOs approach coverage of family planning services. Most of the states interviewed for this project had not yet reviewed their MCO contracts through a family planning specific lens (see Text Box 2 for an exception in Illinois). Those that have often do not yet have a plan for monitoring and enforcing unique provisions of importance to women and family planning providers (e.g., freedom of choice). Across different states, advocate and provider interviewees alike raised concerns about MCOs treating family planning services like other services – rather than as a preventive service — and imposing excess utilization review for LARC in particular. While state interviewees pointed to their authority for broad MCO oversight, as a practical matter, it was difficult to identify mechanisms, processes, or data that demonstrated how states could ensure on-the-ground compliance with protections like freedom of choice.

Text Box 2: Illinois’s Approach to Oversight of Family Planning Services in a Managed Care Setting

Prior to terminating its family planning program in December 2014 and transitioning from fee-for-service to a managed care delivery system, Illinois implemented the “Family Planning Action Plan” (FPAP) as a means of ensuring that MCO contracts offer continuous access to high quality comprehensive family planning services. Through the FPAP, Illinois increased reimbursement rates and modified payment policies to encourage use of the most effective forms of contraception. The FPAP also requires that all Medicaid clients receive evidence-based counseling and have easy access to all methods of family planning without cost-sharing (co-pays/deductibles/co-insurance), step therapy failure requirements, or prior authorization.

Freedom of Choice of Provider

Interviewees reported that the “freedom of choice” provision is not well understood by beneficiaries, family planning providers, and MCOs. This rule enables women to go to any Medicaid provider of their choice to secure family planning services (see Text Box 3). Beneficiaries often are not aware of the option and, in many instances, Medicaid MCOs have not yet established an appropriate infrastructure to implement it. As a result, interviewees reported instances when some beneficiaries who seek services from an out-of-network family planning provider were erroneously told they cannot see such providers. Providers also reported that when they do see patients who have gone out of network, they face major hurdles securing reimbursement from Medicaid. In some states interviewed for the analysis, providers could not even identify, despite trying, whether they should seek reimbursement from a beneficiary’s MCO or from the state. The new Medicaid managed care rule published in May 2016 seeks to address some of these issues, both by requiring appropriate access to family planning providers in-network (i.e., reducing the need for beneficiaries to use the freedom of choice provision) and by requiring plans to educate consumers about the provision.

Fee-for-Service Challenges

Finally, fee-for-service states also raised some access issues. In Alabama, where most women in the family planning program are served through the state’s Department of Public Health Title X clinics, interviewees flagged that women may face long waits for appointments and may have to access some LARC-related services elsewhere because of state scope of practice laws.29 ,30  Alabama is not alone in having challenges in making the full range of contraceptive methods readily available to women. As noted in a later section on LARC, many providers struggle to have a stock of devices and trained staff who can conduct LARC procedures. Because of access challenges, a number of providers and advocates argued that maintaining specialized family planning clinics and providers is important because they allow for more focused, time-intensive counseling sessions, better provider training on family-planning specific issues like LARC insertion, and “all-in-one visit” provision of contraceptive services (lab work, stock of LARCs and other forms of contraceptives).

Data

There is a need for more consistent, up-to-date, reliable and comprehensive data on Medicaid and family planning. While the states in this analysis could provide basic data on enrollment and expenditures in their family planning programs, they usually lacked a set of comprehensive data on Medicaid family planning, making it difficult to definitively draw conclusions on a range of questions, including service utilization by type, wait times, geographic proximity of providers to enrollees, appropriateness of care, ability to see the provider of an individual’s choosing, and the frequency with which people take advantage of the “freedom of choice” provision to see out-of-network providers.

While research has found that family planning waiver programs have resulted in increases in the share of women using contraception and declines in unintended pregnancy, there has been a dearth of data in recent years.31  One notable exception is California, which, until recently, has contracted with the University of California at San Francisco (UCSF) to conduct an ongoing evaluation of its Medicaid family planning program. Over the years, UCSF produced a series of evaluation materials, including an annual report on provider and client populations, services utilized, fiscal issues, and county-level characteristics, as well as analyses on whether women in need of family planning services are receiving them. These rigorous evaluations have documented the impact and reach of Medicaid funding for family planning in the state. For example, the most recent evaluation shows that the state’s Medi-Cal and Family PACT programs provided family planning services to nearly two-thirds (65%) of California’s low-women in need of publicly-funded contraceptives.32  In the spring of 2016, however, the state discontinued its contract with UCSF. The state now plans to conduct its evaluation activities in house. It is too early to assess the implications for the state’s ability to maintain its high standards for evaluation and monitoring, but several interviewees raised concerns, noting that major questions are arising about the implications of women transitioning from the family planning program to full-scope Medicaid (e.g., what is the effect on access and utilization? Use of LARC?).

An additional exception is the evaluation of Alabama’s family planning program, conducted by the University of Alabama at Birmingham. The evaluation, required because the family planning program is operated through a Medicaid 1115 waiver, addresses metrics associated with all of the State’s demonstration objectives (for example, “increase the portion of women eligible for [the family planning program] who actually enroll, and reduce race/ethnicity and geographic disparities in enrollment”) as well as other measures that allow ongoing monitoring of the program. As part of ongoing monitoring, the evaluation plan uses claims data and participant surveys to review issues such as reasons for not using family planning services, choice of birth control, services accessed during family planning visits and use of care coordination services.

Text Box 3: Key Provisions of the Medicaid Managed Care Final Rule Related to Family Planning

On May 6, 2016, the Centers for Medicare and Medicaid Services (CMS) published a final rule seeking to modernize Medicaid managed regulations and align them with evolving Medicare and Marketplace requirements. The final rule includes a number of provisions related to family planning services and providers, including:

  • “Freedom of Choice:” Managed care entities must inform patients of their ability to obtain family planning services and supplies, without prior referral, from out of network providers.
  • Network Adequacy: States must specify time and distance standards for different provider types, including OB/GYNs, and provide female enrollees access to a women’s health specialist for routine and preventive services. Additionally, contracts must require demonstration of sufficient in-network family planning to ensure timely access to services.
  • Utilization Management Controls: Contracts may only impose utilization controls for family planning services if they protect the enrollee’s freedom to choose their method of family planning.
  • Provider Non-Discrimination Protections: Plans may not discriminate against qualified family planning providers (or other types of providers) “solely for providing services within their scope of practice.”

Provider and Delivery System Reform Implications

Implications for Providers

Family planning providers continue to face an uncertain future. Women’s shift to greater use of Medicaid MCOs and Marketplace plans has created administrative and cultural changes for family planning providers, who were accustomed to fee-for-service Medicaid, Title X and self-pay patients. This availability of managed care coverage combined with Medicaid expansion is shaping the systems where women receive family planning services—particularly by increasing access to private providers—putting downward pressure on patient volume for some family planning providers. This change is occurring at the same time as use of LARC and revisions to pap smear recommendations are also reducing the number of visits that women need to get their contraceptive care. Furthermore, in many states, these challenges are combined with calls to lower Medicaid spending growth and political pressures that some family planning providers, like Planned Parenthood face as a result of the larger abortion debate (see Text Box 4).

Text Box 4: Missouri’s Transition to State-Funded Family Planning Program

In April 2016, the Missouri Legislature passed a fiscal year 2017 budget requiring that Medicaid funding for family planning services not be “expended to directly or indirectly subsidize abortion services or procedures or administrative functions and none of the funds…may be paid or granted to an organization that provides abortion services.”33  As a result, Missouri is required to transition its federally- and state-funded family planning demonstration to a program funded with State-only dollars because, to receive federal funding, the State would have to include all qualified providers in the program. Missouri’s Medicaid agency released a demonstration phase out plan for public comment that indicates the State-funded program, titled “Missouri Woman’s State-Funded Health Services Program,” effective as of March 30, 2017.34 

These significant changes to the family planning program bring uncertainty to enrollees trying to access family planning services and to family planning providers. From 2011 to 2012, Texas took several actions to reduce funding to and then exclude Planned Parenthood affiliates from its family planning program, eventually replacing its Medicaid family planning demonstration with a state-only funded program. Analysis of these changes were associated with reductions in provision of LARC and increases the rate of childbirth covered by Medicaid.35  Other studies have found that maternal mortality is on the rise in Texas but have not conclusively identified the cause of their increase.36 

As a result of these changes and challenges, many family planning providers interviewed for this report indicated that they are facing significant pressure to adjust their approach to providing care. Some are re-positioning themselves as providers of a broader array of services, including primary care and behavioral healthcare services. For example, family planning providers in California, Connecticut, and Virginia mentioned expansion into additional primary care services as a strategy to attract new patients, address unmet needs and better position themselves for longer-term sustainability.

Family planning providers are also starting to build stronger partnerships and referral relationships with other providers for needed services. For example, a Planned Parenthood affiliate in Virginia that expanded into primary care joined a safety net collaborative with FQHCs and free clinics, allowing it to tightly manage care while also referring out to specialists for needed services. In Connecticut, a Planned Parenthood affiliate hired staff to help women whose breast health issues were identified during a family planning visit connect with other providers who offer additional, specialized services (e.g., mammograms) and find insurance coverage if necessary.

Interviewees, however, also noted that not all family planning providers are interested in or able to adopt such changes. Many family planning providers either operate in rural markets that do not support service expansion or in urban markets with too many competing primary care providers, including FQHCs that long have been partners in meeting other primary care needs of the underserved population. Other providers would rather stick closer to core family planning services, and focus on increasing reimbursement and awareness of those services.

Many family planning providers reported putting new effort into contracting with Medicaid managed care and Marketplace plans. They said they found this work to be particularly challenging because they must develop contractual arrangements with each plan, rather than simply contracting with a single entity (the state agency). In Missouri, interviewees noted that only about 50% of family planning sites that receive Title X funds have experience with and are comfortable with contracting and negotiating with MCOs. Despite administrative challenges, many providers have sought this pathway in the hopes that successful contracting would raise reimbursement rates and offset declines in volume and stagnation of Title X funding. Additionally, contracting with Medicaid managed care entities is one way to “solve” the challenge of obtaining reimbursement for providing out-of-network services, as allowed under the freedom of choice requirement.

Providers continue to press Medicaid MCOs for higher reimbursement for family planning services. In California, providers report that reimbursement arrangements are lower in Medicaid managed care than they receive under fee for services through FamilyPACT, in the state’s family planning program. With significant numbers of women moving from the family planning program to full-scope Medicaid, they report that this has posed fiscal challenges for family planning providers. In other states, providers report that many Medicaid MCOs have a “take it or leave it” approach when they offer rates to family planning providers, attributing this to MCOs not accruing the benefits of preventing unintended pregnancies because of high churn in and out of MCOs.

Some public health family planning providers, such as county departments of public health, reported that they largely continue to operate “as usual,” experiencing little direct impact from the ACA. These providers are sustaining their family planning work with a combination of government grants, self-pay, foundation funding, and some Medicaid dollars. Although they have experimented with helping their clients find coverage, some interviewees reported that they had eased up on these efforts in recent years.

Role of Family Planning in Delivery System Reform

Many states are engaging in efforts to improve health outcomes and lower costs, spurred by State Innovation Model (SIM) grants, new opportunities for Medicaid waivers that can finance some of the cost of delivery system reform, and a steady drumbeat from the Center for Medicare and Medicaid Innovation on the imperative to reform the health care delivery system. These efforts will continue in light of final MCO regulations, which encourage states to implement alternative payment structures and provide states with enforcement mechanisms to ensure value-based MCO payment structures are enacted.

Interviewees, however, consistently report that family planning issues are not being addressed in discussions of Medicaid and delivery system reform. Among the six states reviewed for this paper, none had included family planning services in their reform efforts except in the context of maternity care (e.g., LARC insertion post-delivery). The exclusion of family planning providers from the larger debates over delivery system reform reflects the heavy focus on the most expensive enrollees and services, not the often younger and relatively healthy Medicaid beneficiaries who use family planning services. Many interviewees expressed concern that the exclusion of family planning services by MCOs and state agencies is a major missed opportunity, reflecting a lack of understanding that many women consider their family planning provider to be their primary source of care and feel more comfortable sharing information with them.

In making the case for their role in delivery system reform, provider interviewees explained that they are often the gateway into the healthcare system for low income and racially and ethnically diverse women of reproductive age. Their populations are generally healthy, but due to their socioeconomic status, are at greater risk of developing chronic illnesses and experiencing behavioral health and substance abuse issues, making it important that reform efforts include them. Additionally, they noted that research indicates that the government saves $7 for every $1 spent on family planning programs37  and that family planning providers can help Medicaid programs avoid the delivery costs associated with unintended pregnancies, as well as poorer maternal and infant outcomes associated with unplanned pregnancies or inadequate spacing between pregnancies.

As family planning providers begin to advocate more aggressively for inclusion in delivery system reform efforts, they are starting to produce some changes. For example, Connecticut has received a $45 million SIM grant from the federal government to transform how healthcare services are delivered in the State. Connecticut family planning providers have been tracking this initiative and actively participating in it by serving on governance committees that oversee the effort. One of Planned Parenthood’s affiliates in Connecticut has been invited to participate in the “Advanced Medical Home Vanguard Program” within the State’s SIM structure, allowing it to receive technical support to transform the practice, more effectively work with other members of the local health care community and, ultimately, potentially improve care and lower costs.

Other interviewees mentioned that the lack of family planning specific quality measures has also been a hurdle for inclusion of family planning services in delivery reform efforts, as current efforts strive to provide incentives to meet target quality measures as well as manage high-cost populations. Some quality metrics address reproductive health issues, such as chlamydia screening, STI/STD screening, and cervical cancer screening, but they fall short of measuring whether family planning services are being provided effectively. Recognizing the critical role that quality measures play, the federal government and states are pursuing the development of usable family planning metrics. The 2014 CDC/OPA guidelines on provision of high-quality family planning services includes a recommendation to measure the proportion of women using contraception, highly-effective methods of contraception, or LARC methods.38  In collaboration with the CDC and OPA, CMS’s Maternal and Infant Health Initiative39  aims to collect and report data on new developmental quality measures to increase the use of effective contraception in Medicaid and CHIP. In September 2015, CMS granted 13 states and one U.S. Territory $400,000 total over four years to support their efforts to collect this information, though states may also report voluntarily. The measures40 ,41  are presented in Text Box 5:

Text Box 5: Quality Measures for Family Planning—2014 CDC and OPA Guidelines

The percentage of women ages 15–44 at risk of unintended pregnancy that:

  • Adopted or continued use of the most effective or moderately effective FDA-approved methods of contraception
  • Adopted or continued use of LARC

Among women ages 15 through 44 who had a live birth, the percentage that:

  • Adopted or continued use of the most effective or moderately effective FDA-approved methods of contraception within 3 and 60 days of delivery
  • Adopted or continued use of LARC within 3 and 60 days of delivery.

These measures were reviewed and adopted by the National Quality Forum in Fall 2016. Approval and validation of the measures are important steps for family planning services and providers to be recognized in measurement programs and broader delivery reform efforts. For now, though, the nascent stage of quality measures for family planning services has exacerbated the challenge of integrating family planning services into larger delivery system reform efforts.

Long-Acting Reversible Contraception (LARC)

Long-acting reversible contraception (LARC) continues to garner significant attention from states. While condoms and oral contraceptives are the most common forms of birth control that women use, about one-third of women who have been sexually active in the past year and who use a contraceptive reported using a LARC.42  Recognizing their high effectiveness rates and potential to reduce unintended pregnancies (see Text Box 6), many of the states in this analysis are actively reviewing their Medicaid LARC policies to reduce access barriers, while also seeking to ensure women are presented with a range of options and not unduly pressured to select a LARC.

Interviewees noted that a significant barrier to accessing LARC is the shortage of providers trained to insert LARC methods, which has been documented by other studies. Family planning-specific providers (e.g., Title X grantees) typically have received specialized training and have experience with the range of LARC options, but of primary care practitioners nationwide, only 42% are comfortable inserting IUDs, and only 11% for implants.43  As interviewees in Illinois pointed out, some providers can be reluctant to complete training even when it is available and sometimes hold onto misconceptions about LARCs (e.g., the erroneous belief that women should use IUDs only after giving birth at least once). In response to these challenges, states such as California and Virginia have organized provider training and educational opportunities aimed at dispelling myths about LARC and increasing the number of providers trained to offer these methods.

A second major barrier to LARCs has been cost and some states in this analysis are seeking to address is the high upfront cost of LARC devices for providers. One aspect of high-quality family planning is the same day provision of contraceptive methods once they are selected by a woman, but the high costs of LARCs makes stocking these devices financially challenging for family planning providers. States typically reimburse providers upon LARC insertion, not when the device is purchased; therefore, providers must take on financial risk and cover the upfront cost of LARC devices in order to maintain an adequate supply. If a woman requests a LARC method but fails to return for insertion at a follow-up appointment, the provider must absorb the cost of the device unless it is used by another patient. Moreover, LARC devices are usually expensive— they can run up to $90044  per device–and so keeping them in stock is prohibitively expensive for many providers. To address the situation, Illinois, as CMS highlighted in an April 2016 Informational Bulletin, is piloting a new program with Bayer HealthCare and Teva Pharmaceuticals (both LARC manufacturers) to make selected LARCs available in physician offices without upfront physician costs.45 

An additional barrier to accessing LARC is the low Medicaid reimbursement rates for procedures. In most of the six states in this analysis, provider and advocate interviewees maintained that reimbursement rates for LARC insertion is generally low. In Missouri, in particular, interviewees noted that some family planning providers have stopped offering LARC in recent years due to the reimbursement rates. Some states, including California and Illinois, are responding by increasing Medicaid reimbursement rates for LARC dispensing and insertion. Illinois, for example, implemented the “Family Planning Action Plan” in October 2014, which raised Medicaid reimbursement rates for LARC devices and insertion/removal.46 

States are also working to address LARC within the scope of Medicaid maternity payments. States historically reimburse hospitals for a woman’s labor and delivery within a single prospective maternity payment. State interviewees were concerned that in an effort to lower costs, providers may be dis-incentivized from offering LARC to post-partum women if the cost is included within that bundled payment. To address this concern, some states have opted to reimburse for LARC outside of the maternity bundle. In July 2015, Illinois started allowing hospitals to receive a separate payment for LARC devices, and for non-employed hospital providers to bill separately for the insertion, making it more financially attractive for providers to insert LARC after delivery.47 

Interviewees also raised concerns about insufficient patient education and counseling on LARC methods. With little or no reimbursement for contraceptive counseling, providers have no financial incentive to counsel individuals on their contraceptive options, including LARC. Advocates and provider interviewees, in particular, noted that increasing and optimizing reimbursement for contraceptive counseling should be a priority in light of the emerging range of contraceptive choices. In particular, interviewees noted that reimbursement for non-licensed, non-clinical counselors, such as certified contraceptive counselors, could be beneficial and is similar to what is currently in place in many states for other programs (e.g., tobacco cessation counseling).

Text Box 6: Washington University School of Medicine’s Contraceptive CHOICE Center

The Contraceptive CHOICE Center at the Washington University School of Medicine received a Center for Medicare and Medicaid Innovation grant to develop and test a contraceptive provision model that targets women at the highest risk for unintended pregnancy. The Center used this grant to design a standardized approach to contraceptive choice counseling that removes inherent provider and patient bias regarding different contraceptive methods, and demonstrated that it ultimately reduced unintended pregnancies. When using the Center’s comprehensive counseling approach, counselors or staff members walk patients through all the different tiers of contraceptive options, starting with the most effective options (e.g., LARC). Researchers at the Center found that the use of contraceptive choice counseling increased patients’ satisfaction with their contraceptive method, increased the use of LARCs and reduced the rate of unintended pregnancies among their sample population.

At the same time, a significant number of provider, state and advocacy interviewees highlighted the importance of adopting a nuanced, balanced approach when promoting LARC. They cited the long history of forced sterilization of low-income women, particularly women of color, and the controversy that erupted over coercive practices used in the 1990s to promote Norplant as reasons to act with sensitivity. While strongly supportive of LARC, they advocated for a balanced approach that provides women with the information and counseling that they need to make an informed decision and, if they freely opt for a LARC method, the opportunity to readily access it. One state explained that it has steered clear of actively promoting LARC insertion at delivery unless women have agreed to the procedure well in advance because of concerns that doing so would be reminiscent of earlier coercive practices.48 

Conclusion

In the six years since passage of the ACA, Medicaid and its role in family planning has evolved significantly. The change of federal administration, however, may result in many changes to the ACA, to Medicaid, and to family planning services. We have seen in Medicaid expansion states many low-income women have moved from family planning programs to full-scope Medicaid. Although this brings enormous benefits to women who can now receive comprehensive care, it has increased the importance of ensuring that Medicaid managed care organizations are well equipped to address the family planning needs of low-income women. In recognition of this, CMS issued a series of guidance aimed at ensuring that states and Medicaid MCOs deliver family planning benefits in accordance with federal standards and newly strengthened requirements that plans inform beneficiaries of their freedom to choose their family planning provider. This federal guidance could be adapted by the future federal administration through regulatory actions.

In non-expansion states, Medicaid family planning programs are perhaps more important than ever, offering key benefits to many low-income women who remain uninsured because they fall into the coverage gap. Efforts to cap Medicaid through block grants or entitlement caps could result in more limited federal requirements and incentives to support these programs, especially if the 90% federal Medicaid match requirement is lifted. States would likely still have the option to operate the limited scope family planning programs, but with limited funding and without the enhanced match, they may choose to direct funds to other services.

Despite the strong consensus in the United States that it is cost-effective and important to reduce the rate of unintended pregnancies, family planning remains on the margins of delivery system reform conversations. With the exception of Connecticut, none of the states in this analysis had actively incorporated family planning services into their state-driven delivery system reform efforts. One promising development in this regard is the expanding body of work aimed at developing performance metrics to evaluate whether women are receiving high quality family planning services.

Perhaps the aspect of family planning that is garnering the most attention from federal and state officials is the issue of how best to promote access to LARC. A number of the states in this analysis had actively reviewed their policies to ensure that there were not inappropriate medical utilization requirements on use of LARCS and/or had launched initiatives to train more providers on LARC insertion. However, there still is a marked discrepancy between the policies that states have “on the books” and the reality of access to LARC, as reported by a number of advocates and family planning providers. Moreover, although the issue of how best to support providers in having LARCs in stock is well recognized, most states had not yet devised approaches to tackling it.

As the frontline providers of care for many low income women of all racial and ethnic backgrounds, many family planning providers are frustrated to find themselves excluded from delivery system reform conversations or struggling to contract with multiple MCOs to provide care to women who long have been their patients. Many are increasingly making the case to payers and policymakers who want to prevent unintended pregnancies about the value that they can offer, highlighting their deep experience and training to provide family planning services, including those that pose stumbling blocks for other primary care providers (e.g., contraceptive counseling, LARC insertion), the ability to offer same-day access to family planning services, and a unique understanding of what differentiates family planning services from other medical services.

This analysis highlighted the lack of data available to systematically assess the implications of the ACA for Medicaid and its role in providing family planning services. With so much at stake for low-income women, family planning providers and policymakers are eager to continue to reduce unintended pregnancy rates, it will be important to find ways to gather data in the future on what is working and where more needs to be done to ensure that women in Medicaid continue to have access to high-quality family planning services.

Finally, this study was conducted in the summer of 2016 before the election changed the outlook for the ACA and Medicaid. The Trump Administration has signaled its willingness to put more decisions about the program’s benefits, eligibility, and distribution of funds in the hands of state policymakers. As we see in this study, several states have used the 1115 waiver process to extend Medicaid coverage for family planning services to groups that have historically been ineligible for full scope Medicaid coverage. However, state and federal policymakers could potentially also apply the 1115 waiver to restrict the range of participating providers, covered services, and eligibility criteria.

This study shows that when states have choices in crafting family planning benefits under Medicaid, the results can vary widely. Moving forward, it will be important to continue to monitor the impact of Medicaid policy changes at the federal and state levels to assess the impact on access to family planning services for low-income women and men.

Appendix

.

Appendix A: State Comparison Chart

 AlabamaCaliforniaConnecticutIllinois49 MissouriVirginia
Medicaid Family Planning Program
NamePlan FirstFamily PACTN/AN/AN/APlan First
Waiver or SPAWaiver(Established in 2000)SPA(Converted from waiver in 2011)SPA(Established in 2012)N/A(Waiver terminated in 2014)Waiver(Established in 1998)SPA(Converted from waiver in 2011)
Gender/Age EligibilityWomen, 19-55

Men, 21 and older (only for vasectomies)

Women, no age restrictions

Men, no age restrictions

Women, no age restrictions

Men, no age restrictions

N/AWomen, 18-55Women, no age restrictions

Men, no age restrictions

Income Eligibility141% FPL200% FPL263% FPLN/A201% FPL200% FPL
FP-Related Benefits?No50 YesYesN/AYesNo
Family Planning Program Enrollment(Source: state interviews)103,288(as of 12/31/15)1,000,000(2016 estimate)274(2016 estimate)N/A71,000(2016 estimate)110,000(2016 estimate)
Coverage Landscape
Expanded Medicaid?NoYesYesYesNoNo
% of Medicaid Enrollees in Managed Care51 0%77%0%53%51%66%
Rely on Healthcare.gov?YesNoNoYesYesYes
Demographics
Distribution of adults ages 19-64 enrolled in Medicaid, by sex, 2014(Source: U.S. Census Bureau)Female: 60%Male: 40%Female: 55%Male: 45%Female: 58%Male: 42%Female: 53%Male: 47%Female: 56%Male: 44%Female: 59%Male: 41%
Distribution of women ages 19-64, by FPL, 2014(Source: U.S. Census Bureau)Below 100% FPL: 18%Below 400% FPL: 67%Below 100% FPL: 16%Below 400% FPL: 62%Below 100% FPL: 9%Below 400% FPL: 46%Below 100% FPL: 14%Below 400% FPL: 58%Below 100% FPL: 11%Below 400% FPL: 59%Below 100% FPL: 12%Below 400% FPL: 52%
Health insurance coverage of women ages 19-64, 2014(Source: KFF Women’s Health Insurance Coverage)ESI: 57%Direct purchase: 8%Medicaid: 13%Other: 9%Uninsured: 14%ESI: 53%Direct purchase: 9%Medicaid: 22%Other: 4%Uninsured: 13%ESI: 67%Direct purchase: 8%Medicaid: 14%Other: 3%Uninsured: 8%ESI: 63%Direct purchase: 7%Medicaid: 16%Other: 3%Uninsured: 11%ESI: 64%Direct purchase: 7%Medicaid: 11%Other: 5%Uninsured: 13%ESI: 63%Direct purchase: 9%Medicaid: 7%Other: 9%Uninsured: 13%

Back to top

Appendix B: State Profiles

Alabama State Profile

Family Planning Overview: Alabama operates Plan First, a waiver program that covers family planning services for women ages 19-55 with incomes up to 141% FPL. The program also covers vasectomies for men age 21 and older with incomes up to 141% FPL. Alabama’s Plan First program does not cover other medical services. The Alabama Medicaid Agency manages eligibility and enrollment for the program. The Alabama Medicaid Agency collaborates with the Department of Public Health (DPH) to administer a unique case management program for Plan First enrollees. The DPH operates 84 health centers where many enrollees seek care.

Alabama Medicaid/CHIP Eligibility Levels as % of FPL52 Eligibility levels do not include 5% income disregard

Children by Age (Medicaid)Separate CHIPPregnant Women(Medicaid)ParentsChildless Adults
0-11-56-18
141%141%141%312%141%13%N/A

Share of Medicaid Population Covered by Different Delivery Systems53 

% of Medicaid Population Covered
Fee-for-Service (FFS)36%
Primary Care Case Management (PCCM)64%

Brief Program History: Alabama established Plan First in October 2000 through an 1115 waiver. At that time, the program provided family planning services for women ages 19-44 with incomes up to 133% FPL not otherwise eligible for Medicaid or Medicare or for those who were losing Medicaid pregnancy coverage after 60 days postpartum. Plan First was expanded in 2008 to include women ages 19-55. In the most recent waiver amendment, the eligibility level was adjusted to 141% FPL54  due to ACA rules for basing eligibility on the Modified Adjusted Gross Income (MAGI) formula and men were added as eligible individuals for vasectomies only. The State elected not to pursue a state plan amendment (SPA) due to the administrative burden of converting from a waiver to a SPA. As of December 2015, 103,288 individuals were enrolled in Plan First.

Program Enrollment & Access to Care: Individuals who apply for Medicaid with the State Medicaid agency must affirmatively opt-in to have their eligibility determined for the Plan First program. An applicant would check a box on the Medicaid application to indicate interest in Plan First in order to have his/her eligibility determined for the program. Alabama developed this approach in 2010 after finding that enrollees who had been auto-enrolled were not utilizing or interested in family planning services. Individuals who apply at HealthCare.gov do not have their eligibility determined for Plan First.

Plan First enrollees have access to a network of nearly 1,7000 providers, including public health clinics, FQHCs, and private providers.55  Notably, there is at least one public health site that offers family planning services in all but one county. These sites serve as key access points since much of Alabama is designated as a medical shortage area for primary care by the federal Health Resources and Services Administration.56 

Intersection with Full-Scope Medicaid: Alabama enrolls “full-scope” beneficiaries into either fee-for-service or primary care case management plans. Full-scope enrollees have access to family planning and family planning-related services, whereas Plan First enrollees are covered only for family planning services.

LARC: Alabama promotes LARC utilization through provider education using the program’s website, ALERTS, care coordination in the Maternity Care program, in public health clinics and through the use of ADPH case management system. Notably, information about different types of contraceptive coverage and educational materials for both Plan First recipients and providers are available on the website and through outreach education provided through a partnership agreement with DPH. DPH provides family planning outreach services to Medicaid eligibles and potential Medicaid eligibles to include orientation pamphlets, posters, and flyers, designed to increase awareness of the availability of benefits of family planning methods.

Nurse practitioners providing services in a public health clinic use a tiered contraceptive chart to counsel patients on the effectiveness of different contraceptives, including LARCs. State law bars a nurse practitioner from inserting an IUD without a physician on staff, so women electing IUDs at a public health clinic are referred out to a physician. Nurse practitioners are permitted to remove IUDs without physician oversight.

In April 2014, Alabama started reimbursing hospitals for LARCs inserted immediately post-delivery. Specifically, the State covers the hospitals’ cost of the LARC device or implant and insertion is billable to Medicaid when the insertion occurs either immediately after delivery and before discharge from an inpatient setting, or in an outpatient setting after delivery and immediately after discharge from an inpatient setting.57 

According to Alabama’s most recent waiver evaluation, LARC utilization among Plan First enrollees increased slightly from 2009 to 2014, from 29% to 32%.58 

Other Initiatives: Alabama provides case management for individuals at high risk for unintended pregnancy and has made a concerted effort to ease Plan First enrollment and renewal processes.

  • Case management has been a key component of the waiver since its inception in 2000. DPH employs social workers who cover all of Alabama’s 67 counties to conduct risk assessments to determine if Medicaid recipients enrolling for family planning services are at high risk for unintended pregnancies. When an individual is identified as high risk, social workers complete a psychosocial assessment and follow-up with individuals regarding family planning appointments and birth control.
  • Case managers play an important role in linking women that seek care under the Plan First program and elect an IUD insertion with a provider that can insert an IUD.
  • In 2012, Alabama started offering express lane eligibility and utilizing data from the Department of Human Services to process automatic renewals for the Plan First program.

Delivery System Reform: Alabama plans to transition its Medicaid program to managed care delivered through hospital and provider led entities called Regional Care Organizations (RCOs), an initiative that received CMS approval in 2016. RCOs will offer the same services currently provided to FFS and PCCM beneficiaries. The State plans to evaluate family planning outcome measures including utilization of LARC and other forms of birth control. Plan First enrollees will continue to enroll in Medicaid FFS, not through RCOs. Back to top

California State Profile

Family Planning Overview: California administers its “Family PACT” program though a State Plan Amendment (SPA) for women and men “of childbearing age” (there are no official age limitations) with incomes up to 200% of the FPL who have no other source of family planning coverage. Enrollees in Family PACT are covered for family planning services and limited family planning-related services. The Department of Health Care Services (DHCS) manages Family PACT as well as California’s Medicaid program, Medi-Cal while the Office of Family Planning (OFP), which sits within DHCS, provides administrative oversight for the Family PACT program and family planning policies for the DHCS at large.

California Medicaid/CHIP Eligibility Levels as % of FPL59 Eligibility levels do not include 5% income disregard

Children by Age (Medicaid)Separate CHIPPregnant Women(Medicaid)ParentsChildless Adults
0-11-56-18
261%261%261%317%208%109%133%

Share of Medicaid Population Covered by Different Delivery Systems60 

% of Medicaid Population Covered
Fee-for-Service23%
Managed Care Organizations77%

Brief Program History: Family PACT was established by the legislature in 1997 as a state-funded program. In 1999, California received approval through a waiver for the program and began receiving matching federal funds. California converted the waiver to a SPA in 2011, retroactive to July 2010, eliminating the need to negotiate and renew the waiver at regular intervals. The state uses an option included in the ACA to extend eligibility under the SPA to individuals who, had they applied on or before January 1, 2007, would have been eligible under the standards and processes in place at that time. One exception is that because California now determines eligibility using the Modified Adjusted Gross Income (MAGI) methodology, applicants (with the exception of those aged 17 or younger) must report household income rather than individual income. Family PACT enrollment has been declining in recent years, with 1.3 million enrolled in June 2015, down from to 1.7 million in June 2013.61  Enrollment is expected to continue to decline as more individuals gain comprehensive coverage through Medi-Cal or Marketplace plans.

Program Enrollment & Access to Care: Individuals apply for and enroll in Family PACT directly through their providers by filling out a two-page application in which they attest to residency, household income and lack of other health insurance. Providers assess eligibility based on attested information. They can issue eligible individuals a Family PACT enrollment card on-site at the time of application, allowing them to provide needed services on the same day the individual applies for coverage. During the Family PACT enrollment process, providers are also encouraged to assist individuals who may be eligible for full Medi-Cal coverage in completing their application or advise them on where they can obtain further application assistance.

Family PACT enrollees can access family planning services through 2,200 providers, including a range of both public and private providers.62 

Intersection with Medicaid Managed Care: Since California expanded Medicaid under the ACA, some Family PACT enrollees with incomes less than 138% FPL have become eligible for full-scope Medi-Cal. While the State has not tracked the number of individuals that have transitioned from Family PACT to full-scope Medi-Cal, the vast majority of enrollees have likely moved into Medi-Cal managed care plans (approximately three-quarters of all full-scope enrollees are enrolled in managed care plans). At the time of Medicaid expansion, there were some minor differences between the benefit packages for full-scope Medi-Cal versus Family PACT. Since then, however, the State has made a concerted effort to align the benefit package for the two programs, primarily by adding some new services to full-scope Medi-Cal.

LARC: While the proportion of Family PACT clients utilizing LARC methods has increased over the past ten years, California continues to work to further educate and train providers on LARC methods. For example, the State has conducted webinars for Family PACT and Medi-Cal providers to dispel common myths about LARC placement and to encourage providers to offer women the option of same-day LARC insertion. The State also continues to examine challenges that providers may face related to obtaining LARC devices and reimbursement for LARC procedures.

Other Initiatives: California has undertaken efforts to develop family planning quality measures and transition eligible individuals into comprehensive coverage, including:

  • DHCS will continue to implement quality improvement and utilization management improvements within Family PACT, which would further enable the State to evaluate the quality and cost-effectiveness of services provided through the program. These evaluation efforts will replace a long-standing contract the state previously held with UCSF to evaluate Family PACT.
  • California was a recipient of $400,000 from CMS’s Contraceptive Use Measure Grant,63  which it is using to develop LARC quality measures aimed at improving access to LARC.
  • Medi-Cal distributed grants to providers, including Family PACT providers, to conduct enrollment outreach to their patients who may be eligible for comprehensive coverage through Medi-Cal.

Delivery System Reform: California’s first “Bridge to Reform” 1115 waiver, which included a Delivery System Reform Incentive Payment (DSRIP) program, expired after five years on October 31, 2015. After months of negotiations to renew the waiver, CMS agreed to extend “Bridge to Reform” until the end of 2015 and then granted approval for the renewal waiver, Medi-Cal 2020, which took effect on January 1, 2016 and operates through December 31, 2020. Medi-Cal 2020 includes a number of different initiatives aimed at broader delivery system reform and preparing public hospitals for alternative payment methodologies, but family planning is not a focus of any of them. Back to top

Connecticut State Profile

Family Planning Overview: Connecticut administers its family planning program through a SPA for men and women of child-bearing age (including minors) who are not otherwise eligible for full-scope Medicaid, with incomes up to 263% FPL. Enrollees in the program are covered for both family planning and family planning-related services. The program is administered by the Department of Social Services (DSS).

Connecticut Medicaid/CHIP Eligibility Levels as % of FPL64 Eligibility levels do not include 5% income disregard

Children by Age (Medicaid)Separate CHIPPregnant Women (Medicaid)ParentsChildless Adults
0-11-56-18
196%196%196%318%258%150%133%

Share of Medicaid Population Covered by Different Delivery Systems65 

 % of Medicaid Population Covered
Fee-for-Service100%
Managed Care Organizations0%

Brief Program History: Connecticut’s family planning SPA went into effect on March 1, 2012. While there was interest in establishing a family planning waiver prior to the implementation of the SPA, a program was never established. When the ACA made the SPA option available, the State leveraged the simpler implementation process.

Program Enrollment:Using presumptive eligibility, providers trained by DSS deemed as qualified entities submit a condensed online application via the DSS “ConneCT” system for those who appear eligible for the family planning program. To obtain coverage beyond the presumptive eligibility period—which lasts through the conclusion of the month following the month of application–individuals must apply through Access Health CT (the State-based Marketplace) either online or by phone and can be determined eligible for full-scope Medicaid, the Marketplace or the family planning program. The vast majority (>90%) of family planning program enrollees originally entered the program by applying for presumptive eligibility at the Planned Parenthood of Southern New England affiliate.

Enrollment in the family planning program beyond the presumptive eligibility period has fallen from 361 individuals in July 2015 to 274 individuals in June 2016. This decline is primarily the result of individuals obtaining full coverage through the Marketplace or in full-scope Medicaid.

Intersection with Medicaid Managed Care: Connecticut no longer operates a Medicaid managed care program. In 2012, Connecticut’s Medicaid program transitioned from contracting with managed care organizations (MCOs) for the delivery of care to fee-for-service, leveraging several Administrative Service Organizations (ASOs) to help with program administration.

LARC: LARC methods are included in the family planning program benefit package. The State also promotes LARC insertions for post-partum women immediately following delivery by allowing hospitals to bill for immediate post-partum LARC outside of inpatient delivery codes.

Other Initiatives: None identified

Delivery System Reform:In December 2014, CMS’ Center for Medicare & Medicaid Innovation awarded Connecticut up to $45 million through a State Innovation Model grant to implement the Connecticut Healthcare Innovation Plan. While the Innovation Plan does not include any family planning-specific components, family planning providers have been invited to participate in some programs. Back to top

Illinois State Profile

Family Planning Overview: Illinois does not have a separate Family Planning waiver or State Plan Amendment for the provision of family planning services. Instead, Illinois embeds family planning and family-planning related services within Medicaid’s comprehensive benefit package. The Illinois Department of Healthcare and Family Services (HFS) administers the full Medicaid program, with the Bureau of Quality Management overseeing family planning services, among other initiatives, within the broader Medicaid Program.

Illinois Medicaid/CHIP Eligibility Levels as % of FPL66 Eligibility levels do not include 5% income disregard

Children by Age (Medicaid)Separate CHIPPregnant Women(Medicaid)ParentsChildless Adults
0-11-56-18
142%142%142%313%208%133%133%

Share of Medicaid Population Covered by Different Delivery Systems67 

% of Medicaid Population Covered
Fee-for-Service21%
Primary Care Case Management27%
Managed Care Organizations53%

Brief Program History: Between 2004 and 2014, the State operated the “Illinois Healthy Women” family planning waiver for women ages 19-44 with incomes up to 200% of the federal poverty level (FPL). The program was administered through the Bureau of Maternal and Child Health Promotion (BMCHP) within HFS. Illinois ended its family planning waiver program on December 31, 2014 with the understanding that women enrolled in the waiver would have the opportunity to enroll in comprehensive coverage — either in Medicaid expansion (for those with incomes at or below 138% of the FPL) or in a qualified health plan with financial assistance on the Marketplace (for those with incomes between 138% FPL and 200% FPL). BMCHP was recently merged into the Bureau of Quality Management.

After Illinois decided to end the waiver program, the State was granted a “transition year” across 2014 to conduct outreach to enrollees, educating them about the closing of the program and opportunities to enroll in either full coverage Medicaid or a Marketplace Qualified Health Plan (QHP) with premium tax credits. While waiver enrollees could not be automatically enrolled into the Medicaid expansion program because the State’s system did not capture enrollees’ income as a percentage of FPL, State data indicate that 45% of waiver enrollees had transitioned to full coverage Medicaid as of February 2016. A portion of waiver enrollees most likely gained coverage in the Marketplace QHPs, although information on the number of enrollees is not available.

Medicaid Enrollee Access to Family Planning Benefits: Medicaid enrollees have access to family planning services as a part of their comprehensive Medicaid benefit package. The majority of enrollees likely to seek family planning services are enrolled in Medicaid managed care.

In June 2014, Illinois Medicaid released a new policy providing guidance to all Medicaid-enrolled providers regarding comprehensive quality family planning and reproductive health services. In October 2014, Illinois took a step to increase access to family planning services, and most notably LARC methods, by increasing Medicaid reimbursement rates for the following procedures:68 

CPT CodeDescriptionPrevious RateNew Rate
11981Insertion of implant$72.30$88.00
11982Removal of implant$87.00$99.00
11983Removal and reinsertion of implant$108.00$143.00
58300Insertion of IUD$44.00$88.00
58301Removal of IUD$37.40$37.40
58300 + 58301Removal and reinsertion of IUD$44.00$106.70

Intersection with Managed Care: In 2015, Illinois’ Medicaid program transitioned from predominantly fee-for-service to over 50% managed care. Knowing that the family planning enrollees transitioning to full coverage Medicaid would be enrolled in Medicaid MCOs, the State rolled out the “Family Planning Action Plan”69  (FPAP) to help smooth the transition and ensure that enrollees continued to receive access to comprehensive family planning services. The FPAP articulates for providers and MCOs that:

  • All Medicaid providers must offer the full spectrum of family planning contraceptives with no cost sharing, step therapy or prior authorization;
  • The Free Choice of Provider statute allows enrollees to see any Medicaid provider regardless of managed care network status; and
  • Enrollees should receive education and counseling on all FDA-approved contraceptives, from most to least effective, with most effective including long acting reversible contraceptives (LARC)—intrauterine devices (IUD) and the contraceptive implant.
  • The Medicaid agency oversees MCOs and their provision of family planning services. In addition to contracting requirements, the Medicaid agency:
  • Requires MCO attendance at periodic in-person meetings, during which the Medicaid agency communicates updates, critical program information, and provides trainings, including on family planning services and how to improve birth outcomes;
  • Requires MCOs to provide intensive care management to enrollees under the prenatal care plan which includes family planning education and counseling; and
  • Is in the process of updating its methodology for withholding a portion of MCOs’ capitation rates contingent on their meeting certain performance measures. Consideration will be given to family planning metrics when the updated developmental contraceptive performance measures are finalized.

LARC: Illinois has implemented several policy and payment changes to increase access to LARC. In addition to the coverage and counseling requirements outlined in the FPAP, Illinois has: (1) increased reimbursement for insertion, removal and reinsertion of LARCs in outpatient settings; (2) increased the dispensing fee for LARC purchased through the 340B program; (3) allowed separate reimbursements for an Evaluation & Management visit in which the provider and patient discuss contraceptive options and a same-day LARC procedure; (4) allowed hospitals to separately bill for a LARC device that is provided immediately postpartum in the inpatient hospital setting;70 (5) ensured that federally-qualified health centers and rural health centers receive reimbursement for actual acquisition costs for LARC devices under the 340B program separate from the encounter rate; and (6) implemented a pilot program to ensure outpatient providers maintain sufficient supplies of LARC methods.71 

Other Initiatives: Illinois has deployed other payment and billing changes across fee-for-service and managed care to ensure access to a range of contraceptive methods, including:

  • Increasing the reimbursement rate for vasectomies;
  • Permitting FQHCs and RHCs to bill fee-for-service for transcervical sterilization devices, which the State describes as alternatives to hospital-based surgical sterilization that do not require incisions or general anesthesia;
  • Establishing a contraceptive education/counseling enhanced rate for eligible providers;
  • Increasing medical dispensing fee add-ons for certain 340B birth control methods beyond LARC; and,
  • Requiring providers to dispense three month supplies of certain contraceptives whenever possible and medically appropriate.

Additionally, on July 29, 2016, Governor Bruce Rauner signed into law House Bill 5677,72  which ensures that all FDA-approved contraceptive drugs, devices and supplies are covered without cost-sharing by individual and group plans regulated by the state or that cover state employees, retirees and their dependents. While plans are not required to include all FDA-approved, therapeutic equivalents of a drug, device or product on formulary, plans must make available without cost-sharing any off-formulary methods recommended by a patient’s provider based on medical necessity. The bill also ensures that 12 months’ worth of contraception may be dispensed at one time and requires coverage for patient education, counseling on contraception, contraceptive follow-up services and voluntary sterilization procedures. The law is scheduled to take effect January 1, 2017.

Finally, the Illinois Medicaid agency contributed to the national effort among the federal Department of Health and Human Services Office of Population Affairs, Centers for Medicare and Medicaid Services, and Centers for Disease Control and Prevention to develop contraceptive use performance measures.

Delivery System Reform: There are no new statewide delivery system reform efforts underway. Back to top

Missouri State Profile

Family Planning Overview: Missouri administers its family planning program through an 1115 waiver for uninsured women ages 18-55 with incomes at or below 201% FPL. Enrollees in the program are covered for both family planning and family planning-related services. The program is co-managed by two divisions within the Department of Social Services: MO HealthNet (Missouri’s Medicaid agency) and the Family Support Division (FSD). FSD manages program eligibility and MO HealthNet handles policy and claims administration.

Missouri Medicaid/CHIP Eligibility Levels as % of FPL73 Eligibility levels do not include 5% income disregard

Children by Age (Medicaid)Separate CHIPPregnant Women(Medicaid)ParentsChildless Adults
0-11-56-18
196%148%148%300%196%18%N/A

Share of Medicaid Population Covered by Different Delivery Systems74 

% of Medicaid Population Covered
Fee-for-Service50%
Managed Care Organizations51%75 

Brief Program History: Missouri’s initial family planning program was approved as part of an 1115 Medicaid managed care demonstration project, which ran from May 1, 1998 through March 1, 2004, before being extended through September 30, 2007. On October 1, 2007 Missouri implemented the current family planning program entitled “Women’s Health Services Program.” At the request of the State, CMS subsequently renewed and extended this program through December 31, 2014, then again through December 31, 2017. Missouri did not see a need to transition the waiver program to a State Plan Amendment. Program enrollment has grown from an average monthly enrollment of approximately 60,000 in 2013 to approximately 71,000 in 2016.

Missouri recently suspended the family planning waiver and replaced it with a state-funded program titled “Missouri Women’s State-Funded Health Service Program.” All existing waiver program enrollees will be automatically transitioned into the state-funded program. Program eligibility and benefits are expected to remain the same. This change is being made because language authorizing funding for the program no longer complies with all terms and conditions of the waiver. As passed by the legislature76  and described in the State’s Public Notice,77  Medicaid funds in Missouri will no longer be “expended to directly or indirectly subsidize abortion services or procedures or administrative functions and none of the funds…may be paid or granted to an organization that provides abortion services.”

Program Enrollment: Missouri employs the same application, verification, and renewal processes for full-scope Medicaid and the family planning program. Pregnant women enrolled in Medicaid are automatically enrolled into the family planning program 60 days postpartum.

Intersection with Medicaid Managed Care: Half of Missouri’s full-scope Medicaid enrollees are enrolled through a Medicaid managed care plan. Family planning benefits are aligned across the family planning waiver program, Medicaid fee-for-service (FFS) and Medicaid managed care plans. Medicaid managed care plans in Missouri are required to offer care management for individuals receiving family planning services and to contract with Title X and other family planning providers. Additionally, plans must have internal quality improvement procedures for a variety of clinical areas, including family planning, well-woman care, and maternity.

LARC: LARC methods are included in the family planning program benefit package. Missouri recently expanded access to LARC for both Medicaid and family planning program enrollees by separately reimbursing hospitals for LARC insertions for post-partum women immediately following delivery.78 

Other Initiatives: None identified

Delivery System Reform: Missouri is not currently pursuing delivery system reform efforts; however, Missouri will be expanding Medicaid managed care eligibility criteria by May 2017, with the primary goal of transitioning more children into managed care plans. The family planning program will remain FFS. Back to top

Virginia State Profile

Family Planning Overview: Virginia administers its “Plan First” program though a State Plan Amendment (SPA) for women and men of any age with incomes up to 200% FPL. Enrollees in Plan First have coverage of family planning services, but not family planning related services. The Department of Medical Assistance Services (DMAS) administers the Plan First program and contracts with the local Department of Social Services to perform eligibility determinations and enrollment of members in Plan First. The Department of Health (VDH) is the largest provider of safety-net family planning services through its Title X clinics.

Virginia Medicaid/CHIP Eligibility Levels as % of FPL79 Eligibility levels do not include 5% income disregard

Children by Age (Medicaid)Separate CHIPPregnant Women*(Medicaid)ParentsChildless Adults
0-11-56-18
143%143%143%200%143%49%0%
*Virginia also has a Health Insurance Flexibility and Accountability CHIP waiver that covers pregnant women over the Medicaid income limits up to 200% of FPL.

Share of Medicaid Population Covered by Different Delivery Systems80 

% of Medicaid Population Covered
Fee-for-Service34%
Managed Care Organizations66%

Brief Program History: Virginia first established a family planning program through a waiver in 2002. This Medicaid waiver extended family planning services for two years to Medicaid pregnant women enrollees after delivery, if they continued to meet eligibility requirements. In 2007, coverage was expanded to all women and men with incomes less than 133% FPL and the lower age requirement of 19 was removed. The income limit was then raised to 200% FPL in 2008. In 2011, Virginia transitioned the family planning program from a waiver to a State Plan, eliminating the need for demonstration renewals every three years as well as waiver evaluations and reports. Since Virginia converted to a State Plan, the requirement for individuals to complete a separate application for family planning upon losing full-scope Medicaid coverage was removed, thus enrollment increased substantially from 8,000 in 2011 to approximately 110,000 in 2016. Notably, the State has not seen a corollary increase in utilization of services in Plan First, reflecting that many of the enrollees are not using services.

Program Enrollment & Access to Care: As part of the Affordable Care Act, Virginia uses a single, streamlined application for most Medicaid eligibility categories, including Plan First. Prior to implementation of the single, streamlined application, Virginia used a shorter, family planning-only form. Individuals between the ages of 19 and 64 who apply for Medicaid using the streamlined application who are not found eligible for full-scope Medicaid but are determined eligible for Plan First are automatically enrolled, unless they opt out for Plan First determination. Individuals under age 19 and over 64 must opt in to be evaluated for the Plan First program if they are not determined eligible for a full Medicaid covered group.

Plan First enrollees may obtain family planning services from any Department of Medical Assistance Services (DMAS) enrolled fee-for-service provider.

Intersection with Medicaid Managed Care: Two-thirds of Virginia’s Medicaid enrollees with comprehensive coverage are enrolled in a Medicaid managed care plan. Family planning services are included in the comprehensive benefit package and are very similar to those offered to family planning SPA enrollees. DMAS is evaluating programmatic differences and working to align the programs.

LARC: Virginia is working on reforms to eliminate payment barriers and increase access to and utilization of LARC in a variety of settings, including physician offices and hospital-based immediate postpartum LARC insertion. The Virginia DMAS is working with the Virginia Department of Health (VDH), Physician and Nurse Practitioner Provider Associations, and the Medicaid and CHIP managed care health plans to increase provider and member education as well as outreach efforts on the benefits of LARC and processes needed to streamline reimbursement for the LARC devices.

Other Initiatives: Virginia has taken steps to address Plan First enrollment issues and increase access to contraception, including through the following activities:

  • DMAS and VDH jointly conducted targeted outreach to encourage enrollment into the Plan First program for several years. Each agency received funding to devote staff to these efforts, including outreach to patients and providers, and met regularly to discuss the outcomes of these efforts.
  • DMAS modified the Plan First ID card and member handbook to differentiate the program more clearly from Medicaid, resolving confusion among providers and consumers about whether women had family planning only or full-scope Medicaid.
  • While all categories of contraceptives are covered, in 2016 Virginia increased access to oral contraceptive methods by eliminating it from the “preferred drug list” (PDL). Removing contraceptives from the PDL removes all prior authorization requirements from oral contraceptives since the Commonwealth does not have “non-preferred” agents. Currently, physician-administered contraceptive methods are not on the PDL and must be purchased by the practitioner and billed upon administration.
  • In 2015, VDH dedicated funding to increase accessibility of LARCs as part of an initiative to reduce unintended pregnancy. VDH continues to support availability of LARCs for VDH clients as long as funding allows. The intent is to compare statewide unintended pregnancy rates before 2015 and after this 2015 LARC initiative to measure efficacy and LARC selection by clients.

Delivery System Reform: In February 2016, Virginia submitted an 1115 Medicaid waiver application to CMS requesting authority to implement a $1 billion Delivery System Reform Incentive Payment (DSRIP) initiative. The initiative would establish networks of high performing providers that would partner with managed care organizations to improve and coordinate care and ultimately transition to new payment models for high-cost Medicaid enrollees. Family planning providers and metrics were not incorporated into the proposed demonstration. Back to top

Appendix C: List of Interviewees

ALABAMA

Medicaid Agency:

Gretel Felton, Deputy Commissioner for Beneficiary Services

Jerri Jackson, Director of the Managed Care Division

Sylisa Lee-Jackson, Associate Director of Maternity, Plan First/Family Planning, and Nurse Midwife Programs

Department of Public Health, Bureau of Family Health Services:

Meredith Adams, Director of Social Work

Diane Beeson, Director of Women’s and Children’s Health Division

Leigh Ann Hixon, Plan First Manager

CALIFORNIA

Department of Health Care Services (DHCS):

Nicole Griffith, Assistant Division Chief of the Office of Family Planning (OFP)

René Mollow, Deputy Director of Healthcare Benefits and Eligibility

Christina Moreno, Division Chief, OFP

Laurie Weaver, Assistant Deputy Director of Healthcare Benefits and Eligibility

University of California at San Francisco (UCSF)

Claire Brindis, Professor of Pediatrics and Health Policy and Director of the Institute for Health Policy Studies. Previously, lead of UCSF Family PACT Evaluation, OFP, DHCS

Heike Thiel de Bocanegra, Associate Professor, Department of Obstetrics, Gynecology & Reproductive Services. Previously, director of UCSF Family PACT Evaluation, OFP, DHCS

Dr. Christine Dehlendorf, Associate Professor, School of Medicine

University of California, Davis

Eleanor Schwarz, Professor of Medicine. Previously, medical director of UCSF Family PACT Evaluation, OFP, DHCS

Planned Parenthood Affiliates of California:

Kathy Kneer, President and CEO

California Family Health Council:

Amy Moy, Vice President of Public Affairs

Julie Rabinowitz, President and CEO

CONNECTICUT

Department of Social Services:

Nina Holmes, Health Program Supervisor, Division of Health Services

Daniel Patterson, Public Assistance Consultant, Eligibility Policy and Program Support

Mark Shock, Director of Eligibility Policy, Division of Health Services

Robert Zavoski, Medical Director, Division of Health Services

Planned Parenthood of Southern New England:

Susan Lane, Director of Planning and Grants

Judy Tabar, President and CEO

ILLINOIS

Department of Healthcare and Family Services

Mary Doran, Bureau Chief, Bureau of Program and Policy Coordination

Teresa Hursey, Acting Administrator, Division of Medical Programs

Linda Wheal, Maternal Health Program Manager, Bureau of Quality Management

Chicago Department of Public Health:

Kai Tao, Deputy Commissioner, Chief Program Officer

Planned Parenthood of Illinois:

Brigid Leahy, Director of Public Policy

EverThrive:

Kathy Waligora, Director Health Reform Initiative

University of Chicago, Center for Interdisciplinary Inquiry and Innovation in Sexual and Reproductive Health:

Lee Hasselbacher, Policy Coordinator, Family Planning and Contraceptive Research

MISSOURI

MO HealthNet:

Glenda Kremer, Assistant Deputy Director of the Program Operational Unit

Nancy Nikodym, Social Services Unit Manager

Jayne Zemmer, Assistant Deputy Director of Clinical Services Policy & Operations

Department of Social Services (DSS):

Jennifer Tidball, Deputy Director

Kim Evans, Deputy Director for Income Maintenance, Family Support Division

St. Louis Planned Parenthood:

Mary Kogut, Chief Executive Officer

Angie Postal, Director of Public Policy

Missouri Family Health Council:

Michelle Trupiano, Executive Director

Missouri Foundation for Health:

Thomas McAuliffe, Director of Health Policy

Contraceptive Choice Center at the Washington University in St. Louis:

Dr. Tessa Madden, OB-GYN and Assistant Professor at the School of Medicine

Dr. Timothy McBride, Professor at the George Warren Brown School of Social Work

VIRGINIA

Department of Medical Assistance Services

Ashley Harrell, Policy & Services Manager, Maternal & Child Health Division

William Lessard, Director of Provider Reimbursement

Linda Nablo, Chief Deputy Director

Daniel Plain, Senior Health Care Services Manager

Cheryl Roberts, Deputy Director for Programs

Department of Health:

Sulola Adekoya, Medical Director for Regional Health Services

Janelle Anthony, Family Planning Quality Assurance Nurse

Cornelia Deagle, Director of the Division of Children and Family Health

Richmond City Health District:

Danny Avula, Deputy Director

Laurinda Davis, Public Health Nurse Supervisor

Planned Parenthood Advocates of Virginia:

Cianti Stewart-Reid, Executive Director

The Virginia League for Planned Parenthood:

Paulette McElwain, President and CEO

Virginia Poverty Law Center:

Jill Hanken, Health Attorney

FEDERAL & NATIONAL EXPERTS

Centers for Medicare and Medicaid Services (CMS): Center for Medicaid and CHIP Services (CMCS), State Demonstrations Group:

Andrea Casart, Director, Division of Medicaid Expansion Demonstrations

Julie Sharp, Technical Director, Division of State Demonstrations and Waivers

CMS: CMCS, Children and Adults Health Programs Group:

Stephanie Bell, Deputy Director, Division of Eligibility & Enrollment

Lekisha Daniel-Robinson, Coordinator, Maternal and Infant Health Initiative, Division of Quality and Health Outcomes

Karen Mizuka, Chief Quality Officer, Division of Quality and Health Outcomes

Jennifer Sheer, Project Officer, Division of Quality and Health Outcomes

CMS: CMCS, Office of the Administrator:

Jessica Schubel, Senior Policy Advisor to the Director of CMCS

National Family Planning and Reproductive Health Association:

Clare Coleman, CEO

Robin Summers, Policy Director

Planned Parenthood Federation of American:

Carolyn Cox, Public Policy Manager

Sarah Gillooly, Strategic Manager for Health Finance

Davida Silverman, Senior Policy Analyst

Emily Stewart, National Director of Public Policy

Amy Yenyo, Assistant Director of Public Policy

Endnotes

  1. Ranji U & Salganicoff A. State Medicaid Coverage of Family Planning Services: Summary of State Survey Findings. Kaiser Family Foundation. November 2009. ↩︎
  2. Sonfield A & Gold RB. Public Funding for Family Planning, Sterilization and Abortion Services, FY 1980–2010. Guttmacher Institute. March 2012. ↩︎
  3. Gold RB, Richards CL, Ranji U, & Salganicoff A. Medicaid’s Role in Family Planning. Kaiser Family Foundation and Guttmacher Institute. October 2007. ↩︎
  4. Ranji U & Salganicoff A. State Medicaid Coverage of Family Planning Services: Summary of State Survey Findings. Kaiser Family Foundation. November 2009. ↩︎
  5. Ranji U & Salganicoff A. State Medicaid Coverage of Family Planning Services: Summary of State Survey Findings. Kaiser Family Foundation. November 2009. ↩︎
  6. Gold RB. Back to Center Stage: ACA Decision Gives New Significance to Medicaid Family Planning Expansions. Guttmacher Institute. October 2012. ↩︎
  7. Guttmacher Institute. State Policies in Brief: Medicaid Family Planning Eligibility Expansions. As of March 2016. ↩︎
  8. Murphy S. Planned Parenthood to continue contracts with Oklahoma. Associated Press, Chicago Tribune. June 30, 2016. ↩︎
  9. Centers for Medicare and Medicaid Services (CMS), Department of Health and Human Services (HHS). HSHHHMedicaid and Children’s Health Insurance Program (CHIP) Programs; Medicaid Managed Care, CHIP Delivered in Managed Care, Medicaid and CHIP Comprehensive Quality Strategies, and Revisions Related to Third Party Liability. Published in the Federal Register on May 6, 2016. ↩︎
  10. CMS, HHS. Clarifying ‘Free Choice of Provider’ Requirement in Conjunction with State Authority to Take Actions against Medicaid Providers.” SMD #16-005. April 19, 2016. ↩︎
  11. CMS, HHS. State Medicaid Payment Approaches to Improve Access to Long-Acting Reversible Contraception. CMCS Informational Bulletin. April 8, 2016. ↩︎
  12. CMS, HHS. Medicaid Family Planning Services and Supplies. SHO #16-008. June 14, 2016. ↩︎
  13. Consumer advocates were available in a limited number of case study states. ↩︎
  14. State Health Facts. Share of Medicaid Population Covered under Different Delivery Systems. Kaiser Family Foundation. As of July 1, 2015. Accessed May 24, 2016. ↩︎
  15. Alabama’s waiver provides the authority to offer family planning related services; however, state interviewees reported that family planning related services are not covered. ↩︎
  16. Prior to termination, Illinois operated the “Illinois Healthy Women” family planning waiver for women ages 19-44 with incomes up to 200% FPL. ↩︎
  17. State Health Facts. Total Number of Residents. Kaiser Family Foundation. 2014. ↩︎
  18. State Health Facts. State Health Insurance Marketplace Types, 2016. Kaiser Family Foundation. ↩︎
  19. States that utilize the Federally-facilitated Marketplace (or “HealthCare.gov”) must elect whether to have the FFM make assessments of Medicaid/CHIP eligibility and transfer the account to the Medicaid/CHIP agency for a final determination (“assessment model”) or whether to delegate the authority to make Medicaid/CHIP eligibility determinations to the FFM (“determination model”). The eight determination states are Alabama, Alaska, Arkansas, Montana, New Jersey, Tennessee, West Virginia, and Wyoming. Marketplace model selections can be found: https://www.medicaid.gov/medicaid-chip-program-information/program-information/medicaid-and-chip-and-the-marketplace/medicaid-chip-marketplace-interactions.html ↩︎
  20. In contrast, 29 states are “assessment model” states that allow the FFM to assess Medicaid eligibility for them, but, that then take the information that people provided to the FFM and use it to conduct the final Medicaid determination themselves. This allows them to apply state-specific eligibility rules and procedures, and, in the process, to evaluate people for eligibility for family planning programs. ↩︎
  21. Alabama’s Application for Health Coverage & Help Paying Costs. Question 7 on Page 2 of 11. ↩︎
  22. When California converted its family planning program from a waiver to a SPA, it leveraged the ACA’s state option to use eligibility standards and processes that were applied on or before January 1, 2007, thereby permitting the State to continue its use of enrollment into the family planning program on-site at providers’ offices based on attested information. ↩︎
  23. Depending on state-specific rules, applicants in waiver states may be deemed ineligible for a Medicaid family planning program if they have access to alternative coverage that includes family planning services. ↩︎
  24. People can still enroll in a Marketplace plan and receive a premium tax credit even if they also are enrolled in a Medicaid family planning program. This is because Medicaid family planning programs do not constitute minimum essential coverage, and so do not preclude someone from premium tax credit eligibility. However, in some states, including California, Medicaid family planning rules adopted under waivers limit the coverage to people who otherwise lack family planning benefits. ↩︎
  25. Ranji U, Bair Y, & Salganicoff A. Medicaid and Family Planning: Background and Implications of the ACA. Kaiser Family Foundation. February 2016. ↩︎
  26. CMS, HHS. Family Planning Services Option and New Benefit Rules for Benchmark Plans. SMDL #10-013. July 2, 2010. ↩︎
  27. Family planning-related services are those services administered along with a family planning service (e.g., contraceptive counseling). Some examples of family planning-related services include the treatment of STIs, physical exams conducted as part of an annual family planning visit, and preventive services (e.g., HPV vaccine). ↩︎
  28. Walls J, Gifford K, Ranji U, Salganicoff A, & Gomez I. Medicaid Coverage of Family Planning Services: Results from a State Survey. Health Management Associates and Kaiser Family Foundation. September 2016. ↩︎
  29. Alabama’s Department of Public Health Title X clinics are staffed primarily by nurse practitioners who, under state law, cannot insert or remove IUDs or implantable devices unless there is a physician on staff. For example, if a woman selects an IUD as her form of birth control, the clinic must refer her to an off-site provider for insertion. ↩︎
  30. Alabama Administrative Code, Chapter 560-X-14-.03(2). ↩︎
  31. Kearney M & Levine P. Reducing Unplanned Pregnancies through Medicaid Family Planning Services. Brookings Institute. July 2008. ↩︎
  32. Cross Reidel J & Thiel de Bocanegra H. Access to Publicly-Funded Family Planning Services by Women in Need, Fiscal Year 2009-10 to Fiscal Year 2012-13. Bixby Center for Global Reproductive Health, University of California. November 2015. ↩︎
  33. Missouri House Bill 2011, 98th General Assembly, 2016. ↩︎
  34. Missouri Department of Social Services. Public Notice of Suspension of Federal Expenditure Authority for Section 1115 Family Planning Demonstration. Accessed August 4, 2016. ↩︎
  35. Stevenson AJ, Flores-Vasquez IM, Allgeyer RL, Schenkkan P, & Potter JE. (2016). Effect of Removal of Planned Parenthood from the Texas Women’s Health Program. The New England Journal of Medicine. Vol. 374:853-860. ↩︎
  36. MacDorman M, Declerq E, Cabral H, & Morton C. (2016). Recent Increases in the U.S. Maternal Mortality Rate: Disentangling Trends From Measurement Issues. Obstetrics and Gynecology. Vol. 128, No. 3, (447-455). ↩︎
  37. Frost J, Sonfield A, Zolna M & Finer L. (2014). Return on Investment: A Fuller Assessment of the Benefits and Cost Savings of the US Publicly Funded Family Planning Program. The Milbank Quarterly. Vol. 92, No. 4, (667-720). ↩︎
  38. Gavin L, Moskosky S, Carter M, et al. (2014). Providing Quality Family Planning Services: Recommendations of CDC and the U.S. Office of Population Affairs. MMWR; 63. ↩︎
  39. Center for Medicaid and CHIP Services. CMCS Maternal and Infant Health Initiative: Improving Maternal and Infant Health Outcomes in Medicaid and CHIP. Accessed August 4, 2016. ↩︎
  40. Office of Population Affairs and Centers for Disease Control. Measure PCU: Use of Contraceptive Methods by Women Ages 15-44 (Developmental Measure). Accessed August 3, 2016. ↩︎
  41. Ibid. ↩︎
  42. Salganicoff A, Ranji U, Beamesderfer A & Kurani N. Women and Health Care in the Early Years of the ACA: Key Findings from the 2013 Kaiser Women’s Health Survey. Kaiser Family Foundation. May 2014. ↩︎
  43. Pace LE, Dolan BM, Tishler LW, Gooding HC, & Bartz D. (2015). Incorporating Long-acting Reversible Contraception Into Primary Care: A Training and Practice Innovation. Women’s Health Issues; Vol. 26(2), pp.131-134. ↩︎
  44. Yoost J. (2014). Understanding Benefits and Addressing Misperceptions and Barriers to Intrauterine Device Access among Populations in the United States. Patient Preference and Adherence; 8, pp.947–957. ↩︎
  45. CMS, HHS. State Medicaid Payment Approaches to Improve Access to Long-Acting Reversible Contraception. CMCS Informational Bulletin. April 8, 2016. ↩︎
  46. Illinois Department of Healthcare and Family Services. Illinois Family Planning Action Plan. October 2014. ↩︎
  47. CMS, HHS. State Medicaid Payment Approaches to Improve Access to Long-Acting Reversible Contraception. CMCS Informational Bulletin. April 2016. ↩︎
  48. While the immediate post-partum period is a particularly favorable time to provide LARC methods due to the softened state of the cervix, there are ethical concerns about attempting to advise or counsel women on contraceptive methods during the time of delivery. ↩︎
  49. Prior to termination, Illinois operated the “Illinois Healthy Women” family planning waiver for women ages 19-44 with incomes up to 200% FPL. ↩︎
  50. Alabama’s waiver provides the authority to offer family planning related services; however, state interviewees reported that family planning related services are not covered. ↩︎
  51. State Health Facts. Share of Medicaid Population Covered under Different Delivery Systems. As of July 1, 2015. Kaiser Family Foundation. Accessed May 24, 2016. ↩︎
  52. Medicaid.gov. Medicaid & CHIP In Alabama. State Profiles, Eligibility. ↩︎
  53. State Health Facts. Share of Medicaid Population Covered under Different Delivery Systems. As of July 1, 2015. Kaiser Family Foundation. Accessed May 24, 2016. ↩︎
  54. Eligibility levels for both men and women go up to 146% when the income disregard in the ACA is considered. ↩︎
  55. Alabama Medicaid. Provider List. Family Planning/ Plan First. As of May 13, 2016. ↩︎
  56. Health Resources and Services Administration. Data Warehouse. Map Tool. Accessed August 25, 2016. ↩︎
  57. CMS, HHS. State Medicaid Payment Approaches to Improve Access to Long-Acting Reversible Contraception. CMCS Informational Bulletin. April 8, 2016. ↩︎
  58. Bronstein J. Evaluation of Plan First. Demonstration Year 14. UAB School of Public Health. March 2016. ↩︎
  59. Medicaid.gov. Medicaid & CHIP in California. State Profiles, Eligibility. ↩︎
  60. State Health Facts. Share of Medicaid Population Covered under Different Delivery Systems. As of July 1, 2015. Kaiser Family Foundation. Accessed May 24, 2016. ↩︎
  61. California Department of Health Care Services – Office of Family Planning. Family PACT Client Data, 2013-2015. August 2015. Accessed August 2, 2016. ↩︎
  62. Family PACT Homepage. California Department of HealthCare Services. ↩︎
  63. CMS, HHS. Maternal and Infant Health Initiative Grant Award Announcement. September 10, 2015. ↩︎
  64. Medicaid.gov. Medicaid & CHIP in Connecticut. State Profiles, Eligibility. ↩︎
  65. State Health Facts. Share of Medicaid Population Covered under Different Delivery Systems. As of July 1, 2015. Kaiser Family Foundation. Accessed May 24, 2016. ↩︎
  66. Medicaid.gov. Medicaid and CHIP in Illinois. State Profiles, Eligibility. ↩︎
  67. State Health Facts. Share of Medicaid Population Covered under Different Delivery Systems. As of July 1, 2015. Kaiser Family Foundation. Accessed May 24, 2016. ↩︎
  68. Illinois Department of Healthcare and Family Services. Provider Notice regarding Important Family Planning Policy Change and Payment Increases. October 10, 2014. ↩︎
  69. Illinois Department of Healthcare and Family Services. Our Medicaid Commitment to Family Planning. August 20, 2014. ↩︎
  70. Illinois Department of Healthcare and Family Services. Hospital Billing and Reimbursement for Immediate Postpartum Long Acting Reversible Contraceptives. June 30,2015. ↩︎
  71. CMS, HHS. State Medicaid Payment Approaches to Improve Access to Long-Acting Reversible Contraception. CMCS Informational Bulletin. April 8, 2016. ↩︎
  72. Illinois House Bill 5576. 99th General Assembly. ↩︎
  73. Medicaid.gov. Medicaid & CHIP in Missouri. State Profiles, Eligibility. ↩︎
  74. State Health Facts. Share of Medicaid Population Covered under Different Delivery Systems. As of July 1, 2015. Kaiser Family Foundation. Accessed May 24, 2016. ↩︎
  75. Data may not sum to 100% due to rounding. ↩︎
  76. Missouri House Bill 2011, 98th General Assembly, 2016. ↩︎
  77. Missouri Department of Social Services. Public Notice of Suspension of Federal Expenditure Authority for Section 1115 Family Planning Demonstration. Accessed August 4, 2016. ↩︎
  78. Missouri Department of Social Services. LARC Devices Inserted Post-Partum During an Inpatient Hospital Stay. Provider Bulletin. Accessed August 16, 2016. ↩︎
  79. Medicaid.gov. Medicaid & CHIP in Virginia. State Profiles, Eligibility. ↩︎
  80. State Health Facts. Share of Medicaid Population Covered under Different Delivery Systems. As of July 1, 2015. Kaiser Family Foundation. Accessed May 24, 2016. ↩︎

Medicaid Managed Care and the Provision of Family Planning Services

Authors: Caroline Rosenzweig, Laurie Sobel, Alina Salganicoff, Jennifer E. Moore, and Ashley A. Hernandez Gray
Published: Apr 27, 2017

Executive Summary

Overview

Since the 1990’s, managed care has had an increasingly significant role in the delivery of health care services to Medicaid beneficiaries. With the passage of the Affordable Care Act (ACA), more individuals qualified for Medicaid than ever before, and the majority of those beneficiaries are enrolled in managed care arrangements. Regardless of the outcome of efforts to repeal or replace the ACA or cap Medicaid spending, managed care is likely to remain the dominant care arrangement for Medicaid beneficiaries across the nation. With three quarters of women of reproductive age in Medicaid enrolled in care arrangements through managed care organizations (MCOs), the effective provision of family planning services is an essential element of needed care for women and is critical to reduce unintended pregnancies among this population. The findings presented in this report are based on information collected from both a national survey and focus groups of leaders from Medicaid MCOs across the country who represented a cross-section of plans in terms of geographic region and the number of enrolled Medicaid beneficiaries. They were asked to address a variety of topics related to the provision of family planning services to low-income women including billing and reimbursement, provider recruitment and network adequacy, scope of benefits, member education, provider training, quality measurement, and state policy constraints.

Key Findings

Plans rely on clinics, including Federally Qualified Health Centers (FQHCs) and family planning clinics, to provide a wide range of comprehensive health care, including family planning services, to their members. Plans did not report having problems developing an adequate network. In fact, they report that they contract with the majority of FQHCs in the area they serve. They maintained that the importance of these health centers derives from their ability to provide a broad suite of health services, including family planning care. In addition, these centers are already embedded in the enrollees’ communities; therefore, the plan may ensure access to care through the providers their members are most likely to seek out. Many also reported that they have contracts with free-standing family planning providers, like Planned Parenthood, to provide family planning services to their enrollees.

The types of contraceptives covered by plans closely follow state policies; and some plans have policies that offer contraceptive coverage options that exceed what is available under fee-for-service programs. Plans felt that enrollees were not always aware of these options. Most plans reported covering all forms of emergency contraception, including Plan B®, ella®, and the copper intrauterine device (IUD), ParaGard®. Although ella® is required to be covered for ACA Medicaid expansion populations, some plans reported challenges with coverage of the drug, attributed to problems with formularies. While there is evidence that providing women who use oral contraceptives with six to twelve cycles of pills reduces unintended pregnancy rates,1 ,2  most plans in the study only cover one or three months of oral contraceptives at one time. Only one plan reported covering a 12-month supply, even though plans have the leeway to cover more cycles of oral contraceptives than the state does under fee-for-service. Almost all plans reported requiring a prescription for over-the-counter (OTC) contraception, such as Plan B ® emergency contraceptive pills and male condoms, and some plans also covered spermicides, sponges, and female condoms, but noted that enrollees could pay out of pocket for these items if they did not pay at the pharmacy counter. Plans reported that requiring a prescription is the only way for them to track utilization and pay for claims directly, but noted that members may not be aware of the requirements for over-the-counter contraceptive coverage.

The expense of stocking of IUDs and implants remains key challenge in ensuring access to Long Acting Reversible Contraceptives (LARC), such as IUDs and implants. LARC devices are usually reimbursed after insertion, requiring providers to take on a significant financial risk to cover the high upfront stocking expenses of devices that can cost as much as $1,000. Plans recognized that limited availability of on-hand LARC devices is often due to the prohibitive expense of stocking. This barrier may limit a beneficiary’s ability to obtain one the same day she requests it, an element of high qualify family planning care according to the Centers for Disease Control and Prevention (CDC). Some health plans reported that they have negotiated with local pharmacies to stock IUDs in order to improve the availability of LARCs to their members.

Plans suggested that state payment and reimbursement methodologies that bundle pregnancy services act as a barrier to care, particularly in the provision of post-partum LARC. Plans reported they largely follow the payment methodologies set by their state Medicaid agency. While plans may reimburse providers above the fee-for-service rates determined by the state, most said they do not due to the administrative burden of reconfiguring their claims systems. This has become particularly salient when the state pays for prenatal and obstetrics care with a global fee or bundled payment, as it has important implications for access to post-partum LARC such as IUDs or implants which most states still include in the bundled rate for pregnancy care. They noted that hospitals have little incentive to provide expensive LARC devices to Medicaid beneficiaries if the plan does not pay them for the devices separately. In response, plans noted that some states have changed their policy to reimburse for LARC services separately, outside of the global fee for pregnancy. In addition, plans expressed concerns that bundling pregnancy care into one payment does not enable them to see details in the encounter data, limiting their plans ability to customize care and education for their members based on the care they access.

Frequent eligibility changes and churn among members can create a disincentive for plans to provide LARC to their enrollees. State-specific changes in eligibility among Medicaid enrollees depend on the expansion status of the state. In non-expansion states, pregnant women typically lose eligibility 60 days post-delivery. Therefore, plans in these states reported little financial incentive to promote expensive methods of LARC to prevent unintended pregnancy when the new mother will likely lose her Medicaid eligibility and, thus, the plan will likely not receive the expected cost savings from their use. In addition, frequent churning between plans, even in states that have expanded Medicaid, was raised as a disincentive for plans to provide long-acting forms of contraception to members that may soon be enrolled in another MCO.

Some plans expressed concern about the issue of coercion in the promotion of LARC to Medicaid populations. Medicaid populations have a history of being subjected to coercive practices surrounding sterilization and certain methods of contraception. With many states’ heightened interest in the promotion of LARC due to its effectiveness in preventing unintended pregnancies, plans were concerned about the perceived or actual coercion of Medicaid beneficiaries to adopt LARC methods. They wanted to ensure that beneficiaries had access to these methods, but did not want their members to feel coerced into making the choice. While there is awareness of the potential of problems, most plans did not report this as a major issue that they have encountered.

Plans identified provider training as crucial to the education of members and their access to the full-range of contraceptive care; however, they did not report the implementation of any programs to train providers in their network. Some of the barriers reported by plans regarding access to LARC included the lack of provider knowledge about the appropriate use of IUDs, especially for post-partum women and among minors or women who have not had children. There was also a reported lack of providers trained in the insertion and removal of LARC methods. Nonetheless, no participating plan reported having implemented a program to train providers in this area nor any attempts to partner with academic institutions or clinician professional associations to ensure that physicians, nurse practitioners, and nurse midwives are receiving this training.

Plans did not report any specific policies to assure that in-network faith-based providers with religious objections to contraception do not limit access to family planning and reproductive health services for Medicaid enrollees. Many plans contract with religious providers that have objections to contraception—even though family planning is a mandatory benefit under Medicaid. Plan members may not be aware of the restrictions placed on their care before seeing one of these providers or that they are able to go out of network to the participating family planning provider of their choice to get contraceptive services. Plans did not report any policies to identify providers with religious or conscience objections that would make it possible proactively to provide referrals for care that might be denied to members. Plans also did not have a consistent method to inform members of their rights to seek care elsewhere if a service is denied by their provider.

Plans reported that they do not measure or evaluate the quality of family planning services. While plans do collect data on the standard state and federally required Healthcare Effectiveness Data and Information Set (HEDIS), Consumer Assessment of Healthcare Providers and Systems (CAHPS), and the National Quality Forum (NQF) endorsed measures, these systems have few quality measures focused on family planning care. Plans do not report collecting internal data on family planning services, nor do they measure if their providers are offering the full-range of contraceptive care. NQF has recently endorsed a new contraceptive measure, so this policy may change in the future as plans adopt the new measure.

Conclusion

Over the past two decades, managed care has transformed the way Medicaid beneficiaries receive essential health care services such as family planning and reproductive health care. States and managed care plans play a central role in shaping access to quality family planning and reproductive health services for millions of low-income women across the nation. The findings of this study highlight the unique challenges that Medicaid plans face in assuring their members have access, and reveals areas where plans can work to strengthen their networks and policies to improve care. The Trump Administration has signaled their willingness to put more decisions about Medicaid benefits, eligibility, and financing in the hands of state policymakers, and this will likely have implications for how plans provide family planning services to their members and the types of clinics they can contract with as part of their provider network. Looking forward, the state and federal programmatic decisions will undoubtedly shape Medicaid plan choices regarding the scope of services, the network of participating providers, and the policies that Medicaid plans will use to provide low-income women with access to high quality family planning services.

Introduction

Overview

The Medicaid program is jointly administered and financed by state governments and the Centers for Medicare and Medicaid Services (CMS), a federal agency within the U.S. Department of Health and Human Services (HHS). Established in 1965, it now provides health coverage to some 70 million low-income adults.3  The program has been especially instrumental for women who were more likely than men to qualify for Medicaid because of their greater likelihood of having low incomes as well as meeting the pre-Affordable Care Act (ACA) categorical eligibility requirements as a pregnant woman, parent of a dependent child, senior, or an individual with a disability. With the passage of the ACA, states were given the option to extend eligibility to low-income adults without dependents for the first time. In states that chose to expand the program, federal regulations require states to cover this new category of nonelderly, childless adults at or below at least 138% of the Federal Poverty Level (FPL). These newly eligible adults include an estimated 13 million women who gained access to primary care and reproductive health services in 2016.4  However, 19 states have not chosen to expand Medicaid.5 

Given that women of reproductive age account for 70% of adult women enrolled in Medicaid,6  the program’s history of strong protections for family planning and reproductive health services are of particular importance.7  Since 1972, the federal government has required Medicaid to cover family planning services as a mandatory benefit, matching state family planning expenditures at an enhanced Federal Medical Assistance Percentage (FMAP) of 90% in order to encourage states to expand access to these services.8  Medicaid enrollees may not be charged cost-sharing for family planning services and are given freedom of choice of provider when it comes to family planning. Medicaid is the largest public payer for family planning care, financing about 75% of all publicly funded family planning services and supplies,9  and remains a critical source of primary health care and family planning coverage for low-income women.

Family Planning in the Medicaid Managed Care Context

Over the past two decades, managed care has become the dominant mode of service delivery for Medicaid beneficiaries. In 2011, 77% of women insured by Medicaid were enrolled in managed care plans.10  In the 1990s, there was a surge in Medicaid beneficiaries enrolled in managed care organizations (MCOs), as states shifted from traditional fee-for-service models to mandated MCO enrollment in order to cut costs and improve quality through coordinated care. Through these arrangements, state Medicaid offices contract with MCOs, paying them a capitated rate by the state for each Medicaid beneficiary enrolled in their plan. The MCO then assembles a network of providers to deliver services to their members. A key provision of the Medicaid program’s family planning rules is that it allows enrollees the “freedom of choice” to select any participating provider for their family planning care. This rule also applies to those enrolled in a managed care arrangement, even if they are limited to the providers within the MCO network for other services. In other words, women on Medicaid may obtain family planning services out of network from the provider of their choice with full coverage by their managed care plan.

While the federal government issues broad guidelines governing managed care, the state Medicaid programs have extensive latitude to establish their own managed care regulations and negotiate contracts with MCOs. In addition, MCOs maintain flexibility in designing specific policies and reimbursement strategies that fall within federal and state regulations. The result is a patchwork of policies across MCOs surrounding the provision of family planning services for Medicaid beneficiaries. In April 2016, CMS issued a new rule which strengthened federal managed care regulations including requirements for network adequacy standards for family planning providers, information provided to beneficiaries about their freedom of choice, as well as limitations on the use of utilization controls that may restrict a beneficiary’s right to select the contraceptive method of their choice. Nonetheless, there is still considerable variation among policies affecting family planning services within the managed care system.

Regardless of the outcome of efforts to repeal or replace the ACA or cap Medicaid spending, managed care is likely to remain the dominant care arrangement for Medicaid beneficiaries across the nation. With three quarters of reproductive age women on Medicaid enrolled in managed care arrangements, the effective provision of these family planning services is an essential element of needed care for women and is critical to reduce unintended pregnancies among this population. This report provides insights from plan leaders on the current state of family planning services within Medicaid managed care arrangements and addresses a variety of topics related to the provision of family planning services to low-income women including billing and reimbursement, provider recruitment and network adequacy, scope of benefits, member education, provider training, quality measurement, and state policy constraints.

Methodology

This study serves as an environmental scan of Medicaid managed care and family planning services focusing on identifying gaps in knowledge, barriers to care, and current practices and policies in the coverage of family planning services offered by Medicaid managed care plans. The project was guided by a set of research questions about the provision of family planning benefits by MCOs to Medicaid populations:

  • How does Medicaid managed care provide women’s reproductive health benefits (e.g., family planning, contraception, prenatal and post-partum care)?
  • What are the barriers that MCOs observe when coordinating care, providing access, and ensuring coverage to such benefits for their members? Are these barriers related to state or federal policies, providers, religious institutions, or personal and/or socioeconomic characteristics (e.g., transportation, health literacy)?
  • What innovative programs are MCOs developing to overcome these barriers and improve care for women?
  • What resources, policies, or tools would help MCOs to enable their patients to overcome barriers to accessing reproductive health care?

This report relies on information collected through two methods: a national survey and focus groups of Medicaid MCOs. A National Technical Advisory Committee (NTAC) of six experts, including Chief Medical Officers, Executive Directors, and Presidents of major Medicaid managed care organizations throughout the country, was assembled in March 2016 to serve as expert consultants in the development of the survey tool and interview guide for the focus groups. The survey then collected data on a wide variety of topics including billing and reimbursement, provider recruitment and network adequacy, benefits, member education, provider training, quality measurement, and state policy constraints. Due to the release of CMS managed care regulations in April 2016, the survey did not include questions about policies, such as utilization controls, that were prohibited by the new rule. The plans were selected based on the geographic region and the number of lives covered. The survey was sent to 20 health plans in May 2016. Eight health plans responded to the questionnaire, including four multi-state plans.

Two in-person focus groups were conducted in September 2016. An interview guide was used to inquire about the same issues addressed in the survey. These focus groups consisted of seven additional plans that did not complete the survey, including six multi-state plans. In total, the report includes perspectives from 15 Medicaid managed care plans, representing more than 15.2 million beneficiaries. These groups were supplemented by follow-up discussions with three participants to clarify certain issues raised during the focus groups.

The survey tool is available upon request.

Report

Key Findings

State Policy Constraints and Open Enrollment

While MCOs maintain authority to determine many of the specific policies that govern their beneficiary populations, they must abide by state Medicaid policies, which they reported sometimes constrain their ability to provide comprehensive family planning care.

Eligibility is focused on pregnancy in non-expansion states. In some non-expansion states, women must rely on the state’s family planning waiver program, which provides access to family planning services for women living in low-income households who are not eligible for Medicaid. Otherwise, women are only covered during pregnancy, and do not qualify for family planning benefits outside of the six-week post-partum period. This was reported to limit a plan’s ability to provide members with the comprehensive family planning care they need.

Some state Medicaid programs have mandated the reimbursement methodology for LARC in the hospital setting. As discussed earlier, plans generally follow the state Medicaid reimbursement schedule. There is little incentive for plans to set their own policies to reimburse separately for a LARC device, if the state methodology includes it in the bundled payment for delivery. Plans reported that the state methodology prevents them from creating a separate payment above the regular negotiated delivery rate that would incentivize LARC insertion immediately post-partum. Again, this may largely be a result of barriers related to the claims system configuration. However, a few states have changed their policies to allow for separate payment of LARC post-partum.

Changes in Medicaid eligibility and churn of enrollees among MCOs present challenges to MCOs in managing their members’ care. One plan commented that once pregnant members give birth, they might be eligible for different types of Medicaid, and therefore might be moved from their plan. In addition, women in non-expansion states typically lose eligibility 60 days post-delivery. Plans reported that this instability in enrollment creates a disincentive for a plan to pay for LARC for a beneficiary that may soon not be a member of their plan. The cost savings that may incentivize a plan to promote post-partum LARC among their members is not fully realized if those members churn into another plan or are dropped from Medicaid shortly after their delivery and LARC placement.

Benefits

Despite its classification of family planning as a mandatory benefit, CMS has never formally defined what services and supplies must be included in that category. The Social Security Act authorizing Medicaid outlines the approved benefits as “family planning services and supplies furnished (directly or under arrangements with others) to individuals of child-bearing age (including minors who can be considered sexually active) who are eligible under the state plan and who desire such services and supplies.”11  Without explicit federal guidance in the definition of family planning services, state Medicaid offices are able to design their own benefit packages as well as vary them across eligibility pathways, potentially omitting important services such as counseling services. In addition, coverage for abortion services is limited due to the Hyde Amendment which prohibits federal funding for abortions except in cases of rape, incest, or life endangerment of the mother. Only 15 states use their own funds to expand the circumstances in which abortion would be covered. The state Medicaid programs in Arizona and Illinois do not pay for abortions outside of circumstances permitted by Hyde despite court orders directing them to do so.

The HHS recently clarified that all 18 FDA-approved methods of contraception must be covered as prescribed under the ACA’s no-cost preventive services, which affect Medicaid expansion populations (but not those who qualify through the traditional pre-ACA pathways). In addition, new guidelines released by CMS prohibited the use of certain utilization management techniques in the provision of family planning by MCOs.12  Quantity limits and prior authorization are not permissible if used for any other purpose other than to determine medical necessity or appropriateness, and step-therapy, or the practice of requiring the use of a particular type of contraception before moving to a more expensive version, is not allowed. However, in most states plans retain authority to determine the coverage of over-the-counter (OTC) contraception, as well as the number of cycles of contraception dispensed at one time, absent any state regulations.13 

Emergency Contraception and Dispensing Limits

Emergency contraception is intended to prevent unintended pregnancy after unprotected sex or contraceptive failure. There are three types of emergency contraception: progestin-based pills (e.g. Plan B®), ulipristal acetate (ella®), and copper IUDs. While ella® is available by prescription only, Plan B® and other generic progestin-based pills are available OTC without a prescription for women of all ages. The ACA requires that Medicaid expansion programs cover emergency contraceptives with a prescription. Therefore, while these programs must cover ella® for their expansion populations, they are only required to cover Plan B® with a prescription. Some states also limit the number of months of oral contraceptives dispensed at one time to a beneficiary.

Most plans reported covering all forms of emergency contraception, including Plan B®, ella®, and the copper IUD. Although ella® is required to be covered for expansion populations, some plans reported challenges with coverage of the drug. A consultant suggested this was most likely due to a problem with plan formularies.

Most of the plans surveyed cover one or three months of oral contraceptives at one time. Although managed care plans have the leeway to cover more cycles of oral contraceptives than the state does under fee-for-service, only one plan who participated in the survey reported covering a full 12-month supply.

Over-the-Counter Contraception

The ACA requires prescription contraceptive methods to be covered for Medicaid expansion populations, but this requirement does not apply to OTC methods, such as condoms, spermicide, and sponges, obtained without a prescription. As a result, some states require a prescription for coverage of OTC methods, most likely due to the reimbursement mechanism to pharmacies in place for prescription drugs. However, plans may determine their own requirements for OTC contraception.

Most plans reported covering Plan B® and male condoms over the counter. Some plans also covered spermicides, sponges, and female condoms. Plan representatives confirmed that a Medicaid enrollee could potentially pay out of pocket for these items, if they did not pay at the pharmacy counter. However, one plan stated that the amount their plan spends on the OTC benefit suggests that members are aware of and utilizing this benefit by obtaining OTC contraceptives through the pharmacy.

Almost all plans reported requiring a prescription for OTC contraception, though strategies vary. Some reported exceptions for Plan B®, or that they allow a pharmacist to produce the prescription. This is the only way for health plans to track utilization and pay for claims directly. Plans may cover it either as an OTC benefit or as a pharmacy benefit. However, one plan noted that a member would have to read the member benefits manual closely in order to know what is required for a drug or product to be covered, suggesting that members may not be aware this is an option for them.

Billing and Reimbursement

In a managed care arrangement, the state Medicaid program and the health plan enter into a contract in which the state pays the plan a negotiated capitated rate, a fixed fee per individual enrolled in the plan, in order to provide comprehensive coordinated health care services to its Medicaid beneficiaries. CMS regulations require “actuarially sound capitation rates” that must cover all “reasonable, appropriate, and attainable costs of providing services under the contract.”14 

The plan then pays its contracted providers for the services used by their members. Services can be reimbursed using various methodologies, such as a bundled payment or separate payments for each service. They might also be included in a capitated rate paid to a beneficiary’s primary care provider. Bundled payments are a single fixed fee paid for a set of related services. For example, pregnancy-related services are often paid for in a bundle, referred to in this case as a global fee. This means a provider will receive a fixed negotiated amount to provide routine care throughout the entire pregnancy, regardless of the number of visits or services the patient utilizes. The purpose of a bundled payment is to incentivize providers to reduce costs associated with unnecessary care, while also easing the administrative burden of billing for each individual service. Alternatively, a plan could pay a provider for each service separately after it is rendered to the plan member. While rates are set by the state, a health plan can pay more to providers in order to recruit them into their network, especially if there are a limited number of providers in their area.

State and plan reimbursement methodologies are crucial to the effective provision of the full-range of family planning services and supplies for women insured by Medicaid. Providers may be less inclined to contract with health plans or provide certain services or supplies to Medicaid beneficiaries if their actual costs are higher than the reimbursable amount. Lower provider payments may compromise a member’s right to see the family planning provider or use the method of contraception of their choice. In particular, out-of-network family planning providers may not be willing to see Medicaid patients because the administrative burden of billing the plan may not be worth the low rates of reimbursement.

Payment Methodology

All plans reported that family planning services are paid for individually, rather than as a separate family planning bundle. While family planning is a required benefit, MCOs may choose how they pay for these services as long as they are in accordance with state regulations. All plans in the study reported that these services are paid for as separate line items outside of the capitated fee paid to a primary care provider for each enrollee. For example, providers are paid a separate fee for LARC device insertion or removal, in addition to the cost of the device itself. They do not have a separate family planning bundled rate for these services.

Pregnancy is paid for using a single global fee, which can limit access to post-partum LARC and tubal ligation. Plans reported that many providers prefer this method of payment because they are paid the same amount regardless of the number of times they see the patient, and they do not have the administrative burden of billing for each encounter. However, plans noted certain problems in the payment and provision of post-partum LARC. Hospitals often will not be reimbursed separately for LARC insertions post-delivery despite the use of their facilities. This creates an incentive for the provider to wait until the six-week post-partum visit to charge a separate reimbursement. This practice may pose a barrier for women who miss their follow-up appointment, and therefore do not receive their desired LARC method and then subsequently lose their Medicaid eligibility 60 days’ post-partum.

Tubal ligation is also reimbursed as a separate payment outside of the global fee because Medicaid beneficiaries are required to sign an informed consent form at least 30 days prior to undergoing sterilization. Therefore, the procedure is essentially treated as a prior authorization, and paid for separately. Plans reported that billing for all pregnancy-related care as a single fee also prevents information about provider-patient encounters from being communicated to the plan in many cases until after the woman delivers, inhibiting their ability to customize and improve the coordination of their members’ care. For example, a plan would not be aware if their enrollees are underutilizing their prenatal care benefits. One plan expressed that if they were able to see this information, they could provide their members with additional education about post-partum contraception and when to see their provider.

Challenges with LARC

In general, plans follow the state Medicaid fee schedule and reimbursement methodology for post-partum LARC. Plans may set their own policy in regards to payment for post-partum LARC, however, there is little incentive for plans to facilitate access to LARCs for their enrollees. Plans reported that because many women on Medicaid lose eligibility after delivery, the cost savings to the plan is essentially lost if a patient provided with post-partum LARC is likely to be dropped from the plan. Only two plans surveyed provided a supplemental payment for immediate post-partum LARC (device and insertion) in hospitals, and only one of those plans did so in other provider settings as well. Many of the plans stressed that the unbundling of services during pregnancy would facilitate access to LARC during hospitalization post-delivery.

Innovative Practice 1: Post-Partum LARC Pilot Program

In partnership with the state Medicaid program, one plan is currently working with a local hospital to test a new reimbursement methodology to pay separately for immediate post-partum LARC. The initiative seeks to identify and fix problems that may arise before expanding to the rest of the state. The plan noted that the primary barrier to implementing this policy change has been the configuration of claims system, which has not yet been set up to facilitate billing and reimbursement between the hospital and the plan for the separate payment of immediate post-partum LARC. In order for physicians to provide LARC devices immediately post-delivery, both the hospital and the plan must create and align the reimbursement codes for that service.

Plans cited reimbursement for LARC devices, especially for immediate post-partum insertion, as a top challenge in providing family planning services to women on Medicaid. The health plans reported variation across state markets in the reimbursement for in-patient post-partum LARC. In states without a mandate to pay separately, hospitals have no incentive to provide post-partum LARC because the bundled reimbursement they receive from the plan for the delivery is not enough to cover the cost of the device. Currently, 21 states mandate separate payment for post-partum LARC above the regular negotiated rate for delivery. Some of these states use a modifier code to increase the bundled payment for delivery to pay for post-partum LARC devices and insertions. The majority of the states retain the bundled payment for delivery, and instead apply the fee-for-service rate for LARC in an office setting to inpatient hospital settings, paying separately for either the device only, or both the device and insertion.15 

The administrative and financial burden of maintaining a stock of IUD devices can be too great for many providers. Although most plans reported that they allow women to get same-day LARC insertion, they cited significant barriers due to the difficulty and expense of stocking LARC devices. Difficulty stocking LARC may limit a woman’s ability to obtain an IUD the same day she requests it, requiring two appointments. For many women insured by Medicaid, it may be difficult to return for a second appointment, reducing the likelihood they will obtain their preferred method of contraception. Only one plan reported allowing providers to bill for the stocking of LARC.

Innovative Practice 2: Care Cart

One health plan has developed an innovative strategy to help providers stock LARC devices. In this model, the health plan pays the upfront costs to stock a “Care Cart,” similar to a Pyxis® system, on site with LARC devices and insertion tools for a low administrative fee paid by the provider, primarily community health centers and school-based clinics with on-site pharmacies. The pharmacy then bills the plan for the restocking of LARC devices as needed. The Care Cart model allows providers to keep LARC on-hand to facilitate same-day insertions which improves adherence and access to this effective method of contraception.

Plans recognized the challenges around incentivizing the use of LARC due to concerns about the appearance of coercion, or encouraging the selection of LARC to avoid pregnancy when it may not align with the preference of the members. However, most plans did not report this as a major problem that their plan has encountered. One plan indicated that they requested guidance from CMS about how to handle the balance between encouraging access and educating members, and coercion.

Network Adequacy and Provider Recruitment

The Medicaid program requires states to establish network adequacy standards for beneficiaries enrolled in managed care plans. These standards include factors such as the number and type of providers, time and distance to travel to see a provider, wait-times for appointments, geographic distribution of providers between rural and urban areas, provider to enrollee ratios, and a provider’s willingness to accept new patients. States have broad latitude to develop more specific network adequacy regulations, although they give MCOs significant leeway to create their own policies governing the recruitment and development of their network.

Network adequacy in the context of family planning providers is complicated by beneficiaries’ right to seek care from out-of-network Medicaid participating providers for these services. CMS addressed this issue in their recent guidelines. Although family planning providers are exempted from the CMS time and distance standards, CMS stated that the freedom of choice provision, while important, does not negate the “plan’s responsibility to ensure timely access within network.”16  CMS maintained that having sufficient family planning providers available within network would “facilitates claims payments, helps enrollees locate providers more easily and improves care coordination.”17 

In their new rule, CMS also noted the ability of MCOs to use telemedicine or e-visits to meet network adequacy requirements.18  However, they provide no federal guidance other than encouraging states to create reimbursement methodologies to pay for services provided using telemedicine.19  The state has the flexibility to determine the conditions under which they will cover telemedicine, if at all, including type of service, provider, and location of care, as well as reimbursement rates. They can also decide the level of control the individual managed care plan retains in setting these policies. MCOs may contract with religiously-affiliated providers with a conscience objection to family planning, an additional consideration in the establishment of adequate networks for family planning services. States may also contract with religiously-affiliated MCOs; however, this study did not include any MCOs of this type.

Recruitment

Plans considered a variety of factors when recruiting family planning providers for their networks. Surveyed plans reported the factors that weigh most heavily in their decisions are the average distance to see a provider, provider type, geographic distribution, and a provider’s willingness to accept new patients. Plans participating in the focus groups reported that they do not focus narrowly on family planning providers when meeting access standards, but instead broadly recruit providers that offer a comprehensive range of services, including sexual and reproductive health care.

Plans contract with a majority of FQHCs in their area. They cited them as being particularly important because they are the providers their members are most likely to go to, and they provide a broad range of services, including family planning. Inclusion of other provider types such as school-based clinics, Planned Parenthood®, and state and local health departments varied by plan. No plans in the study reported problems developing an adequate network.

Some plans contract with specific providers that offer abortion services in non-Hyde states. Only 15 states use their own funds to pay for abortions outside of the Hyde exceptions of rape, incest, and life endangerment of the woman. However, even in those states, access to abortion counseling and services is often constrained by many state abortion restrictions and regulations. In addition, the controversial nature of the issue of abortion has complicated contracting with Planned Parenthood® in certain states. For example, in Texas and Missouri, plans reported that Planned Parenthood® is no longer an approved Medicaid provider, and therefore cannot reimburse their providers with Medicaid funds. Two plans surveyed do not contract with Planned Parenthood®, though this may also be due to the lack of clinics in their area.

Plans do not report using telehealth for family planning services. Some focus group participants noted that contraceptive counseling may make sense in the telehealth context, but there was a perception that telehealth had “limited applicability” for family planning services. Plans maintained that in order to provide comprehensive reproductive health care providers need to see the patient in the office.

Plans noted some challenges to the implementation of the freedom of choice provision. In particular, there is administrative burden in the reimbursement of out-of-network providers. However, other plans noted that because of robust network adequacy requirements, there are few instances where a plan member would go out of network for services. Although in-network and out-of-network providers are paid the same state Medicaid rates, providers have an incentive to join the network to become eligible for rapid electronic payments and to establish a regular patient base. A member who receives services from an out-of-network provider is often a new enrollee who wishes to keep their current provider. In these continuity of care cases, the out-of-network provider will bill the plan, which must pay the provider at the rate they were receiving from the previous payer. Therefore, the rate paid to an out-of-network provider is member-specific, and in many instances, may be higher than the Medicaid rate if the new member was previously enrolled in a private commercial plan before losing coverage.

Religious Providers

There are a growing number of religiously-affiliated hospitals in the United States. This growth has raised concerns that the rise in the number of religiously-affiliated hospitals can limit patient access to reproductive health care due to the religious restrictions that govern the services they provide.20  Some states, such as Texas, require plans to contract with religious providers who may have objections to family planning including contraception and abortion so that enrollees may choose to get their care at religious providers if they wish. However, Texas also includes provisions to ensure that the provider network is adequate for women who do not use those providers.

Religious providers may present a barrier to family planning care. In general, plans reported that they include Catholic hospitals and religiously-affiliated private provider offices in their networks. Catholic hospitals, in particular, were noted as presenting a barrier to family planning care for enrollees, especially for those hospitals located in rural areas or that do not have an unaffiliated clinic that provides these services. Plans reported that even in institutions located in urban areas that have implemented a work-around strategy to provide family planning care through another clinic, same-day access may be compromised. For example, a consultant cited the case of a religiously-affiliated academic medical institution on the East Coast that contracts with an FQHC to provide contraception in their university health center, but noted that the FQHC staff is only available on campus certain days of the week.

Plans reported that they do not have systems in place to notify enrollees of limits to care if they select a provider with “conscience” objections to family planning. Plans noted that the only way they would know if a member could not access a specific service, such as contraception, sterilization, or abortion, is if the member calls the plan’s member services or care coordinator/case manager to receive help finding access to those services elsewhere. This can act as a barrier to care for a member who may not know their provider is religious, and therefore is not counseling them on the full-range of family planning services. They may also not be informed about how to navigate the system in order to find a provider that will offer them the specific contraceptive services they desire.

Communication and Education

The Medicaid program’s significant protections for beneficiaries’ access to family planning services are only useful to the extent that enrollees are aware of them. Federal regulations require MCOs to inform their members of their right to go out of network for family planning services. CMS recently updated this rule, clarifying that enrollees must be informed that requiring a referral to see a family planning provider is not permitted.21  In addition, CMS requires plans to post certain information on their public website including the member handbook, provider directory, and drug formulary, as well as provide the information in paper form in prevalent languages upon request. The rule also clarifies that plans may notify members of required information by email with enrollee consent or by “any other method that can reasonably be expected to result in the enrollee receiving” it, though both email and texting are prohibited from being used for cold-call marketing.22  Beginning in July 2018, the new rule requires that plans implement a Beneficiary Support System (BSS) to assist enrollees in understanding their options within the managed care system such as enrollment and provider decisions. The BSS must be available via phone, internet, in-person, and auxiliary aids.23 

Member Communication and Education

Plans reported that they rely heavily on providers to educate their members and communicate their health care options and rights to them. The plans also rely on care coordinators, member services, mailed paper notices, their website, and the member handbook for communication about the scope of reproductive health benefits and members’ rights. One plan reported conducting in-person, on-site member health promotion workshops in community settings. However, contact information may be hard to obtain or may be incorrect. In particular, plans reported that they found that addresses for individuals in the Medicaid population often change frequently within short periods of time.

Plans reported having face-to-face care coordination visits during pregnancy. Pregnancy is a primary point of contact between plans and their members, especially for plans in states that have not expanded Medicaid. However, although one plan emphasized the particular strength of MCOs in coordinating care for their members, this type of episodic coverage limits their ability to address a member’s general health or chronic conditions during the prenatal period alone.

Provider Education

In addition to effective communication strategies between plans and their members, the provision of family planning services requires trained providers skilled in addressing sensitive topics and educated in evidence-based family planning practices. While there are no federal regulations requiring MCOs to educate providers within their networks, the plans participating in this study acknowledged their important role with members but did not typically have formal programs in place to train in-network providers to educate members about family planning options.

Plans cited provider training and education in the provision of LARC as a top challenge in providing access to family planning services. One plan representative stressed that there is a lot of misinformation about LARC provision both for immediately post-partum and for young women and teens who have never given birth. Despite their reliance on providers as a key point of contact between the plan and the member, most plans report that they do not provide training for clinicians regarding enrollee education about post-partum contraception or sterilization. While some plans reported offering educational materials to providers to educate Medicaid enrollees about post-partum contraception or sterilization, the majority surveyed do not. One plan stated that many of their members are unaware of the need for a signed consent form and 30-day waiting period for sterilization.

Some plans and state Medicaid offices have implemented policies to educate providers on MCO plan policies. One plan sends email blasts to update providers on new plan policies. The New York state Medicaid office provides webinar and in-person seminars to train new Medicaid providers about billing practices, including those specific to managed care organizations, as well as instruct established providers about how to use the electronic claims system.24 

Teen Outreach and Confidentiality

Although teen pregnancy and abortion rates are at all-time lows, they still remain an area of concern. Educating adolescents and minors about their rights to access family planning services, and communicating with them about their benefits requires targeted outreach strategies and confidentiality protections. Twenty-one states and the District of Columbia allow all minors to consent to contraceptive services, and 25 states allow minors who meet certain criteria to consent.25  However, there are no federal regulations governing the confidentiality of these services or the promotion of effective outreach to young adult and teen populations.

Some plans reported strategies to target outreach to minors, but most did not have any overarching approach to target teens or specific policies to protect their confidentiality. Half of the surveyed plans reported using provider education as a strategy to protect enrollee confidentiality, and three out of the eight plans reported using this strategy specifically for assuring confidentiality for adolescents and other dependents. However, one plan reported that a top challenge they encounter in providing access to women’s reproductive health and family planning services is providers’ lack of commitment to addressing sexuality with minors, as well as difficulty coordinating with school-based clinics to gain access to medical records. Plans noted that quality care coordination is easier during pregnancy, however, healthy teens and young adults often do not come to the attention of care management. One plan recognized the need to perform outreach to contact that population of members, though they noted cultural and political barriers in some states hinder the implementation of innovative outreach strategies. Another plan stated that state regulations governing how they can communicate with their members, such as opt-in requirements for texting, restrict their ability to do outreach effectively. Still, one plan reported sending annual targeted mailings to adolescents on a variety of sexual health topics and confidentiality requirements.

Quality Measures and Data

The Healthcare Effectiveness Data and Information Set (HEDIS) is a set of performance measures used widely by health plans to evaluate the quality of the care they provide. Health plans are also required to report Consumer Assessment of Healthcare Providers and Systems (CAHPS) data, a series of patient surveys evaluating the quality of their health care experiences. However, few quality standards exist for family planning services, and most states do not collect data to evaluate utilization and quality. The National Quality Forum (NQF) recently endorsed new measures to enhance the service value and quality in family planning specifically in regard to post-partum contraceptive care, access to LARC, and the use of most and moderately effective methods.26 

Overall, plans are not evaluating the performance of family planning services for the purposes of quality reporting. In general, plans do not collect performance measures for family planning services beyond the HEDIS and NQF measures, nor do they analyze the data they do collect. Only one plan reported measuring contraceptive rates, and another plan looks at performance measures for various aspects of pregnancy care including prenatal care, post-partum follow-up, and C-section rates. The lack of quality measurement for family planning services has implications for the provision of high-quality, patient-centered care. However, it was also noted that performance measures incentivize providers, which can be challenging especially when dealing with LARC due to the appearance of coercion.

Plans reported that they do not measure if providers are offering the full-range of contraceptive methods. Most plans participating in the focus groups reported that they are not conducting any analysis in this area. Only one plan mentioned a new initiative led by the New York City Department of Health that is analyzing plan data to determine preferred methods of birth control. Another plan discussed the benefits of creating a reimbursement code for contraceptive counseling and education in order to incentivize and track its use. However, the plan conceded it would be difficult to get providers to use the code and to validate the data provided to the health plan.

State implemented bundled payments for maternity care and pregnancy limits much of the information that is available through encounter data. Since providers are paid for the entire episode of care in one single payment, they are not required to file claims or encounters for every visit. Therefore, a health plan may not be aware of services being provided to a member until after a claim is made by the provider. In many instances, this may not be until the post-partum period. One plan noted that this had an impact on their “ability to communicate effectively with members and incentivize them to go to their individual visits.” If members are underutilizing care, the plan’s ability to educate that member about prenatal and post-partum care is limited.

Conclusion

Managed care organizations that coordinate members’ health care to improve the quality of services provided and reduce unnecessary costs have become the primary care arrangement for women on Medicaid. Family planning has long been a mandated benefit under Medicaid and holds important protections such as freedom of choice of provider, an enhanced federal match, and a ban on cost sharing. However, the variability among state Medicaid policies at both the state and plan level leaves room for inconsistent coverage and access to family planning services and providers for MCO members seeking contraceptive care.

Health plans expressed that MCOs are adept at care coordination, including face-to-face visits, targeted education, and the regular review of claims to address reimbursement problems. These plans also identified several areas where there are barriers in how family planning services are billed and reimbursed, particularly post-partum LARC, as well as the way they are measured for purposes of quality reporting. In addition, the frequency of churn for low-income women presents a financial disincentive for plans to provide comprehensive, long-term contraceptive care. Religious institutions and providers may also serve as an obstacle in the path of women seeking family planning services. Plan members may not be aware of the religious restrictions their health care providers place on their family planning care, and it is left to enrollees to seek help from their plan to find those services elsewhere.

Health plans also identified policies they believed would help to overcome the barriers to quality family planning services and supplies in the Medicaid managed care system. They emphasized the need for state Medicaid programs to unbundle payments for pregnancy care, and in particular, to reimburse post-partum LARC devices and insertions separately in order to more effectively promote their use post-partum. Innovative policies to aid providers in the stocking of IUDs and implants are also essential to the timely provision of the full-range of contraceptive care. Furthermore, this study has highlighted the lack of data collected on the provision of family planning services to Medicaid populations in order to measure and evaluate quality and access in the managed care setting, in most cases because of the lack of valid and reliable measures. This may change with the new family planning quality measures recently endorsed by the National Quality Forum.

This survey sought to understand better how Medicaid MCOs are providing family planning services to their members. We sought to understand the challenges that plans have identified as well as uncover innovative strategies used to address them. As federal and state policymakers explore opportunities to restructure the Medicaid program, consider changes to benefits and eligibility, and potentially reduce the pool of available family planning providers such as Planned Parenthood®, Medicaid MCOs will likely have a growing role and greater responsibility to assure that their members have access to the full range of high quality family planning services.

Endnotes

  1. Foster DG, Hulett D, Bradsberry M, Darney P, Policar M. Number of Oral Contraceptive Pill Packages Dispensed and Subsequent Unintended Pregnancies. Obstetrics and Gynecology. 2011;117(3):566-572. ↩︎
  2. Foster DG, Parvataneni R, Thiel de Bocanegra H, Lewis C, Bradsberry M, Darney P. Number of Oral Contraceptive Pill Packages Dispensed, Method Continuation, and Costs. Obstetrics and Gynecology. 2006b;108(5):1107-1114. ↩︎
  3. Paradise J, Lyons B, Rowland D. (2015). Medicaid at 50. Kaiser Family Foundation. ↩︎
  4. National Women’s Law Center (NWLC). (2013). Women and the Health Care Law in the United States. ↩︎
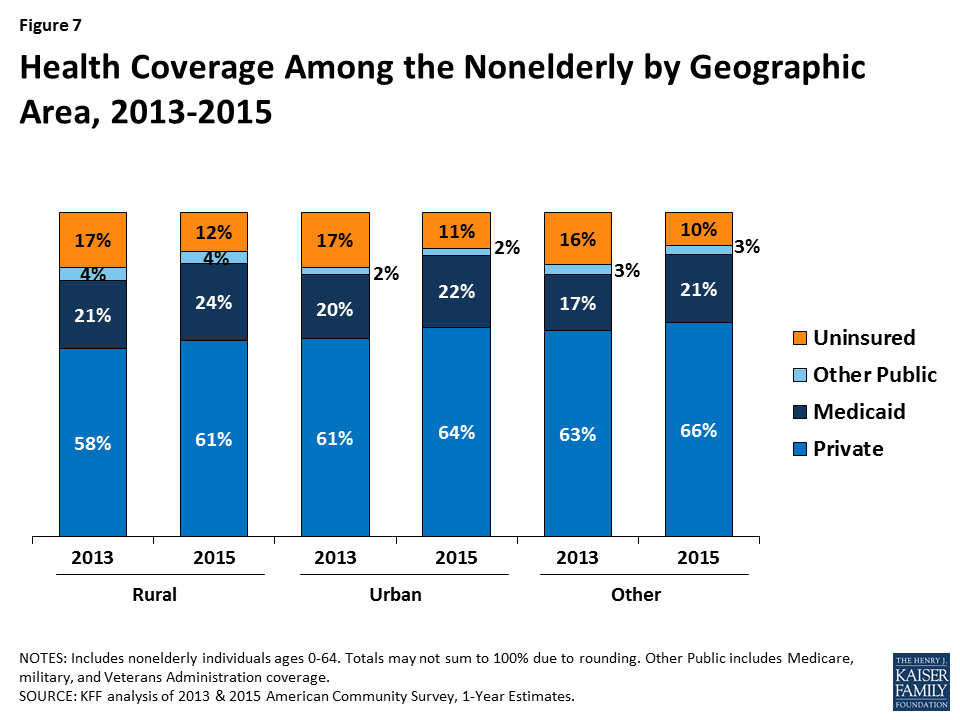
  5. Kaiser Family Foundation. (2017). State Health Facts. Status of State Action on Medicaid Expansion Decision. ↩︎
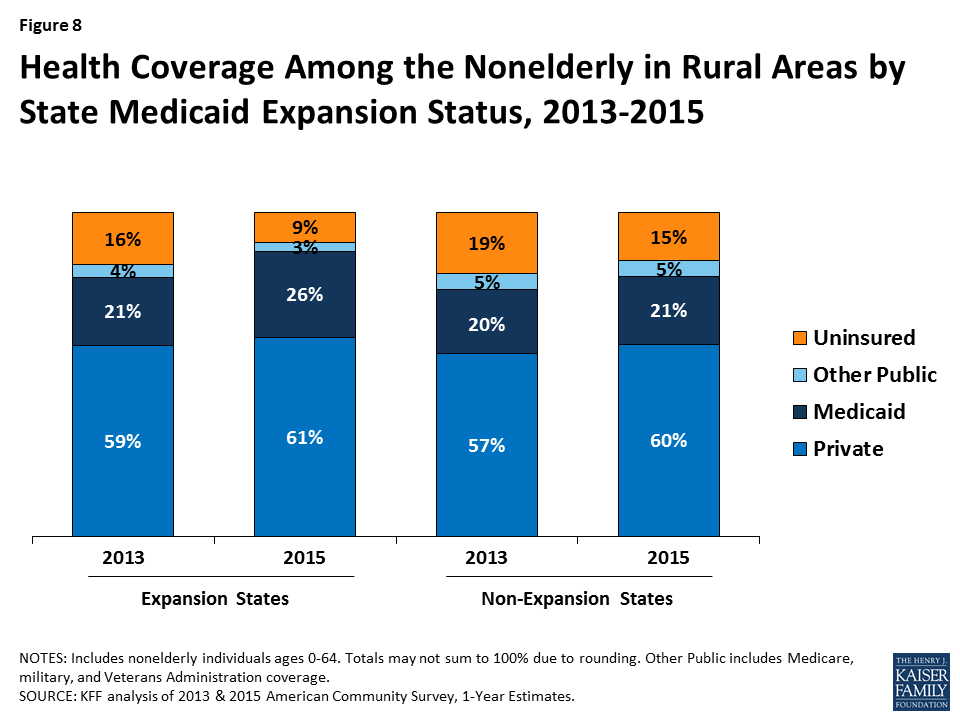
  6. Ranji U, Bair Y, Salganicoff A. (2016). Medicaid and Family Planning: Background and Implications of the ACA. Kaiser Family Foundation. ↩︎
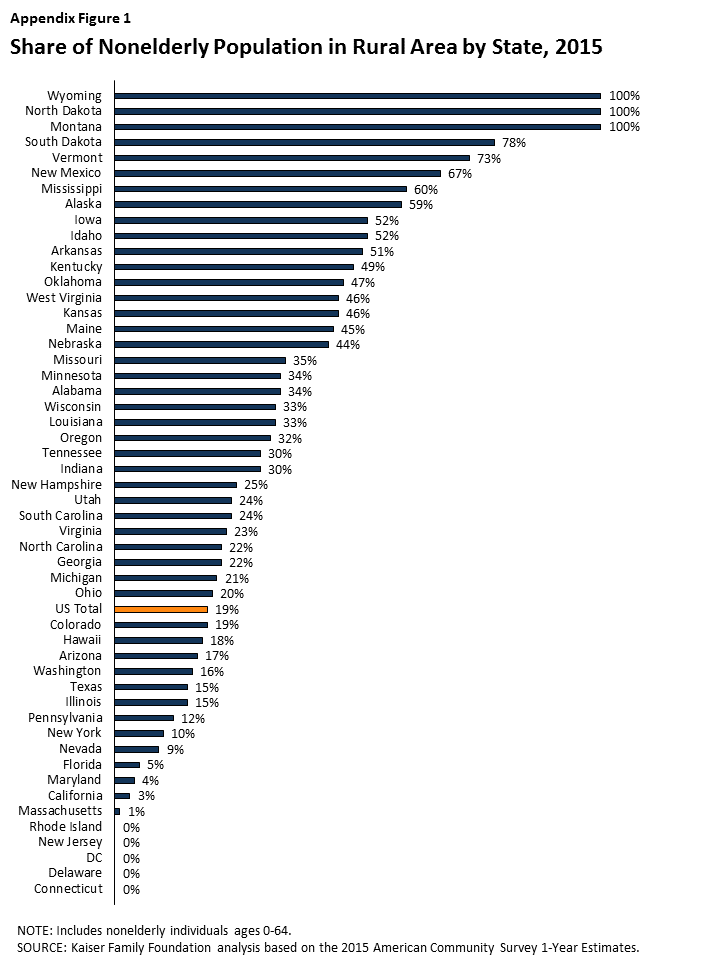
  7. Kaiser Family Foundation. (2012). Medicaid’s role for women across the lifespan: current issues and the impact of the Affordable Care Act. ↩︎
  8. The average Federal Medical Assistance Percentage (FMAP) is about 57%. ↩︎
  9. Guttmacher Institute. (2016). Publicly Funded Family Planning Services in the United States. ↩︎
  10. Ranji U, Bair Y, Salganicoff A. (2016). Medicaid and Family Planning: Background and Implications of the ACA. Kaiser Family Foundation. ↩︎
  11. Section 1905(a)(4)(C) of the Social Security Act. ↩︎
  12. Center for Medicare and Medicaid Services (CMS). (2016). Medicaid and Children’s Health Insurance Program (CHIP) Programs; Medicaid Managed Care, CHIP Delivered in Managed Care, and Revisions Related to Third Party Liability. ↩︎
  13. At this time, only one state, California, offers OTC birth control pills with a pharmacist’s prescription as an option; all other states and DC offer OTC emergency contraception such as Plan B®. ↩︎
  14. Center for Medicare and Medicaid Services (CMS). (2016). Medicaid and Children’s Health Insurance Program (CHIP) Programs; Medicaid Managed Care, CHIP Delivered in Managed Care, and Revisions Related to Third Party Liability. ↩︎
  15. Walls J, Gifford K, Ranji U, Salganicoff A, Gomez I. (2016). Medicaid Coverage of Family Planning Benefits: Results from a State Survey. Kaiser Family Foundation. ↩︎
  16. Center for Medicare and Medicaid Services (CMS). (2016). Medicaid and Children’s Health Insurance Program (CHIP) Programs; Medicaid Managed Care, CHIP Delivered in Managed Care, and Revisions Related to Third Party Liability. ↩︎
  17. Ibid. ↩︎
  18. Ibid. ↩︎
  19. Centers for Medicare and Medicaid Services (CMS). Telemedicine. ↩︎
  20. American Civil Liberties Union (ACLU) and MergerWatch. (2013). Miscarriage of Medicine: The Growth of Catholic Hospitals and the Threat to Reproductive Health Care. ↩︎
  21. Center for Medicare and Medicaid Services (CMS). (2016). Medicaid and Children’s Health Insurance Program (CHIP) Programs; Medicaid Managed Care, CHIP Delivered in Managed Care, and Revisions Related to Third Party Liability. ↩︎
  22. Ibid. ↩︎
  23. Ibid. ↩︎
  24. New York State Department of Health. Provider Training. ↩︎
  25. Guttmacher Institute. (2017). Minors’ Access to Contraceptive Services. ↩︎
  26. National Quality Forum (NQF). (2016). Perinatal and Reproductive Health 2015-2016 Final Report. ↩︎
News Release

Kaiser/Economist Survey Highlights Americans’ Views and Experiences with End-of-Life Care, With Comparisons to Residents of Italy, Japan and Brazil

Published: Apr 27, 2017

Half of Americans — including nearly six in ten of those in fair or poor health – say people in the U.S. have too little control over their end-of-life medical decisions, finds a new Kaiser Family Foundation/Economist survey examining views and experiences with end-of-life care in the U.S. and three other nations.

The cross-country survey and related journalism in The Economist’s April 29 issue highlight Americans’ experiences and opinions about aging and end-of-life care and how this compares with the views and experiences of residents of Italy, Japan and Brazil. A separate report focuses on the views and experiences of people in the United States.

While most residents of Italy, Japan and Brazil say that the government bears primary responsibility for caring for people’s health and long-term care needs as they age, Americans are more evenly divided with almost equal shares saying government (42%) and individuals and families (44%) should be most responsible.

Most Americans (62%) say the U.S. government is “not too prepared” or “not at all prepared” to deal with the aging population, while a third (35%) say it is “very” or “somewhat” prepared. Americans are more split on whether the health care system and families in the U.S. are prepared to deal with the aging population, with about half saying each is prepared and the other half saying they are not.

About a quarter (27%) of Americans, including half (51%) of adults age 65 and over, say they have written down their wishes for end-of-life care; these shares are much higher than the shares reporting taking such steps in the other three countries. Among those who haven’t, the most common reason for not doing so is that they haven’t gotten around to it.

When asked to think about their own death, most Americans (54%) say it is “extremely important” to make sure their family is not burdened financially by their care.  Large shares also cite other factors as “extremely important,” including having loved ones around them (48%), being at peace spiritually (46%) and being comfortable and without pain (42%).

Fewer (23%) say living as long as possible is “extremely important,” though the share who do is higher among Blacks (45%) and Hispanics (28%) than among Whites (18%). Blacks and Hispanics are also more likely than whites to say the health care system in the U.S. places too little emphasis on preventing death and extending life as long as possible.

Other findings include:

  • Just over half of Americans (56%) say that they’ve had a serious conversation with a spouse, parent, child or other loved one about their own wishes for end-of-life care at some point, higher than the shares in Italy (48%), Japan (31%), and Brazil (34%). Fewer say that they’ve talked to a doctor either about their own wishes (11%) or those of a family member (32%).
  • Given the choice, most Americans (71%) say that they would prefer to die at home than in a hospital, hospice or nursing home, but a smaller share (41%) expect to do so. Italians, Brazilians and the Japanese also face similar gaps between their wishes and expectations.
  • Among people who were involved in making medical decisions for a loved one who died in the past five years, a large majority of Americans (89%) say they had a good idea what their loved one’s wishes were for end-of-life care. By contrast, in Italy, Japan, and Brazil, at least a third of those involved in making medical decisions reported that they didn’t really know what their loved one’s wishes were.

The four-country survey is part of a polling partnership between Kaiser and The Economist. Findings are featured in two Foundation reports, one on Americans’ views and experiences, and one that captures the results across all four countries.  The poll was designed and analyzed by survey researchers at Kaiser in collaboration with a team from The Economist. Each organization is solely responsible for the content it publishes based on the survey.

The poll was conducted by telephone from March through November 2016 among random digit dial telephone (landline and cell phone) samples of adults in the U.S. (1,006), Italy (1,000), Japan (1,000) and Brazil (1,233). The margin of sampling error for results from each country is plus or minus 4 percentage points. For results based on subgroups, the margin of sampling error may be higher.

Views and Experiences with End-of-Life Medical Care in the U.S.

Authors: Liz Hamel, Bryan Wu, and Mollyann Brodie
Published: Apr 27, 2017

Overview

In partnership with The Economist, the Kaiser Family Foundation conducted a cross-country survey of adults in the United States, Italy, Japan, and Brazil about people’s views and experiences related to aging and end-of-life medical care. These four countries are each at different stages of population aging, and have different cultural and institutional considerations when it comes to preparing and providing care for those near the end of life.

This report gives an overview of the survey results for the U.S. A summary report comparing themes across the four countries and highlighting specific findings in Japan, Italy, and Brazil is available here.

Coverage from The Economist

What people want in their final months

Mending Mortality

What people want at the end of life

Findings

Key Findings

Views on the Aging Population

In 2014, Americans ages 65 and older made up 15 percent of the total U.S. population; by 2060, that share is projected to grow to 24 percent.1  A majority of Americans (57 percent) believe the growing number of older people in the U.S. is a problem for the country, including a third (36 percent) who see it as a major problem. Older Americans themselves are more likely to see the aging of the population as a problem; six in ten (62 percent) of those ages 65 and over see it as a problem, including half (48 percent) who believe it is a major problem.

Figure 1: U.S. Public Perceives Aging of the Population as a Problem

A majority (62 percent) of U.S. adults say the government is “not too prepared” or “not at all prepared” to deal with the aging population, while a third (35 percent) say it is “very” or “somewhat” prepared. Americans are more split on whether the health care system and families in the U.S. are prepared to deal with the aging population, with about half saying each is prepared and the other half saying they are not.

Figure 2: Views Split on Preparedness for Dealing with Aging Population

When asked who should bear the greatest responsibility for paying for people’s health care and long-term care needs as they age, Americans are fairly evenly divided between those who believe individuals and families should bear the biggest burden (44 percent) and those who place this responsibility on the government (42 percent). This stands in sharp contrast to other countries surveyed (Italy, Japan, and Brazil), where majorities place the responsibility squarely on the government. Reflecting usual partisan preferences and demographic differences within the U.S., Democrats and African Americans are more likely to believe the government should have the main responsibility to pay for care for the aging population’s health, while Republicans and whites are more likely to see it as a responsibility for individuals and families.

Figure 3: Perception of Responsibility for Financing Aging Population’s Health Needs Varies by Party and Race/Ethnicity

Outside of the financial responsibility, families are seen as having a major role to play in helping older adults. Three-quarters of Americans say it is the duty of children to help take care of their parents’ needs as they get older. Older adults themselves are somewhat less likely to feel this way compared with younger Americans (58 percent of those ages 65 and over, compared with at least three-quarters in younger age groups).

Figure 4: Most Americans See Caring for Aging Parents as Children’s Duty, but Older Adults Less Likely to Feel This Way

Rating the Current System for End-of-Life Care

Americans do not give their health care system high marks in general, or when it comes to providing end-of-life care. About half (54 percent) give the U.S. health care system a rating of “fair” or “poor” overall, while a quarter (26 percent) rate it as “good” and 16 percent say it is “excellent” or “very good.” Responses are similar when the public is asked to rate the health care system specifically when it comes to providing end-of-life medical care (49 percent say it is fair or poor, and just 14 percent say it is excellent or very good).

Figure 5: About Half Rate Health Care System Fair or Poor in General and When It Comes to End-of-Life Medical Care

A large majority (87 percent) believe that patients and their families should have the greater say in which treatment options to pursue for patients who are seriously ill and nearing the end of life, while just 8 percent believe doctors should have the greater say. Americans also prefer honesty from their health care providers, no matter what the prognosis. Just 7 percent say that when a patient is seriously ill, it is more important for their doctors to emphasize hope, while the vast majority (88 percent) say it is more important for doctors to be completely honest even if there is little chance of recovery.

Figure 6: Public Wants Patients/Families to Have Biggest Say in Medical Decisions, and Doctors to be Honest About Prognosis

However, the public sees room for improvement when it comes to giving patients control over end-of-life medical decisions. About half (49 percent) believe most people in the U.S. have too little control over decisions about their own medical care at the end of life, while four in ten (38 percent) feel patients have about the right amount of control and just 4 percent say they have too much. Among those who say their own health is only fair or poor, an even higher share (63 percent) say most people in the U.S. have too little control.

Figure 7: About Half Believe Patients Have Too Little Control Over Medical Decisions; Higher Among Those in Poor Health

When asked which should be more important when it comes to health care at the end of people’s lives, seven in ten Americans (71 percent) choose “helping people die without pain, discomfort, and stress,” while one in five (19 percent) choose “preventing death and extending life as long as possible.” When asked to rate the U.S. health care system on each of these dimensions, about four in ten (37 percent each) say the current system places about the right amount of emphasis on each of these areas. However, four in ten (41 percent) say the system places too little emphasis on helping people die without pain, discomfort, and stress, and a third (33 percent) say it places too little emphasis on extending life. While very few (5 percent) say the system places too much emphasis on reducing pain and discomfort, roughly one in five (19 percent) say it places too much emphasis on extending life.

Figure 8: Public Prioritizes Relieving Pain and Stress over Prolonging Life

Hospice care is an option for many in the U.S. who are nearing the end of life and prefer a focus on relief of pain and suffering. Americans’ awareness of hospice care is fairly robust, and opinions of hospice care are overwhelmingly positive among those who have heard at least something about it. Seven in ten U.S. residents say they know at least a little about hospice care, including about a third (36 percent) who say they know “a lot.” About one in five (19 percent) say they’ve heard of hospice care but don’t know much about it, while one in nine say they had not heard the term before the survey. Among the 70 percent who say they know at least a little about hospice, a large majority (85 percent) say they have a positive opinion of hospice care, including almost half (47 percent) who say their opinion is very positive; just one in ten (9 percent) say they have a negative opinion of hospice care. One in five (20 percent) say that someone in their household has had an experience with hospice care in the past year, and among this group 87 percent say they have a positive opinion of hospice, including 58 percent who have a very positive opinion.

Figure 9: 7 in 10 Americans Have Heard At Least a Little About Hospice Care; Among Them, Opinions Are Overwhelmingly Positive

What People Want for Their Own Death

When asked what is most important in thinking about their own death, a variety of factors are rated as important by large shares of Americans. At the top of the list, just over half (54 percent) say that making sure their family is not burdened financially by their care is “extremely” important. About half also say making sure their wishes for medical care are followed (49 percent), having loved ones around them (48 percent), and being at peace spiritually (46 percent) are extremely important. Roughly four in ten say the same about making sure their family is not burdened by tough decisions about their care (44 percent) and being comfortable and without pain (42 percent). At the bottom of the list, a quarter (23 percent) say that living as long as possible is extremely important to them.

Figure 10: Most Important in Death: Not Burdening Family Financially; Least Important: Living as Long as Possible

While the ranking of these factors is mostly similar across age and other demographic groups, some differences in the shares saying each factor is important emerge. For example, while living as long as possible ranks below other considerations across racial and ethnic groups, blacks and Hispanics are more likely than whites to say this is “extremely important” to them (45 percent, 28 percent, and 18 percent, respectively). Perhaps relatedly, blacks and Hispanics are also more likely than whites to say the health care system in the U.S. places too little emphasis on preventing death and extending life as long as possible.

Figure 11: Black and Hispanic Americans More Likely than Whites to Emphasize Prolonging Life

Groups of Americans also differ in the amount of influence that religion and spirituality play in their own end-of-life wishes. Overall, half of U.S. adults say that their religious and spiritual beliefs play a major role in how they think about their own wishes for end-of-life medical treatment, while 22 percent say these beliefs play a minor role and 26 percent say they play no role. Older Americans, women, Blacks, and those who attend religious services at least weekly are more likely than their counterparts to say their religious and spiritual beliefs play a major role in how they think about these matters.

Figure 12: Half of Americans Say Religious or Spiritual Beliefs Play a Major Role in How They Think About End-of-Life Medical Wishes

As other research has shown, most Americans (71 percent) say that given the choice, they would prefer to die at home, with few saying they would choose a hospital (9 percent), hospice (7 percent), or nursing home (1 percent). However, people’s expectations often don’t line up with their preferences. About four in ten (41 percent) think they are most likely to die at home, while about a quarter (24 percent) expect to die in a hospital, 6 percent expect to die in a hospice, 4 percent expect to die in a nursing home, and 17 percent say they aren’t sure.

Figure 13: Seven in Ten Americans Would Prefer to Die at Home; Four in Ten Think They Are Likely to Die at Home

Conversations and Preparations

Like residents of each of the countries surveyed (Italy, Japan, and Brazil), a majority (69 percent) of Americans say that in U.S. society, death is a subject that is generally avoided. Perhaps reflecting cultural norms in different racial and ethnic communities, Hispanic Americans (37 percent) are more likely than Blacks (22 percent) or whites (23 percent) to say that death is a subject people generally feel free to talk about.

Figure 14: Most Americans Say Death Is a Subject People Generally Avoid

Despite this sense of cultural norms, over half (56 percent) of U.S. adults say they’ve had a serious conversation with a spouse, parent, child, or any other loved one about their own wishes for end-of-life medical care. The share who say they’ve had a serious conversation rises from 28 percent of adults under age 30 to 73 percent of those ages 65 and over. Those who are married (69 percent) are also much more likely than those who are not married (43 percent) to say they’ve had such a conversation. Interestingly, even though Hispanics are more likely than whites or Blacks to say that death is a subject that people generally feel free to talk about, Hispanics are less likely to say they’ve had a conversation with a loved one about their own wishes for end-of-life medical care. While Hispanics in the U.S. are younger on average than whites, this difference persists even after controlling for age and other demographic factors. Among people of all races/ethnicities, those who have not had this type of conversation with a loved one cite a variety of reasons, the most common being that they don’t think it’s necessary because they’re not sick yet (42 percent say this is a major reason).

Figure 15: Older and Married Americans Are More Likely to Report Having Conversations with Loved Ones About End-of-life Medical Care

Americans are substantially less likely to say they’ve discussed their wishes for end-of-life medical care with a doctor than to say they’ve done so with a loved one. Overall, just one in nine (11 percent) say they’ve ever had such a conversation with a doctor or other health care provider, including 22 percent of those ages 65 and over. About a third (32 percent) say they’ve participated in a discussion with a doctor or other health care provider about another family member’s wishes for their care at the end of life, a share that is somewhat higher among those ages 30 and over, and also higher among women than men (36 percent versus 27 percent).

Figure 16: 1 in 10 Report Discussing Their Own End-of-Life Care Wishes With a Health Care Provider

While few report having conversations with health care providers about their own wishes for end-of-life care, lack of comfort in discussing these issues with doctors does not seem to be a major barrier. The vast majority (92 percent) say they would be at least somewhat comfortable talking with a doctor or health care provider about their end-of-life medical wishes, including two-thirds (66 percent) who say they’d be very comfortable. This is similar to the share who say they’d be comfortable discussing end-of-life issues with their spouse or partner (94 percent), and higher than the share who would be comfortable having such discussions with their children (82 percent), their parents (81 percent), or a minister, priest, or other religious or spiritual advisor (75 percent). Further, there is broad support among the public for having Medicare cover discussions between doctors and patients about end-of-life treatment options (78 percent).

Figure 17: Large Shares Would Be Comfortable Talking About End-of-Life Wishes with Doctors

Discussions with health care providers about one’s wishes for end-of-life medical care are one part of what is often referred to as “advance care planning.”2  Another component of such planning is writing one’s wishes into a document, sometimes referred to as an “advance directive.” Overall, about a quarter (27 percent) of U.S. adults say they have their end-of-life wishes for medical treatment in a written document, ranging from just 8 percent of those under age 30 to about half (51 percent) of those ages 65 and over. Among the 72 percent who do not have their wishes written down, the most common reason is simply not having gotten around to it (49 percent), followed by never having considered it (27 percent). Few say they’re worried they might change their mind about what they want (5 percent) or that they don’t think it will be useful (4 percent).

Figure 18: One Quarter Report Having End-of-Life Wishes Written Down; Many Say They Haven’t Gotten Around to It

Besides the large difference by age, the survey also finds that members of racial and ethnic minority groups, and those with lower incomes and lower levels of education are less likely than whites and those with higher levels of income and education to say they have their wishes for end-of-life medical treatment in a written document. These differences also persist after controlling for age and other demographics.

Table 1: Wishes for End-of-Life Care in a Written Document by Race and Socioeconomic Status
Race/EthnicityEducationHousehold Income
Non-Hispanic WhitesNon-Hispanic BlacksHispanicsHigh school or lessSome collegeCollege graduateLess than $40K$40K- $89.9KOver $90K
Percent who say they have their end-of-life wishes for medical treatment in a written document35%15%11%20%33%33%20%30%33%

Experiences with the Death of a Loved One

Roughly two-thirds (66 percent) of U.S. adults say they have experienced the death of someone close to them in the past five years. This includes 19 percent who experienced the death of a parent, 15 percent who experienced the death of a close friend, and 12 percent who experienced the death of a sibling. One in three (34 percent) say their loved one died at home, while a similar share (29 percent) say they died in a hospital, 15 percent say they died in a hospice, and 10 percent in a nursing home. Overall, about half (53 percent) of those who experienced the death of a loved one say that person either died in a hospice or received hospice care services before they died.

Figure 19: 2 in 3 Americans Say They Have Experienced the Death of a Loved One in the Past Five Years

Family members often serve as caregivers or medical decision-makers when a loved one is ill and approaching the end of life. The survey finds that just over a third (35 percent) of those who experienced the death of a loved one in the past five years (accounting for 23 percent of the public overall) say that they were involved in providing care for the person before they died. Nearly as many (27 percent of those who experienced a death, or 18 percent of the public overall) report that they were involved in helping to make decisions about their loved one’s medical care. Those who experienced the death of a parent were much more likely than those who experienced the death of another type of loved one to say that they were involved in providing care (55 percent versus 28 percent) and making medical decisions (55 percent versus 18 percent).

Figure 20: Larger Shares Report Involvement in Parent’s Medical Care Before Their Death Than in Other Loved One’s Care

Most family members who were involved in making medical decisions for a loved one feel that they had a good understanding of their loved one’s wishes for end-of-life treatment. Among this group of decision-makers, about six in ten (57 percent) say they knew exactly what the person wanted, and about a third (32 percent) say they had a pretty good idea; one in ten (10 percent) report that they didn’t really know what the person’s wishes were. Furthermore, about three-quarters (73 percent) of this group reports that they have participated in a discussion with a doctor or other health care provider about another family member’s wishes for end-of-life medical care, a much higher share than among the public at large.

Figure 21: Majority of Those Involved in Their Loved One’s Care Report Knowing What Their Loved One’s Wishes Were

On the whole, few of those who experienced the death of a loved one describe negative experiences with end-of-life medical care. Large majorities say their loved one’s religious and spiritual beliefs were respected (86 percent), they died with friends or family present (81 percent), their wishes about medical care were followed (71 percent), and they had access to appropriate medical treatments for prolonging life (71 percent). Those who say their family member received hospice services before death are more likely than those who didn’t to say the person’s religious and spiritual beliefs were respected (91 percent versus 84 percent), they died with friends or family present (90 percent versus 74 percent), their wishes about medical care were followed (77 percent versus 68 percent), and they had access to appropriate medical treatments for prolonging life (82 percent versus 64 percent).

Still, small but important shares report negative experiences related to a loved one’s death. A quarter (25 percent) say their loved one experienced more pain than was necessary, and 17 percent say the person received medical care that placed an undue financial burden on the patient’s family. These shares are not statistically different between those whose family member received hospice services and those who did not.

Figure 22: Majorities of Those Whose Loved Ones Have Died Report Positive End-of-Life Experiences

Methodology

The Kaiser Family Foundation/The Economist Four-Country Survey on Aging and End-of-Life Medical Care was conducted among nationally representative random digit dial (RDD) telephone (landline and cell phone) samples of adults ages 18 and older, living in the United States (including Alaska and Hawaii), Brazil, Italy, and Japan (Note: persons without a telephone could not be included in the random selection process). SSRS carried out the sampling and weighting for all countries, and conducted computer-assisted telephone interviews for the U.S. sample. Interviews in Brazil were carried out by Cido International, and interviews in Japan and Italy were carried out by European Field Group, under the direction of SSRS. RDD landline and cell phone samples were provided by Marketing Systems Group (MSG) for the U.S., Sample Answers for Brazil, and Sample Solutions Europe (SSE) for Japan and Italy. Interview languages, field dates, and sample sizes for each country are shown in the table below. Teams from The Economist and the Kaiser Family Foundation worked together to develop the survey questionnaire and analyze the data. The Kaiser Family Foundation paid for the fieldwork costs associated with the survey. Each organization is responsible for its content.

Due to the multi-national design, the questionnaire was tested and translated in multiple stages. The first step involved a live-interview telephone pretest of the English questionnaire with U.S. respondents. Revisions to the English questionnaire were made following the pretest in order to shorten the survey instrument and improve respondent comprehension of questions. Following the English pretest, the questionnaire was translated into Spanish (for interviewing in the U.S.), Italian, Japanese, and Portuguese. Translations were reviewed by a team of professional translators and by regional experts at The Economist. A second pretest was conducted in Italy, Japan, and Brazil, after which further revisions were made to the non-English versions of the questionnaire.

In each country, to randomly select a household member for the landline samples, respondents were selected by asking for the adult male or female currently at home who had the most recent birthday based on a random rotation. If no one of that gender was available, interviewers asked to speak with the adult of the opposite gender who had the most recent birthday. For the cell phone samples, interviews were conducted with the adult who answered the phone.

Multi-stage weighting processes were applied separately for each country to ensure an accurate representation of each country’s national adult population. The first stage of weighting involved corrections to account for the fact that respondents with both a landline and cell phone have a higher probability of selection. The second weighting stage was designed to make demographic adjustments to the sample to match national population estimates. In the U.S., the sample was balanced to match known adult-population parameters using data from the Census Bureau’s 2015 March supplement of the Current Population Survey (CPS) and phone use parameters from the July-December 2015 early release estimates for the National Health Interview Survey. The weighting parameters used for the U.S. were age, gender, education, race/ethnicity, marital status, census region, and telephone use. In Italy, the sample was balanced using estimates from Instituto Nazionale di Statistica’s population projections based on 2010-2011 Census reports, with weighting parameters for age, education, region, and region by density. In Japan, the sample was balanced to match population parameters from Japan’s Statistical Yearbook 2015, based on age, education, and region by prefecture. In Brazil, the sample was balanced using the 2010 Population Census conducted by Instituto Brasileiro de Geografia de Estatística, based on age, education, region, and rural status. All statistical tests of significance account for the effect of weighting.

At the end of the field period, SSRS completed several data validation processes on the international data that included: internal validity checks, testing for straightlining, and analyzing paradata (interviewer workload, interview length, interview time, and overlap of interviews). The Kaiser Family Foundation, along with SSRS, also conducted a percent-match procedure to identify cases that share a high-percentage of identical responses to a large set of questions. This extra validation measure allows for detection of possible duplicate data, whether as a result of intentional falsification, or due to errors in data-processing.

The margin of sampling error including the design effect for each country sample is plus or minus 4 percentage points. For results based on subgroups, the margin of sampling error will be higher; sample sizes and margins of sampling error for subgroups are available by request. Note that sampling error is only one of many potential sources of error in this or any other public opinion poll. Kaiser Family Foundation public opinion and survey research is a charter member of the Transparency Initiative of the American Association for Public Opinion Research.

CountryField datesLanguage(s)Total sample size (unweighted)Cell phone sampleLandline sampleM.O.S.E
U.SMarch 30-May 29English and Spanish1,006739268±4 percentage points
ItalySeptember 15-October 3Italian1,000600400±4 percentage points
JapanSeptember 10-October 20Japanese1,000500500±4 percentage points
BrazilAugust 26-November 12Portuguese1,233714519±4 percentage points


Endnotes

  1. U.S. Census Bureau, Projections of the Size and Composition of the U.S. Population: 2014 to 2060, March 2015. http://www.census.gov/content/dam/Census/library/publications/2015/demo/p25-1143.pdf ↩︎
  2. National Institute on Aging, Advance Care Planning, February 2012. https://www.nia.nih.gov/health/publication/advance-care-planning   ↩︎

Views and Experiences with End-of-Life Medical Care in Japan, Italy, the United States, and Brazil: A Cross-Country Survey

Authors: Liz Hamel, Bryan Wu, and Mollyann Brodie
Published: Apr 27, 2017
Section:
0 / 0

Overview

In partnership with The Economist, the Kaiser Family Foundation conducted a cross-country survey of adults in Japan, Italy, the United States, and Brazil about people’s views and experiences related to aging and end-of-life medical care. These four countries are each at a different stage of population aging. On one end of the spectrum, Japan is the world’s oldest country (27 percent are ages 65 and older) and has the longest life expectancy along with a shrinking overall population . Italy is not far behind, with a population that is 21 percent elderly, the largest proportion among European nations . The United States is in the middle of the aging trajectory, with the share of the population ages 65 and older expected to grow from about 15 percent in 2015 to 24 percent by 2060 . At the other end of the spectrum, Brazil has a relatively young population today, but due to recent changes in mortality and fertility, the share of the population that is elderly is expected to double (from 7 percent to 14 percent) by 2031. These four countries also reflect different cultural and institutional considerations when it comes to preparing and providing care for those near the end of life, and both the demographic and cultural differences are reflected in the survey results reported here.

This report summarizes the overall survey results with comparisons across the four countries, and includes sections highlighting particular findings in Japan, Italy, and Brazil. A separate report with more detail on the U.S. results is available here.

Coverage from The Economist

What people want in their final months

Mending Mortality

What people want at the end of life

Summary

Four-Country Comparison: Five Key Takeaways

  1. Despite the demographic and cultural differences between these four countries, there are some common themes that emerge from the survey results. For example, in each country surveyed a majority say their government is not well-prepared to deal with the aging population, and residents are more apt to give their health care system a negative rating than a positive one when it comes to providing end-of-life care. In another area of commonality, majorities in all four countries express a preference to die at home, but fewer say they expect to die at home than say that is their wish. Large majorities across countries also feel that doctors should be completely honest with seriously ill patients, regardless of their prognosis.
  2. When asked about priorities for health care at the end of people’s lives, majorities across three of the four countries (Japan, Italy, and the U.S.) prioritize reducing pain and stress over extending life as long as possible. Similarly, when asked what is important in thinking about their own death, “living as long as possible” ranks last on a list of seven possible factors in these three countries. Brazil stands out as an exception on these measures, with a larger share placing a priority on extending life, both in general and for themselves personally.
  3. When it comes to discussing and planning for the end of life, majorities across countries say death is a subject that is generally avoided rather than something people feel free to talk about. However, the U.S. stands out from other countries, with higher shares reporting having conversations with loved ones about their end-of-life wishes and having these wishes written down.
  4. About one in five adults in each country surveyed say they were involved in helping to make medical decisions for a loved one who died in the past five years. Acting as a medical decision-maker for someone who died appears to influence people’s own personal end-of-life preparations; in Japan, the U.S., and Brazil, those who served as a medical decision-maker for someone else are more likely to say they’ve had a serious conversation with a loved one about their own end-of-life wishes, and to have those wishes in a written document.
  5. While most of those who experienced the death of a loved one report positive experiences overall, some negative reports are not uncommon. Majorities across countries say their loved one’s wishes about medical care were followed, that their spiritual and religious beliefs were respected, and that they died with friends or family present. Still, substantial shares of those who experienced the death of a loved one (particularly in Japan and Brazil) say the person experienced more pain than was necessary (about four in ten in Brazil, about three in ten in Japan, and a quarter in the U.S. and Italy) or that they did not have access to appropriate medical treatments for prolonging life (about four in ten in Japan and Brazil, one-third in Italy, and 18 percent in the U.S.). About one in five of those experiencing the death of a loved one across countries say their loved one received medical care that placed an undue burden on the patient’s family.

Key Findings Across Countries

Perceptions of the Aging Population and Preparedness of Government, Health System, and Families

Across the four countries surveyed, the share of the public perceiving population aging as a major problem corresponds roughly to each country’s place on the aging trajectory. Nine in ten adults in Japan and about six in ten in Italy (the two “older” countries in the survey) see the growing number of older people in their country as a major problem, compared with about four in ten in the “younger” countries of the U.S. and Brazil.

Figure 1: Majorities in Italy & Japan, Smaller Shares in U.S. & Brazil Perceive Aging Population as a Major Problem

Across all four countries surveyed, majorities say the government is “not too prepared” or “not at all prepared” to deal with the aging population. Preparedness ratings are somewhat more mixed when it comes to the country’s health care system and families. In Italy and Brazil, majorities see the health care system as unprepared, while residents of the U.S. and Japan are more evenly divided between thinking the health care system is prepared and not prepared. Asked how prepared families are to deal with the aging population, majorities in Italy, Japan, and Brazil say families are not prepared, while Americans are more evenly split.

Figure 2: Across Countries, Many See Government, Health System, and Families as Unprepared to Deal with Aging Population

Another similarity across countries is in residents’ relatively negative ratings of their health care systems. In each country, the public is more likely to rate their health care system as “fair” or “poor” than to say it is “excellent” or “very good.” This is true when residents are asked to rate the health care system in general and also when they are asked about end-of-life medical care specifically. Residents of Brazil – a country whose state-run health care system has been plagued by problems – are particularly negative on these measures, with about nine in ten giving a “fair” or “poor” rating.

Figure 3: Most Give Their Country’s Health System Negative Ratings in General and When It Comes to End-of-Life Medical Care

Residents of the four countries differ somewhat in their views of who should bear the greatest responsibility for financing care for an aging population. In Italy and Brazil, large majorities of around eight in ten say it’s the government’s responsibility to pay for people’s health and long-term care needs as they age, as do just over half in Japan. Views in the U.S. are more evenly split between those who say the responsibility should fall mostly on individuals and families (44 percent) and those who say it’s the responsibility of the government (42 percent). These views are largely divided by party identification, as views of government responsibility generally are in the U.S., with Democrats more likely to place the responsibility on government and Republicans more likely to place it on families.

Figure 4: Majorities in All Countries Except U.S. Feel Government Responsible for Financing Aging Population’s Health Needs

Outside of financial responsibility, most people across countries see a large role for families in helping aging family members. Solid majorities say that it is the duty of children to help take care of their parents’ needs as they get older, ranging from 61 percent in Japan to 91 percent in Brazil. With the exception of Italy, in each country older adults themselves are less likely than their younger counterparts to say it is the children’s duty.

Figure 5: Majorities Across Countries Say It Is Children’s Duty to Help Care for Aging Parents; Older Adults Less Likely to Say So

Priorities at the End of Life

The survey reveals a difference between residents of Brazil and those of the other three countries surveyed when it comes to the relative priority placed on extending life. When asked what should be more important when it comes to health care at the end of people’s lives, half of Brazilians (50 percent) choose “preventing death and extending life as long as possible” while about four in ten (42 percent) choose “helping people die without pain, discomfort, and stress.” This stands in contrast to Japan, Italy, and the U.S., where large majorities – between 68 percent and 82 percent – prioritize reducing pain and stress over extending life.

Figure 6: Majority in U.S., Italy, and Japan Prioritize Reducing Pain and Stress over Prolonging Life; Brazilians More Divided

Similarly, when asked what is important in thinking about their own death, Brazilians stand out in the relative importance placed on extending life. In Japan, Italy, and the U.S., “living as long as possible” ranks last on the list of seven possible factors, with a substantially lower share saying it is “extremely important” to them compared with any other factor. By contrast, “living as long as possible” ranks fourth in Brazil, with 26 percent saying it is “extremely important,” similar to the shares who say the same about other priorities like having loved ones around and not burdening one’s family financially. These differences between Brazil and the other countries surveyed may have something to do with Brazil’s relatively younger population; across countries, younger adults are generally more likely than older adults to place greater emphasis on extending life.

In terms of what is most important to people in thinking about their own death, in the U.S. and Japan, where medical care is generally expensive, “making sure your family is not burdened financially by your care” ranks at the top of the list.1  In Italy, the top concern is “having loved ones around you,” followed closely by “making sure your wishes about medical care are followed” and “being comfortable and without pain.” In Brazil, the top concern is “being at peace spiritually.”

Figure 7: Personal Priorities for Death

In considering their own death, individuals across countries share the desire to die at home, along with the expectation that this desire is not likely to be fulfilled. Across the four countries surveyed, majorities say if they had the choice, they would prefer to die at home. However, when asked where they think they are most likely to die, a much smaller share in each country say they expect to die at home. This pattern is starkest in Japan – a country with 13.4 hospital beds per 1,000 residents (roughly 4 times as many as any other country surveyed) – where 55 percent say they would prefer to die at home, but 58 percent think they are most likely to die in a hospital.2 

Figure 8: Most Would Prefer to Die at Home, Fewer Think It’s Likely

Who Should Have Control of Medical Decisions at the End of Life?

There is some variation across the countries surveyed in views of whether doctors or patients and their families should have the greater say in decisions about end-of-life medical treatments. The vast majority of adults in Japan (88 percent) and the U.S. (87 percent) say that patients and their families should have the greater say, while closer to half in Italy (52 percent) and Brazil (47 percent) say the same. By contrast, substantial shares of Brazilians (40 percent) and Italians (30 percent) say that doctors should have the greater say in which medical treatments to pursue for seriously ill patients who are near the end of their lives, compared with about one in ten in Japan and the U.S.

Interestingly, however, the two countries surveyed (Brazil and Italy) where residents are least likely to say patients and their families should have the greater say in end-of-life medical decisions are also the most likely to say people in their own country have too little control over decisions about their own medical care at the end of life (79 percent and 59 percent, respectively). About half (49 percent) of U.S. adults also feel that people have too little control over these decisions. In Japan, about half (49 percent) feel that people in their country have about the right amount of control, while a smaller share (36 percent) say they have too little.

Figure 9: Views on Who Should Have Greater Say in Decisions About End-of-Life Care Medical Treatment Vary by Country

Despite these differences, most people across the countries surveyed agree that doctors should be honest with patients regardless of their prognosis. Large majorities say that when a patient is seriously ill, it is more important for doctors to be completely honest even if there is little chance of recovery, while a small share across countries believe it is more important for doctors to emphasize hope for seriously ill patients.

Figure 10: Across Countries, Most Want Doctors to Be Completely Honest Regardless of Prognosis

Talking about Death and Planning Ahead

Across countries, majorities say death is a subject that is generally avoided rather than something people feel free to talk about. However, the U.S. stands out from other countries, with higher shares reporting having conversations with loved ones about end-of-life wishes and having these wishes written down.

When it comes to the subject of death, majorities ranging from 57 percent in Japan to 69 percent in the U.S. say that death is a subject that is generally avoided in their country’s society, while much smaller shares (ranging from 26 percent in the U.S. to 38 percent in Japan) say death is a subject people generally feel free to talk about.

Figure 11: Across Countries, Public Says Death Is a Subject People Generally Avoid

This reluctance to talk about death is reflected in people’s self-reported conversations. Fewer than half of adults (including those ages 65 and over) in Italy, Japan, and Brazil say they’ve had a serious conversation with a loved one about their own wishes for end-of-life medical care. These conversations are somewhat more common in the U.S., with just over half the general population and about three-quarters of Americans ages 65 and over saying they’ve had such a conversation. Having one’s end-of-life medical wishes in a written document is also more common in the U.S.; a quarter of U.S. adults (27 percent) and half of U.S. seniors (51 percent) say they do, compared with fewer than 1 in 6 in other countries.

Figure 12: U.S. Residents More Likely to Report Discussing End-of-Life Wishes with Loved Ones and Having Wishes Written Down

Among those who do not have their wishes written down, the top reason in Italy, Japan, and Brazil is “you never considered it,” suggesting that writing down one’s wishes is not a commonly discussed practice in these countries. By contrast, the top reason in the U.S. is “you just haven’t gotten around to it,” suggesting that Americans are more likely than residents of the other countries surveyed to think of writing down their medical wishes as a common practice and something they expect to do at some point in their lives.

Figure 13: Reasons for Not Having End-of-Life Wishes in a Written Document Vary by Country

If conversations with loved ones about end-of-life wishes are relatively uncommon, conversations with health care professionals about these issues are even rarer. Just about one in ten in each country say they’ve had a conversation about their wishes for end-of-life medical treatment with a doctor or other health care provider, rising to 22 percent among seniors in the United States. A somewhat larger share – roughly three in ten – in the U.S. and Japan say they’ve participated in a discussion with a health care provider about another family member’s wishes for their care at the end of life, but still the majority say they have not participated in such a conversation.

Figure 14: Few Have Discussed Their Own End-of-Life Wishes with a Doctor or Other Health Care Provider

Experiences with Death of a Loved One

At least half of people in each of the four countries surveyed report experiencing the death of someone close to them within the past five years, including substantial minorities who say they helped provide care or helped make medical decisions for the person who died. Overall, about one-fifth in Japan, one-quarter in the U.S. and Italy, and one-third in Brazil say they helped to provide care for a loved one who died in the past five years. About one in five in each country say they were involved in helping to make medical decisions for someone who died in that time frame.

Figure 15: Substantial Minorities Report Acting as Caregiver or Medical Decision-Maker for Loved One Who Died

Among those who say they acted as a medical decision-maker for a loved one who died, residents of the U.S. are more likely than residents of the other countries surveyed to say they had a good idea of their loved one’s end-of-life wishes. A majority of Americans who served as a medical decision-maker for someone who died say they knew exactly what the person wanted (57 percent) or had a pretty good idea (32 percent), while just one in ten say they didn’t really know what their loved one wanted. By contrast, between a third and four in ten in Japan, Italy, and Brazil say they didn’t really know what their loved one’s wishes were before they died. This difference may be related to the finding noted above that Americans are more likely to report having conversations with loved ones about end-of-life wishes.

Figure 16: Awareness of Loved Ones’ End-of-Life Wishes Among Medical Decision-Makers Varies by Country

Acting as a medical decision-maker for someone who died also appears to influence people’s own personal end-of-life preparations; in Japan, the U.S., and Brazil, those who served as a medical decision-maker for someone else are significantly more likely to say they’ve had a serious conversation with a loved one about their own end-of-life wishes, and to have those wishes in a written document.

Figure 17: Those Who Helped Make Medical Decisions for a Loved One Are More Likely to Report Talking About Their Own Wishes and Writing Them Down

While most of those who experienced the death of a loved one report positive experiences overall, some negative reports are not uncommon. Among those who experienced the death of someone close to them in the past five years, majorities across countries say their loved one’s wishes about medical care were followed, that their spiritual and religious beliefs were respected, and that they died with friends or family present.

Figure 18: Majorities Say Loved Ones Died with Friends or Family Present, Had Spiritual Beliefs Respected and Medical Wishes Followed

Still, substantial shares of those who experienced the death of a loved one – particularly in Japan and Brazil – say the person experienced more pain than was necessary (about four in ten in Brazil, three in ten in Japan, and a quarter in the U.S. and Italy) or that they did not have access to appropriate medical treatments for prolonging life (about four in ten in Japan and Brazil, one-third in Italy, and 18 percent in the U.S.). About one in five of those experiencing the death of a loved one across countries say their loved one received medical care that placed an undue burden on the patient’s family.

Figure 19: Many Say Loved One Who Died Experienced Unnecessary Pain, Did Not Have Adequate Access to Life-Prolonging Treatment

Awareness and Opinions of Hospice Care

Hospice care is an option for seriously ill patients near the end of life that emphasizes providing comfort and pain management rather than curative treatment. In the U.S., the use of hospice care has increased in recent years, and hospice services are provided in various settings, including hospitals, free-standing hospice centers, and often in the patient’s own home.3  In the other countries surveyed, hospice care is less common and is usually provided in a designated hospice facility. Reflecting these differences, adults in the U.S. are much more likely than those in Japan, Italy, or Brazil to say they know something about hospice. Seven in ten Americans say they know at least a little about hospice care, compared with between about a quarter and a third in the other countries surveyed.

Figure 20: Awareness of Hospice Highest in U.S.

Among those who have heard of it, feelings about hospice care across countries are overwhelmingly positive, with large majorities (between seven and eight in ten) saying they have a positive opinion of hospice.

Figure 21: Across Countries, Majorities of Those Who Have Heard About Hospice Have a Positive Opinion

While relatively few of those who experienced the death of a loved one in Japan, Italy, and Brazil say that their loved one died in a hospice facility, roughly half (53 percent) of U.S. adults who experienced a death say their loved one either died in a hospice facility or was receiving hospice services before they died. In the U.S., those whose close friend or family member received hospice services are more likely than those who didn’t receive such services to say their loved one’s spiritual or religious beliefs were respected, that they died with friends or family present, and that their wishes about medical care were followed. Although the aim of hospice is to relieve pain and suffering and not necessarily to extend life, those whose loved ones received hospice services are also more likely than those who didn’t to say the person had access to appropriate treatments for prolonging life. However, there is no significant difference based on receipt of hospice services in the share who say their loved one experienced more pain than necessary or received care that placed an undue financial burden on the family.

Figure 22: U.S.: Those Whose Loved Ones Received Hospice Services More Likely to Report Positive End-of-Life Experiences

Country Highlights: Japan

As the country in the survey with the oldest population, residents of Japan see the growing number of older adults as a major problem, and rate their health care system poorly on providing end-of-life care.

Nine in ten adults (91 percent) in Japan say the growing number of older people is a major problem for their country, far higher than any of the other countries surveyed. While just over half say it is the government’s responsibility to finance care for this aging population, one-third (35 percent) say the responsibility should fall on individuals and families. Japanese adults are also particularly sour on their health system when it comes to providing end-of-life medical care: seven in ten give it a rating of fair or poor on a 5-point scale.

Figure 23: Japan: Public Sees Aging of the Population as a Problem, Rates Health Care System Poorly When It Comes to End-of-Life Care

In Japan, a country with 13.4 hospital beds per 1,000 residents (roughly 4 times as many as any other country surveyed), residents are more likely than those in other countries surveyed to expect to die in a hospital and to say a loved one died in a hospital.

While just over half (55 percent) of Japanese adults say they would prefer to die at home, the majority (58 percent) think they are most likely to die in a hospital, higher than any of the other countries surveyed. Among residents with a loved one who died in the past five years, 69 percent in Japan say their loved one died in a hospital, while just 15 percent say they died at home.

Figure 24: Japan: Majority of Residents Expect to Die in a Hospital and About Seven in Ten Say Their Loved One Died in a Hospital

The top concern for Japanese adults in thinking about their own death is making sure their family is not financially burdened.

Six in ten (59 percent) adults in Japan say that making sure their family is not burdened financially by their care is “extremely important” in thinking about their own death. About half also place this level of importance on being at peace spiritually, not burdening their family with tough decisions about their medical care, having loved ones around, and being comfortable and without pain. By contrast, just 10 percent of Japanese adults say that living as long as possible is extremely important to them, ranking far below any other concern.

Figure 25: Japan: Most Important for Own Death: Not Burdening Family Financially; Least Important (By Far): Living as Long as Possible

Conversations about end-of-life wishes are uncommon in Japan.

Just 31 percent of Japanese adults (and 33 percent of those ages 65 and over) say they’ve had a serious conversation with a loved one about their own wishes for end-of-life care. Just 7 percent say they’ve had such a conversation with a doctor and 6 percent say they have their wishes written down. Among those who don’t have their wishes in writing, two-thirds (64 percent) say they’ve never considered it, suggesting this is something that is not discussed or done often in Japan.

Figure 26: Japan: Few Report Discussing Their End-of-Life Wishes with Others or Having Them Written Down in a Document

Perhaps reflecting this lack of conversation, just 26 percent of adults in Japan who served as a medical decision-maker for someone who died say they knew exactly what their loved one wanted in terms of medical treatment, substantially lower than among decision-makers in the other countries surveyed.

Figure 27: Japan: About One in Four Decision-Makers Knew Exactly What Their Loved One Wanted for End-of-Life Medical Treatment

Some attitudes about end-of-life medical care in Japan differ by education level and gender.

University graduates in Japan are more likely than those with lower levels of education to say the health care system places too much emphasis on extending life and too little emphasis on helping people die without pain and stress. Those with higher levels of education are also more likely to say most people have too little control over decisions about their own medical care at the end of life.

Figure 28: Japan: University Graduates More Likely To Say System Places Too Much Emphasis on Extending Life, Too Little on Relieving Suffering
Figure 29: Japan: University Graduates More Likely to Say Most People Have Too Little Control over End-of-Life Decisions

In Japan, women are more likely than men to say they’ve had a conversation with a loved one about their wishes (36 percent vs. 26 percent). By contrast, Japanese men are more likely than women to say they’d prefer to die at home (66 percent vs. 45 percent).

Figure 30: Japan: Women More Likely to Report Discussing Wishes with a Loved One; Less Likely to Say They’d Prefer to Die at Home

Country Highlights: Italy

Italians want their government to take responsibility for the aging population, but most doubt its preparedness to do so.

In Italy, the second-oldest country in our survey, 72 percent see the aging of the population as a problem – including 57 percent who say it’s a major problem – and roughly eight in ten (78 percent) say it should be the responsibility of the government to pay for people’s health and long-term care needs as they age. Yet nearly nine in ten Italians say the government is “not too prepared” (37 percent) or “not at all prepared” (48 percent) to deal with the aging population, and two-thirds (65 percent) say the same about the country’s health care system. Furthermore, six in ten (61 percent) give the country’s health care system a fair or poor rating overall, and half (53 percent) say the same when it comes to end-of-life medical care.

Figure 31: Italians Want Their Government to Take Responsibility for Aging Population, But Doubt Its Preparedness to Do So
Figure 32: Over Half of Italians Rate Their Health Care System Negatively in General and When It Comes to End-of-Life Medical Care

Italians are more likely than residents of some other countries surveyed to place decisions about end-of-life medical care in the hands of doctors. This is particularly true among Italians with lower incomes and lower levels of education.

While just 11 percent of Italians say they have had a serious conversation with a doctor about their own wishes for end-of-life medical care and just 6 percent say they have these wishes written down, Italians seem somewhat more willing than residents of the U.S. and Japan to place decision-making in the hands of doctors. Three in ten Italians (compared with about one in ten in the U.S. and Japan) say that doctors should have the greater say in which medical treatments to pursue for seriously ill patients who are near the end of their lives, while about half (compared with nearly 9 in 10 in the U.S. and Japan) say patients and their families should have the greater say.

In Italy, those with lower incomes and lower levels of education are more likely than their higher-income, more educated counterparts to say that doctors should have a greater say in these decisions. For example, 37 percent of Italians with less than a high school education say that doctors should have the greater say in medical decisions, compared with just 17 percent of university graduates.

Figure 33: Italians with Lower Levels of Income and Education More Likely to Say Doctors Should Have Greater Say in End-of-Life Decisions

When it comes to priorities for their own death, Italians value the presence of loved ones along with a variety of other factors.

Asked what is important in thinking about their own death, a third (34 percent) of Italians say that having loved ones around is “extremely important.” Similar shares say the same about making sure their wishes for medical care are followed, being comfortable and without pain, and making sure their family is not burdened financially by their care. As in Japan, living as long as possible ranks far behind other factors, with just 14 percent saying it is “extremely important” to them.

Figure 34: Italy: Most Important for Own Death: Having Loved Ones Around; Least Important: Living as Long as Possible

Some other interesting demographic differences in views of end-of-life care in Italy are worth highlighting.

As in Japan, women in Italy are somewhat more likely than men to report having had a serious conversation with a loved one about their own wishes for end-of-life medical care (53 percent vs. 42 percent).

Catholics – who make up 75 percent of adults in Italy – are more likely than those with no religious preferences to say the health care system in Italy places too little emphasis on extending life (38 percent vs. 27 percent). By contrast, those with no religious preference are more likely than Catholics to say the health care system places too much emphasis on extending life (20 percent vs. 11 percent).

Figure 35: Italians’ Views on Extending Life Differ by Religious Preference

Among Italians with a loved one who died in the past five years, those with lower incomes are more likely to say their loved one received medical care that placed an undue financial burden on the family and less likely to say they had access to appropriate life-extending treatments.

Figure 36: Italy: Lower-Income More Likely to Report Some Negative Experiences with Loved One’s Death

Country Highlights: Brazil

Among the countries surveyed, Brazilians stand out as having the most negative views of their health care system, yet they are the most likely to defer to doctors when it comes to end-of-life decision making.

In Brazil, a country whose state-sponsored health care system has been plagued by problems, nine in ten residents give the health care system a rating of “fair” or “poor” both in general (90 percent) and when it comes to providing end-of-life medical care (86 percent), by far the most negative ratings among the countries surveyed.

Figure 37: Vast Majority of Brazilians Rate Health Care System Negatively

Brazilians are also the most likely of any country surveyed to say that most people in their country have too little control over their own medical care at the end of life (79 percent). Despite this sense that people should have more control, Brazilians are more likely than residents of the other countries surveyed to say that doctors should have the greater say in which medical treatments to pursue for seriously ill patients; 4 in 10 say doctors should have the greater say, while about half say patients and their families should have the greater say. And among Brazilians who have not discussed their own end-of-life wishes with a loved one, the main reason given is that they will trust their doctor to make those decisions for them when the time comes.

Figure 38: Brazilians Want Patients to Have More Control, But Four in Ten Defer to Doctors When It Comes to End-of-Life Care

Brazilians stand out as being more likely than residents of other countries surveyed to focus on religion and spirituality when it comes to end-of-life issues.

Eight in ten Brazilians (83 percent) say their religious or spiritual beliefs play a major role in how they think about their own wishes for end-of-life medical treatment, compared to about half of residents in the U.S. and Italy and just 13 percent in Japan. Forty-four percent of adults in Brazil identify as Catholic and three in ten identify as Evangelical; these groups are about equally likely to say their beliefs play a major role in their thinking on these issues.

Figure 39: Brazilians Focus on Religion and Spirituality When It Comes to End-of-Life Issues

When asked the importance of various factors in thinking about their own death, “being at peace spiritually” ranks number one in Brazil, with 40 percent saying it is extremely important and another 49 percent saying it is very important. In contrast to the other countries surveyed, a quarter of Brazilians (26 percent) say that living as long as possible is extremely important to them, placing it on par with other concerns like having loved ones around, making sure your family is not burdened financially, and making sure your wishes about medical care are followed.

Figure 40: Brazil: Many Factors Seen as Important for Own Death: Being At Peace Spiritually Ranks #1

Some attitudes about end-of-life care in Brazil differ by gender and education level.

Among Brazilians, women are more likely than men to say they have thought a great deal about how they would pay for the costs of medical care and other services they or another family member might need in old age (50 percent vs. 36 percent) and who would provide care for them or another family member if someone became seriously ill and needed special support (51 percent vs. 40 percent). However, men are more likely than women to report discussing their own wishes for end-of-life treatment with a health care provider (14 percent versus 6 percent).

Figure 41: Brazil: Gender Differences in Preparing for Old Age/Serious Illness

While Brazil is a relatively young country, Brazilians with higher levels of education appear to be more concerned than their less-educated counterparts about the issue of population aging. Nearly six in ten university graduates (56 percent) say the growing number of older adults in Brazil is a major problem, compared with about a third (34 percent) of those with a primary education or less.

Figure 42: Brazil: University Graduates More Likely to Perceive Aging Population as a Major Problem

There is also a difference based on education level in Brazilians’ attitudes about extending life. While Brazilians overall are more likely to prioritize prolonging life over helping people die without pain, discomfort, and stress, university grads lean in the other direction (58 percent say reducing pain and stress should be more important).

Figure 43: Brazil: University Graduates More Likely to Prioritize Reducing Pain and Stress over Prolonging Life

Methodology

The Kaiser Family Foundation/The Economist Four-Country Survey on Aging and End-of-Life Medical Care was conducted among nationally representative random digit dial (RDD) telephone (landline and cell phone) samples of adults ages 18 and older, living in the United States (including Alaska and Hawaii), Brazil, Italy, and Japan (Note: persons without a telephone could not be included in the random selection process). SSRS carried out the sampling and weighting for all countries, and conducted computer-assisted telephone interviews for the U.S. sample. Interviews in Brazil were carried out by Cido International, and interviews in Japan and Italy were carried out by European Field Group, under the direction of SSRS. RDD landline and cell phone samples were provided by Marketing Systems Group (MSG) for the U.S., Sample Answers for Brazil, and Sample Solutions Europe (SSE) for Japan and Italy. Interview languages, field dates, and sample sizes for each country are shown in the table below. Teams from The Economist and the Kaiser Family Foundation worked together to develop the survey questionnaire and analyze the data. The Kaiser Family Foundation paid for the fieldwork costs associated with the survey. Each organization is responsible for its content.

Due to the multi-national design, the questionnaire was tested and translated in multiple stages. The first step involved a live-interview telephone pretest of the English questionnaire with U.S. respondents. Revisions to the English questionnaire were made following the pretest in order to shorten the survey instrument and improve respondent comprehension of questions. Following the English pretest, the questionnaire was translated into Spanish (for interviewing in the U.S.), Italian, Japanese, and Portuguese. Translations were reviewed by a team of professional translators and by regional experts at The Economist. A second pretest was conducted in Italy, Japan, and Brazil, after which further revisions were made to the non-English versions of the questionnaire.

In each country, to randomly select a household member for the landline samples, respondents were selected by asking for the adult male or female currently at home who had the most recent birthday based on a random rotation. If no one of that gender was available, interviewers asked to speak with the adult of the opposite gender who had the most recent birthday. For the cell phone samples, interviews were conducted with the adult who answered the phone.

Multi-stage weighting processes were applied separately for each country to ensure an accurate representation of each country’s national adult population. The first stage of weighting involved corrections to account for the fact that respondents with both a landline and cell phone have a higher probability of selection. The second weighting stage was designed to make demographic adjustments to the sample to match national population estimates. In the U.S., the sample was balanced to match known adult-population parameters using data from the Census Bureau’s 2015 March supplement of the Current Population Survey (CPS) and phone use parameters from the July-December 2015 early release estimates for the National Health Interview Survey. The weighting parameters used for the U.S. were age, gender, education, race/ethnicity, marital status, census region, and telephone use. In Italy, the sample was balanced using estimates from Instituto Nazionale di Statistica’s population projections based on 2010-2011 Census reports, with weighting parameters for age, education, region, and region by density. In Japan, the sample was balanced to match population parameters from Japan’s Statistical Yearbook 2015, based on age, education, and region by prefecture. In Brazil, the sample was balanced using the 2010 Population Census conducted by Instituto Brasileiro de Geografia de Estatística, based on age, education, region, and rural status. All statistical tests of significance account for the effect of weighting.

At the end of the field period, SSRS completed several data validation processes on the international data that included: internal validity checks, testing for straightlining, and analyzing paradata (interviewer workload, interview length, interview time, and overlap of interviews). The Kaiser Family Foundation, along with SSRS, also conducted a percent-match procedure to identify cases that share a high-percentage of identical responses to a large set of questions. This extra validation measure allows for detection of possible duplicate data, whether as a result of intentional falsification, or due to errors in data-processing.

The margin of sampling error including the design effect for each country sample is plus or minus 4 percentage points. For results based on subgroups, the margin of sampling error will be higher; sample sizes and margins of sampling error for subgroups are available by request. Note that sampling error is only one of many potential sources of error in this or any other public opinion poll. Kaiser Family Foundation public opinion and survey research is a charter member of the Transparency Initiative of the American Association for Public Opinion Research.

CountryField datesLanguage(s)Total sample size (unweighted)Cell phone sampleLandline sampleM.O.S.E
U.SMarch 30-May 29English and Spanish1,006739268±4 percentage points
ItalySeptember 15-October 3Italian1,000600400±4 percentage points
JapanSeptember 10-October 20Japanese1,000500500±4 percentage points
BrazilAugust 26-November 12Portuguese1,233714519±4 percentage points

Endnotes

  1. Peter G. Peterson Foundation, Per Capita Healthcare Costs – International Comparison, October 2016. http://www.pgpf.org/chart-archive/0006_health-care-oecd ↩︎
  2. OECD, Health Statistics 2014, 2014. http://www.oecd.org/els/health-systems/Briefing-Note-JAPAN-2014.pdf ↩︎
  3. National Hospice and Palliative Care Organization, Hospice Care in America, September 2015. http://www.nhpco.org/sites/default/files/public/Statistics_Research/2015_Facts_Figures.pdf     ↩︎

U.S. Global Health Funding in Draft FY18 Budget Request

Published: Apr 26, 2017

As reported in Foreign Policy, a draft of the Trump administration’s FY18 budget request for the State Department and USAID, expected to be submitted in full to Congress in May, proposes significant cuts to global health funding. According to a document obtained by Foreign Policy, funding for global health programs would total $6.8 billion, a cut of $1.7 billion (-20%) below the FY16 level ($8.5 billion).[i] While funding amounts for most program areas was not specified and total U.S. government global health funding[ii] is not yet known, some global health funding amounts are specified in the document (it is important to note that this is a draft proposal and the final request may differ):

Total global health funding: $6.8 billion provided through the Global Health Programs (GHP) account at State and USAID, which includes the majority of U.S. global health funding. This represents a decrease of $1.7 billion (-20%) below the FY16 level ($8.5 billion) and would be the lowest level of funding since FY08 ($6.5 billion). Of the 53 countries that received global health funding in FY16, twelve would increase in FY18, 40 would decrease (of which, funding in five countries would be eliminated), and one would remain flat.

State Department – bilateral HIV funding (PEPFAR) & Global Fund, UNAIDS: Of the $6.8 billion in total global health funding, $5.0 billion would be provided through the State Department, a decrease of $0.7 billion (-12%) below the FY16 level ($5.7 billion) and would be the lowest level of funding since FY08 ($4.7 billion). This includes the majority of U.S. bilateral support for HIV provided through the President’s Emergency Plan for AIDS Relief (PEPFAR) as well as contributions to the Global Fund to Fight AIDS, Tuberculosis and Malaria (Global Fund) and UNAIDS as follows:

  • Bilateral HIV (PEPFAR): Totals $3.9 billion, a decrease of more than $0.4 billion (-10%) below the FY16 level ($4.3 billion).
  • Global Fund and UNAIDS: Combined funding for these two organizations would total $1.1 billion, a decrease of $270 million (-19%) below the FY16 level ($1.4 billion); while the document does not indicate how these cuts would be distributed, in FY16, the U.S. provided $1.35 billion to the Global Fund and $45 million to UNAIDS.

USAID Global Health Programs: Of the $6.8 billion in total global health funding, $1.8 billion would be provided through USAID, a decrease of approximately $1.0 billion (-36%) below the FY16 level ($2.8 billion) and would be a return to the FY08 funding level ($1.8 billion). This funding is used to support activities addressing HIV (though most HIV funding is provided through the State Department), tuberculosis, malaria, maternal and child health (MCH), nutrition, vulnerable children, family planning and reproductive health (FP/RH), neglected tropical diseases (NTDs), and global health security. While specific amounts for all areas were not provided, the document does specify that funding for NTDs would be $75 million, a decrease of $25 million (-25%) below the FY16 level ($100 million), and funding for global health security would remain flat ($72.5 million). Funding for MDR Financing (multi-drug resistance) would decline while funding for blind children, iodine deficiency disorder, and new partners fund would be eliminated.

Other Multilateral Contributions: According to the document, the administration is proposing to increase the U.S. contribution to Gavi, the Vaccine Alliance, to $290 million, an increase of $55 million (23%) above the FY16 level ($235 million). The administration is proposing to decrease funding for the TB Drug Facility ($15 million in FY16) and eliminate funding for the Commodity Fund ($20.3 million in FY16), the International AIDS Vaccine Initiative (IAVI) ($28.7 million in FY16), and for international microbicides research ($45 million in FY16).


[i] FY17 funding is not yet finalized and is currently operating under a continuing resolution (CR) at approximately the same level as FY16.

[ii] The draft document obtained by Foreign Policy presents U.S. funding for global health provided through the U.S. Department of State and U.S. Agency for International Development (USAID). Additional global health funding is provided through the Centers for Disease Control and Prevention (CDC), National Institutes of Health (NIH), and the Department of Defense; these amounts are not yet known.

News Release

Poll: Majority Opposes Hard-Ball Negotiating Tactics to Replace the Affordable Care Act, But Republicans Support It

Three Quarters of Public, Including Half of Trump Backers, Want President and Congress to Make the Law Work

Published: Apr 26, 2017

Somewhat More Want President Trump and Republicans to Continue Working on ACA Repeal and Replace than Want Them to Move onto Other Priorities

With President Trump and Congress continuing to discuss repealing and replacing the Affordable Care Act, a majority of the public opposes using hard-ball tactics as a way to force Democrats in Congress to negotiate a replacement, the latest Kaiser Health Tracking Poll finds.

President Trump recently suggested that his administration and Congress could push Democrats to negotiate a replacement to the Affordable Care Act by stopping payments for the law’s cost-sharing reductions, which experts say would likely cause insurers to raise premiums or stop offering coverage through the ACA’s marketplaces.

The poll finds six in 10 (60%) of the public think President Trump should not try to pass an ACA replacement plan using negotiating tactics like these that could disrupt the ACA’s insurance marketplaces and cause people to lose health coverage. While majorities of Democrats (82%) and independents (66%) oppose such tactics, two thirds of Republicans (67%) instead say President Trump should use whatever negotiating tactics are necessary to win support for a replacement plan.

April Late Poll Release Chart-1.png

The poll also finds that most Americans (70%) say the uncertainty around the law’s future is hurting one of the groups most directly affected by the law – people who buy their own health insurance. A similar majority (65%) say that insurers deciding not to sell insurance plans in certain marketplaces is a “big problem” across the country, though fewer (43%) say this about insurers in their local area. These perceptions are similar across party lines.

Public Sees President Trump and Republicans in Congress as Controlling the ACA’s Future

Other findings in the poll suggest the public believes President Trump and Republicans in Congress hold the future of the ACA in their hands. For example:

  • When asked how much control, if any, various groups have over whether the current health care law works or fails, large majorities of the public say Republicans in Congress (80%) and President Trump and his administration (75%) have at least some control. Smaller shares say Democrats in Congress (56%), their own representatives in Congress (51%), or their state’s governor (48%) have at least some control.
  • Three quarters (74%) of the public say President Trump and his administration should do what they can to make the current health care law work, while one-fifth (19%) say they should do what they can to make the ACA fail so they can replace it later. Among President Trump’s supporters, half (53%) say his administration should try to make the law work.
  • A majority (64%) of the public, including most Republicans (53%), say that because President Trump and Republicans in Congress are now in control of the government, they are responsible for any problems with the ACA moving forward. That’s more than twice the share (28%) who say that President Obama and Democrats in Congress are responsible because they passed the law. The share of Republicans who say President Trump and Republicans in Congress are responsible is up significantly from 34 percent in early April.
  • This month, the public is more favorable than unfavorable in their views of the ACA overall, with 48 percent holding favorable views and 41 percent holding unfavorable ones. However, more Americans say they want President Trump and Republicans in Congress to continue working to repeal and replace it (51%) than say they want them to move on to other priorities (43%). There are big partisan divisions on both questions, with Republicans far more likely to view the ACA unfavorably (72%) and to want work to continue on repealing and replacing the law (82%).

Majorities Favor Spending Increases for Veteran’s Care, Medicare and Medical Research

With Congress facing a key budget deadline Friday, the poll finds few Americans want to see decreases in most health areas. In fact, majorities say they want the president and Congress to increase spending on veteran’s medical care (77%) and medical research to find cures for major illnesses (58%). In addition, more people say they favor increases rather than decreases in funding for many other areas, including Medicaid (40% increase, 12% decrease) and reproductive health services (36% increase, 21% decrease). The only area that more people say they want to see spending decrease than increase is for efforts to improve health for people in developing countries (33% decrease, 19% increase).

One potentially contentious issue in the budget involves efforts by some Republicans to prevent Planned Parenthood from receiving any government funding, including federal payments for non-abortion services provided to low-income women through state Medicaid programs.

The poll finds three quarters (73%) of the public favor continuing to such payments to Planned Parenthood, with a quarter (24%) saying all federal payments to the organization should stop. Few (10%, overall) say stopping these payments is important enough to shut down the federal government.

Designed and analyzed by public opinion researchers at the Kaiser Family Foundation, the poll was conducted from April 17- April 23 among a nationally representative random digit dial telephone sample of 1,171 adults. Interviews were conducted in English and Spanish by landline (421) and cell phone (750). The margin of sampling error is plus or minus 3 percentage points for the full sample. For results based on subgroups, the margin of sampling error may be higher.

Kaiser Health Tracking Poll – Late April 2017: The Future of the ACA and Health Care & the Budget

Authors: Ashley Kirzinger, Bianca DiJulio, Elise Sugarman, and Mollyann Brodie
Published: Apr 26, 2017

Aca

KEY FINDINGS:

  • President Trump recently said he may stop payments for the Affordable Care Act’s (ACA) cost-sharing reductions in order to get Democrats to start negotiating on a replacement for the 2010 health care law.1  The majority of the public (60 percent) thinks President Trump should not use negotiating tactics like these that could disrupt insurance markets and cause people to lose health coverage – including the majority of Democrats (82 percent) and independents (66 percent). On the other hand, a majority of Republicans (67 percent) say President Trump should use whatever negotiating tactics necessary to win support for a replacement plan. Most Americans (70 percent) say uncertainty around the future of the law is hurting those who purchase their own health insurance.
  • The public is more favorable (48 percent) than unfavorable (41 percent) in their views of the 2010 health care law this month. Despite this, somewhat more Americans want President Trump and Republican lawmakers to keep working on a plan to repeal and replace the ACA than want them to stop working on health care and move on to other priorities (51 percent vs. 43 percent).
  • For most, repealing the ACA falls behind other health care priorities such as lowering the amount individuals pay for health care and lowering the cost of prescription drugs – which consistently top the list of health care priorities. Among Republicans, repealing the ACA is a top health care priority, with about one-fourth saying it is the “most important priority” for President Trump and Congress when it comes to health care.
  • With the legislative path for repeal still unclear, three-fourths (74 percent) of Americans say that President Trump and his administration should do what they can to make the current health care law work. Large majorities of the public say Republicans in Congress and President Trump and his administration have at least some control over whether the current health care works or fails – including many who say they have “a lot” of control. Furthermore, a majority (64 percent) of the public – including 53 percent of Republicans – say that because President Trump and Republicans in Congress are now in control of the government, they are responsible for any problems with the ACA moving forward.
  • With lawmakers negotiating current federal budget priorities, relatively few Americans want to see the president and Congress decrease funding for a variety of different health priorities – including spending for reproductive health services for lower-income women (21 percent). Overall, one-fourth (24 percent) of the public says that federal Medicaid payments to Planned Parenthood for non-abortion services should be stopped but few (10 percent) think stopping these payments is important enough to shut down the federal government.

The Future of the ACA

With the ongoing debate about the future of the 2010 health care law, this month’s survey examines the public awareness of and attitudes about some recent developments related to the future of law, including uncertainty about cost-sharing reduction payments and insurers opting out of some health insurance marketplaces.

Cost-Sharing Reductions

Under the Affordable Care Act (ACA), financial help is available to low-income people who buy their own health insurance to lower their deductibles and co-payments, sometimes called “cost-sharing reductions” (CSRs). The federal government pays insurance companies to help cover these costs. About half of the public (49 percent) is aware that the ACA provides this type of financial help to lower-income people. Republicans are much more likely than Democrats to say the health care law does not provide this type of assistance (50 percent vs. 29 percent), suggesting that perceptions about what the law includes can be shaped by partisanship.

In addition, 44 percent of the public say they have heard at least some about President Trump saying the federal government may stop making these payments, which experts say would likely cause insurers to raise premiums or stop offering coverage.

Figure 1: Half Unaware of ACA Cost-Sharing Reductions, Two in Ten Say They’ve Heard “A Lot” About It
Majority of Republicans Approve of President Trump’s Negotiating Tactics

President Trump recently said he may stop payments for the ACA’s cost-sharing reductions in order to get Democrats to start negotiating on a replacement for the 2010 health care law. The majority of the public (60 percent) thinks President Trump should not try to pass an ACA replacement plan using negotiating tactics like these that could disrupt insurance markets and cause people to lose health coverage. The majority of Democrats (82 percent) and independents (66 percent) think President Trump should not use these tactics, while, on the other hand, two-thirds of Republicans (67 percent) say President Trump should use whatever negotiating tactics necessary to win support for a replacement plan.

Figure 2: Views on Pres. Trump’s Use of Cost-Sharing Reductions as a Negotiation Tactic Vary by Party

Health Insurance Exchanges

Recently, some major health insurers have announced they are withdrawing from some ACA exchanges — marketplaces where people who do not have employer-sponsored health insurance can buy coverage. Slightly less than half of the public say they have been closely following news about health insurance companies’ decisions on whether or not to sell plans through the marketplaces – with about one in ten saying they have been following the news “very closely.”

Overall, the majority of the public say health insurance companies choosing not to sell insurance plans in certain marketplaces is a “big problem” across the country (65 percent) with an additional 21 percent saying it is a “small problem.” When asked about their local area, 43 percent say it is a “big problem” with another third saying it is a “small problem.” These perceptions are similar across parties.

Figure 3: Most Say Insurers Pulling Out of Marketplaces Is a Problem Across the Country and in Their Local Area

Majorities Say Uncertainty over ACA’s Future is Hurting Individuals Who Buy Their Own Health Insurance

A large share (70 percent), including majorities across parties, says that uncertainty around the future of the law is hurting the group that is most directly affected by the ACA – individuals who purchase their own health insurance. The public is less likely to say that the uncertainty is hurting insurance companies or them and their families.

Figure 4: More Americans Say Uncertainty Around Future of ACA Hurting Self-Purchasers than Insurers or Them Personally

The Public Thinks President Trump and Republicans Have Control Over Making the ACA Work or Fail

When asked how much control, if any, various groups have over whether the current health care law works or fails, large majorities of the public say Republicans in Congress and President Trump and his administration have at least some control. Eight in ten say Republicans in Congress have “a lot” or “some” control over whether the current health care works or fails – including half (47 percent) who say they have “a lot” of control. This is somewhat similar to the share (75 percent) who say President Trump and his administration have at least some control, including 43 percent who say he has “a lot” of control. Smaller shares say Democrats in Congress (56 percent), their own representatives in Congress (51 percent), and their state’s governor (48 percent) have at least some control.

Figure 5: Large Majorities Think Republicans in Congress and Pres. Trump Have Control Over Whether Health Care Law Works or Fails

The vast majority of Republicans (80 percent), Democrats (86 percent), and independents (82 percent) say Republicans in Congress have at least some control while fewer – across parties – say the same about Democrats in Congress (64 percent, 51 percent, and 57 percent, respectively).

Majorities Say President Trump and Republicans Should Make the Current Health Care Law Work, Are Responsible For It Going Forward

In addition to most of the public saying President Trump and Republicans have at least some control over the future of the ACA, three-fourths (74 percent) of the public think Trump and his administration should do what they can to make the current health care law work while one-fifth (19 percent) say President Trump and his administration should do what they can to make the ACA fail so they can replace it later.

Figure 6: Three-Quarters of the Public Says Pres. Trump & Administration Should Do What They Can to Make the ACA Work

Nine in ten Democrats (91 percent) and eight in ten independents (79 percent) say Trump and his administration should do what they can to make the law work as do half of Republicans. Among Trump supporters, more say Trump and his administration should do what they can to make the law work (53 percent) than say they should do what they can to make the law fail so they can replace it later (35 percent).

Figure 7: Most Including Trump Supporters Say Pres. Trump & Administration Should Do What They Can to Make Law Work

In addition, a majority (64 percent) of the public say that because President Trump and Republicans in Congress are now in control of the government, they are responsible for any problems with the ACA moving forward. About three in ten (28 percent) say that because President Obama and Democrats in Congress passed the law, they are responsible for any problems with it moving forward.

Figure 8: Majorities Across Parties Say Pres. Trump and Republicans Are Responsible for Any ACA Problems Moving Forward

Half of Republicans (53 percent) say President Trump and Republicans in Congress are now responsible for any problems with the ACA going forward, up significantly from 34 percent earlier this month.2  Large shares of Democrats and independents still say President Trump and Republicans in Congress are responsible for any problems with the law moving forward.

Figure 9: More Republicans Now Say Pres. Trump and Republicans in Congress Responsible for Any ACA Problems Moving Forward

Plans to Repeal and Replace the ACA

Since House Republicans pulled their replacement plan from a vote last month, plans to repeal and replace the Affordable Care Act have been on-again, off-again. More Americans want President Trump and Republican lawmakers to keep working on a plan to repeal and replace the ACA than want them to stop working on health care and move on to other priorities (51 percent vs. 43 percent).

Republicans and those who say they approve of President Trump are more likely to say they want President Trump and Republicans to keep working on a replacement plan (82 percent and 78 percent, respectively). On the other hand, Democrats and those who disapprove of President Trump are more likely to say they should stop working on health care and move on to other priorities (70 percent and 65 percent, respectively). Independents are divided, with similar shares saying Trump and Republicans should keep working on health care (48 percent) as say they should move on to other priorities (45 percent).

Figure 10: Somewhat More Say Pres. Trump & Republicans Should Keep Working to Repeal and Replace ACA than Say Move On

The Public Leans Favorable in Attitudes Towards the ACA

The public is more favorable than unfavorable in their views of the 2010 health care law this month with 48 percent expressing a favorable view compared to 41 percent expressing an unfavorable view. This split is largely partisan with seven in ten Republicans (72 percent) expressing an unfavorable view and three-fourths (73 percent) of Democrats expressing a favorable opinion of the law. A larger share of independents have a favorable view (48 percent) than an unfavorable view (37 percent).

Figure 11: Public Leans Favorable in Views of the Affordable Care Act

Lowering Costs for Individuals Is Public’s Top Health Care Priority for President Trump and Congress, Repealing ACA Ranks Lower

When asked about a series of health care priorities for President Trump and Congress to act on, about six in ten of the public say lowering the amount individuals pay for health care (63 percent) and lowering the cost of prescription drugs (60 percent) should each be a “top priority” for President Trump and Congress. This is followed by half who say dealing with the prescription painkiller addiction epidemic should be a “top priority.”

Despite the ongoing discussion about repealing the ACA, this falls much lower on the list of the public’s health care priorities, with 32 percent saying it should be a “top priority” for President Trump and Congress, similar to the shares who say decreasing the role of the federal government in health care (33 percent) and decreasing how much the federal government spends on health care over time (30 percent) should be top priorities. In fact, the share who say repealing the 2010 health care law should be a “top priority” has decreased from 37 percent in December 2016.3 

Figure 12: Lowering Out-of-Pocket Costs Is Top Health Care Priority

For Republicans, Repealing the ACA is Still Most Important Priority

When asked the “most important priority” for President Trump and Congress when it comes to health care, lowering the amount individuals pay for health care and lowering the cost of prescription drugs are most prioritized by the public – and by Democrats and independents. On the other hand, one-fourth of Republicans (27 percent) say repealing the 2010 health care law is the most important health care priority.

Table 1: Views of Most Important Health Care Priority by Party Identification
Percent who say each is the most important priority:TotalParty ID
DemocratsIndependentsRepublicans
Lowering the amount individuals pay for health care33%44%33%22%
Lowering the cost of prescription drugs19232015
Repealing the 2010 health care law113827
Dealing with the prescription painkiller addiction epidemic1013107
Decreasing the role of the federal government in health care92914
Decreasing how much the federal government spends on health care4345

Federal Budget Priorities: Health Care

With lawmakers debating spending priorities in advance of a key budget deadline, few Americans want to see the president and Congress decrease funding in a variety of different health areas. In fact, a majority of Americans want to see the president and Congress increase spending on veteran’s medical care (77 percent), medical research to find cures for major illnesses (58 percent), and Medicare (57 percent). The only health area that has a larger share of the public saying they want the president and Congress to decrease spending rather than increase spending is on efforts to improve health for people in developing countries, with one-third saying they want to see spending decreased in this area.

Figure 13: Few Say They Want Decreased Spending on Most Health Priorities

The Role of Planned Parenthood in the Federal Budget

One in five Americans (21 percent) say they want the president and Congress to decrease spending on reproductive health services, such as family planning and birth control for lower-income women. Some Republicans have proposed using the budget process to stop federal Medicaid payments to Planned Parenthood for the health care services they provide to low-income women. Overall, three-fourths (73 percent) of the public thinks federal Medicaid payments to Planned Parenthood should continue while 24 percent think that these payments should stop. When asked whether stopping these payments is so important that it would be worth shutting down the federal government, one in ten of the public overall say stopping these payments is that important.

Figure 14: Most Say Federal Medicaid Payments to Planned Parenthood Should Continue, Few Say Worth Shutting Down Federal Gov’t

Rx Drugs

This month’s tracking survey examines potential policy aimed at one of the public’s top health care priorities for President Trump and Congress: lowering the cost of prescription drugs. Six in ten Americans say lowering the cost of prescription drugs is a “top priority” for President Trump and Congress – including majorities of Democrats, Republicans, and independents.

Figure 1: Lowering the Cost of Prescription Drugs Is One of the Top Health Care Priorities Across Parties

Public Favors Variety of Policy Options to Keep Prescription Drug Costs Down

When presented with a list of policy options intended to help keep the cost of prescription drugs down, the majority of the public is in favor of most of the policy actions, with the vast majority favoring allowing the federal government to negotiate with drug companies to get a lower price on medications for people on Medicare (92 percent), making it easier for generic drugs to come to market (87 percent), and requiring drug companies to release information to the public on how they set drug prices (86 percent).

Figure 2: Most of the Public Favors Actions to Keep Drug Costs Down

A majority of Republicans, Democrats, and independents favor most of these policy actions with one exception – encouraging people to buy lower-cost drugs by requiring them to pay a higher share if they choose a similar, higher-cost drug, which is favored by less than half of Democrats.

Table 1: Views of Policy Actions to Keep Drug Costs Down by Party Identification
Percent who say they favor each of the following:Party ID
DemocratsIndependentsRepublicans
Allowing the federal government to negotiate with drug companies to get a lower price on medications for people on Medicare96%92%92%
Making it easier for generic drugs to come to market in order to increase competition and reduce costs.849191
Requiring drug companies to release information to the public on how they set their drug prices.848884
Limiting the amount drug companies can charge for high-cost drugs for illnesses like hepatitis or cancer787979
Creating an independent group that oversees the pricing of prescription drugs747471
Allowing Americans to buy prescription drugs imported from Canada667775
Allowing Americans to buy prescription drugs from online pharmacies based in Canada736859
Eliminating prescription drug advertisements595953
Encouraging people to buy lower-cost drugs by requiring them to pay a higher share if they choose a similar, higher cost drug406057
NOTE: Items were asked of separate half samples.

Importing Prescription Drugs from Canada

One policy proposal that has received recent attention is allowing Americans to buy prescription drugs imported from Canada or from online pharmacies based in Canada. The majority of the public think that both of these policy changes will make medicines more affordable without sacrificing safety or quality (76 percent say this about allowing Americans to buy prescription drugs imported from Canada, 68 percent say this about allowing Americans to buy prescription drugs from online pharmacies based in Canada). Fewer say either of these policy changes will expose Americans to unsafe medicines from other countries (35 percent and 39 percent, respectively) or lead U.S. drug companies to do less research and development (29 percent and 33 percent, respectively).

Figure 3: A Large Majority Agree Importing Canadian Prescription Drugs Would Make Medicines More Affordable

Marketplaces

Recently, some major health insurers have announced they are withdrawing from the ACA exchanges — marketplaces where people who do not have employer-sponsored health insurance can buy coverage. The late-April Kaiser Health Tracking Poll gauged the public’s awareness of and attitudes about the status of the health insurance marketplaces.

Visibility of News About Insurers Withdrawing from Marketplaces

Half of the public (47 percent) say they have been closely following news about health insurance companies’ decisions on whether or not to sell plans through the marketplaces – with about one in ten saying they are following the news “very closely.”

Figure 1: Half Say They Have Been Closely Following News of Insurance Companies’ Marketplace Decisions

Most See Insurer Withdrawals as a Big Problem Across the Country

Overall, nearly seven in ten (65 percent) say health insurance companies choosing not to sell insurance plans in certain marketplaces is a “big problem” across the country with an additional 21 percent saying it is a “small problem.” When asked about their local area, 43 percent say it is a “big problem,” with another one-third saying it is a “small problem.” These perceptions are similar across parties but there are differences depending on whether individuals are closely following news about health insurance companies’ decisions. Larger shares of those who are closely following the news say it is a “big problem” both across the country (78 percent vs. 54 percent) and in their local area (54 percent vs. 33 percent).

Figure 2: Those Following the News Say Insurers Pulling Out of Exchanges Is a Problem Across the Country and in their Local Area

Views of How Marketplaces are Working

Americans are divided on how well they think the health insurance marketplaces are working in their own state and in the nation, overall. About half (53 percent) of individuals say the health insurance marketplace in their own state is working well while about four in ten say it is working either “not too well” (25 percent) or “not at all well” (14 percent). This is slightly more positive than the rating given to health insurance marketplaces in the nation, overall, with nearly half saying the marketplaces in the nation overall are not working well.

Figure 3: Half Say Marketplaces Are Working Well in Their State; Fewer Say the Same of Marketplaces in the Nation, Overall

Differences in How Public Views Marketplace Functionality

In fact, the share who say the health insurance marketplaces are working well in their own state and in the nation, overall, has actually increased slightly since September 2016.4  But, like previous surveys, party identification as well as location still drive attitudes towards the health insurance marketplaces.

Overall, Democrats are more likely to say the marketplaces in their own state (66 percent) and in the nation overall (66 percent) are working well. And while a larger share of Republicans say the marketplaces in their own state are working well than say the same about in the nation, overall (41 percent v. 26 percent, respectively), the share who say they are working well is smaller than the share of independents and Democrats who say the same.

Figure 4: Democrats are More Positive in Views of How Well Marketplaces are Working

In addition, individuals living in states that have developed their own state-based marketplace are more likely to say the health insurance marketplace in their own state is working well Individuals living in states with state-based marketplaces are more positive in their evaluations with 65 percent saying the health insurance marketplace in their state is working either “very” or “somewhat” well. This is more positive than those living in states with a state-federal partnership (52 percent) but significantly more positive than those living in states that have not developed their own state-based marketplace and are using the federal marketplace (45 percent). These differences hold even when controlling for demographic factors that tend to predict support for the ACA (age, education level, party identification, gender, and race/ethnicity).

Figure 5: Assessment of How Well State Marketplaces Are Working Varies by State Marketplace Type

Methodology

This Kaiser Health Tracking Poll was designed and analyzed by public opinion researchers at the Kaiser Family Foundation (KFF). The survey was conducted April 17-23, 2017, among a nationally representative random digit dial telephone sample of 1,171 adults ages 18 and older, living in the United States, including Alaska and Hawaii (note: persons without a telephone could not be included in the random selection process). Computer-assisted telephone interviews conducted by landline (421) and cell phone (750, including 448 who had no landline telephone) were carried out in English and Spanish by Princeton Data Source under the direction of Princeton Survey Research Associates International (PSRAI). Both the random digit dial landline and cell phone samples were provided by Survey Sampling International, LLC. For the landline sample, respondents were selected by asking for the youngest adult male or female currently at home based on a random rotation. If no one of that gender was available, interviewers asked to speak with the youngest adult of the opposite gender. For the cell phone sample, interviews were conducted with the adult who answered the phone. KFF paid for all costs associated with the survey.

The combined landline and cell phone sample was weighted to balance the sample demographics to match estimates for the national population using data from the Census Bureau’s 2015 American Community Survey (ACS) on sex, age, education, race, Hispanic origin, and region along with data from the 2010 Census on population density. The sample was also weighted to match current patterns of telephone use using data from the January-June 2016 National Health Interview Survey. The weight takes into account the fact that respondents with both a landline and cell phone have a higher probability of selection in the combined sample and also adjusts for the household size for the landline sample. All statistical tests of significance account for the effect of weighting.

The margin of sampling error including the design effect for the full sample is plus or minus 3 percentage points. Numbers of respondents and margins of sampling error for key subgroups are shown in the table below. For results based on other subgroups, the margin of sampling error may be higher. Sample sizes and margins of sampling error for other subgroups are available by request. Note that sampling error is only one of many potential sources of error in this or any other public opinion poll. Kaiser Family Foundation public opinion and survey research is a charter member of the Transparency Initiative of the American Association for Public Opinion Research.

GroupN (unweighted)M.O.S.E.
Total1171±3 percentage points
Party Identification
   Democrats360±6 percentage points
   Republicans296±7 percentage points
   Independents396±6 percentage points
Trump Approval
   Approve of President Trump526±5 percentage points
   Disapprove of President Trump595±5 percentage points


Endnotes

  1. The Wall Street Journal, Trump threatens to withhold payments to insurers to press Democrats on health bill, April 2017.  https://www.wsj.com/articles/trump-threatens-to-withhold-payments-to-insurers-to-press-democrats-on-health-bill-1492029844 ↩︎
  2. A Kirzinger, B DiJulio, B Wu, M Brodie, Kaiser Health Tracking Poll – April 2017: The Fall of the AHCA and Next Steps for the ACA,  https://modern.kff.org/health-reform/poll-finding/kaiser-health-tracking-poll-april-2017-the-fall-of-the-ahca-and-next-steps-for-the-aca/ ↩︎
  3. A Kirzinger, B Wu, M Brodie, Kaiser Health Tracking Poll: Health Care Priorities for 2017,  https://modern.kff.org/health-costs/poll-finding/kaiser-health-tracking-poll-health-care-priorities-for-2017/   ↩︎
  4. A Kirzinger, B Wu, M Brodie. Kaiser Health Tracking Poll: September 2016 https://modern.kff.org/health-costs/report/kaiser-health-tracking-poll-september-2016/ ↩︎

The Role of Medicaid in Rural America

Authors: Julia Foutz, Samantha Artiga, and Rachel Garfield
Published: Apr 25, 2017

Issue Brief

Key Takeaways

This brief describes Medicaid’s role for 52 million nonelderly children and adults living in the most rural areas in the United States and discusses how expansions or reductions in Medicaid could affect rural areas. It shows:

  • Rural populations face significant challenges to their health care coverage and access. People who live in the most rural counties of America are spread across almost 2,500 counties that are heavily concentrated in the South and Midwest. Individuals living in rural areas are less likely to be employed and more likely to be low-income than individuals living in other areas. Individuals in rural areas also face significant barriers to accessing care, including provider shortages, recent closures of rural hospitals, and long travel distances to providers.
  • Medicaid plays a central role in helping to fill gaps in private coverage in rural areas. Although private insurance accounts for the largest share of health coverage in rural areas, nonelderly individuals in rural areas are less likely to have private coverage compared to those in urban and other areas (61% vs. 64% and 66%, respectively). Medicaid helps fill this gap in private coverage, covering nearly one in four (24%) nonelderly individuals in rural areas. Further, in many states, Medicaid coverage rates are higher in rural areas than in urban or other areas of the state. In some cases, these differences are large. For example, in California, the Medicaid coverage rate in rural areas is 16 percentage points higher than in urban areas, and Hawaii has a 13 percentage point difference between Medicaid coverage rates in rural and other areas. Similarly, rural areas in Arizona, Arkansas, and Florida have a Medicaid coverage rate that is about ten percentage points higher than the rate in urban or other areas.
  • The Affordable Care Act (ACA) Medicaid expansion led to coverage gains in rural areas. Prior to the ACA Medicaid expansion to low-income adults, rural areas in Medicaid expansion and non-expansion states had similar rates of Medicaid coverage. However, in rural areas that expanded Medicaid, the Medicaid coverage rate increased from 21% to 26% between 2013 and 2015, while it increased by just one percentage point, from 20% to 21%, in rural areas of non-expansion states. As a result, as of 2015, nonelderly individuals in rural areas within non-expansion states were nearly twice as likely to be uninsured as those living in expansion states (15% vs. 9%).

Additional action to expand Medicaid within the 19 states that have not yet adopted the Medicaid expansion would likely lead to further increases in coverage among individuals living in rural areas. These non-expansion states are home to 59% of nonelderly uninsured individuals living in rural areas. Conversely, cuts to Medicaid could disproportionately affect people living in rural areas given the large role of the program in these areas.

Introduction

People in rural areas face unique challenges in health care coverage and access, including low density of providers and longer travel times to care, limited access to employer-sponsored coverage, and greater health care needs due to older age and lower income. Medicaid plays an important role in helping to address these challenges. This brief provides insight into the role of Medicaid in rural areas and discusses how expansions or reductions in Medicaid such as those currently under debate could affect rural areas. The analysis is based on data from the 2013-2015 American Community Survey and classifies counties as “rural” based on an Index of Relative Rurality (IRR). We group counties into quintiles of rurality and define those with the highest degree of rurality as “rural,” those with the lowest degree as “urban,” and those in the middle as “other.” While Medicaid provides assistance to many low-income elderly individuals, primarily as a wrap-around benefit to Medicare, this analysis focuses on its role in covering nonelderly children and adults. The analysis shows that Medicaid plays a particularly important role providing coverage in rural areas and that gains in Medicaid coverage have helped reduce the uninsured rate in rural areas. More detail on the methods underlying the analysis is available in the “methods” box at the end of the brief.

Where is Rural America and Who Lives There?

The nearly 20% of the nonelderly population, or 52 million people, who live in the most rural counties of America are spread across almost 2,500 counties that are heavily concentrated in the South and Midwest (Click here for a county level map). In contrast, the 20% of the nonelderly population (or 55 million people) who live in the most urban counties of America are spread across fewer than 70 counties that are heavily concentrated in the Northeast. Rurality varies widely by state (Figure 1 and Appendix Table 1). By the definition used in this brief, states such as Montana, North Dakota, and Wyoming are entirely rural, whereas states such as Connecticut, New York, and the District of Columbia have little to no rural area. In 11 states, more than half of the nonelderly population resides in a rural area (Montana, North Dakota, Wyoming, South Dakota, Vermont, New Mexico, Mississippi, Alaska, Iowa, Idaho, and Arkansas).

Figure 1: Share of Nonelderly Population in Rural Area by State, 2015

People living in rural areas are more likely to be older, White, and have lower levels of education compared to people living in other areas. A greater share of people living in rural areas are ages 65 and older than in urban and other areas (data not shown);1  however, there are not large differences in the age distribution of nonelderly individuals living in rural areas compared to those in urban and other areas (Appendix Table 2). Fewer than one quarter of individuals living in rural areas are people of color, compared to over half of people living in urban areas and four in ten people living in other areas (Figure 2). Similar to other areas of the US, nearly nine in ten people living in rural areas have at least a high school diploma or GED. However, fewer than two in ten people in rural areas have a Bachelor’s degree or higher, compared to nearly four in ten people in urban areas and three and ten people living in other areas of the US (Figure 3).

Figure 2: Race/Ethnicity Among the Nonelderly by Geographic Area, 2015
Figure 3: Education Among Nonelderly Adults by Geographic Area, 2015

People living in rural areas are less likely to be in the labor force, more likely to have a disability, and more likely to be low-income than people living in other areas (Figure 4). A smaller share of nonelderly adults in rural areas are working than in urban and other areas (70% vs. 74% and 73%, respectively). Further, nonelderly adults living in rural areas are significantly more likely to have a disability (14%) than those in urban and other areas (9% and 10%, respectively; Figure 4). Reflecting their lower employment rate, nonelderly individuals living in rural areas are more likely than those in other areas to be low-income (below 200% of the federal poverty level or $40,320 per year for a family of three in 2017).

Figure 4: Employment Status, Income, and Disability by Geographic Area, 2015

Rural populations face longstanding and significant disparities in their health and access to health care. Previous research has shown that rural residents are more likely to report poorer physical and mental health and have higher rates of cigarette smoking, obesity, and physical inactivity compared to their urban counterparts.2  In addition, people living in rural areas face significant barriers to accessing care, including provider shortages, recent closures of rural hospitals, and high travel distances to providers.3 

What role does Medicaid play in rural America?

Medicaid plays a central role helping to fill gaps in private coverage in rural areas. Private insurance accounts for the largest share of health coverage among individuals in rural areas. However, nonelderly individuals in rural areas have a lower rate of private coverage compared to those in urban and other areas, reflecting greater employment in jobs that do not offer employer-sponsored health insurance4  and the lower labor force participation rate in rural areas (Figure 5). Medicaid helps fill this gap in private coverage, covering nearly one in four (24%) nonelderly individuals in rural areas, compared to 22% in urban areas and 21% in other areas. However, Medicaid coverage does not fully offset the gap in private coverage. As such, rural areas have a slightly higher nonelderly uninsured rate (12%) compared to urban (11%) and other areas (10%).

Figure 5: Health Coverage Among the Nonelderly by Geographic Area, 2015

Within states, Medicaid generally plays a larger role in rural areas of the state compared to other areas. Medicaid coverage rates are higher in rural areas than in urban areas in 12 of the 19 states with both rural and urban areas (Appendix Table 3). Similarly, rural areas have a higher Medicaid coverage rate than other areas in 41 of the 43 states with both rural and other areas. In some states, the Medicaid coverage rate in rural areas is much higher than other areas. Figure 6 shows the six states with the largest differences in Medicaid coverage rates between rural and urban or other areas. For example, in California, the Medicaid coverage rate in rural areas is 16 percentage points higher compared to urban areas and in Hawaii there is a 13 percentage point difference between Medicaid coverage in rural and other areas. Similarly, in Arizona, Arkansas, and Florida, rural areas have a Medicaid coverage rate that is about ten percentage points higher than urban or other areas or the state.

Figure 6: Medicaid Coverage Rates Among the Nonelderly by Geographic Area, Selected States, 2015

How did Medicaid coverage in rural areas change under the ACA?

The share of people living in rural areas who are covered by Medicaid has grown under the ACA, corresponding with reductions in the uninsured rate. Rural areas experienced growth in Medicaid and private coverage that was similar to urban and other areas. In rural areas, the share of people with Medicaid and private coverage increased from 21% to 24% and 58% to 61% between 2013 and 2015, resulting in a decrease in the uninsured rate from 17% to 12%. Similarly, in urban and other areas, Medicaid and private coverage rates increased by 3 percentage points and uninsured rates decreased by 5 and 6 percentage points, respectively (Figure 7).

Figure 7: Health Coverage Among the Nonelderly by Geographic Area, 2013-2015

Rural areas in states that implemented the ACA Medicaid expansion to low-income adults experienced larger gains in coverage than those in non-expansion states. Prior to the ACA coverage expansion, which was implemented in 2014, rural areas in Medicaid expansion and non-expansion states had similar rates of Medicaid coverage. However, rural areas in non-expansion states had a lower rate of private coverage, which contributed to a higher uninsured rate for rural areas in non-expansion states (Figure 8). In rural areas, the Medicaid coverage rate in expansion states increased from 21% to 26% between 2013 and 2015, while it rose just one percentage point, from 20% to 21%, in non-expansion states. Reflecting the larger gains in Medicaid coverage in expansion states, the uninsured rate in rural areas within expansion states fell by nearly half from 16% to 9%. This reduction was nearly twice as large as the reduction in rural areas of non-expansion states. As a result, as of 2015, nonelderly individuals in rural areas within non-expansion states were nearly twice as likely to be uninsured as those within expansion states (15% vs. 9%).

Figure 8: Health Coverage Among the Nonelderly in Rural Areas by State Medicaid Expansion Status, 2013-2015

Looking Ahead

These data illustrate that Medicaid plays a particularly important role in the most rural communities within our nation. This analysis shows that Medicaid helps fill gaps in private coverage within rural areas, helping to reduce disparities in coverage between rural areas and the rest of the nation. Medicaid coverage has grown in rural areas under the ACA, helping to reduce uninsured rates. However, states that expanded Medicaid experienced larger coverage gains than non-expansion states, leaving individuals in rural areas in non-expansion states nearly twice as likely to be uninsured as those in expansion states.

Further action among states to implement the ACA Medicaid expansion to low-income adults could lead to additional coverage gains in rural areas. As of April 2017, 19 states have not yet adopted the Medicaid expansion to low-income adults. These non-expansion states are home to 59% of nonelderly uninsured individuals living in rural areas. Additional action to expand Medicaid within these states would likely lead to increased coverage among individuals living in rural areas. In the four states (Kansas, Maine, North Carolina, and Virginia) that have had recent legislative activity related to implementing the expansion,5  nearly a quarter or more nonelderly individuals live in rural areas.

Reductions in Medicaid could disproportionately affect individuals living in rural America. If federal funding for Medicaid is reduced through elimination of enhanced funding for the ACA Medicaid expansion or limits on funding for the broader program, states would likely need to increase state spending to maintain coverage or make program cutbacks that would reduce eligibility, benefits, or provider payments. Given the larger role Medicaid plays for individuals in rural areas compared to other areas, individuals in these areas would likely be disproportionately impacted by coverage losses as well as reduced benefits and increased premiums and cost sharing. Further, analysis shows that high poverty states and states in the South, which include many rural areas, would be disproportionately impacted by reductions in federal Medicaid funds and face the highest increases in state spending to maintain coverage amid federal reductions. Reductions in Medicaid coverage would also increase demands on safety net providers, including community health centers and public hospitals. At the same time, the loss of federal Medicaid revenues would increase fiscal strains on these providers who already face a range of challenges that have contributed to increases in closures among rural hospitals in recent years.6 

Methods

This brief is based on analysis of American Community Survey (ACS) data from 2013-2015. In this brief, rural areas are defined using the 2010 Index of Relative Rurality (IRR) measure, which is a continuous measure of a county’s degree of rurality based on population size, population density, extent of urbanized area, and distance to the nearest metro area.7  For this analysis the IRR is divided into five equally weighted population quintiles based off ACS weighted data. County level data for ACS was obtained by using a public use microdata area (PUMA) code to county crosswalk based on the 2010 Census definition.8  Although the IRR determines the degree of a county’s rurality and not if a county is rural or urban, throughout this brief, the population quintile with the highest degree of rurality is referred to as “rural,” and the population quintile with the lowest degree of rurality is referred to as “urban.” The remaining three population quintiles are referred to as “other.” While the elderly population is included in the assignment of rurality, they are excluded from the remainder of the analysis, as our focus is Medicaid’s role as a health insurer for children and non-elderly adults.

Appendix

Appendix Table 1: Nonelderly Population by Geographic Area, 2015
 % in Rural Areas% in Urban Areas% in Other Areas
United States19%20%60%
Alabama34%0%66%
Alaska59%0%41%
Arizona17%0%83%
Arkansas51%0%49%
California3%10%86%
Colorado19%13%68%
Connecticut0%51%49%
Delaware0%0%100%
DC0%100%0%
Florida5%4%91%
Georgia22%37%40%
Hawaii18%0%70%
Idaho52%0%48%
Illinois15%54%31%
Indiana30%15%56%
Iowa52%0%48%
Kansas46%0%54%
Kentucky49%17%34%
Louisiana33%0%67%
Maine45%0%55%
Maryland4%11%85%
Massachusetts1%46%53%
Michigan21%18%61%
Minnesota34%33%33%
Mississippi60%0%40%
Missouri35%22%43%
Montana100%0%0%
Nebraska44%0%56%
Nevada9%0%91%
New Hampshire25%0%75%
New Jersey0%43%57%
New Mexico67%0%33%
New York10%51%39%
North Carolina22%11%67%
North Dakota100%0%0%
Ohio20%29%51%
Oklahoma47%0%53%
Oregon32%0%68%
Pennsylvania12%33%55%
Rhode Island0%0%100%
South Carolina24%0%76%
South Dakota78%0%22%
Tennessee30%0%70%
Texas15%34%51%
Utah24%0%76%
Vermont73%0%27%
Virginia23%34%43%
Washington16%0%84%
West Virginia46%0%54%
Wisconsin33%17%49%
Wyoming100%0%0%
NOTES: Includes nonelderly individuals ages 0-64. Totals may not sum to 100% due to rounding. Totals for Hawaii do not sum to 100% because FIPS county codes 15005 and 15009 are not assigned an IRR; population in geographic area is N/A.

SOURCE: Kaiser Family Foundation analysis based on the 2015 American Community Survey 1-Year Estimates.

Appendix Figure 1: Share of Nonelderly Population in Rural Area by State, 2015
Appendix Table 2: Demographics by Geographic Area, 2015
RuralUrbanOther
Mean Index of Relative Rurality, 20100.510.130.34
Nonelderly (0-64)
Age30%28%29%
   0-18 30%28%29%
   19-3424%28%26%
   35-5430%31%31%
   55-6417%14%15%
Sex
   Male50%49%50%
   Female50%51%50%
Race/Ethnicity
   Non-Hispanic White76%45%58%
   Non-Hispanic Black8%21%11%
   Hispanic10%22%21%
   Non-Hispanic Other Race5%12%9%
Citizenship
   Citizen96%79%86%
   Naturalized Citizen1%9%6%
   Non-Citizen3%12%8%
Poverty
   <100% FPL18%16%15%
   100-199% FPL20%17%17%
   200-399% FPL32%26%29%
   400% FPL28%40%38%
Census Region
   Northeast8%35%14%
   Midwest31%26%16%
   South42%31%38%
   West19%7%31%
Nonelderly Adults (19-64)
Education
   Less than High School11%12%11%
   High School Diploma or GED34%23%25%
   Some College36%28%34%
   Bachelor’s Degree or Higher19%37%30%
Work Status
   Working70%74%73%
   Unemployed4%5%5%
   Not in Labor Force26%21%22%
Disability
   With Disability14%9%10%
   Without Disability86%91%90%
NOTES: People of Hispanic origin may be of any race but are categorized as Hispanic for this analysis; all other racial groups are non-Hispanic. Disability includes limitation in vision, hearing, mobility, cognitive functioning, self-care, and/or independent living.

SOURCE: Kaiser Family Foundation analysis of the 2015 American Community Survey 1-Year Estimates.

Appendix Table 3: Health Coverage Among the Nonelderly Population by Geographic Area, 2015
MedicaidOther PublicPrivateUninsured
Rural UrbanOtherRuralUrbanOtherRuralUrbanOtherRuralUrbanOther
United States24%22%21%4%2%3%61%64%66%12%11%10%
 Implemented Medicaid Expansion- Democratic/Independent Governor
California37%21%28%3%1%3%49%69%60%11%9%10%
Colorado26%23%18%4%2%5%57%62%70%12%13%8%
ConnecticutN/A21%20%N/A1%2%N/A69%73%N/A9%5%
DelawareN/AN/A23%N/AN/A3%N/AN/A67%N/AN/A6%
DCN/A26%N/AN/A2%N/AN/A68%N/AN/A4%N/A
Hawaii28%N/A15%3%N/A12%64%N/A69%5%N/A4%
Louisiana25%N/A23%4%N/A4%55%N/A60%16%N/A13%
Minnesota22%21%15%2%1%1%70%72%79%5%6%4%
Montana17%N/AN/A4%N/AN/A66%N/AN/A14%N/AN/A
New York26%31%21%4%1%2%63%58%71%7%10%6%
Oregon31%N/A24%3%N/A2%56%N/A66%9%N/A8%
Pennsylvania22%22%18%3%2%2%67%69%73%8%8%7%
Rhode IslandN/AN/A24%N/AN/A2%N/AN/A68%N/AN/A6%
Washington30%N/A21%4%N/A4%56%N/A68%10%N/A7%
West Virginia32%N/A28%4%N/A4%57%N/A62%7%N/A6%
Alaska19%N/A20%8%N/A9%55%N/A60%19%N/A11%
 Implemented Medicaid Expansion- Republican Governor
Arizona32%N/A22%5%N/A3%48%N/A62%15%N/A13%
Arkansas33%N/A23%4%N/A4%52%N/A62%11%N/A11%
Illinois25%22%20%2%2%2%67%67%71%6%10%6%
Indiana17%26%17%3%3%3%69%58%70%11%14%11%
Iowa20%N/A18%2%N/A2%72%N/A74%6%N/A6%
Kentucky32%24%23%6%2%4%54%67%67%8%6%7%
Maryland25%34%16%3%3%4%66%53%73%6%9%7%
Massachusetts24%21%28%1%1%2%71%75%67%4%3%3%
Michigan25%37%21%3%2%2%64%53%71%8%8%6%
Nevada21%N/A20%3%N/A4%65%N/A62%11%N/A14%
New Hampshire17%N/A12%3%N/A3%69%N/A78%11%N/A7%
New JerseyN/A19%18%N/A1%2%N/A68%72%N/A13%8%
New Mexico36%N/A32%4%N/A5%47%N/A52%13%N/A11%
North Dakota11%N/AN/A4%N/AN/A76%N/AN/A9%N/AN/A
Ohio24%24%22%3%2%3%65%66%68%8%8%7%
Vermont29%N/A21%2%N/A2%63%N/A74%6%N/A4%
 Has Not Implemented Medicaid Expansion- Democratic Governor
North Carolina24%16%19%5%2%6%56%69%63%15%13%12%
Virginia17%12%11%5%8%9%66%69%71%12%11%9%
 Has Not Implemented Medicaid Expansion- Republican Governor
Alabama24%N/A20%5%N/A4%58%N/A64%13%N/A12%
Florida27%17%20%5%4%4%50%64%60%18%14%16%
Georgia24%16%17%5%2%6%53%66%62%18%16%14%
Idaho19%N/A17%3%N/A3%64%N/A68%14%N/A12%
Kansas14%N/A14%6%N/A2%69%N/A73%10%N/A11%
Maine25%N/A16%4%N/A3%59%N/A71%12%N/A9%
Mississippi29%N/A23%4%N/A6%52%N/A57%15%N/A14%
Missouri19%15%13%7%2%3%60%74%73%14%9%10%
Nebraska13%N/A13%2%N/A4%74%N/A75%10%N/A8%
Oklahoma21%N/A17%5%N/A5%57%N/A63%17%N/A15%
South Carolina27%N/A19%5%N/A5%55%N/A64%13%N/A12%
South Dakota15%N/A12%5%N/A2%66%N/A75%14%N/A11%
Tennessee26%N/A19%5%N/A4%57%N/A64%12%N/A12%
Texas19%20%16%4%2%4%57%58%62%21%21%17%
Utah13%N/A11%2%N/A2%71%N/A76%14%N/A11%
Wisconsin18%30%14%2%2%2%73%60%78%7%9%6%
Wyoming12%N/AN/A4%N/AN/A71%N/AN/A12%N/AN/A
NOTES: Includes nonelderly individuals ages 0-64. Totals may not sum to 100% due to rounding. Other Public includes Medicare, military, and Veterans Administration coverage. MT and LA adopted Medicaid expansion in 2016. N/A indicates lack of geographic area in state.

SOURCE: Kaiser Family Foundation analysis based on the 2015 American Community Survey 1-Year Estimates.

Endnotes

  1. Kaiser Family Foundation analysis of 2015 American Community Survey 1-Year Estimates. ↩︎
  2. Michael Meit et al., The 2014 Update of the Rural-Urban Chartbook, (Bethesda, MD: The North Dakota and NORC Rural Health Reform Policy Research Center, October 2014), https://ruralhealth.und.edu/projects/health-reform-policy-research-center/pdf/2014-rural-urban-chartbook-update.pdf. ↩︎
  3. Jane Wishner et al., A look at Rural Hospital Closures and Implications for Access to Care: Three Case Studies, (Washington, DC: Kaiser Commission on Medicaid and the Uninsured, July 2016), https://modern.kff.org/medicaid/issue-brief/a-look-at-rural-hospital-closures-and-implications-for-access-to-care/. ↩︎
  4. Kaiser Family Foundation analysis of 2015 American Community Survey 1-Year Estimates. ↩︎
  5. https://modern.kff.org/medicaid/slide/state-medicaid-expansion-approaches/ ↩︎
  6. Jane Wishner et al., A look at Rural Hospital Closures and Implications for Access to Care: Three Case Studies, (Washington, DC: Kaiser Commission on Medicaid and the Uninsured, July 2016), https://modern.kff.org/medicaid/issue-brief/a-look-at-rural-hospital-closures-and-implications-for-access-to-care/. ↩︎
  7. Brigitte Waldorf and Ayoung Kim, Defining and Measuring Rurality in the US: From Typologies to Continuous Indices, (West Lafayette, IN: Purdue University, Department of Agricultural Economics, April 2015), http://sites.nationalacademies.org/cs/groups/dbassesite/documents/webpage/dbasse_168031.pdf. ↩︎
  8. Missouri Census Data Center Geographic Correspondence Engine, http://mcdc.missouri.edu/websas/geocorr12.html. ↩︎