2019 Employer Health Benefits Survey
Abstract
This annual survey of employers provides a detailed look at trends in employer-sponsored health coverage, including premiums, employee contributions, cost-sharing provisions, offer rates, wellness programs, and employer practices. The 2019 survey included 2,012 interviews with nonfederal public and private firms.
Annual premiums for employer sponsored family health coverage reached $20,576 this year, up 5% from last year, with workers on average paying $6,015 toward the cost of their coverage. The average deductible among covered workers in a plan with a general annual deductible is $1,655 for single coverage. Fifty-six percent of small firms and 99% of large firms offer health benefits to at least some of their workers, for an overall offer rate of 57%.
Survey results are released in several formats, including a full report with downloadable tables on a variety of topics, a summary of findings, and an article published in the journal Health Affairs.
NEWS RELEASE
- A news release announcing the publication of the 2019 Employer Health Benefits Survey is available here.
SUMMARY OF FINDINGS
- The Summary of Findings provides an overview of the 2019 survey results and is available in the Summary of Findings section.
FULL REPORT
- The complete Employer Health Benefits Survey report includes over 200 exhibits and is available under the Report. The “Report” section contains 14 separate sections. Users can view each section separately or download the section exhibits from the right side of the respective section page.
HEALTH AFFAIRS
- The peer-reviewed journal Health Affairs has published an article with key findings from the 2019 survey: Health Benefits In 2019: Premiums Inch Higher, Employers Respond to Federal Policy.
RELATED
- This related analysis includes an overview of the various network configuration strategies employers are implementing and offers a deeper understanding of the successes, barriers, and trade-offs firms have experienced in their network decision-making.
WEB BRIEFING
- On Wednesday, Sept. 25, 2019, the Kaiser Family Foundation held a reporters-only web briefing to release the 2019 Employer Health Benefits Survey.
INTERACTIVE GRAPHIC
- This graphing tool allows users to look at changes in premiums and worker contributions for covered workers at different types of firms over time: Premiums and Worker Contributions Among Workers Covered by Employer-Sponsored Coverage, 1999-2019.
KEY EXHIBITS-CHARTPACK
- Over twenty overview slides from the 2019 Employer Health Benefits Survey are available as a slideshow.
ADDITIONAL RESOURCES
- Standard errors for selected estimates are available in the Technical Supplement here.
- Employer Health Benefits Surveys from 1998–2018 are available here. Please note that historic survey reports have not been revised with methodological changes.
- Researchers may request a public use dataset by going to Contact Us and choosing “TOPIC: Health Costs.”
Researchers at the Kaiser Family Foundation and NORC at the University of Chicago designed and analyzed the survey.
Summary Of Findings
Employer-sponsored insurance covers over half of the non-elderly population; approximately 153 million nonelderly people in total.1 To provide current information about employer-sponsored health benefits, the Kaiser Family Foundation (KFF) conducts an annual survey of private and non-federal public employers with three or more workers. This is the twenty-first survey and reflects employer-sponsored health benefits in 2019.
HEALTH INSURANCE PREMIUMS AND WORKER CONTRIBUTIONS
The average annual premiums for employer-sponsored health insurance in 2019 are $7,188 for single coverage and $20,576 for family coverage [Figure B]. The average single premium increased 4% and the average family premium increased 5% over the past year. Workers’ wages increased 3.4% and inflation increased 2%.2
The average premium for family coverage has increased 22% over the last five years and 54% over the last ten years, significantly more than either workers’ wages or inflation [Figure A].
As we generally see, the average premiums for covered workers in high-deductible health plans with a savings option (HDHP/SOs) are considerably lower than the overall average for all plan types for both single and family coverage, at $6,412 and $18,980, respectively [Figure B]. Covered workers in firms with a relatively large share of lower-wage workers (where at least 35% of workers earn $25,000 a year or less) have lower average premiums for both single and family coverage than covered workers in firms with a smaller share, likely because their plans are less comprehensive. Covered workers at private for-profit firms have lower average premiums than covered workers at not-for-profit or publicly owned firms for both single and family coverage.
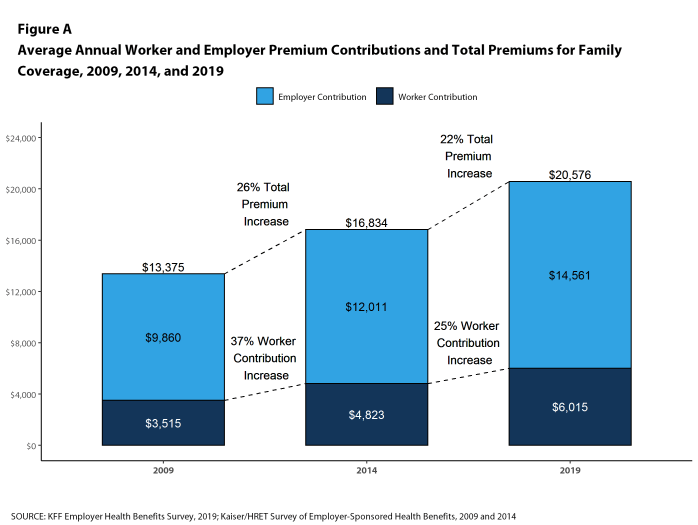
Figure A: Average Annual Worker and Employer Premium Contributions and Total Premiums for Family Coverage, 2009, 2014, and 2019
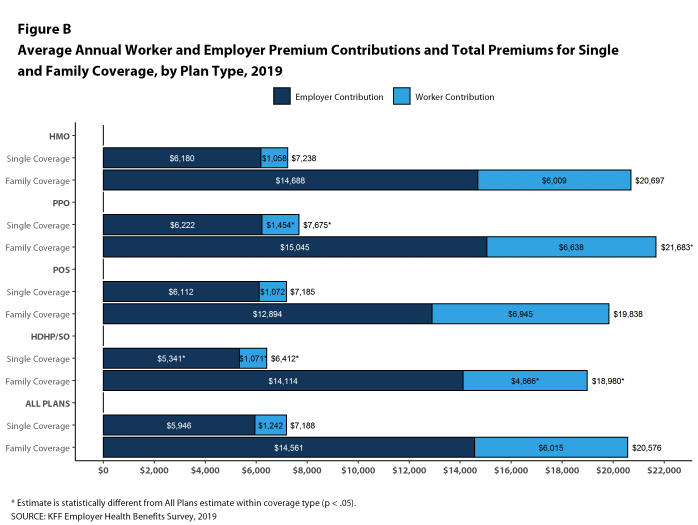
Figure B: Average Annual Worker and Employer Premium Contributions and Total Premiums for Single and Family Coverage, by Plan Type, 2019
Most covered workers make a contribution toward the cost of the premium for their coverage. On average, covered workers contribute 18% of the premium for single coverage and 30% of the premium for family coverage. Compared to covered workers in large firms, covered workers in small firms on average contribute a lower percentage of the premium for single coverage (16% vs. 19%) and a higher percentage of the premium for family coverage than workers in large firms (40% vs. 26%). Covered workers in firms with a relatively large share of lower-wage workers have higher average contribution rates for family coverage (41% vs. 30%) than those in firms with a smaller share of lower-wage workers.3 Covered workers at private for-profit firms on average contribute a higher percentage of the premium for both single and family coverage than covered workers at other firms for both single and family coverage.
Thirty-one percent of covered workers in small firms are in a plan where the employer pays the entire premium for single coverage, compared to only 5% of covered workers in large firms. In contrast, 35% of covered workers in small firms are in a plan where they must contribute more than one-half of the premium for family coverage, compared to 6% of covered workers in large firms [Figure D].
The average annual dollar amounts contributed by covered workers for 2019 are $1,242 for single coverage and $6,015 for family coverage. The average dollar contribution for family coverage has increased 25% since 2014 and 71% since 2009 [Figure A]. Average contribution amounts for covered workers in HDHP/SOs are lower than the average overall contribution amounts for both single and family coverage [Figure B]. Nine percent of covered workers, including 24% of covered workers in small firms, are in a plan with a worker contribution of $12,000 or more for family coverage.
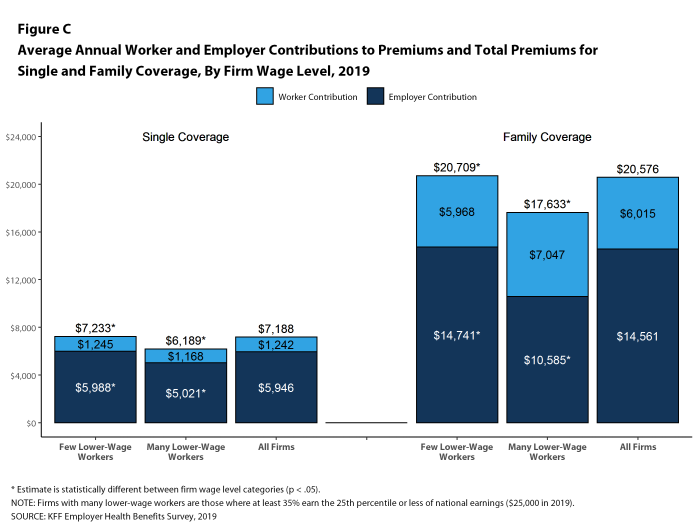
Figure C: Average Annual Worker and Employer Contributions to Premiums and Total Premiums for Single and Family Coverage, by Firm Wage Level, 2019
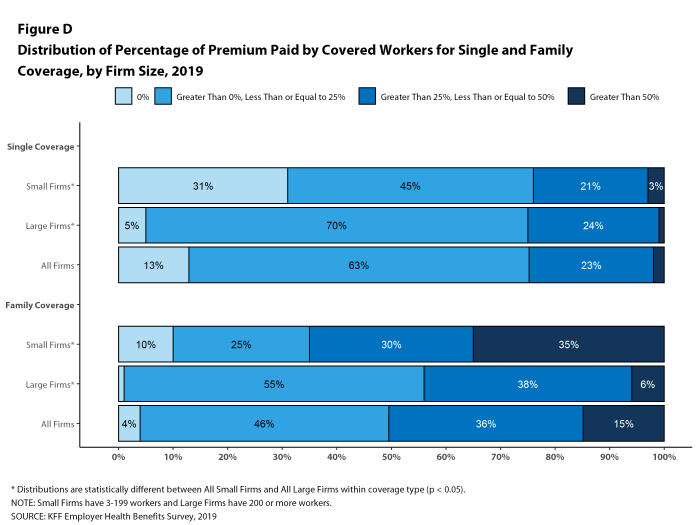
Figure D: Distribution of Percentage of Premium Paid by Covered Workers for Single and Family Coverage, by Firm Size, 2019
PLAN ENROLLMENT
PPOs continue to be the most common plan type, enrolling 44% of covered workers in 2019. Thirty percent of covered workers are enrolled in a high-deductible plan with a savings option (HDHP/SO), 19% in an HMO, 7% in a POS plan, and 1% in a conventional (also known as an indemnity) plan [Figure E].
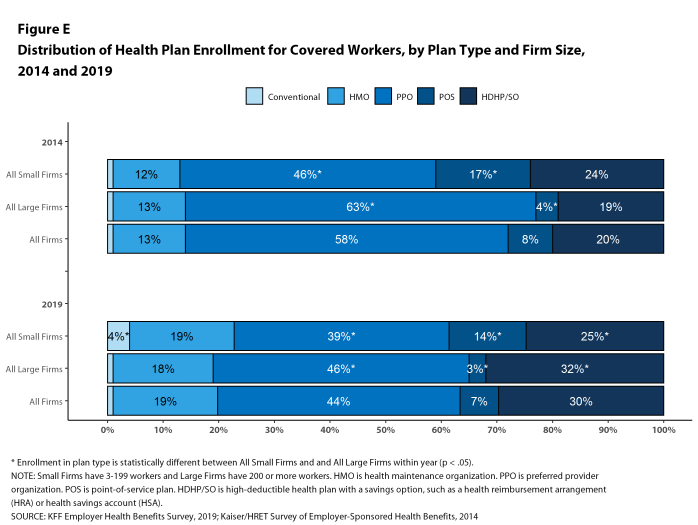
Figure E: Distribution of Health Plan Enrollment for Covered Workers, by Plan Type and Firm Size, 2014 and 2019
Self-Funding. Sixty-one percent of covered workers, including 17% of covered workers in small firms and 80% in large firms, are enrolled in plans that are either partially or completely self-funded.
Seven percent of small firms report that they have a level-funded plan. These arrangements combine a relatively small self-funded component with stoploss insurance with low attachment points that may transfer a substantial share of the risk to insurers. These arrangements are complex and some small employers may not be entirely certain about the funding status of their plans.
EMPLOYEE COST SHARING
Most covered workers must pay a share of the cost when they use health care services. Eighty-two percent of covered workers have a general annual deductible for single coverage that must be met before most services are paid for by the plan.
Among covered workers with a general annual deductible, the average deductible amount for single coverage is $1,655, similar to the average deductible last year. The average deductible for covered workers is higher in small firms than large firms ($2,271 vs. $1,412). The average annual deductible among covered workers with a deductible has increased 36% over the last five years and 100% over the last ten years.
Deductibles have increased in recent years due to higher deductibles within plan types and higher enrollment in HDHP/SOs. While growing deductibles in PPOs and other plan types generally increase enrollee out-of-pocket liability, the shift to enrollment in HDHP/SOs does not necessarily do so because many HDHP/SO enrollees receive an account contribution from their employers. Twenty-one percent of covered workers in an HDHP with a Health Reimbursement Arrangement (HRA), and 2% of covered workers in a Health Savings Account (HSA)-qualified HDHP receive an account contribution for single coverage at least equal to their deductible, while another 22% of covered workers in an HDHP with an HRA and 23% of covered workers in an HSA-qualified HDHP receive account contributions that, if applied to their deductible, would reduce their actual liability to less than $1,000.
The 2019 value is 41% higher than the average general annual deductible of $989 in 2014 and 162% higher than the average general annual deductible of $533 in 2009.
Another way to look at deductibles is the percentage of all covered workers who are in a plan with a deductible that exceeds certain thresholds. Over the past five years, the percentage of covered workers with a general annual deductible of $2,000 or more for single coverage has grown from 18% to 28% [Figure F].
A large share of covered workers also pay a portion of the cost when they visit an in-network physician. Most covered workers face a copayment (a fixed dollar amount) when they visit a doctor, although some workers face coinsurance requirements (a percentage of the covered amount). The average copayments are $25 for primary care and $40 for specialty care. The average coinsurance rates are 18% for primary care and 19% for specialty care. These amounts are similar to those in 2018.
Most workers also face additional cost sharing for a hospital admission or outpatient surgery. Sixty-six percent of covered workers have coinsurance and 14% have a copayment for hospital admissions. The average coinsurance rate for a hospital admission is 20% and the average copayment is $326 per hospital admission. The cost-sharing provisions for outpatient surgery follow a similar pattern to those for hospital admissions.
Almost all (99%) covered workers are in plans with a limit on in-network cost sharing (called an out-of-pocket maximum) for single coverage, though the limits vary significantly. Among covered workers in plans with an out-of-pocket maximum for single coverage, 12% are in a plan with an out-of-pocket maximum of less than $2,000, while 20% are in a plan with an out-of-pocket maximum of $6,000 or more.
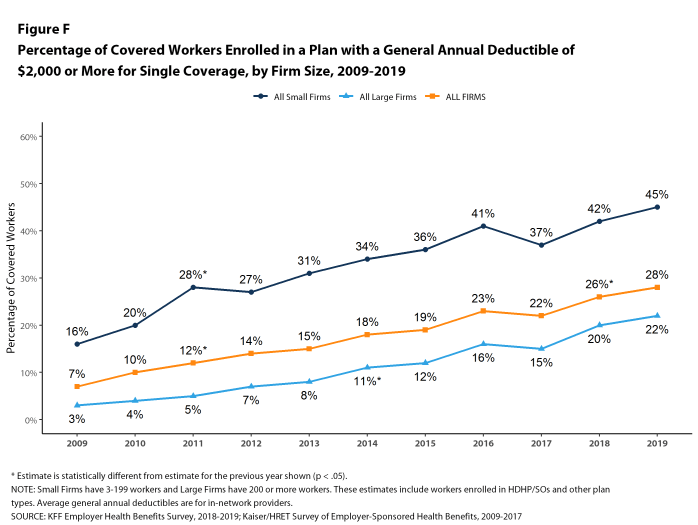
Figure F: Percentage of Covered Workers Enrolled in a Plan With a General Annual Deductible of $2,000 or More for Single Coverage, by Firm Size, 2009-2019
AVAILABILITY OF EMPLOYER-SPONSORED COVERAGE
Fifty-seven percent of firms offer health benefits to at least some of their workers, similar to the percentage last year [Figure G]. The likelihood of offering health benefits differs significantly by firm size; only 47% of firms with 3 to 9 workers offer coverage, while virtually all firms with 1,000 or more workers offer coverage.
While the vast majority of firms are small, most workers work for large firms that offer coverage. In 2019, 90% of workers are employed by a firm that offers health benefits to at least some of its workers.
Although the vast majority of workers are employed by firms that offer health benefits, many workers are not covered at their job. Some are not eligible to enroll (e.g., waiting periods or part-time or temporary work status) and others who are eligible choose not to enroll (e.g., they feel the coverage is too expensive or they are covered through another source). In firms that offer coverage, 80% of workers are eligible for the health benefits offered, and of those eligible, 76% take up the firm’s offer, resulting in 61% of workers in offering firms enrolling in coverage through their employer. All of these percentages are similar to 2018.
Looking at workers in both firms that offer and firms that do not offer health benefits, 55% of workers are covered by health plans offered by their employer, similar to the percentage last year.
Repeal of the Individual Mandate Beginning in 2019, there is no penalty for individuals who do not maintain health insurance, sometimes called the Individual Mandate. Among firms offering health benefits with at least 50 employees, 9% say that they believed the repeal of the penalty reduced the percentage of employees and dependents that elected the firm’s coverage in 2019. We did not, however, observe a change in the takeup rate for workers offered coverage at their job since last year.
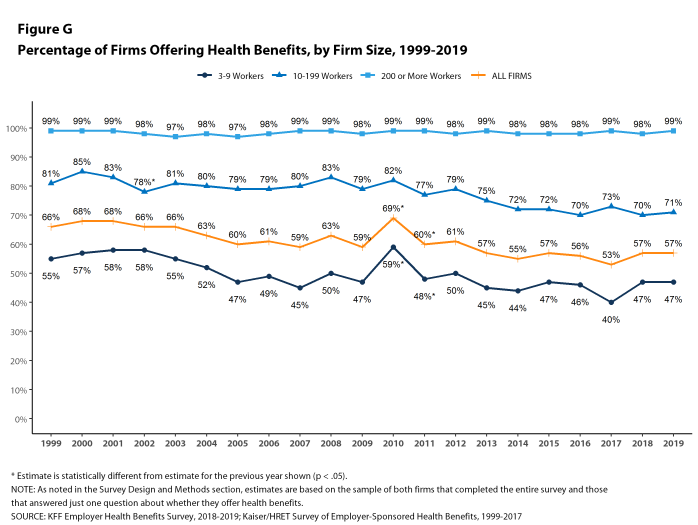
Figure G: Percentage of Firms Offering Health Benefits, by Firm Size, 1999-2019
HEALTH AND WELLNESS PROGRAMS
Most large firms and many small firms have programs that help workers identify health issues and manage chronic conditions, including health risk assessments, biometric screenings, and health promotion programs.
Health Risk Assessments. Among firms offering health benefits, 41% of small firms and 65% of large firms provide workers the opportunity to complete a health risk assessment. A health risk assessment includes questions about a person’s medical history, health status, and lifestyle. Fifty percent of large firms with a health risk assessment program offer an incentive to encourage workers to complete the assessment. Incentives may include: gift cards, merchandise or similar rewards; lower premium contributions or cost sharing; and financial rewards, such as cash, contributions to health-related savings accounts, or avoiding a payroll fee.
Biometric Screenings. Among firms offering health benefits, 26% of small firms and 52% of large firms provide workers the opportunity to complete a biometric screening. A biometric screening is an in-person health examination that measures a person’s risk factors, such as body mass index (BMI), cholesterol, blood pressure, stress, and nutrition. Fifty-eight percent of large firms with biometric screening programs offer workers an incentive to complete the screening, similar to the incentives for completing health risk assessments.
Additionally, among large firms with biometric screening programs, 14% reward or penalize workers based on achieving specified biometric outcomes (such as meeting a target BMI). The size of these incentives varies considerably: among large firms offering a reward or penalty for meeting biometric outcomes, the maximum reward is valued at $150 or less in 17% of firms and more than $1,000 in 11% of firms.
Health and Wellness Promotion Programs. Most firms offering health benefits offer programs to help workers identify and address health risks and unhealthy behaviors. Fifty percent of small firms and 84% of large firms offer a program in at least one of these areas: smoking cessation, weight management, and behavioral or lifestyle coaching. Among large firms offering at least one of these programs, 41% offer workers an incentive to participate in or complete the program.
As health screenings and wellness programs have become more complex, incentives have become more sophisticated and may involve participating in or meeting goals in different programs. We asked firms that had incentives for any of these programs to estimate the maximum incentive for a worker across all of their screening and promotion programs combined. Among large firms with any type of incentive, 16% have a maximum incentive of $150 or less, while 20% have a maximum incentive of more than $1,000.
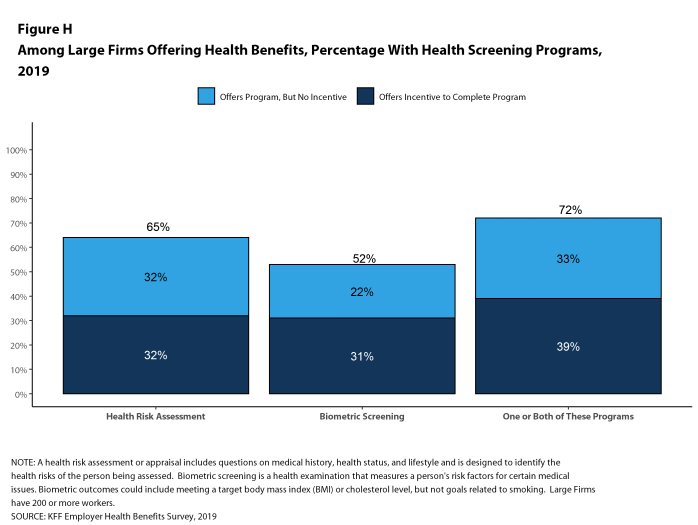
Figure H: Among Large Firms Offering Health Benefits, Percentage With Health Screening Programs, 2019
SITES OF CARE
Telemedicine. Sixty-nine percent of firms with 50 or more workers offering health benefits cover the provision of health care services through telemedicine in their largest health plan [Figure I]. Telemedicine is the delivery of health care services through telecommunications to a patient from a provider who is at a remote location, including video chat and remote monitoring. Firms with 5,000 or more workers are more likely to cover services provided through telemedicine than smaller firms.
Retail Health Clinics. Seventy-seven percent of large firms offering health benefits cover health care services received in retail clinics, such as those located in pharmacies, supermarkets and retail stores, in their largest health plan [Figure I]. These clinics are often staffed by nurse practitioners or physician assistants and treat minor illnesses and provide preventive services.
On-Site and Near-Site Health Clinics 19% of large firms offering health benefits, including 36% of firms with 5,000 or more employees, have a health clinic for their employees at or near one or more of their major locations. A large share of these firms report that employees can receive treatment for non-work-related illnesses at their on-site clinics.
PROVIDER NETWORKS
Firms and health plans can structure their networks of providers and their cost sharing to encourage enrollees to use providers who are lower cost or who provide better care. Periodically we ask employers about network strategies, such as using tiered or narrow networks. For 2019, as part of our partnership with the Peterson Center on Healthcare, we added questions about additional network strategies and about employer satisfaction with the options available to them.
Satisfaction with Network Choices Among employers offering health benefits, 42% of firms report being ‘very satisfied’ and 42% report being ‘satisfied’ by the choice of provider networks available to them. They are somewhat less satisfied with the cost of the provider networks available to them, however. Only 11% of these firms report being ‘very satisfied’ while 46% report being ‘satisfied’ with the cost of provider networks available to them. Large firms are more likely than small firms to be very satisfied with the cost of available provider networks, while small firms are more likely to be ‘dissatisfied’ or ‘very dissatisfied’ with the cost of the provider networks available to them.
When asked to identify the most important factor they use to assess provider networks, employers are fairly evenly divided, with 30% of employers identifying the number and convenience of providers as most important, 33% identifying the cost of providers as most important, and 36% identifying the quality of providers as most important.
Narrow Networks Among employers offering health benefits, 55% say that the network for their plan with the largest enrollment is ‘very broad’, 37% say it is ‘somewhat broad’, and 7% say it is ‘somewhat narrow’. When asked how much cost savings the firm would need to realize to shift any of their health plans to narrower networks, a significant share of employers (39%) say that they would not reduce network size for cost savings, 25% say that they would need to realize savings of more than 30%, and 11% say that they would need to realize savings of between 20% and 30%. When employers were asked to identify the biggest obstacle adopting a narrower network plan or plans, 28% cite employee considerations, such as disruption of provider relationships or employee backlash, 14% cite concerns about access or convenience for employees, 9% say that they are in a rural area and/or there was a lack of providers, 11% say that their employees are spread out over a large area, and 12% cite concerns about the cost or quality of care.
Tiered or High-Performance Networks Fourteen percent of firms with 50 or more workers that offer health benefits include a high-performance or tiered provider network in their health plan with the largest enrollment, similar to the percentage last year. A tiered or high-performance network typically groups providers in the network based on the cost, quality and/or efficiency of the care they deliver and uses financial incentives to encourage enrollees to use providers on the preferred tier.
Direct Contracting Some employers also contract directly with certain health plans or health systems, outside of their established provider networks, to treat patients with specified conditions. Among large employers with at least one self-funded health plan, 8% have such an arrangement.
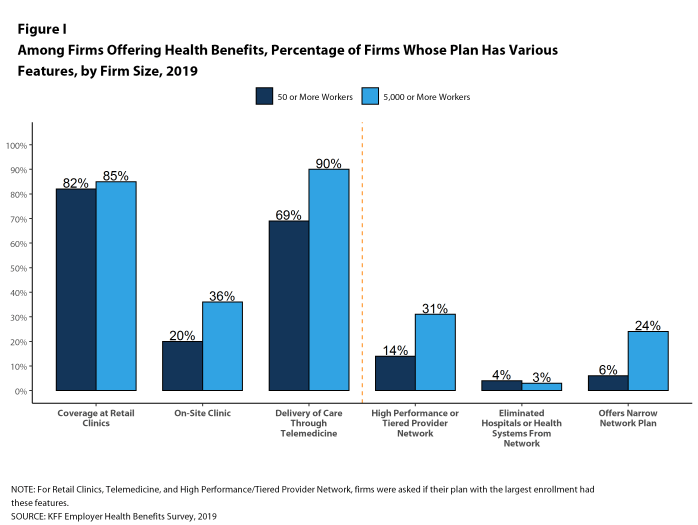
Figure I: Among Firms Offering Health Benefits, Percentage of Firms Whose Plan Has Various Features, by Firm Size, 2019
EXCISE TAX ON HIGH COST HEALTH PLANS
The high-cost plan tax, sometimes called the “Cadillac Tax”, is an excise tax on health benefit plans with premiums and other costs that exceed specified thresholds. The tax was scheduled to take effect in 2018, but its effective date has been delayed several times, and recently a bill passed the House that would repeal the provision entirely.4 Only 16% of firms offering health benefits with 50 or more employees say they expect the high-cost plan tax to take effect as scheduled, 52% say it will not take effect as scheduled, and 31% say they do not know. Thirty-three percent of offering firms say that the upcoming high-cost plan tax was ‘very important’ or ‘somewhat important’ when making health benefit decisions for 2019, while 62% say that was ‘not too important’ or ‘not important at all.’ A recent Kaiser Family Foundation analysis finds that at least one in five employers would be affected by the tax if it takes effect in 2022 unless they make changes to lower plan costs.5
PRESCRIPTION DRUG PRACTICE
The cost of prescription drugs is one of the largest challenges facing employers and families. Recent policy options have focused on the complexity involving the delivery and pricing of prescription drugs and the lack of transparency about the true price for individual prescriptions. In particular, policy makers have focused on rebate payments from pharmaceutical manufacturers to payers and intermediaries as obscuring true costs. Payers have also raised questions about discount coupons and other patient assistance that manufacturers provide to patients which reduce patient cost sharing and mute financial incentives in payer formularies to encourage patients to use lower-priced alternatives.
Among employers offering health benefits with 1,000 or more employees, 27% say that they receive ‘most’ of the prescription drug rebate negotiated by their PBM or health plan, 32% say that they receive ‘some’ of the negotiated rebate, 18% say that they receive ‘very little’ of the negotiated rebate, and 23% do not know. When asked about discount coupons and patient assistance programs, only 7% say they believe that they have a ‘substantial impact’ on the cost of their health plans, 33% say that have ‘some impact’ on plan costs, 34% say that they have ‘little impact’ on plan costs, 9% say that they have ‘no impact’ on plans costs, while 17% do not know.
DISCUSSION
Trends in the market for employer-based coverage have been moderate for several years now. Premiums go up each year, but in the low to mid-single digits, which seems tame for those who remember the much higher increases in the early 2000’s and periods before. Cost sharing, particularly deductibles, has increased meaningfully over time, but the largest percentage increases were now a few years ago. New ideas and new approaches – things like narrow networks, value-based pricing, telemedicine, direct contracting – are tried and sometimes gradually implemented, but with modest impact on the basic structure of the market or the overall cost of coverage. Even though actual cost levels are quite high (the average family premium exceeds $20,000 for a family of four), an expanding economy and historically low underlying health care cost growth appear to have dampened any impatience for big changes, although predicted economic slowing over the next couple of years could push employers to consider more significant actions.
One thing that is new this year is the context: the public debate over expanding Medicare or creating public program options is raising questions about the performance of employer-based coverage that are rarely triggered when looking only at annual performance. In particular, those suggesting a bigger role for public programs raise issues about the cost and affordability of health care for the society overall and for individuals and families. Although premium growth has been low, it still exceeds inflation, and the prices employer plans pay for care are rising faster than either Medicare or Medicaid. One side of the coin calls this a cost shift from public plans to private payers; the other side suggests a lack of any real cost-control efforts in private plans. Negotiating lower prices means that plans have to be willing to tell higher-priced providers they cannot be in the network, but as the survey findings show, narrowing networks is both unpopular with employers and, due to dispersed workforces and rural challenges, impractical for many. Other than increasing cost-sharing, this is the most (and maybe only) powerful cost-reducing tool that private plans have, but it is rarely employed.
How to best assure affordable access to care for individuals and families is really the main theme in the debate about public plan options, and our polling suggests this issue raises important questions about the adequacy of employer-based plans. In a recent survey conducted by KFF and the LA Times, 40 percent of non-elderly adults with employer-based coverage said that they or a family member had difficulty affording health insurance or health care or had problems paying medical bills.6 Roughly one-in-two said that they or a family member had skipped or postponed getting health care or prescriptions in the past 12 months due to costs. Among those with employer-based coverage who say that someone under the plan has a chronic health condition, roughly three in five say they are confident that they have enough money or health insurance to afford the cost of a major illness; this percentage falls to just one-in-three for those in plans with the highest deductibles ($3,000 for single coverage; $5,000 or more for family coverage).
This survey shows other affordability issues as well, particularly for some identifiable groups. Covered workers in small firms face relatively high deductibles for single coverage and a meaningful share face substantial premium contributions if they choose family coverage. Covered workers in firms with large shares of lower-wage workers on average face higher deductibles for single coverage and must contribute a greater share of the premium for family coverage than workers in firms with a smaller share of lower-wage workers. When people talk about the 153 million people with employer-based coverage they often gloss over the very real cost differences for different groups of workers across the marketplace.
Regardless of its outcome, the national debate about expanding Medicare or creating public program options provides an opportunity to step back and evaluate how well employer-based coverage is doing in achieving national goals relating to costs and affordability. In doing so, it will be important to look past averages and examine how well the market serves the many different types of employers and working families in the many different circumstances that they face.
METHODOLOGY
The Kaiser Family Foundation 2019 Employer Health Benefits Survey reports findings from a telephone survey of 2,012 randomly selected non-federal public and private employers with three or more workers. Researchers at NORC at the University of Chicago and the Kaiser Family Foundation designed and analyzed the survey. National Research, LLC conducted the fieldwork between January and July 2019. In 2019, the overall response rate is 27%, which includes firms that offer and do not offer health benefits. Among firms that offer health benefits, the survey’s response rate is 26%. To improve estimates for small firms, the 2018 survey had a significantly larger sample than in previous years; the increased sample size led to both more firms completing the survey and a lower response rate than in years past. Unless otherwise noted, differences referred to in the text and figures use the 0.05 confidence level as the threshold for significance. Values below 3% are not shown on graphical figures to improve the readability of those graphs. Some distributions may not sum due to rounding. In 2019, we modified our weighting methodology by no longer using a non-response adjustment; this change had the largest impact on the offer rate but had a negligible effect on most statistics.
For more information on the survey methodology, please visit the Survey Design and Methods section at http://ehbs.kff.org/.
Filling the need for trusted information on national health issues, the Kaiser Family Foundation is a nonprofit organization based in San Francisco, California.
- Kaiser Family Foundation. The Uninsured and the ACA: A Primer: Supplemental Tables. 2019 Jan (cited 2019 Aug 16). https://www.kff.org/uninsured/report/the-uninsured-and-the-aca-a-primer-key-facts-about-health-insurance-and-the-uninsured-amidst-changes-to-the-affordable-care-act/. See Table 1: 267.5 million nonelderly people, 57.1% of whom are covered by employer-sponsored insurance.↩
- Bureau of Labor Statistics. Consumer Price Index – All Urban Consumers (April to April – not seasonally adjusted): Department of Labor; 2019. https://beta.bls.gov/dataViewer/view/timeseries/CUUR0000SA0. Wage data are from the Bureau of Labor Statistics and based on the change in total average hourly earnings of production and nonsupervisory employees. Employment, hours, and earnings from the Current Employment Statistics survey: Department of Labor; 2019. https://beta.bls.gov/dataViewer/view/timeseries/CES0500000008↩
- This threshold is based on the twenty-fifth percentile of workers’ earnings. Bureau of Labor Statistics. May 2018 National Occupational Employment and Wage Estimates: United States. Washington (DC): BLS. Available from: http://www.bls.gov/oes/current/oes_nat.htm↩
- Middle Class Health Benefits Tax Repeal Act, H.R. 748, 116th Cong. (2019)↩
- Rae, Matthew; Claxton, Gary; Levitt, Larry. “How Many Employers Could Be Affected by the High-Cost Plan Tax” Kaiser Family Foundation. July 12, 2019. https://www.kff.org/private-insurance/issue-brief/how-many-employers-could-be-affected-by-the-high-cost-plan-tax/↩
- Hamel, Liz; Munana, Cailey and Brodie, Mollyann. “Kaiser Family Foundation/LA Times Survey Of Adults With Employer-Sponsored Insurance.” Kaiser Family Foundation. May 2, 2019. https://www.kff.org/report-section/kaiser-family-foundation-la-times-survey-of-adults-with-employer-sponsored-insurance-section-2-affordability-of-health-care-and-insurance/↩
Survey Design And Methods
The Kaiser Family Foundation (KFF) has conducted this annual survey of employer-sponsored health benefits since 1999. KFF works with NORC at the University of Chicago (NORC) and National Research, LLC (NR) to field and analyze the survey. From January to July 2019, NR completed computer-assisted telephone interviews with human resource and benefits managers at 2,012 firms.
SURVEY TOPICS
The survey includes questions on the cost of health insurance, health benefit offer rates, coverage, eligibility, plan type enrollment, premium contributions, employee cost sharing, prescription drug benefits, retiree health benefits, and wellness benefits.
Firms that offer health benefits are asked about the plan attributes of their largest health maintenance organization (HMO), preferred provider organization (PPO), point-of-service (POS) plan, and high-deductible health plan with a savings option (HDHP/SO).7 We treat exclusive provider organizations (EPOs) and HMOs as one plan type and conventional (or indemnity) plans as PPOs. The survey defines an HMO as a plan that does not cover nonemergency out-of-network services. PPOs and POS plans have lower cost sharing for in-network services than HMOs do. POS plans use a primary care gatekeeper to screen for specialist and hospital visits. HDHP/SOs were defined as plans with a deductible of at least $1,000 for single coverage and $2,000 for family coverage and that either offer a health reimbursement arrangement (HRA) or are eligible for a health savings account (HSA).
Throughout this report, we use the term “in-network” to refer to services received from a preferred provider. Definitions of the health plan types are available in Section 4, and a detailed explanation of the HDHP/SO plan type is in Section 8.
To reduce survey burden, some questions on worker cost sharing for hospitalization, outpatient surgery and prescription drugs were only asked about the firm’s largest plan type
Firms with 50 or more workers were asked: “Does your firm offer health benefits for current employees through a private or corporate exchange?” Employers were still asked for plan information about their HMO, PPO, POS and HDHP/SO plan regardless of whether they purchased health benefits through a private exchange or not.
Firms are asked about the attributes of their current plans during the interview. While the survey’s fielding period begins in January, many respondents may have a plan whose 2019 plan year lags behind the calendar year [Figure M.1]. In some cases, plans may report the attributes of their 2018 plans and some plan attributes (such as HSA deductible limits) may not meet the calendar year regulatory requirements.
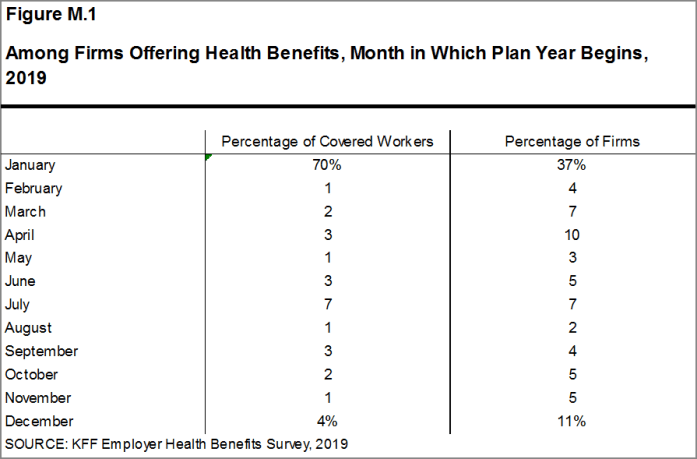
Figure M.1: Among Firms Offering Health Benefits, Month in Which Plan Year Begins, 2019
SAMPLE DESIGN
The sample for the annual Kaiser Employer Health Benefits Survey includes private firms and nonfederal government employers with three or more employees. The universe is defined by the U.S. Census’ 2015 Statistics of U.S. Businesses (SUSB) for private firms and the 2012 Census of Governments (COG) for non-federal public employers. At the time of the sample design (December 2018), these data represented the most current information on the number of public and private firms nationwide with three or more workers. As in the past, the post-stratification is based on the most up-to-date Census data available (the 2016 SUSB). We determine the sample size based on the number of firms needed to ensure a target number of completes in six size categories.
We attempted to repeat interviews with prior years’ survey respondents (with at least ten employees) who participated in either the 2017 or the 2018 survey, or both. Firms with 3-9 employees are not included in the panel to minimize the potential of panel effects. As a result, 1,445 of the 2,012 firms that completed the full survey also participated in either the 2017 or 2018 surveys, or both. In total, 329 firms participated in 2017, 157 firms participated in 2018, and 959 firms participated in both 2017 and 2018. Non-panel firms are randomly selected within size and industry groups.
Since 2010, the sample has been drawn from a Dynata list (based on census assembled by Dun and Bradstreet) of the nation’s private employers and the COG for public employers. To increase precision, we stratified the sample by ten industry categories and six size categories. The federal government and business with fewer than three employees are not included. Education is a separate category for the purposes of sampling, and included in Service category for weighting. For information on changes to the sampling methods over time, please consult the Survey Design and Methods Sections of prior Employer Health Benefits Surveys as well as extended methods at http://ehbs.kff.org/
Each year, we conduct a series of checks on our instrument to confirm the accuracy of data collection, including test interviews prior to the official launch. Beginning in 2019, we included firms with at least ten employees that had completed a pre-test during the prior year’s survey in the current year’s sample. Firms eligible to complete pre-testing had been sampled from the same two universe datasets as the main non-panel sample, differing only by when they made contact with the interview team. We expect to continue including these firms completing an interview during the pre-testing phase of our survey, and believe they will improve our response rate without adding any bias to our data collection effort.
RESPONSE RATE
Response rates are calculated using a CASRO method, which accounts for firms that are determined to be ineligible in its calculation. The overall response rate is 27% [Figure M.2].8 The response rate for panel firms is higher than the response rate for non-panel firms [Figure M.2]. Similar to other employer and household surveys, the Employer Health Benefits Survey has seen a general decrease in response rates over time. Since 2017, we have attempted to increase the number of completes by increasing the number of non-panel firms in the sample. While this generally increases the precision of estimates by ensuring a sufficient number of respondents in various sub-groups, it has the effect of reducing the overall response rate.
The vast majority of questions are asked only of firms that offer health benefits. A total of 1,668 of the 2,012 responding firms indicated they offered health benefits. The response rate for firms that offer health benefits is also 26%.
We asked one question of all firms in the study with which we made phone contact but where the firm declined to participate: “Does your company offer a health insurance program as a benefit to any of your employees?”. A total of 4,395 firms responded to this question (including 2,012 who responded to the full survey and 2,383 who responded to this one question). These responses are included in our estimates of the percentage of firms offering health benefits.9 The response rate for this question is 58% [Figure M.2].
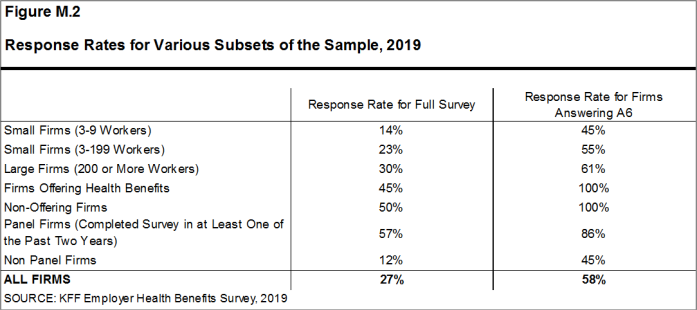
Figure M.2: Response Rates for Various Subsets of the Sample, 2019
While response rates have decreased, elements of the survey design limit the potential impact of a response bias. First, most major statistics are weighted by the percentage of covered workers at a firm. The percentage of the population whose employers completed the full survey has not decreased with response rates. The most important statistic that is weighted by the number of employers is the offer rate; firms that do not complete the full survey are asked whether their firm offers health benefits to any employees. As noted this question relies on a wider set of respondents than just those completing the full survey.
FIRM SIZES AND KEY DEFINITIONS
Throughout the report, we report data by size of firm, region, and industry. Unless otherwise specified, firm size definitions are as follows: small firms: 3-199 workers; and large firms: 200 or more workers. [Figure M.3] shows selected characteristics of the survey sample. A firm’s primary industry classification is determined from Dynata’s designation on the sampling frame and is based on the U.S. Census Bureau’s North American Industry Classification System (NAICS), [Figure M.4]. A firm’s ownership category and other firm characteristics such as the firm’s wage level and the age of the work force are based on respondents’ answers. While there is considerable overlap in firms in the “State/Local Government” industry category and those in the “public” ownership category, they are not identical. For example, public school districts are included in the service industry even though they are publicly owned. Family coverage is defined as health coverage for a family of four.
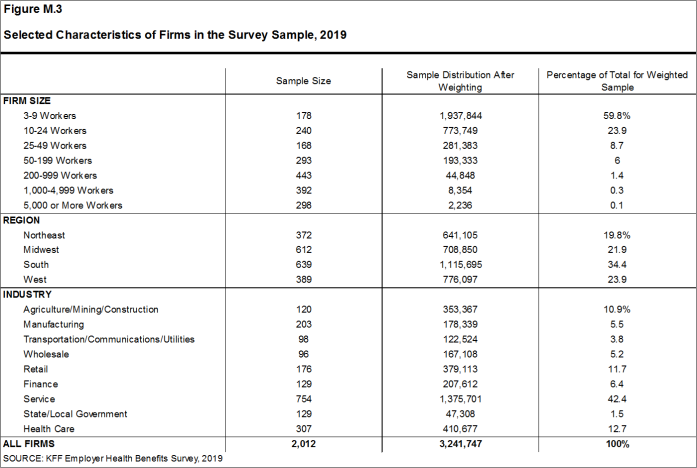
Figure M.3: Selected Characteristics of Firms in the Survey Sample, 2019
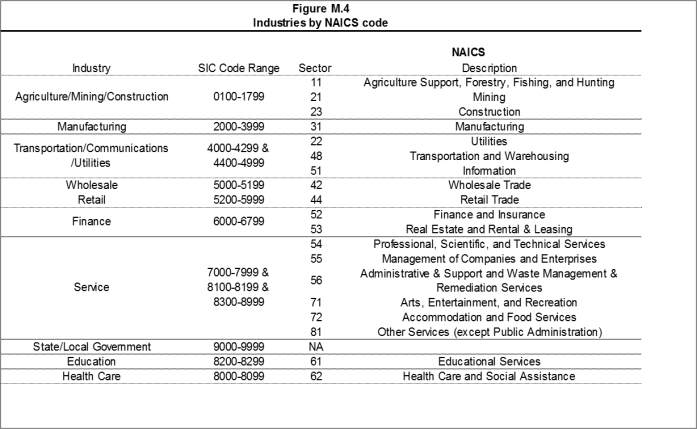
Figure M.4: Industries by NAICS code
[Figure M.5] presents the breakdown of states into regions and is based on the U.S Census Bureau’s categorizations. State-level data are not reported both because the sample size is insufficient in many states and we only collect information on a firm’s primary location rather than where all workers may actually be employed. Some mid- and large-size employers have employees in more than one state, so the location of the headquarters may not match the location of the plan for which we collected premium information.
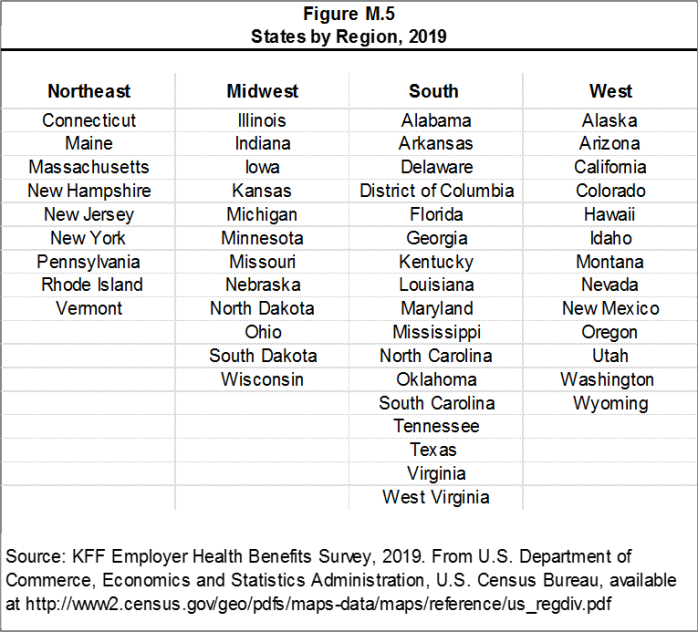
Figure M.5: States by Region, 2019
[Figure M.6] displays the distribution of the nation’s firms, workers, and covered workers (employees receiving coverage from their employer). Among the three million firms nationally, approximately 59.8% employ 3 to 9 workers; such firms employ 7.5% of workers, and 4.1% of workers covered by health insurance. In contrast, less than one percent of firms employ 5,000 or more workers; these firms employ 36.2% of workers and 38.3% of covered workers. Therefore, the smallest firms dominate any statistics weighted by the number of employers. For this reason, most statistics about firms are broken out by size categories. In contrast, firms with 1,000 or more workers are the most influential employer group in calculating statistics regarding covered workers, since they employ the largest percentage of the nation’s workforce. Statistics among small firms and those weighted by the number of firms tend to have more variability.
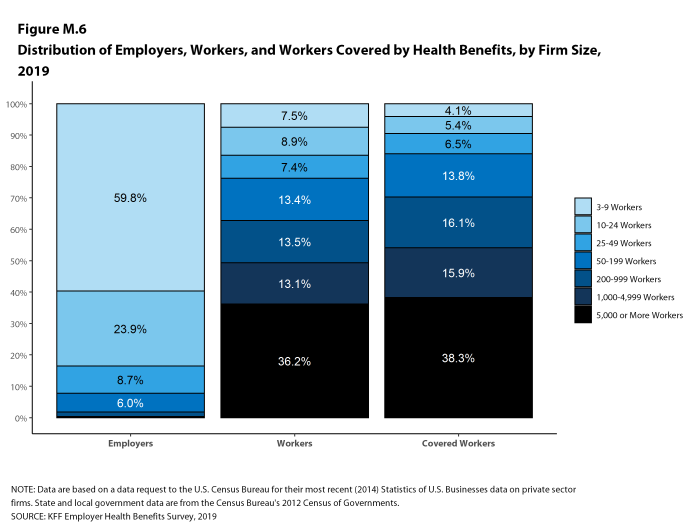
Figure M.6: Distribution of Employers, Workers, and Workers Covered by Health Benefits, by Firm Size, 2019
The survey asks firms what percentage of their employees earn more or less than a specified amount in order to identify the portion of a firm’s workforce that has relatively lower or higher wages. This year, the income threshold is $25,000 or less per year for lower-wage workers and $63,000 or more for higher-wage workers. These thresholds are based on the 25th and 75th percentile of workers’ earnings as reported by the Bureau of Labor Statistics using data from the Occupational Employment Statistics (OES) (2018).10 The cutoffs were inflation-adjusted and rounded to the nearest thousand.
ROUNDING AND IMPUTATION
Some figures in the report do not sum to totals due to rounding. Although overall totals and totals for size and industry are statistically valid, some breakdowns may not be available due to limited sample sizes or high relative standard errors. Where the unweighted sample size is fewer than 30 observations, figures include the notation “NSD” (Not Sufficient Data). Estimates with high relative standard errors are reviewed and in some cases not published. Many breakouts by subsets may have a large standard error, meaning that even large differences between estimates are not statistically different. Values below 3% are not shown on graphical figures to improve the readability of those graphs. The underlying data for all estimates presented in graphs are available in the Excel documents accompanying each section on http://www.kff.org/ehbs.
To control for item nonresponse bias, we impute values that are missing for most variables in the survey. On average, 5% of observations are imputed. All variables are imputed following a hotdeck approach. The hotdeck approach replaces missing information with observed values from a firm similar in size and industry to the firm for which data are missing. In 2019, there were seven variables where the imputation rate exceeded 20%; most of these cases were for individual plan level statistics. When aggregate variables were constructed for all of the plans, the imputation rate is usually much lower. There are a few variables that we have decided not to impute; these are typically variables where “don’t know” is considered a valid response option. Some variables are imputed based on their relationship to each other. For example, if a firm provided a worker contribution for family coverage but no premium information, a ratio between the family premium and family contribution was imputed and then the family premium was calculated. We estimate separate single and family coverage premiums for firms that provide premium amounts as the average cost for all covered workers.
To ensure data accuracy we have several processes to review outliers and illogical responses. Every year several hundred firms are called back to confirm or correct responses. In some cases, answers are edited based on responses to open-ended questions or based on established logic rules.
Annual inflation estimates are calculated from April to April. The 12 month percentage change for this period was 2.0%.11 Data presented is nominal unless indicated specifically otherwise.
WEIGHTING
Because we select firms randomly, it is possible through the use of weights to extrapolate the results to national (as well as firm size, regional, and industry) averages. These weights allow us to present findings based on the number of workers covered by health plans, the number of total workers, and the number of firms. In general, findings in dollar amounts (such as premiums, worker contributions, and cost sharing) are weighted by covered workers. Other estimates, such as the offer rate, are weighted by firms.
Calculation of the weights follows a common approach. The employer weight was determined by calculating the firm’s probability of selection. This weight was trimmed of overly influential weights and calibrated to U.S. Census Bureau’s 2016 Statistics of U.S. Businesses for firms in the private sector, and the 2012 Census of Governments totals. The worker weight was calculated by multiplying the employer weight by the number of workers at the firm and then following the same weight adjustment process described above. The covered-worker weight and the plan-specific weights were calculated by multiplying the percentage of workers enrolled in each of the plan types by the firm’s worker weight. These weights allow analyses of all workers covered by health benefits and of workers in a particular type of health plan.
The trimming procedure follows the following steps: First, we grouped firms into size and offer categories of observations. Within each strata, we calculated the trimming cut point as the median plus six times the interquartile range (M + [6 * IQR]). Weight values larger than this cut point are trimmed. In all instances, very few weight values were trimmed.
The survey collects information on primary and specialty care physician office visits for each plan type. Different plan types at the same firm may have different cost-sharing structures (e.g., copayments or coinsurance). Because the composite variables (using data from across all plan types) are reflective of only those plans with that provision, separate weights for the relevant variables were created in order to account for the fact that not all covered workers have such provisions.
To account for design effects, the statistical computing package R version 3.6.1 (2019-07-05) and the library “survey” version 3.36 were used to calculate standard errors.
STATISTICAL SIGNIFICANCE AND LIMITATIONS
All statistical tests are performed at the .05 confidence level. For figures with multiple years, statistical tests are conducted for each year against the previous year shown, unless otherwise noted. No statistical tests are conducted for years prior to 1999.
Statistical tests for a given subgroup (firms with 25-49 workers, for instance) are tested against all other firm sizes not included in that subgroup (all firm sizes NOT including firms with 25-49 workers, in this example). Tests are done similarly for region and industry; for example, Northeast is compared to all firms NOT in the Northeast (an aggregate of firms in the Midwest, South, and West). However, statistical tests for estimates compared across plan types (for example, average premiums in PPOs) are tested against the “All Plans” estimate. In some cases, we also test plan-specific estimates against similar estimates for other plan types (for example, single and family premiums for HDHP/SOs against single and family premiums for HMO, PPO, and POS plans); these are noted specifically in the text. The two types of statistical tests performed are the t-test and the Wald test. The small number of observations for some variables resulted in large variability around the point estimates. These observations sometimes carry large weights, primarily for small firms. The reader should be cautioned that these influential weights may result in large movements in point estimates from year to year; however, these movements are often not statistically significant. Standard Errors for most key statistics are available in a technical supplement available at http://www.kff.org/ehbs.
Due to the complexity of many employer health benefits programs, this survey is not able to capture all the components of any particular plan. For example, many employers have complex and varied prescription drug benefits, premium contributions, and incentives for wellness programs. We attempted to complete interviews with the person who is most knowledgeable about the firm’s health benefits. In some cases, the firm may not know details of some elements of their plan.
While we collect information on the number of workers enrolled in health benefits, the survey is not able to capture the characteristics of the workers offered or enrolled in any particular plan. As discussed above, statistics weighted by the percentage of employers often display a high level of variability.
2019 SURVEY
Starting in 2019, we discontinued a weighting adjustment informed by a follow-back survey of firms with 3-49 workers that refused to participate in the full survey. This adjustment was intended to reduce non-response bias in the offer rate statistic, under the assumption that firms that did not complete the survey were less likely to offer health benefits. The adjustment involves comparing the distribution of offering to non-offering firms in the full survey and the follow-back sample in the three smallest size categories (3-9, 10-24, 25-49). The adjustment is based on the differences between the two groups of firms and generally operates to adjust the weights of offering firms and non-offering firms to bring the counts closer together. However, if the distributions of the two groups differ to a statistically significant extent, we consider the follow-back survey to be a different population from the full survey and do not make any adjustment to the weights.
Although we cannot be sure of the reason, we are no longer witnessing the systematic upward bias on estimates for the offer rates of small firms that gave rise to the adjustment. Looking at the decade from 2010 to 2019, offer rates among firms responding to the follow-up survey have been higher for five of ten surveys. Firms with 3-49 employees responding to this follow-up survey have reported a higher offer rate than the full EHBS survey during the 2014, 2016, 2017, 2018, and 2019 surveys. An alternative way to measure non-response bias is to compare estimates throughout the fielding period.
In 2019, the percent of firms offering health benefit was similar in the last month of fielding to offer rates throughout the entire fielding period. Changes in both the survey methodology and the health insurance market have led us to become increasingly cautious about assuming that the follow back survey is a suitable proxy for the true population. Since 2014, we have collected offer rate information from firms before a final disposition is assigned. This method was introduced to reduce a bias in which firms who offer health benefits face a longer average survey than non-offering firms. This had the effect of increasing the percentage of firms for whom contact was made from whom we collected offer rate information. Additionally, we have also attempted to reduce non-response bias by increasing our data collection.
Recent changes in the marketplace also raise some concerns about the validity of the follow-back survey to be the basis for a weight adjustment. We have in recent years seen an increase in non-offering firms reporting that they are providing funds to employees to purchase non-group health insurance. We do not consider this to be an offer of health insurance by the firm, but we are concerned that the person who responds to the follow-back survey may not be able to make that distinction. The follow-back survey is a very simple set of questions asked to whoever answers the phone at a firm that refused to participate in the survey. In contrast, during the full-survey, we attempt to talk to the person most knowledgeable about health benefits, and the interviewers are trained to distinguish between types of benefit programs.
For 2019, making the weight adjustment would change offer rate statistic for all firms from 57% to 60%. Neither estimate is different than the 57% we reported last year (when the weight adjustment was not made because the statistical test indicated that the follow-back group was significantly different than the full survey group).
Starting in 2019, all presented calculations of out-of-pocket maximums strictly relied on an arithmetic average across all plans weighted by covered worker plan enrollment. In prior surveys, some figures (for example Figures 7.43, 7.45, and 7.46 in the 2018 report) were calculated based on the out-of-pocket maximum of the largest plan. This change did not meaningfully change any findings and ensured consistency within the out-of-pocket maximum section of the Employee Cost Sharing section.
For prescription drug coverage, similar to years past, if the firm reports that the worker pays the full cost for drugs on a particular tier and/or that the plan only offers access to a discount program, we do not consider this as offering covering for that drug tier. Starting this year, firms with multiple tiers that cover exclusively specialty drugs, were asked about the cost-sharing of the tier that is used most often. Cost-sharing for prescription drugs does not typically include mail order. Hospital, outpatient surgery and prescription drug cost-sharing was only asked of a firm’s largest plan type.
For 2019, we clarified the question that we use to ask firms whether or not they provide retiree health benefits; particularly, we added language that explicitly stated that firms that had terminated retiree health benefits but still has some retirees currently getting coverage, or that had current employees who will get retiree health coverage in the future, should answer yes to the question. We made this clarification in response to a large decline in the 2018 survey in the prevalence of retiree coverage (from 25% in 2017 to 18% in 2018). In the 2018 survey, we expressed concern that the then current public focus on public entities eliminating retiree benefits for future (not existing) retirees may be influencing the responses we were getting and said that we were going to add clarifying language to the survey question in future years.
For 2019, two open-ended questions were added to the survey in order to examine employer responses to the opioid crisis and obstacles preventing firms from adopting narrow network health plans. All responses to these questions were reviewed in a consistent manner by KFF staff to determine whether they could be recoded as an earlier multiple choice item, or if they could be sorted into new categories.
To increase participation in the final two weeks of the survey, a financial incentive was offered to firms with 3-9 employees, but only 6 firms that completed the survey within that time period qualified for the incentive. All respondents received a printed copy of the survey findings.
OTHER RESOURCES
Additional information on the 2019 Employer Health Benefit Survey is available at http://ehbs.kff.org/, including an article in the Journal Health Affairs, an interactive graphic and historic reports. Standard Errors for some statistics are available in the online technical supplement. Researchers may also request a public use dataset here: https://www.kff.org/contact-us/
The survey design and methods section found on our website (http://ehbs.kff.org/) contains an extended methods document that was not included in the portable document format (PDF) or the printed versions of this book. Readers interested in the extended methodology should consult the online edition of this publication.
As part of the Peterson Center on Healthcare’s work on the Peterson-Kaiser Health System Tracker, additional questions on provider networks were included in the 2019 survey. The authors thank Tricia Neuman, Gretchen Jacobson, Karen Pollitz, Larry Levitt, and Cynthia Cox for their contributions.
Published: September 25, 2019. Last Updated: September 23, 2019.
HISTORICAL DATA
Data in this report focus primarily on findings from surveys conducted and authored by the Kaiser Family Foundation since 1999. Between 1999 and 2017, the Health Research & Educational Trust (HRET) co-authored this survey. HRET’s divestiture had no impact on our survey methods, which remain the same as years past. Prior to 1999, the survey was conducted by the Health Insurance Association of America (HIAA) and KPMG using a similar survey instrument, but data are not available for all the intervening years. Following the survey’s introduction in 1987, the HIAA conducted the survey through 1990, but some data are not available for analysis. KPMG conducted the survey from 1991-1998. However, in 1991, 1992, 1994, and 1997, only larger firms were sampled. In 1993, 1995, 1996, and 1998, KPMG interviewed both large and small firms. In 1998, KPMG divested itself of its Compensation and Benefits Practice, and part of that divestiture included donating the annual survey of health benefits to HRET.
This report uses historical data from the 1993, 1996, and 1998 KPMG Surveys of Employer-Sponsored Health Benefits and the 1999-2017 Kaiser/HRET Survey of Employer-Sponsored Health Benefits. For a longer-term perspective, we also use the 1988 survey of the nation’s employers conducted by the HIAA, on which the KPMG and KFF surveys are based. The survey designs for the three surveys are similar.
[Figure M.7] displays the historic sample sizes and weights of firms, workers, and covered workers (employees receiving coverage from their employer).
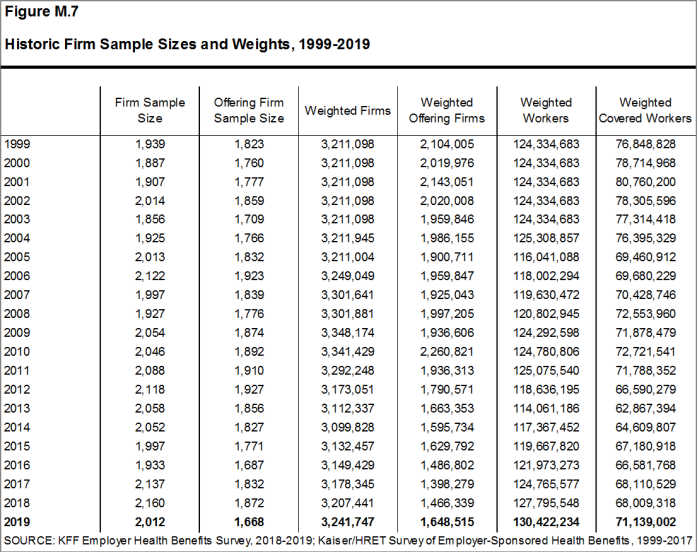
Figure M.7: Historic Firm Sample Sizes and Weights, 1999-2019
[Figure M.8] displays the historic sample frames and weighting universes.
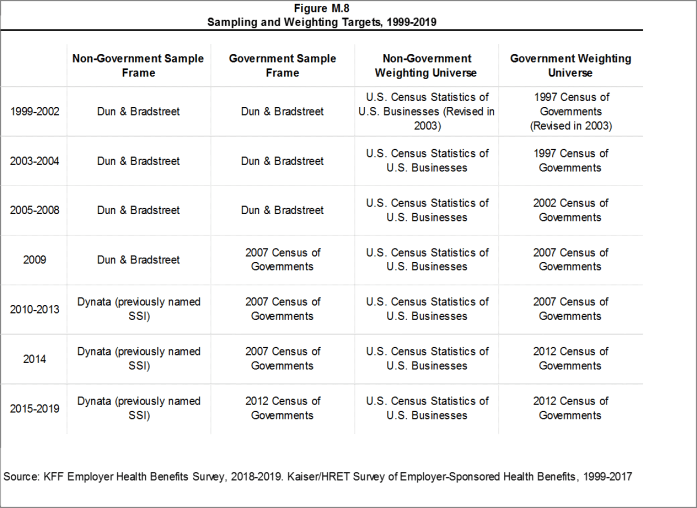
Figure M.8: Sampling and Weighting Targets, 1999-2019
1999
The Kaiser Family Foundation and The Health Research and Educational Trust (Kaiser/HRET) began sponsoring the survey of employer-sponsored health benefits supported for many years by KPMG Peat Marwick LLP, an international consulting and accounting firm. In 1998, KPMG divested itself of its Compensation and Benefits Practice, and donated the annual survey of health benefits to HRET, a non-profit research organization affiliated with the American Hospital Association. From 1999 until 2017, the survey was conducted under a partnership between HRET and The Kaiser Family Foundation, a health care philanthropy and policy research organization that is not affiliated with Kaiser Permanente or Kaiser Industries. Starting in 1999, survey continued a core set of questions from prior KPMG surveys, but was expanded to include small employers and a variety of policy-oriented questions. Some reports include data from the 1993, 1996 and 1998 KPMG Surveys of Employer-Sponsored Health Benefits. For a longer-term perspective, we also use the 1988 survey of the nation’s employers conducted by the Health Insurance Association of America (HIAA), on which the KPMG, Kaiser/HRET, and Kaiser Family Foundation surveys were based. Many of the questions in the HIAA, KPMG, Kaiser/HRET, and Kaiser Family Foundation surveys are identical, as is the sample design. Since Point-of-Service (POS) plans did not exist in 1988, reports do not include statistics for this plan type in that year. Starting in 1999, Kaiser/HRET drew its sample from a Dun & Bradstreet list of the nation’s private and public employers with three or more workers. To increase precision, Kaiser/HRET stratified the sample by industry and the number of workers in the firm. Kaiser/HRET attempted to repeat interviews with many of the 2,759 firms interviewed in 1998 and replaced non-responding firms with another firm from the same industry and firm size. As a result, 1,377 firms in the 1999 total sample of 1,939 firms participated in both the 1998 and 1999 surveys.
For more detail about the 1999 survey, see the Survey Methodology section of that year’s report.
2000
Kaiser/HRET attempted to repeat interviews with many of the 1,939 firms interviewed in 1999 and replaced non-responding firms with other firms of the same industry and firm size. As a result, 982 firms in the 2000 survey’s total sample of 1,887 firms participated in both the 1999 and 2000 surveys. The overall response rate was 45% down from 60% in 1999. Contributing to the declining response rate was the decision not to re-interview any firms with 3-9 workers who participated in the 1999 survey. In 1999, the survey weights had instead been adjusted to control for the fact that firms with 3-9 workers that are in the panel (responded in either 1998 or 1999) are biased in favor of offering a health plan. The response rate in 2000 for firms with 3-9 workers was 30%.
For more detail about the 2000 survey, see the Survey Methodology section of that year’s report.
2001
For more detail about the 2001 survey, see the Survey Methodology section of that year’s report.
2002
The list of imputed variables was greatly expanded in 2002 to also include self-insurance status, level of benefits, prescription drug cost-sharing, copay and coinsurance amounts for prescription drugs, and firm workforce characteristics such as average income, age and part-time status. On average, 2% of these observations are imputed for any given variable. The imputed values are determined based on the distribution of the reported values within stratum defined by firm size and region.
For more detail about the 2002 survey, see the Survey Methodology section of that year’s report.
2003
The calculation of the weights followed a similar approach to previous years, but with several notable changes in 2003. First, as in years past, the basic weight was determined, followed by a nonresponse adjustment added this year to reflect the fact that small firms that do not participate in the full survey are less likely to offer health benefits and, consequently, are unlikely to answer the single offer rate question. To make this adjustment, Kaiser/HRET conducted a follow-up survey of all firms with 3-49 workers that did not participate in the full survey. Each of these 1,744 firms was asked the single question, “Does your company offer or contribute to a health insurance program as a benefit to its employees?” The main difference between this follow-up survey and the original survey is that in the follow-up survey the first person who answered the telephone was asked whether the firm offered health benefits, whereas in the original survey the question was asked of the person who was identified as most knowledgeable about the firm’s health benefits. Conducting the follow-up survey accomplished two objectives. First, statistical techniques (a McNemar analysis which was confirmed by a chi-squared test) demonstrated that the change in method-speaking with the person answering the phone rather than a benefits manager-did not bias the results of the follow-up survey. Analyzing firms who responded to the offer question twice, in both the original and follow-up survey, proved that there was no difference in the likelihood that a firm offers coverage based on which employee answered the question about whether a firm offers health benefits. Second, the follow-up survey demonstrated that very small firms not offering health benefits to their workers are less likely to answer the one survey question about coverage. Kaiser/HRET analyzed the group of firms that only responded to the follow-up survey and performed a t-test between the firms who had responded to the initial survey as well as the follow-up, and those who only responded to the follow-up. Tests confirmed the hypothesis that the firms that did not answer the single offer rate question in the original survey were less likely to offer health benefits. To adjust the offer rate data for this finding an additional non-response adjustment was applied to increase the weight of firms in the sample that do not offer coverage. The second change to the weighting method in 2003 was to trim the weights in order to reduce the influence of weight outliers. On occasion one or two firms will, through the weighting process, represent a highly disproportionate number of firms or covered workers. Rather than excluding these observations from the sample, a set cut point that would minimize the variances of several key variables (such as premium change and offer rate) was determined. The additional weight represented by outliers is then spread among the other firms in the same sampling cell. Finally, a post-stratification adjustment was applied. In the past, Kaiser/HRET was poststratified back to the Dun & Bradstreet frequency counts. Concern over volatility of counts in recent years led to the use of an alternate source for information on firm and industry data. This year the survey uses the recently released Statistics of U.S. Businesses conducted by the U.S. Census as the basis for the post-stratification adjustment. These Census data indicate the percentage of the nation’s firms with 3-9 workers is 59% rather than the higher percentages (e.g., 76% in 2002) derived from Dun & Bradstreet’s national database. This change has little impact on worker-based estimates, since firms with 3-9 workers accounted for less than 10% of the nation’s workforce. The impact on estimates expressed as a percentage of employers (e.g., the percent of firms offering coverage), however, may be significant. Due to these changes, Kaiser/HRET recalculated the weights for survey years 1999-2002 and modified estimates published in the survey where appropriate. The vast majority of these estimates are not statistically different. However, please note that the survey data published starting in 2003 varies slightly from previously published reports.
For more detail about the 2003 survey, see the Survey Methodology section of that year’s report.
2004
For more detail about the 2004 survey, see the Survey Methodology section of that year’s report.
2005
In 2005, the Kaiser/HRET survey added two additional sections to the questionnaire to collect information about high-deductible health plans (HDHP) that are offered along with a health reimbursement account (HRA) or are health savings account (HSA) qualified. Questions in these sections were asked of all firms offering these plan types, regardless of enrollment. Specific weights were also created to analyze the HDHP plans that are offered along with HRAs or are HSA qualified. These weights represent the proportion of employees enrolled in each of these arrangements.
We updated our data to reflect the 2002 Census of Governments. We also removed federal government employee counts from our post-stratification.
For more detail about the 2005 survey, see the Survey Methodology section of that year’s report.
2006
For the first time in 2006, Kaiser/HRET asked questions about the highest enrollment HDHP/SO as a separate plan type, equal to the other plan types. In prior years, data on HDHP/SO plans were collected as part of one of the other types of plans. Therefore, the removal of HDHP/SOs from the other plan types may affect the year to year comparisons for the other plan types. Given the decline in conventional health plan enrollment and the addition of HDHP/SO as a plan type option, Kaiser/HRET eliminated nearly all questions pertaining to conventional coverage from the survey instrument. We continue to ask firms whether or not they offer a conventional health plan and, if so, how much their premium for conventional coverage increased in the last year, but respondents are not asked additional questions about the attributes of the conventional plans they offer. Because we have limited information about conventional health plans, we must make adjustments in calculating all plan averages or distributions. In cases where a firm offers only conventional health plans, no information from that respondent is included in all plan averages. The exception is for the rate of premium growth, for which we have information. If a firm offers a conventional health plan and at least one other plan type, for categorical variables we assign the values from the health plan with the largest enrollment (other than the conventional plan) to the workers in the conventional plan. In the case of continuous variables, covered workers in conventional plans are assigned the weighted average value of the other plan types in the firm.
The survey newly distinguished between plans that have an aggregate deductible amount in which all family members’ out-of-pocket expenses count toward the deductible and plans that have a separate amount for each family member, typically with a limit on the number of family members required to reach that amount.
In 2006, Kaiser/HRET began asking employers if they had a health plan that was an exclusive provider organization (EPO). We treat EPOs and HMOs together as one plan type and report the information under the banner of “HMO”; if an employer sponsors both an HMO and an EPO, they are asked about the attributes of the plan with the larger enrollment.
Kaiser/HRET made a slight change to one of the industry groups: we removed Wholesale from the group that also included Agriculture, Mining and Construction. The nine industry categories now reported are: Agriculture/Mining/Construction, Manufacturing, Transportation/Communications/Utilities, Wholesale, Retail, Finance, Service, State/Local Government, and Health Care.
Starting in 2006, we made an important change to the way we test the subgroups of data within a year. Statistical tests for a given subgroup (firms with 25-49 workers, for instance) are tested against all other firm sizes not included in that subgroup (all firm sizes NOT including firms with 25-49 workers in this example). Tests are done similarly for region and industry: Northeast is compared to all firms NOT in the Northeast (an aggregate of firms in the Midwest, South, and West). Statistical tests for estimates compared across plan types (for example, average premiums in PPOs) are tested against the “All Plans” estimate. In some cases, we also test plan specific estimates against similar estimates for other plan types (for example, single and family premiums for HDHP/SOs against single and family premiums in HMO, PPO, and POS plans). Those are noted specifically in the text. This year, we also changed the type of Chi-square test from the Chi-square test for goodness-of-fit to the Pearson Chi-square test. Therefore, in 2006, the two types of statistical tests performed are the t-test and the Pearson Chi-square test.
For more detail about the 2006 survey, see the Survey Methodology section of that year’s report.
2007
Kaiser/HRET drew its sample from a Survey Sampling Incorporated list (based on an original Dun and Bradstreet list) of the nation’s private and public employers with three or more workers.
In prior years, many variables were imputed following a hotdeck approach, while others followed a distributional approach (where values were randomly determined from the variable’s distribution, assuming a normal distribution). This year, all variables are imputed following a hotdeck approach. This imputation method does not rely on a normal distribution assumption and replaces missing values with observed values from a firm with similar characteristics, in this case, size and industry. Due to the low imputation rate for most variables, the change in methodology is not expected to have a major impact on the results. In some cases, due to small sample size, imputed outliers are excluded. There are a few variables that Kaiser/HRET has decided should not be imputed; these are typically variables where “don’t know” is considered a valid response option (for example, firms’ opinions about effectiveness of various strategies to control health insurance costs).
The survey now contains a few questions on employee cost sharing that are asked only of firms that indicate in a previous question that they have a certain cost-sharing provision. For example, the copayment amount for prescription drugs is asked only of those that report they have copayments for prescription drugs. Because the composite variables are reflective of only those plans with the provision, separate weights for the relevant variables were created in order to account for the fact that not all covered workers have such provisions.
For more detail about the 2007 survey, see the Survey Methodology section of that year’s report.
2008
National Research, LLC (NR), our Washington, D.C.-based survey research firm, introduced a new CATI (Computer Assisted Telephone Interview) system at the end of 2007, and, due to several delays in the field, obtained fewer responses than expected. As a result, an incentive of $50 was offered during the final two and a half weeks the survey was in the field. Kaiser/HRET compared the distribution of key variables between firms receiving the incentive and firms not receiving the incentive to determine any potential bias. Chi-square test results were not significant, suggesting minimal to no bias.
In 2008, we changed the method used to report the annual percentage premium increase. In prior years, the reported percentage was based on a series of questions that asked responding firms the percentage increase or decrease in premiums from the previous year to the current year for a family of four in the largest plan of each plan type (e.g., HMO, PPO). The reported premium increase was the average of the reported percentage changes (i.e., 6.1% for 2007) weighted by covered workers. This year, we calculate the overall percentage increase in premiums from year to year for family coverage using the average of the premium dollar amounts for a family of four in the largest plan of each plan type reported by respondents and weighted by covered workers (i.e., $12,106 for 2007 and $12,680 for 2008, an increase of 5%). A principal advantage of using the premium dollar amounts to calculate the annual change in premiums is that we are better able to capture changes in the cost of health insurance for those firms that are newly in the market or that change plan types, especially those that move to plans with very different premium levels. For example, in the first year that a firm offers a plan of a new plan type, such as a consumer-directed plan, the firm can report the level of the premium they paid, but using the previous method would be unable to report the rate of change from the previous year since the plan was not previously offered. If the premium for the new plan is relatively low compared to other premiums in the market, the relatively low premium amount that the firm reports will tend to lower the weighted average premium dollar amount reported in the survey, but the firm responses would not provide any information to the percentage premium increase question. Another advantage of using premium dollar amounts to examine trends is that these data directly relate to the other findings in the survey and better address a principal public policy issue (i.e., what was the change in the cost of insurance over some past period). Many users noted, for example, that the percentage change calculated from the reported premium dollar amounts between two years did not directly match the reported average premium increase for the same period. There are several reasons why we would not expect these questions to produce identical results: 1) they are separate questions subject to varying degrees of reporting error, 2) firms could report a premium dollar amount for a plan type they might not have offered in the previous year, therefore, contributing information to one measure but not the other, or 3) firms could report a premium dollar amount for a plan that was not the largest plan of that type in the previous year. Although the two approaches have generated similar results in terms of the long-term growth rate of overall family premiums, there are greater discrepancies in trends for subgroups like small employers and self-funded firms. Focusing on the dollar amount changes over time will provide a more reliable and consistent measure of premium change that also is more sensitive to firms offering new plan options.
As we have in past years, this year we collected information on the cost-sharing provisions for hospital admissions and outpatient surgery that is in addition to any general annual plan deductible. However, for the 2008 survey, we changed the structure of the question and now include “separate annual deductible or hospital admissions” as a response option rather than collecting the information through a separate question. We continue to examine and sometimes modify the questions on hospital and outpatient surgery cost sharing because this can be a complex component of health benefit plans. For example, for some plans it is difficult to distinguish a separate hospital deductible from one categorized as a general annual deductible, where office visits and preventive care are covered and the deductible only applies to hospital use. Because this continues to be a point of confusion, we continue to refine the series of questions in order to clearly convey the information we are attempting to collect from respondents.
As in 2007, we asked firms if they offer health benefits to opposite-sex or same-sex domestic partners. However, this year, we changed the response options because during early tests of the 2008 survey, several firms noted that they had not encountered the issue yet, indicating that the responses of “yes,” “no,” and “don’t know” were insufficient. Therefore, this year we added the response option “not applicable/not encountered” to better capture the number of firms that report not having a policy on the issue.
For more detail about the 2008 survey, see the Survey Methodology section of that year’s report.
2009
In the fall of 2008, with guidance from experts in survey methods and design from NORC, we reviewed the methods used for the survey. As a result of this review, several important modifications were made to the 2009 survey, including the sample design and questionnaire. For the first time, this year we determined the sample requirements based on the universe of firms obtained from the U.S. Census rather than Dun and Bradstreet. Prior to the 2009 survey, the sample requirements were based on the total counts provided by Survey Sampling Incorporated (SSI) (which obtains data from Dun and Bradstreet). Over the years, we have found the Dun and Bradstreet frequency counts to be volatile because of duplicate listings of firms, or firms that are no longer in business. These inaccuracies vary by firm size and industry. In 2003, we began using the more consistent and accurate counts provided by the Census Bureau’s Statistics of U.S. Businesses and the Census of Governments as the basis for post-stratification, although the sample was still drawn from a Dun and Bradstreet list. In order to further address this concern at the time of sampling, we now also use Census data as the basis for the sample. This change resulted in shifts in the sample of firms required in some size and industry categories.
This year, we also defined Education as a separate sampling category, rather than as a subgroup of the Service category. In the past, Education firms were a disproportionately large share of Service firms. Education is controlled for during post-stratification, and adjusting the sampling frame to also control for Education allows for a more accurate representation of both Education and Service industries.
In past years, both private and government firms were sampled from the Dun and Bradstreet database. For the 2009 sample, Government firms were sampled in-house from the 2007 Census of Governments. This change was made to eliminate the overlap of state agencies that were frequently sampled from the Dun and Bradstreet database. Each year the survey attempts to repeat interviews with respondents from past years (see “Response Rate” section below), and in order to maintain government firms that had completed the survey in the past (firms that have completed the survey in the past are known as panel firms), government firms from the 2008 survey were matched to the Census of Governments to identify phone numbers. All panel government firms were included in the sample (resulting in an oversample). In addition, the sample of private firms is screened for firms that are related to state/ local governments, and if these firms are identified in the Census of Governments, they are reclassified as government firms and a private firm is randomly drawn to replace the reclassified firm. These changes to the sample frame resulted in an expected slight reduction in the overall response rate, since there were shifts in the number of firms needed by size and industry. Therefore, the data used to determine the 2009 Employer Health Benefits sample frame include the U.S. Census’ 2005 Statistics of U.S. Businesses and the 2007 Census of Governments. At the time of the sample design (December 2008), these data represented the most current information on the number of public and private firms nationwide with three or more workers. As in the past, the post- stratification is based on the most up-to-date Census data available (the 2006 update to the Census of U.S. Businesses was purchased during the survey field period) and the 2007 Census of Governments. The Census of Governments is conducted every five years, and this is the first year the data from the 2007 Census of Governments have been available for use.
Based on recommendations from cognitive researchers at NORC and internal analysis of the survey instrument, a number of questions were revised to improve the clarity and flow of the survey in order to minimize survey burden. For example, in order to better capture the prevalence of combinations of inpatient and outpatient surgery cost sharing, the survey was changed to ask a series of yes or no questions. Previously, the question asked respondents to select one response from a list of types of cost sharing, such as separate deductibles, copayments, coinsurance, and per diem payments (for hospitalization only). We have also expanded the number of questions for which respondents can provide either the number of workers or the percentage of workers. Previously, after obtaining the total number of employees, the majority of questions asked about the percentage of workers with certain characteristics. Now, for questions such as the percentage of workers making $23,000 a year or less or the enrollment of workers in each plan type, respondents are able to respond with either the number or the percentage of workers. Few of these changes have had any noticeable impact on responses.
For more detail about the 2009 survey, see the Survey Methodology section of that year’s report.
2010
New topics in the 2010 survey include questions on eligibility for dependent coverage, coverage for care received at retail clinics, health plan changes as a result of the Mental Health Parity and Addiction Equity Act of 2008, and disease management. As in past years, this year’s survey included questions on the cost of health insurance, offer rates, coverage, eligibility, enrollment patterns, premiums, employee cost sharing, prescription drug benefits, retiree health benefits, wellness benefits, and employer opinions.
Firms in the sample with 3-49 workers that did not complete the full survey are contacted and asked (or re-asked in the case of firms that previously responded to only one question about offering benefits) whether or not the firm offers health benefits. As part of the process, we conduct a McNemar test to verify that the results of the follow-up survey are comparable to the results from the original survey. If the test indicates that the results are comparable, a nonresponse adjustment is applied to the weights used when calculating firm offer rates. This year, for the first time since we began conducting the follow-up survey, the test indicated that the results from those answering the one question about offering health benefits in the original survey and those answering the follow-up survey were different (statistically significant difference at the p<0.05 level between the two surveys), suggesting the results are not comparable. Therefore, we did not use the results of this follow-up survey to adjust the weights as we have in the past. In the past, the nonresponse adjustment lowered the offer rate for smaller firms by one to three percentage points, so not making the adjustment this year makes the offer rate look somewhat higher when making comparisons to prior years. For 2010, we saw a very large and unexpected increase in the offer rate (from 60 percent in 2009 to 69 percent in 2010) overall and particularly for firms with 3 to 9 workers (from 46 percent in 2009 to 59 percent in 2010). While not making the adjustment this year added to the size of the change, there would have been a large and difficult to explain change even if a nonresponse adjustment comparable to previous years had been made.
For more detail about the 2010 survey, see the Survey Methodology section of that year’s report.
2011
New topics in the 2011 survey include questions on stoploss coverage for self-funded plans, cost sharing for preventive care, plan grandfathering resulting from the Affordable Care Act (ACA), and employer awareness of tax credits authorized under the ACA.
This year, we became aware that the way we have been using the data from the Census Bureau for calibration was incorrect and resulted in an over-count of the actual number of firms in the nation. Specifically, firms operating in more than one industry were counted more than once in computing the total firm count by industry, and firms with establishments were counted more than once in computing the total firm count by state (which affects the regional count). Because smaller firms are less likely to operate in more than one industry or state, the miscounts occurred largely for larger from sizes. The error affects only statistics that are weighted by the number of firms (such as the percent of firms offering health benefits or sponsoring a disease management plan). Statistics that are weighted by the number of workers or covered workers (such as average premiums, contributions, or deductibles) were not affected. We addressed this issue by proportionally distributing the correct national total count of firms within each firm size as provided by the U.S. Census Bureau across industry and state based on the observed distribution of workers. This effectively weights each firm within each category (industry or state) in proportion to its share of workers in that category. The end result is a synthetic count of firms across industry and state that sums to the national totals. Firm-weighted estimates resulting from this change show only small changes from previous estimates, because smaller firms have much more influence on national estimates. For example, the estimate of the percentage of firms offering coverage was reduced by about .05 percentage points in each year (in some years no change is evident due to rounding). Estimates of the percentage of large firms offering retiree benefits were reduced by a somewhat larger amount (about 2 percentage points). Historical estimates used in the 2011 survey release have been updated following this same process. As noted above, worker-weighted estimates from prior years were not affected by the miscount and remain the same.
For more detail about the 2011 survey, see the Survey Methodology section of that year’s report.
2012
New topics in the 2012 survey include the use of biometric screening, domestic partner benefits, and emergency room cost sharing. In addition, many of the questions on health reform included in the 2011 survey were retained, including stoploss coverage for self-funded plans, cost sharing for preventive care, and plan grandfathering resulting from the Affordable Care Act (ACA).
There are several variables in which missing data is calculated based on respondents’ answers to other questions (for example, when missing employer contributions to premiums is calculated from the respondent’s premium and the ratio of contributions to premiums). In 2012 the method to calculate missing premiums and contributions was revised; if a firm provides a premium for single coverage or family coverage, or a worker contribution for single coverage or family coverage, that information was used in the imputation. For example, if a firm provided a worker contribution for family coverage but no premium information, a ratio between the family premium and family contribution was imputed and then the family premium was calculated. In addition, in cases where premiums or contributions for both family and single coverage were missing, the hotdeck procedure was revised to draw all four responses from a single firm. The change in the imputation method did not make a significant impact on the premium or contribution estimates.
In 2012, the method for calculating the size of the sample was adjusted. Rather than using a combined response rate for panel and non-panel firms, separate response rates were used to calculate the number of firms to be selected in each strata. In addition, the mining stratum was collapsed into the agriculture and construction industry grouping. In sum, changes to the sampling method required more firms to be included and may have reduced the response rate in order to provide more balanced power within each strata.
To account for design effects, the statistical computing package R and the library package “survey” were used to calculate standard errors. All statistical tests are performed at the .05 level, unless otherwise noted. For figures with multiple years, statistical tests are conducted for each year against the previous year shown, unless otherwise noted. No statistical tests are conducted for years prior to 1999. In 2012 the method to test the difference between distributions across years was changed to use a Wald test which accounts for the complex survey design. In general this method was more conservative than the approach used in prior years.
In 2012, average coinsurance rates for prescription drugs, primary care office visits, specialty office visits, and emergency room visits include firms that have a minimum and/or maximum attached to the rate. In years prior to 2012 we did not ask firms the structure of their coinsurance rate. For most prescription drug tiers, and most services, the average coinsurance rate is not statically different depending on whether the plan has a minimum or maximum.
In 2012 the calculation of the response rates was adjusted to be slightly more conservative than previous years.
For more detail about the 2012 survey, see the Survey Methodology section of that year’s report.
2013
Starting in 2013, information on conventional plans was collected under the PPO section and therefore the covered worker weight was representative of all plan types.
For more detail about the 2013 survey, see the Survey Methodology section of that year’s report.
2014
Starting in 2014, we elected to estimate separate single and family coverage premiums for firms that provided premium amounts as the average cost for all covered workers, instead of differentiating between single and family coverage. This method more accurately accounted for the portion that each type of coverage contributes to the total cost for the 1 percent of covered workers who are enrolled at firms affected by this adjustment.
Several provisions of the ACA took effect on January 1, 2014 which impacted non-grandfathered plans as well as plans renewing in calendar year 2014, such as the requirement to have an out of pocket limit and a waiting period of not more than three months. As a result, firms with non-grandfathered plans that reported that they did not have out-of-pocket limits, or waiting periods exceeding three months, were contacted during our data-confirmation calls. We did not have information on the month in which a firm’s plan or plans was renewed. Many of these firms indicated that they had a plan year starting prior to January 2014, so these ACA provision were not yet in effect for these plans.
Firms with 200 or more workers were asked: “Does your firm offer health benefits for current employees through a private or corporate exchange? A private exchange is one created by a consulting firm or an insurance company, not by either a federal or state government. Private exchanges allow employees to choose from several health benefit options offered on the exchange.” Employers were still asked for plan information about their HMO, PPO, POS and HDHP/SO plan regardless of whether they purchased health benefits through a private exchange or not.
Beginning in 2014, we collected whether firms with a non-final disposition code (such as a firm that requested a callback at a later time or date) offered health benefits. By doing so we attempt to mitigate any potential non-response bias of firms either offering or not offering health benefits on the overall offer rate statistic.
For more detail about the 2014 survey, see the Survey Methodology section of that year’s report.
2015
To increase response rates, firms with 3-9 employees were offered an incentive of $75 in cash or as a donation to a charity of their choice to complete the full survey.
In 2015, weights were not adjusted using the nonresponse adjustment process described in previous years’ methods. As in past years, Kaiser/HRET conducted a small follow-up survey of those firms with 3 to 49 workers that refused to participate in the full survey. Based on the results of a McNemar test, we were not able to verify that the results of the follow-up survey were comparable to the results from the original survey. In 2010, the results of the McNemar test were also significant and we did not conduct a nonresponse adjustment.
The 2015 survey contains new information in several areas, including on wellness and biometric screening. In most cases, information reported in this section is not comparable with previous years’ findings. Data presented in the 2015 report reflect the firm’s benefits at the time they completed the interview. Some firms may report on a plan which took effect in the prior calendar year. Starting in 2015, firms were able to have a contribution and deductible in compliance with HSA requirements for the plan year.
Starting in 2015, employers were asked how many full-time equivalents they employed. In cases in which the number of full-time equivalents was relevant to the question, interviewer skip patterns may have depended on the number of FTEs.
In cases where a firm had multiple plans, they were asked about their strategies for containing the cost of specialty drugs for the plan with the largest enrollment.
Under the Affordable Care Act, non-grandfathered plans are required to have an out-of- pocket maximum. Non-grandfathered plans who indicated that they did not have an out of pocket maximum were asked to confirm whether their plan was grandfathered and whether that plan had an out-of-pocket maximum.
For more detail about the 2015 survey, see the Survey Methodology section of that year’s report.
2016
Between 2015 and 2016, we conducted a series of focus groups that led us to the conclusion that human resource and benefit managers at firms with between 20 and 49 employees think about health insurance premiums more similarly to benefit managers at smaller firms than larger firms. Therefore, starting in 2016, we altered the health insurance premium question pathway for firms with between 20-49 employees to match that of firms with 3-19 employees rather than firms with 50 or more employees. This change affected firms representing 8% of the total covered worker weight. We believe that these questions produce comparable responses and that this edit does not create a break in trend.
Starting in 2016, we made significant revisions to how the survey asks employers about their prescription drug coverage. In most cases, information reported in the Prescription Drug Benefits section is not comparable with previous years’ findings. First, in addition to the four standard tiers of drugs (generics, preferred, non-preferred, and lifestyle), we began asking firms about cost sharing for a drug tier that covers only specialty drugs. This new tier pathway in the questionnaire has an effect on the trend of the four standard tiers, since respondents to the 2015 survey might have previously categorized their specialty drug tier as one of the other four standard tiers. We did not modify the question about the number of tiers a firm’s cost-sharing structure has, but in cases in which the highest tier covered exclusively specialty drugs we reported it separately. For example, a firm with three tiers may only have copays or coinsurances for two tiers because their third tier copay or coinsurance is being reported as a specialty tier. Furthermore, in order to reduce survey burden, firms were asked about the plan attributes of only their plan type with the most enrollment. Therefore, in most cases, we no longer make comparisons between plan types. Lastly, prior to 2016, we required firms’ cost sharing tiers to be sequential, meaning that the second tier copay was higher than the first tier, the third tier was higher than the second, and the fourth was higher than the third. As drug formularies have become more intricate, many firms have minimum and maximums attached to their copays and coinsurances, leading us to believe it was no longer appropriate to assume that a firm’s cost sharing followed this sequential logic.
In cases where a firm had multiple plans, they were asked about their strategies for containing the cost of specialty drugs for the plan type with the largest enrollment. Between 2015 and 2016, we modified the series of ‘Select All That Apply’ questions regarding cost containment strategies for specialty drugs. In 2016, we elected to impute firms’ responses to these questions. We removed the option “Separate cost sharing tier for specialty drugs” and added specialty drugs as their own drug tier questionnaire pathway. We added question options on mail order drugs and prior authorization.
In 2016, we modified our questions about telemedicine to clarify that we were interested in the provision of health care services, and not merely the exchange of information, through telecommunication. We also added dependent and spousal questions to our health risk assessment question pathway.
For more detail about the 2016 survey, see the Survey Methodology section of that year’s report.
2017
While the Kaiser/HRET survey similar to other employer and household surveys has seen a general decrease in response rates over time, the decrease between the 2016 and 2017 response rates is not solely explained by this trend. In order to improve statistical power among sub-groups, including small firms and those with a high share of low income workers, the size of the sample was expanded from 5,732 in 2016 to 7,895 in 2017. As a result, the 2017 survey includes 204 more completes than the 2016 survey. While this generally increases the precision of estimates (for example, a reduction in the standard error for the offer rate from 2.2% to 1.8%), it has the effect of reducing the response rate. In 2017, non-panel firms had a response rate of 17%, compared to 62% for firms that had participated in one of the last two years.
To increase response rates, firms with 3-9 employees were offered an incentive for participating in the survey. A third of these firms were sent a $5 Starbucks gift card in the advance letter, a third were offered an incentive of $50 in cash or as a donation toa charity of their choice after completing the full survey, and a third of firms were offered no incentive at all. Our analysis does not show significant differences in responses to key variables among these incentive groups.
In 2017, weights were not adjusted using the nonresponse adjustment process described in previous years’ methods. As in past years, Kaiser/HRET conducted a small follow-up survey of those firms with 3-49 workers that refused to participate in thefull survey. Based on the results of a McNemar test, we were not able to verify that the results of the follow-up survey were comparable to the results from the original survey. In 2010 and 2015, the results of the McNemar test were also significant andwe did not conduct a nonresponse adjustment.
To reduce the length of survey, in several areas, including stoploss coverage for self-funded firms and cost sharing for hospital admissions, outpatient surgery, and emergency room visits, we revised the questionnaire to ask respondents about theattributes of their largest health plan rather than each plan type they may offer. This expands on the method we used for prescription drug coverage in 2016. Therefore, for these topics, aggregate variables represent the attributes of the firm’s largestplan type, and are not a weighted average of all of the firms plan types. In previous surveys, if a firm had two plan types, one with a copayment and one with a coinsurance for hospital admissions, the covered worker weight was allotted proportionallytoward the average copayment and coinsurance based on the number of covered workers with either feature. With of this change, comparison among plans types is now a comparison of firms where any given plan type is the largest. The change onlyaffects firms that have multiple plan types (58% of covered workers). After reviewing the responses and comparing them to prior years where we asked about each plan type, we find that the information we are receiving is similar to responses fromprevious years. For this reason, we will continue to report our results for these questions weighted by the number of covered workers in responding firms.
Starting in 2017, respondents were allowed to volunteer that their plans did not cover outpatient surgery or hospital admissions. Less than 1% of respondents indicated that their plan did not include coverage for these services. Cost sharing for hospital admissions, outpatient surgery and emergency room visits was imputed by drawing a firm similar in size and industry within the same plan type.
For more detail about the 2017 survey, see the Survey Methodology section of that year’s report.
2018
As in past years, we conducted a small follow-up survey of those firms with 3-49 workers that refused to participate in the full survey. Based on the results of a McNemar test, we were not able to verify that the results of the follow-up survey were comparable to the results from the original survey, and weights were not adjusted using the nonresponse adjustment process described in previous years’ methods. In 2010, 2015, and 2017, the results of the McNemar test were also significant and we did not conduct a nonresponse adjustment.
In light of a number of regulatory changes and policy proposals, we included new questions on the anticipated effects of the ACA’s individual mandate penalty repeal on the firm’s health benefits offerings, and the impact of the delay of the high cost plan tax, also known as the Cadillac tax, on the firm’s health benefits decisions. Also new in 2018 are questions asking about smaller firms’ use of level-funded premium plans, an alternative self-funding method with integrated stop loss coverage and a fixed monthly premium.
In 2018, we moved the battery of worker demographics questions from near the beginning of the survey to the end of the survey in an effort to improve the flow. There is no evidence that this move has impacted our survey findings and we will continue to monitor any suspected impacts.
The 2018 survey also expands on retiree health benefits questions, asking firms about cost reduction strategies, whether they contribute to the cost of coverage, and how retiree benefits are offered (e.g., through a Medicare Advantage contract, a traditional employer plan, private exchange, etc.).
Starting in 2018, we allowed respondents who did not know the combined maximum incentive or penalty an employee could receive for health screening and/or wellness and health promotion to answer a categorical question with specified ranges. This method is consistent with how we handle the percent of low-wage and high-wage workers at a firm. In 2018, 18% of respondents did not know the dollar value of the their incentive or penalty and 39% were able to estimate a range.
Starting in 2018, the survey began asking small firms who indicated that their plan was fully-insured whether the plan was level-funded. In a level-funded plan, employers make a set payment each month to an insurer or third party administrator which funds a reserve account for claims, administrative costs, and premiums for stop-loss coverage. These plans are often integrated and firms may not understand the complexities of the self-funded mechanisms underlying them. Some small employers who indicate that their plan is self-funded may also offer a plan that meets this definition. Respondents offering level funded plans were asked about any attachment points applying to enrollees. These firms were not less likely to answer this question, and including them doesn’t not substantially change the average. Prior to 2018, all firms reporting coverage as underwritten by an insurer were excluded from the stop-loss calculations.
The response option choices for the type of incentive or penalty for completing biometric screening or a health risk assessment changed from 2017 to 2018.
For more detail about the 2018 survey, see the Survey Methodology section of that year’s report.
- HDHP/SO includes high-deductible health plans with a deductible of at least $1,000 for single coverage and $2,000 for family coverage and that offer either a Health Reimbursement Arrangement (HRA) or a Health Savings Account (HSA). Although HRAs can be offered along with a health plan that is not an HDHP, the survey collected information only on HRAs that are offered along with HDHPs. For specific definitions of HDHPs, HRAs, and HSAs, see the introduction to Section 8.↩
- Response rate estimates are calculated by dividing the number of completes over the number of refusals and the fraction of the firms with unknown eligibility to participate estimated to be eligible. Firms determined to be ineligible to complete the survey are not included in the response rate calculation.↩
- Estimates presented in [Figure 2.1], [Figure 2.2], [Figure 2.3], [Figure 2.4], [Figure 2.5], and [Figure 2.6] are based on the sample of both firms that completed the entire survey and those that answered just one question about whether they offer health benefits.↩
- General information on the OES can be found at http://www.bls.gov/oes/oes_emp.htm#scope.↩
- Bureau of Labor Statistics, Consumer Price Index, U.S. City Average of Annual Inflation, 1998-2019; (cited 2019 Sept 6). https://beta.bls.gov/dataViewer/view/timeseries/CUUR0000SA0.↩
Section One: Cost Of Health Insurance
In 2019, the average annual premiums are $7,188 for single coverage and $20,576 for family coverage. The average premium for single coverage increased by 4% since 2018 and the average premium for family coverage increased by 5%. The average family premium has increased 54% since 2009 and 22% since 2014.
This graphing tool allows users to look at changes in premiums and worker contributions for covered workers at different types of firms over time: https://www.kff.org/interactive/premiums-and-worker-contributions/
PREMIUMS FOR SINGLE AND FAMILY COVERAGE
- The average premium for single coverage in 2019 is $7,188 per year. The average premium for family coverage is $20,576 per year [Figure 1.1].
- The average annual premium for family coverage for covered workers in small firms ($20,236) is similar to the average premium for covered workers in large firms ($20,717). [Figure 1.2].
- The average annual premiums for covered workers in HDHP/SOs are lower for single coverage ($6,412) and family coverage ($18,980) than overall average premiums. The average premiums for covered workers enrolled in PPOs are higher for single ($7,675) and family coverage ($21,683) than the overall plan average [Figure 1.1].
- The average premiums for covered workers with single coverage and for family coverage are similar across regions for all plan types [Figure 1.3].
- The average premium for single coverage varies across industries. Compared to the average single premiums for covered workers in other industries, the average premiums for covered workers in the Manufacturing and Retail categories are relatively low and the average premium for State and Local Government workers are relatively high [Figure 1.4].
- The average premiums for covered workers in firms with a relatively large share of lower-wage workers (where at least 35% of the workers earn $25,000 annually or less) are lower than the average premiums for covered workers in firms with a smaller share of lower-wage workers ($6,189 vs. $7,233 for single coverage and $17,633 vs. $20,709 for family coverage) [Figure 1.6].
- The average premiums for covered workers in firms with a relatively large share of older workers (where at least 35% of the workers are age 50 or older) are higher than the average premiums for covered workers in firms with a smaller share of older workers ($7,485 vs. $6,941 for single coverage and $21,491 vs. $19,807 for family coverage) [Figure 1.6].
- The average premiums for family coverage for covered workers in firms with a relatively large share of younger workers (where at least 35% of the workers are age 26 or younger) are lower than the average premiums for covered workers in firms with a smaller share of younger workers ($19,094 vs. $20,753) [Figure 1.6].
- Premiums also vary by type of firm ownership. Covered workers at private for-profit firms have lower average annual premiums than covered workers at public firms or private not-for-profit firms for both single and family coverage [Figure 1.6].
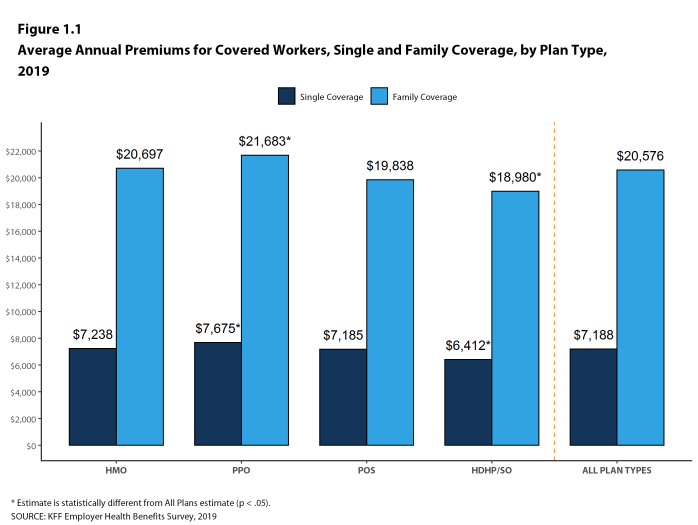
Figure 1.1: Average Annual Premiums for Covered Workers, Single and Family Coverage, by Plan Type, 2019

Figure 1.2: Average Monthly and Annual Premiums for Covered Workers, by Plan Type and Firm Size, 2019
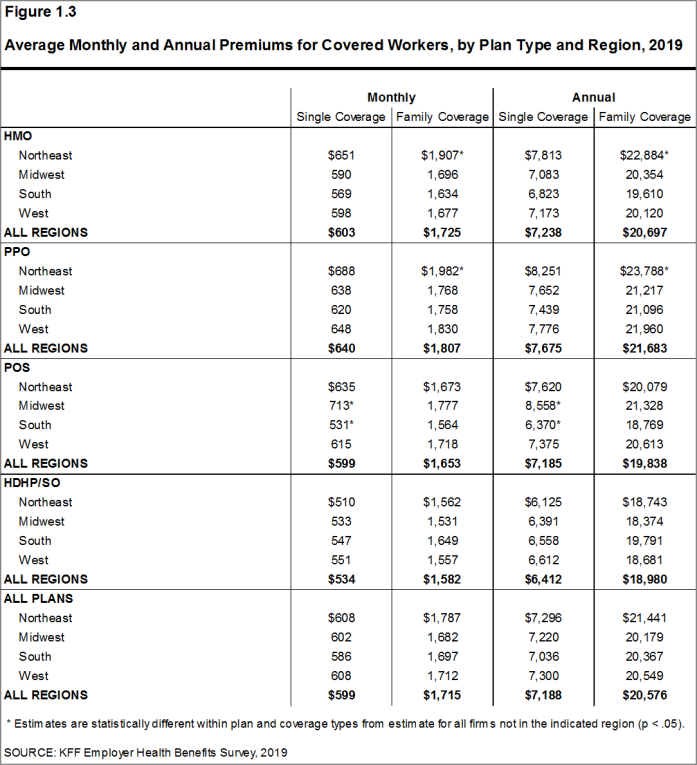
Figure 1.3: Average Monthly and Annual Premiums for Covered Workers, by Plan Type and Region, 2019
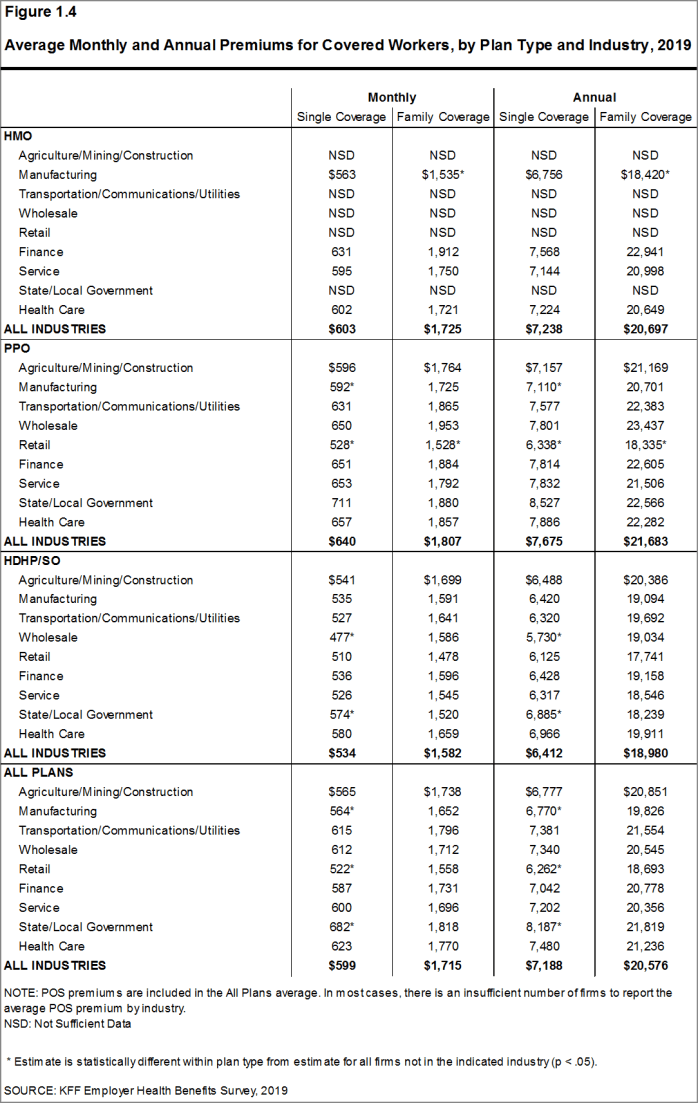
Figure 1.4: Average Monthly and Annual Premiums for Covered Workers, by Plan Type and Industry, 2019
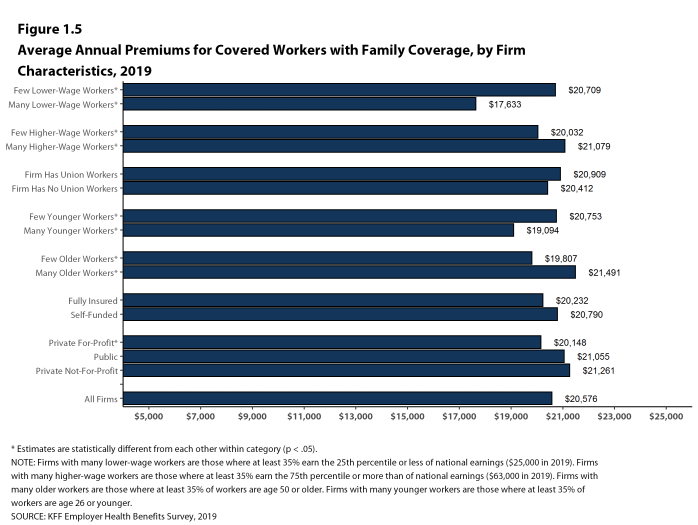
Figure 1.5: Average Annual Premiums for Covered Workers With Family Coverage, by Firm Characteristics, 2019
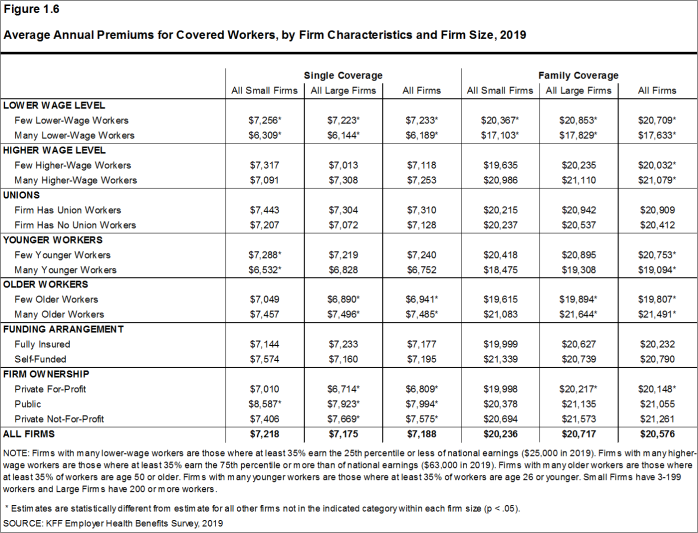
Figure 1.6: Average Annual Premiums for Covered Workers, by Firm Characteristics and Firm Size, 2019
PREMIUM DISTRIBUTION
- There is considerable variation in premiums for both single and family coverage
- Seventeen percent of covered workers are employed in a firm with a single premium at least 20% higher than the average single premium, while 19% of covered workers are in firms with a single premium less than 80% of the average single premium [Figure 1.7].
- Seven percent of covered workers are in a firm with an average annual premium of at least $10,000 for single coverage [Figure 1.8]. Seven percent of covered workers are in a firm with an average annual premium of at least $28,000 for family coverage [Figure 1.9].
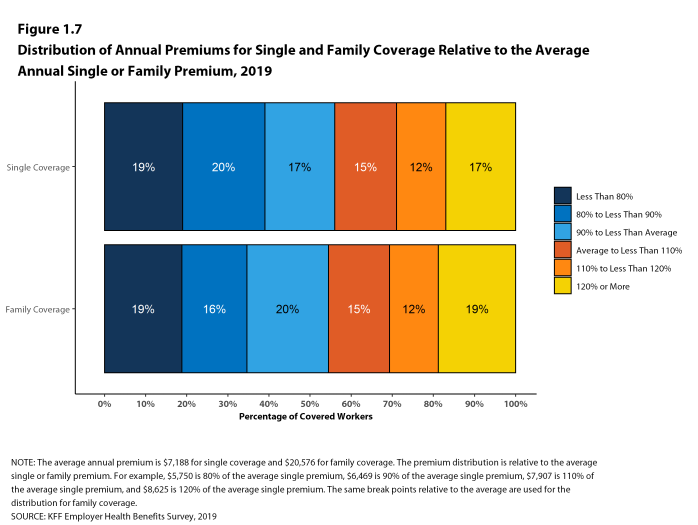
Figure 1.7: Distribution of Annual Premiums for Single and Family Coverage Relative to the Average Annual Single or Family Premium, 2019
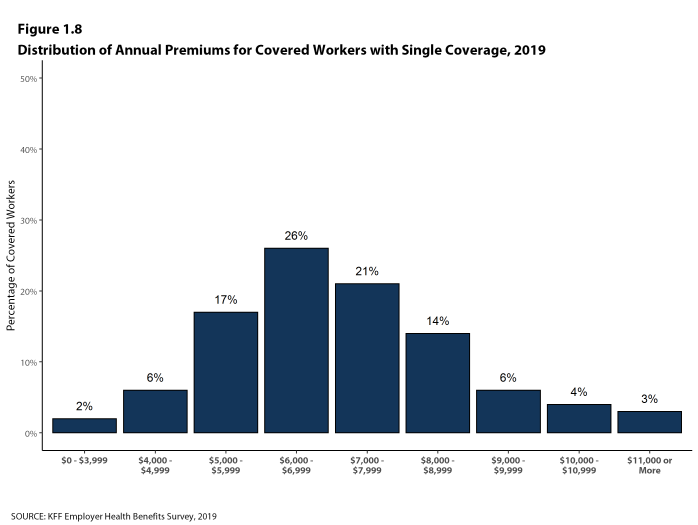
Figure 1.8: Distribution of Annual Premiums for Covered Workers With Single Coverage, 2019
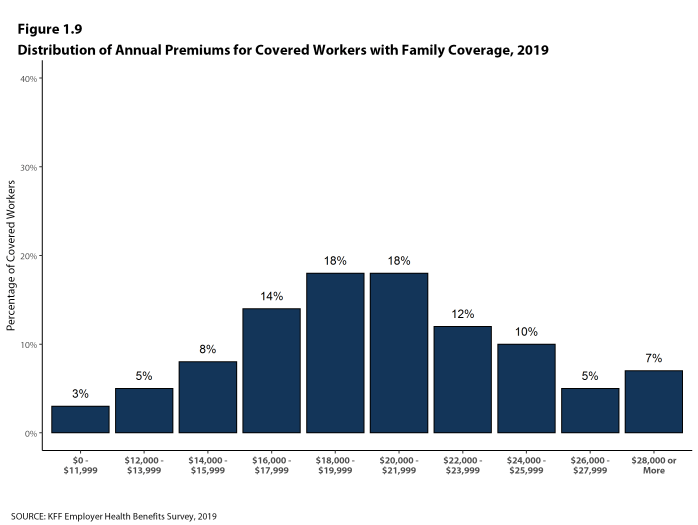
Figure 1.9: Distribution of Annual Premiums for Covered Workers With Family Coverage, 2019
PREMIUM CHANGES OVER TIME
- For covered workers in large firms, over the past five years, the average family premium in firms that are fully insured has grown at a similar rate to the average family premium for covered workers in fully or partially self-funded firms (18% for fully insured plans and 20% for self-funded firms) [Figure 1.13].
- Premium growth continues to outpace both inflation and increases in workers’ earnings [Figure 1.14].
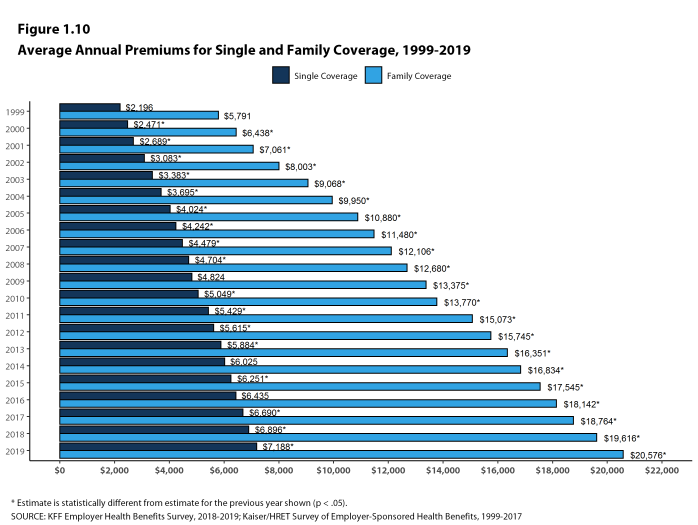
Figure 1.10: Average Annual Premiums for Single and Family Coverage, 1999-2019
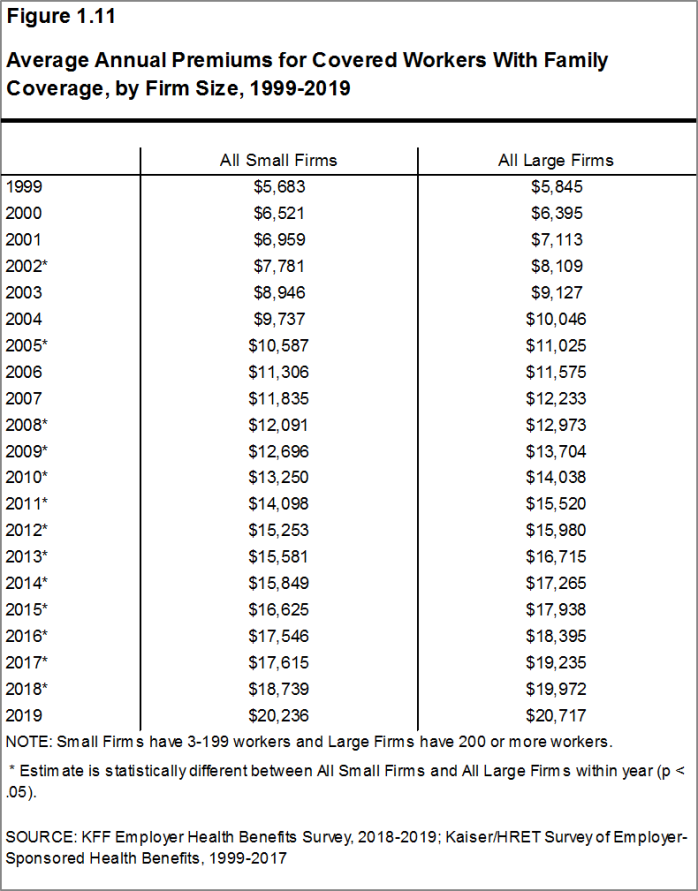
Figure 1.11: Average Annual Premiums for Covered Workers With Family Coverage, by Firm Size, 1999-2019
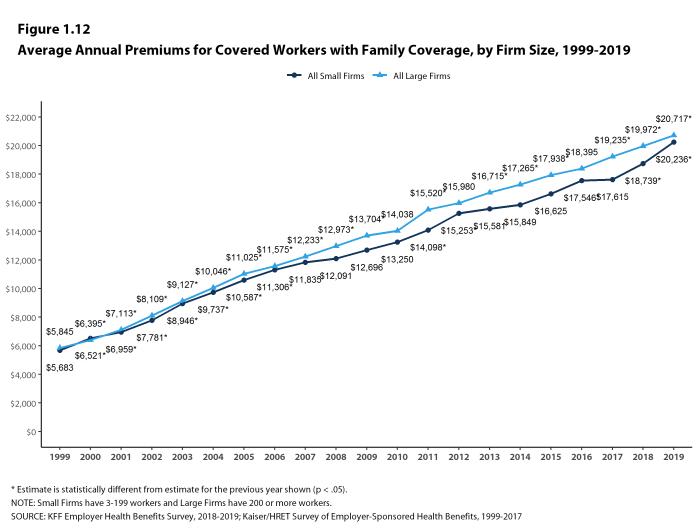
Figure 1.12: Average Annual Premiums for Covered Workers With Family Coverage, by Firm Size, 1999-2019
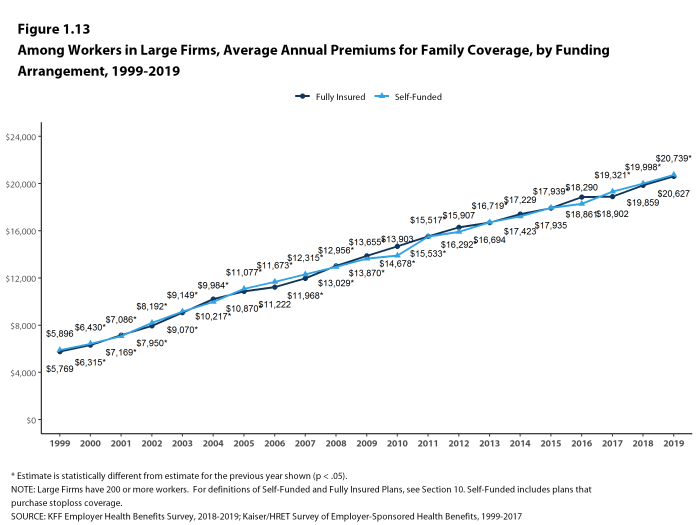
Figure 1.13: Among Workers in Large Firms, Average Annual Premiums for Family Coverage, by Funding Arrangement, 1999-2019
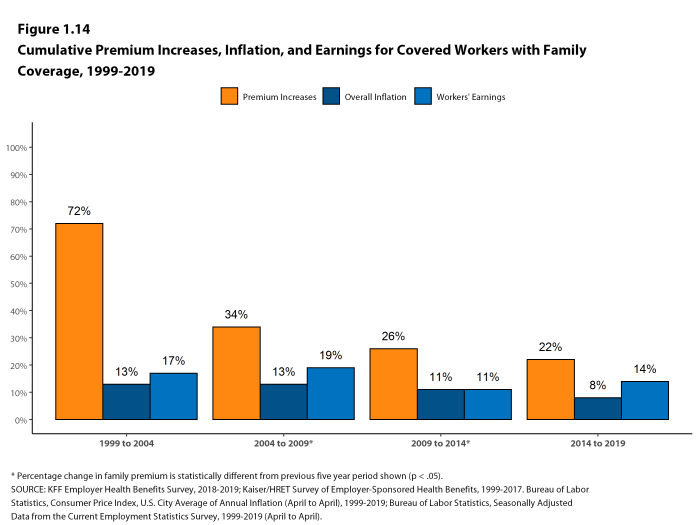
Figure 1.14: Cumulative Premium Increases, Inflation, and Earnings for Covered Workers With Family Coverage, 1999-2019
Section Two: Health Benefits Offer Rates
While nearly all large firms (200 or more workers) offer health benefits to at least some workers, small firms (3-199 workers) are significantly less likely to do so. The percentage of all firms offering health benefits in 2019 (57%) is similar to the percentages of firms offering health benefits last year (57%), five years ago (55%), and ten years ago (59%).
Firms not offering health benefits continue to cite cost as the most important reason they do not do so. Almost all firms that offer coverage offer benefits to dependents such as children and the spouses of eligible employees.
FIRM OFFER RATES
- In 2019, 57% of firms offer health benefits, the same percentage as last year [Figure 2.1].
- The overall percentage of firms offering health benefits in 2019 is similar to the percentages offering health benefits in 2014 (55%) and in 2009 (59%) [Figure 2.1].
- Ninety-nine percent of large firms offer health benefits to at least some of their workers. In contrast, only 56% of small firms offer health benefits [Figure 2.2] and [Figure 2.3]. The percentages of both small and large firms offering health benefits to at least some of their workers are similar to last year [Figure 2.2].
- The smallest-sized firms are least likely to offer health insurance: 47% of firms with 3-9 workers offer coverage, compared to 77% of firms with 25-49 workers, and 93% of firms with 50-199 workers [Figure 2.3]. Since most firms in the country are small, variation in the overall offer rate is driven largely by changes in the percentages of the smallest firms (3-9 workers) offering health benefits. For more information on the distribution of firms in the country, see the Survey Design and Methods Section and Figure M.6.
- Only fifty-four percent of firms with 3-49 workers offer health benefits to at least some of their workers, compared to 94% of firms with 50 or more workers [Figure 2.4].
- Because most workers are employed by larger firms, most workers work at a firm that offers health benefits to at least some of its employees. Ninety percent of all workers are employed by a firm that offers health benefits to at least some of its workers [Figure 2.6].
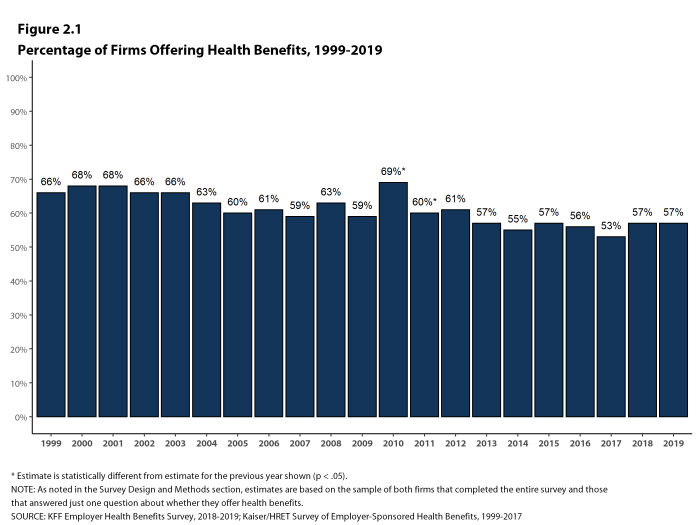
Figure 2.1: Percentage of Firms Offering Health Benefits, 1999-2019
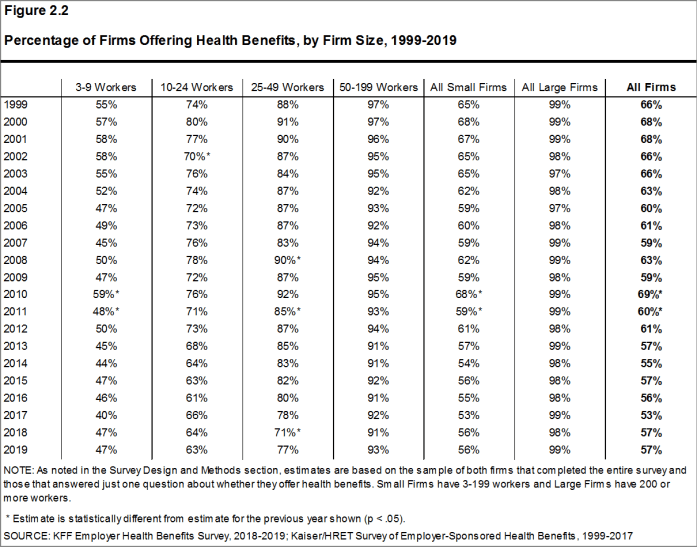
Figure 2.2: Percentage of Firms Offering Health Benefits, by Firm Size, 1999-2019
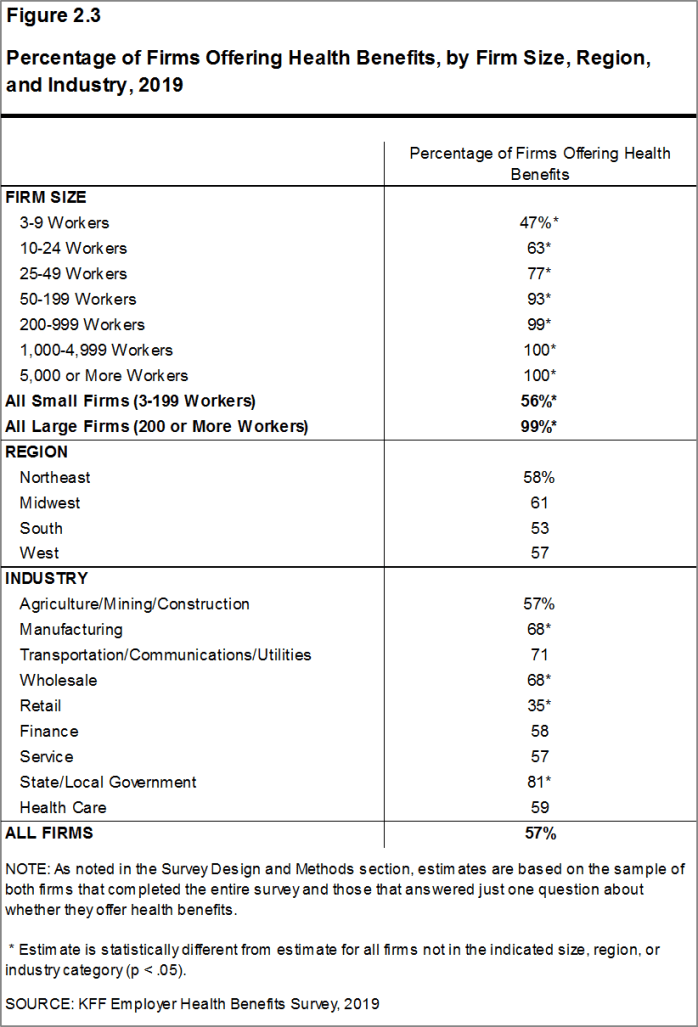
Figure 2.3: Percentage of Firms Offering Health Benefits, by Firm Size, Region, and Industry, 2019
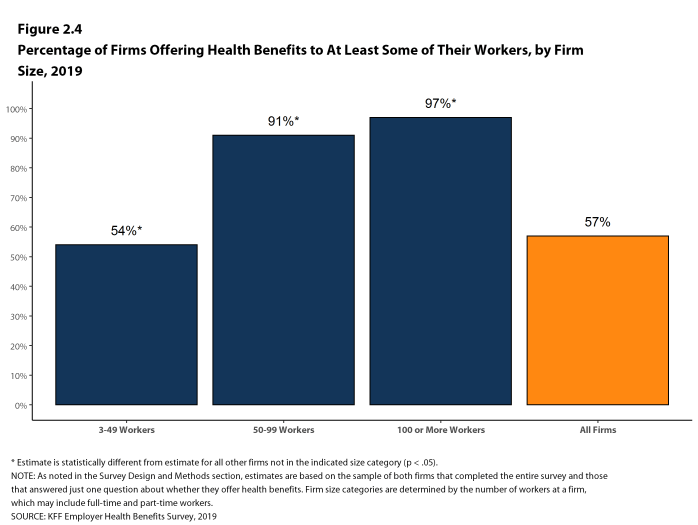
Figure 2.4: Percentage of Firms Offering Health Benefits to at Least Some of Their Workers, by Firm Size, 2019
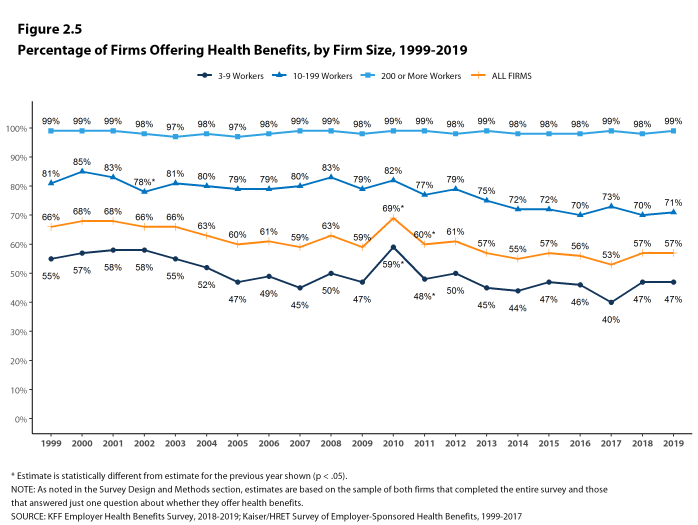
Figure 2.5: Percentage of Firms Offering Health Benefits, by Firm Size, 1999-2019
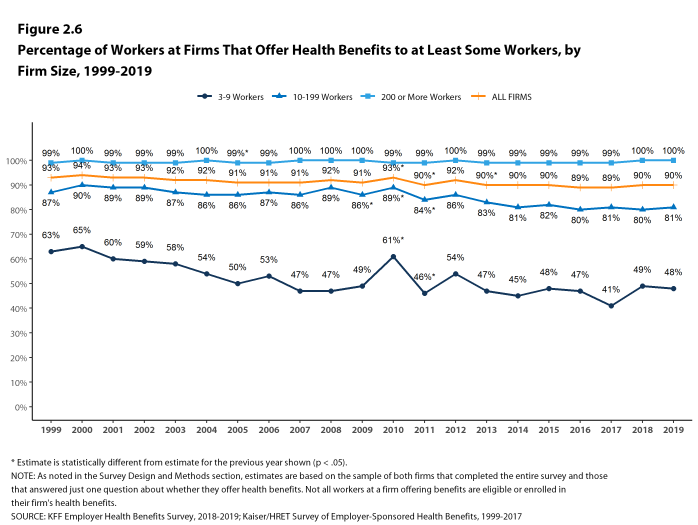
Figure 2.6: Percentage of Workers at Firms That Offer Health Benefits to at Least Some Workers, by Firm Size, 1999-2019
PART-TIME AND TEMPORARY WORKERS
- Among firms offering health benefits, relatively few offer benefits to their part-time and temporary workers.
- The Affordable Care Act (ACA) defines full-time workers as those who on average work at least 30 hours per week, and part-time workers as those who on average work fewer than 30 hours per week. The employer shared responsibility provision of the ACA requires that firms with at least 50 full-time equivalent employees offer most full-time employees coverage that meets minimum standards or be assessed a penalty.12
Beginning in 2015, we modified the survey to explicitly ask employers whether they offered benefits to employees working fewer than 30 hours. Our previous question did not include a definition of “part-time”. For this reason, historical data on part-time offer rates are shown, but we did not test whether the differences between 2014 and 2015 were significant. Many employers may work with multiple definitions of part-time; one for their compliance with legal requirements and another for internal policies and programs.
- In 2019, 28% of all firms that offer health benefits offer them to part-time workers. Small firms and large firms have similar rates of offering to part-time workers [Figure 2.7].
- A small percentage (7%) of firms offering health benefits offer them to temporary workers [Figure 2.8].
- Among firms offering health benefits, large firms are more likely than small firms to offer benefits to temporary workers (13% vs. 7%) [Figure 2.8].
- The percentage of large firms offering health benefits to temporary workers is not statistically different from the 14% reported in 2018, but is an increase from ten years ago (5%) [Figure 2.10].
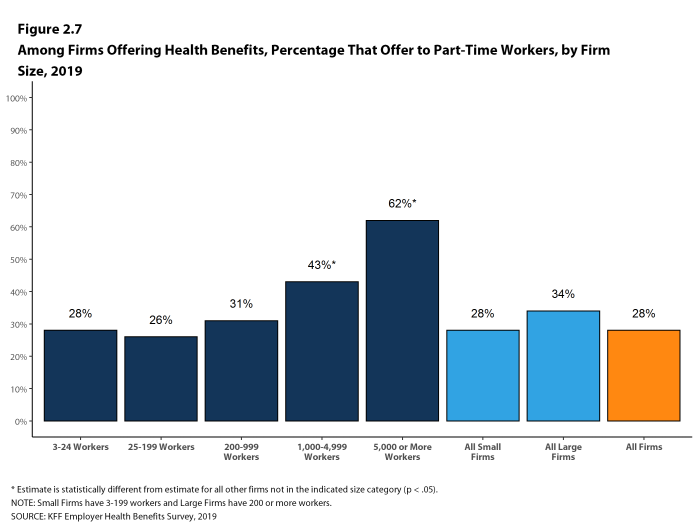
Figure 2.7: Among Firms Offering Health Benefits, Percentage That Offer to Part-Time Workers, by Firm Size, 2019
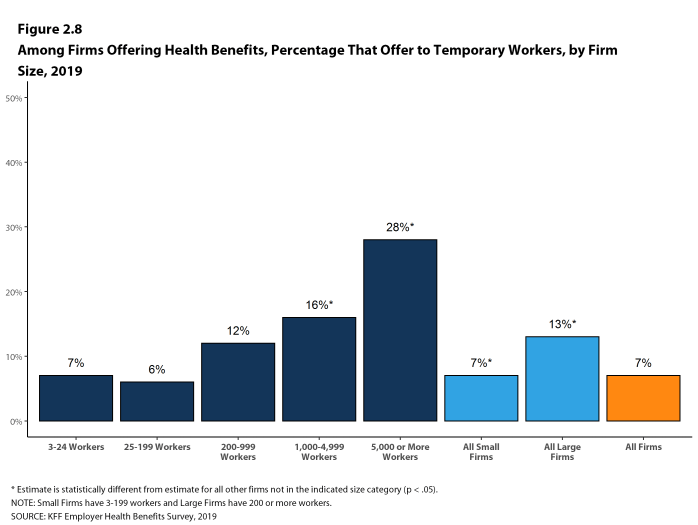
Figure 2.8: Among Firms Offering Health Benefits, Percentage That Offer to Temporary Workers, by Firm Size, 2019
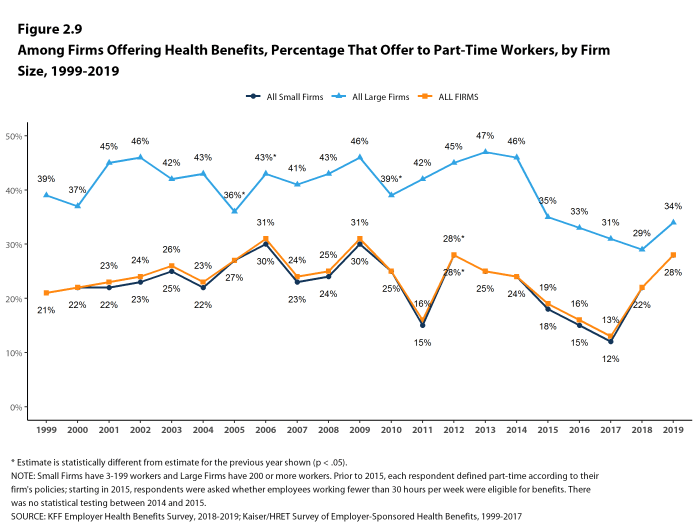
Figure 2.9: Among Firms Offering Health Benefits, Percentage That Offer to Part-Time Workers, by Firm Size, 1999-2019
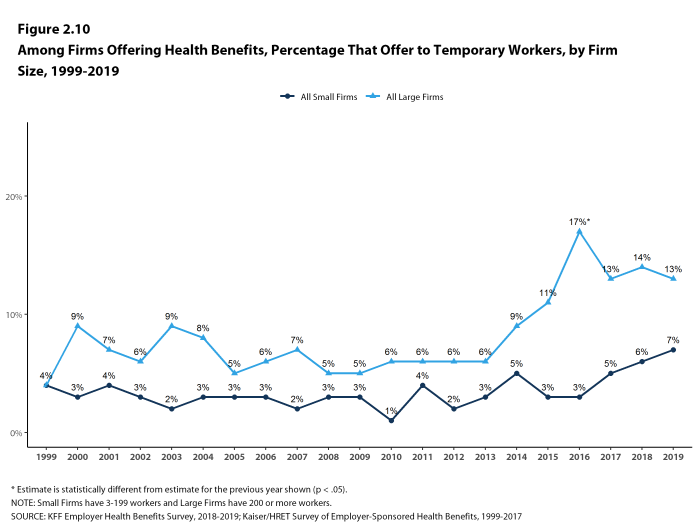
Figure 2.10: Among Firms Offering Health Benefits, Percentage That Offer to Temporary Workers, by Firm Size, 1999-2019
SPOUSES, DEPENDENTS, AND DOMESTIC PARTNER BENEFITS
- The vast majority of firms offering health benefits offer to spouses and dependents, such as children.
- In 2019, 94% of firms offering health benefits offer coverage to spouses, similar to the percentage last year [Figure 2.11].
- Ninety-four percent of small firms and 100% of large firms offering health benefits cover dependents other than spouses, such as children, similar to the percentages last year [Figure 2.11].
- Six percent of small firms offering health benefits offer only single coverage to their workers, similar to the percentage last year [Figure 2.11].
- Firms were also asked whether they offer health benefits to same-sex or opposite-sex domestic partners. While definitions may vary, employers often define domestic partners as an unmarried couple who has lived together for a specified period of time. Firms may define domestic partners separately from any legal requirements a state may have.
- Thirty-four percent of firms offering health benefits offer coverage to opposite-sex domestic partners, similar to the 45% that did so last year.
- Forty-three percent of firms offering health benefits offer coverage to same-sex domestic partners, similar to the 45% that did so last year.
- Thirty-six percent of large firms offering health benefits offer coverage to opposite-sex domestic partners, similar to the 41% that did so last year [Figure 2.13].
- Forty-two percent of large firms offering health benefits offer coverage to same-sex domestic partners, similar to the 47% that did so last year [Figure 2.13].
- When firms are asked if they offer health benefits to opposite or same-sex domestic partners, many small firms report that they have not encountered this issue. These firms may not have formal human resource policies on domestic partners simply because none of the firm’s workers have asked to cover a domestic partner. Regarding health benefits for opposite-sex domestic partners, 20% of small firms report that they have not encountered this request or that the question was not applicable. Similarly, for health benefits for same-sex domestic partners, 26% of small firms report that they have not encountered the request or that the question was not applicable [Figure 2.12].
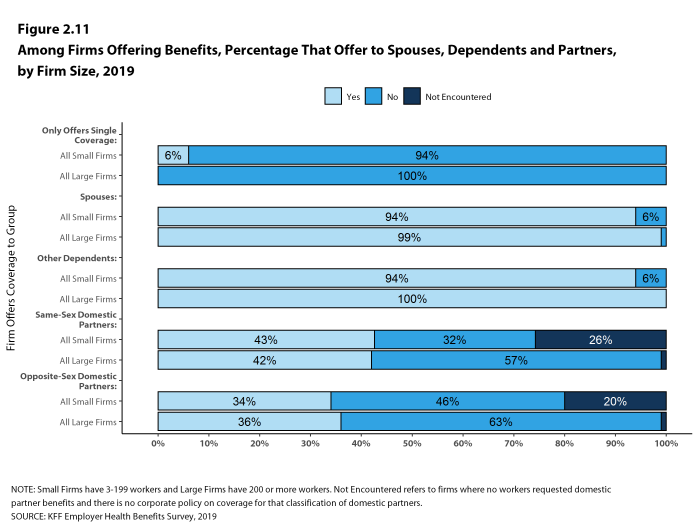
Figure 2.11: Among Firms Offering Benefits, Percentage That Offer to Spouses, Dependents and Partners, by Firm Size, 2019
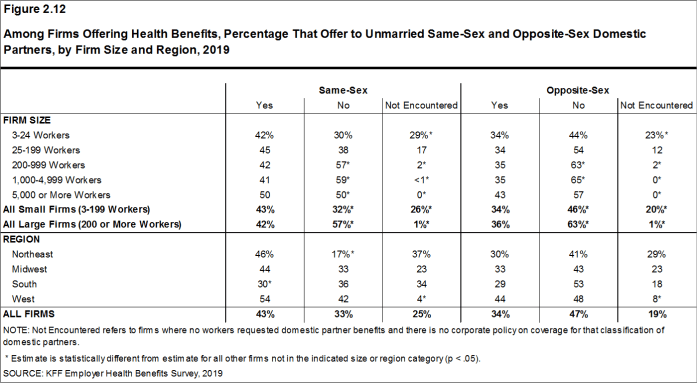
Figure 2.12: Among Firms Offering Health Benefits, Percentage That Offer to Unmarried Same-Sex and Opposite-Sex Domestic Partners, by Firm Size and Region, 2019
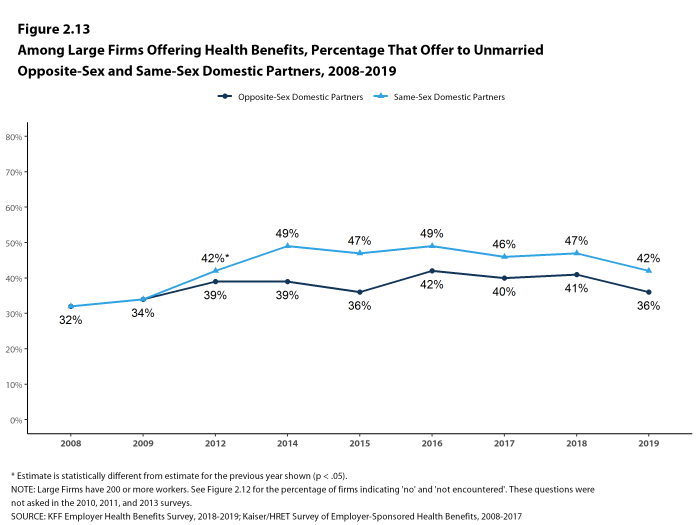
Figure 2.13: Among Large Firms Offering Health Benefits, Percentage That Offer to Unmarried Opposite-Sex and Same-Sex Domestic Partners, 2008-2019
SPOUSAL SURCHARGES
Some employers place conditions on the ability of dependent spouses to enroll in a health plan if the spouse is offered health insurance from another source, such as his or her own place of work.
- Among firms offering health benefits to spouses, 87% say that an employee’s spouse is able to enroll in the employee’s health plan even if the spouse is offered coverage from another source, 2% say the spouse can enroll subject to some conditions (for example, the type of coverage offered), and 12% say that the spouse is not eligible to enroll [Figure 2.14].
- Among large firms that say that spouses are eligible to enroll in an employee’s health plan even if the spouse has access to coverage from another source, 10% require the spouse to pay more to enroll than other spouses, such as a higher premium contribution or cost sharing [Figure 2.15].
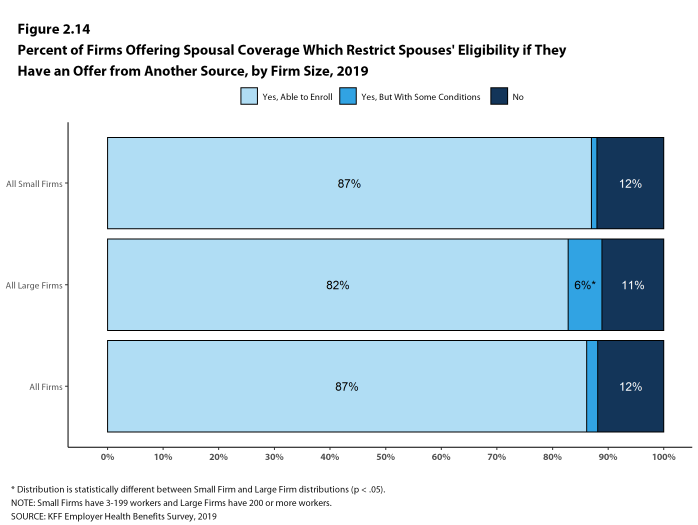
Figure 2.14: Percent of Firms Offering Spousal Coverage Which Restrict Spouses’ Eligibility If They Have an Offer From Another Source, by Firm Size, 2019

Figure 2.15: Among Large Firms That Offer Spousal Coverage, Spouses’ Eligibility If They Have an Offer From Another Source, by Firm Size, 2019
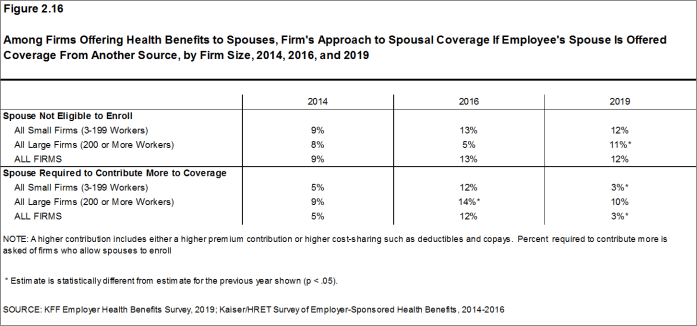
Figure 2.16: Among Firms Offering Health Benefits to Spouses, Firm’s Approach to Spousal Coverage If Employee’s Spouse Is Offered Coverage From Another Source, by Firm Size, 2014, 2016, and 2019
VOLUNTARY INSURANCE BENEFITS
Many firms offer voluntary benefits to their workers, separate from coverage provided through their health plans. These plans can help with costs that are not covered by the health plan or provide additional financial assistance if the enrollee is hospitalized or develops a serious health condition. Employers sometimes contribute toward the cost of these benefits, while other times employees pay the entire cost.
- Among firms offering health benefits in 2019, 59% of small firms and 92% of large firms offer a dental insurance program to their workers seperate from any plan included in their plan [Figure 2.17].
- Sixty-three percent of firms offering a dental program to their workers make a contribution toward the cost of the coverage [Figure 2.18].
- Among large firms offering health benefits in 2019, 92% offer a dental insurance program to their workers, a change from 97% in 2017 when this question was last asked [Figure 2.20]. However, among large firms that offer health benefits, offers of both dental and vision coverage have increased since 2010 from 87% and 53%, respectively [Figure 2.21].
- Among firms offering health benefits in 2019, 44% of small firms and 83% of large firms offer a vision insurance program to their workers seperate from any plan included in their plan [Figure 2.17].
- Forty-seven percent of firms offering a vision program to their workers make a contribution toward the cost of the coverage [Figure 2.18].
- Among firms offering health benefits in 2019, 23% of small firms and 62% of large firms offer critical illness insurance to their workers [Figure 2.17].
- Twenty percent of firms offering critical insurance to their workers make a contribution toward the cost of the coverage [Figure 2.18].
- Among firms offering health benefits in 2019, 18% offer long-term care insurance to their workers [Figure 2.17].
- Thirty-six percent of firms offering long-term care insurance to their workers make a contribution toward the cost of the coverage [Figure 2.18].
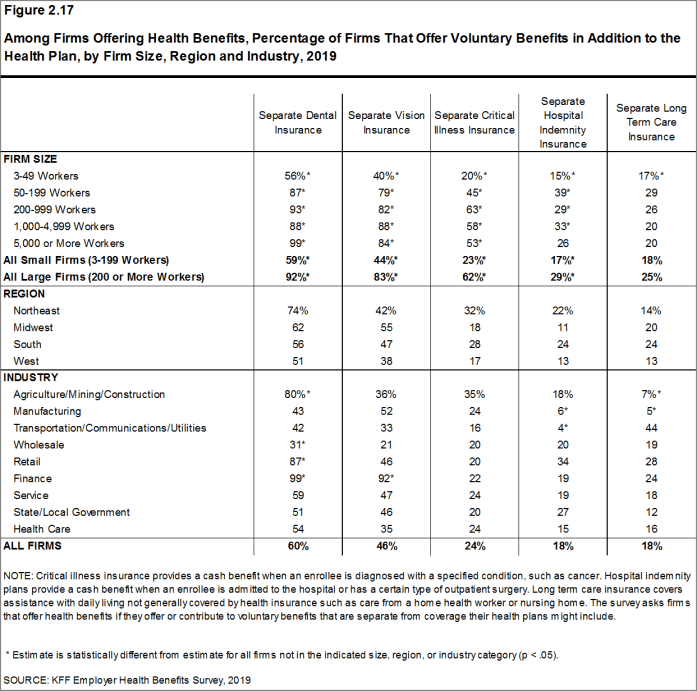
Figure 2.17: Among Firms Offering Health Benefits, Percentage of Firms That Offer Voluntary Benefits in Addition to the Health Plan, by Firm Size, Region and Industry, 2019
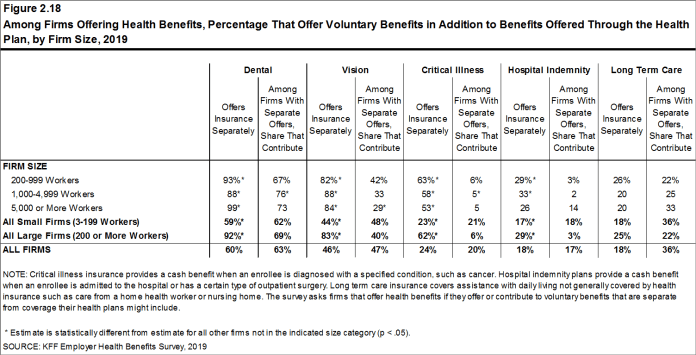
Figure 2.18: Among Firms Offering Health Benefits, Percentage That Offer Voluntary Benefits in Addition to Benefits Offered Through the Health Plan, by Firm Size, 2019

Figure 2.19: Among Firms Offering Health Benefits, Percentage of Firms That Offer Voluntary Insurance Benefits in Addition to Benefits Offered Through the Health Plan, by Firm Size, 2019
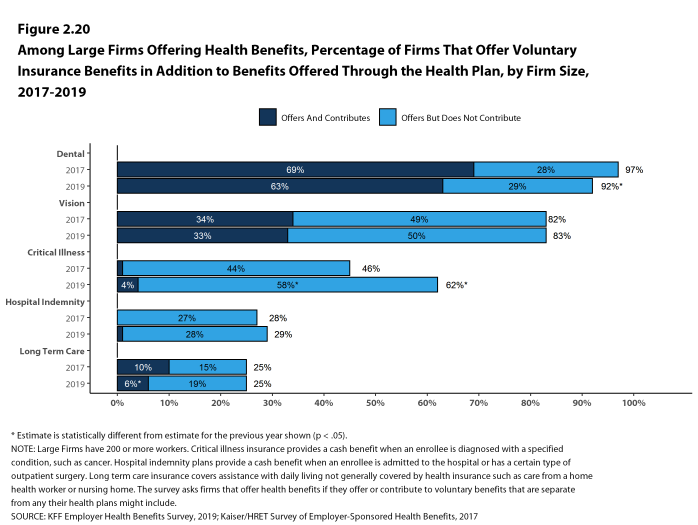
Figure 2.20: Among Large Firms Offering Health Benefits, Percentage of Firms That Offer Voluntary Insurance Benefits in Addition to Benefits Offered Through the Health Plan, by Firm Size, 2017-2019
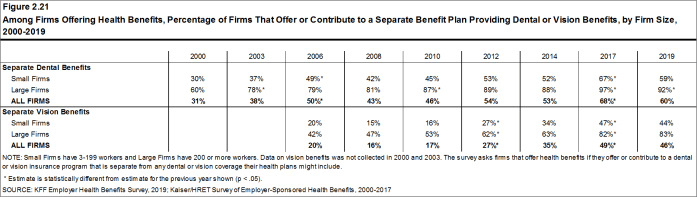
Figure 2.21: Among Firms Offering Health Benefits, Percentage of Firms That Offer or Contribute to a Separate Benefit Plan Providing Dental or Vision Benefits, by Firm Size, 2000-2019
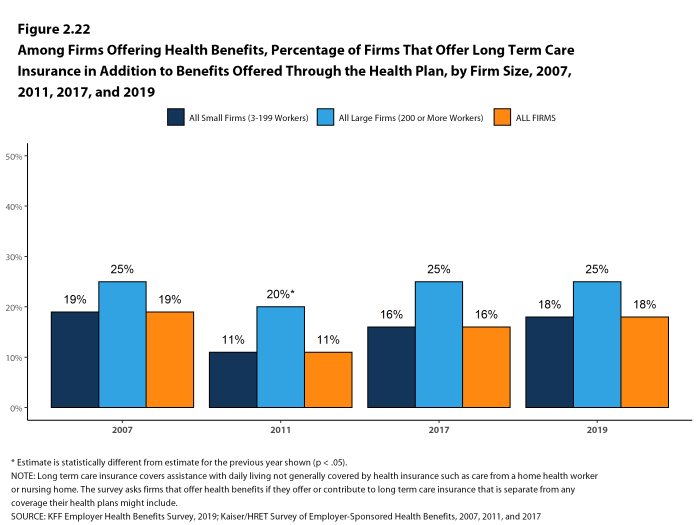
Figure 2.22: Among Firms Offering Health Benefits, Percentage of Firms That Offer Long Term Care Insurance in Addition to Benefits Offered Through the Health Plan, by Firm Size, 2007, 2011, 2017, and 2019
FIRMS NOT OFFERING HEALTH BENEFITS
- The survey asks firms that do not offer health benefits if they have offered insurance or shopped for insurance in the recent past, and about their most important reasons for not offering coverage. Because such a small percentage of large firms report not offering health benefits, we present responses for small non-offering firms only.
- The cost of health insurance remains the primary reason cited by firms for not offering health benefits. Among small firms not offering health benefits, 43% cite high cost as “the most important reason” for not doing so, followed by employees being covered by another plan (17%), then “the firm is too small” (13%). Few small firms indicate that they do not offer because they believe employees will get a better deal on the health insurance exchanges (2%) [Figure 2.23].
- Some small non-offering firms have either offered health insurance in the past five years or shopped for health insurance in the past year.
- Thirteen percent of small non-offering firms have offered health benefits in the past five years, similar to the percentage reported last year [Figure 2.24].
- Fourteen percent of small non-offering firms have shopped for coverage in the past year, a decrease from last year (24%) [Figure 2.24].
- Among small non-offering firms that report they stopped offering coverage within the past five years, 8% stopped offering coverage within the past year, similar to the percentage reported last year.
- Among small non-offering firms, 11% report that they provide funds to their employees to purchase health insurance on their own in the individual market or through a health insurance exchange [Figure 2.25].
- Seventy percent of small firms (3-199 employees) not offering health benefits believed that their employees would prefer a two dollar per hour increase in wages rather than health insurance. [Figure 2.26]. The percentage of small employers who believe that their employees would prefer a wage increase is the similar as 2014, the last time the survey asked this question.
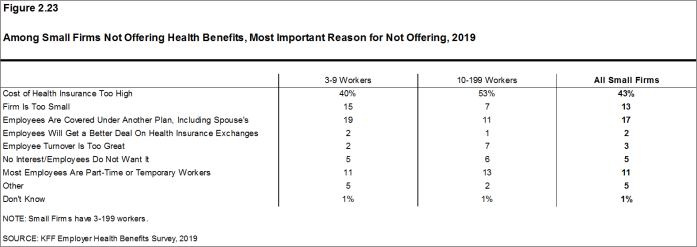
Figure 2.23: Among Small Firms Not Offering Health Benefits, Most Important Reason for Not Offering, 2019
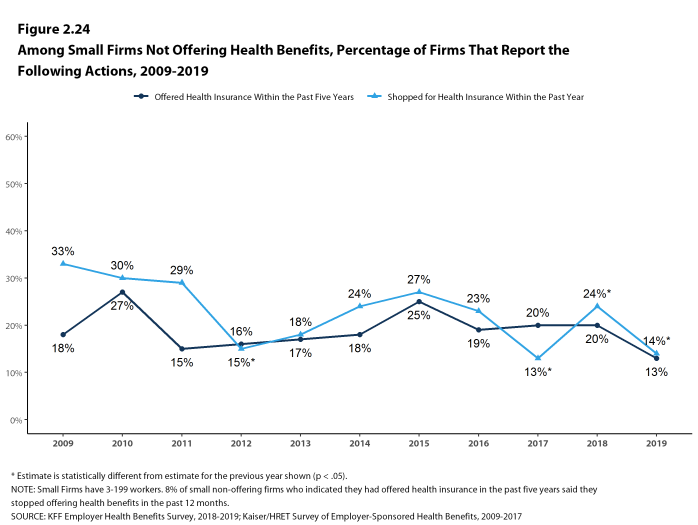
Figure 2.24: Among Small Firms Not Offering Health Benefits, Percentage of Firms That Report the Following Actions, 2009-2019
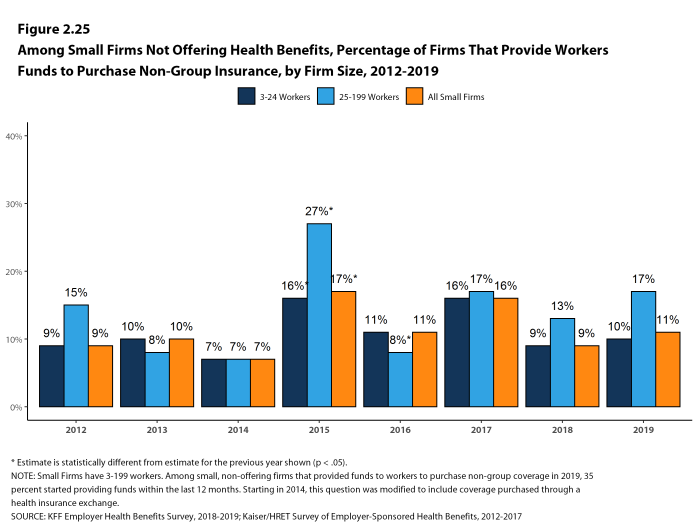
Figure 2.25: Among Small Firms Not Offering Health Benefits, Percentage of Firms That Provide Workers Funds to Purchase Non-Group Insurance, by Firm Size, 2012-2019
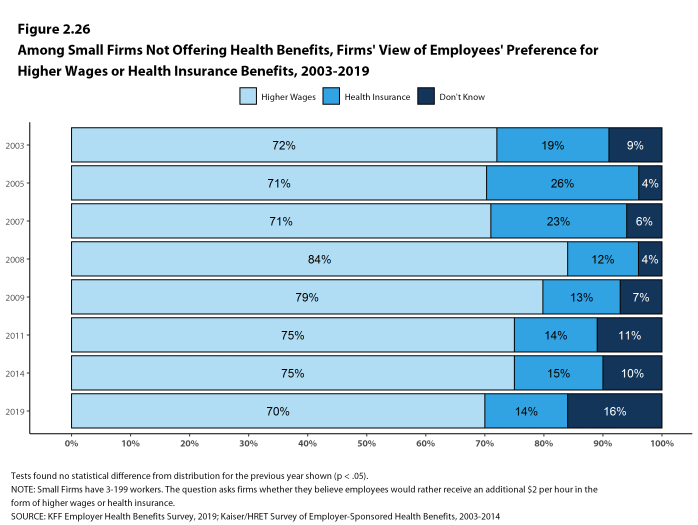
Figure 2.26: Among Small Firms Not Offering Health Benefits, Firms’ View of Employees’ Preference for Higher Wages or Health Insurance Benefits, 2003-2019
- Internal Revenue Code. 26 U.S. Code § 4980H – Shared responsibility for employers regarding health coverage. 2011. https://www.gpo.gov/fdsys/pkg/USCODE-2011-title26/pdf/USCODE-2011-title26-subtitleD-chap43-sec4980H.pdf↩
Section Three: Employee Coverage, Eligibility, And Participation
Employers are the principal source of health insurance in the United States, providing health benefits for about 153 million non-elderly people in America.13 Most workers are offered health coverage at work, and most of the workers who are offered coverage take it. Workers may not be covered by their own employer for several reasons: their employer may not offer coverage, they may not be eligible for the benefits offered by their firm, they may elect to receive coverage through their spouse’s employer, or they may refuse coverage from their firm. In 2019, 61% of workers in firms offering health benefits are covered by their own firm, similar to the percentages last year and five years ago, but lower than the share (65%) in 2009. The share of eligible workers taking up benefits in offering firms (76%) is lower than the share in 2014 (80%) and in 2009 (81%)
ELIGIBILITY
- Even in firms that offer health benefits, some workers may not be eligible to participate.14 Many firms, for example, do not offer coverage to part-time or temporary workers. Among workers in firms offering health benefits in 2019, 80% are eligible to enroll in the benefits offered by their firm, similar to the percentages last year, five years ago, and 10 years ago, for both small and large firms [Figure 3.1].
- The percentage of workers eligible to enroll in health benefits at their firm is relatively higher in firms with 25-49 workers (87%), and relatively lower in firms with 5,000 or more workers (76%) [Figure 3.3].
- Eligibility varies considerably by firm wage level. Workers in firms with a relatively large share of lower-wage workers (where at least 35% of workers earn $25,000 a year or less) have a lower average eligibility rate than workers in firms with a smaller share of lower-wage workers (66% vs. 81%) [Figure 3.6].
- Workers in firms with a relatively large share of higher-wage workers (where at least 35% earn $63,000 or more annually) have a higher average eligibility rate than workers in firms with a smaller share of higher-wage workers (86% vs. 75%) [Figure 3.6].
- Eligibility also varies by the age of the workforce. Those in firms with a relatively small share of younger workers (where fewer than 35% of the workers are age 26 or younger) have a higher average eligibility rate than those in firms with a larger share of younger workers (83% vs. 63%) [Figure 3.6].
- Eligibility rates vary considerably for workers in different industries. The average eligibility rate remains particularly low for workers in retail firms (51%) [Figure 3.3].
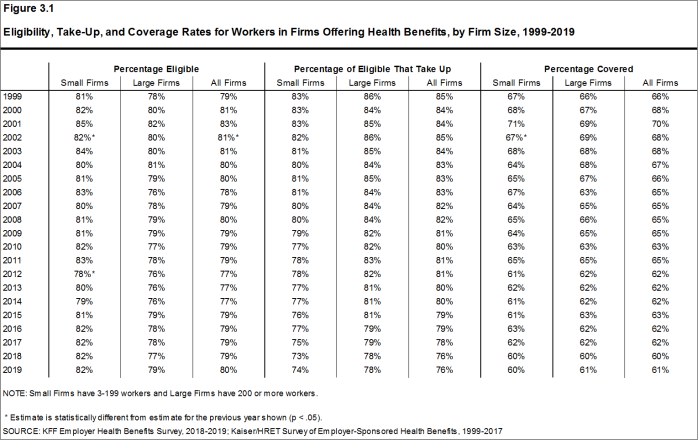
Figure 3.1: Eligibility, Take-Up, and Coverage Rates for Workers in Firms Offering Health Benefits, by Firm Size, 1999-2019
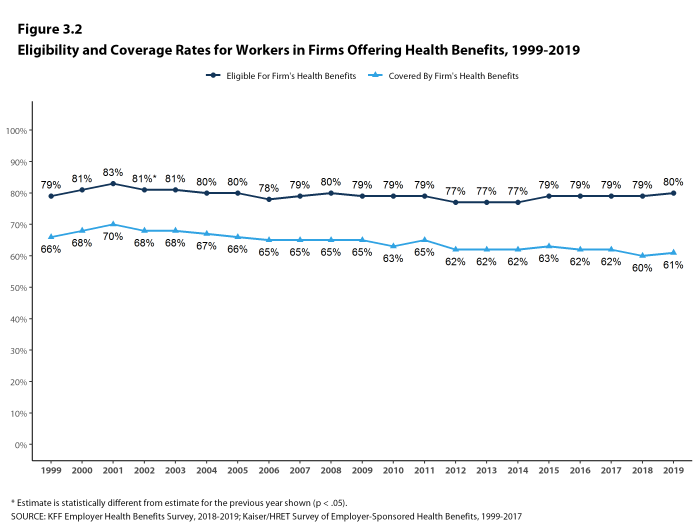
Figure 3.2: Eligibility and Coverage Rates for Workers in Firms Offering Health Benefits, 1999-2019
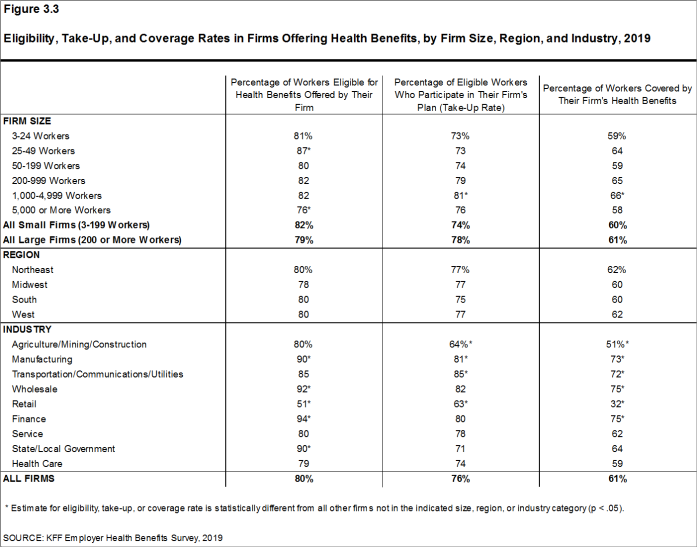
Figure 3.3: Eligibility, Take-Up, and Coverage Rates in Firms Offering Health Benefits, by Firm Size, Region, and Industry, 2019
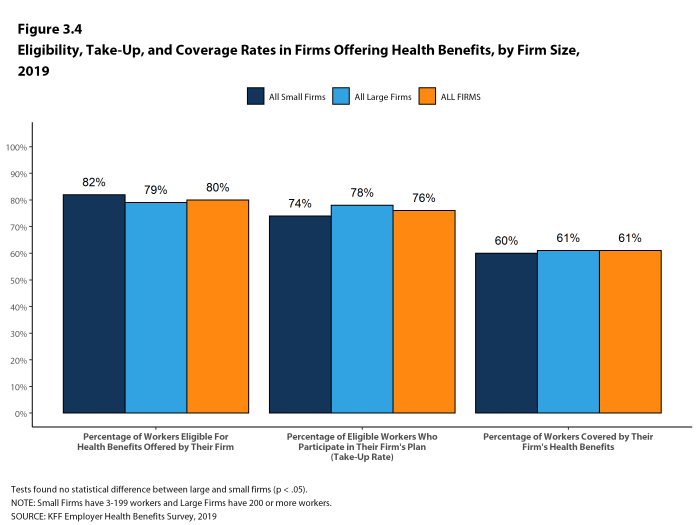
Figure 3.4: Eligibility, Take-Up, and Coverage Rates in Firms Offering Health Benefits, by Firm Size, 2019
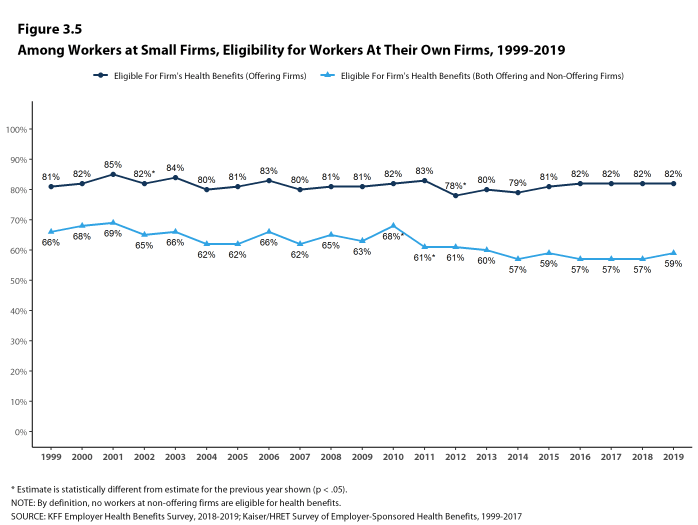
Figure 3.5: Among Workers at Small Firms, Eligibility for Workers at Their Own Firms, 1999-2019
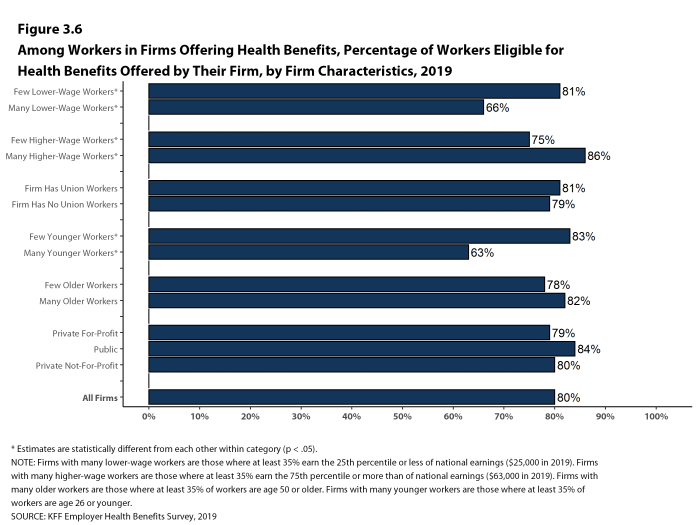
Figure 3.6: Among Workers in Firms Offering Health Benefits, Percentage of Workers Eligible for Health Benefits Offered by Their Firm, by Firm Characteristics, 2019
TAKE-UP RATE
- Seventy-six percent of eligible workers take up coverage when it is offered to them, similar to the percentage last year [Figure 3.1].15
- The likelihood of a worker accepting a firm’s offer of coverage varies by firm wage level. Eligible workers in firms with a relatively large share of lower-wage workers have a lower average take up rate than eligible workers in firms with a smaller share of lower-wage workers (51% vs. 78%) [Figure 3.7].
- Eligible workers in firms with a relatively large share of higher-wage workers have a higher average take up rate than those in firms with a smaller share of higher-wage workers (83% vs. 71%) [Figure 3.7].
- The likelihood of a worker accepting a firm’s offer of coverage also varies with the age distribution of the workforce. Eligible workers in firms with a relatively large share of younger workers have a lower average take up rate than those in firms with a smaller share of younger workers (65% vs. 78%) [Figure 3.7].
- Eligible workers in firms with a relatively large share of older workers have a higher average take up rate than those in firms with a smaller share of older workers (81% vs. 73%) [Figure 3.7].
- Eligible workers in private, for-profit firms firms have a lower average take up rate (74%) than workers in other firm types [Figure 3.7].
- Eligible workers in firms with some union workers have a higher average takeup rate than those in firms with no union workers (83% vs. 74%) [Figure 3.7].
- The percentage of eligible workers taking up benefits in offering firms also varies by industry [Figure 3.3].
- The share of eligible workers taking up benefits in offering firms (76%) is lower than the share in 2014 (80%) and in 2009 (81%) [Figure 3.1].
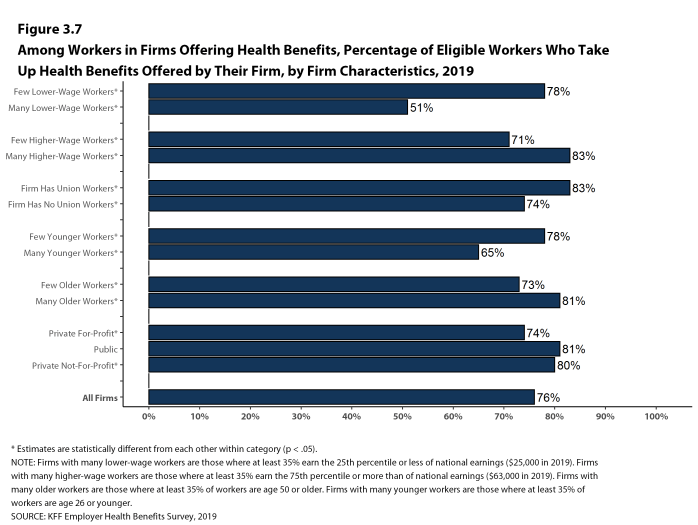
Figure 3.7: Among Workers in Firms Offering Health Benefits, Percentage of Eligible Workers Who Take Up Health Benefits Offered by Their Firm, by Firm Characteristics, 2019
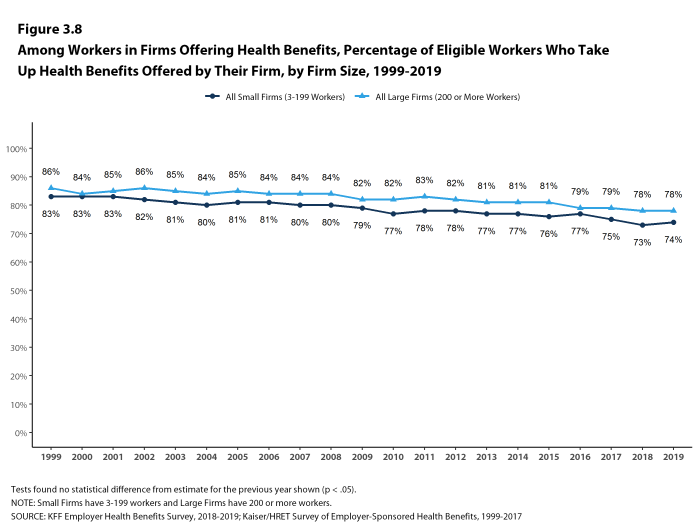
Figure 3.8: Among Workers in Firms Offering Health Benefits, Percentage of Eligible Workers Who Take Up Health Benefits Offered by Their Firm, by Firm Size, 1999-2019
COVERAGE
- In 2019, the percentage of workers at firms offering health benefits covered by their firm’s health plan is 61%, similar to the percentage last year [Figure 3.1] and [Figure 3.2].
- The coverage rate at firms offering health benefits is similar for small firms and large firms in 2019. These rates are similar to the rates last year for both small firms and large firms [Figure 3.1].
- There is significant variation by industry in the coverage rate among workers in firms offering health benefits. The average coverage rate is particularly low in the retail industry (32%) [Figure 3.3].
- There also is variation by firm wage levels. Among workers in firms offering health benefits, those in firms with a relatively large share of lower-wage workers are less likely to be covered by their own firm than workers in firms with a smaller share of lower-wage workers (33% vs. 63%). A comparable pattern exists in firms with a relatively large share of higher-wage workers, with workers in these firms being more likely to be covered by their employer’s health benefits than those in firms with a smaller share of higher-wage workers (71% vs. 53%) [Figure 3.9].
- The age profile of workers is also related to variation in coverage rates. Among workers in firms offering health benefits, those in firms with a relatively small share of younger workers are more likely to be covered by their own firm than those in firms with a larger share of younger workers (64% vs. 41%). Similarly, workers in offering firms with a relatively large share of older workers are more likely to be covered by their own firm than those in firms with a smaller share of older workers (66% vs. 57%) [Figure 3.9].
- Among workers in firms offering health benefits, those working in private, for-profit firms are less likely than workers in other firm types to be covered by their own firm [Figure 3.9].
- Among workers in all firms, including those that offer and those that do not offer health benefits, 55% are covered by health benefits offered by their employer, similar to last year, but lower than the coverage rate in 2009 (59%) [Figure 3.10].
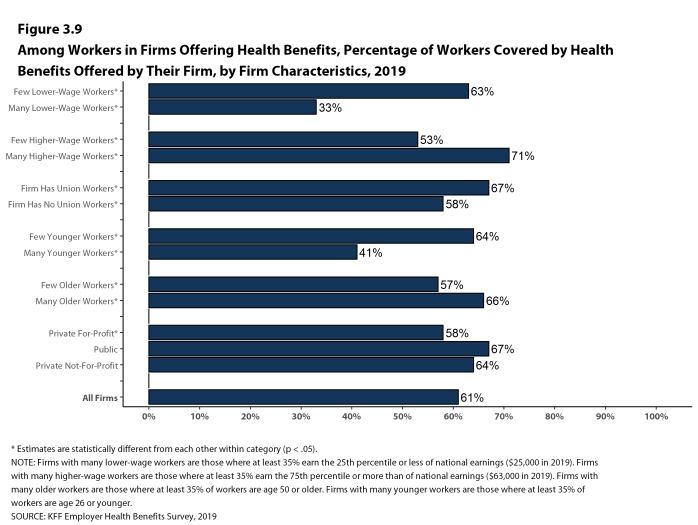
Figure 3.9: Among Workers in Firms Offering Health Benefits, Percentage of Workers Covered by Health Benefits Offered by Their Firm, by Firm Characteristics, 2019
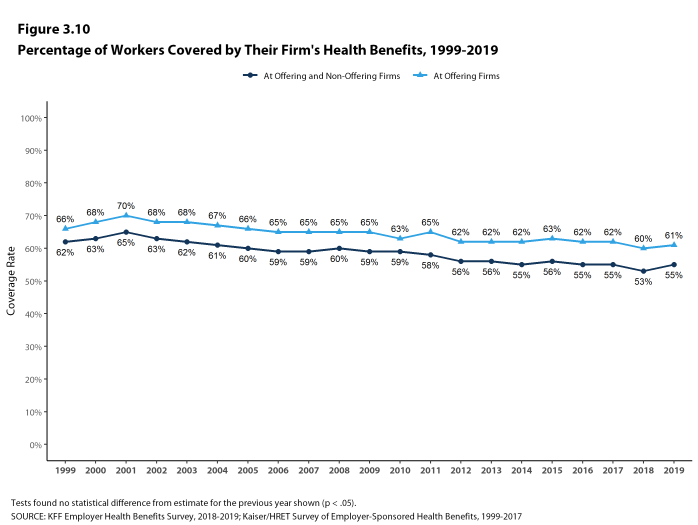
Figure 3.10: Percentage of Workers Covered by Their Firm’s Health Benefits, 1999-2019
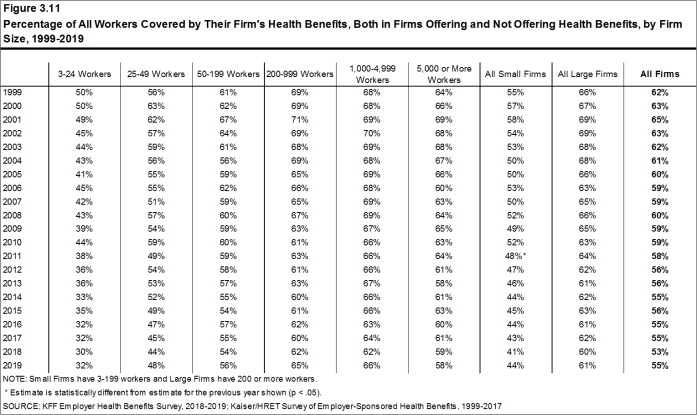
Figure 3.11: Percentage of All Workers Covered by Their Firm’s Health Benefits, Both in Firms Offering and Not Offering Health Benefits, by Firm Size, 1999-2019
- The Uninsured: A Primer – Key Facts about Health Insurance and the Uninsured Under the Affordable Care Act. Washington (DC): The Commission; 2019 Jan (cited 2019 Aug 12). https://www.kff.org/uninsured/report/the-uninsured-a-primer-key-facts-about-health-insurance-and-the-uninsured-under-the-affordable-care-act/. See supplemental tables – Table 1: 267.5 million non-elderly people, 57.1% of whom are covered by employer-sponsored insurance (ESI).↩
- See Section 2 for part-time and temporary worker offer rates.↩
- In 2009, we began weighting the percentage of workers that take up coverage by the number of workers eligible for coverage. The historical take-up estimates have also been updated. See the Survey Design and Methods section for more information.↩
Section Four: Types Of Plans Offered
Most firms that offer health benefits offer only one type of health plan (75%). Large firms (200 or more workers) are more likely than small firms (3-199 workers) to offer more than one type of health plan. Firms are most likely to offer their workers a PPO plan and are least likely to offer a conventional plan (sometimes known as indemnity insurance).
NUMBER OF PLAN TYPES OFFERED
- In 2019, 75% of firms offering health benefits offer only one type of health plan. Large firms are more likely than small firms to offer more than one plan type (61% vs. 24%) [Figure 4.1].
- Sixty-four percent of covered workers are employed in a firm that offers more than one type of health plan. Seventy-five percent of covered workers in large firms are employed by a firm that offers more than one plan type, compared to 37% in small firms [Figure 4.2].
- Seventy-six percent of covered workers in firms offering health benefits work in firms that offer one or more PPOs; 58% work in firms that offer one or more HDHP/SOs; 36% work in firms that offer one or more HMOs; 14% work in firms that offer one or more POS plans; and 2% work in firms that offer one or more conventional plans [Figure 4.4].
- Among covered workers in firms offering only one type of health plan, 52% are in firms that only offer one or more PPOs and 27% are in firms that only offer one or more HDHP/SOs [Figure 4.5].
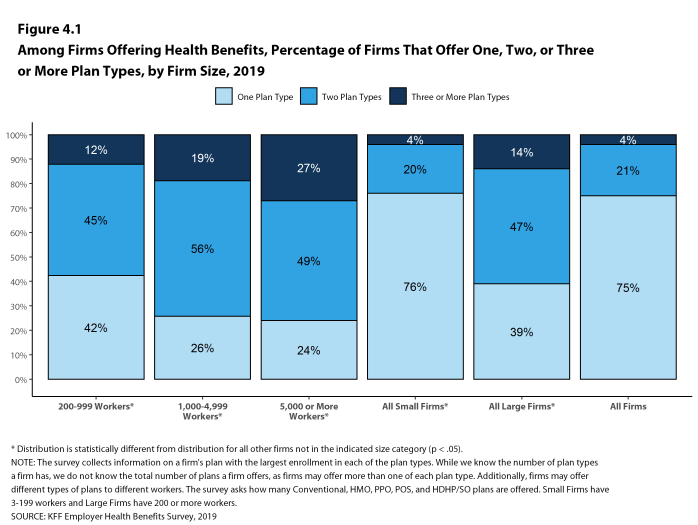
Figure 4.1: Among Firms Offering Health Benefits, Percentage of Firms That Offer One, Two, or Three or More Plan Types, by Firm Size, 2019
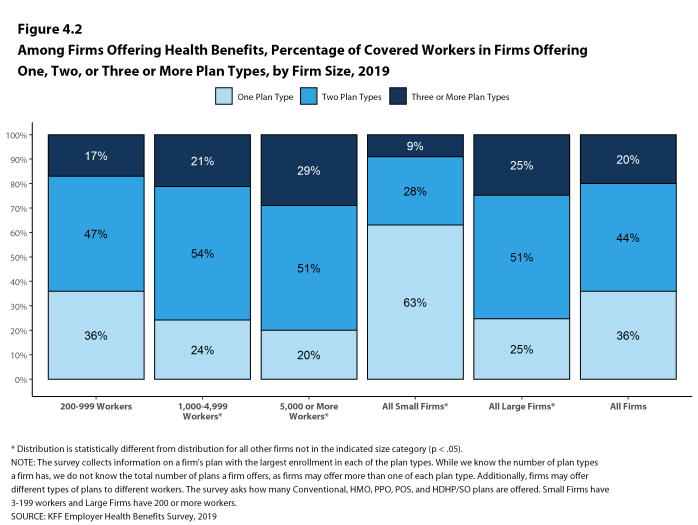
Figure 4.2: Among Firms Offering Health Benefits, Percentage of Covered Workers in Firms Offering One, Two, or Three or More Plan Types, by Firm Size, 2019
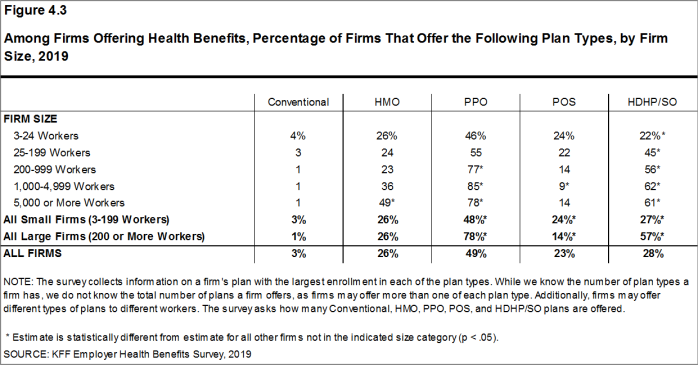
Figure 4.3: Among Firms Offering Health Benefits, Percentage of Firms That Offer the Following Plan Types, by Firm Size, 2019
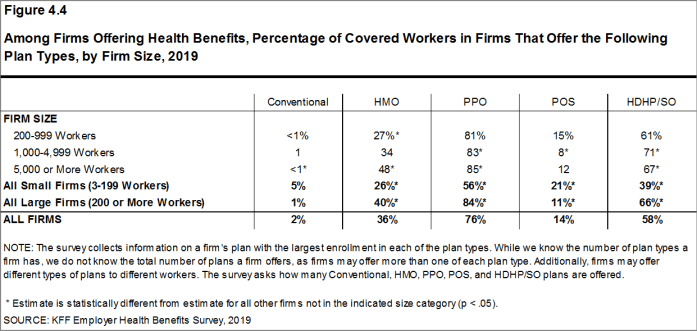
Figure 4.4: Among Firms Offering Health Benefits, Percentage of Covered Workers in Firms That Offer the Following Plan Types, by Firm Size, 2019
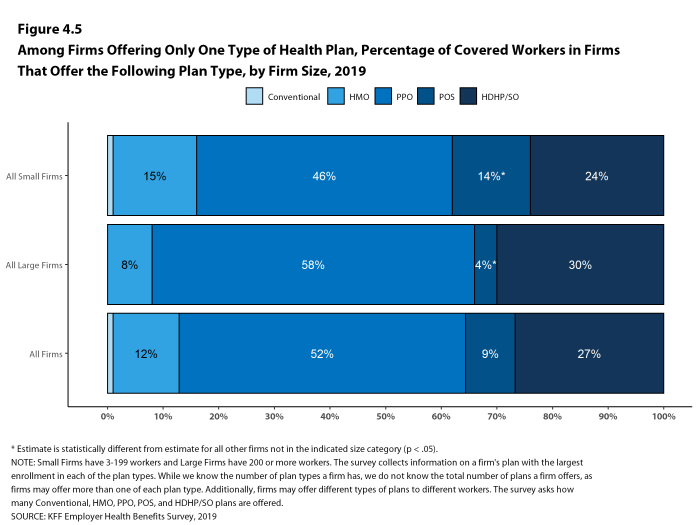
Figure 4.5: Among Firms Offering Only One Type of Health Plan, Percentage of Covered Workers in Firms That Offer the Following Plan Type, by Firm Size, 2019
OTHER ISSUES
- Some firms only offer workers an HDHP/SO, or do not make other plan choices available to some workers. At 45% of firms that offer an HDHP/SO, at least some workers can only choose an HDHP/SO, while 55% of firms that offer an HDHP/SO allow workers to choose between an HDHP/SO and other plan types [Figure 4.6].
- This survey defines Exclusive Provider Organization (EPO) and HMO plans as a single plan type, under the HMO banner. With an EPO, covered workers must receive their care from providers under contract with the health plan. This year we asked respondents which offered this plan type whether they offered an HMO, EPO or both types of plans.
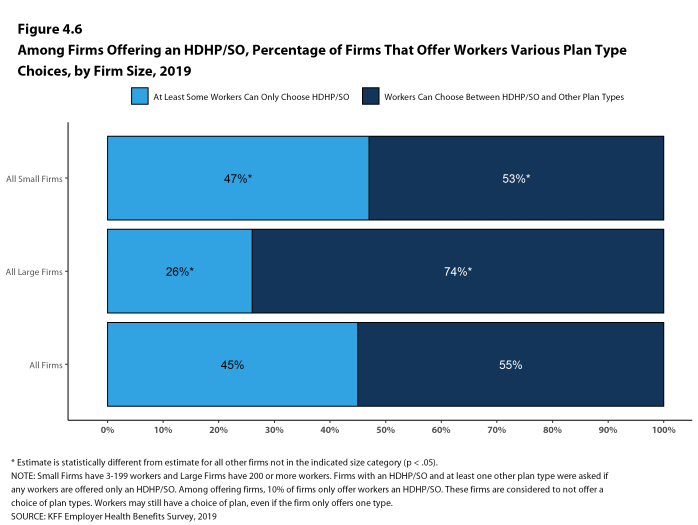
Figure 4.6: Among Firms Offering an HDHP/SO, Percentage of Firms That Offer Workers Various Plan Type Choices, by Firm Size, 2019
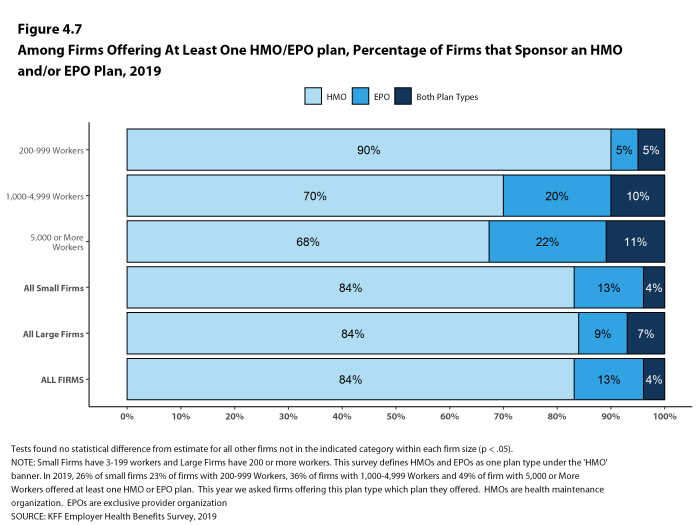
Figure 4.7: Among Firms Offering at Least One Hmo/EPO Plan, Percentage of Firms That Sponsor an HMO And/Or EPO Plan, 2019
The survey collects information on a firm’s plan with the largest enrollment in each of the plan types. While we know the number of plan types a firm has, we do not know the total number of plans a firm offers workers. In addition, firms may offer different types of plans to different workers. For example, some workers might be offered one type of plan at one location, while workers at another location are offered a different type of plan.
Section Five: Market Shares Of Health Plans
PPOs are the most common plan type, covering 44% of covered workers, followed by HDHP/SOs, HMOs, POS plans, and conventional plans. The drop in the share of covered workers in PPOs in 2019 was not statistically significant.
- Forty-four percent of covered workers are enrolled in PPOs, followed by HDHP/SOs (30%), HMOs (19%), POS plans (7%), and conventional plans (1%) [Figure 5.1].
- The percentage of covered workers enrolled in HDHP/SOs is similar to last year, but has increased over the past decade.
- The percentage of covered workers enrolled in PPOs decreased by 16% over the past decade.
- A larger share of covered workers are enrolled in HDHP/SOs than in HMOs in large firms.
- Covered workers in large firms are more likely to be enrolled in PPOs and HDHP/SOs than covered workers in small firms [Figure 5.2]. Covered workers in small firms are much more likely than covered workers in large firms to be enrolled in POS plans (14% vs. 3%) [Figure 5.2].
- Plan enrollment patterns also differ across regions.
- HMO enrollment is significantly higher in the West (35%), and significantly lower in the South (11%) and Midwest (10%) [Figure 5.3].
- Covered workers in the Northeast (39%) are more likely to be enrolled in HDHP/SOs than workers in other regions, while covered workers in the West (20%) are less likely to be enrolled in HDHP/SOs [Figure 5.3].
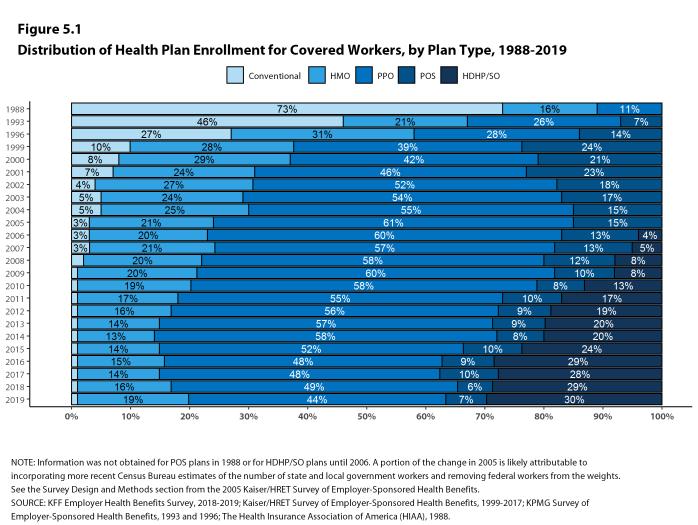
Figure 5.1: Distribution of Health Plan Enrollment for Covered Workers, by Plan Type, 1988-2019
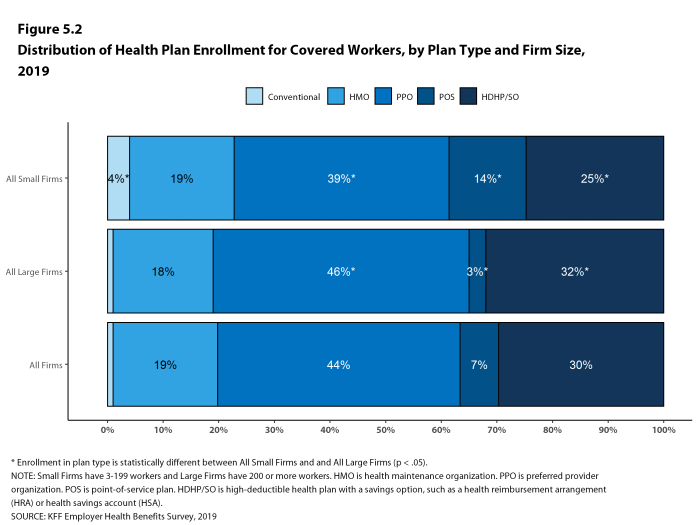
Figure 5.2: Distribution of Health Plan Enrollment for Covered Workers, by Plan Type and Firm Size, 2019
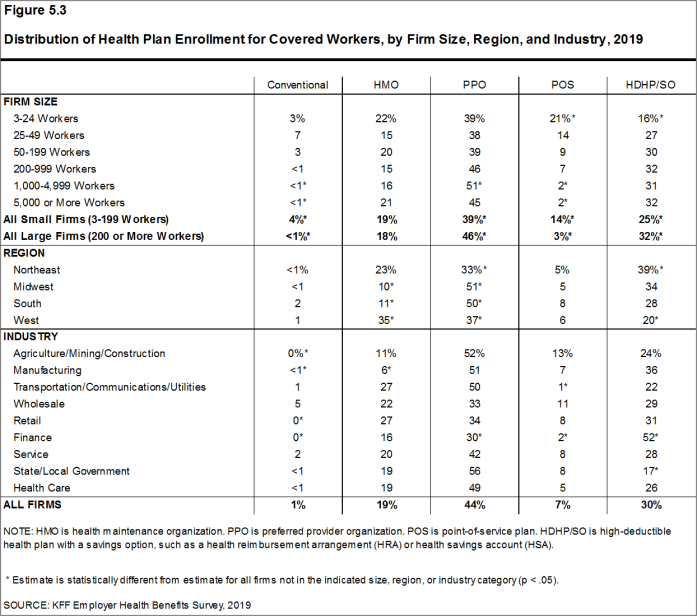
Figure 5.3: Distribution of Health Plan Enrollment for Covered Workers, by Firm Size, Region, and Industry, 2019
Section Six: Worker And Employer Contributions For Premiums
In 2019, premium contributions by covered workers average 18% for single coverage and 30% for family coverage.16 The average monthly worker contributions are $103 for single coverage ($1,242 annually) and $501 for family coverage ($6,015 annually). Compared to covered workers in large firms (200 or more workers), covered workers in small firms (3-199 workers) have a lower contribution, on average, for single coverage ($1,035 vs. $1,330) but ahigher average contribution for family coverage ($7,805 vs. $5,271).
- In 2019, covered workers on average contribute 18% of the premium for single coverage and 30% of the premium for family coverage [Figure 6.1].17 The average percentage contributed for single coverage has remained stable in recent years. While estimates of the average contribution percentage for family coverage have shown small changes in recent years, the differences are not statistically significant.
- Covered workers in small firms on average contribute a much higher percentage of the premium for family coverage (40% vs. 26%) than covered workers in large firms [Figure 6.2].
- Workers with single coverage have an average contribution of $103 per month ($1,242 annually), and workers with family coverage have an average contribution of $501 per month ($6,015 annually) toward their health insurance premiums [Figure 6.3], [Figure 6.4], and [Figure 6.5].
- The average worker contributions in HDHP/SOs are lower than the overall average worker contribution for single coverage ($1,071 vs. $1,242) and family coverage ($4,866 vs. $6,015). The average worker contributions in PPOs are higher than the overall average worker contribution for single coverage ($1,454 vs. $1,242) [Figure 6.6].
- Worker contributions also differ by firm size.
- Covered workers in small firms on average contribute less for single coverage than covered workers in large firms ($1,035 vs. $1,330) [Figure 6.7].
- Covered workers in small firms on average contribute significantly more annually for family coverage ($7,805 vs. $5,271) [Figure 6.7].
- Covered workers working for private, not for profit firms have a relatively low average contribution for single coverage ($1,057) while covered workers working for private for profits firms have a relatively high average contribution for single coverage ($1,341).
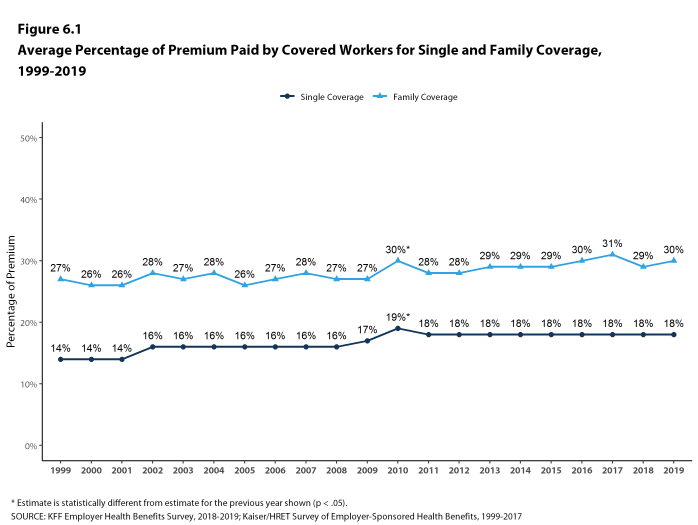
Figure 6.1: Average Percentage of Premium Paid by Covered Workers for Single and Family Coverage, 1999-2019
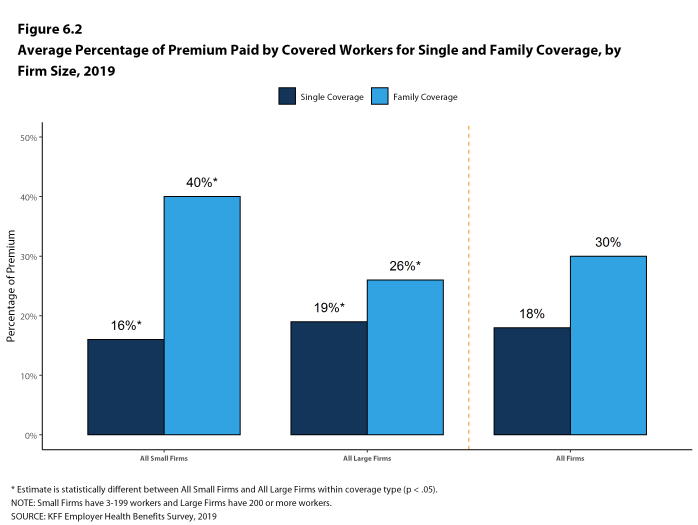
Figure 6.2: Average Percentage of Premium Paid by Covered Workers for Single and Family Coverage, by Firm Size, 2019
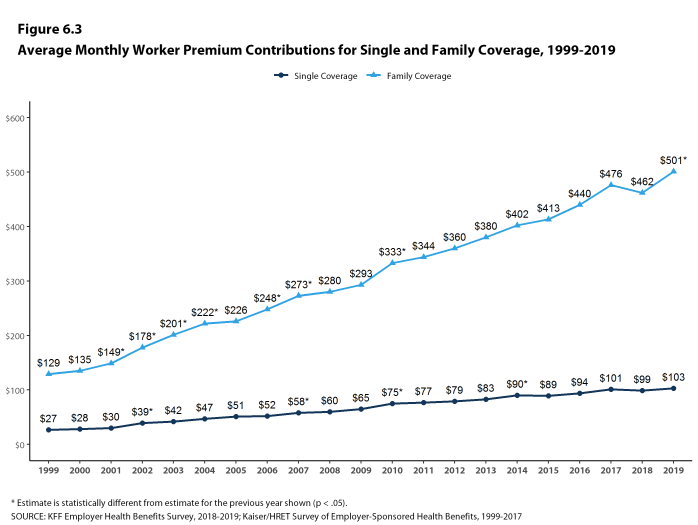
Figure 6.3: Average Monthly Worker Premium Contributions for Single and Family Coverage, 1999-2019
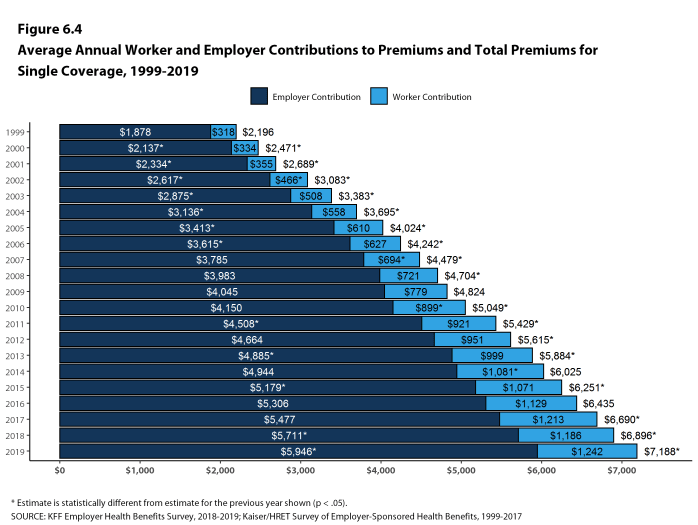
Figure 6.4: Average Annual Worker and Employer Contributions to Premiums and Total Premiums for Single Coverage, 1999-2019
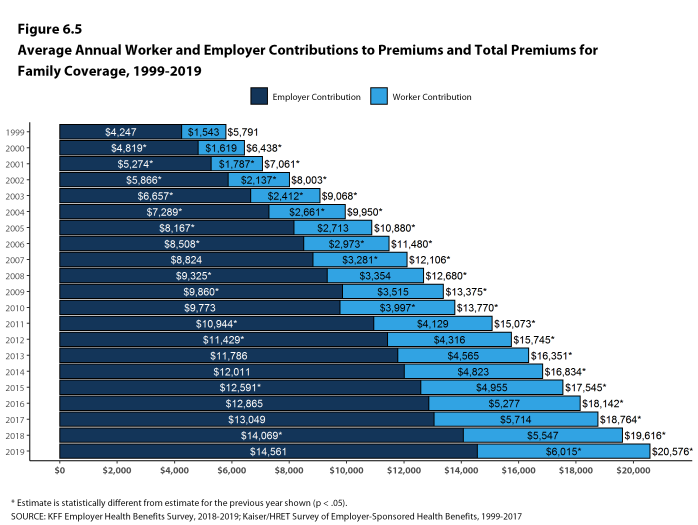
Figure 6.5: Average Annual Worker and Employer Contributions to Premiums and Total Premiums for Family Coverage, 1999-2019
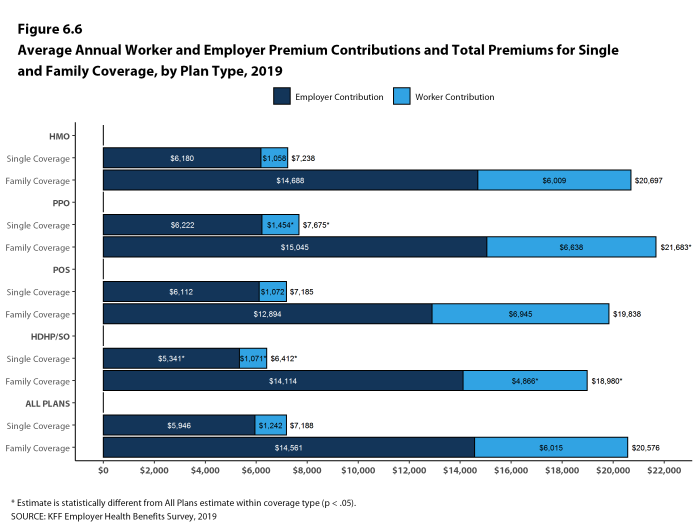
Figure 6.6: Average Annual Worker and Employer Premium Contributions and Total Premiums for Single and Family Coverage, by Plan Type, 2019
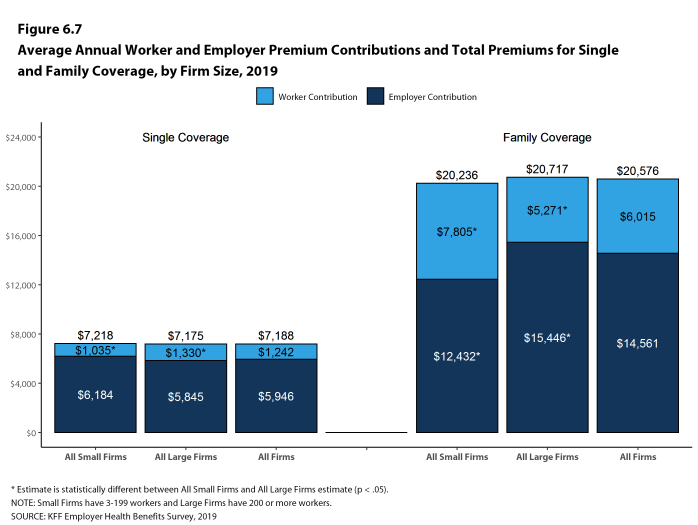
Figure 6.7: Average Annual Worker and Employer Premium Contributions and Total Premiums for Single and Family Coverage, by Firm Size, 2019
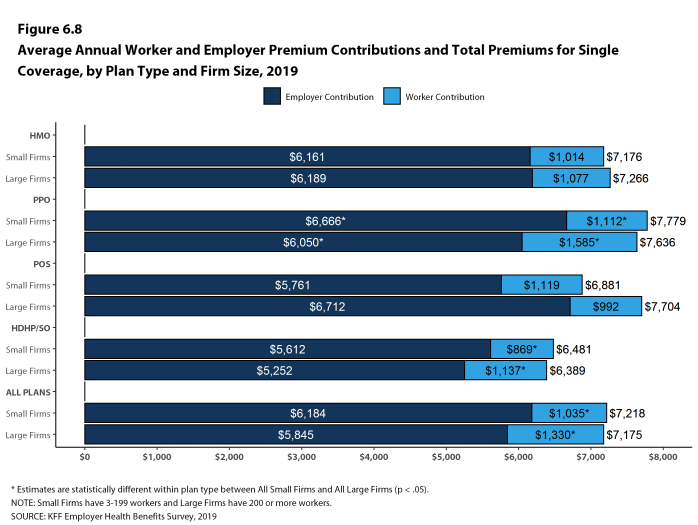
Figure 6.8: Average Annual Worker and Employer Premium Contributions and Total Premiums for Single Coverage, by Plan Type and Firm Size, 2019
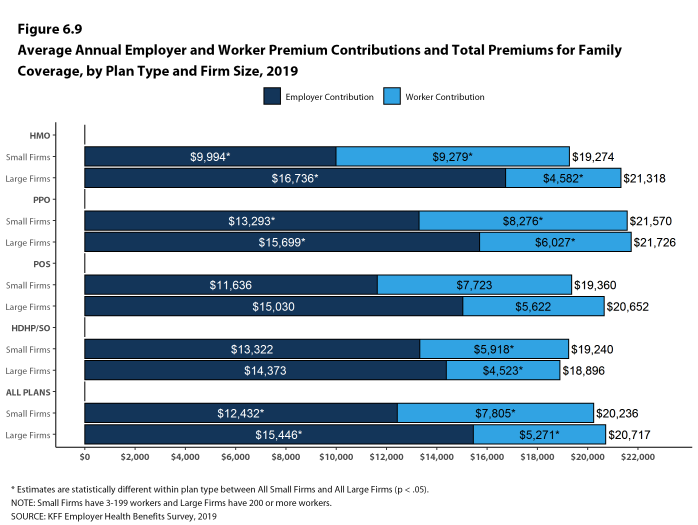
Figure 6.9: Average Annual Employer and Worker Premium Contributions and Total Premiums for Family Coverage, by Plan Type and Firm Size, 2019
DISTRIBUTIONS OF WORKER CONTRIBUTIONS TO THE PREMIUM
- About nine-tenths of covered workers are in a plan where the employer contributes at least half of the premium for both single and family coverage.
- Thirteen percent of covered workers are in a plan where the employer pays the entire premium for single coverage, while only 4% of covered workers are in a plan where the employer pays the entire premium for family coverage [Figure 6.10].
- Covered workers in small firms are much more likely than covered workers in large firms to be in a plan where the employer pays the entire premium.
- Thirty-one percent of covered workers in small firms have an employer that pays the full premium for single coverage, compared to 5% of covered workers in large firms [Figure 6.10].
- For family coverage, 10% of covered workers in small firms have an employer that pays the full premium, compared to 1% of covered workers in large firms [Figure 6.10].
- Fifteen percent of covered workers are in a plan with a worker contribution of more than half of the premium for family coverage [Figure 6.10].
- Thirty-five percent of covered workers in small firms work in a firm where the worker contribution for family coverage is more than 50% of the premium, a much higher percentage than the 6% of covered workers in large firms [Figure 6.10].
- Small shares of covered workers in small firms (3%) and large firms (1%) must pay more than 50% of the premium for single coverage [Figure 6.10].
- There is substantial variation among workers in both small and large firms in the dollar amounts they must contribute.
- Among covered workers in small firms, 43% have a contribution for single coverage of less than $500, while 18% have a contribution of $2,000 or more. For family coverage, 13% have a contribution of less than $1,500, while 29% have a contribution of $10,500 or more [Figure 6.13] and [Figure 6.14].
- Among covered workers in large firms, 16% have a contribution for single coverage of less than $500, while 16% have a contribution of $2,000 or more. For family coverage, 5% have a contribution of less than $1,500, while only 4% have a contribution of $10,500 or more [Figure 6.13] and [Figure 6.14].
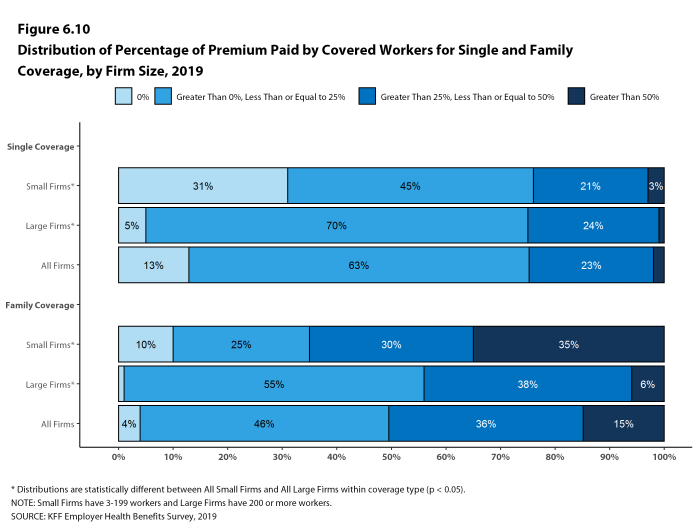
Figure 6.10: Distribution of Percentage of Premium Paid by Covered Workers for Single and Family Coverage, by Firm Size, 2019
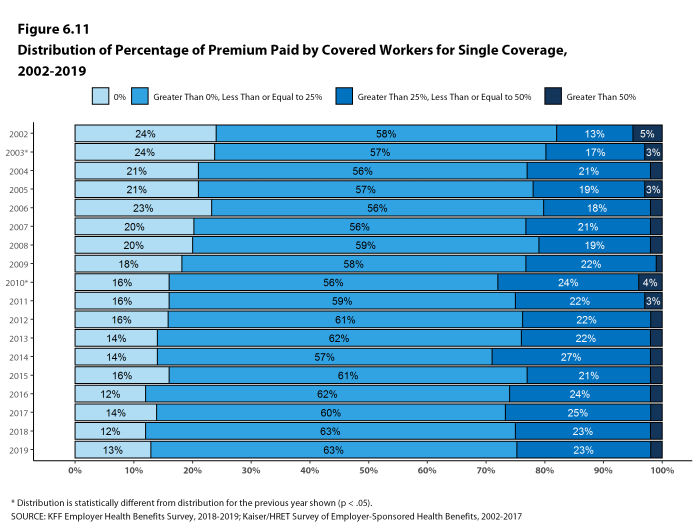
Figure 6.11: Distribution of Percentage of Premium Paid by Covered Workers for Single Coverage, 2002-2019
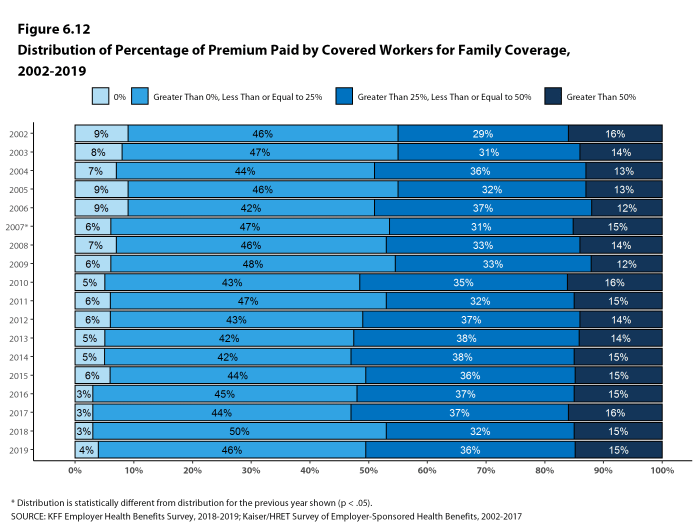
Figure 6.12: Distribution of Percentage of Premium Paid by Covered Workers for Family Coverage, 2002-2019
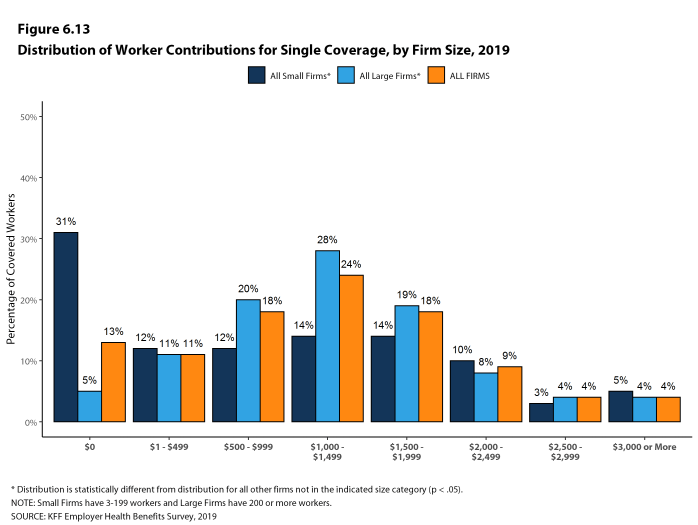
Figure 6.13: Distribution of Worker Contributions for Single Coverage, by Firm Size, 2019
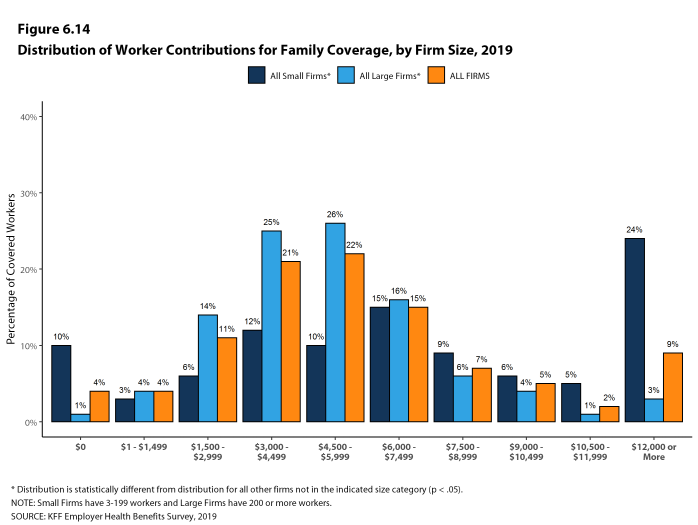
Figure 6.14: Distribution of Worker Contributions for Family Coverage, by Firm Size, 2019
DIFFERENCES BY FIRM CHARACTERISTICS
- The percentage of the premium paid by covered workers also varies by firm characteristics.
- Covered workers in private for-profit firms on average have higher contribution rates for both single coverage (20%) and family coverage (32%) than workers in other types of firms. Covered workers in private not for profit organizations have lower contribution rates for single coverage (14%) than workers in other types of firms [Figure 6.19].
- Covered workers in firms with a relatively large share of lower-wage workers (where at least 35% of workers earn $25,000 a year or less) have a higher average contribution rate for family coverage (41% vs. 30%) than those in firms with a smaller share of lower-wage workers [Figure 6.17].
- Covered workers in firms with a relatively large share of higher-wage workers (where at least 35% earn $63,000 or more annually) have a lower average contribution rate for family coverage than those in firms with a smaller share of higher-wage workers (28% vs. 33%) [Figure 6.17].
- Covered workers in firms that have at least some union workers have a lower average contribution rate for family coverage than those in firms without any union workers (24% vs. 33%) [Figure 6.17].
- Covered workers in firms that are partially or completely self-funded on average have a lower average contribution rate for family coverage than workers in firms that are fully-insured (26% vs. 37%) [Figure 6.17].18
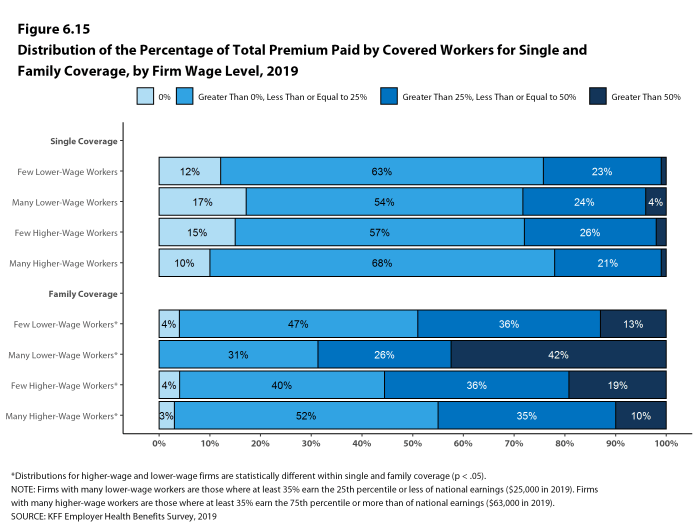
Figure 6.15: Distribution of the Percentage of Total Premium Paid by Covered Workers for Single and Family Coverage, by Firm Wage Level, 2019
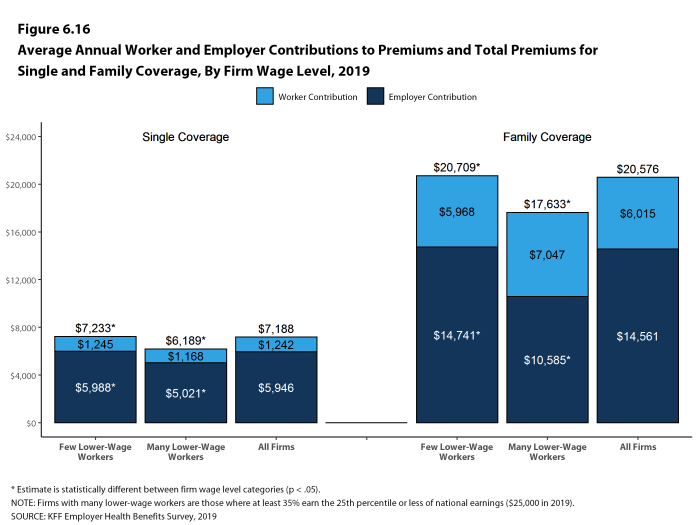
Figure 6.16: Average Annual Worker and Employer Contributions to Premiums and Total Premiums for Single and Family Coverage, by Firm Wage Level, 2019
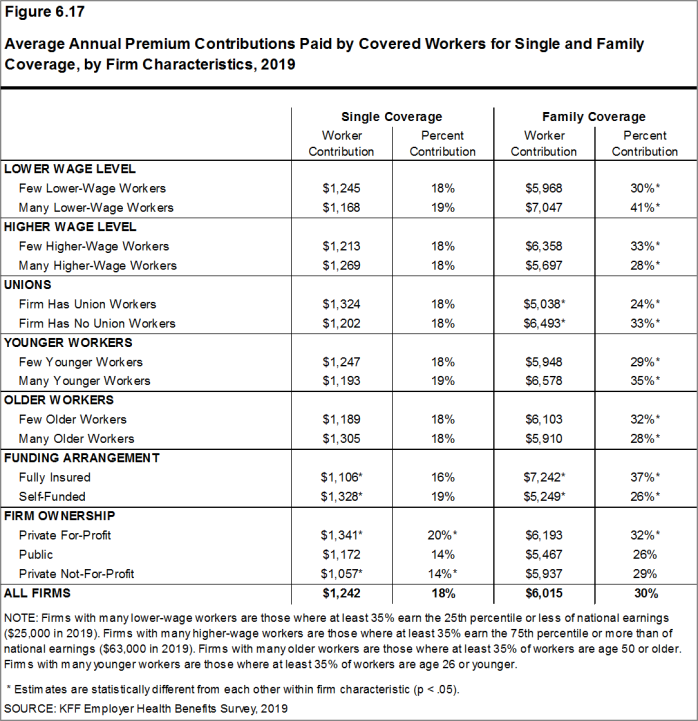
Figure 6.17: Average Annual Premium Contributions Paid by Covered Workers for Single and Family Coverage, by Firm Characteristics, 2019
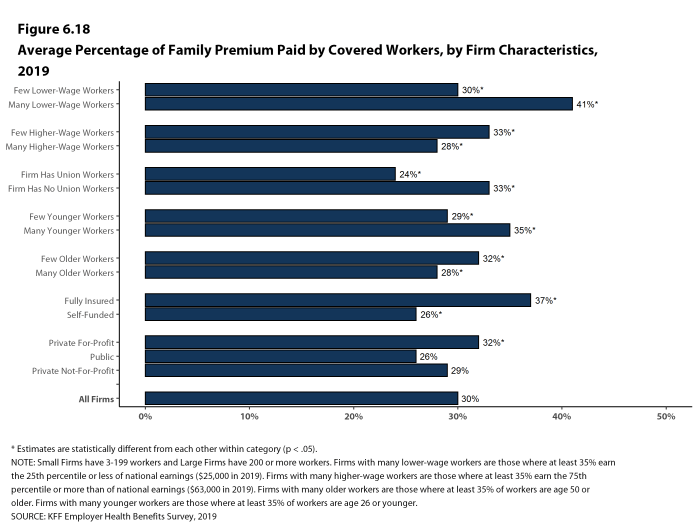
Figure 6.18: Average Percentage of Family Premium Paid by Covered Workers, by Firm Characteristics, 2019
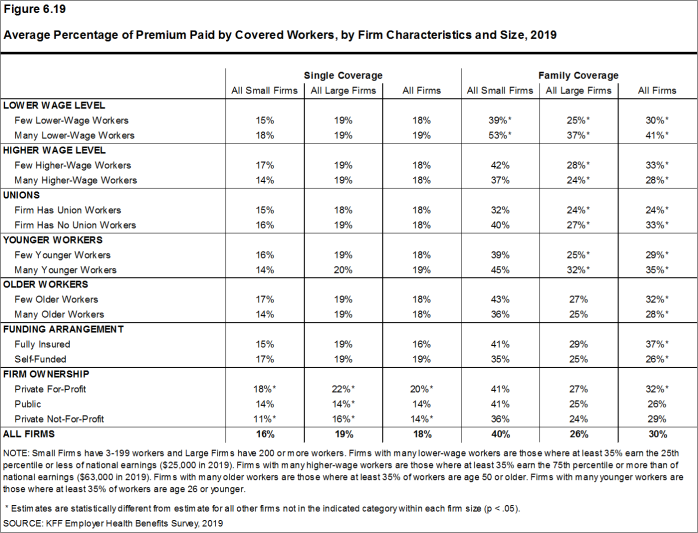
Figure 6.19: Average Percentage of Premium Paid by Covered Workers, by Firm Characteristics and Size, 2019
DIFFERENCES BY REGION AND INDUSTRY
- The average worker contribution rate for single coverage is lower in the West (13%) and higher in the Midwest (21%) than in other regions [Figure 6.20].
- The average worker contribution rate for family coverage is higher in the South (34%) than in other regions [Figure 6.20].
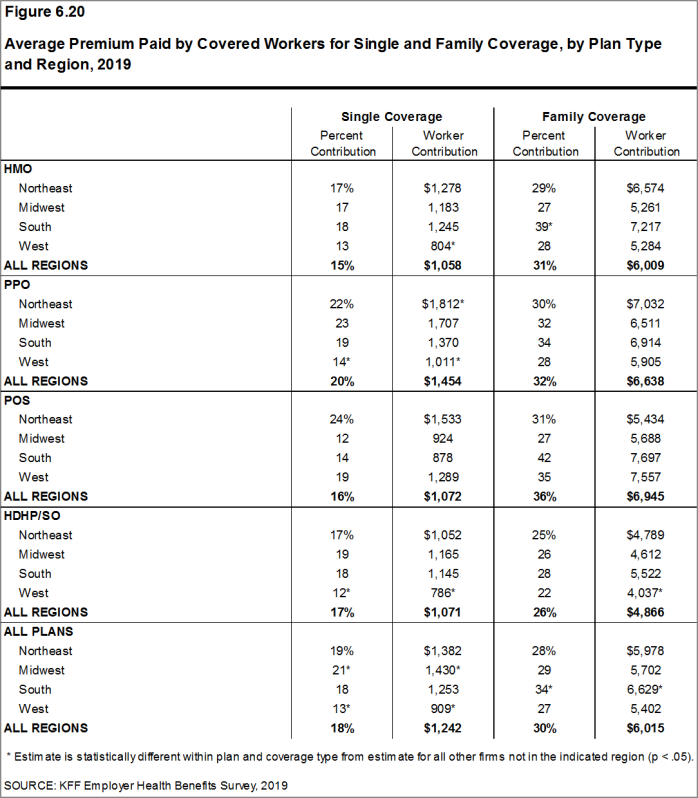
Figure 6.20: Average Premium Paid by Covered Workers for Single and Family Coverage, by Plan Type and Region, 2019
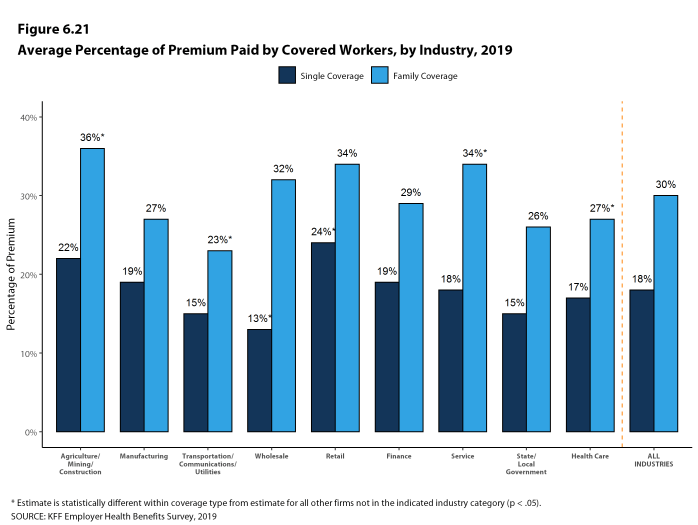
Figure 6.21: Average Percentage of Premium Paid by Covered Workers, by Industry, 2019
CHANGES OVER TIME
- The average worker contributions for single coverage ($1,242 in 2019) is similar to last year. The average worker contribution for family coverage ($6,015 in 2019) is higher than the average contribution for family coverage last year ($5,547) [Figure 6.23] and [Figure 6.24].
- The average worker contributions for single and family coverage have increased over the last five years (15% and 25%, respectively) and over the last 10 years (59% and 71%, respectively).
- Over the past ten years, the average worker contribution for family coverage has increased faster than the average employer contribution for family coverage (71% vs. 48%).
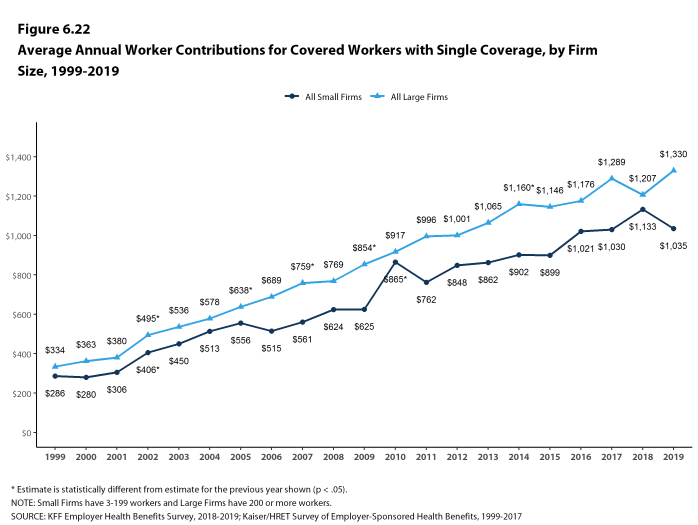
Figure 6.22: Average Annual Worker Contributions for Covered Workers With Single Coverage, by Firm Size, 1999-2019
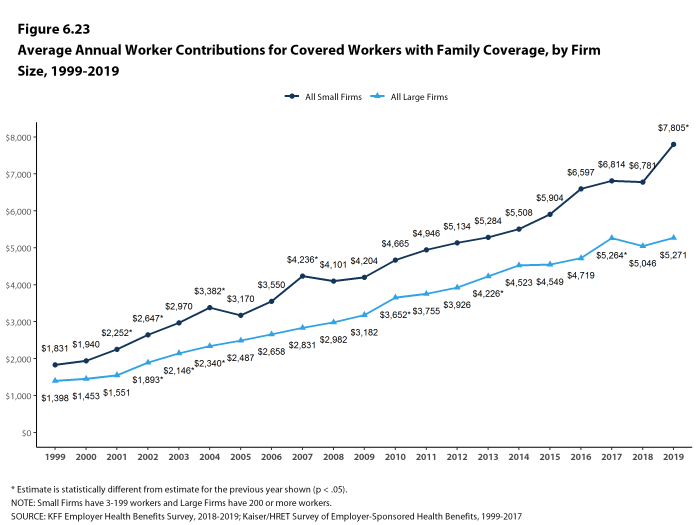
Figure 6.23: Average Annual Worker Contributions for Covered Workers With Family Coverage, by Firm Size, 1999-2019
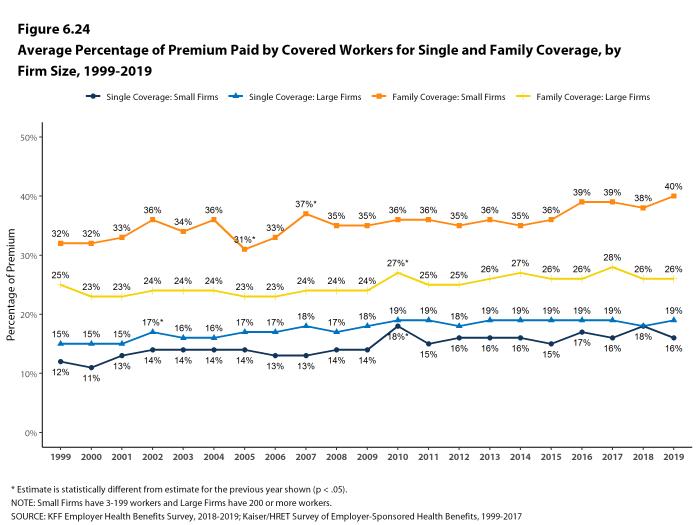
Figure 6.24: Average Percentage of Premium Paid by Covered Workers for Single and Family Coverage, by Firm Size, 1999-2019
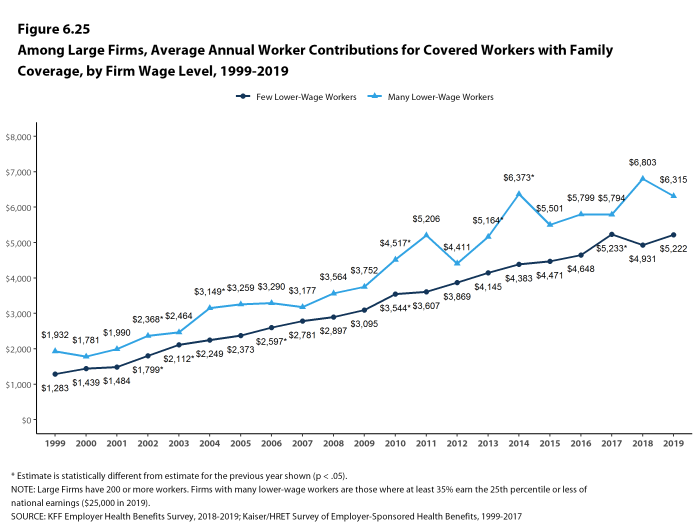
Figure 6.25: Among Large Firms, Average Annual Worker Contributions for Covered Workers With Family Coverage, by Firm Wage Level, 1999-2019
FINANCIAL INCENTIVES
- Thirty-two percent of large firms provide a financial incentive to choose a lower cost health plan.
- Large employers with a financial incentive for employees to choose a lower cost plan option report that, on average, employees can save $104 monthly if they choose the lowest cost single plan available to them.
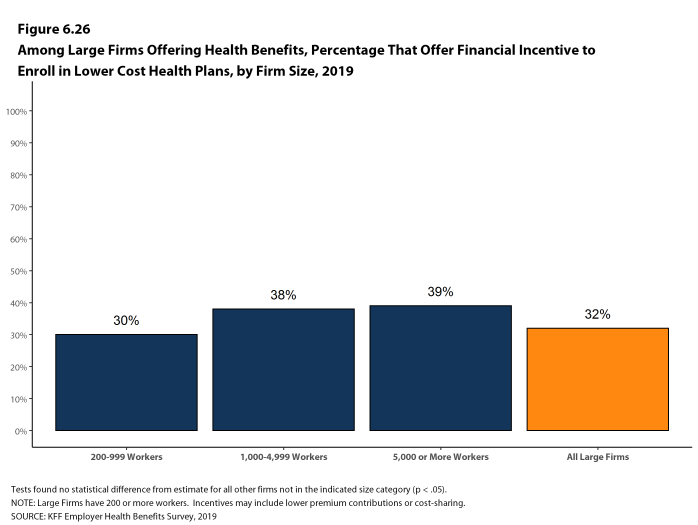
Figure 6.26: Among Large Firms Offering Health Benefits, Percentage That Offer Financial Incentive to Enroll in Lower Cost Health Plans, by Firm Size, 2019
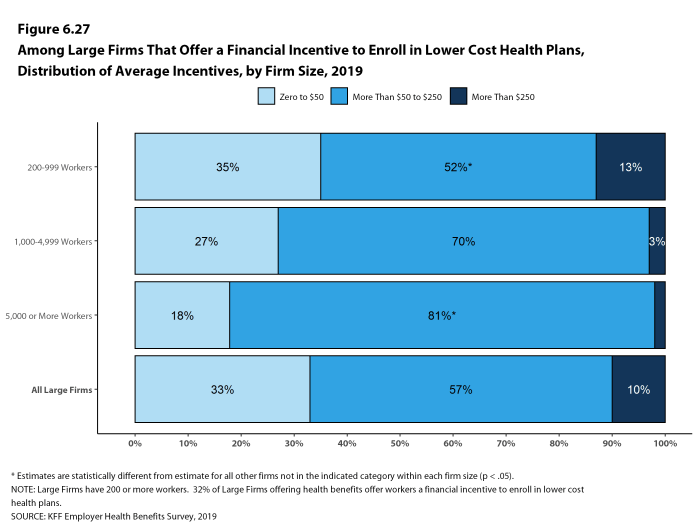
Figure 6.27: Among Large Firms That Offer a Financial Incentive to Enroll in Lower Cost Health Plans, Distribution of Average Incentives, by Firm Size, 2019
- Estimates for premiums, worker contributions to premiums, and employer contributions to premiums presented in Section 6 do not include contributions made by the employer to Health Savings Accounts (HSAs) or Health Reimbursement Arrangements (HRAs). See Section 8 for estimates of employer contributions to HSAs and HRAs.↩
- The average percentage contribution is calculated as a weighted average of all a firm’s plan types and may not necessarily equal the average worker contribution divided by the average premium.↩
- For definitions of self-funded and fully-insured plans, see the introduction to Section 10.↩
Section Seven: Employee Cost Sharing
In addition to any required premium contributions, most covered workers must pay a share of the cost for the medical services they use. The most common forms of cost sharing are: deductibles (an amount that must be paid before most services are covered by the plan), copayments (fixed dollar amounts), and coinsurance (a percentage of the charge for services). Sometimes cost sharing forms are mixed, such as assessing coinsurance for a service up to a maximum amount, or assessing coinsurance or copayment for a service, whichever is higher. The type and level of cost sharing often vary by the type of plan in which the worker is enrolled. Cost sharing may also vary by the type of service, such as office visits, hospitalizations, or prescription drugs.
The cost-sharing amounts reported here are for covered workers using in-network services. Plan enrollees receiving services from providers that do not participate in plan networks often face higher cost sharing and may be responsible for charges that exceed the plan’s allowable amounts. The framework of this survey does not allow us to capture all of the complex cost-sharing requirements in modern plans, particularly for ancillary services (such as durable medical equipment or physical therapy) or cost-sharing arrangements that vary across different settings (such as tiered networks). Therefore, we do not collect information on all plan provisions and limits that affect enrollee out-of-pocket liability.
GENERAL ANNUAL DEDUCTIBLES FOR WORKERS IN PLANS WITH DEDUCTIBLES
- We consider a general annual deductible to be an amount that must be paid by enrollees before most services are covered by their health plan. Non-grandfathered health plans are required to cover some services, such as preventive care, without cost sharing.19 Some plans require enrollees to meet a service-specific deductible, such as for prescription drugs or hospital admissions, in lieu of or in addition to a general annual deductible. As discussed below, some plans with a general annual deductible for most services exclude specified classes of care from the deductible, such as prescriptions or physician office visits.
- In 2019, 82% of covered workers are enrolled in a plan with a general annual deductible for single coverage, similar to the percentage last year (85%) and much higher than the percentage ten years ago (63%) [Figure 7.2].
- The percentages of covered workers enrolled in a plan with a general annual deductible for single coverage are similar for small firms (3-199 workers) (83%) and large firms (200 or more workers) (81%) [Figure 7.2].
- The likelihood of being in a plan with a general annual deductible varies by plan type. Fifty-two percent of covered workers in HMOs do not have a general annual deductible for single coverage, compared to 24% of workers in POS plans and 15% of workers in PPOs [Figure 7.1].
- For covered workers in a plan with a general annual deductible, the average annual deductible for single coverage is $1,655, similar to the average deductible ($1,573) last year [Figure 7.3] and [Figure 7.10].
- For covered workers in plans with a general annual deductible, the average deductibles for single coverage are $1,200 in HMOs, $1,206 in PPOs, $1,857 in POS plans, and $2,486 in HDHP/SOs [Figure 7.6].
- The average deductibles for single coverage are higher across plan types for covered workers in small firms than for covered workers in large firms. For covered workers in PPOs with a general annual deductible, for example, the average deductible for single coverage in small firms is considerably higher than the average deductible in large firms ($1,767 vs. $983) [Figure 7.6]. Overall, for covered workers in plans with a general annual deductible, the average deductible for single coverage in small firms ($2,271) is higher than the average deductible in large firms ($1,412) [Figure 7.3].
- The average general annual deductible for single coverage for covered workers in plans with a general annual deductible has increased 36% over the past five years, from $1,217 in 2014 to $1,655 in 2019 [Figure 7.9].
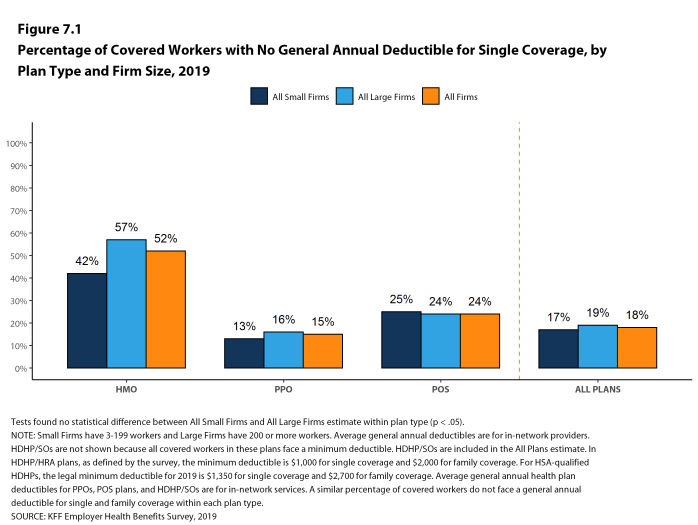
Figure 7.1: Percentage of Covered Workers With No General Annual Deductible for Single Coverage, by Plan Type and Firm Size, 2019
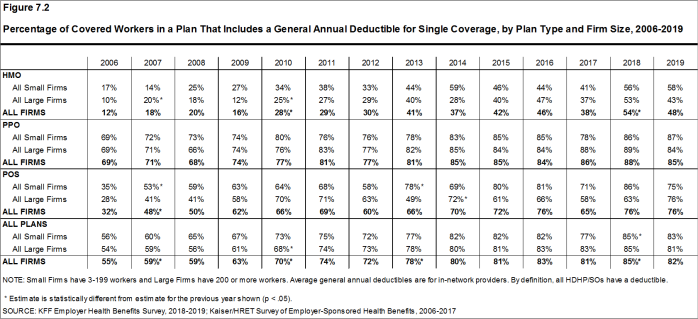
Figure 7.2: Percentage of Covered Workers in a Plan That Includes a General Annual Deductible for Single Coverage, by Plan Type and Firm Size, 2006-2019
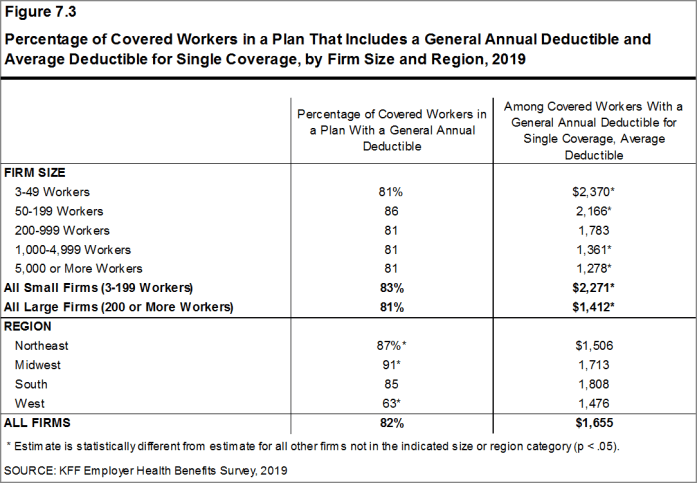
Figure 7.3: Percentage of Covered Workers in a Plan That Includes a General Annual Deductible and Average Deductible for Single Coverage, by Firm Size and Region, 2019
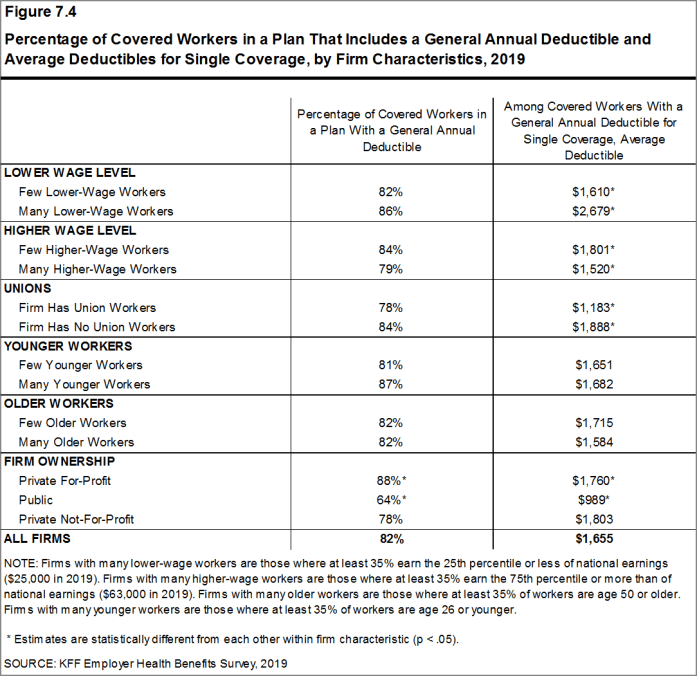
Figure 7.4: Percentage of Covered Workers in a Plan That Includes a General Annual Deductible and Average Deductibles for Single Coverage, by Firm Characteristics, 2019
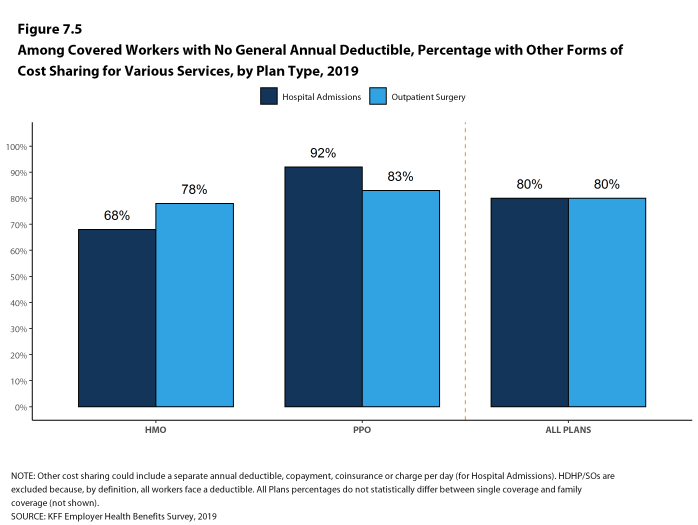
Figure 7.5: Among Covered Workers With No General Annual Deductible, Percentage With Other Forms of Cost Sharing for Various Services, by Plan Type, 2019
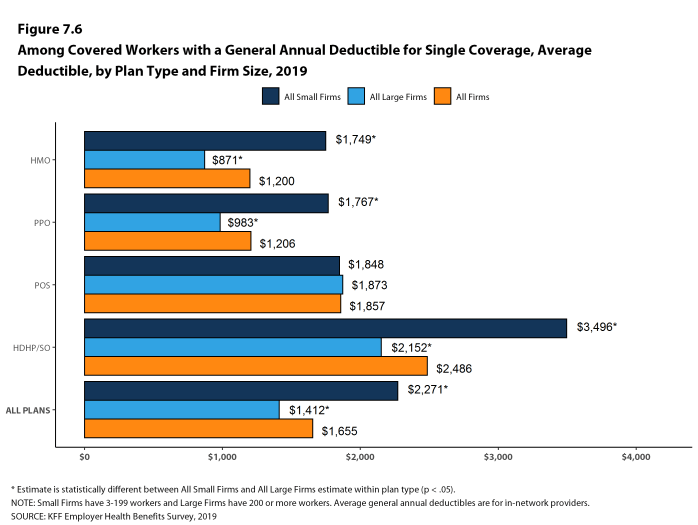
Figure 7.6: Among Covered Workers With a General Annual Deductible for Single Coverage, Average Deductible, by Plan Type and Firm Size, 2019
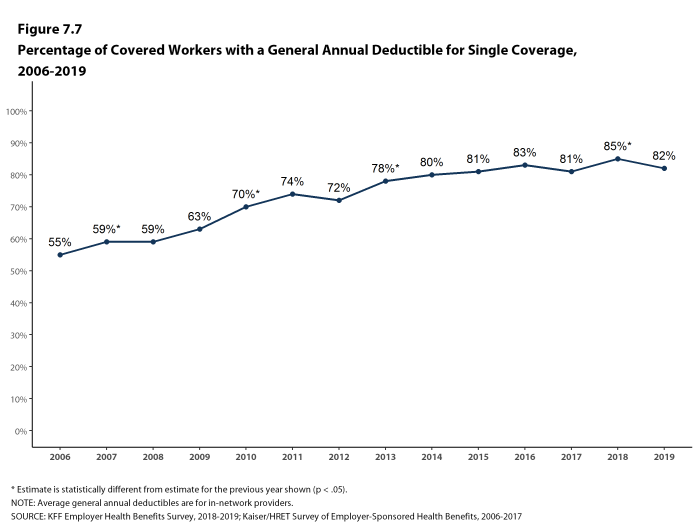
Figure 7.7: Percentage of Covered Workers With a General Annual Deductible for Single Coverage, 2006-2019
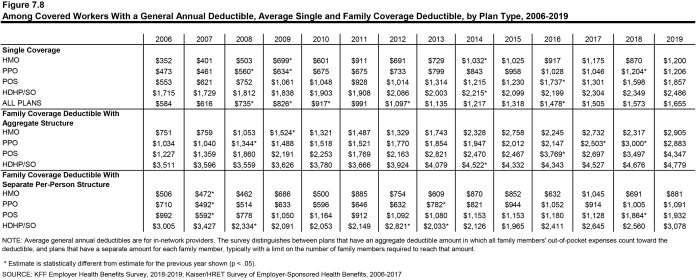
Figure 7.8: Among Covered Workers With a General Annual Deductible, Average Single and Family Coverage Deductible, by Plan Type, 2006-2019
GENERAL ANNUAL DEDUCTIBLES AMONG ALL COVERED WORKERS
- As discussed above, the share of covered workers in plans with a general annual deductible has increased significantly over time, from 63% in 2009 to 82% in 2019 [Figure 7.2]. The average deductible amounts for covered workers in plans with a deductible have also increased, over the period, from $826 in 2009 to $1,655 in 2019 [Figure 7.10]. Neither trend by itself, however, captures the full impact of changes in deductibles on covered workers. We can look at the average impact of both trends together on covered workers by assigning a zero deductible value to covered workers in plans with no deductible and looking at how the resulting averages change over time. These average deductible amounts are lower in any given year but the changes over time reflect both the higher deductibles in plans with a deductible and the fact that more workers face them.
- Using this approach, the average general annual deductible for single coverage for all covered workers in 2019 is $1,396, similar to the amount last year ($1,350) [Figure 7.10].
- The 2019 value is 41% higher than the average general annual deductible of $989 in 2014 and 162% higher than the average general annual deductible of $533 in 2009 [Figure 7.10].
- Another way to look at deductibles is the percentage of all covered workers who are in a plan with a deductible that exceeds certain thresholds. Fifty-five percent of covered workers are in plans with a general annual deductible of $1,000 or more for single coverage, similar to the percentage last year [Figure 7.13].
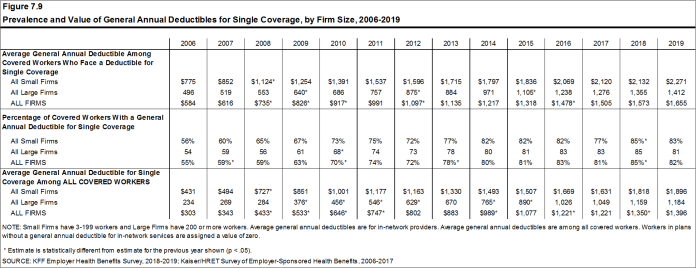
Figure 7.9: Prevalence and Value of General Annual Deductibles for Single Coverage, by Firm Size, 2006-2019
- Over the past five years, the percentage of covered workers with a general annual deductible of $1,000 or more for single coverage has grown 34%, from 41% to 55% [Figure 7.13].
- Workers in small firms are considerably more likely to have a general annual deductible of $1,000 or more for single coverage than workers in large firms (68% vs. 50%) [Figure 7.12].
- In 2019, 28% of covered workers are enrolled in a plan with a deductible of $2,000 or more, similar to the percentage last year (26%) [Figure 7.15]. This percentage is much higher for covered workers in small firms (45% vs. 22%) [Figure 7.12].
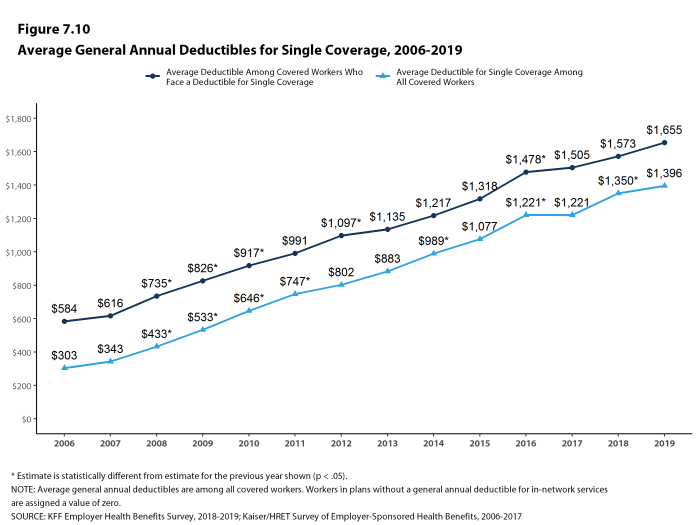
Figure 7.10: Average General Annual Deductibles for Single Coverage, 2006-2019
GENERAL ANNUAL DEDUCTIBLES AND ACCOUNT CONTRIBUTIONS
- One of the reasons for the growth in general annual deductibles has been the growth in enrollment in HDHP/SOs, which have higher deductibles than other plans. While growing deductibles in other plan types generally increases enrollee out-of-pocket liability, the shift in enrollment to HDHP/SOs does not necessarily do so because many HDHP/SO enrollees receive an account contribution from their employers, which in essence reduces the high cost sharing in these plans.
- Twenty-one percent of covered workers in an HDHP with an HRA and 2% of covered workers in an HSA-qualified HDHP receive an account contribution from their employer for single coverage at least equal to their deductible, while another 22% of covered workers in an HDHP with an HRA and 23% of covered workers in an HSA-qualified HDHP receive account contributions that, if applied to their deductible, would reduce the deductible to $1,000 or less [Figure 7.17].
- If we reduce the general annual deductibles by employer account contributions, the percentage of covered workers with a deductible of $1,000 or more would be reduced from 55% to 47% [Figure 7.13] and [Figure 7.14].
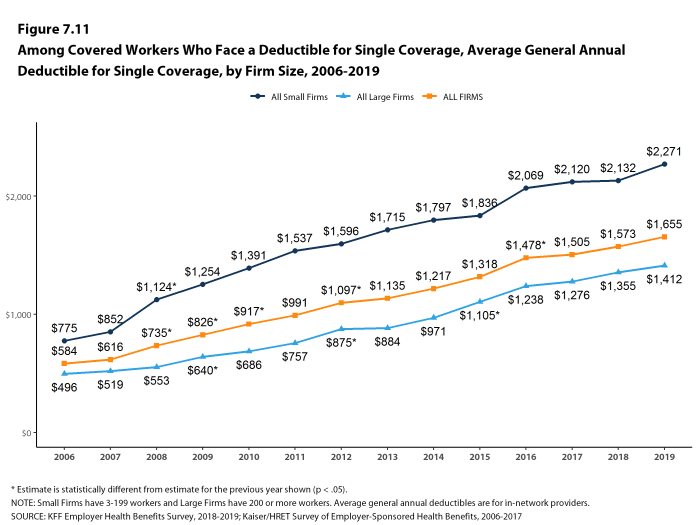
Figure 7.11: Among Covered Workers Who Face a Deductible for Single Coverage, Average General Annual Deductible for Single Coverage, by Firm Size, 2006-2019
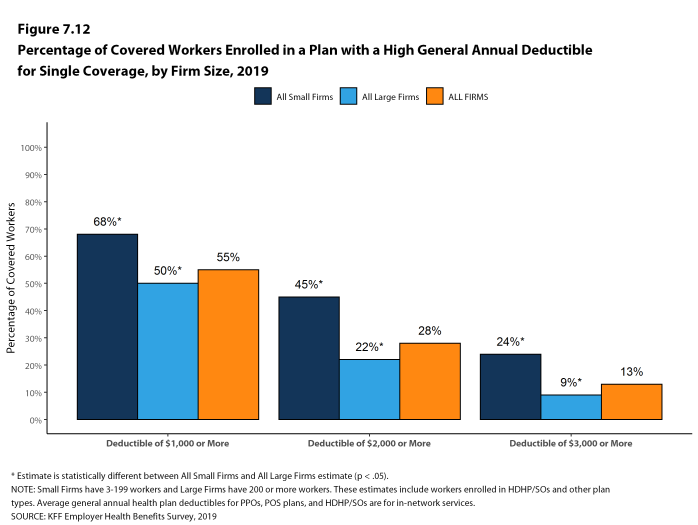
Figure 7.12: Percentage of Covered Workers Enrolled in a Plan With a High General Annual Deductible for Single Coverage, by Firm Size, 2019
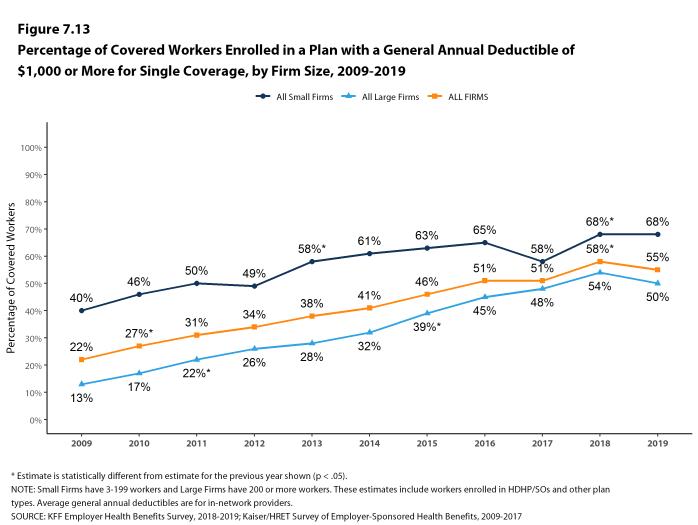
Figure 7.13: Percentage of Covered Workers Enrolled in a Plan With a General Annual Deductible of $1,000 or More for Single Coverage, by Firm Size, 2009-2019
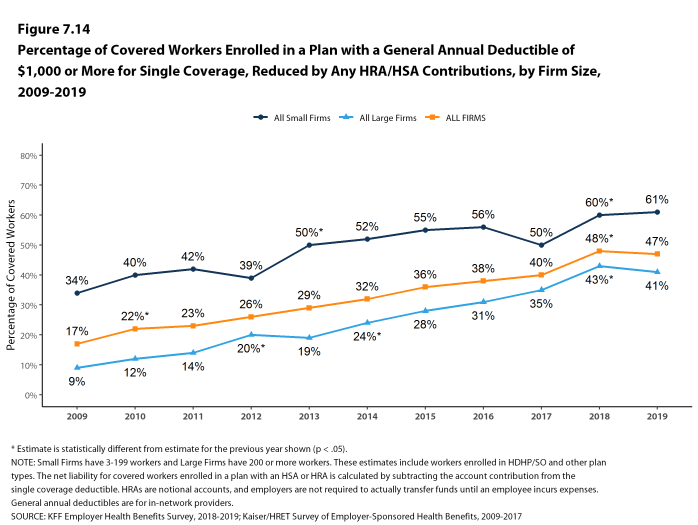
Figure 7.14: Percentage of Covered Workers Enrolled in a Plan With a General Annual Deductible of $1,000 or More for Single Coverage, Reduced by Any HRA/HSA Contributions, by Firm Size, 2009-2019
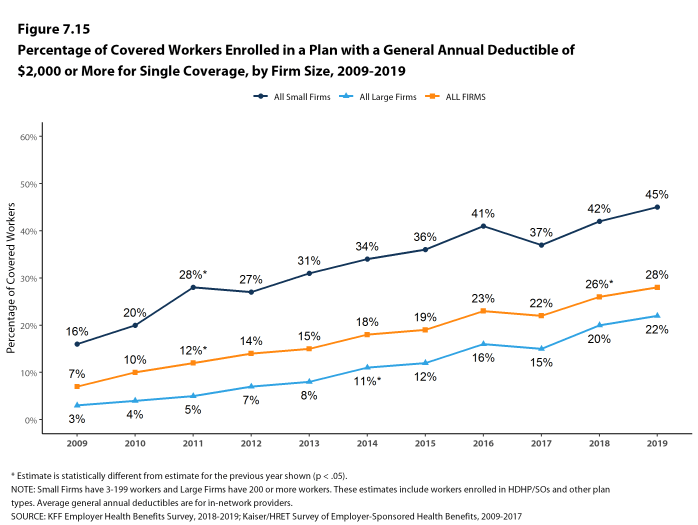
Figure 7.15: Percentage of Covered Workers Enrolled in a Plan With a General Annual Deductible of $2,000 or More for Single Coverage, by Firm Size, 2009-2019
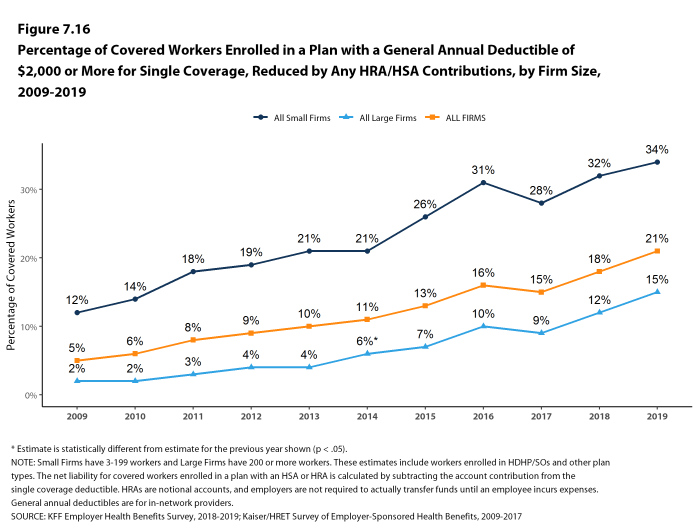
Figure 7.16: Percentage of Covered Workers Enrolled in a Plan With a General Annual Deductible of $2,000 or More for Single Coverage, Reduced by Any HRA/HSA Contributions, by Firm Size, 2009-2019
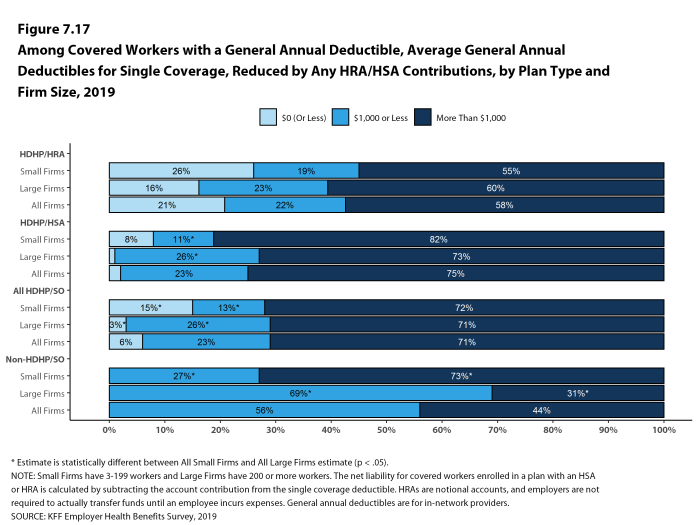
Figure 7.17: Among Covered Workers With a General Annual Deductible, Average General Annual Deductibles for Single Coverage, Reduced by Any HRA/HSA Contributions, by Plan Type and Firm Size, 2019
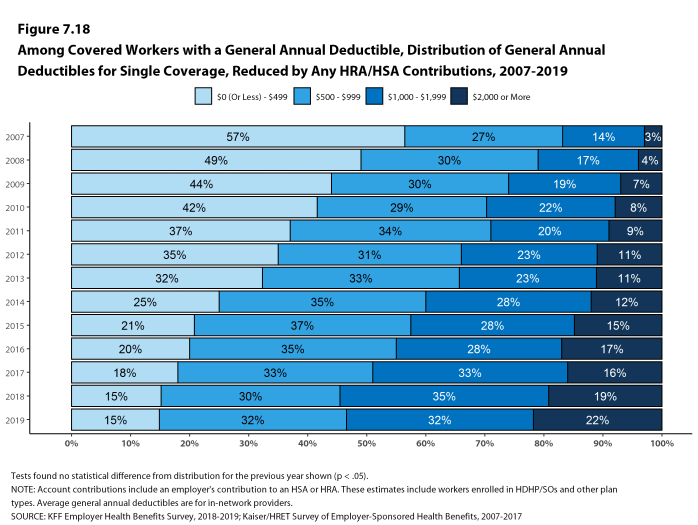
Figure 7.18: Among Covered Workers With a General Annual Deductible, Distribution of General Annual Deductibles for Single Coverage, Reduced by Any HRA/HSA Contributions, 2007-2019
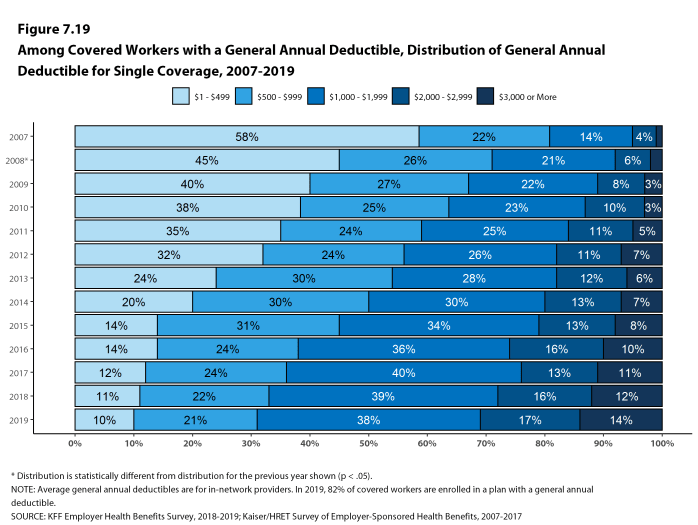
Figure 7.19: Among Covered Workers With a General Annual Deductible, Distribution of General Annual Deductible for Single Coverage, 2007-2019
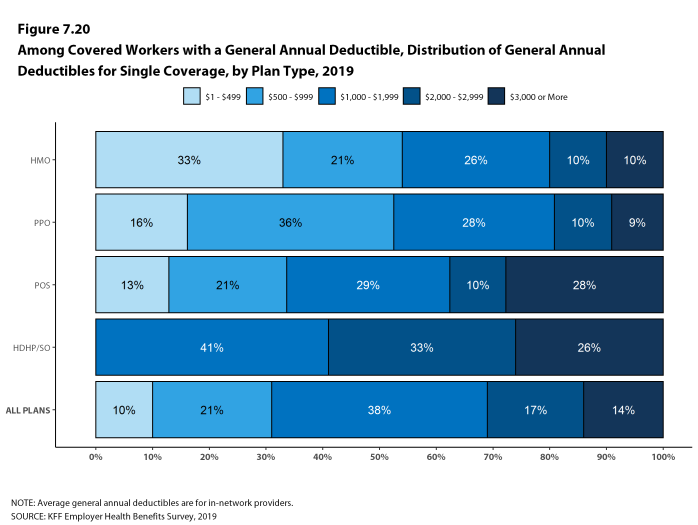
Figure 7.20: Among Covered Workers With a General Annual Deductible, Distribution of General Annual Deductibles for Single Coverage, by Plan Type, 2019
GENERAL ANNUAL DEDUCTIBLES FOR WORKERS ENROLLED IN FAMILY COVERGE
General annual deductibles for family coverage are structured in two primary ways: (1) with an aggregate family deductible, the out-of-pocket expenses of all family members count against a specified family deductible amount, and the deductible is considered met when the combined family expenses exceed the deductible amount; (2) with a separate per-person family deductible, each family member is subject to a specified deductible amount before the plan covers expenses for that member, although many plans consider the deductible for all family members met once a specified number (typically two or three) of family members meet their specified deductible amount.20
- In most plan types, relatively few covered workers are in plans without a general annual deductible for family coverage: 15% of covered workers in PPOs, and 24% of covered workers in POS plans. As defined, all covered workers in HDHP/SOs have a general annual deductible for family coverage [Figure 7.21].
- Among covered workers enrolled in family coverage, the percentages of covered workers in a plan with an aggregate general annual deductible are 27% for workers in HMOs; 49% for workers in PPOs; 58% for workers in POS plans; and 81% for workers in HDHP/SOs [Figure 7.21].
- The average deductible amounts for covered workers in plans with an aggregate annual deductible for family coverage are $2,905 for HMOs; $2,883 for PPOs; $4,347 for POS plans; and $4,779 for HDHP/SOs [Figure 7.22]. Deductible amounts for aggregate family deductibles are similar to last year for each plan type.
- For covered workers in plans with an aggregate deductible for family coverage, the average annual family deductibles in small firms are higher than the average annual family deductibles in large firms for covered workers in PPOs and HDHP/SOs [Figure 7.22].
- Among covered workers enrolled in family coverage, the percentages of covered workers in plans with a separate per-person annual deductible for family coverage are 21% for workers in HMOs; 35% for workers in PPOs; 18% for workers in POS plans; and 19% for workers in HDHP/SOs [Figure 7.21].
- The average deductible amounts for covered workers in plans with separate per-person annual deductibles for family coverage are $881 for HMOs; $1,091 for PPOs; $1,932 for POS plans; and $3,078 for HDHP/SOs [Figure 7.22].
- Most covered workers in plans with a separate per-person annual deductible for family coverage have a limit for the number of family members required to meet the separate deductible amounts [Figure 7.25]. Among those covered workers in plans with a limit on the number of family members, the most frequent number of family members required to meet the separate per-person deductible is two [Figure 7.26].
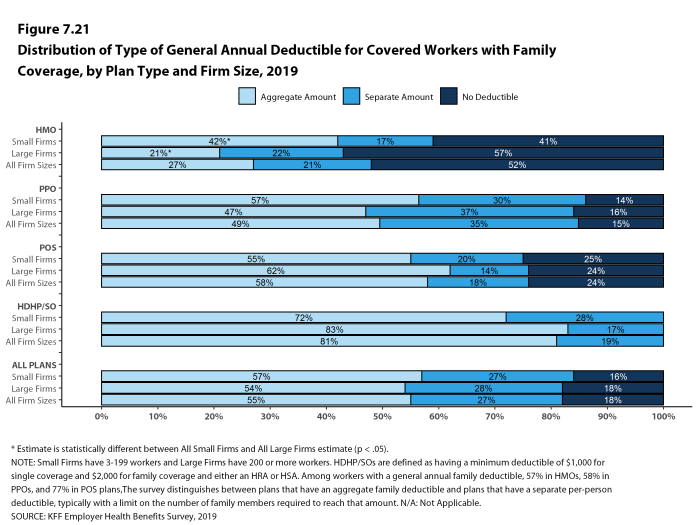
Figure 7.21: Distribution of Type of General Annual Deductible for Covered Workers With Family Coverage, by Plan Type and Firm Size, 2019
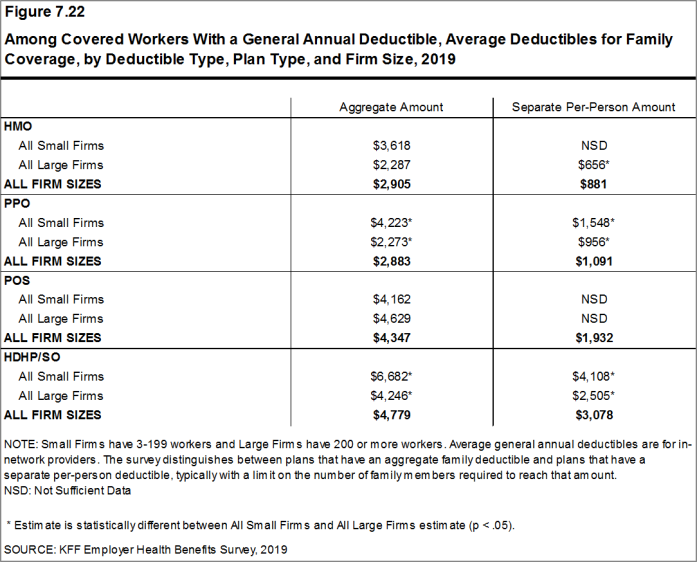
Figure 7.22: Among Covered Workers With a General Annual Deductible, Average Deductibles for Family Coverage, by Deductible Type, Plan Type, and Firm Size, 2019
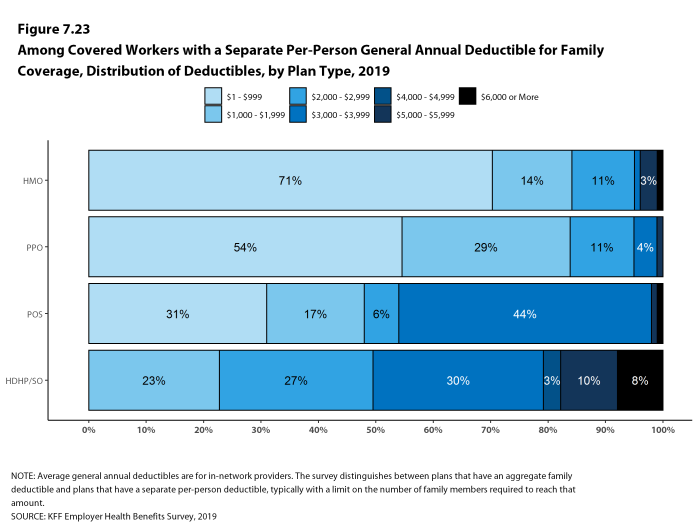
Figure 7.23: Among Covered Workers With a Separate Per-Person General Annual Deductible for Family Coverage, Distribution of Deductibles, by Plan Type, 2019
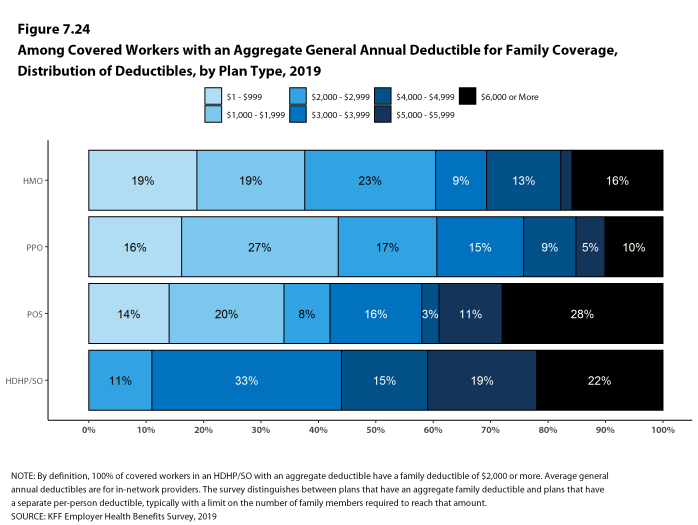
Figure 7.24: Among Covered Workers With an Aggregate General Annual Deductible for Family Coverage, Distribution of Deductibles, by Plan Type, 2019
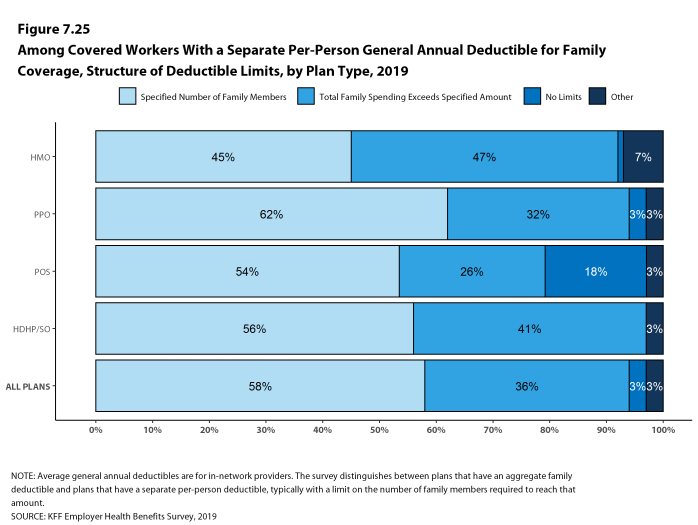
Figure 7.25: Among Covered Workers With a Separate Per-Person General Annual Deductible for Family Coverage, Structure of Deductible Limits, by Plan Type, 2019
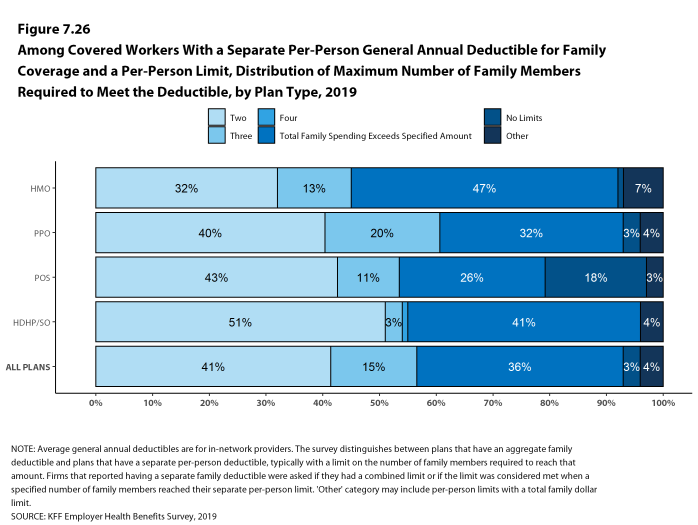
Figure 7.26: Among Covered Workers With a Separate Per-Person General Annual Deductible for Family Coverage and a Per-Person Limit, Distribution of Maximum Number of Family Members Required to Meet the Deductible, by Plan Type, 2019
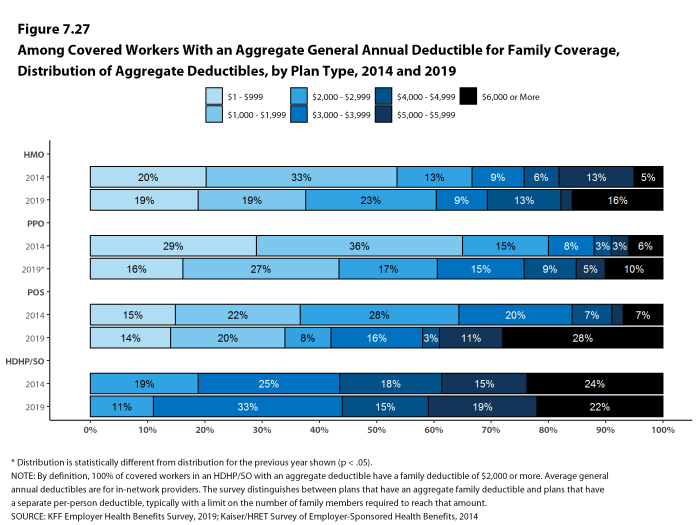
Figure 7.27: Among Covered Workers With an Aggregate General Annual Deductible for Family Coverage, Distribution of Aggregate Deductibles, by Plan Type, 2014 and 2019
CHARACTERISTICS OF GENERAL ANNUAL DEDUCTIBLES
- The majority of covered workers with a general annual deductible are in plans where the deductible does not have to be met before certain services, such as physician office visits or prescription drugs, are covered.
- Majorities of covered workers (82% in HMOs, 77% in PPOs, 68% in POS plans, and 56% in HDHP/HRAs) that are enrolled in plans with general annual deductibles are in plans where the deductible does not have to be met before physician office visits for primary care are covered [Figure 7.28].
- Similarly, among workers with a general annual deductible, large shares of covered workers in HMOs (92%), PPOs (91%), POS plans (90%), and HDHP/HRAs (83%) are enrolled in plans where the general annual deductible does not have to be met before prescription drugs are covered [Figure 7.28].
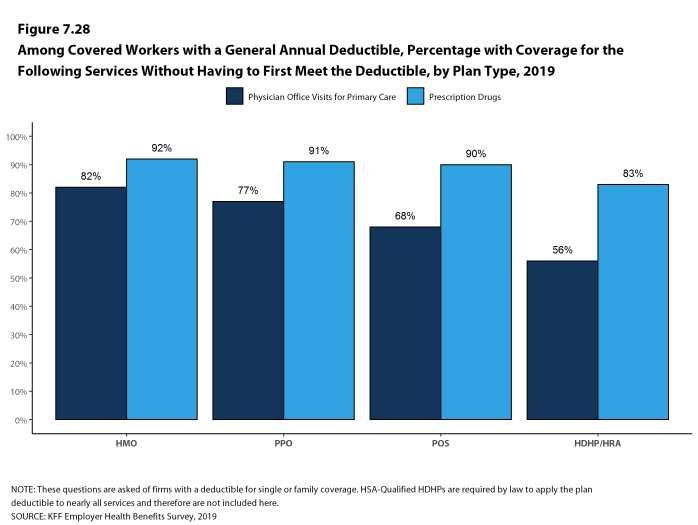
Figure 7.28: Among Covered Workers With a General Annual Deductible, Percentage With Coverage for the Following Services Without Having to First Meet the Deductible, by Plan Type, 2019
HOSPITAL ADMISSIONS AND OUTPATIENT SURGERY
- Whether or not a worker has a general annual deductible, most workers face additional types of cost sharing (such as a copayment, coinsurance, or a per diem charge) when admitted to a hospital or having outpatient surgery. The distribution of workers with cost sharing for hospital admissions or outpatient surgery does not equal 100%, as workers may face a complex combination of types of cost sharing. For this reason, the average copayment and coinsurance rates include workers who may have a combination of these types of cost sharing.
- Beginning in 2017, to reduce the burden on respondents, we revised the survey to ask about cost sharing for hospital admissions and outpatient surgery only for their largest health plan type; previously, we asked for this information for each of the plan types that they offered.
- For hospital admissions, 66% of covered workers have coinsurance and 14% have a copayment. Lower percentages of workers have per day (per diem) payments (5%), a separate hospital deductible (1%), or both a copayment and coinsurance (7%), while 15% have no additional cost sharing for hospital admissions after any general annual deductible has been met [Figure 7.29].
- For covered workers in HMOs, copayments are more common (42%) and coinsurance (22%) is less common than the average for all covered workers [Figure 7.29] and [Figure 7.31].
- HDHP/SOs, on average, have a different cost-sharing structure than other plan types for hospital admissions. Only 2% of covered workers in HDHP/SOs have a copayment for hospital admissions, lower than the average for all covered workers [Figure 7.29].
- The average coinsurance rate for a hospital admission is 20%, the average copayment is $326 per hospital admission, and the average per diem charge is $475 [Figure 7.32]. Seventy-five percent of workers enrolled in a plan with a per diem for hospital admissions have a limit on the number of days a worker must pay the amount [Figure 7.33].
- The cost-sharing provisions for outpatient surgery are similar to those for hospital admissions, as most workers have coinsurance or copayments. In 2019, 16% of covered workers have a copayment and 67% have coinsurance for outpatient surgery. In addition, 6% have both a copayment and coinsurance, while 16% have no additional cost sharing after any general annual deductible has been met [Figure 7.30] and [Figure 7.31].
- For covered workers with cost sharing for outpatient surgery, the average coinsurance rate is 19% and the average copayment is $180 [Figure 7.32].
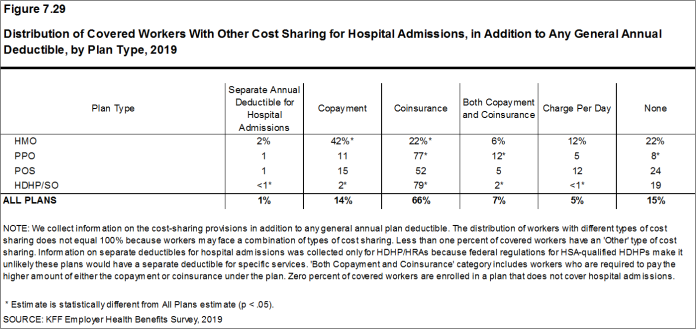
Figure 7.29: Distribution of Covered Workers With Other Cost Sharing for Hospital Admissions, in Addition to Any General Annual Deductible, by Plan Type, 2019
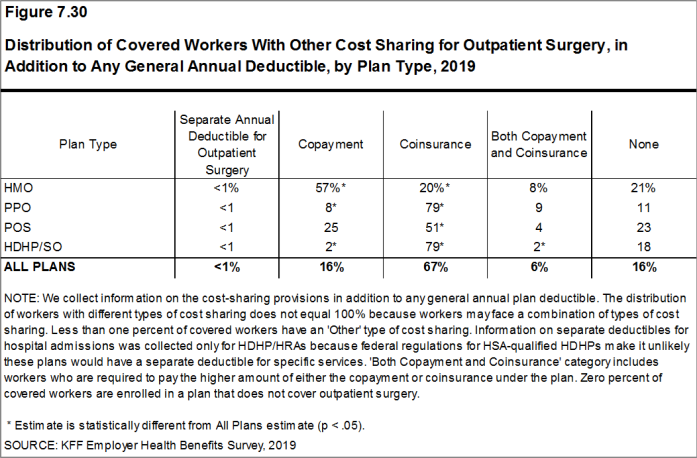
Figure 7.30: Distribution of Covered Workers With Other Cost Sharing for Outpatient Surgery, in Addition to Any General Annual Deductible, by Plan Type, 2019
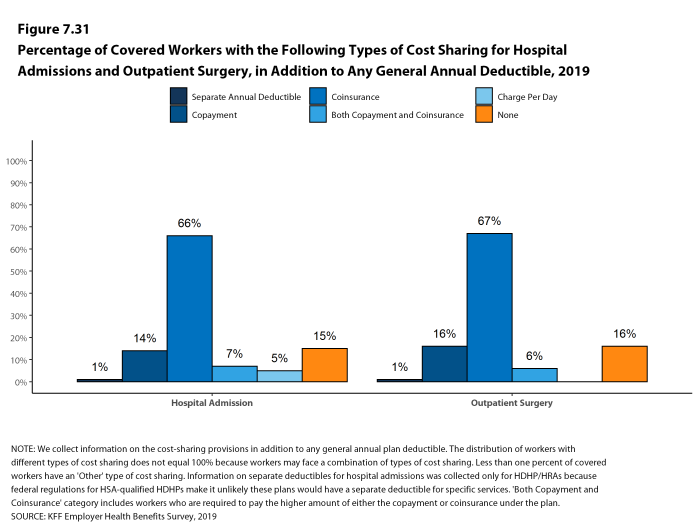
Figure 7.31: Percentage of Covered Workers With the Following Types of Cost Sharing for Hospital Admissions and Outpatient Surgery, in Addition to Any General Annual Deductible, 2019
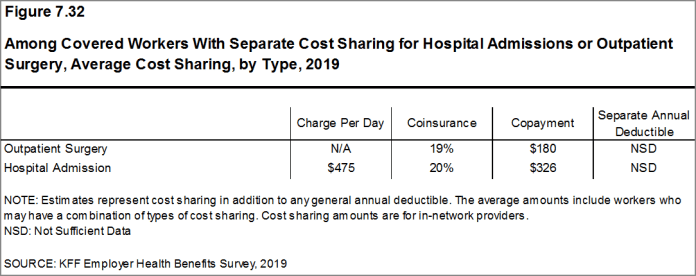
Figure 7.32: Among Covered Workers With Separate Cost Sharing for Hospital Admissions or Outpatient Surgery, Average Cost Sharing, by Type, 2019
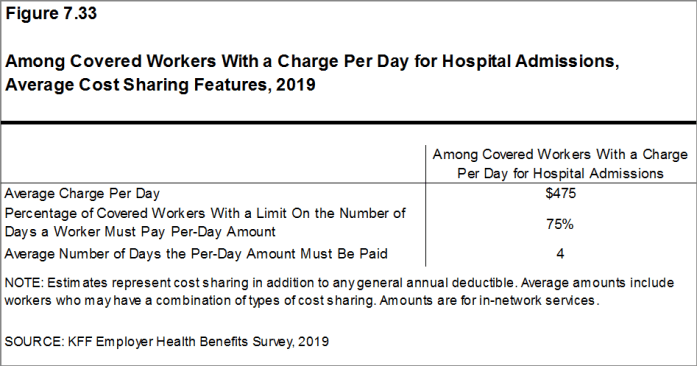
Figure 7.33: Among Covered Workers With a Charge Per Day for Hospital Admissions, Average Cost Sharing Features, 2019
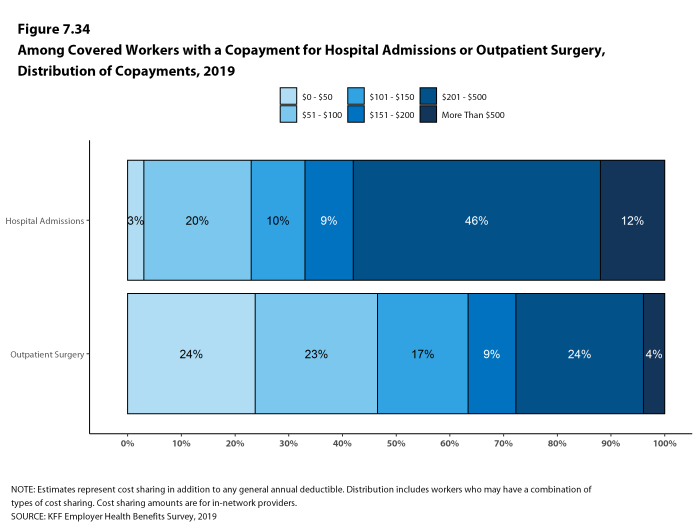
Figure 7.34: Among Covered Workers With a Copayment for Hospital Admissions or Outpatient Surgery, Distribution of Copayments, 2019
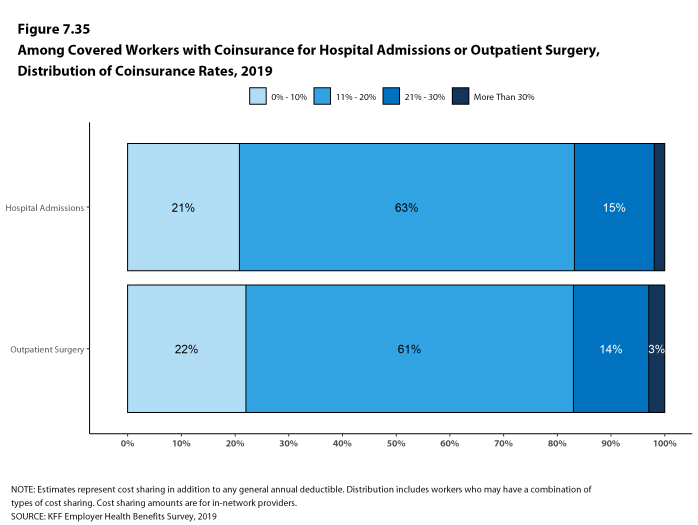
Figure 7.35: Among Covered Workers With Coinsurance for Hospital Admissions or Outpatient Surgery, Distribution of Coinsurance Rates, 2019
COST SHARING FOR PHYSICIAN OFFICE VISITS
- The majority of covered workers are enrolled in health plans that require cost sharing for an in-network physician office visit, in addition to any general annual deductible.21
- The most common form of physician office visit cost sharing for in-network services is a copayment. Sixty-seven percent of covered workers have a copayment for a primary care physician office visit and 25% have coinsurance. For office visits with a specialty physician, 66% of covered workers have a copayment and 26% have coinsurance [Figure 7.36].
- Covered workers in HMOs, PPOs, and POS plans are much more likely to have copayments for both primary care and specialty care physician office visits than workers in HDHP/SOs. For primary care physician office visits, 15% of covered workers in HDHP/SOs have a copayment, 68% have coinsurance, and 15% have no cost sharing after the general annual plan deductible is met [Figure 7.36].
- Among covered workers with a copayment for in-network physician office visits, the average copayment is $25 for primary care and $40 for specialty physician office visits [Figure 7.37], similar to the amounts last year.
- Among covered workers with coinsurance for in-network physician office visits, the average coinsurance rates are 18% for a visit with a primary care physician and 19% for a visit with a specialist [Figure 7.37], similar to the rates last year.
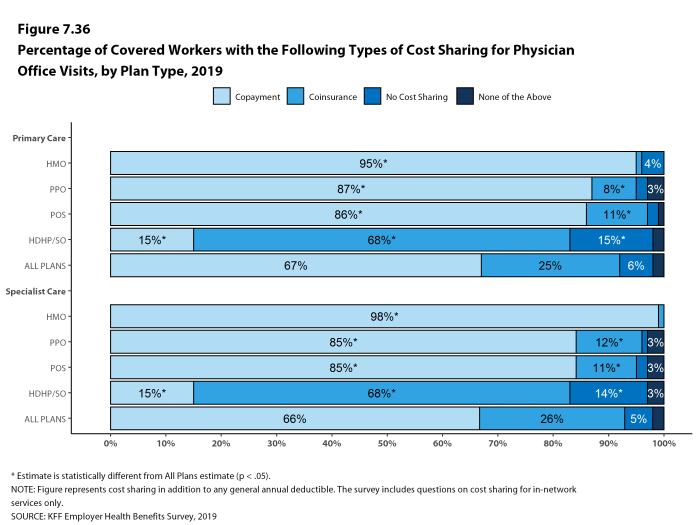
Figure 7.36: Percentage of Covered Workers With the Following Types of Cost Sharing for Physician Office Visits, by Plan Type, 2019
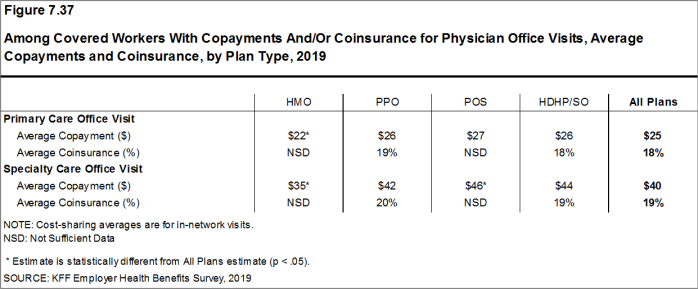
Figure 7.37: Among Covered Workers With Copayments And/Or Coinsurance for Physician Office Visits, Average Copayments and Coinsurance, by Plan Type, 2019
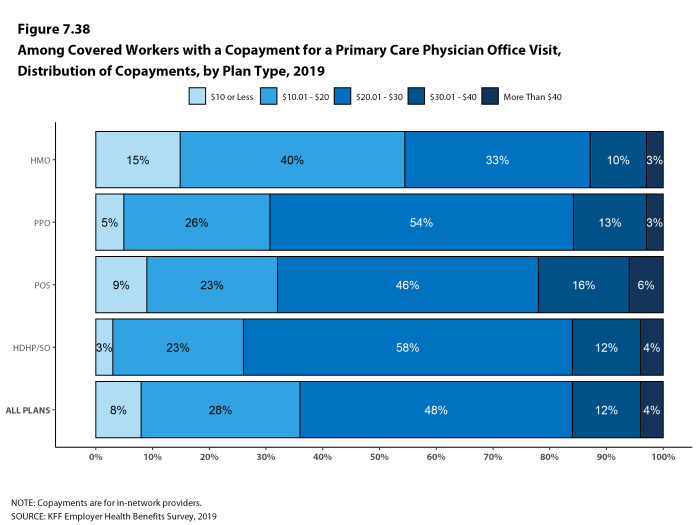
Figure 7.38: Among Covered Workers With a Copayment for a Primary Care Physician Office Visit, Distribution of Copayments, by Plan Type, 2019
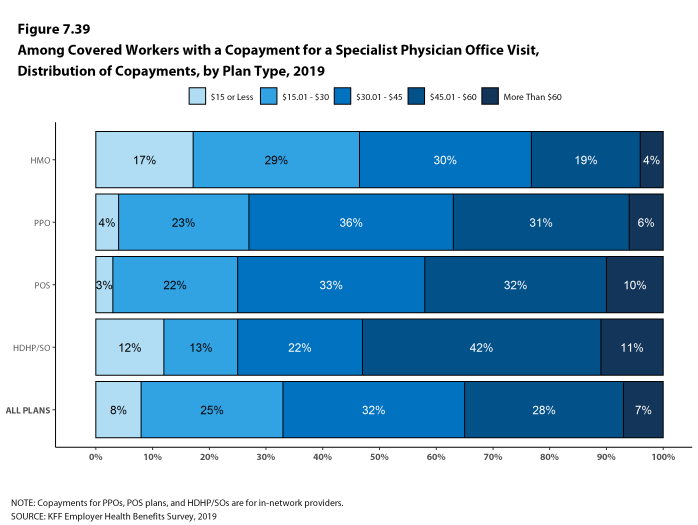
Figure 7.39: Among Covered Workers With a Copayment for a Specialist Physician Office Visit, Distribution of Copayments, by Plan Type, 2019
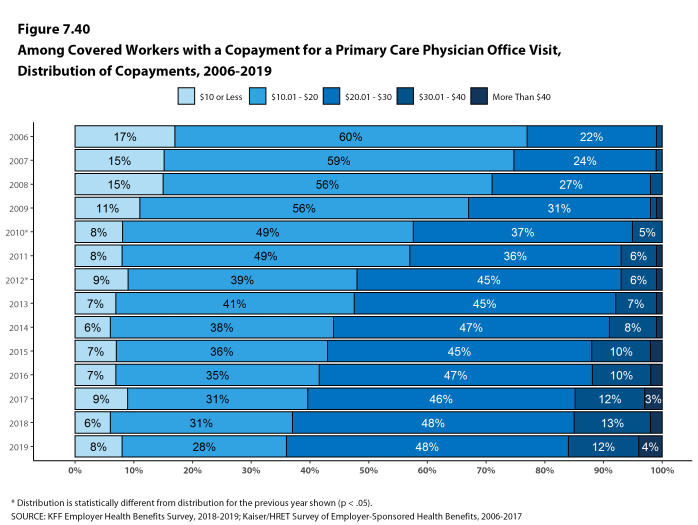
Figure 7.40: Among Covered Workers With a Copayment for a Primary Care Physician Office Visit, Distribution of Copayments, 2006-2019
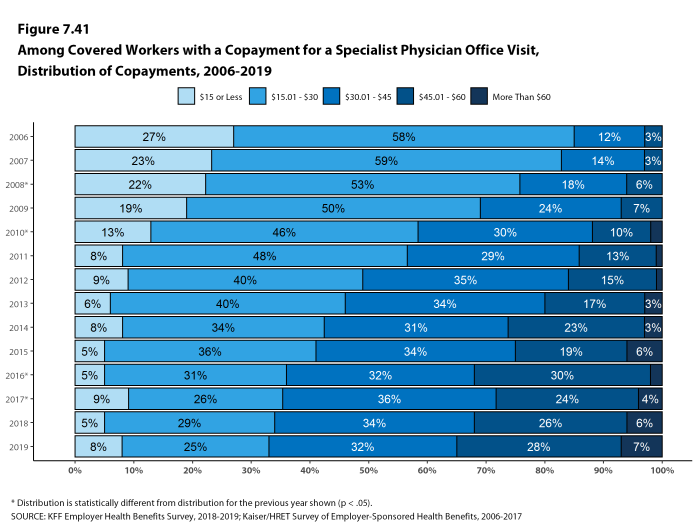
Figure 7.41: Among Covered Workers With a Copayment for a Specialist Physician Office Visit, Distribution of Copayments, 2006-2019
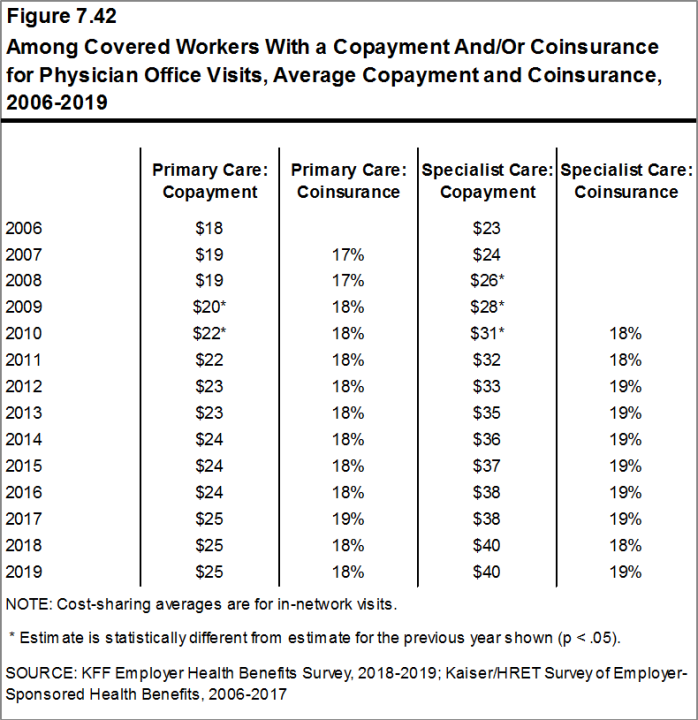
Figure 7.42: Among Covered Workers With a Copayment And/Or Coinsurance for Physician Office Visits, Average Copayment and Coinsurance, 2006-2019
OUT-OF-POCKET MAXIMUMS
- Most covered workers are in a plan that partially or totally limits the cost sharing that an enrollee must pay in a year. This limit is generally referred to as an out-of-pocket maximum. The Affordable Care Act (ACA) requires that non-grandfathered health plans have an out-of-pocket maximum of no more than $7,900 for single coverage and $15,800 for family coverage in 2019. Out-of-pocket limits in HSA qualified HDHP/SOs are required to be somewhat lower.22 Many plans have complex out-of-pocket structures, which makes it difficult to accurately collect information on this element of plan design.
- In 2019, 99% of covered workers are in a plan with an out-of-pocket maximum for single coverage. This is a significant increase from 94% in 2014 [Figure 7.43].
- For covered workers in plans with an out-of-pocket maximum for single coverage, there is wide variation in spending limits.
- Twelve percent of covered workers in plans with an out-of-pocket maximum for single coverage have an out-of-pocket maximum of less than $2,000, while 20% have an out-of-pocket maximum of $6,000 or more [Figure 7.45].
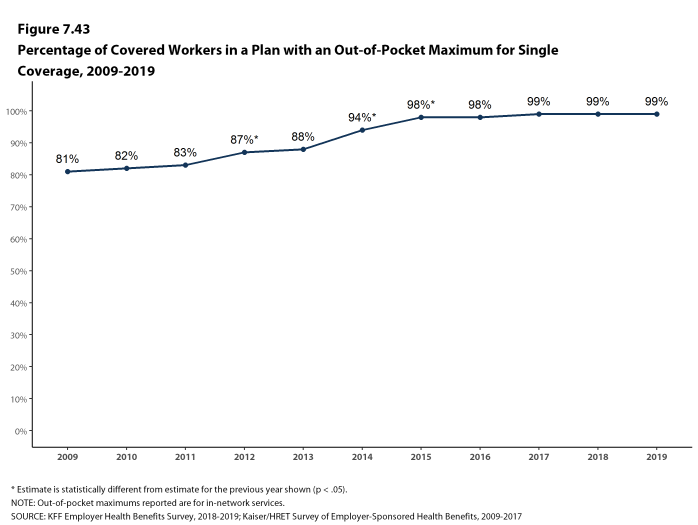
Figure 7.43: Percentage of Covered Workers in a Plan With an Out-Of-Pocket Maximum for Single Coverage, 2009-2019
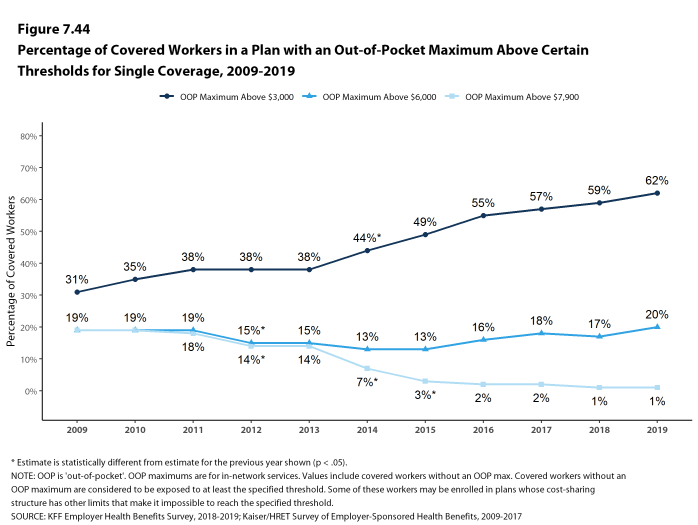
Figure 7.44: Percentage of Covered Workers in a Plan With an Out-Of-Pocket Maximum Above Certain Thresholds for Single Coverage, 2009-2019
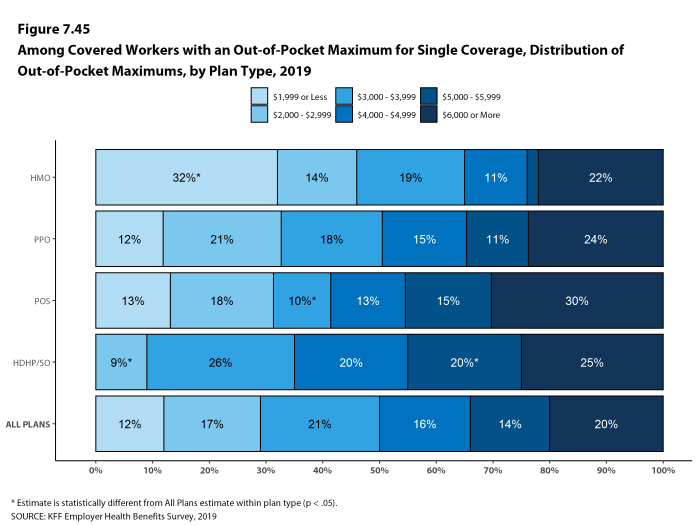
Figure 7.45: Among Covered Workers With an Out-Of-Pocket Maximum for Single Coverage, Distribution of Out-Of-Pocket Maximums, by Plan Type, 2019
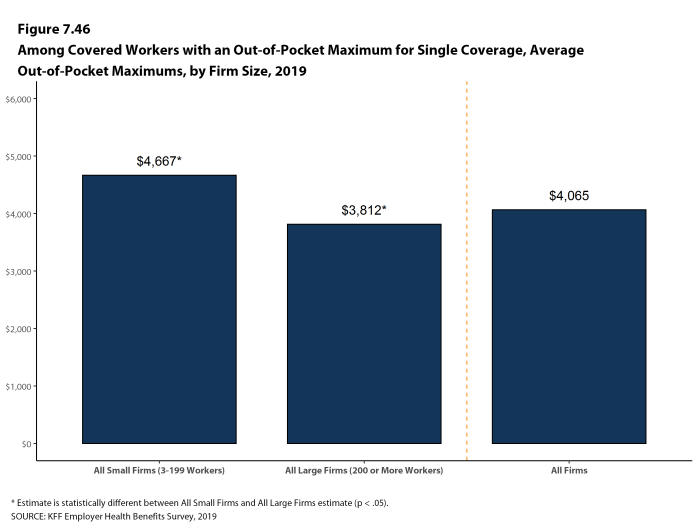
Figure 7.46: Among Covered Workers With an Out-Of-Pocket Maximum for Single Coverage, Average Out-Of-Pocket Maximums, by Firm Size, 2019
- For more information on grandfathered health plans, please see Section 13.↩
- Some workers with separate per-person deductibles or out-of-pocket maximums for family coverage do not have a specific number of family members that are required to meet the deductible amount and instead have another type of limit, such as a per-person amount with a total dollar amount limit. These responses are included in the averages and distributions for separate family deductibles and out-of-pocket maximums.↩
- See https://www.federalregister.gov/d/2018-07355/p-923 For those enrolled in an HDHP/HSA, the out-of-pocket maximum may be no more than $6,750 for an individual plan and $13,500 for a family plan in 2019. See https://www.irs.gov/pub/irs-pdf/p969.pdf↩
- Starting in 2010, the survey asked about the prevalence and cost of physician office visits separately for primary care and specialty care. Prior to the 2010 survey, if the respondent indicated the plan had a copayment for office visits, we assumed the plan had a copayment for both primary and specialty care visits. The survey did not allow for a respondent to report that a plan had a copayment for primary care visits and coinsurance for visits with a specialist physician. The changes made in 2010 allow for variations in the type of cost sharing for primary care and specialty care visits. The survey includes cost sharing for in-network services only.↩
Section Eight: High-deductible Health Plans With Savings Option
To help cover out-of-pocket expenses not covered by a health plan, some firms offer high deductible plans that are paired with an account that allows enrollees to use tax-preferred funds to pay plan cost sharing and other out-of-pocket medical expenses. The two most common are health reimbursement arrangements (HRAs) and health savings accounts (HSAs). HRAs and HSAs are financial accounts that workers or their family members can use to pay for health care services. These savings arrangements are often (or, in the case of HSAs, always) paired with health plans with high deductibles. The survey treats high-deductible plans paired with a savings option as a distinct plan type – High-Deductible Health Plan with Savings Option (HDHP/SO) – even if the plan would otherwise be considered a PPO, HMO, POS plan, or conventional health plan. Specifically for the survey, HDHP/SOs are defined as (1) health plans with a deductible of at least $1,000 for single coverage and $2,000 for family coverage23 offered with an HRA (referred to as HDHP/HRAs); or (2) high-deductible health plans that meet the federal legal requirements to permit an enrollee to establish and contribute to an HSA (referred to as HSA-qualified HDHPs).24
PERCENTAGE OF FIRMS OFFERING HDHP/HRAS AND HSA-QUALIFIED HDHPS
- Twenty-eight percent of firms offering health benefits offer an HDHP/HRA, an HSA-qualified HDHP, or both. Among firms offering health benefits, 4% offer an HDHP/HRA and 26% offer an HSA-qualified HDHP [Figure 8.1]. The percentage of firms offering an HDHP/SO is similar to last year.
- Large firms (200 or more workers) are more likely than small firms (3-199 workers) to offer an HDHP/SO (57% vs. 27%) [Figure 8.3].
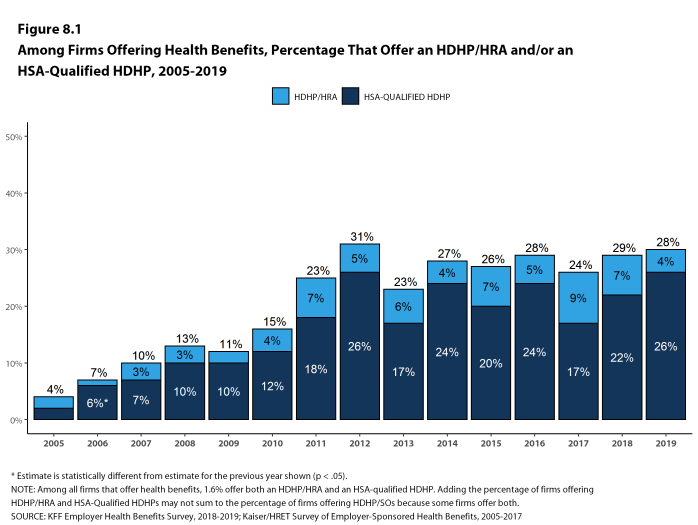
Figure 8.1: Among Firms Offering Health Benefits, Percentage That Offer an HDHP/HRA And/Or an HSA-Qualified HDHP, 2005-2019
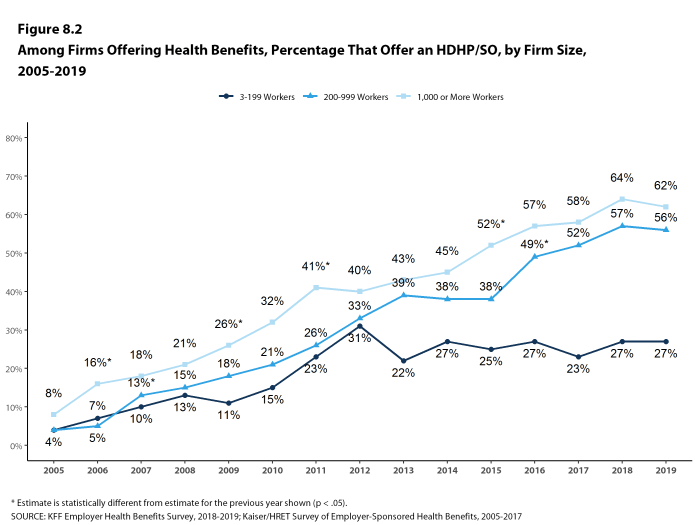
Figure 8.2: Among Firms Offering Health Benefits, Percentage That Offer an HDHP/SO, by Firm Size, 2005-2019
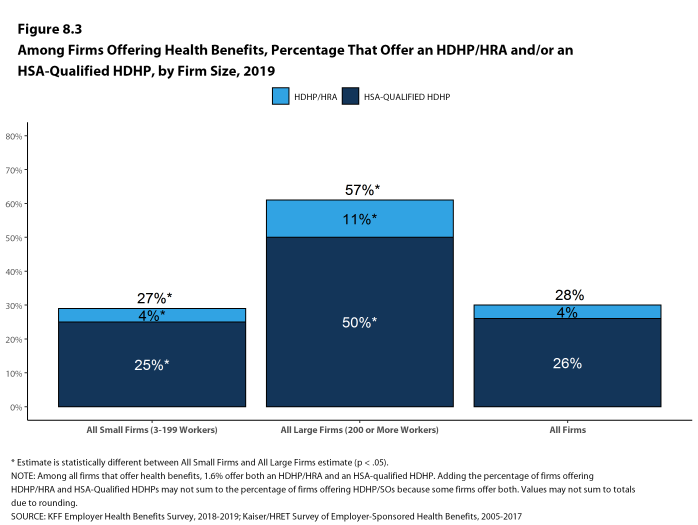
Figure 8.3: Among Firms Offering Health Benefits, Percentage That Offer an HDHP/HRA And/Or an HSA-Qualified HDHP, by Firm Size, 2019
ENROLLMENT IN HDHP/HRAS AND HSA-QUALIFIED HDHPS
- Thirty percent of covered workers are enrolled in an HDHP/SO in 2019 [Figure 8.5].
- Enrollment in HDHP/SOs has increased over the past five years, from 20% of covered workers in 2014 to 30% in 2019 [Figure 8.5].
- Seven percent of covered workers are enrolled in HDHP/HRAs and 23% of covered workers are enrolled in HSA-qualified HDHPs in 2019. These percentages are similar to the percentages last year [Figure 8.5].
- The percentage of covered workers enrolled in HDHP/SOs is higher in large firms (32%) than in small firms (25%) [Figure 8.6].
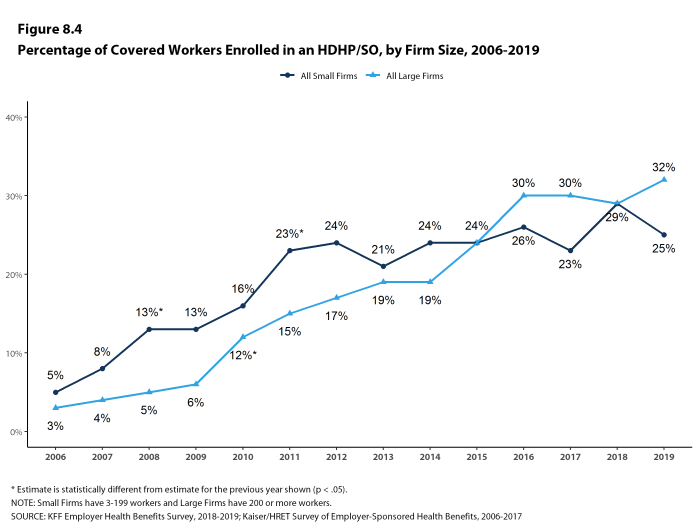
Figure 8.4: Percentage of Covered Workers Enrolled in an HDHP/SO, by Firm Size, 2006-2019
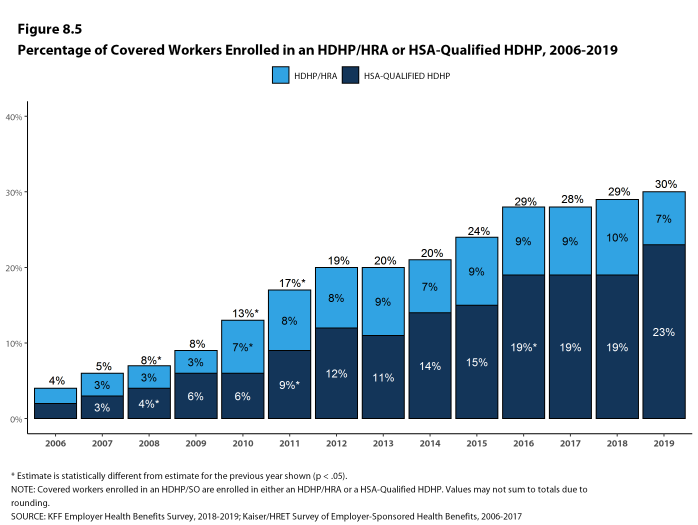
Figure 8.5: Percentage of Covered Workers Enrolled in an HDHP/HRA or HSA-Qualified HDHP, 2006-2019
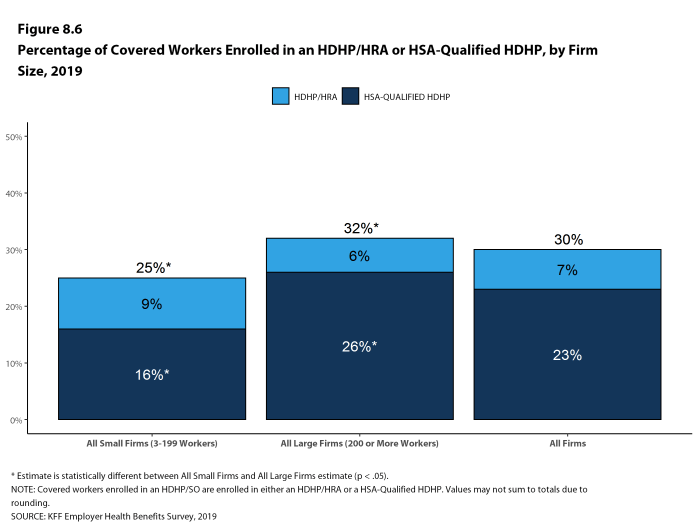
Figure 8.6: Percentage of Covered Workers Enrolled in an HDHP/HRA or HSA-Qualified HDHP, by Firm Size, 2019
PREMIUMS AND WORKER CONTRIBUTIONS
- In 2019, the average annual premiums for covered workers in HDHP/HRAs are $7,103 for single coverage and $21,002 for family coverage [Figure 8.7].
- The average annual premiums for workers in HSA-qualified HDHPs are $6,211 for single coverage and $18,433 for family coverage. These amounts are significantly less than the average single and family premium for covered workers in plans that are not HDHP/SOs [Figure 8.8].
- The average single and family coverage premiums for covered workers enrolled in HSA-qualified HDHPs are lower than the premiums for covered workers enrolled in HDHP/HRAs.
- The average annual worker contributions to premiums for workers enrolled in HDHP/HRAs are $1,345 for single coverage and $6,729 for family coverage [Figure 8.7]. The average contribution for family coverage for covered workers in HDHP/HRAs are similar to the average premium contribution made by covered workers in plans that are not HDHP/SOs [Figure 8.8].
- The average annual worker contributions to premiums for workers in HSA-qualified HDHPs are $990 for single coverage and $4,376 for family coverage. The average contributions for single and family coverage for covered workers in HSA-qualified HDHPs are significantly less than the average premium contribution made by covered workers in plans that are not HDHP/SOs [Figure 8.8].
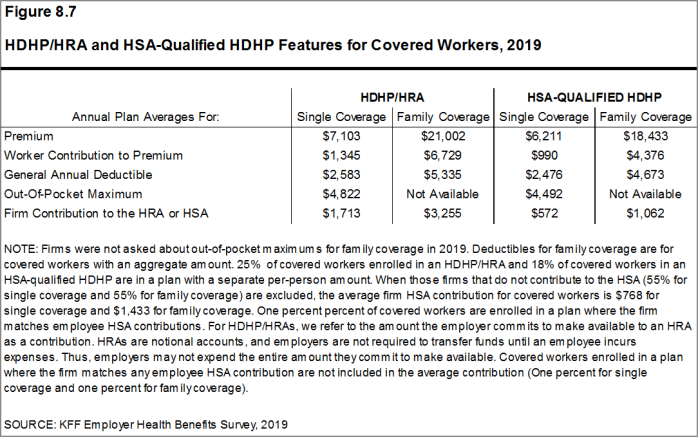
Figure 8.7: HDHP/HRA and HSA-Qualified HDHP Features for Covered Workers, 2019
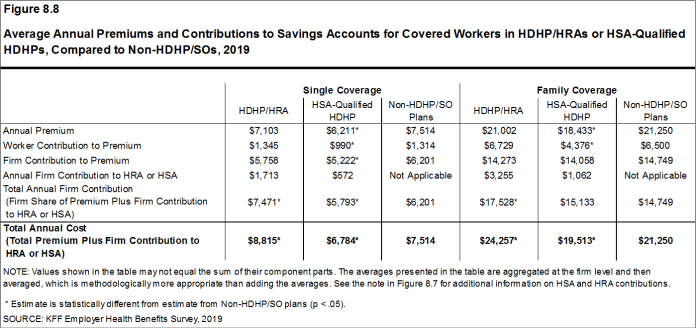
Figure 8.8: Average Annual Premiums and Contributions to Savings Accounts for Covered Workers in HDHP/HRAs or HSA-Qualified HDHPs, Compared to Non-HDHP/SOs, 2019
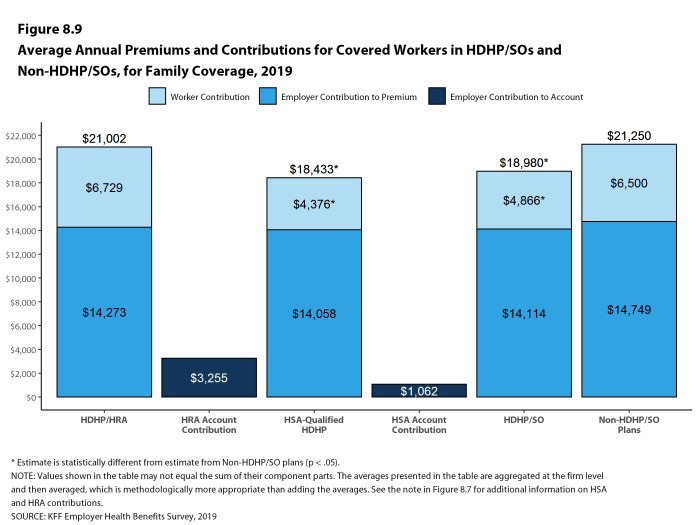
Figure 8.9: Average Annual Premiums and Contributions for Covered Workers in HDHP/SOs and Non-HDHP/SOs, for Family Coverage, 2019
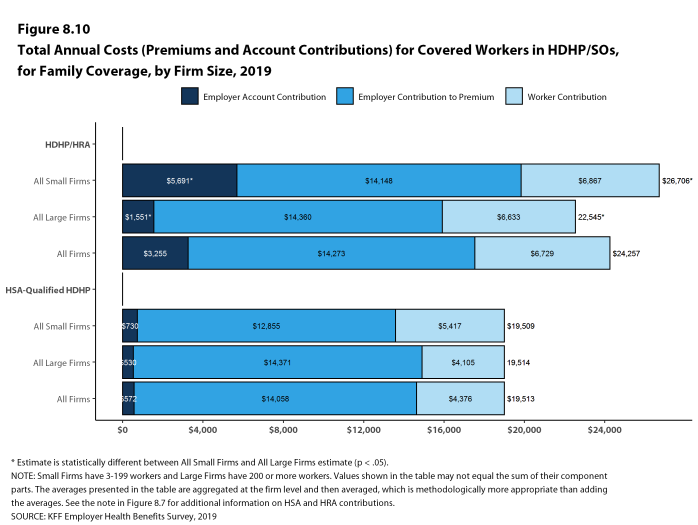
Figure 8.10: Total Annual Costs (Premiums and Account Contributions) for Covered Workers in HDHP/SOs, for Family Coverage, by Firm Size, 2019
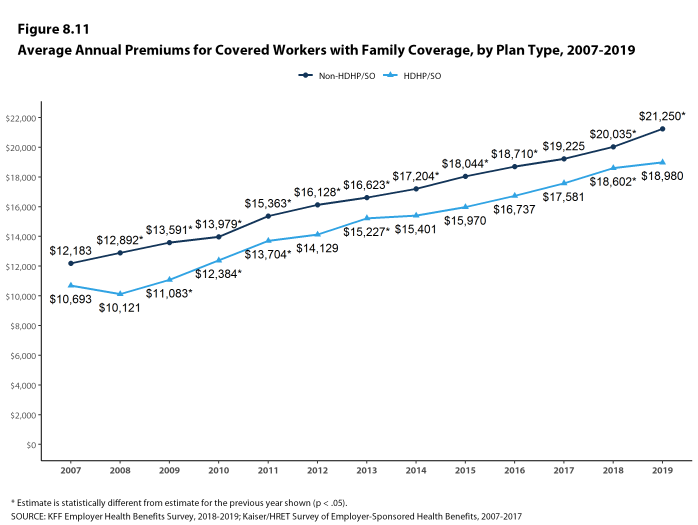
Figure 8.11: Average Annual Premiums for Covered Workers With Family Coverage, by Plan Type, 2007-2019
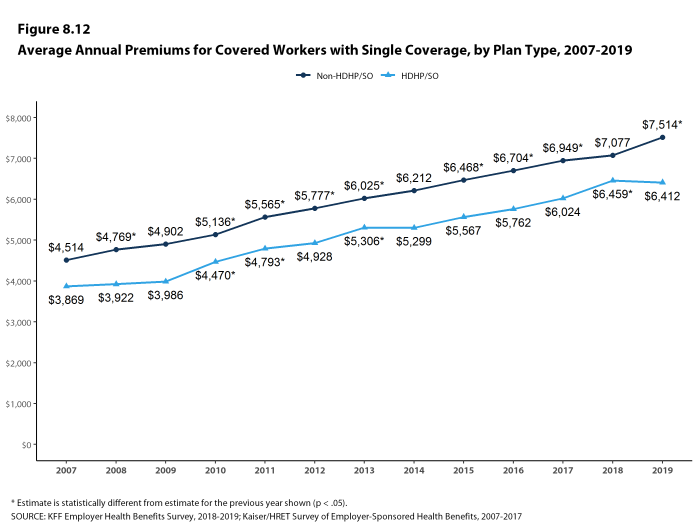
Figure 8.12: Average Annual Premiums for Covered Workers With Single Coverage, by Plan Type, 2007-2019
OUT-OF-POCKET MAXIMUMS AND PLAN DEDUCTIBLES
- HSA-qualified HDHPs are legally required to have an annual out-of-pocket maximum of no more than $6,750 for single coverage and $13,500 for family coverage in 2019. Non-grandfathered HDHP/HRA plans are required to have out-of-pocket maximums of no more than $7,900 for single coverage and $15,800 for family coverage in 2019.25 Virtually all HDHP/HRA plans have an out-of-pocket maximum for single coverage in 2019.
- The average annual out-of-pocket maximum for single coverage is $4,822 for HDHP/HRAs and $4,492 for HSA-qualified HDHPs [Figure 8.7].
- As expected, workers enrolled in HDHP/SOs have higher deductibles than workers enrolled in HMOs, PPOs, or POS plans.
- The average general annual deductible for single coverage is $2,583 for HDHP/HRAs and $2,476 for HSA-qualified HDHPs [Figure 8.14]. These averages are similar to the amounts reported in recent years. There is wide variation around these averages: 41% of covered workers enrolled in an HDHP/SO are in a plan with a deductible of $1,000 to $1,999 while 26% are in a plan with a deductible of $3,000 or more [Figure 8.13].
- The survey asks firms whether the family deductible amount is (1) an aggregate amount (i.e., the out-of-pocket expenses of all family members are counted until the deductible is satisfied), or (2) a per-person amount that applies to each family member (typically with a limit on the number of family members that would be required to meet the deductible amount) (see Section 7 for more information).
- The average aggregate deductibles for workers with family coverage are $5,335 for HDHP/HRAs and $4,673 for HSA-qualified HDHPs [Figure 8.7]. As with single coverage, there is wide variation around these averages for family coverage: 11% of covered workers enrolled in HDHP/SOs with an aggregate family deductible have a deductible of $2,000 to $2,999 while 22% have a deductible of $6,000 dollars or more [Figure 8.16].
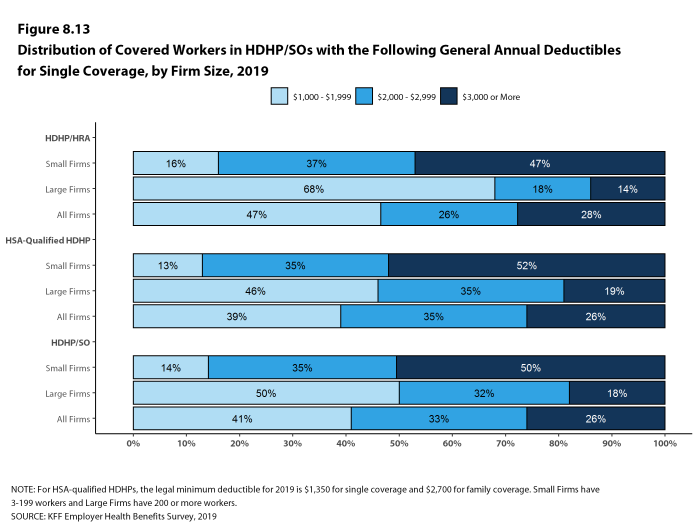
Figure 8.13: Distribution of Covered Workers in HDHP/SOs With the Following General Annual Deductibles for Single Coverage, by Firm Size, 2019
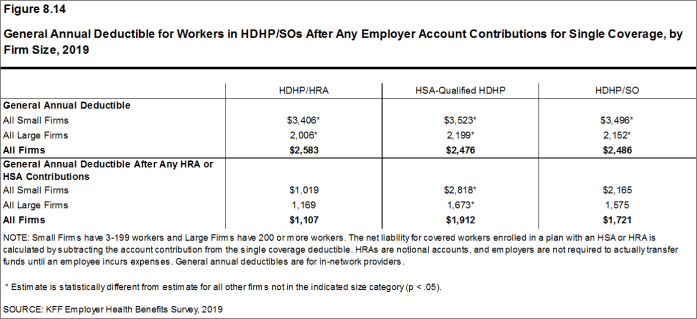
Figure 8.14: General Annual Deductible for Workers in HDHP/SOs After Any Employer Account Contributions for Single Coverage, by Firm Size, 2019
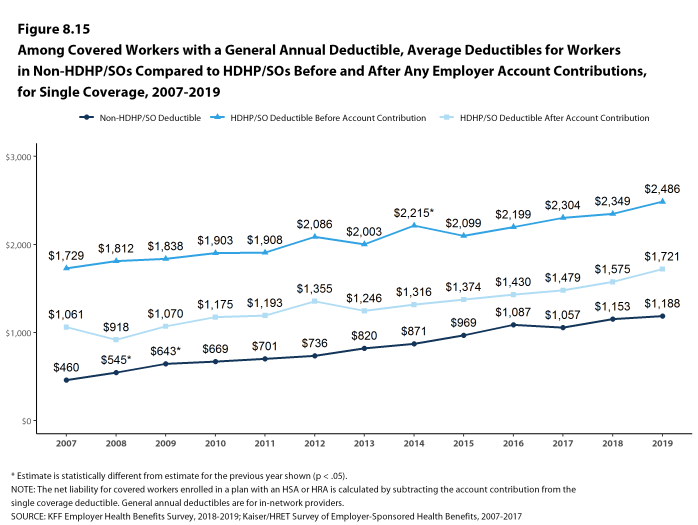
Figure 8.15: Among Covered Workers With a General Annual Deductible, Average Deductibles for Workers in Non-HDHP/SOs Compared to HDHP/SOs Before and After Any Employer Account Contributions, for Single Coverage, 2007-2019
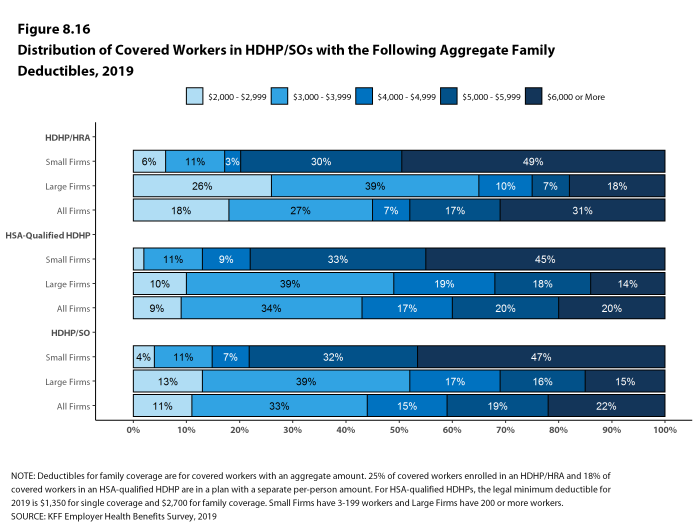
Figure 8.16: Distribution of Covered Workers in HDHP/SOs With the Following Aggregate Family Deductibles, 2019
EMPLOYER ACCOUNT CONTRIBUTIONS
- Employers contribute to HDHP/SOs in two ways: through their contributions toward the premium for the health plan and through their contributions (if any, in the case of HSAs) to the savings account option (i.e., the HRAs or HSAs themselves).
- Looking at only the annual employer contributions to premiums, covered workers in HDHP/HRAs on average receive employer contributions of $5,758 for single coverage and $14,273 for family coverage [Figure 8.8]. These amounts are similar to the contribution amounts last year.
- The average annual employer contributions to premiums for workers in HSA-qualified HDHPs are $5,222 for single coverage and $14,058 for family coverage, similar to the contribution amounts last year. The average employer contribution for covered workers in HSA-qualified HDHPs for single coverage is lower than the average contribution for covered workers in plans that are not HDHP/SOs [Figure 8.8].
- Looking at employer contributions to the savings options, covered workers enrolled in HDHP/HRAs on average receive an annual employer contribution to their HRA of $1,713 for single coverage and $3,255 for family coverage [Figure 8.8].
- HRAs are generally structured in such a way that employers may not actually spend the whole amount that they make available to their employees’ HRAs.26 Amounts committed to an employee’s HRA that are not used by the employee generally roll over and can be used in future years, but any balance may revert back to the employer if the employee leaves his or her job. Thus, the employer contribution amounts to HRAs that we capture in the survey may exceed the amount that employers will actually spend.
- Covered workers enrolled in HSA-qualified HDHPs on average receive an annual employer contribution to their HSA of $572 for single coverage and $1,062 for family coverage [Figure 8.8].
- In many cases, employers that sponsor HSA-qualified HDHP/SOs do not make contributions to HSAs established by their employees. Fifty-five percent of employers offering single coverage and 55% offering family coverage through HSA-qualified HDHPs do not make contributions toward the HSAs that their workers establish. For both single and family coverage, 25% and 26% of workers respectively, in an HSA-qualified HDHP do not receive an account contribution from their employer [Figure 8.17] and [Figure 8.18].
- The average HSA contributions reported above include the portion of covered workers whose employer contribution to the HSA is zero. When those firms that do not contribute to the HSA are excluded from the calculation, the average employer contribution for covered workers is $768 for single coverage and $1,433 for family coverage.
- The percentages of covered workers enrolled in a plan where the employer makes no HSA contribution (25% for single coverage and 26% for family coverage) are similar to the percentages in recent years [Figure 8.17] and [Figure 8.18].
- There is considerable variation in the amount that employers contribute to savings accounts.
- Forty-three percent of covered workers in an HDHP/HRA receive an annual HRA contribution of less than $800 for single coverage, while 26% receive an annual HRA contribution of $1,600 or more [Figure 8.17].
- Forty percent of covered workers in an HSA-qualified HDHP receive an annual HSA contribution of less than $400 for single coverage, including 25% that receive no HSA contribution from their employer [Figure 8.17]. In contrast, 11% of covered workers in an HSA-qualified HDHP receive an annual HSA contribution of $1,200 or more. One percent of covered workers with an employer that matches any HSA contribution for single coverage.
- Employer contributions to savings account options (i.e., the HRAs and HSAs themselves) for their workers can be added to their health plan premium contributions to calculate total employer contributions toward HDHP/SOs. We note that HRAs are a promise by an employer to pay up to a specified amount and that many employees will not receive the full amount of their HRA in a year, so adding the employer premium contribution amount and the HRA contribution represents an upper bound for employer liability that overstates the amount that is actually expended. Since employer contributions to employee HSAs immediately transfer the full amount to the employee, adding employer premium and HSA contributions is an instructive way to look at their total liability under these plans.
- For HDHP/HRAs, the average annual total employer contribution for covered workers is $7,471 for single coverage and $17,528 for family coverage. The average total employer contributions for covered workers for single coverage and family coverage in HDHP/HRAs are higher than the average firm contributions toward single and family coverage in plans that are not HDHP/SOs [Figure 8.8].
- For HSA-qualified HDHPs, the average total annual firm contribution for covered workers is $5,793 for single coverage and $15,133 for workers with family coverage. The average total firm contribution amount for single coverage in HSA-qualified HDHPs is lower average firm contributions toward single coverage in health plans that are not HDHP/SOs [Figure 8.8].
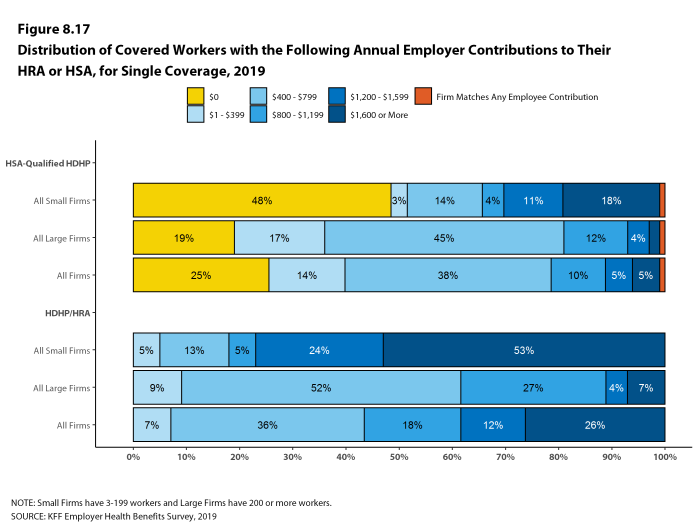
Figure 8.17: Distribution of Covered Workers With the Following Annual Employer Contributions to Their HRA or HSA, for Single Coverage, 2019
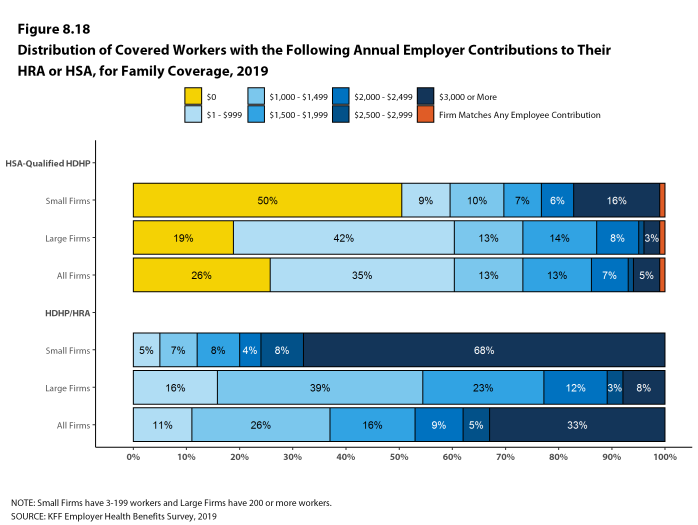
Figure 8.18: Distribution of Covered Workers With the Following Annual Employer Contributions to Their HRA or HSA, for Family Coverage, 2019
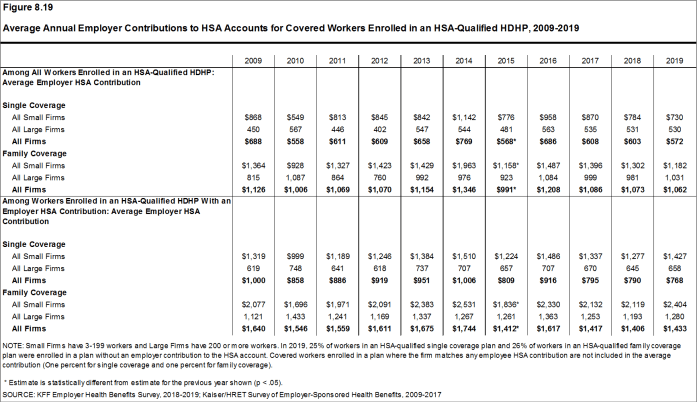
Figure 8.19: Average Annual Employer Contributions to HSA Accounts for Covered Workers Enrolled in an HSA-Qualified HDHP, 2009-2019
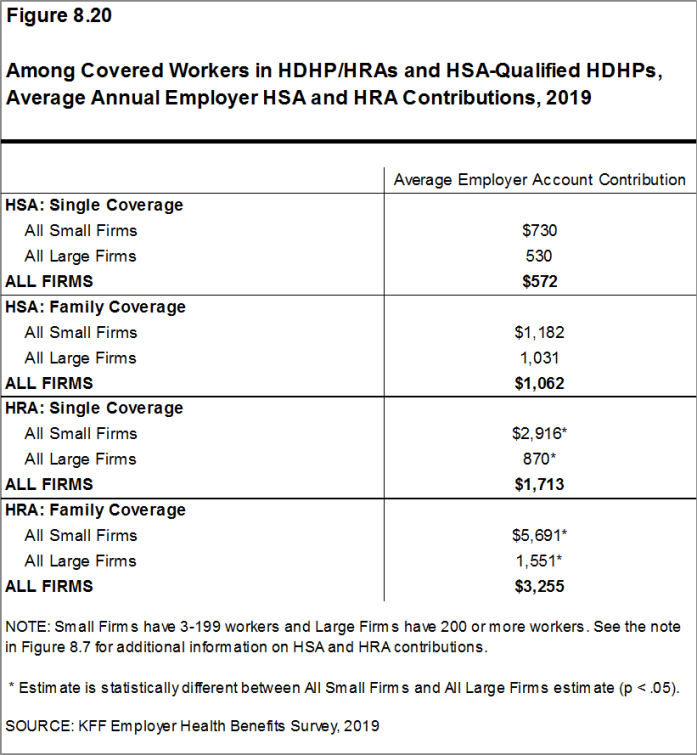
Figure 8.20: Among Covered Workers in HDHP/HRAs and HSA-Qualified HDHPs, Average Annual Employer HSA and HRA Contributions, 2019
COST SHARING FOR OFFICE VISITS
- The cost-sharing pattern for primary care office visits differs for workers enrolled in HDHP/SOs. Forty-seven percent of covered workers in HDHP/HRAs have a copayment for primary care physician office visits compared to 6% enrolled in HSA-qualified HDHPs [Figure 8.21]. Workers in other plan types are much more likely to face copayments than coinsurance for physician office visits (see Section 7 for more information).
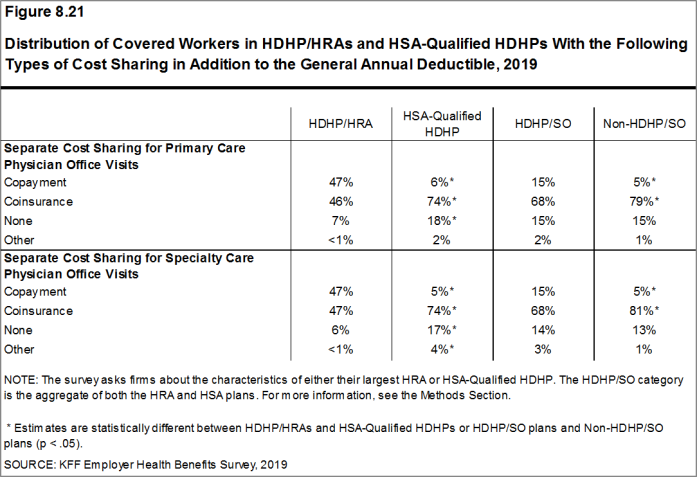
Figure 8.21: Distribution of Covered Workers in HDHP/HRAs and HSA-Qualified HDHPs With the Following Types of Cost Sharing in Addition to the General Annual Deductible, 2019
- There is no legal requirement for the minimum deductible in a plan offered with an HRA. The survey defines a high-deductible HRA plan as a plan with a deductible of at least $1,000 for single coverage and $2,000 for family coverage. Federal law requires a deductible of at least $1,350 for single coverage and $2,700 for family coverage for HSA-qualified HDHPs in 2019 (or $1,350 and $2,700, respectively, for plans in their 2018 plan year). Not all firms’ plan years correspond with the calendar year, so some firms may report a plan with limits from the prior year. See the Text Box for more information on HDHP/HRAs and HSA-qualified HDHPs.↩
- The definitions of HDHP/SOs do not include other consumer-driven plan options, such as arrangements that combine an HRA with a lower-deductible health plan or arrangements in which an insurer (rather than the employer as in the case of HRAs or the enrollee as in the case of HSAs) establishes an account for each enrollee. Other arrangements may be included in future surveys as the market evolves.↩
- See https://www.federalregister.gov/d/2018-07355/p-923 For those enrolled in an HDHP/HSA, see https://www.irs.gov/pub/irs-pdf/p969.pdf↩
- The survey asks “Up to what dollar amount does your firm promise to contribute each year to an employee’s HRA or health reimbursement arrangement for single coverage?” We refer to the amount that the employer commits to make available to an HRA as a contribution for ease of discussion. As discussed, HRAs are notional accounts, and employers are not required to actually transfer funds until an employee incurs expenses. Thus, employers may not expend the entire amount that they commit to make available to their employees through an HRA. Some employers may make their HRA contribution contingent on other factors, such as completing wellness programs.↩
- See https://www.federalregister.gov/d/2018-07355/p-923 For those enrolled in an HDHP/HSA, see https://www.irs.gov/pub/irs-pdf/p969.pdf↩
Section Nine: Prescription Drug Benefits
Nearly all (more than 99%) covered workers are at a firm that provides prescription drug coverage in its largest health plan. Many employer plans have increasingly complex benefit designs for prescriptions drugs, as employers and insurers expand the use of formularies with multiple cost-sharing tiers as well as other management approaches. To reduce the burden on respondents, we ask offering firms about the attributes of prescription drug coverage only for their largest health plan. This survey asks employers about the cost-sharing in up to four tiers, and a tier exclusively for specialty drugs. There may be considerable variation in how plans structure their formularies.
DISTRIBUTION OF COST SHARING
- The large majority of covered workers (91%) are in a plan with tiered cost sharing for prescription drugs [Figure 9.1]. Cost-sharing tiers generally refer to a health plan placing a drug on a formulary or preferred drug list that classifies drugs into categories that are subject to different cost sharing or management. It is common for there to be different tiers for generic, preferred and non-preferred drugs. In recent years, plans have created additional tiers that may, for example, be used for specialty drugs or expensive biologics. Some plans may have multiple tiers for different categories; for example, a plan may have preferred and non-preferred specialty tiers. The survey obtains information about the cost-sharing structure for up to five tiers.
- Eighty-four percent of covered workers are in a plan with three, four, or more tiers of cost sharing for prescription drugs [Figure 9.1]. These totals include tiers that cover only specialty drugs, even though the cost-sharing information for those tiers is reported separately.
- HDHP/SOs have a different cost-sharing pattern for prescription drugs than other plan types. Compared to covered workers in other plan types, those in HDHP/SOs are more likely to be in a plan with the same cost sharing regardless of drug type (10% vs. 3%) or in a plan that has no cost sharing for prescriptions once the plan deductible is met (9% vs. 1%) [Figure 9.2].
- Among firms that cover prescription drugs very few firms limit their coverage to only generics drugs. Of firms with prescription drug coverage, the percent of small firms that cover only generic drugs is 1% and the percentage of large firms that cover only generic drugs is 1%.
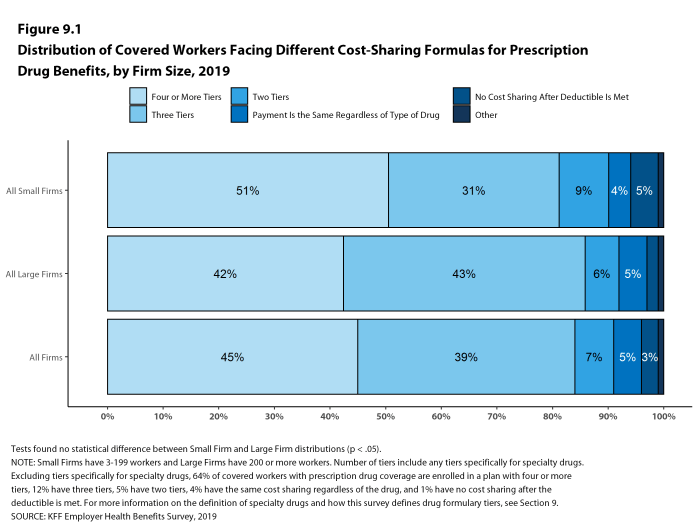
Figure 9.1: Distribution of Covered Workers Facing Different Cost-Sharing Formulas for Prescription Drug Benefits, by Firm Size, 2019
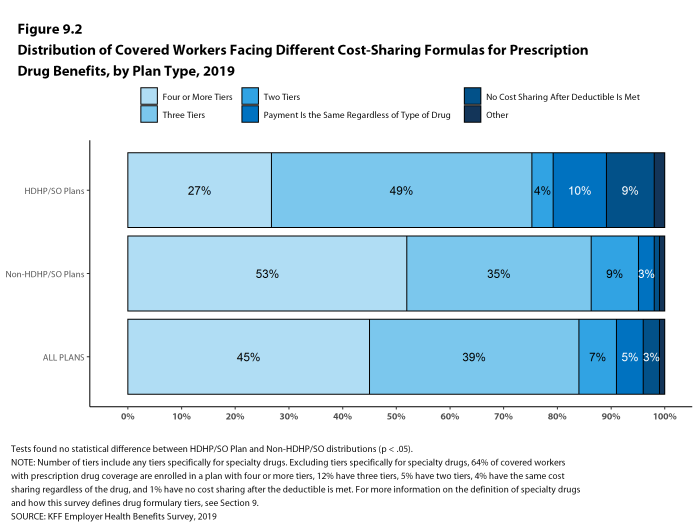
Figure 9.2: Distribution of Covered Workers Facing Different Cost-Sharing Formulas for Prescription Drug Benefits, by Plan Type, 2019
TIERS NOT EXCLUSIVELY FOR SPECIALTY DRUGS
- Even when formulary tiers covering only specialty drugs are not counted, a large share (78%) of covered workers are in a plan with three or more tiers of cost sharing for prescription drugs. The cost-sharing statistics presented in this section do not include information about tiers that cover only specialty drugs. In cases in which a plan covers specialty drugs on a tier with other drugs, they will still be included in these averages. Cost-sharing statistics for tiers covering only specialty drugs are presented in the next section.
- For covered workers in a plan with three or more tiers of cost sharing for prescription drugs, copayments are the most common form of cost sharing in the first three tiers and coinsurance is the next most common [Figure 9.3].
- Among covered workers in plans with three or more tiers of cost sharing for prescription drugs, the average copayments are $11 for first-tier drugs, $33 second-tier drugs, $59 for third-tier drugs, and $123 for fourth-tier drugs [Figure 9.6].
- Among covered workers in plans with three or more tiers of cost sharing for prescription drugs, the average coinsurance rates are 18% for first-tier drugs, 24% second-tier drugs, 34% third-tier drugs, and 29% for fourth-tier drugs [Figure 9.6].
- Twelve percent of covered workers are in a plan with two tiers for prescription drug cost sharing (excluding tiers covering only specialty drugs).
- For these workers, copayments are more common than coinsurance for first-tier and second-tier drugs [Figure 9.3]. The average copayment for the first tier is $11 and the average copayment for the second tier is $31 [Figure 9.6].
- Five percent of covered workers are in a plan with the same cost sharing for prescriptions regardless of the type of drug (excluding tiers covering only specialty drugs).
- Among these workers, 25% have copayments and 75% have coinsurance [Figure 9.3]. The average coinsurance rate is 22% [Figure 9.6].
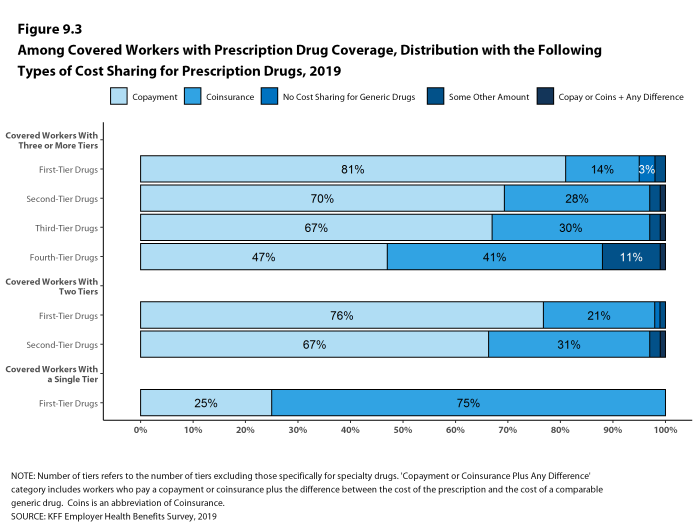
Figure 9.3: Among Covered Workers With Prescription Drug Coverage, Distribution With the Following Types of Cost Sharing for Prescription Drugs, 2019
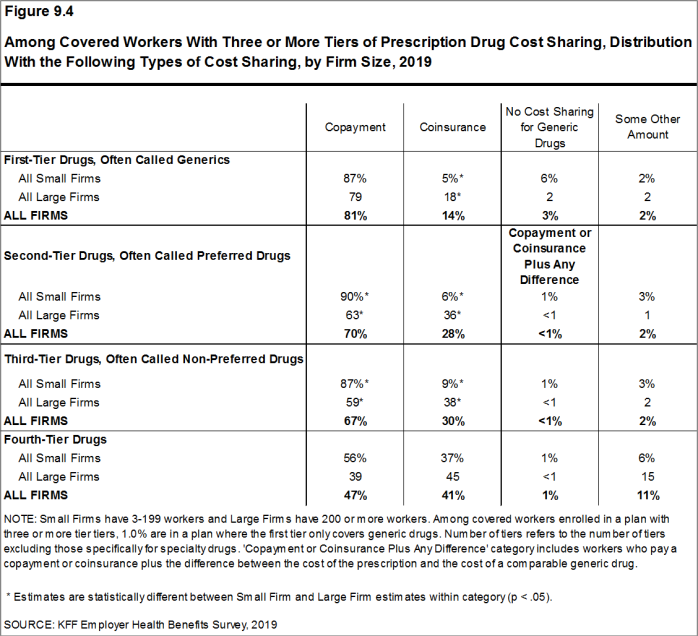
Figure 9.4: Among Covered Workers With Three or More Tiers of Prescription Drug Cost Sharing, Distribution With the Following Types of Cost Sharing, by Firm Size, 2019
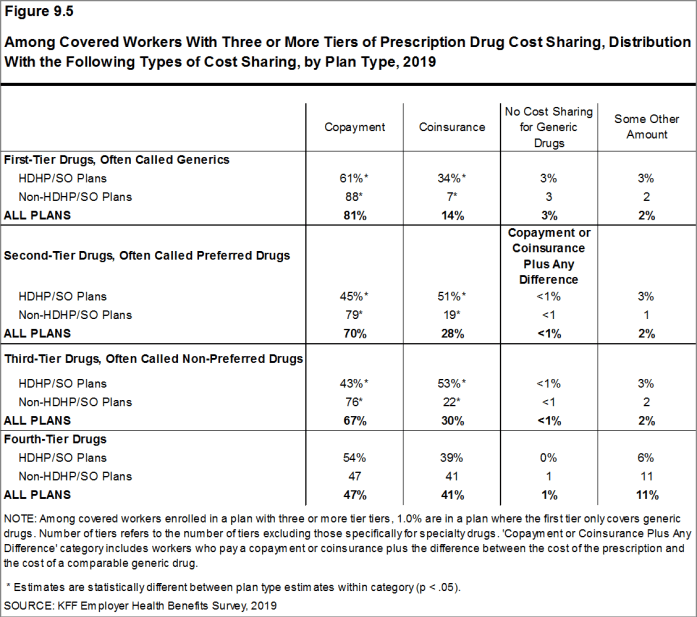
Figure 9.5: Among Covered Workers With Three or More Tiers of Prescription Drug Cost Sharing, Distribution With the Following Types of Cost Sharing, by Plan Type, 2019
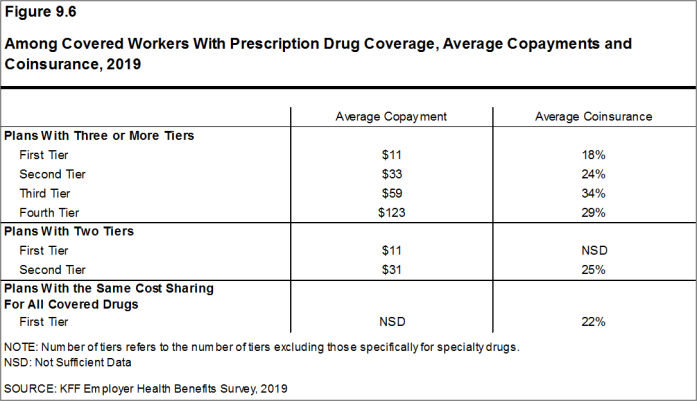
Figure 9.6: Among Covered Workers With Prescription Drug Coverage, Average Copayments and Coinsurance, 2019
COINSURANCE MAXIMUMS
- Coinsurance rates for prescription drugs often include maximum and/or minimum dollar amounts. Depending on the plan design, coinsurance maximums may significantly limit the amount an enrollee must spend out-of-pocket for higher-cost drugs.
- These coinsurance minimum and maximum amounts vary across the tiers.
- For example, among covered workers in a plan with coinsurance for the first cost-sharing tier, 16% have only a maximum dollar amount attached to the coinsurance rate, 6% have only a minimum dollar amount, 18% have both a minimum and maximum dollar amount, and 58% have neither. For those in a plan with coinsurance for the fourth cost-sharing tier, 40% have only a maximum dollar amount attached to the coinsurance rate, 2% have only a minimum dollar amount, 13% have both a minimum and maximum dollar amount, and 43% have neither [Figure 9.7].
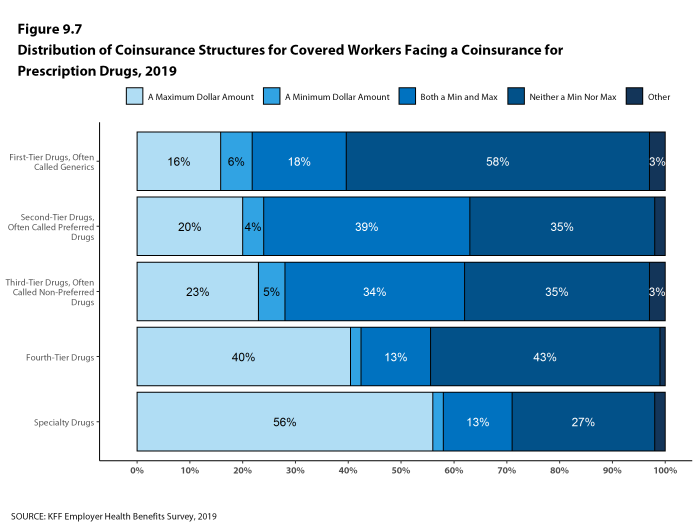
Figure 9.7: Distribution of Coinsurance Structures for Covered Workers Facing a Coinsurance for Prescription Drugs, 2019
SEPARATE TIERS FOR SPECIALTY DRUGS
- Specialty drugs, such as biologics that may be used to treat chronic conditions, or some cancer drugs, can be quite expensive and often require special handling and administration. We revised our questions beginning with the 2016 survey to obtain more information about formulary tiers that are exclusively for specialty drugs. We are reporting results only among large firms because a relatively large share of small firms were unsure whether their largest plan covered these drugs.
- Ninety-seven percent of covered workers at large firms have coverage for specialty drugs [Figure 9.8]. Among these workers, 45% are in a plan with at least one cost-sharing tier just for specialty drugs [Figure 9.9].
- Among covered workers in a plan with at least one separate tier for specialty drugs, 45% have a copayment for specialty drugs and 52% have coinsurance [Figure 9.10]. The average copayment is $109 and the average coinsurance rate is 24% [Figure 9.11]. Seventy percent of those with coinsurance have a maximum dollar limit on the amount of coinsurance they must pay.
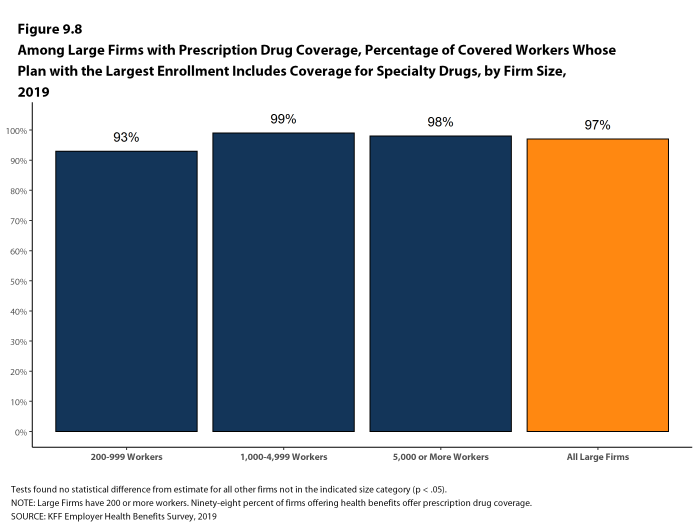
Figure 9.8: Among Large Firms With Prescription Drug Coverage, Percentage of Covered Workers Whose Plan With the Largest Enrollment Includes Coverage for Specialty Drugs, by Firm Size, 2019
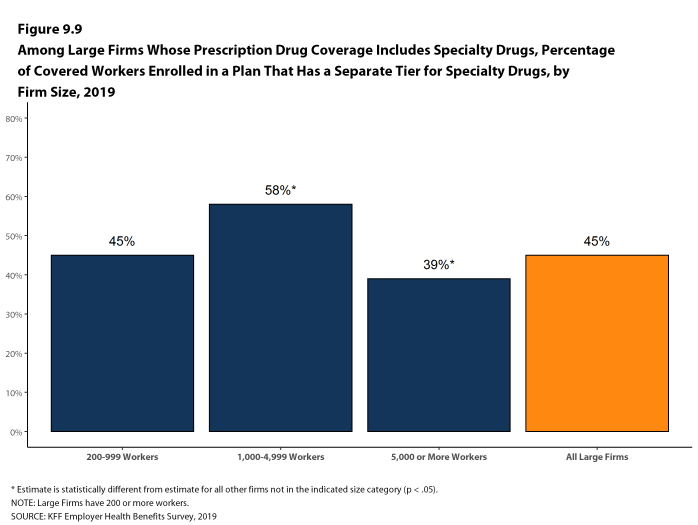
Figure 9.9: Among Large Firms Whose Prescription Drug Coverage Includes Specialty Drugs, Percentage of Covered Workers Enrolled in a Plan That Has a Separate Tier for Specialty Drugs, by Firm Size, 2019
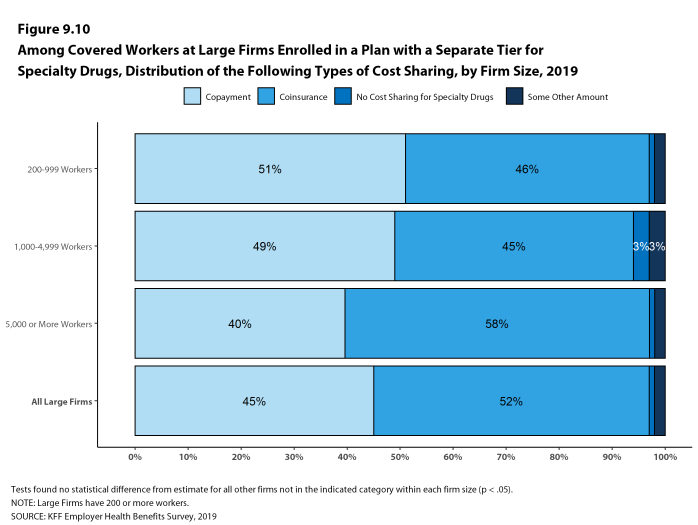
Figure 9.10: Among Covered Workers at Large Firms Enrolled in a Plan With a Separate Tier for Specialty Drugs, Distribution of the Following Types of Cost Sharing, by Firm Size, 2019
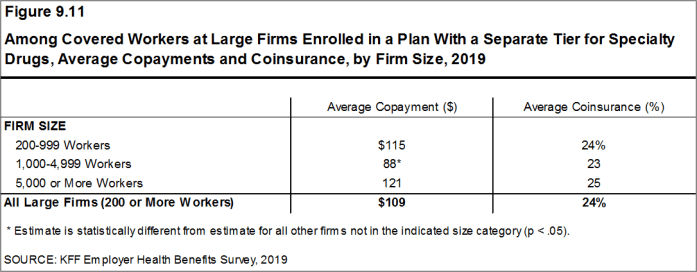
Figure 9.11: Among Covered Workers at Large Firms Enrolled in a Plan With a Separate Tier for Specialty Drugs, Average Copayments and Coinsurance, by Firm Size, 2019
MAIL ORDER PHARMACIES
- Many plans allow enrollees to fill prescriptions through the mail. In some cases, there may be financial incentive, such as lower cost sharing for enrollees to use this process.
- In 2019, a very small share of workers 2% were in plans that only covered prescription drugs provided through the mail and 4% were in plans which only covered some prescriptions through the mail [Figure 9.12]. For these workers, the plan would generally not pay anything for a prescription if the enrollee visited a physical pharmacy.
- Among workers at firms with 50 or more employees that offer coverage for prescription drugs, 58% have a financial incentive for enrollees to fill some or all prescriptions through a mail order pharmacy [Figure 9.13].
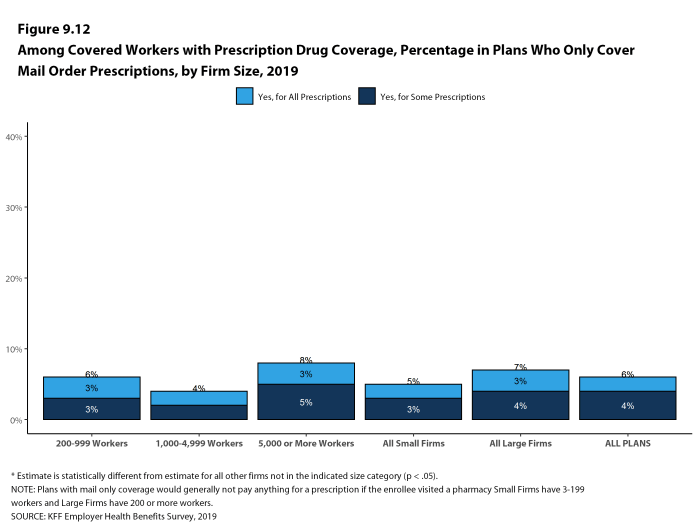
Figure 9.12: Among Covered Workers With Prescription Drug Coverage, Percentage in Plans Who Only Cover Mail Order Prescriptions, by Firm Size, 2019
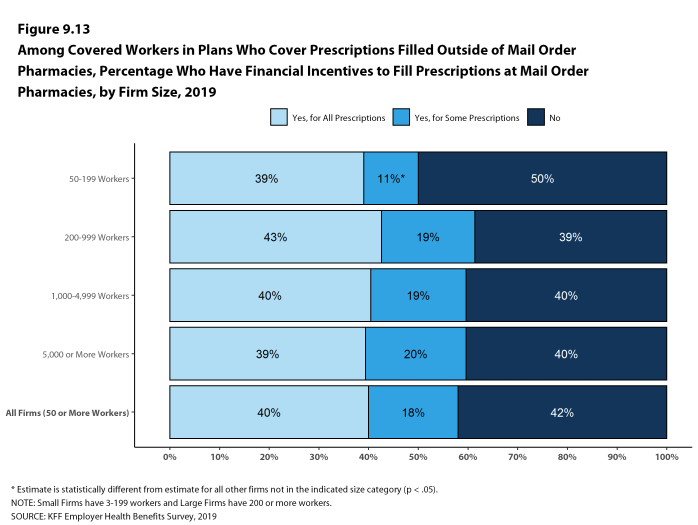
Figure 9.13: Among Covered Workers in Plans Who Cover Prescriptions Filled Outside of Mail Order Pharmacies, Percentage Who Have Financial Incentives to Fill Prescriptions at Mail Order Pharmacies, by Firm Size, 2019
MAINTENANCE DRUGS FOR CHROINIC CONDITIONS
- Among firms with 1,000 or more employees that offer coverage for prescription drugs, 31% have reduced or zero cost sharing for maintenance drugs for chronic conditions, such as insulin for diabetes [Figure 9.14].
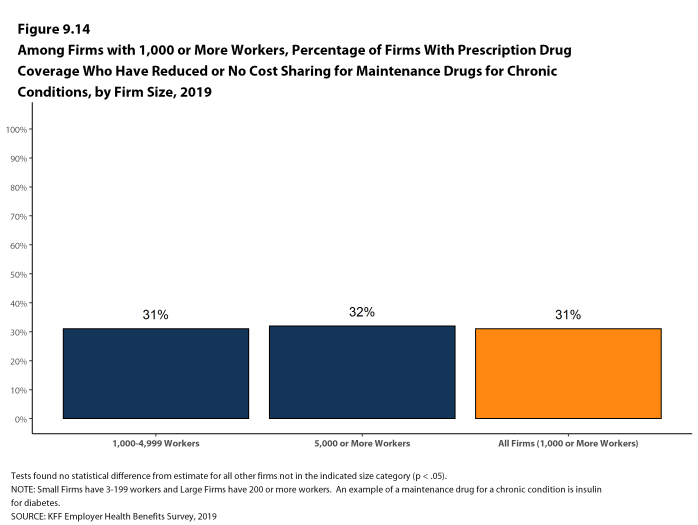
Figure 9.14: Among Firms With 1,000 or More Workers, Percentage of Firms With Prescription Drug Coverage Who Have Reduced or No Cost Sharing for Maintenance Drugs for Chronic Conditions, by Firm Size, 2019
SEPARATE ANNUAL DEDUCTIBLE
- Among covered workers in a plan with coverage for prescription drugs, 13% are enrolled in a plan that that has a separate annual deductible that applies only to prescription drugs.
- Covered workers in small firms are less likely than those in large firms to be enrolled in a plan with a separate annual deductible for prescription drugs (9% vs. 14%) [Figure 9.15].
- For covered workers in a plan with a separate annual deductible for prescription drugs, the average prescription drug deductible is $194 [Figure 9.16].
- Sixty-nine percent of covered workers in a plan with a separate annual deductible for prescription drugs are in a plan that applies the deductible to all covered drugs [Figure 9.16].
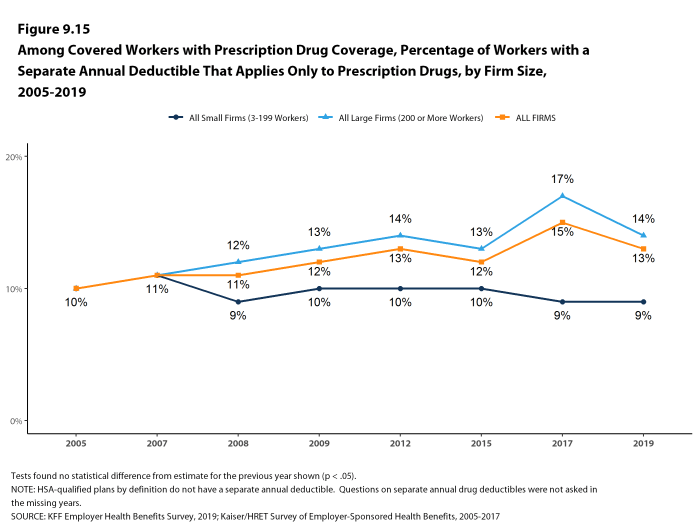
Figure 9.15: Among Covered Workers With Prescription Drug Coverage, Percentage of Workers With a Separate Annual Deductible That Applies Only to Prescription Drugs, by Firm Size, 2005-2019
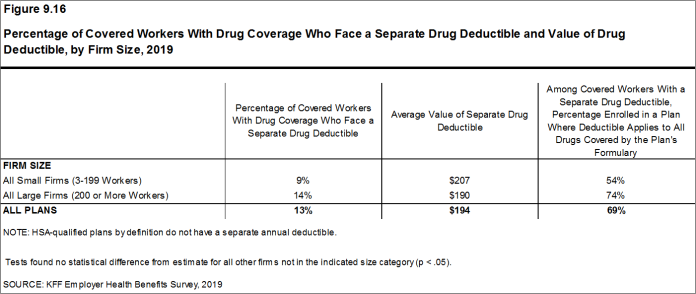
Figure 9.16: Percentage of Covered Workers With Drug Coverage Who Face a Separate Drug Deductible and Value of Drug Deductible, by Firm Size, 2019
Section Ten: Plan Funding
Many firms, particularly larger firms, choose to pay for some or all of the health services of their workers directly from their own funds rather than by purchasing health insurance for them. This is called self-funding. Both public and private employers use self-funding to provide health benefits. Federal law (the Employee Retirement Income Security Act of 1974, or ERISA) exempts self-funded plans established by private employers (but not public employers) from most state insurance laws, including reserve requirements, mandated benefits, premium taxes, and many consumer protection regulations. Sixty-one percent of covered workers are in a self-funded health plan in 2019. Self-funding is common among larger firms because they can spread the risk of costly claims over a large number of workers and dependents.
In recent years, a complex funding option, often called level-funding, has become more widely available to small employers. Level-funded arrangements are nominally self-funded options that package together a self-funded plan with extensive stoploss coverages that significantly reduces the risk retained by the employer. Seven percent of covered workers in small firms (3-199 workers) are in a level-funded plan.
SELF-FUNDED PLANS
- Sixty-one percent of covered workers are in a plan that is completely or partially self-funded, similar to last year [Figure 10.1] and [Figure 10.2].
- The percentage of covered workers enrolled in self-funded plans has been stable in recent years across firm sizes [Figure 10.2]. The percentage of covered workers enrolled in a self-funded health plan is similar to ten years ago.
- As expected, covered workers in large firms are significantly more likely to be in a self-funded plan than covered workers in small firms (80% vs. 17%). The percentage of covered workers in self-funded plans generally increases as the number of workers in a firm increases. [Figure 10.1] and [Figure 10.3].
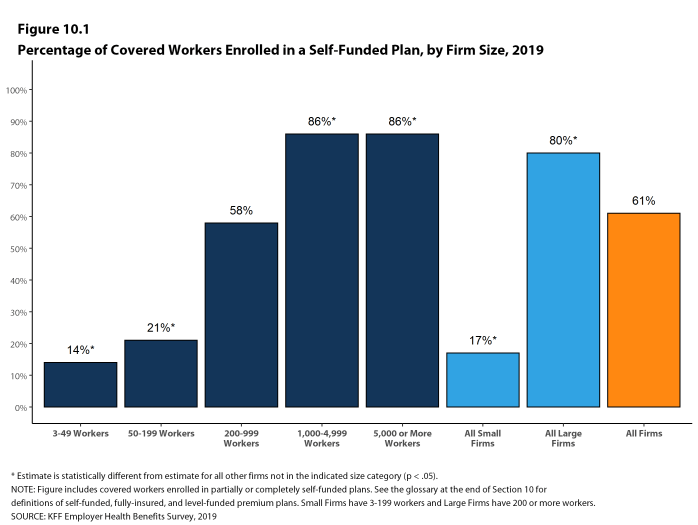
Figure 10.1: Percentage of Covered Workers Enrolled in a Self-Funded Plan, by Firm Size, 2019
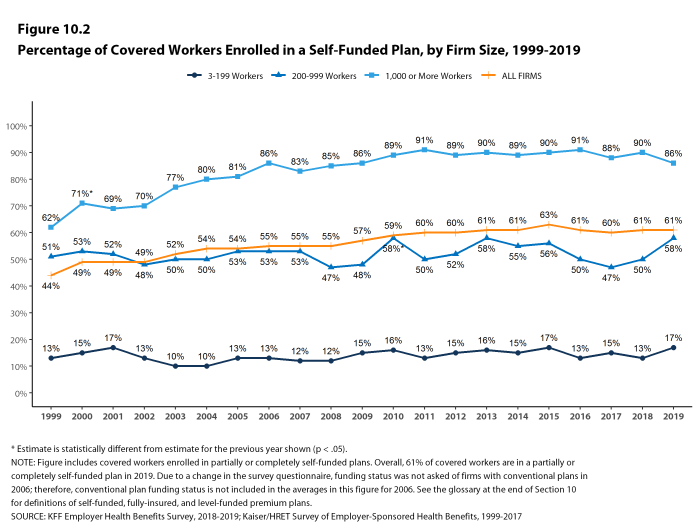
Figure 10.2: Percentage of Covered Workers Enrolled in a Self-Funded Plan, by Firm Size, 1999-2019
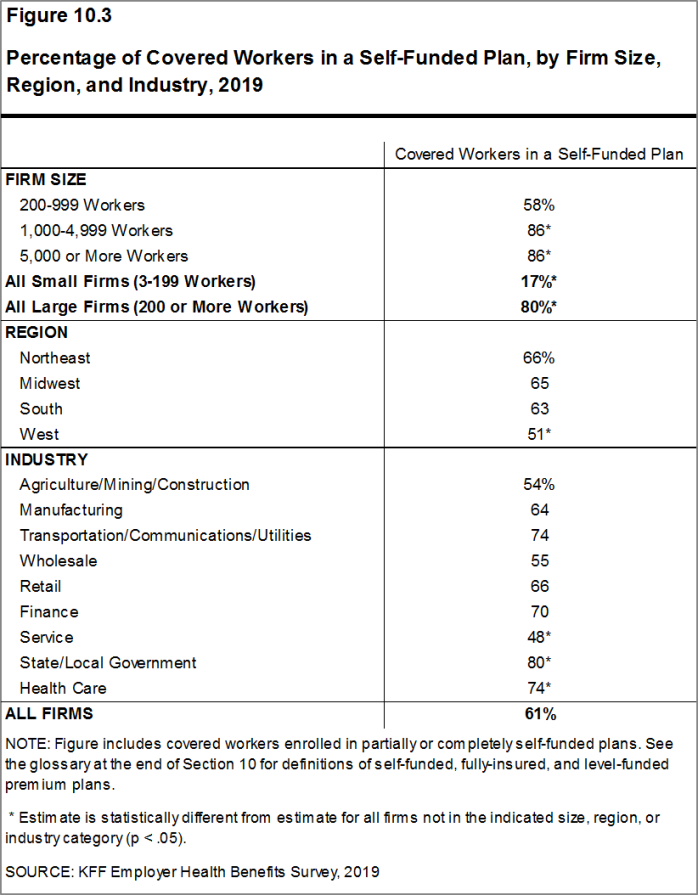
Figure 10.3: Percentage of Covered Workers in a Self-Funded Plan, by Firm Size, Region, and Industry, 2019
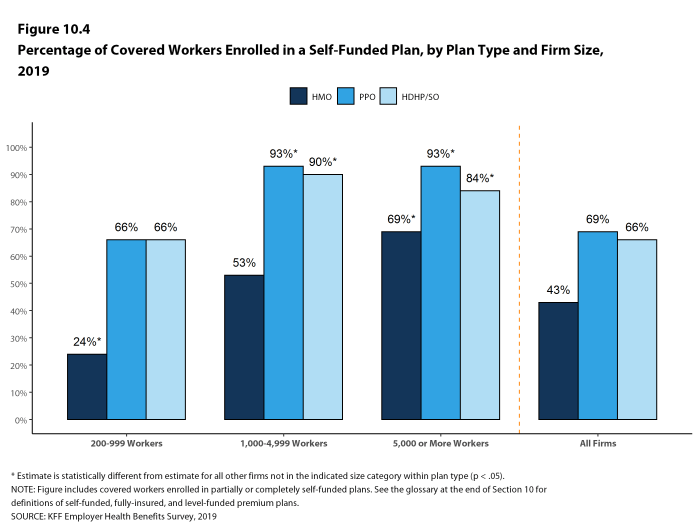
Figure 10.4: Percentage of Covered Workers Enrolled in a Self-Funded Plan, by Plan Type and Firm Size, 2019
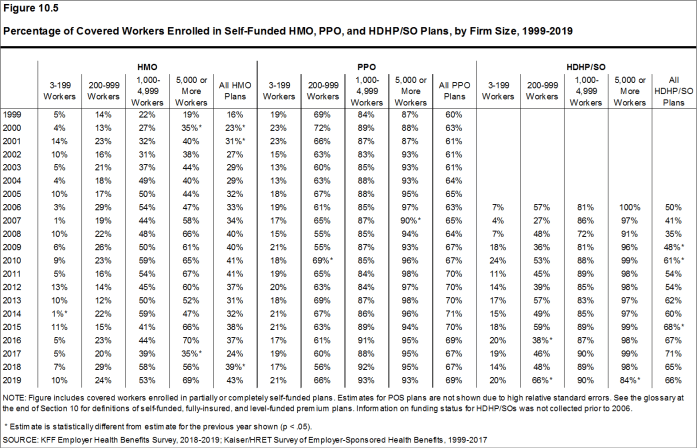
Figure 10.5: Percentage of Covered Workers Enrolled in Self-Funded HMO, PPO, and HDHP/SO Plans, by Firm Size, 1999-2019
LEVEL-FUNDED PLANS
In the past few years, insurers have begun offering health plans that provide a nominally self-funded option for small or mid-sized employers that incorporates stoploss insurance with relatively low attachment points. Often, the insurer calculates an expected monthly expense for the employer, which includes a share of the estimated annual cost for benefits, premium for the stoploss protection, and an administrative fee. The employer pays this “level premium” amount, with the potential for some reconciliation between the employer and the insurer at the end of the year, if claims differ significantly from the estimated amount. These policies are sold as self-funded plans, so they generally are not subject to state requirements for insured plans and, for those sold to employers with fewer than 50 employees, are not subject to the rating and benefit standards in the ACA for small firms.
Due to the complexity of the funding (and regulatory status) of these plans, and because employers often pay a monthly amount that resembles a premium, respondents may be confused as to whether or not their health plan is self-funded or insured. We asked employers with fewer than 200 workers whether they have a level-funded plan.
- Twenty-four percent of covered workers in small firms are in a plan that is either self-funded or level-funded [Figure 10.6].
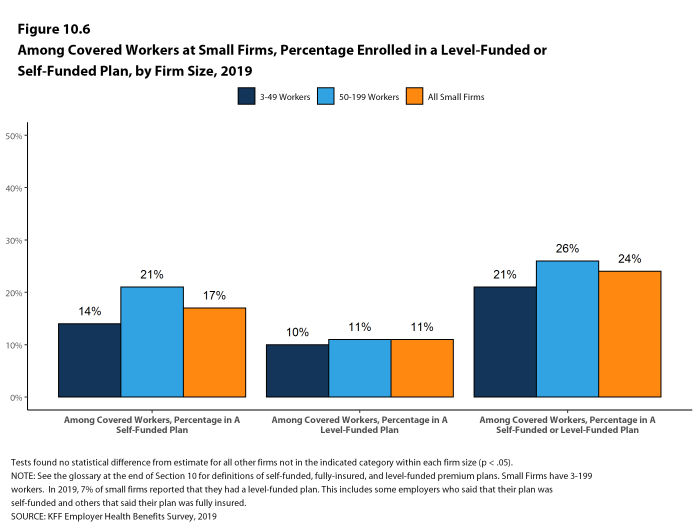
Figure 10.6: Among Covered Workers at Small Firms, Percentage Enrolled in a Level-Funded or Self-Funded Plan, by Firm Size, 2019
Section Eleven: Retiree Health Benefits
Retiree health benefits are an important consideration for older workers making decisions about their retirement. Retiree benefits can be a crucial source of coverage for people retiring before Medicare eligibility. For retirees with Medicare coverage, retiree health benefits can provide an important supplement to Medicare, helping them pay for cost sharing and benefits not otherwise covered by Medicare.
For 2019, we modified the question that we use to ask firms whether or not they provide retiree health benefits; particularly, we explicitly stated that firms that had terminated retiree health benefits but still has some retirees getting coverage, or that had current employees who will get retiree health coverage in the future, should answer ‘yes’ to the question. We made this clarification in response to a large decline in the 2018 survey in the prevalence of retiree coverage (from 25% in 2017 to 18% in 2018). In the 2018 survey, we expressed concern that the then current focus on public entities eliminating retiree benefits for future (not existing) retirees may be influencing the responses we were getting and said that we were going to clarify the survey question in future years.
This year’s survey finds that 28% of large firms offering health benefits offer retiree health benefits. While this percentage is similar to percentages of firms offering retirees prior to the 2018 decline, we are concerned that the change to the question compromises the comparability of the responses before and after the change. For this reason, estimates of retiree health benefits from the 2019 survey may not be comparable to those from prior surveys.
This survey asks retiree health benefits questions only of large firms (200 or more workers).
EMPLOYER RETIREE BENEFITS
- In 2019, 28% of large firms that offer health benefits offer retiree health benefits for at least some current workers or retirees [Figure 11.1]. See the Methods section for a discussion of changes to survey question on retiree health benefits for 2019 survey. Due to this change, we did not test if the 2018 and 2019 estimates were statistically different from each other.
- Retiree health benefits offer rates vary considerably by firm characteristics.
- Among large firms offering health benefits, the likelihood that a firm will offer retiree health benefits increases with firm size [Figure 11.2].
- The share of large firms offering retiree health benefits varies considerably by industry [Figure 11.2].
- Among large firms offering health benefits, private for-profit firms are less likely (13%) and public employers are more likely (65%) to offer retiree health benefits [Figure 11.3].
- Large firms offering health benefits with at least some union workers are more likely to offer retiree health benefits than large firms without any union workers (53% vs. 19%) [Figure 11.3].
- Large firms offering health benefits with a relatively large share of older workers (where at least 35% of the workers are age 50 or older) are more likely to offer retiree health benefits than large firms with a smaller share of older workers (36% vs. 21%) [Figure 11.3].
- Large firms offering health benefits with a relatively small share of younger workers (where fewer than 35% of the workers are age 26 or younger) are more likely to offer retiree health benefits than large firms with a larger share of younger workers (31% vs. 17%) [Figure 11.3].
- Large firms offering health benefits with a relatively large share of higher-wage workers (where at least 35% of workers earn $63,000 a year or more) are more likely to offer retiree health benefits than large firms with a smaller share of higher-wage workers (39% vs. 20%) [Figure 11.3].
- Large firms offering health benefits with a relatively small share of lower-wage workers (where at least 35% of workers earn $25,000 a year or less) are more likely to offer retiree health benefits than large firms with a larger share of lower-wage workers (30% vs. 12%) [Figure 11.3].
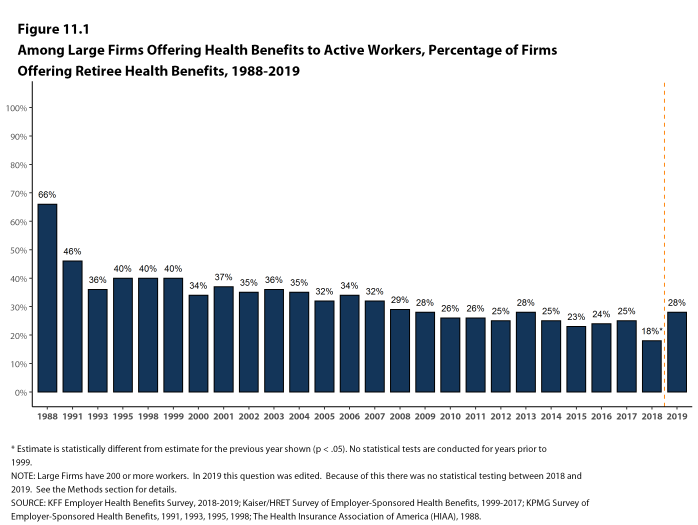
Figure 11.1: Among Large Firms Offering Health Benefits to Active Workers, Percentage of Firms Offering Retiree Health Benefits, 1988-2019
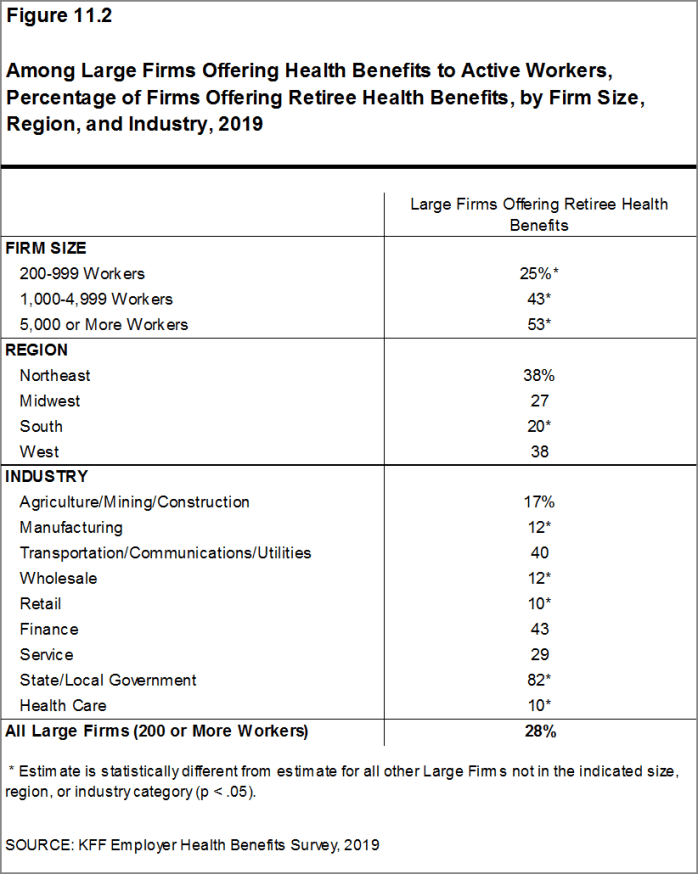
Figure 11.2: Among Large Firms Offering Health Benefits to Active Workers, Percentage of Firms Offering Retiree Health Benefits, by Firm Size, Region, and Industry, 2019
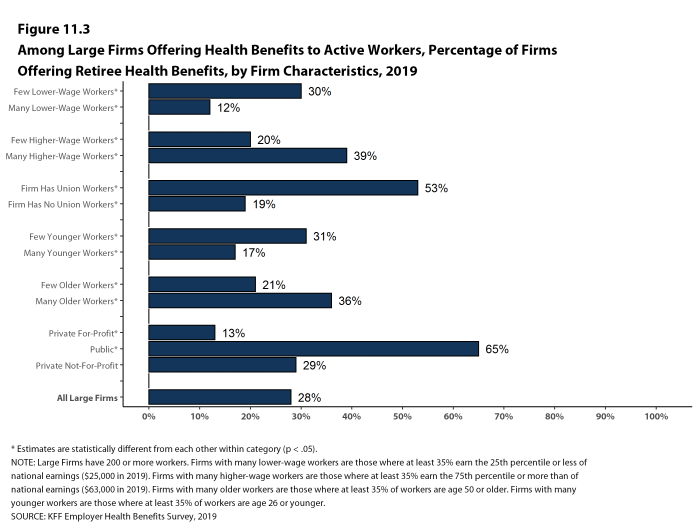
Figure 11.3: Among Large Firms Offering Health Benefits to Active Workers, Percentage of Firms Offering Retiree Health Benefits, by Firm Characteristics, 2019
EARLY RETIREES, MEDICARE-AGE RETIREES AND SPOUSES
- Among large firms offering retiree health benefits, a large share offer benefits to early retirees under the age of 65 (91%). A lower percentage (61%) of large firms offering retiree health benefits offer to Medicare-age retirees [Figure 11.4]. Among all large firms offering health benefits to current workers, 17% offer retiree health benefits to Medicare-age retirees.
- Among large firms offering retiree health benefits, 55% offer benefits to both early and Medicare-age retirees.
- Among large firms offering retiree benefits, a large share (89%) report offering health benefits to the spouses of retirees [Figure 11.7].
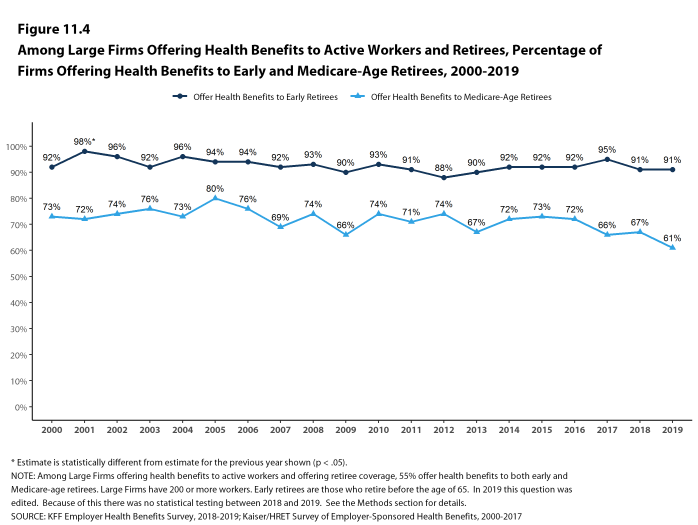
Figure 11.4: Among Large Firms Offering Health Benefits to Active Workers and Retirees, Percentage of Firms Offering Health Benefits to Early and Medicare-Age Retirees, 2000-2019
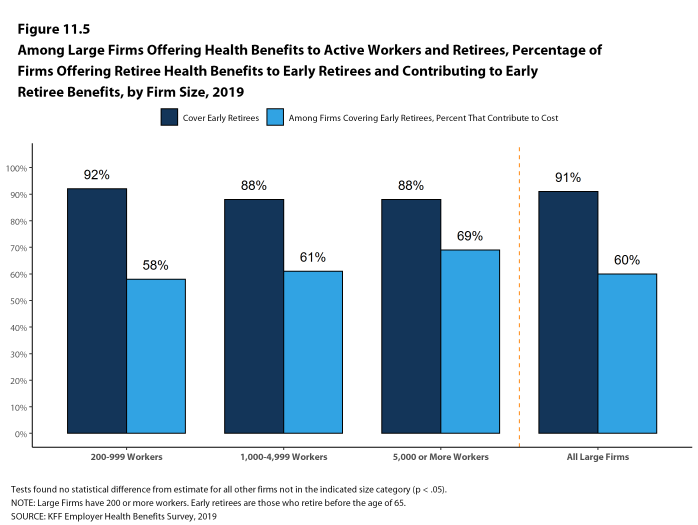
Figure 11.5: Among Large Firms Offering Health Benefits to Active Workers and Retirees, Percentage of Firms Offering Retiree Health Benefits to Early Retirees and Contributing to Early Retiree Benefits, by Firm Size, 2019
CONTRIBUTIONS TO COVERAGE
- Among large employers offering retiree health benefits to at least some early retirees, 60% say that they contribute to the cost for at least some early retirees [Figure 11.5].
- Among large employers offering retiree health benefits to at least some Medicare-age retirees, 67% say that they contribute to the cost for at least some Medicare-age retirees [Figure 11.6].
- Among large employers offering retiree health benefits to at least some Medicare-age retirees through a contract with a Medicare Advantage Plan, 88% say that they contribute to the cost of the coverage [Figure 11.9].
- Among large employers offering retiree health benefits to at least some spouses of retirees, 57% say that they contribute to the cost of the coverage for the spouse [Figure 11.7].
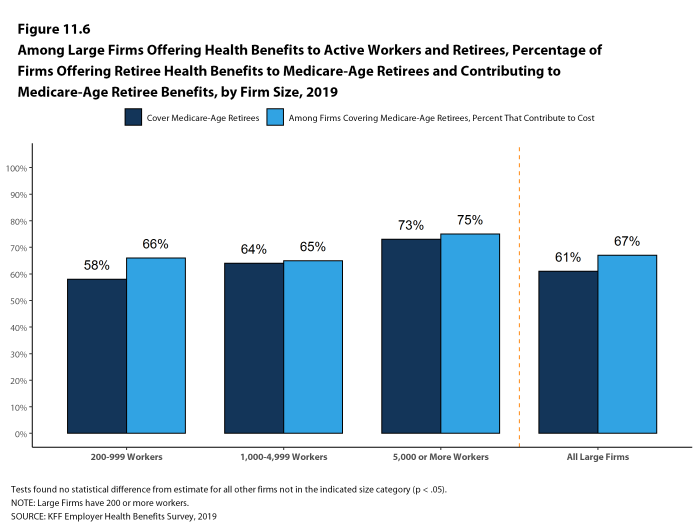
Figure 11.6: Among Large Firms Offering Health Benefits to Active Workers and Retirees, Percentage of Firms Offering Retiree Health Benefits to Medicare-Age Retirees and Contributing to Medicare-Age Retiree Benefits, by Firm Size, 2019
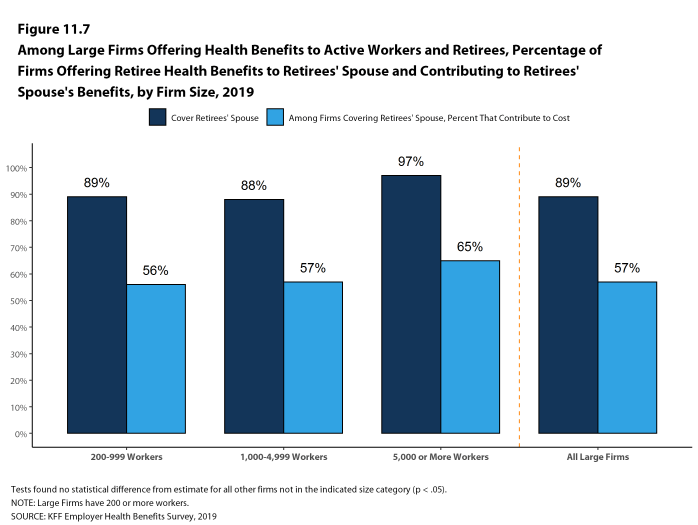
Figure 11.7: Among Large Firms Offering Health Benefits to Active Workers and Retirees, Percentage of Firms Offering Retiree Health Benefits to Retirees’ Spouse and Contributing to Retirees’ Spouse’s Benefits, by Firm Size, 2019
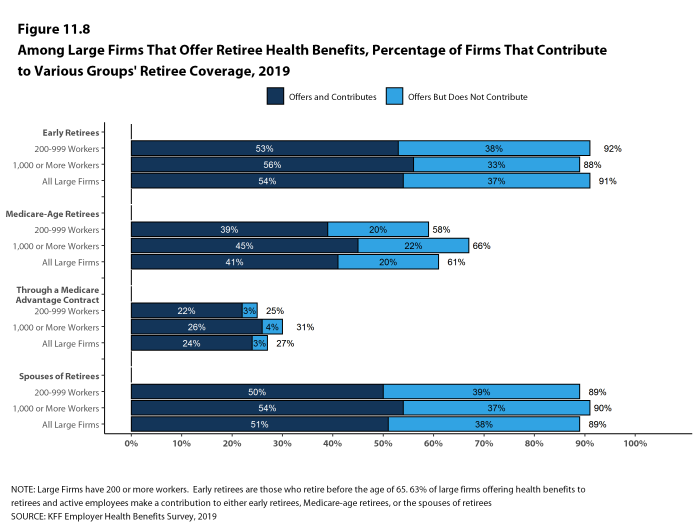
Figure 11.8: Among Large Firms That Offer Retiree Health Benefits, Percentage of Firms That Contribute to Various Groups’ Retiree Coverage, 2019
MEDICARE ADVANTAGE
- Forty-four percent of large employers offering retiree health benefits to Medicare-age retirees offer coverage to at least some Medicare-age retirees through a contract with a Medicare Advantage plan [Figure 11.9].
- Among large employers offering retiree health benefits to Medicare-age retirees that do not offer coverage through a Medicare Advantage plan, only 7% say that they are ‘very likely’ or ‘somewhat likely’ to do so in the next two years [Figure 11.10].
- Among large employers offering retiree health benefits to Medicare-age retirees through a contract with a Medicare Advantage plan, 53% provide retirees with the opportunity to choose a plan other than a Medicare Advantage plan for retiree health benefits [Figure 11.11].
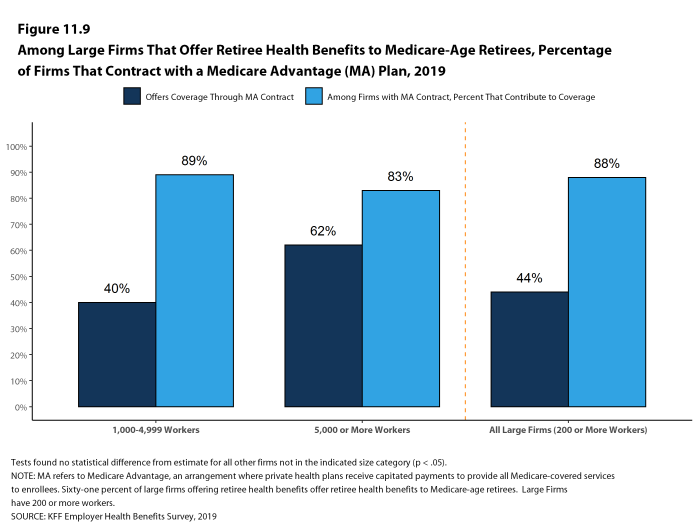
Figure 11.9: Among Large Firms That Offer Retiree Health Benefits to Medicare-Age Retirees, Percentage of Firms That Contract With a Medicare Advantage (MA) Plan, 2019
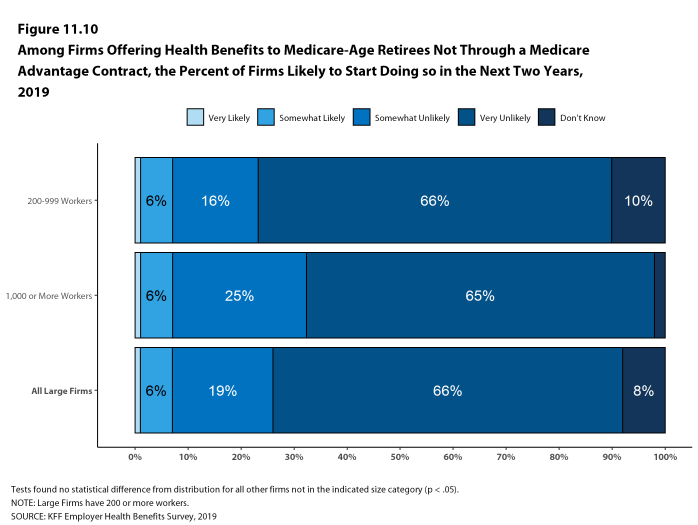
Figure 11.10: Among Firms Offering Health Benefits to Medicare-Age Retirees Not Through a Medicare Advantage Contract, the Percent of Firms Likely to Start Doing So in the Next Two Years, 2019
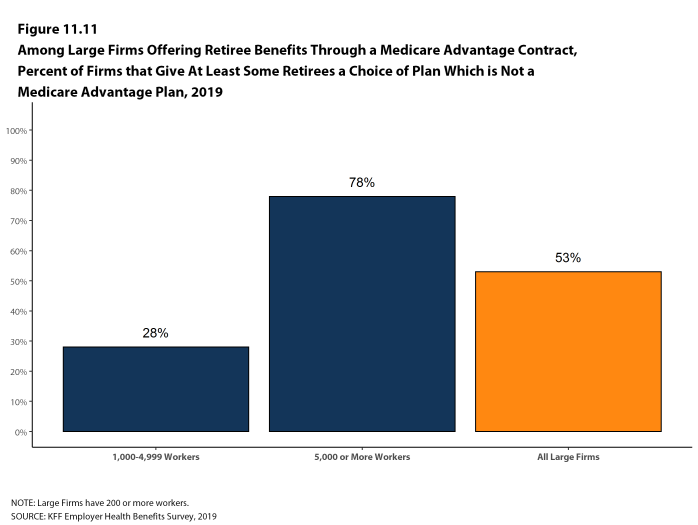
Figure 11.11: Among Large Firms Offering Retiree Benefits Through a Medicare Advantage Contract, Percent of Firms That Give at Least Some Retirees a Choice of Plan Which Is Not a Medicare Advantage Plan, 2019
BENEFIT ELIGIBILITY
- Among large firms offering retiree health benefits, 90% say that at least some current employees will be eligible for retiree health benefits after meeting any age and/or length of service requirements [Figure 11.12].
- Among large firms offering retiree health benefits, 73% say that new hires will be eligible for the firm’s retiree health benefits after meeting any age and/or length of service requirements [Figure 11.12].
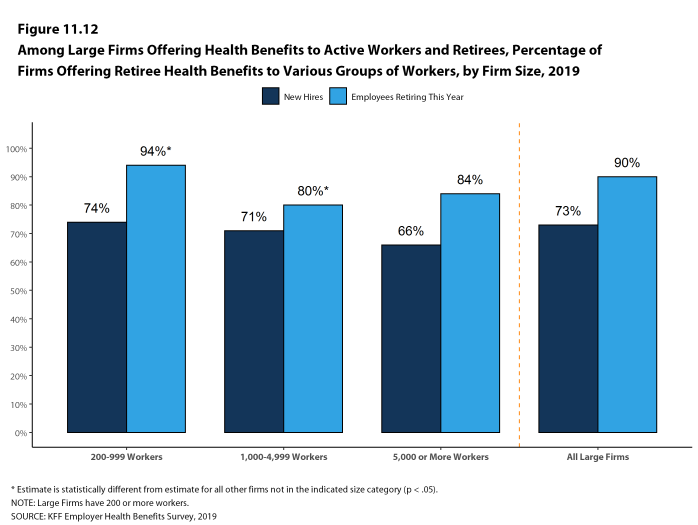
Figure 11.12: Among Large Firms Offering Health Benefits to Active Workers and Retirees, Percentage of Firms Offering Retiree Health Benefits to Various Groups of Workers, by Firm Size, 2019
COST REDUCTION STRATEGIES
- Among large firms offering retiree health benefits, 13% say the firm made a major change in retiree health benefits in the past year to cut costs or reduce its future liability [Figure 11.14].
- Thirty-four percent of large firms offering retiree health benefits say they anticipate that the firm will increase retiree premium contributions or cost-sharing for services in the next two years [Figure 11.13].
- Nine percent of large firms offering retiree health benefits say that the firm will eliminate retiree health benefits offered to at least some current employees or retirees in the next two years [Figure 11.13].
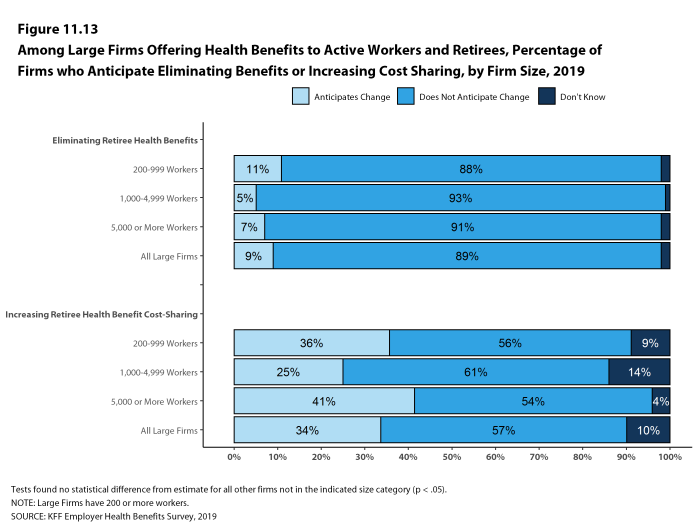
Figure 11.13: Among Large Firms Offering Health Benefits to Active Workers and Retirees, Percentage of Firms Who Anticipate Eliminating Benefits or Increasing Cost Sharing, by Firm Size, 2019
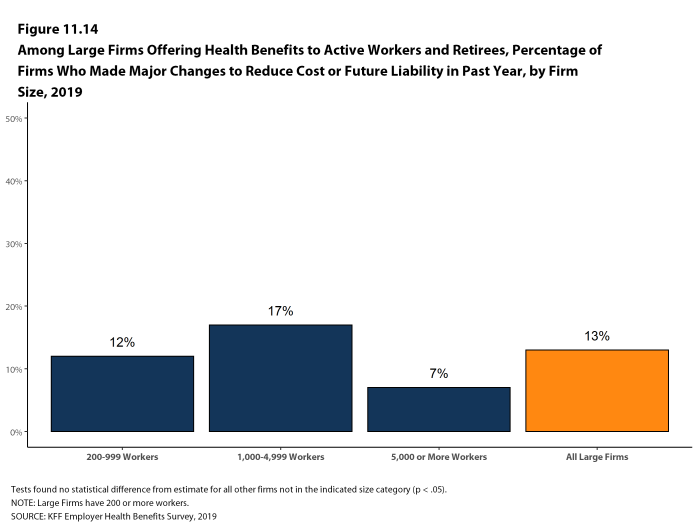
Figure 11.14: Among Large Firms Offering Health Benefits to Active Workers and Retirees, Percentage of Firms Who Made Major Changes to Reduce Cost or Future Liability in Past Year, by Firm Size, 2019
Section Twelve: Health And Wellness Programs
Firms continue to show considerable interest in programs that help workers identify health issues and manage chronic conditions. Many employers believe that improving the health of their workers and their family members can improve morale and productivity, and reduce health care costs.
In addition to offering wellness programs, a majority of large firms now offer health screening programs, including health risk assessments, which are questionnaires asking workers about lifestyle, stress, or physical health, and biometric screening, which we define as in-person health examinations conducted by a medical professional. Firms and insurers may use the health information collected during screenings to target wellness offerings or other health services to workers with certain conditions or behaviors that pose a risk to their health. Some firms have incentive programs that reward or penalize workers for different activities, including participating in wellness programs or completing health screenings.
Among large firms offering health benefits in 2019, 65% offer workers the opportunity to complete a health risk assessment, 52% offer workers the opportunity to complete a biometric screening, and 84% offer workers wellness programs, such as programs to help them stop smoking or lose weight, or programs that offer lifestyle and behavioral coaching. Substantial shares of these large firms provide incentives for workers to participate in or complete the programs.
Only firms offering health benefits were asked about their wellness and health promotion programs.
Employers, like other institutions, have had to deal with the opioid epidemic that has affected many workers and their family members. Employers have made changes to their health plans and employee assistance programs to address some of the impacts of the epidemic.
HEALTH RISK ASSESSMENTS
Many firms provide workers the opportunity to complete a health risk assessment to identify potential health issues. Health risk assessments generally include questions about medical history, health status, and lifestyle. At small firms, health risk assessments are typically administered by an insurer.
- Among firms offering health benefits, 41% of small firms and 65% of large firms provide workers the opportunity to complete a health risk assessment [Figure 12.1]. These percentages are similar to the corresponding percentages for 2018 (37% for small firms and 62% for large firms) [Figure 12.2]. Over the last decade the percent of large firms offering workers the opportunity to complete a health risk assessment has increased from 52% to 65%.
- Some firms offer incentives to encourage workers to complete a health risk assessment.
- Among firms that offer a health risk assessment, 18% of small firms and 50% offer workers an incentive to complete the assessment [Figure 12.3].
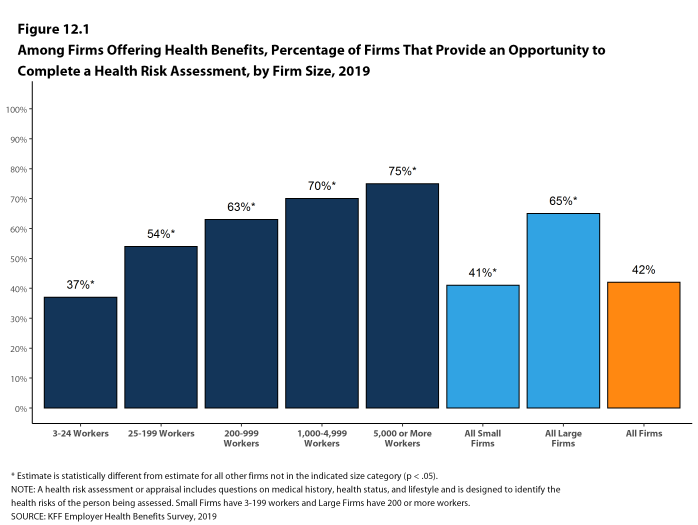
Figure 12.1: Among Firms Offering Health Benefits, Percentage of Firms That Provide an Opportunity to Complete a Health Risk Assessment, by Firm Size, 2019
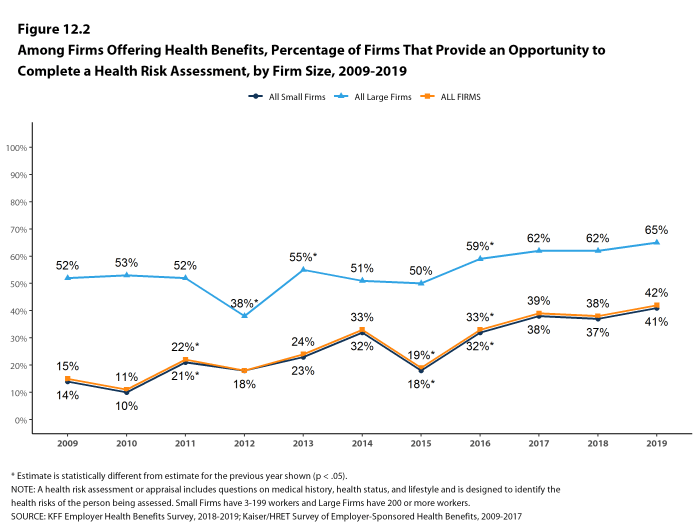
Figure 12.2: Among Firms Offering Health Benefits, Percentage of Firms That Provide an Opportunity to Complete a Health Risk Assessment, by Firm Size, 2009-2019
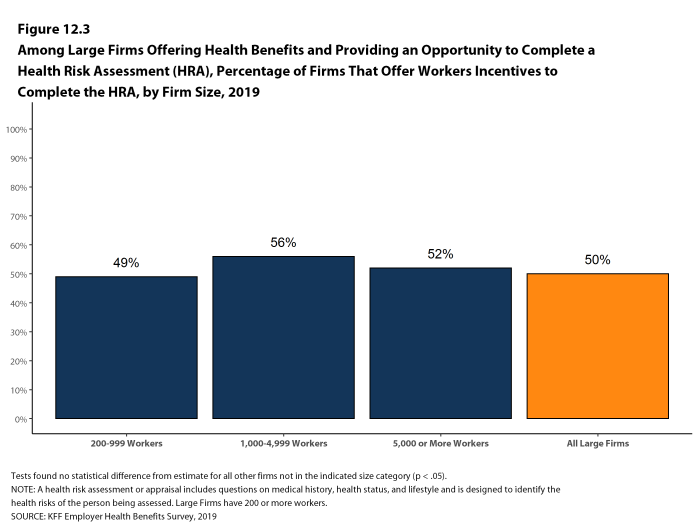
Figure 12.3: Among Large Firms Offering Health Benefits and Providing an Opportunity to Complete a Health Risk Assessment (HRA), Percentage of Firms That Offer Workers Incentives to Complete the HRA, by Firm Size, 2019
BIOMETRIC SCREENING
Biometric screening is a health examination that measures a person’s risk factors (such as cholesterol, blood pressure, and body mass index (BMI) for certain medical issues. A biometric outcome involves assessing whether the person meets specified health targets related to certain risk factors, such as meeting a target BMI or cholesterol level. As defined by this survey, goals related to smoking are not included in the biometric screening questions.
- Among firms offering health benefits, 26% of small firms and 52% of large firms provide workers the opportunity to complete a biometric screening [Figure 12.4]. These percentages are similar to 2018 (21% and 50%) [Figure 12.5].
- Some firms offer incentives to encourage workers to complete the biometric screening.
- Among firms with biometric screening programs, 29% of small firms and 58% of large firms offer workers an incentive to complete the screening [Figure 12.6]. Some firms report offering more than one type of incentive.
- In addition to incentives for completing a biometric screening, some firms offer workers incentives to meet biometric outcomes. Among large firms with biometric screening programs, 14% reward or penalize workers based on achieving specified biometric outcomes (such as meeting a target BMI) [Figure 12.6].
- The size of the incentives firms offer for meeting biometric outcomes varies considerably. Among large firms offering a reward or penalty for meeting biometric outcomes, the maximum reward is valued at $150 or less for 17% of firms and more than $1,000 for 11% of firms [Figure 12.7]. Thirty-one percent of these firms combine the reward with incentives for other activities. This may include employers who ask employees to complete several health screening, disease management, wellness/health promotion activities in order to qualify for incentives.
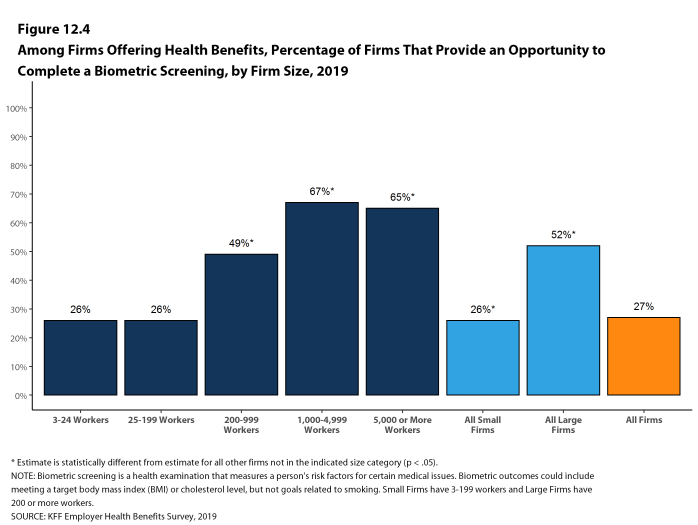
Figure 12.4: Among Firms Offering Health Benefits, Percentage of Firms That Provide an Opportunity to Complete a Biometric Screening, by Firm Size, 2019
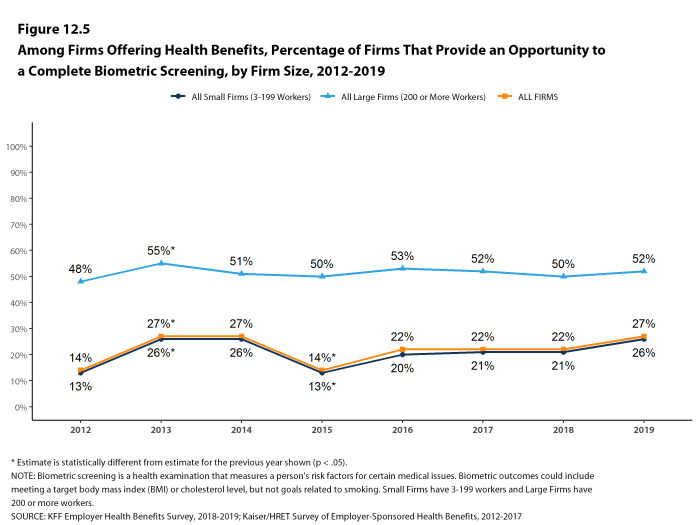
Figure 12.5: Among Firms Offering Health Benefits, Percentage of Firms That Provide an Opportunity to a Complete Biometric Screening, by Firm Size, 2012-2019
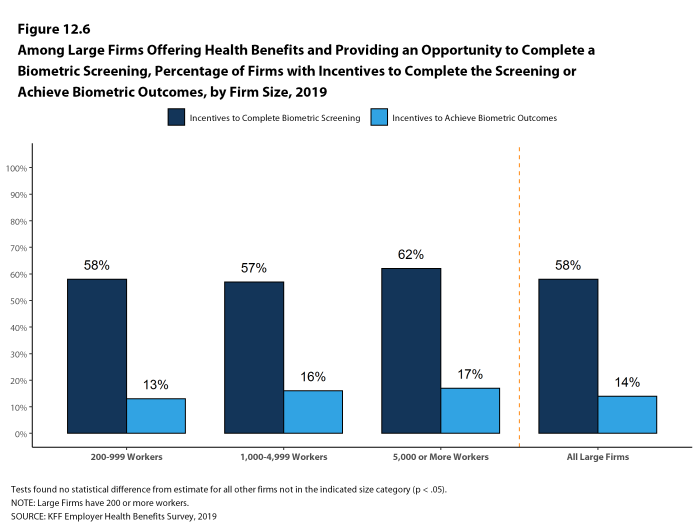
Figure 12.6: Among Large Firms Offering Health Benefits and Providing an Opportunity to Complete a Biometric Screening, Percentage of Firms With Incentives to Complete the Screening or Achieve Biometric Outcomes, by Firm Size, 2019
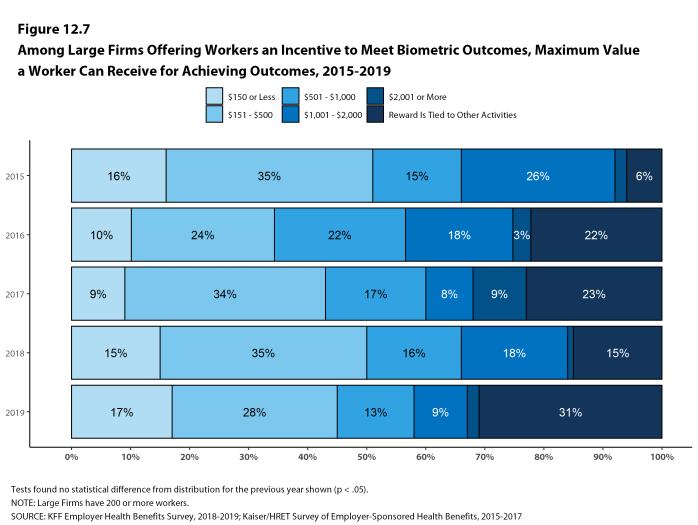
Figure 12.7: Among Large Firms Offering Workers an Incentive to Meet Biometric Outcomes, Maximum Value a Worker Can Receive for Achieving Outcomes, 2015-2019
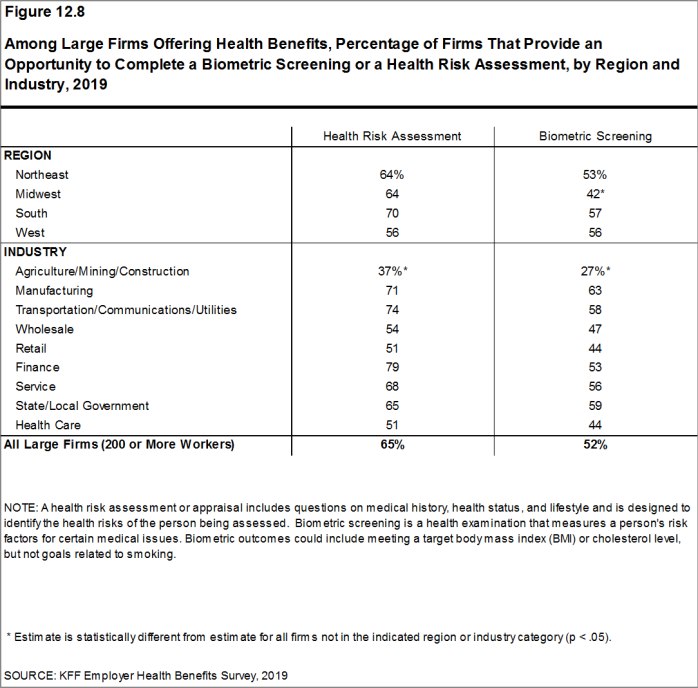
Figure 12.8: Among Large Firms Offering Health Benefits, Percentage of Firms That Provide an Opportunity to Complete a Biometric Screening or a Health Risk Assessment, by Region and Industry, 2019
HEALTH SCREENING PROGRAMS
Among firms offering health benefits, 48% of small firms and 72% of large firms offer workers a health risk assessment, biometric screening or both screening programs.
- Thirty-nine percent of large firms offering health benefits have an incentive for workers to complete a biometric screening or health risk assessment [Figure 12.9].
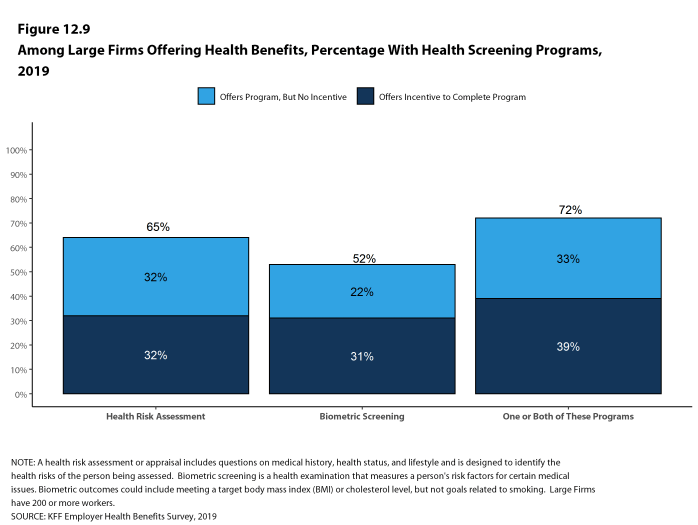
Figure 12.9: Among Large Firms Offering Health Benefits, Percentage With Health Screening Programs, 2019
WEARABLE TECHNOLOGY
Some employers and health plans incorporate information collected from mobile phone applications of wearable devices, such as Fitbits or Apple Watches into their health promotion programs.
- Among all firms offering health benefits, 11% collect information from workers’ mobile apps or wearable devices, such as a Fitbit or Apple Watch, as part of their wellness or health promotion program, similar to the percentage last year [Figure 12.10] and [Figure 12.11].
- Firms with 1,000 to 4,999 and firms with 5,000 or more employees are more likely than other firms to collect information from workers’ mobile apps or wearable devices [Figure 12.10].
- Five percent of employers offering health benefits, including 18% of employers with 5,000 or more employees, provide employees with wearable technologies such as a Fitbit or Apple Watch as part of a health improvement program [Figure 12.10].
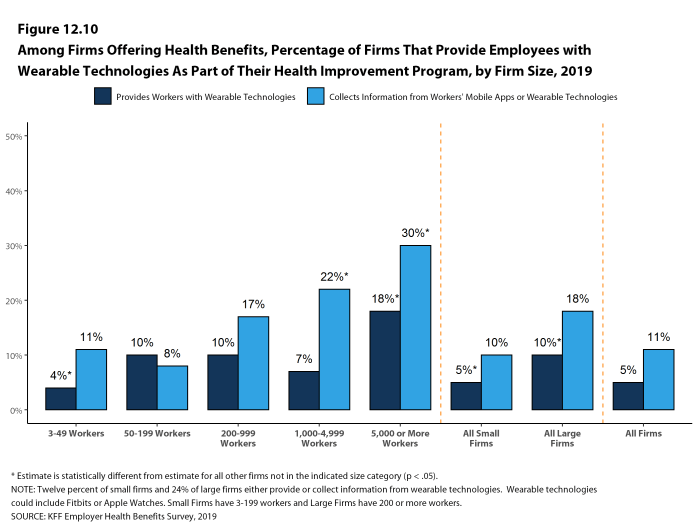
Figure 12.10: Among Firms Offering Health Benefits, Percentage of Firms That Provide Employees With Wearable Technologies As Part of Their Health Improvement Program, by Firm Size, 2019
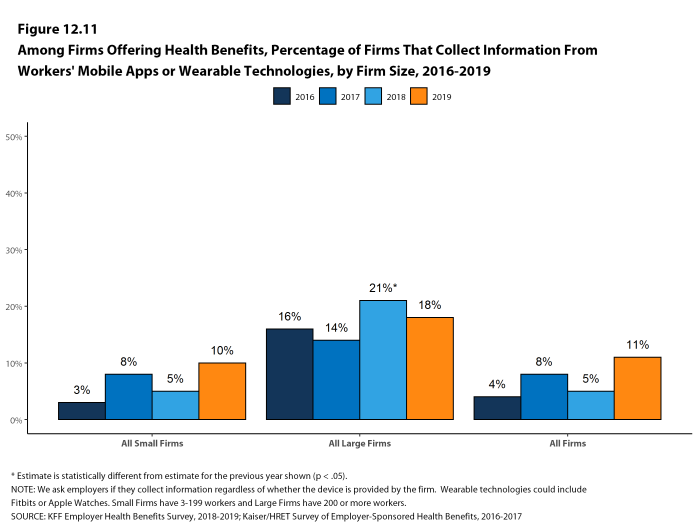
Figure 12.11: Among Firms Offering Health Benefits, Percentage of Firms That Collect Information From Workers’ Mobile Apps or Wearable Technologies, by Firm Size, 2016-2019
WELLNESS AND HEALTH PROMOTION PROGRAMS
Large shares of employers continue to offer educational and other programs to help workers engage in healthy lifestyles and reduce health risks. Wellness and health promotion programs may include exercise programs, health education classes, health coaching, and stress-management counseling. These programs may be offered directly by the firm, an insurer, or a third-party contractor.
- Among firms offering health benefits, 36% of small firms and 72% of large firms offer programs to help workers stop smoking or using tobacco, 31% of small firms and 60% of large firms offer programs to help workers lose weight, and 39% of small firms and 71% of large firms offer some other lifestyle or behavioral coaching program. Overall, 50% of small firms and 84% of large firms offering health benefits offer at least one of these three programs [Figure 12.12] and [Figure 12.13].
- Forty-one percent of large firms offering one of these wellness or health promotion programs offer an incentive to encourage workers to participate in or complete the programs [Figure 12.15]
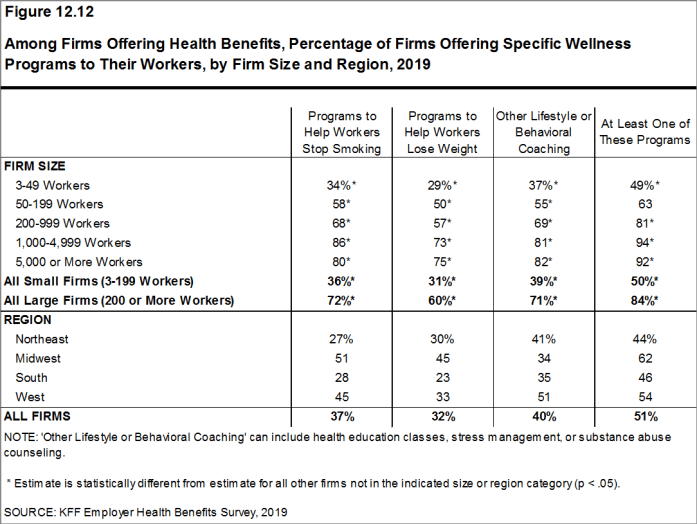
Figure 12.12: Among Firms Offering Health Benefits, Percentage of Firms Offering Specific Wellness Programs to Their Workers, by Firm Size and Region, 2019
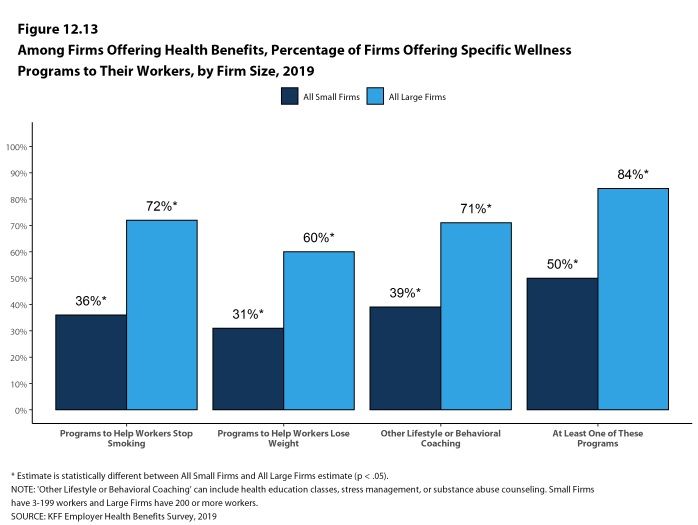
Figure 12.13: Among Firms Offering Health Benefits, Percentage of Firms Offering Specific Wellness Programs to Their Workers, by Firm Size, 2019
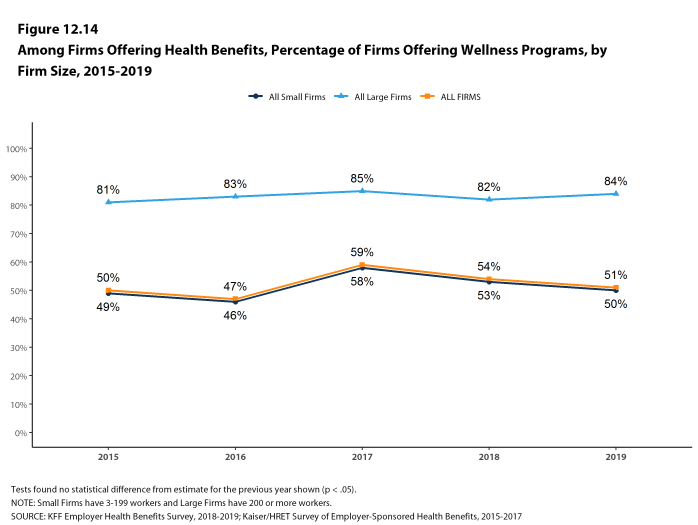
Figure 12.14: Among Firms Offering Health Benefits, Percentage of Firms Offering Wellness Programs, by Firm Size, 2015-2019
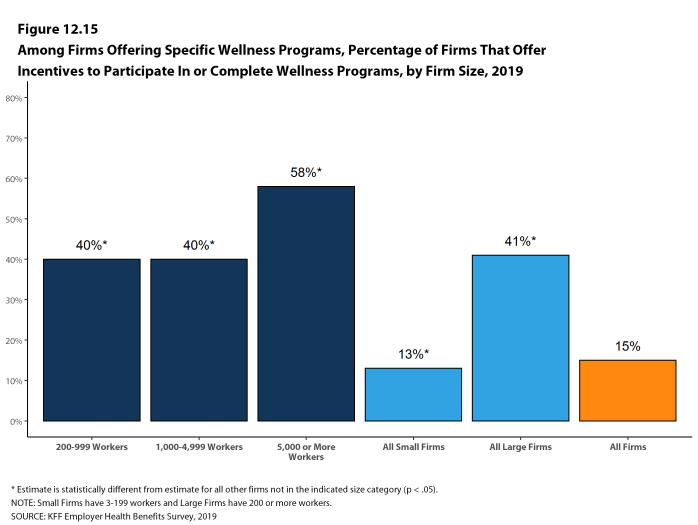
Figure 12.15: Among Firms Offering Specific Wellness Programs, Percentage of Firms That Offer Incentives to Participate in or Complete Wellness Programs, by Firm Size, 2019
INCENTIVES FOR WELLNESS AND HEALTH SCREENING PROGRAMS
Firms with incentives for health risk assessments, biometric screenings, or wellness or health promotion programs were asked to report the maximum reward or penalty a worker could earn for all of the firm’s health promotion activities combined. Some firms do not offer incentives for individual activities, but offer rewards to workers who complete a variety of activities.28 Among large firms offering incentives for any of these programs, the maximum value for all wellness-related incentives is $150 or less in 16% of firms and more than $1,000 in 20% of firms [Figure 12.16].
- This year we asked large firms with an incentive to participate in a health promotion or health screening program, how effective they believed these incentives were at increasing employee participation. 39% believed incentives were ‘very effective’ and 53% said ‘somewhat effective’. [Figure 12.16].
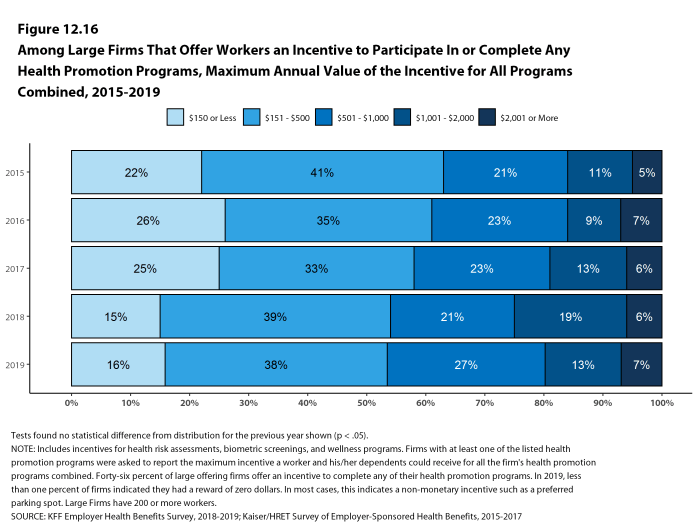
Figure 12.16: Among Large Firms That Offer Workers an Incentive to Participate in or Complete Any Health Promotion Programs, Maximum Annual Value of the Incentive for All Programs Combined, 2015-2019
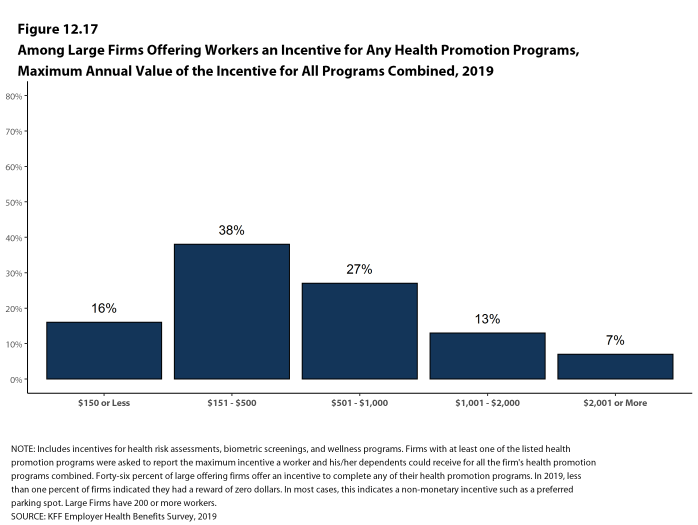
Figure 12.17: Among Large Firms Offering Workers an Incentive for Any Health Promotion Programs, Maximum Annual Value of the Incentive for All Programs Combined, 2019
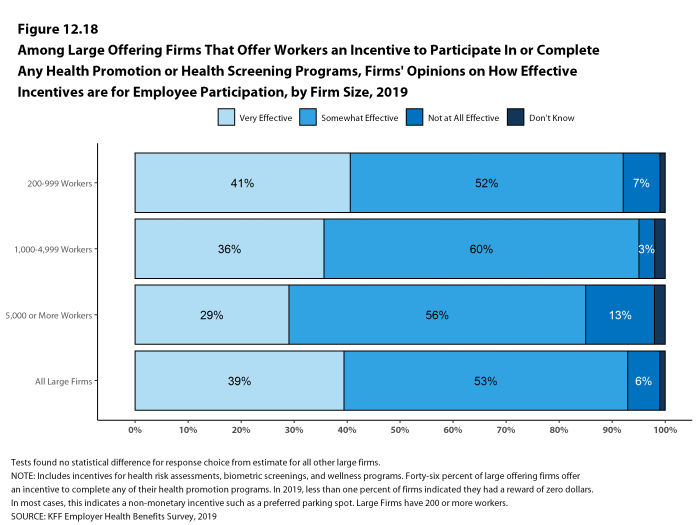
Figure 12.18: Among Large Offering Firms That Offer Workers an Incentive to Participate in or Complete Any Health Promotion or Health Screening Programs, Firms’ Opinions On How Effective Incentives Are for Employee Participation, by Firm Size, 2019
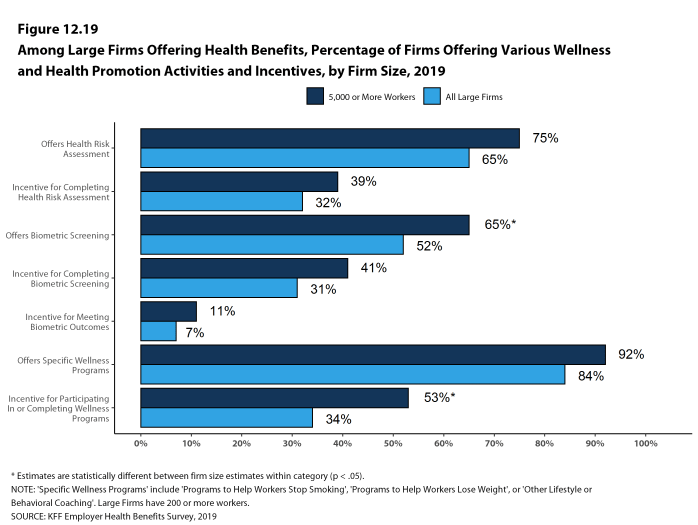
Figure 12.19: Among Large Firms Offering Health Benefits, Percentage of Firms Offering Various Wellness and Health Promotion Activities and Incentives, by Firm Size, 2019
DISEASE MANAGEMENT
Disease management programs aim to improve health and reduce costs for enrollees with chronic illnesses by educating them about their disease and suggesting treatment options. These programs can help enrollees with conditions such as diabetes, asthma, hypertension, and high cholesterol.
- Among firms that offer health benefits, 28% of small firms and 68% of large firms offer disease management programs [Figure 12.20].
- The likelihood that firms offering health benefits offer disease management programs increases with firm size [Figure 12.20].
- Among large firms with a disease management program, 13% offer incentives or penalties for workers to participate in or complete the programs. This percentage is highest among firms with 5,000 or more workers (21%) [Figure 12.22].
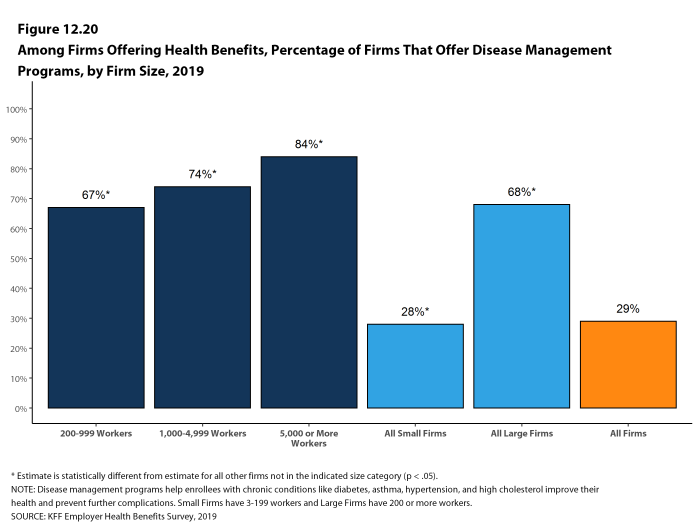
Figure 12.20: Among Firms Offering Health Benefits, Percentage of Firms That Offer Disease Management Programs, by Firm Size, 2019
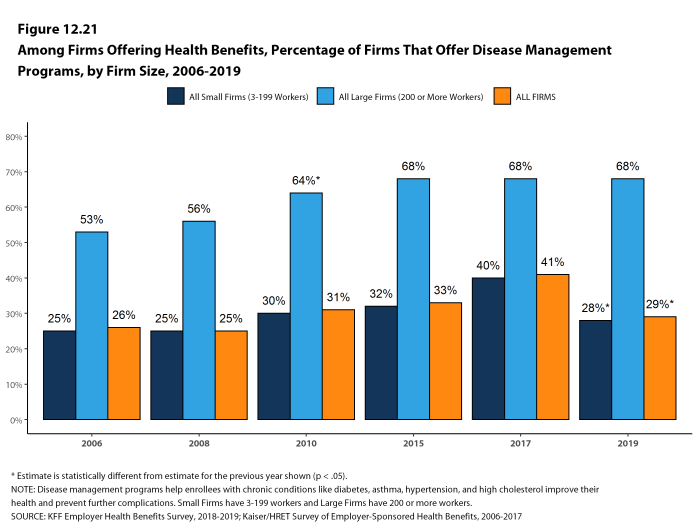
Figure 12.21: Among Firms Offering Health Benefits, Percentage of Firms That Offer Disease Management Programs, by Firm Size, 2006-2019
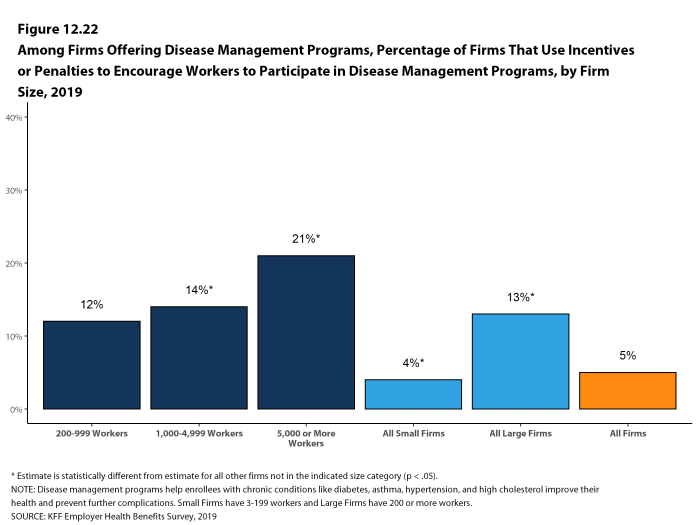
Figure 12.22: Among Firms Offering Disease Management Programs, Percentage of Firms That Use Incentives or Penalties to Encourage Workers to Participate in Disease Management Programs, by Firm Size, 2019
OPIOID CRISIS
The opioid epidemic has challenged employers and their workers in a number of ways. Over prescribing and insufficient follow-up with those prescribed pain medications helped fuel the increase in addiction. Large employers offering health benefits were asked about specific actions that they have made in the past five years in response to the opioid epidemic.
- Forty percent of large employers initiated or revised an employee assistance program, 24% modified their health plans to incorporate utilization management or step therapy for opioid use, 38% provided additional health information to employees, 8% require enrollees with high opioid use to obtain prescriptions from only one provider, 21% asked their insurer or PBM to increase monitoring of opioid use, and 2% increased the number of substance abuse providers in their networks [Figure 12.23].
- Large employers were asked about how much the opioid epidemic had affected the productivity of their workforce. Most say that the epidemic had little impact (37%) or no impact (39%) on productivity [Figure 12.24].
- Employers with 200 to 999 employees are more likely than larger employers to say the epidemic had no impact on productivity (44%) [Figure 12.24].
- Employers with 5,000 or more employees were more likely to say that they did not know (33%), while employers with 200 to 999 workers were less likely to say they did not know (14%) [Figure 12.24].
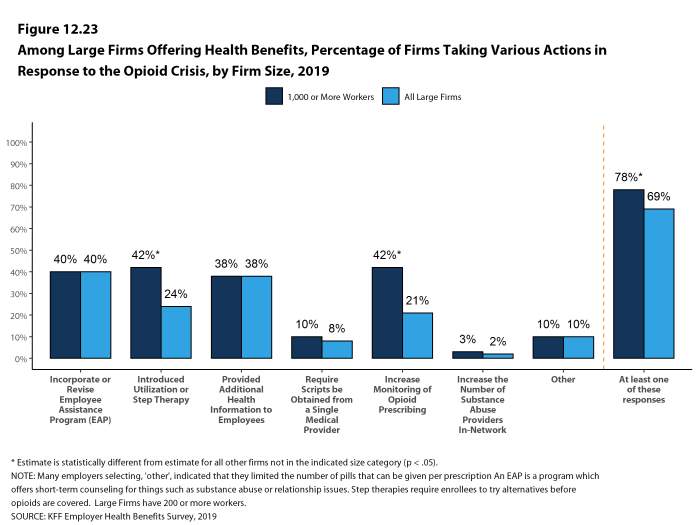
Figure 12.23: Among Large Firms Offering Health Benefits, Percentage of Firms Taking Various Actions in Response to the Opioid Crisis, by Firm Size, 2019
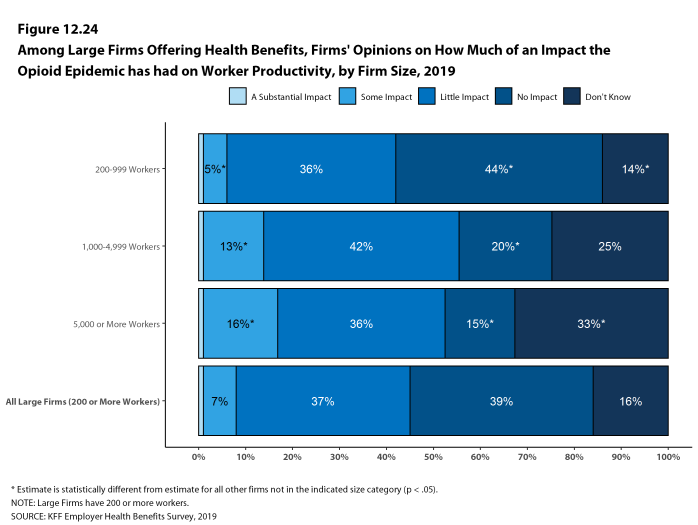
Figure 12.24: Among Large Firms Offering Health Benefits, Firms’ Opinions On How Much of an Impact the Opioid Epidemic Has Had On Worker Productivity, by Firm Size, 2019
- In 2019, less than one percent of firms indicated that they had an incentive for completing health risk assessments, biometric screenings, or wellness or health promotion programs, but had a maximum incentive of zero dollars. These firms may have non-monetary incentives such as preferred parking spots or employee recognition programs.↩
Section Thirteen: Grandfathered Health Plans
The Affordable Care Act (ACA) exempts certain health plans that were in effect when the law was passed, referred to as grandfathered plans, from some standards in the law, including the requirement to cover preventive services without cost sharing, have an external appeals process, or comply with the new benefit and rating provisions in the small group market. In 2019, 22% of firms offering health benefits offer at least one grandfathered health plan, and 13% of covered workers are enrolled in a grandfathered plan.
As in years past, some firms had difficulty with the details of the term “grandfathering”, as described in the provisions of the ACA. We would note that smaller firms in particular appeared to have some confusion about whether or not they are grandfathered.
- Twenty-two percent of offering firms report having at least one grandfathered plan in 2019, similar to 20% in 2018 [Figure 13.1].
- Thirteen percent of covered workers are enrolled in a grandfathered health plan in 2019 [Figure 13.2].
- The percentage of covered workers enrolled in a grandfathered plan is similar to the percentage in 2018 (16%) [Figure 13.3].
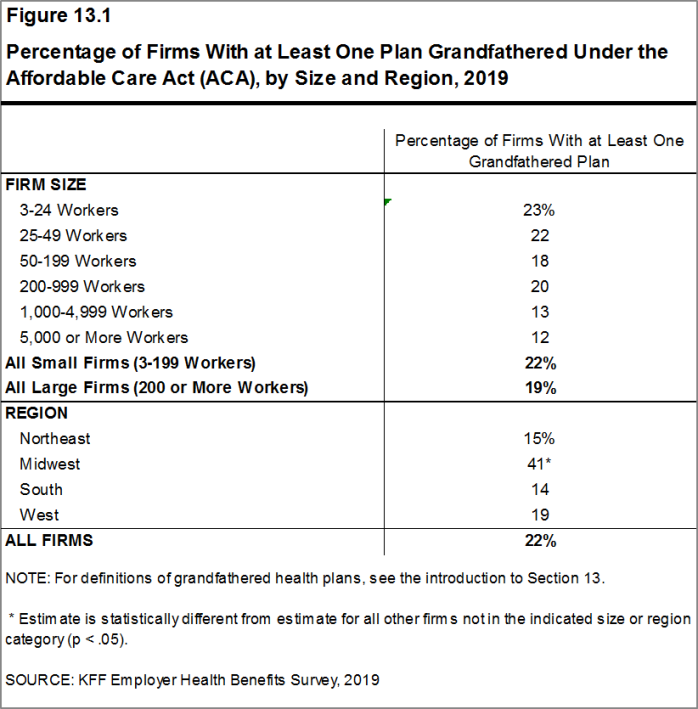
Figure 13.1: Percentage of Firms With at Least One Plan Grandfathered Under the Affordable Care Act (ACA), by Size and Region, 2019
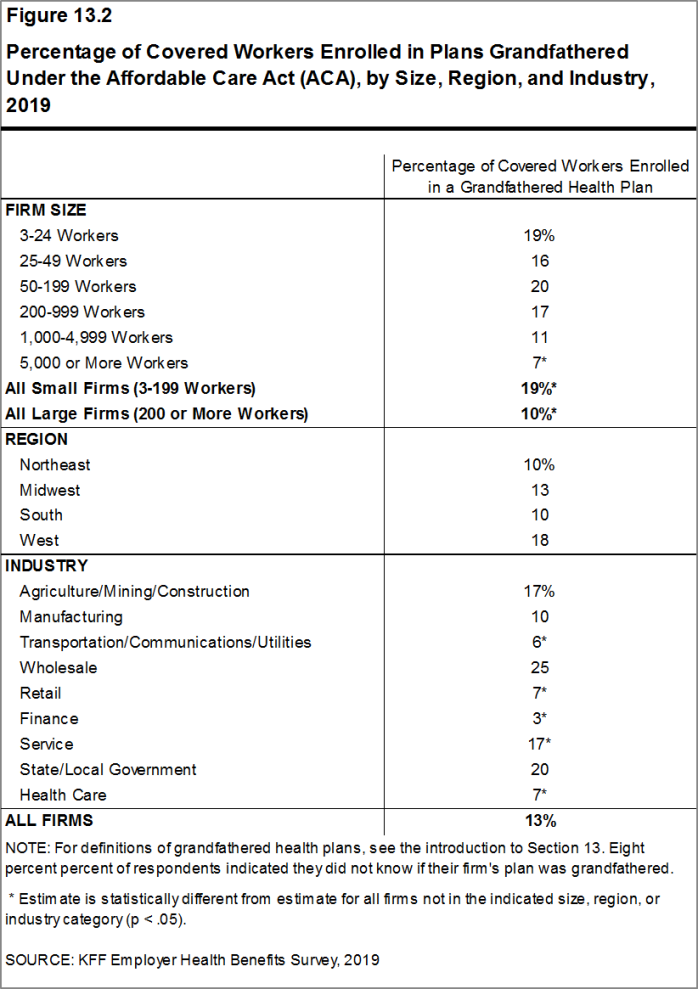
Figure 13.2: Percentage of Covered Workers Enrolled in Plans Grandfathered Under the Affordable Care Act (ACA), by Size, Region, and Industry, 2019
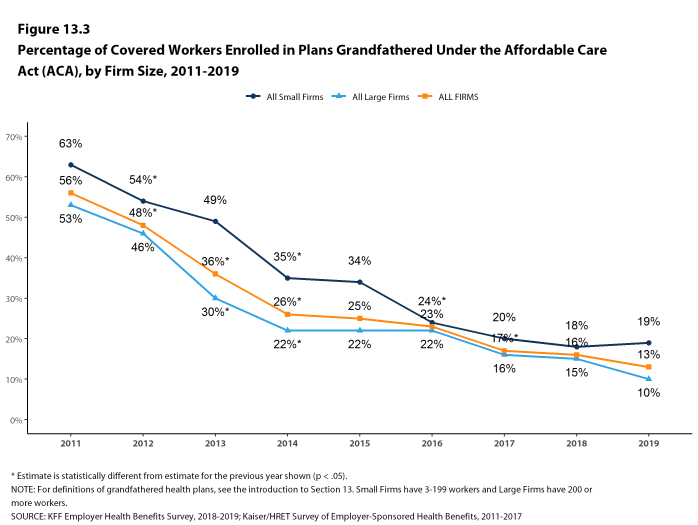
Figure 13.3: Percentage of Covered Workers Enrolled in Plans Grandfathered Under the Affordable Care Act (ACA), by Firm Size, 2011-2019
Section Fourteen: Employer Practices And Health Plan Networks
Employers are continuously reviewing and modifying their health plans to incorporate new options and to respond to changes in policy and the economy. We continue to monitor new options, such as telemedicine, and ask about changes in the policy environment, such as the elimination of the federal requirement that people have health insurance. This year we also asked additional questions about how employers view the provider network options available to them.
SHOPPING FOR HEALTH COVERAGE
Fifty-three percent of firms offering health benefits reported shopping for a new health plan or a new insurance carrier in the past year, similar to the percentage last year. Firms with 1,000-4,999 workers and firms with 5,000 or more workers were less likely to shop for coverage (32% and 25%, respectively) than firms in other size categories [Figure 14.1].
- Among firms that offer health benefits and who shopped for a new plan or carrier in the past year, 18% changed insurance carriers [Figure 14.2].
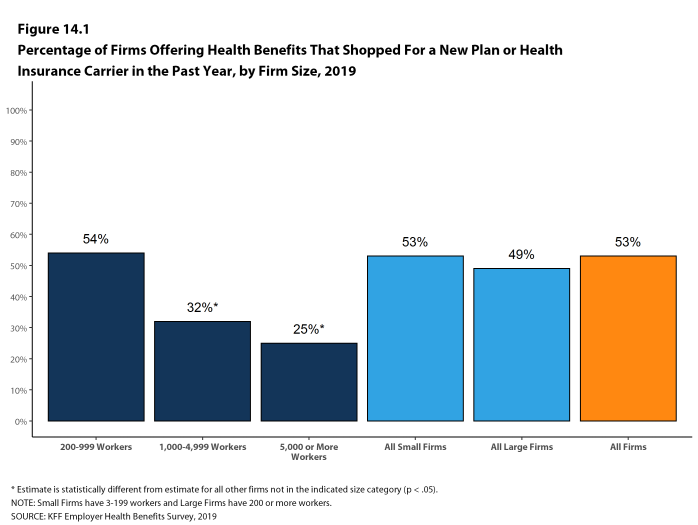
Figure 14.1: Percentage of Firms Offering Health Benefits That Shopped for a New Plan or Health Insurance Carrier in the Past Year, by Firm Size, 2019
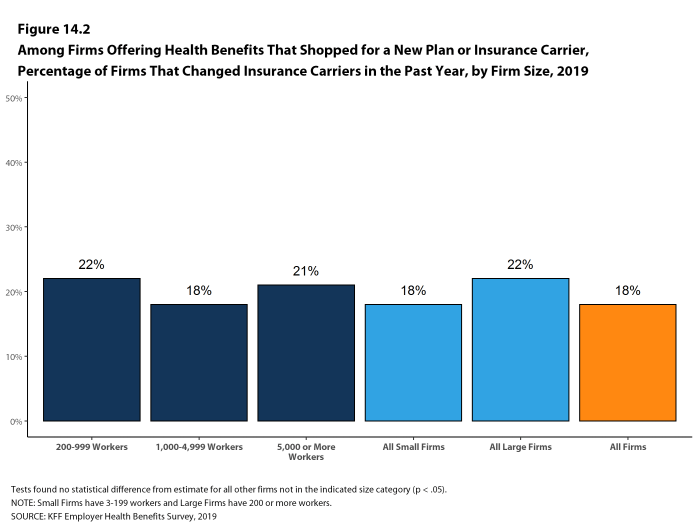
Figure 14.2: Among Firms Offering Health Benefits That Shopped for a New Plan or Insurance Carrier, Percentage of Firms That Changed Insurance Carriers in the Past Year, by Firm Size, 2019
ALTERNATIVE CARE SETTINGS: TELEMEDICINE, ON-SITE CLINICS, AND RETAIL CLINICS
Many firms provide coverage for health services delivered outside typical provider settings.
- Telemedicine is the delivery of health care services through telecommunications to a patient from a provider who is at a remote location, including video chat and remote monitoring. This would not include the mere exchange of information via email, exclusively web-based resources, or online information a plan may make available unless a health professional provides information specific to the enrollee’s condition. Sixty-nine percent of firms with 50 or more workers that offer health benefits cover the provision of some health care services through telemedicine in their largest health plan, similar to the percentage in 2018. [Figure 14.3]. Firms with 50-199 workers are less likely than larger firms to cover services provided through telemedicine.
- Among firms with 50 or more workers with plans that cover health services through telemedicine, 48% provide a financial incentive for workers to use telemedicine instead of visiting a traditional physician’s office in-person, similar to the percentage in 2018 [Figure 14.4].
- The percentage of large firms reporting that they cover services through telemedicine increased from 74% last year and 39% three years ago to 82% this year [Figure 14.5].
- Some employers provide health services to their employees though clinics that they establish or sponsor at or near their place of work. This year we expanded the survey to ask about ‘near-site’ health clinics, which are clinics conveniently located to a worksite that contract with an employer to serve it workers. On-site and near-site clinics may treat work-related injuries and may also provide other health services.
- Among firms with 50 or more employees that offer health benefits, 20% have an on-site or a near-site health clinic for their employees at one or more of their workplace locations. Firms with 5,000 or more workers are more likely than smaller firms to have one of these clinics [Figure 14.8].
- Among firms reporting that they have an on-site or near-site clinic at one of their workplace locations, 21% say they have an on-site clinic, 72% say that they have a near-site clinic, and 7% say that they have both types of clinics. Generally, smaller firms are more likely to say that they have near-site clinics and larger firms are more likely to say that they have on-site clinics [Figure 14.8].
- Eighty-two percent of firms with 10 or more employees that offer health benefits cover health care services received in retail clinics, such as those located in pharmacies, supermarkets and retail stores, in their largest health plan [Figure 14.6]. These clinics are often staffed by nurse practitioners or physician assistants and treat minor illnesses and provide preventive services.
- Among firms with 10 or more employees covering health services received in retail clinics in their largest plan, 16% provide a financial incentive for workers to use a retail health clinic instead of visiting a traditional physician’s office [Figure 14.6].
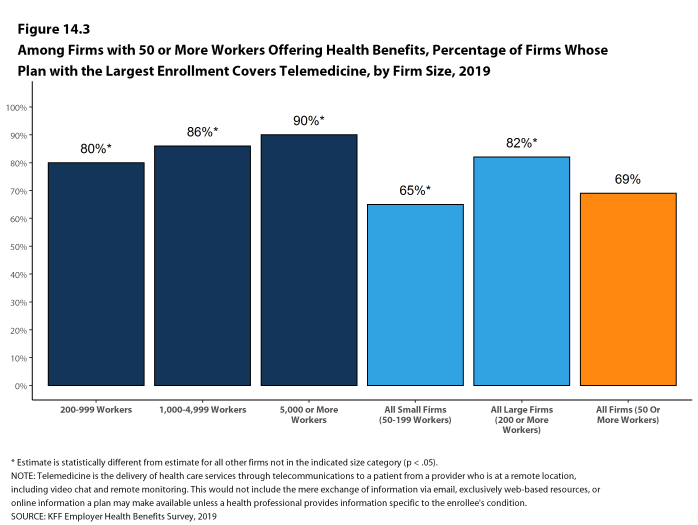
Figure 14.3: Among Firms With 50 or More Workers Offering Health Benefits, Percentage of Firms Whose Plan With the Largest Enrollment Covers Telemedicine, by Firm Size, 2019
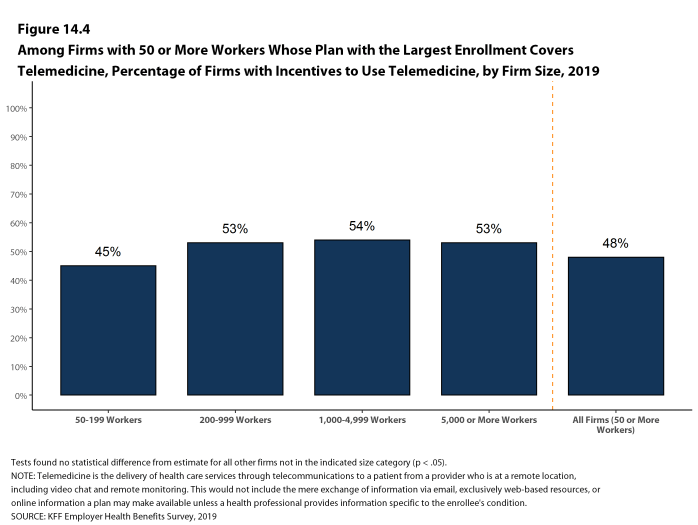
Figure 14.4: Among Firms With 50 or More Workers Whose Plan With the Largest Enrollment Covers Telemedicine, Percentage of Firms With Incentives to Use Telemedicine, by Firm Size, 2019
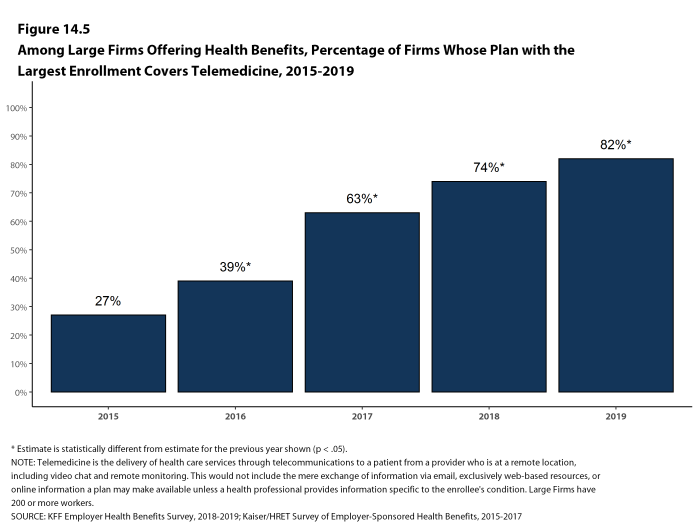
Figure 14.5: Among Large Firms Offering Health Benefits, Percentage of Firms Whose Plan With the Largest Enrollment Covers Telemedicine, 2015-2019
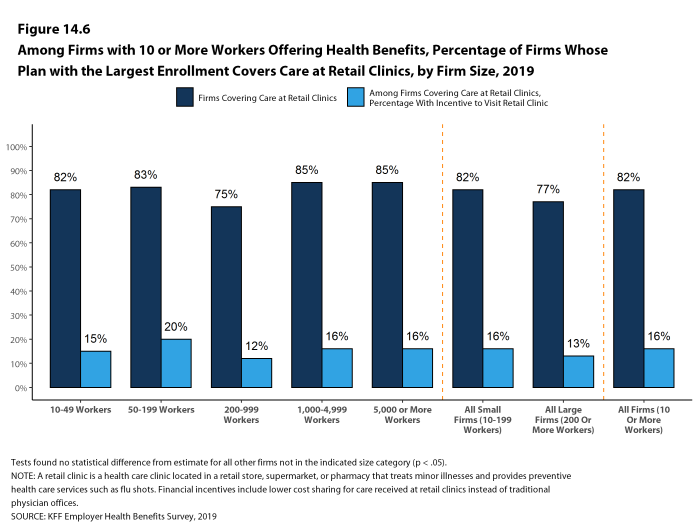
Figure 14.6: Among Firms With 10 or More Workers Offering Health Benefits, Percentage of Firms Whose Plan With the Largest Enrollment Covers Care at Retail Clinics, by Firm Size, 2019

Figure 14.7: Among Large Firms Offering Health Benefits, Percentage of Firms Whose Plan With the Largest Enrollment Covers Care at Retail Clinics and That Have a Financial Incentive for Workers to Visit Retail Clinics Instead of a Physician’s Office, 2010-2019
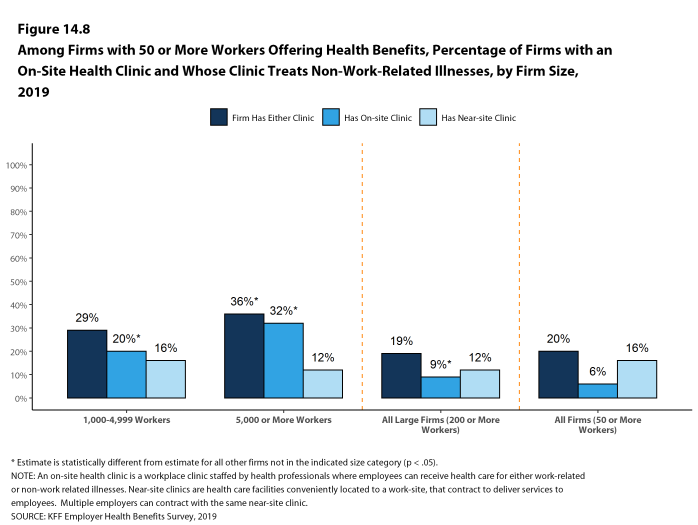
Figure 14.8: Among Firms With 50 or More Workers Offering Health Benefits, Percentage of Firms With an On-Site Health Clinic and Whose Clinic Treats Non-Work-Related Illnesses, by Firm Size, 2019
FIRM APPROACHES TO PLAN NETWORKS
Firms and health plans can structure their networks of providers and their cost sharing to encourage enrollees to use providers who are lower cost or who provide better care. Periodically we ask employers about network strategies, such as using tiered or narrow networks. For 2019, we added questions about additional network strategies and about employer satisfaction with the network options available to them.
- Employers overall report being quite satisfied with the choice of provider networks made available to them by their insurer or plan administrator.
- Among employers offering health benefits, 42% of firms report being ‘very satisfied’ and 42% report being ‘satisfied’ by the choice of provider networks available to them. Employers with 1,000-4,999 and with 5,000 or more workers are more likely to be ‘very satisfied’ with the available network choices [Figure 14.9].
- Employers are somewhat less satisfied with the cost of the provider networks available to them from their insurer or administrator. Among employers offering health benefits, only 11% of firms report being ‘very satisfied’ while 46% report being ‘satisfied’ with the cost of provider networks available to them. Large firms are more likely than small firms to be very satisfied with the cost of available provider networks, while small firms are more likely to be ‘dissatisfied’ or ‘very dissatisfied’ with the cost of the provider networks available to them [Figure 14.9].
- Employers offering health benefits were asked what the most important factor is when assessing the provider networks they will offer to employees: number and convenience of providers, cost of providers, quality of providers, or some other factor.
- Employers overall are fairly evenly divided across the first three factors, with 30% of employers identifying the number and convenience of providers as most important, 33% identifying the cost of providers as most important, and 36% identifying the quality providers as most important [Figure 14.10].
- Employers with 1,000-4,999 and with 5,000 or more workers are less likely to say that cost of providers is the most important factor they consider when assessing provider networks.
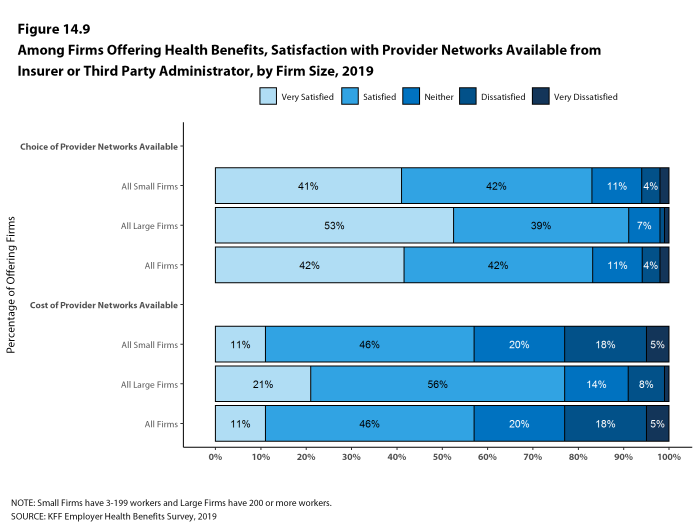
Figure 14.9: Among Firms Offering Health Benefits, Satisfaction With Provider Networks Available From Insurer or Third Party Administrator, by Firm Size, 2019
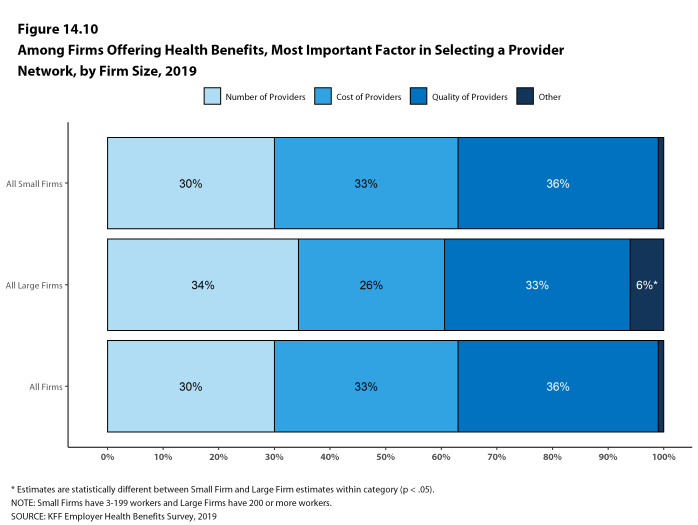
Figure 14.10: Among Firms Offering Health Benefits, Most Important Factor in Selecting a Provider Network, by Firm Size, 2019
TIERED NETWORKS
- Some employers offer health plans with provider networks that are divided into two or more groups or ‘tiers’. A tiered or high-performance network typically groups providers in the network based on the cost, quality and/or efficiency of the care they deliver. These networks generally use financial incentives, such as lower cost sharing, to encourage enrollees to use providers in the preferred groupings.
- Fourteen percent of firms with 50 or more workers that offer health benefits include a high-performance or tiered provider network in their health plan with the largest enrollment, similar to the percentage last year [Figure 14.11] and [Figure 14.12].
- Firms with 1,000-4,999 and with 5,000 or more workers are more likely to include a high-performance or tiered provider network in their health plan with the largest enrollment than smaller firms [Figure 14.11].
- Seventy-three percent of large firms offering a tiered or high-performance network say that the network tiers are based on both quality and cost/efficiency of care, 9% say the tiers are based on quality of care, 13% say the tiers are based on the cost/efficiency of care, and 4% say the tiers are based on some other factor [Figure 14.13].
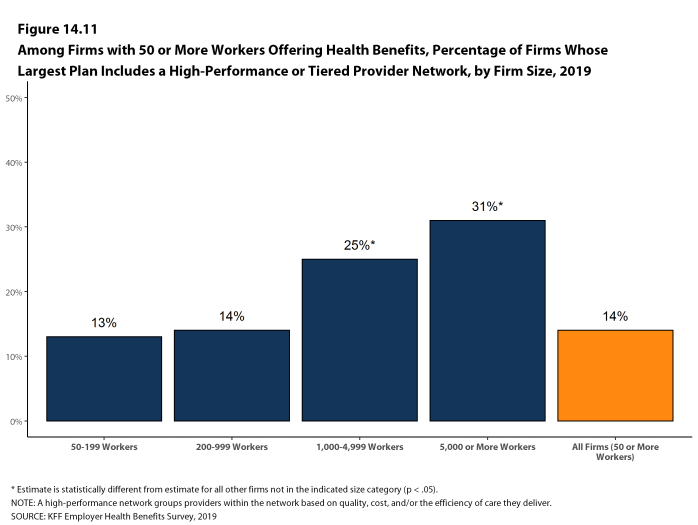
Figure 14.11: Among Firms With 50 or More Workers Offering Health Benefits, Percentage of Firms Whose Largest Plan Includes a High-Performance or Tiered Provider Network, by Firm Size, 2019
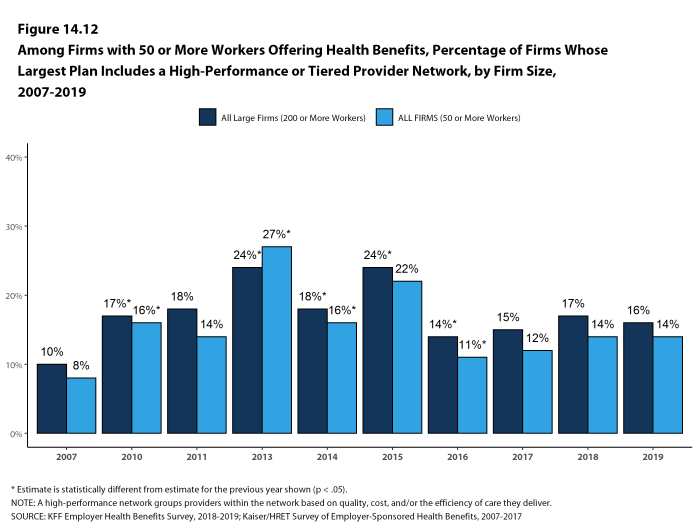
Figure 14.12: Among Firms With 50 or More Workers Offering Health Benefits, Percentage of Firms Whose Largest Plan Includes a High-Performance or Tiered Provider Network, by Firm Size, 2007-2019
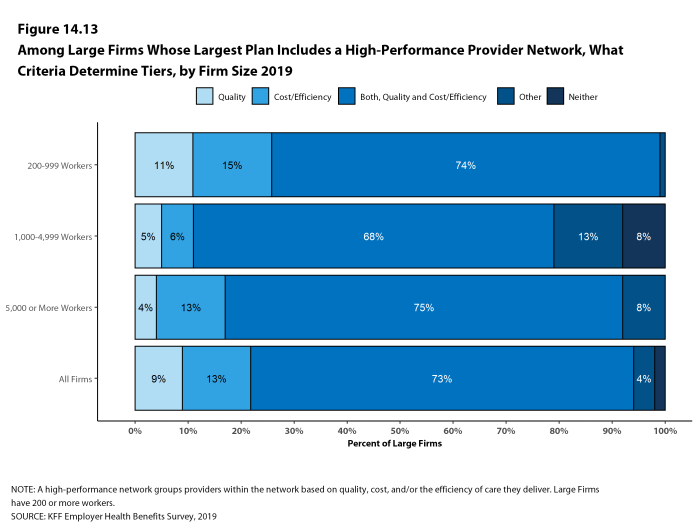
Figure 14.13: Among Large Firms Whose Largest Plan Includes a High-Performance Provider Network, What Criteria Determine Tiers, by Firm Size 2019
OTHER PLAN NETWORK ISSUES
- Some employers and health plans designate providers as ‘Centers of Excellence’ and encourage enrollees to use these providers to treat certain conditions. Centers of Excellence are designated providers that firms or health plans have identified as meeting high standards for both the cost and quality of care.
- Sixteen percent of employers with 50 or more employees offering health benefits say their plan with the largest enrollment encourages enrollees to use Centers of Excellence, including 34% of employers with 1,000-4,999 workers and 52% of employers with 5,000 or more workers [Figure 14.14].
- Among large employers that say that they encourage enrollees to use Centers of Excellence in their plan with the largest enrollment, 33% pay for the travel and lodgings costs for enrollees to receive care at a designated Center of Excellence [Figure 14.14].
- Another strategy for some employers is to eliminate out-of-network coverage for specified services. These firms may feel that they can better control use or quality of care by restricting coverage to in-network providers.
- Four percent of large firms report they stopped covering specified health services provided out-of-network within the last two years [Figure 14.16].
- Services identified by employers that reported dropping out-of-network for services included mental health, bariatric surgery and dialysis.
- Some employers also contract directly with certain health plans or health systems, outside of their established provider networks, to treat patients with specified conditions. Among large employers offering health benefits, 8% have such an arrangement [Figure 14.15].
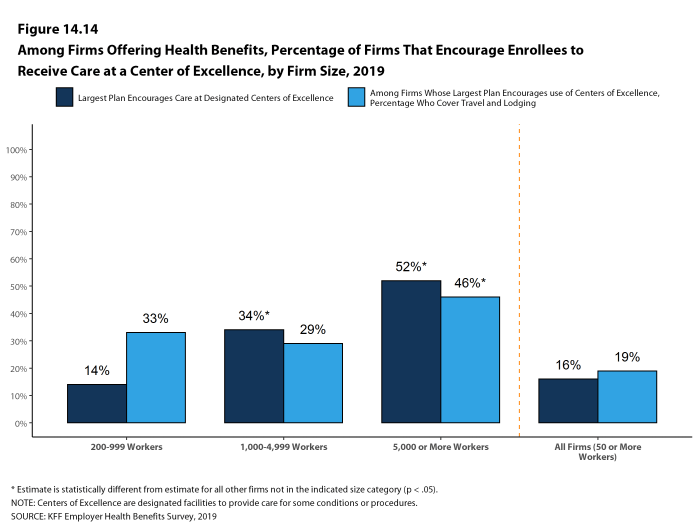
Figure 14.14: Among Firms Offering Health Benefits, Percentage of Firms That Encourage Enrollees to Receive Care at a Center of Excellence, by Firm Size, 2019
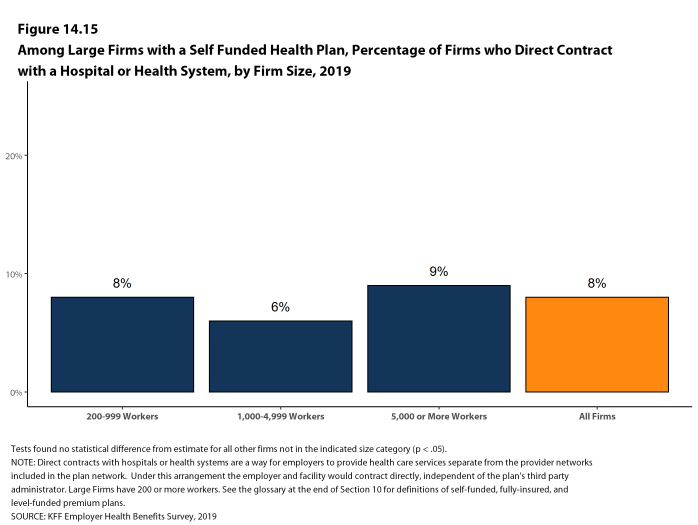
Figure 14.15: Among Large Firms With a Self Funded Health Plan, Percentage of Firms Who Direct Contract With a Hospital or Health System, by Firm Size, 2019
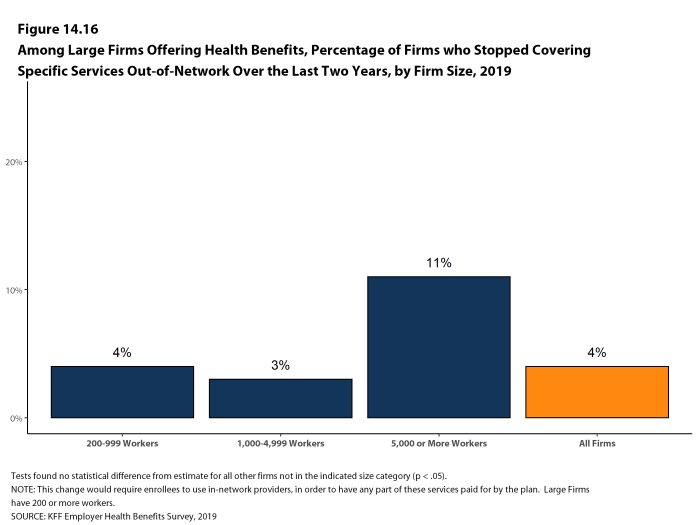
Figure 14.16: Among Large Firms Offering Health Benefits, Percentage of Firms Who Stopped Covering Specific Services Out-Of-Network Over the Last Two Years, by Firm Size, 2019
NARROW NETWORKS
- One way that employers and health plans can affect the cost and quality of services in their provider networks is to eliminate hospitals or health systems that are not performing well.
- Only a small share (2%) of firms offering health benefits say that either they or their insurer eliminated a hospital or health system from a provider network during the past year in order to reduce the plan’s cost [Figure 14.17].
- Among firms saying that they did not eliminate a hospital or health system from a provider network in the previous year, 5% say that they considered doing so [Figure 14.19].
- Another approach that employers can use is to offer a health plan with a relatively small, or narrow, network of providers. Narrow network plans limit the number of providers that can participate in order to reduce costs and generally are more restrictive than standard HMO networks.
- Five percent of firms offering health benefits report that they offer at least one plan that they considered to be a narrow network plan, similar to the percentage reported last year [Figure 14.18].
- Firms with 5,000 or more workers offering health benefits are more likely than firms of other sizes to offer at least one plan with a narrow network [Figure 14.17].
- Employers offering health benefits were asked to characterize how broad the provider network is in the plan with the largest enrollment. Fifty-five percent of firms say that the network in the plan with the largest enrollment is ‘very broad’, 37% say it is ‘somewhat broad’, 7% say it is ‘somewhat narrow’ [Figure 14.20].
- Employers offering health benefits were further asked how much cost savings the firm would need to realize to shift any of their health plans to narrower networks.
- A significant share of employers (39%) say that they would not reduce network size for cost savings, 25% say that they would need to realize savings of more than 30%, and 11% say that they would need to realize savings of between 20% and 30% [Figure 14.21].
- Employers were also asked what the biggest obstacle is to adopting a narrower network plan or plans. Only 5% of employers say that they had not considered the idea of a narrower network plan, 28% cite employee considerations, such as disruption of provider relationships or employee backlash, 14% cite concerns about access or convenience for employees, 9% say that they were in a rural area and/or there was a lack of providers, 11% say that their employees were spread out over a large area, and 12% cite concerns about the cost or quality of care [Figure 14.22].
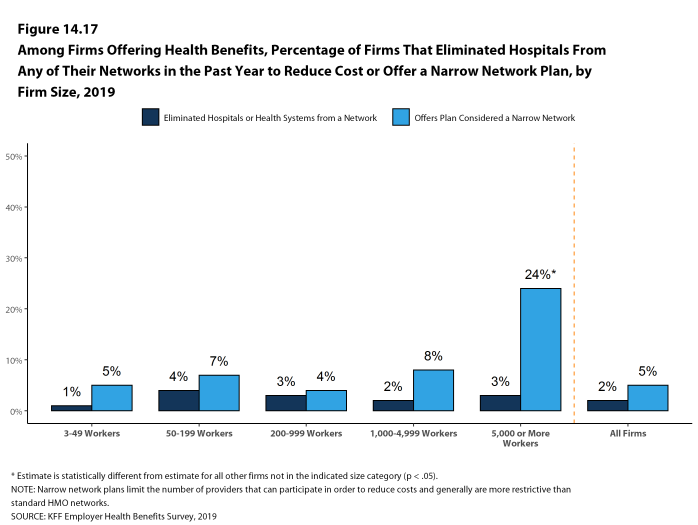
Figure 14.17: Among Firms Offering Health Benefits, Percentage of Firms That Eliminated Hospitals From Any of Their Networks in the Past Year to Reduce Cost or Offer a Narrow Network Plan, by Firm Size, 2019
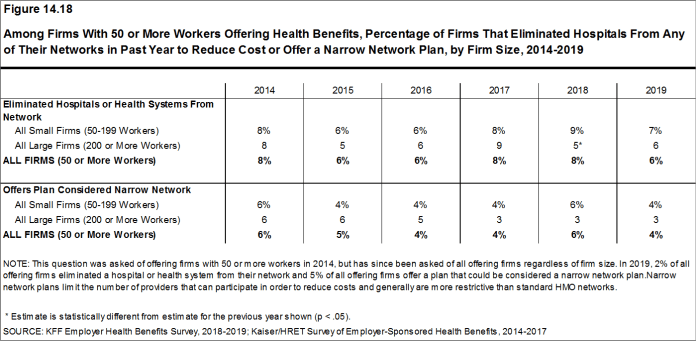
Figure 14.18: Among Firms With 50 or More Workers Offering Health Benefits, Percentage of Firms That Eliminated Hospitals From Any of Their Networks in Past Year to Reduce Cost or Offer a Narrow Network Plan, by Firm Size, 2014-2019
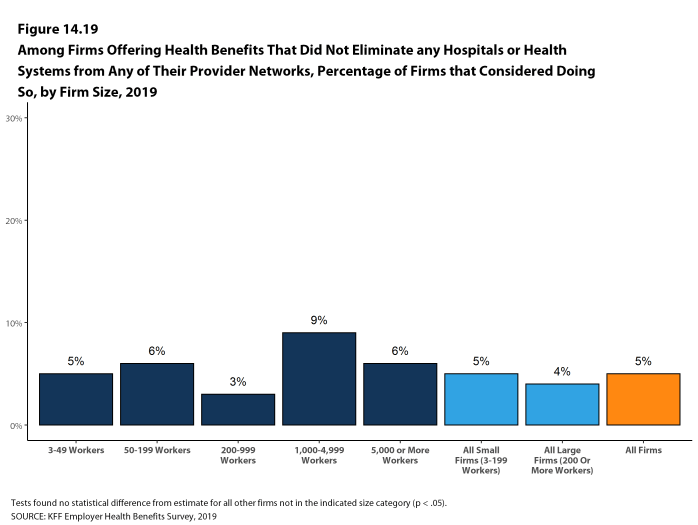
Figure 14.19: Among Firms Offering Health Benefits That Did Not Eliminate Any Hospitals or Health Systems From Any of Their Provider Networks, Percentage of Firms That Considered Doing So, by Firm Size, 2019
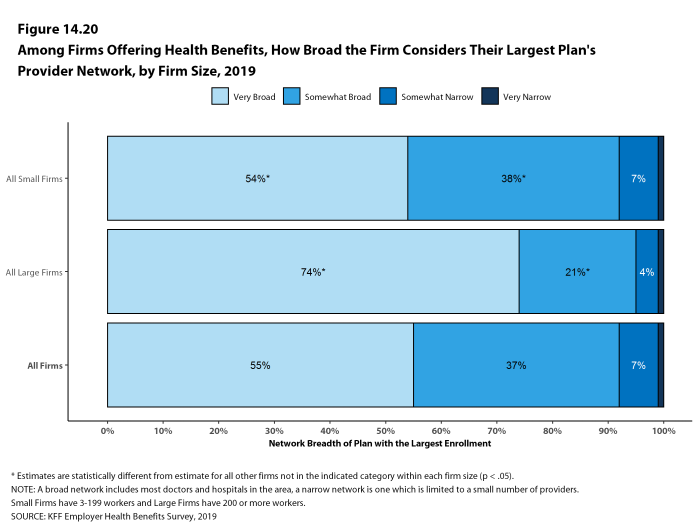
Figure 14.20: Among Firms Offering Health Benefits, How Broad the Firm Considers Their Largest Plan’s Provider Network, by Firm Size, 2019
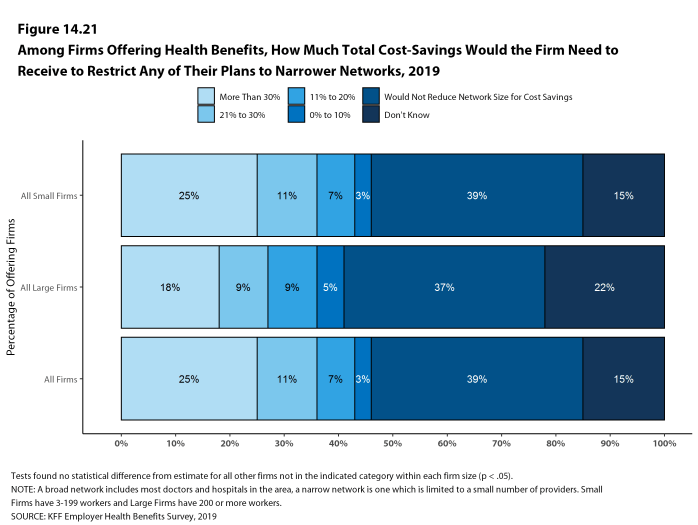
Figure 14.21: Among Firms Offering Health Benefits, How Much Total Cost-Savings Would the Firm Need to Receive to Restrict Any of Their Plans to Narrower Networks, 2019
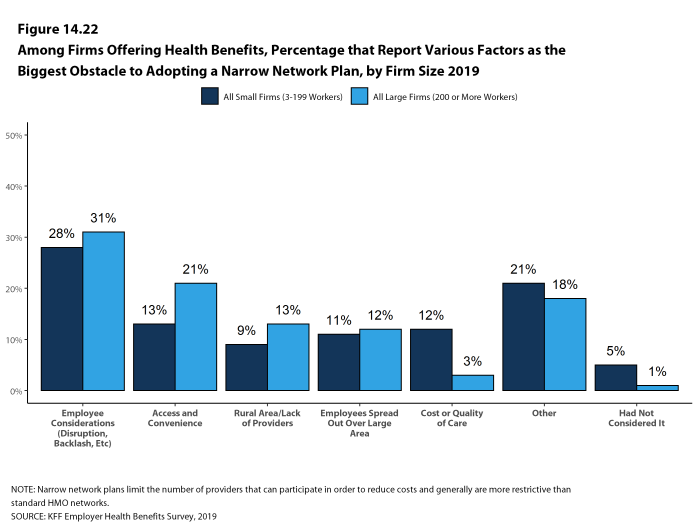
Figure 14.22: Among Firms Offering Health Benefits, Percentage That Report Various Factors As the Biggest Obstacle to Adopting a Narrow Network Plan, by Firm Size 2019

Figure 14.23: Among Firms Offering Health Benefits, Percentage of Firms Whose Plan Has Various Features, by Firm Size, 2019
PRESCRIPTION DRUG PRACTICE
The cost of prescription drugs is one of the largest challenges facing employers and families. Recent policy options have focused on the complexity involving the delivery and pricing of prescription drugs and the lack of transparency about the true price for individual prescriptions. We asked employers about two issues related to price transparency, prescription drug rebates and programs operated by drug manufacturers to assist patients with the cost of prescriptions.
Rebates are payments made by drug manufacturers to insurers, pharmacy benefit managers (PBMs), and employers that reduce the actual price of the drugs, usually in exchange for favorable placement on health plan formularies. Some payers are concerned that insurers and PBMs may not be passing all of the rebates they collect onto the ultimate payers. Drug manufacturers operate or fund programs to reduce the costs of prescriptions for patients. Some are aimed at lower income or uninsured patients, while others assist people with coverage who still may face high out-of-pocket costs. Some drug manufacturers provide coupons to patients who are prescribed their drugs. Coupons are discounts that prescription users can present at the pharmacy that reduce their cost sharing liability. Payers are concerned that coupons and some patient assistance programs affect the incentives employees otherwise may have to use lower cost drugs.
- Among employers with 1,000 or more employees offering health benefits, 27% say that they receive ‘most’ of the prescription drug rebate negotiated by their PBM or health plan, 32% say that they receive ‘some’ of the negotiated rebate, 18% say that they receive ‘very little’ of the negotiated rebate, and 23% do not know [Figure 14.25].
- Among employers offering health benefits with 1,000 or more employees, 7% say they believe that drug coupons and patient assistance programs have a ‘substantial impact’ on the cost of their health plans, 33% say that coupons and patient assistance programs have ‘some impact’ on plan costs, 34% say that they have ‘little impact’ on plan costs, 9% say that they have ‘no impact’ on plans costs, and 17% do not know [Figure 14.24].
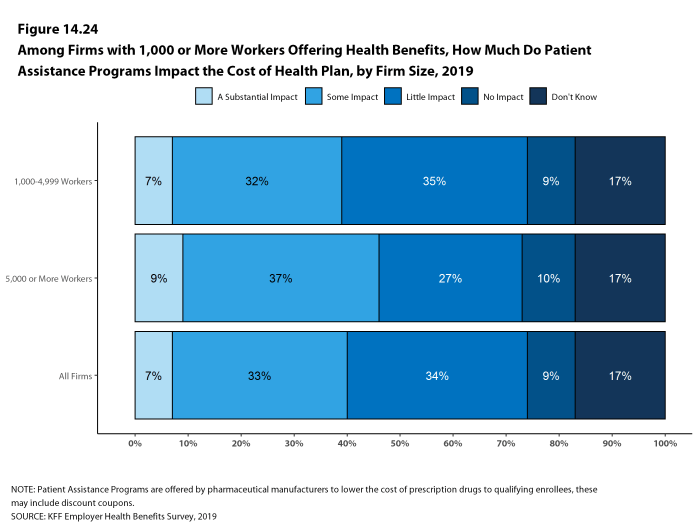
Figure 14.24: Among Firms With 1,000 or More Workers Offering Health Benefits, How Much Do Patient Assistance Programs Impact the Cost of Health Plan, by Firm Size, 2019
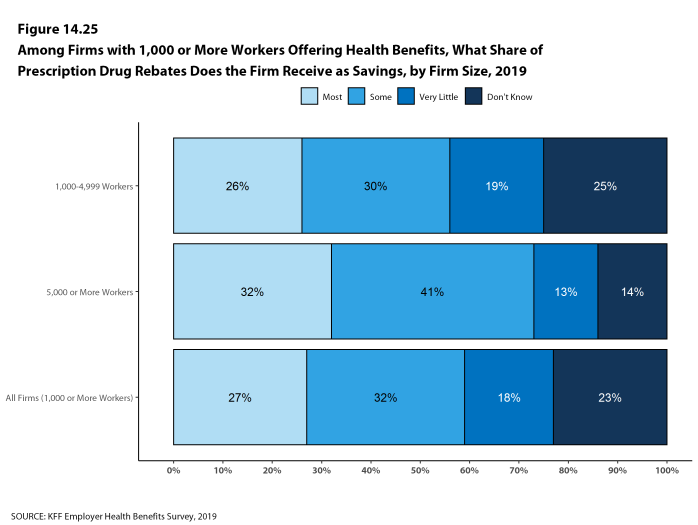
Figure 14.25: Among Firms With 1,000 or More Workers Offering Health Benefits, What Share of Prescription Drug Rebates Does the Firm Receive As Savings, by Firm Size, 2019
REPEAL OF THE ACA’s INDIVIDUAL RESPONSIBILITY PROVISION
The Affordable Care Act included a tax penalty, sometimes called the Individual Mandate, for tax payers who did not have health insurance that met minimum requirements. This penalty was essentially eliminated beginning for tax year 2019. Although employers with more than 50 full-time equivalent employee are still required to offer health benefits to their full-time employees, some have predicted that the repeal of the individual mandate will reduce the share of workers electing to take up coverage at their work.
- Among firms offering health benefits with at least 50 employees, 9% say that they believed the repeal of the individual requirement reduced the percentage of employees and dependents that elected the firm’s coverage in 2019 [Figure 14.26].
- Among firms that say that they believe repeal of the Individual Mandate reduced employee take up, 75% say that the reduction in take up was greater among lower-paid employees and their dependents than among other workers.
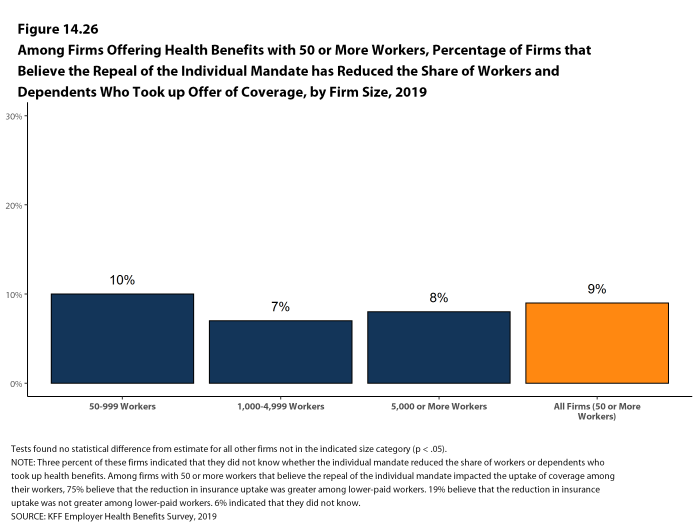
Figure 14.26: Among Firms Offering Health Benefits With 50 or More Workers, Percentage of Firms That Believe the Repeal of the Individual Mandate Has Reduced the Share of Workers and Dependents Who Took Up Offer of Coverage, by Firm Size, 2019
EXCISE TAX ON HIGH COST HEALTH PLANS
The high-cost plan tax, sometimes called the “Cadillac Tax”, is an excise tax on health benefit plans with premiums and other costs that exceed specified thresholds. The tax is 40% of the amount by which plan costs exceed the specified thresholds, and is calculated with respect to each employee based on the combinations of health benefits received by that employee, including the employer and employee share of health plan premiums (or premium equivalents for self-funded plans), Flexible Spending Account (FSA) contributions, and employer contributions to health savings accounts and health reimbursement arrangement contributions. The tax was originally scheduled to begin in 2018, but has been delayed twice and recently a bill passed the House which would repeal the provision entirely.29
- Only 16% of firms offering health benefits with 50 or more employees say they expect the high-cost plan tax to take effect as scheduled, 52% say it will not take effect as scheduled, and 31% say they do not know.
- Among firms offering health benefits with 50 or more employees, 33% say that the upcoming high-cost plan tax was ‘very important’ or ‘somewhat important’ when making health benefit decisions for 2019, while 62% say that was ‘not too important’ or ‘not important at all’ [Figure 14.28].
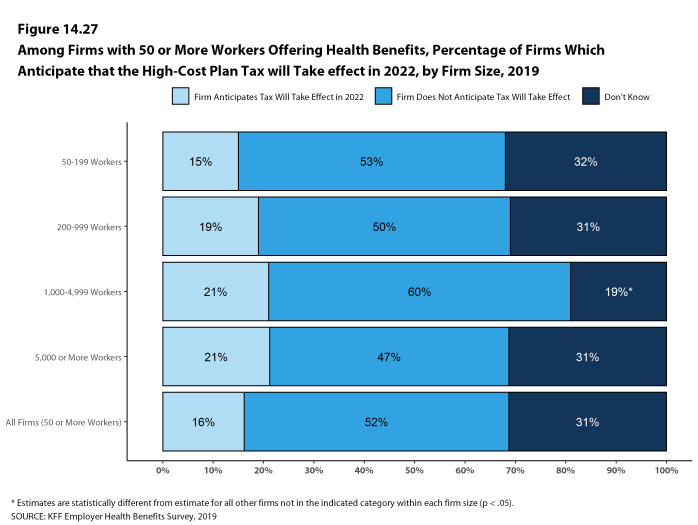
Figure 14.27: Among Firms With 50 or More Workers Offering Health Benefits, Percentage of Firms Which Anticipate That the High-Cost Plan Tax Will Take Effect in 2022, by Firm Size, 2019
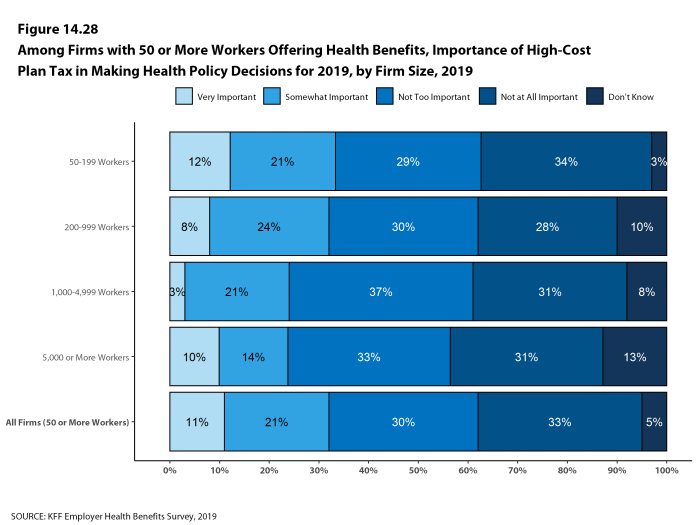
Figure 14.28: Among Firms With 50 or More Workers Offering Health Benefits, Importance of High-Cost Plan Tax in Making Health Policy Decisions for 2019, by Firm Size, 2019
PRIVATE EXCHANGES AND DEFINED CONTRIBUTIONS
A private exchange is a virtual market that allows employers to provide their workers with a choice of several different health benefit options, often including voluntary or ancillary benefits options. Private exchanges generally are created by consulting firms, insurers, or brokers, and are different than the public exchanges run by the states or the federal government. There is considerable variation in the types of exchanges currently offered: some exchanges allow workers to choose between multiple plans offered by the same carrier while in other cases multiple carriers participate. Private exchanges have been operating for several years, but enrollment remains modest.
- Six percent of firms offering health benefits with 50 or more workers offer coverage through a private exchange. These firms provide coverage to 4% of covered workers in firms with 50 or more workers. These percentages are similar to those in 2018.
- Among firms with 50 or more employees offering health benefits through a private exchange, 81% say they use a defined contribution approach for their employees receiving coverage through a private exchange. A defined premium contribution is a set dollar amount offered to the employee to help pay for healthinsurance.
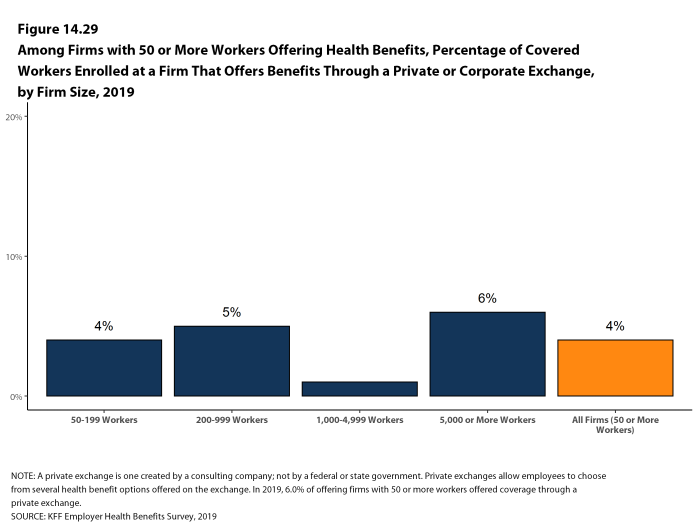
Figure 14.29: Among Firms With 50 or More Workers Offering Health Benefits, Percentage of Covered Workers Enrolled at a Firm That Offers Benefits Through a Private or Corporate Exchange, by Firm Size, 2019
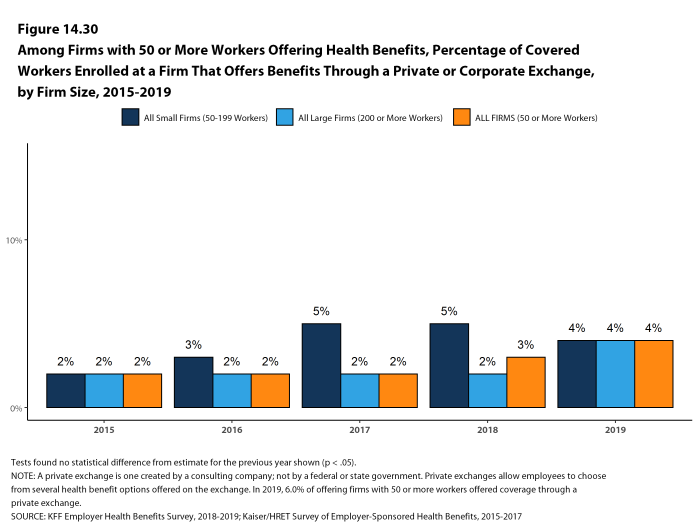
Figure 14.30: Among Firms With 50 or More Workers Offering Health Benefits, Percentage of Covered Workers Enrolled at a Firm That Offers Benefits Through a Private or Corporate Exchange, by Firm Size, 2015-2019
PROFESSIONAL EMPLOYER ORGANIZATION
Some firms provide for health and other benefits by entering into a co-employment relationship with a Professional Employer Organization (PEO). Under this arrangement, the firm manages the day-to-day responsibilities of employees, but the PEO hires the employees and acts as the employer for insurance, benefits, and other administrative purposes. Six percent of small firms offering health benefits offer coverage through a PEO, similar to the last year this question was asked [Figure 14.31].
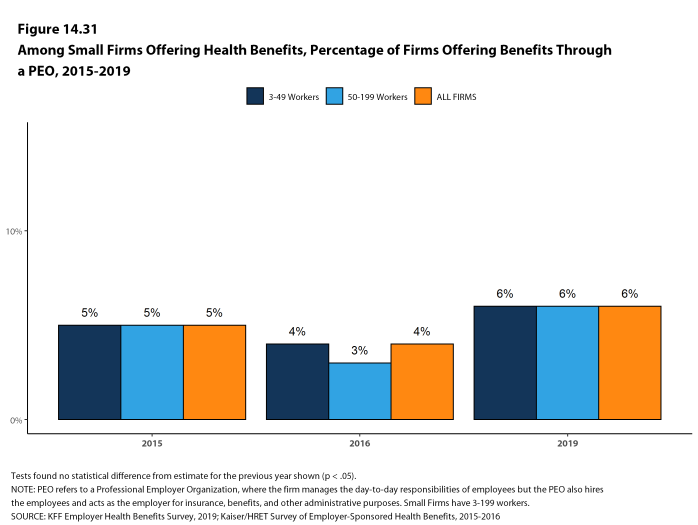
Figure 14.31: Among Small Firms Offering Health Benefits, Percentage of Firms Offering Benefits Through a Peo, 2015-2019
- Middle Class Health Benefits Tax Repeal Act, H.R. 748, 116th Cong. (2019)↩