Early Look at Medicaid Spending and Enrollment Trends Amid COVID-19

Published: May 15, 2020

The coronavirus pandemic has generated both a public health crisis and an economic crisis, with major implications for Medicaid, a countercyclical program. During economic downturns, more people enroll in Medicaid, increasing program spending at the same time state tax revenues may be falling. To help support states as enrollment in Medicaid grows and ensure existing enrollees maintain continuous coverage, the Families First Coronavirus Response Act (FFCRA) authorized a 6.2 percentage point increase in the federal match rate (“FMAP”) (retroactive to January 1, 2020) available if states meet certain “maintenance of eligibility” (MOE) requirements.

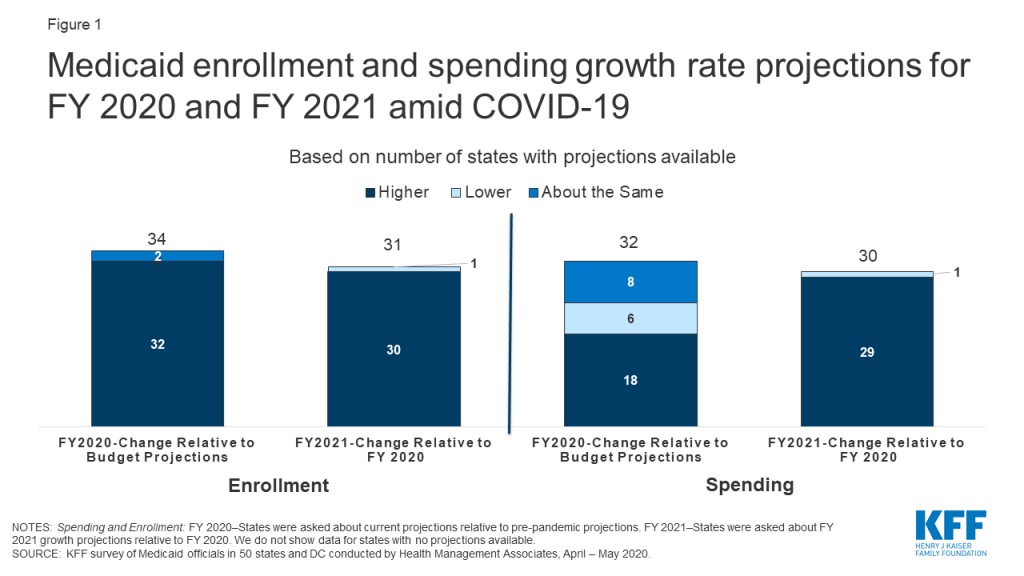
This brief provides some early insights into the current picture of Medicaid spending and enrollment, as Congress considers providing additional fiscal relief through the federal Medicaid match rate. It is based on a rapid survey conducted by the Kaiser Family Foundation (KFF) and Health Management Associates (HMA) of Medicaid directors in all 50 states and the District of Columbia. A total of 38 states responded to the survey. Some states were still in the process of gathering data to understand the implications of the coronavirus at the time of this survey and did not have updated enrollment and/or spending projections yet for state fiscal year (FY) 2020 and/or FY 2021. Overall, nearly all states with enrollment projections and over half of states with spending projections anticipate FY 2020 growth rates to exceed pre-pandemic estimates. Nearly all states with projections anticipate FY 2021 growth rates to exceed rates in FY 2020 for both enrollment and spending (Figure 1). For most states, the fiscal year begins on July 1.

Figure 1: Medicaid enrollment and spending growth rate projections for FY 2020 and FY 2021 amid COVID-19

Overview

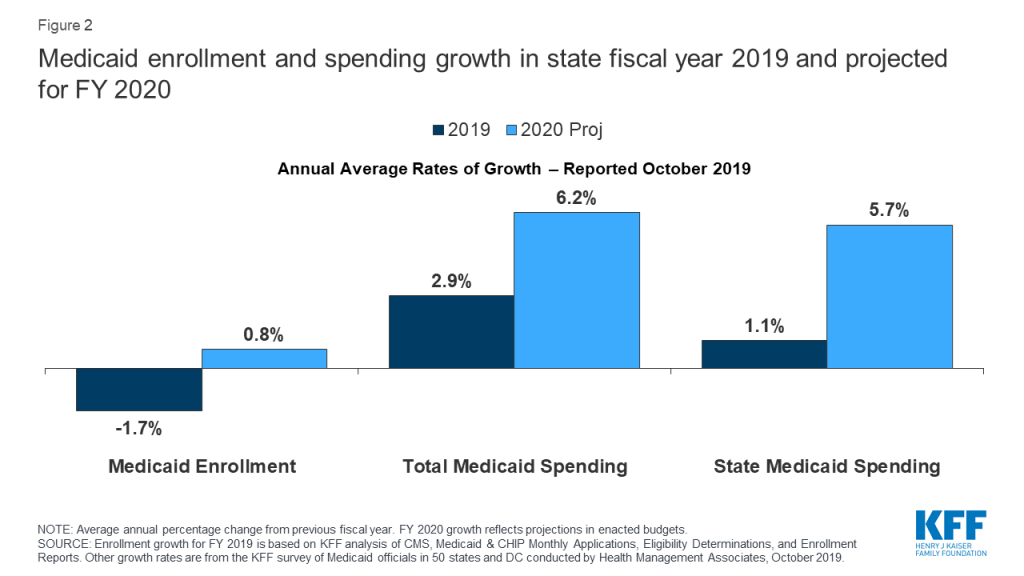
At the start of FY 2020, states anticipated relatively flat enrollment growth but modest total and state Medicaid spending growth (Figure 2). When states adopted budgets for FY 2020, states attributed flat enrollment projections primarily to a robust economy. States also pointed to changes in renewal processes, new functionality of upgraded eligibility systems, and enhanced verifications and data matching efforts as contributors to enrollment declines. While states expected flat enrollment growth to mitigate total Medicaid spending growth, states also reported that higher costs for prescription drugs, provider rate increases, and costs for the seniors and people with disabilities (including increased utilization of long-term services and supports) would put upward pressure on total Medicaid spending.

Figure 2: Medicaid enrollment and spending growth in state fiscal year 2019 and projected for FY 2020

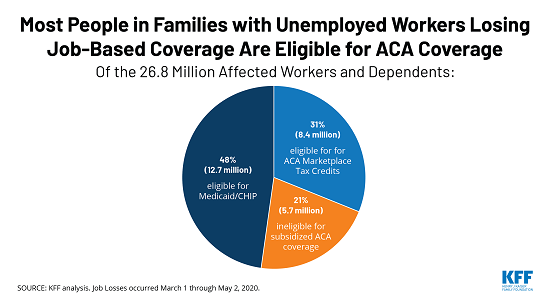
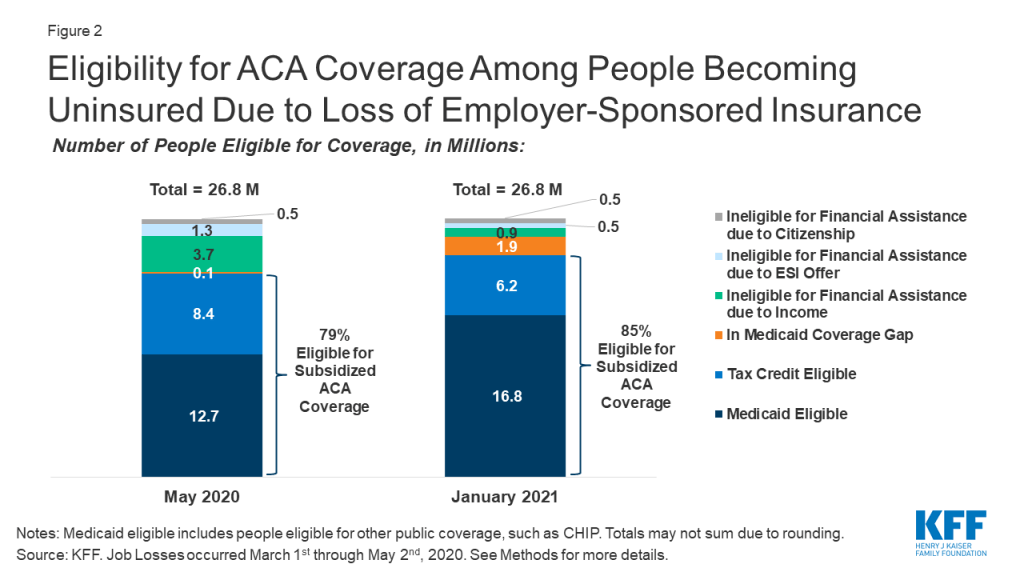
The economic implications from the coronavirus pandemic are stark with unemployment rates up and state revenues down. April data show that the U.S. economy lost 20.5 million jobs and the unemployment rate increased to 14.7 percent. The Congressional Budget Office (CBO) estimates that the unemployment rate will average 15 percent during the second and third quarters of 2020, up from less than 4 percent in the first quarter. CBO expects the unemployment rate to decline somewhat but remain at 9.5 percent by the end of 2021 (about 6 percentage points higher than the rate in CBO’s economic projection produced in January 2020). Often individuals lose job-based health insurance coverage when they experience job loss. A recent KFF analysis shows that by January 2021, when unemployment insurance benefits cease for most people who lost jobs between March 1 and May 2, 2020, nearly 17 million people could be newly eligible for Medicaid and about 6 million eligible for marketplace subsidies (assuming individuals in this group have not found work as by that time) . Preliminary data show that state April 2020 revenues may be down 20 percent to 50 percent from April last year and down significantly relative to pre-pandemic projections. Drops in revenues coupled with increased demand for spending to address the public health emergency is generating budget shortfalls across states. A CBO letter to the Chair of the House Budget Committee affirms that without further funding from the federal government, states will need to increase taxes or reduce spending as a result of the pandemic and these actions would result in lower spending and higher job loss.

During economic downturns, enrollment and spending in Medicaid grow. During downturns, more individuals lose jobs and income and enroll in Medicaid. While demand for Medicaid and other services typically increases during downturns, state revenues generally fall. For example, during the Great recession, the unemployment rate peaked at 10 percent in October 2009 and Medicaid spending and enrollment growth peaked at 7.6 percent and 7.8 percent, respectively, in 2009 as well. At that time, a temporary increase in the Medicaid FMAP rate was used to provide rapid fiscal relief to states. This approach leveraged Medicaid’s existing financing structure to provide federal funds to states more quickly and efficiently than establishing a new program or allocating money from a new funding stream. It also reduced the need for states to cut Medicaid spending to fill state budget gaps and included MOE provisions for states to be eligible for enhanced match. Because Medicaid is funded from a combination of federal and state funds, states need to make substantial cuts to Medicaid to generate state savings. For example, for a state with a 50 percent match rate, a $100 cut to Medicaid will reduce state spending by $50 and federal spending by $50. However, for the ACA expansion population, a $100 reduction will yield only $10 in state savings and reduce federal spending by $90 (as the federal match rate is set at 90 percent for newly eligible expansion adults).

The Families First Coronavirus Response Act, amended by the Coronavirus Aid, Relief, and Economic Security (CARES) Act, authorizes a 6.2 percentage point increase in federal Medicaid matching funds to help states respond to the COVID-19 pandemic. The additional funds are available to states from January 1, 2020 through the quarter in which the public health emergency period ends, provided that states meet certain conditions. The HHS Secretary declared COVID-19 a nationwide public health emergency on January 31, 2020, retroactive to January 27, 2020. The public health emergency ends when the Secretary declares that the emergency no longer exists or after 90 days, whichever happens first, although the Secretary can renew the public health emergency declaration for subsequent periods. The public health emergency was extended on April 26 for another 90 days. Increased federal matching funds support states in responding to the increased need for services, such as testing and treatment during the COVID-19 public health emergency, as well as increased enrollment as more people lose income and qualify for Medicaid during the economic downturn.

States must meet five maintenance of eligibility (MOE) conditions that ensure continued coverage for current enrollees to receive the enhanced federal matching funds during the COVID-19 public health emergency. States must apply Medicaid eligibility standards, methodologies, and procedures that are no more restrictive, and states cannot increase premiums relative to what was in effect on January 1, 2020. States also must cover coronavirus testing and COVID-19 treatment, including vaccines, specialized equipment, and therapies, without cost-sharing while they receive the increased funds. States also cannot increase political subdivisions’ contributions to the non-federal share of Medicaid costs beyond what was required on March 11, 2020. Finally, states must provide continuous eligibility through the end of the month in which the public health emergency ends for those enrolled as of March 18, 2020 unless the person ceases to be a state resident, becomes deceased, or requests a voluntary coverage termination. Medicaid eligibility during this time must continue “regardless of any changes in circumstances or redeterminations at scheduled renewals that would otherwise result in termination.” Recent guidance from CMS states that, under the MOE, states that accept the FMAP increase cannot increase cost-sharing.

Key Findings

Compared to pre-pandemic estimates, nearly all states with projections anticipate higher enrollment growth in FY 2020 and continued growth into FY 2021. We asked states about their current projections for monthly Medicaid enrollment for May 2020 relative to projections made prior to the pandemic as well as the direction and drivers of enrollment into FY 2021. Not surprisingly, nearly all states with projections (32 of 34) anticipate that current FY 2020 enrollment growth will exceed pre-pandemic enrollment projections and 30 of 31 states anticipate that enrollment growth in FY 2021 will outpace the current fiscal year.

States attribute higher enrollment projections in FY 2020 and FY 2021 to the worsening economy and the effects of the MOE. The effects of the economy in recent months and expectations that these conditions will get worse were major factors in state enrollment projections. In addition, states reported that the MOE was also a factor. MOE requirements eliminate the usual enrollment churn that occurs when some individuals lose eligibility and are dis-enrolled from Medicaid each month. However, even when states can resume eligibility redeterminations, given the magnitude of the economic crisis, many individuals are likely to retain eligibility because their income will continue to fall below Medicaid income eligibility thresholds. In the past, some eligibility churn was attributable to individuals losing coverage due to barriers maintaining coverage at renewal or when states conducted periodic data matches between renewals. Prior to the pandemic, these types of barriers were potentially depressing enrollment for some individuals who remained eligible. Beyond the conditions to access the enhanced funding, some states are implementing actions to expand eligibility and make it easier to apply such as allowing for self-attestation of eligibility criteria, eliminating premiums, expanding the use of presumptive eligibility, or otherwise simplifying application processes.

Over half of states with projections anticipate that FY 2020 spending growth will be higher than spending growth projections made prior to the pandemic. Similar to other health care payers, the spending picture for Medicaid for the remainder of FY 2020 is somewhat mixed. Over half of states with projections (18 of 32) expect FY 2020 total Medicaid spending to exceed pre-pandemic projections while eight states anticipate no material change. The remaining six states expect somewhat lower spending in FY 2020 due to public health emergency restrictions halting non-urgent services and otherwise resulting in lower utilization of health care services. Some states with managed care noted that without adjustments in capitation rates, reductions in utilization will not reduce overall costs while increases in enrollment will continue to drive expenditures up. Without available claims data to review, many states could not anticipate how lower costs attributable to lower utilization would compare to costs related to increased enrollment and new/unanticipated expenditures related to COVID testing and treatment.

States also reported policy actions to expand access to services and increase payment rates for selected providers. Some states pointed to actions that could put upward pressure on spending and potentially offset expenditure reductions due to decreased utilization. Such actions include waiving copayments and prior authorization requirements, allowing early pharmacy refills, expanded telehealth services and reimbursement rates, and increasing provider rates particularly for hospitals, nursing facilities, and other long-term services providers. Examples of reimbursement adjustments include bumps for COVID-positive nursing facility residents or a hospital DRG add-on of 20 percent for COVID-19 positive enrollees.

For FY 2021, nearly all states with projections (29 of 30) anticipate that total Medicaid spending rates will continue to increase over FY 2020 spending rates, primarily due to increases in enrollment. In addition, states anticipate upticks in utilization for new enrollees and previously enrolled individuals (catch-up for depressed utilization in FY 2020) and pressure to address provider reimbursement issues will contribute to expenditure growth in FY 2021. A few states also pointed to the expected continuation of telehealth expenditures. While not asked about projections beyond FY 2021, at least one state commented that economic impacts and higher enrollment growth will likely continue beyond FY 2021.

Expected Budget Shortfall

Four in ten states with projections (13 of 33) reported currently projecting a Medicaid budget shortfall for FY 2020. A few states said that the combination of a supplemental appropriation and the additional federal support from the FMAP increase will help to address potential Medicaid budget shortfalls in FY 2020. However, a number of states reported that FY 2020 budgets were still in flux and broader reductions in overall state revenues may require reductions in Medicaid and other state programs. At least one state reported administrative reductions like hiring freezes and deferment of non-essential contracts.

Among the states with projections available, nearly all reported a budget shortfall is “almost certain” or “likely” for FY 2021 (17 of 19 states). Two other states reported a “50-50” chance of a Medicaid budget shortfall for FY 2021. No states reported that that a FY 2021 budget shortfall was “not likely” or “almost certain no shortfall.”

Looking Ahead

The FFCRA temporary FMAP increase has already provided fiscal relief to states facing mounting budget pressures from the pandemic. Enhancing that relief by further increasing the temporary FMAP rate and extending its duration could provide greater fiscal stability to states and support the costs of growing increases in enrollment as the economy worsens, at increased federal cost. Multiple state groups including the National Governors Association and the National Association of State Medicaid Directors have called for a further increase in the FMAP. The House bill introduced on May 12, 2020 would increase the FMAP by 14 percentage points from July 1, 2020 through June 30, 2021. Without certainty of additional federal support, many states will need to develop balanced budgets for the fiscal year beginning on July 1 (for most states) that could likely include significant spending cuts, including for Medicaid programs, at a time when demand for services is growing. We will continue to track state changes to Medicaid in response to the pandemic and will be fielding a more detailed survey of Medicaid programs this summer to capture assumptions about Medicaid spending and enrollment as well as policy changes that were included in state fiscal year (FY) 2021 budgets.

COVID-19 Presents Significant Risks for American Indian and Alaska Native People

Authors: Samantha Artiga and Kendal Orgera
Published: May 14, 2020

The COVID-19 emergency presents significant risks for the over 5 million individuals who self-identify as American Indian and Alaska Native (AIAN) alone or in combination with another race. AIAN people live across the country, but are concentrated in certain states, with roughly half living in seven states (CA, OK, AZ, TX, NM, WA, and NY). Under treaties and laws, the federal government has a unique responsibility to provide health care services to AIAN people. AIAN people face disproportionate risks from the COVID-19 outbreak given significant underlying disparities in health, social, and economic factors. Addressing their needs as part of COVID-19 response efforts will be key for preventing further widening of these disparities and fulfilling the federal government’s federal trust responsibility.

Data point to stark impacts of COVID-19 for AIAN people in some states. For example, as of May 11th, AIAN people made up 18% of deaths and 11% of cases compared to 4% of the total population in Arizona, 57% of cases compared to 9% of the total population in New Mexico, and 30% of cases compared to 2% of the total population in Wyoming, and (Figure 1). As of May 10th, the Indian Health Service (IHS) reported nearly 5,500 positive cases from IHS, Tribal, and urban Indian facilities, including over 3,300 among the Navajo Nation, which spans Arizona, New Mexico, and Utah.

Figure 1: Data Point to Stark Impacts of COVID-19 for American Indian and Alaska Native People in Some States

Coronavirus presents significant health risks for AIAN people because they face large underlying health disparities. AIAN people have disproportionately high rates of many health conditions that may put them at higher risk for serious illness if they contract coronavirus, including diabetes, heart disease, asthma, and obesity. Analysis examining how many adults are at higher risk for experiencing serious illness if they are infected with coronavirus based on CDC’s identified health risk factors finds that 34% of AIAN nonelderly adults are at risk of serious illness compared to 21% of White nonelderly adults (Figure 2). Living conditions also put AIAN people at increased risk for exposure to the disease. For example, compared to other groups, AIAN individuals are more likely to lack access to clean water and plumbing and to live in substandard and crowded housing situations, limiting the ability to practice frequent hand washing and social distancing.

Figure 2: Share of Adults Ages 18-64 at Higher Risk of Serious Illness if Infected with Coronavirus by Race/Ethnicity

AIAN people face barriers to health care that may make it challenging to obtain coronavirus testing and treatment services. IHS is the primary vehicle through which the federal government fulfills its responsibility to provide health care services to AIAN people. However, IHS historically has been underfunded to meet their health care needs. Moreover, not all individuals who identify as AIAN are able to access services through IHS. IHS services generally are limited to members of or descendants of members of federally recognized Tribes. However, not all individuals who self-identify as AIAN belong to a federally recognized Tribe. Further, while many AIAN people live in rural areas, the majority live outside of Tribal areas, which can make it challenging to access an IHS provider. Give the limitations of IHS, Medicaid and other sources of health insurance remain important for expanding access to care for AIAN people. They also provide revenue that enhances capacity at IHS and Tribal facilities. However, as of 2018, 22% of AIAN nonelderly people were uninsured, the highest of all racial and ethnic groups (Figure 3). Reflecting the limitations of IHS and the high uninsured rate for AIAN people, they face increased challenges accessing care. For example, AIAN nonelderly adults are more likely compared to their White counterparts to have not seen a doctor in the past year due to cost (19% vs. 13%) and to have delayed care for other reasons (36% vs. 19%).

Figure 3: Uninsured Rates among the Nonelderly Individual by Race/Ethnicity, 2018

Coronavirus also may lead to disproportionate financial challenges for AIAN people. Over one in four (26%) nonelderly AIAN people have income below poverty, leaving them with limited ability to absorb income decreases that may result from the COVID-19 crisis. In addition, Tribes have lost key sources of revenue to support operations and services due to the halting of businesses and services in response to social distancing policies.

Addressing the needs of AIAN people as part of COVID-19 response efforts will be key to prevent further widening of their already large health and economic disparities and fulfilling the federal trust responsibility provide health care to AIAN people. The federal government has provided relief and support for federally recognized Tribes and Tribal business entities through the Coronavirus Aid Relief and Economic Security Act, including roughly $1 billion in additional IHS funding. Looking ahead, it will be important to assess the extent to which resources are adequate to address the needs of AIAN people and communities, including providing access to testing and treatment, support for health care providers, resources to mitigate risks associated with living conditions, culturally appropriate outreach and education, and financial relief. Moreover, comprehensive data will be key for understanding how the COVID-19 outbreak is affecting AIAN people, directing resources to meet needs, and measuring effects of response and relief efforts.

News Release

Hospitals with More Private Insurance Revenue, Larger Operating Margins and Less Uncompensated Care Received More Federal Coronavirus Relief Funding Than Others 

Published: May 13, 2020

Hospitals that in normal times derive most of their revenue from patients with private insurance received more than twice as much federal coronavirus relief funding per bed than the hospitals that get the smallest share of private insurance money, finds a new KFF analysis of the first $50 billion in relief grants.

Institutions representing the top 10 percent of hospitals based on share of private insurance revenue received $44,321 in coronavirus relief per hospital bed, the analysis finds. That was more than double the $20,710 per hospital bed for the hospitals in the bottom 10 percent based on private insurance revenue.

The lopsided awards are the outgrowth of a distribution formula – determined by the Department of Health and Human Services in an attempt to get relief money out quickly – that favored hospitals with the highest share of revenue from patients with private insurance. These grants were provided using funding from the Coronavirus Aid, Relief, and Economic Security (CARES) Act and the Paycheck Protection Program and Health Care Enhancement Act, which both deferred to the HHS on how the money should be distributed.

Previous KFF analysis documented that private insurance typically reimburses at twice the rate of Medicare, with some hospitals commanding even higher reimbursement. This new study shows that the hospitals that are benefiting the most from that higher reimbursement are now getting the most taxpayer money in the form of coronavirus relief funds. Meanwhile hospitals that make most of their money treating people who are on Medicare and Medicaid, and therefore are typically paid at much lower rates, are getting relatively less help.

The analysis finds that the hospitals receiving more money are less likely to be teaching hospitals (10% vs 38%) and more likely to be for-profit (33% vs 23%). They had higher average operating margins (4.2%  vs -9.0%) and provided less uncompensated care as a share of operating expenses (7.0% vs. 9.1%).

With additional relief money expected, our analysis of more than 4,500 hospitals focused on those with the highest and lowest shares of revenue from private payers to inform policy decisions regarding how to allocate any remaining grants to providers as well as any potential new funding from Congress. In its latest proposed coronavirus relief bill, the House has added details that would take steps to minimize the advantages for providers with more revenue from privately insured patients.

For the full analysis, as well as other data and analyses related to the COVID-19 pandemic, visit kff.org.

Distribution of CARES Act Funding Among Hospitals

Authors: Karyn Schwartz and Anthony Damico
Published: May 13, 2020

The Department of Health and Human Services (HHS) has now begun distributing $72.4 billion of the $175 billion allocated for grants to health care providers in the Coronavirus Aid, Relief, and Economic Security (CARES) Act and the Paycheck Protection Program and Health Care Enhancement Act. This relief fund is designed to provide an influx of money to hospitals and other health care entities to help them respond to the coronavirus pandemic. Congress stated the money can be used either for costs related to treating COVID patients or to reimburse for lost revenue due to the pandemic. The largest share of that $72.4 billion is the $50 billion that the Department of Health and Human Services allocated to providers who participate in Medicare based on their total net patient revenue from all sources.

This brief examines the implications of the decision to allocate funding based on total net patient revenue, which is total patient revenue minus contractual allowances and discounts. The brief focuses specifically on hospitals using data that hospitals report to the Centers for Medicare & Medicaid Services as part of the Healthcare Cost Report Information System (HCRIS). Hospital revenue is mainly a factor of volume and payment rates per service or patient diagnosis.  Reimbursement rates vary widely by payer. Hospitals typically command rates from private insurers that average twice Medicare rates per patient, and some are paid substantially higher rates from private insurers in highly concentrated markets. We focused our analysis on hospitals with the highest and lowest shares of revenue from private payers to inform policy decisions regarding how to allocate any remaining grants to providers as well as any potential new funding from Congress.

Findings

The formula used to allocate the $50 billion in funding favored hospitals with the highest share of private insurance revenue as a percent of total net patient revenue. The hospitals in the top 10% based on share of private insurance revenue received $44,321 per hospital bed, more than double the $20,710 per hospital bed for those in the bottom 10% of private insurance revenue (Figure 1).

Figure 1: Relief Funds Per Hospital Bed for Hospitals with the Highest and Lowest Share of Private Insurance Revenue

When compared to the 457 hospitals with the lowest share of private insurance revenue, the 457 hospitals with the highest share of private insurance revenue are less likely to be teaching hospitals (10% vs 38%) and more likely to be for-profit (33% vs 23%) (Figure 2).  The hospitals with the highest share of private insurance revenue also had higher operating margins (4.2% vs -9.0%) and provided less uncompensated care as a share of operating expenses (7.0% vs. 9.1%).  Uncompensated care includes bad debt, charity care and unreimbursed Medicaid and children’s health insurance program expenses.

Figure 2: Characteristics of Hospitals with Highest and Lowest Share of Private Insurance Revenue

Discussion

Our analysis shows that the size of the relief fund grants varies dramatically per hospital bed based on a hospital’s payor mix. Hospitals with the lowest share of private insurance revenue received less than half as much funding for each hospital bed compared to the hospitals with the greatest share of revenue from private insurance. These hospitals’ large share of private reimbursement may be due either to having more patients with private insurance or charging relatively high rates to private insurers or a combination of those two factors. All things being equal, hospitals with more market power can command higher reimbursement rates from private insurers and therefore received a larger share of the grant funds under the formula HHS used. An alternative methodology for distributing the funds based on patient volume or that increased the size of the grant for providers that are more reliant on public payors such as Medicaid would have distributed the funding more evenly and less skewed by higher revenues from private insurers.

Our analysis focused on hospitals, but all entities that receive Medicare reimbursement were eligible for the $50 billion in relief funds. Those entities include hospice providers, skilled nursing facilities and individual physicians. Importantly, providers who did not have any Medicare reimbursement in 2019 were not eligible for grants from the $50 billion allocation. Some of these providers are pediatricians and obstetricians who do not serve Medicare patients. Others are providers who specialize in serving Medicaid patients and provide crucial services such as non-emergency medical transit, substance use disorder treatment, home-and community-based services, behavioral health services and dental care. HHS has stated that Medicaid-only providers will receive a separate allocation of funding, as will skilled nursing facilities and dentists.

Our analysis shows that hospitals with the highest share of private insurance revenue received a disproportionately high share of total funds. We would expect to see similar patterns for physicians and other entities that receive private insurance reimbursement. For example, community health centers that often see a relatively small share of patients with private insurance would have received less money than a private physician’s office that sees the same total patient volume but has more patients with private insurance. With HHS expected to release additional relief fund grants and Congress considering additional stimulus, this analysis demonstrates that the formula used to distribute funding has significant consequences for how funding is allocated among providers.

Methods and Data Limitations

We used the RAND Hospital Data tool to analyze data that hospitals report to the Centers for Medicare & Medicaid Services as part of the Healthcare Cost Report Information System (HCRIS). The HCRIS data was used because it provides the most complete set of data for all hospitals. The actual payments from the relief fund are based on data hospitals are submitting from their most recent tax filings or audited annual financial statements, which are not always publicly available. The individual hospitals in some hospital systems submit separate HCRIS data but may have applied for a relief fund grant as part of a larger hospital system. In those cases, our calculations of the hospital’s total revenues and the amount received from the relief fund would be based on that individual’s hospitals data and not the data for the larger system.

We used the total net patient revenue reported by each hospital to determine the amount of the $50 billion fund that will go to each hospital, using the formula provided by HHS and using a patient revenue denominator of $2.5 Trillion dollars. To analyze revenue from patients with private insurance, we used RAND’s calculation of private insurance revenues, which are not directly reported in the HCRIS data. Private insurance revenue is calculated by starting with total net patient revenues and then subtracting revenues from traditional (fee-for-service) Medicare, Medicare Advantage, Medicaid, SCHIP and state and local and privately funded indigent care programs, and amounts paid by insured patients who qualify for a hospital’s charity care program. Our definition of private insurance revenue therefore includes patient cost sharing from those with private insurance, including balance billing. The formula that HHS used would have included those amounts as part of total net patient revenue and thus they would have been factored into the amount that each provider received.

We used 2017 data because that was the most recent year when relatively complete data was available. Data were not adjusted for inflation, and some hospitals included in the dataset may no longer be operating or may have merged.

Our analysis includes 4,564 hospitals, 3,242 of which are short-term acute care hospitals paid on the inpatient prospective payment system and 1,322 are critical access hospitals. The data excluded other hospitals, such as children’s hospitals, cancer hospitals, psychiatric hospitals, long-term care hospitals, and Veterans Health Administration facilities. Our analysis used data as reported by hospitals, with some corrections from RAND for data that falls far outside the normal range of variation.

We also assumed that the $50 billion was allocated based on total net patient revenue. In fact, that money was allocated through two separate disbursements. The first $30 billion was distributed based on Medicare fee-for-service revenue and the remaining $20 billion was allocated with the intention of having the total $50 billion be distributed based on total net patient revenue. However, it has been reported that some providers have such a high share of Medicare fee-for-service payments that, in order for the $50 billion to be allocated based on total net patient revenue, those providers would have to give back some of the $30 billion based on Medicare fee-for-service. On May 6, HHS updated its Frequently Asked Questions document to clarify that it “does not intend to recoup funds as long as a provider’s lost revenue and increased expenses exceed the amount of Provider Relief funding a provider has received.” We did not account for that lack of recoupment in our analysis.

This work was supported in part by Arnold Ventures. We value our funders. KFF maintains full editorial control over all of its policy analysis, polling, and journalism activities.

Individual Insurance Market Performance in 2019

Authors: Rachel Fehr, Daniel McDermott, and Cynthia Cox
Published: May 13, 2020

Issue Brief

The early years of the Affordable Care Act (ACA) exchanges and broader ACA-compliant individual market were marked by volatility. Markets in some parts of the country have remained fragile, with little competition, an insufficient number of healthy enrollees to balance those who are sick, and high premiums as a result. By 2017, however, the individual market generally had begun to stabilize, and by 2018 insurers in the ACA-compliant market were highly profitable, despite the elimination of cost-sharing subsidy payments and expansion of short-term plans. However, 2019 was the first year that the repeal of the individual mandate penalty went into effect, raising concerns that healthy enrollees would forgo coverage, leaving sicker and more expensive enrollees behind and requiring insurers to increase premiums. Nonetheless, Marketplace premiums fell slightly on average going into 2019, as it became clear that some insurers had raised 2018 rates more than was necessary (and premiums dropped again heading into 2020).

In this brief, we analyze data from 2011 through 2019 to examine how the individual insurance market performed under the ACA and, most recently, without the individual mandate in place. We use financial data reported by insurance companies to the National Association of Insurance Commissioners and compiled by Mark Farrah Associates to look at the average premiums, claims, medical loss ratios, gross margins, and enrollee utilization in the individual insurance market, as well as the amount of medical loss ratio rebates insurers expect to issue to 2019 enrollees. These figures include coverage purchased through the ACA’s exchange marketplaces and ACA-compliant plans purchased directly from insurers outside the marketplaces (which are part of the same risk pool), as well as individual plans originally purchased before the ACA went into effect.

We find that, on average, individual market insurers remained profitable through 2019. Further, despite the absence of the mandate penalty, data indicate that the individual market has not become significantly less healthy. These new data from 2019 offer further evidence that the individual market is stable even without a mandate penalty, though several factors – notably the coronavirus pandemic, economic downturn, and ongoing lawsuit seeking to strike down the ACA – cloud expectations somewhat for the future.

Medical Loss Ratios

As we found in our previous analysis, insurer financial performance as measured by loss ratios (the share of health premiums paid out as claims) worsened in the earliest years of the ACA Marketplaces, but began to improve in recent years. This is to be expected, as the market had just undergone significant regulatory changes in 2014 and insurers had very little information to work with in setting their premiums.

The chart below shows simple loss ratios, which differ from the formula used in the ACA’s MLR provision.1  Loss ratios began to decline in 2016, suggesting improved financial performance. In 2017, following relatively large premium increases, individual market insurers saw significant improvement in loss ratios, a sign that individual market insurers on average were beginning to better match premium revenues to claims costs. Loss ratios continued to decline in 2018, averaging 70%, suggesting that insurers were able to build in the loss of cost-sharing subsidy payments when setting premiums and some insurers over-corrected. With such low ratios, insurers could not justify premium hikes for 2019, and loss ratios rebounded to average 79% in 2019.

Figure 1: Average Individual Market Medical Loss Ratios, 2011 – 2019

Margins

Another way to look at individual market financial performance is to examine average gross margins per member per month, or the average amount by which premium income exceeds claims costs per enrollee in a given month. Gross margins are an indicator of performance, but positive margins do not necessarily translate into profitability since they do not account for administrative expenses.

Figure 2: Average Individual Market Gross Margins Per Member Per Month, 2011 – 2019

Gross margins show a similar pattern to loss ratios. Insurer financial performance improved dramatically through 2018 (increasing to $167 per enrollee, from a recent annual low of -$9 in 2015). Margins fell an average of $44 per member per month from 2018 to 2019, but they remain higher than all other years before 2018. These data suggest that insurers in this market remain financially healthy, on average.

Premiums per enrollee rose slightly in 2019 following steep increases in 2018, while per person claims continued to grow modestly. On average, per member per month premiums grew 4% from 2018 to 2019, and per person claims grew 17%.2 

Figure 3: Average Individual Market Monthly Premiums and Claims Per Person, 2011 – 2019

One concern about the elimination of the individual mandate penalty was whether healthy enrollees would drop out of the market in large numbers. However, the average number of days individual market enrollees spent in a hospital in 2019 was slightly lower than inpatient days in the previous four years.3 

Figure 4: Average Individual Market Monthly Hospital Patient Days Per 1,000 Enrollees, 2011 – 2019

Taken together, these data on claims and utilization suggest that the individual market risk pool is relatively stable, though sicker on average than the pre-ACA market, which is to be expected since people with pre-existing conditions have guaranteed access to coverage under the ACA. Despite concerns that healthier enrollees may be dropping out of the market in recent years, somewhat lower average inpatient days indicate that the individual market did not get sicker, on average, during 2019.

Discussion

Annual results from 2019 suggest that despite the reduction of the individual mandate penalty to $0 the individual insurance market has remained stable. Insurer financial results from 2019 – the first year the repeal of the individual mandate penalty went into effect – reveal yet another favorable year for insurers in the ACA-compliant market. The repeal of the individual mandate penalty and expansion of short-term plans does not appear to have led to a significantly sicker group of enrollees, as hospitalization rates remain stable.

Our recent analysis also finds that individual market insurers expect to pay a record total of nearly $2 billion in rebates to consumers for falling below the ACA medical loss ratio threshold, which requires insurers to spend at least 80% of premium revenues on health care claims or quality improvement activities. This is more than double the amount insurers paid out in rebates last year. In total, across the individual, small group, and large group markets, insurers expect to issue about $2.7 billion in rebates this year based on their 2019 performance, nearly double last year’s previous record high of $1.4 billion.

While markets in some parts of the country have limited insurer participation and high premiums, the individual market on average remains profitable. In the last two years, some insurers have entered the market and others have expanded their footprints, as would be expected in a competitive marketplace. With a continuing legal battle threatening the exchange markets and the ACA as a whole, significant uncertainties remain. While insurers are now locked in to 2020 premiums for ACA-compliant plans, it remains to be seen how continued uncertainty around the coronavirus pandemic, the economic crisis, and the future of the ACA may affect premiums and plan participation in 2021 or beyond.

Methods

We analyzed insurer-reported financial data from Health Coverage Portal TM, a market database maintained by Mark Farrah Associates, which includes information from the National Association of Insurance Commissioners. The dataset analyzed in this report does not include NAIC plans licensed as life insurance or California HMOs regulated by California’s Department of Managed Health Care; in total, the plans in this dataset represent at least 80% of the individual market. All figures in this issue brief are for the individual health insurance market as a whole, which includes major medical insurance plans and mini-med plans sold both on and off exchange. We excluded some plans that filed negative enrollment, premiums, or claims and corrected for plans that did not file “member months” in the annual statement but did file current year membership.

To calculate the weighted average loss ratio across the individual market, we divided the market-wide sum of total incurred claims by the sum of all unadjusted health premiums earned. Medical loss ratios in this analysis are simple loss ratios and do not adjust for quality improvement expenses, taxes, or risk program payments. Gross margins were calculated by subtracting the sum of total incurred claims from the sum of unadjusted health premiums earned and dividing by the total number of member months (average monthly enrollment) in the individual insurance market. Using earned premiums adjusted for taxes and fees to calculate loss ratios and gross margins increases the MLR by 4 percentage points and decreases the gross margin per member by $31 in 2019. On average across all years, using earned premiums adjusted for taxes and fees increases the MLR by 3 percentage points and decreases the gross margin per member by $16.

Endnotes

  1. The loss ratios shown in this issue brief differ from the definition of MLR in the ACA, which makes some adjustments for quality improvement and taxes, and do not account for reinsurance, risk corridors, or risk adjustment payments. Reinsurance payments, in particular, helped offset some losses insurers would have otherwise experienced. However, the ACA’s reinsurance program was temporary, ending in 2016, so loss ratio calculations excluding reinsurance payments are a good indicator of financial stability going forward. ↩︎
  2. Average premiums per member per month increased in 2019, even while average unsubsidized premiums for the lowest-cost plans in each metal tier went down, because average premiums per member per month reflect changes in the age and geographic distribution of enrollees, changes in plans selected by enrollees, and changes in subsidy amounts. ↩︎
  3. Hospital patient days for 2014 are not necessarily representative of the full year because open enrollment was longer that year and a number of exchange enrollees did not begin their coverage until mid-year 2014. ↩︎

Older Adults Are Hit Hard by COVID-19 – and Also Losing Jobs

Authors: Juliette Cubanski, Tricia Neuman, and Wyatt Koma
Published: May 13, 2020

The scale of the economic crisis caused by the coronavirus pandemic just came into clearer view with the release of the latest unemployment numbers, which shows an overall unemployment rate of 14.7% in April, up from 4.4% in March – reflecting an increase of nearly 16 million in the number of unemployed Americans in the last month alone. The unemployment rate is the number of people who are out of a job but actively looking for work as a share of the overall labor force. These unprecedented job losses are being experienced by people across a wide array of occupations and in all age groups.

While the unemployment rate is now highest among people in the youngest age cohort – those ages 16 to 24, where the rate of unemployment is 27.4% – the next highest rate of unemployment is among the oldest age cohort – those ages 65 and older, where the unemployment rate is 15.6%. (Estimates presented here for people ages 55-64 and 65 and older are not seasonally adjusted, because the Bureau of Labor Statistics does not calculate seasonal adjustments for these age cohorts; estimates for younger age cohorts are seasonally adjusted.)

The unemployment rate among people age 65 and older quadrupled between March and April 2020 from 3.7% to 15.6% (Figure 1). By comparison, the overall unemployment rate tripled from 4.4% to 14.7%. From March to April, 1.2 million adults age 65 and older lost jobs, as did another 2.4 million people ages 55 to 64. Altogether, people 55 and older account for just under one fourth of all Americans who lost their jobs in April, which is proportional to their share of the workforce. More than 1 in 5 of the nearly 23 million Americans who are now unemployed are older adults (55+).

Figure 1: The Unemployment Rate among People Age 65 and Older Quadrupled Between March and April 2020

This surge in unemployment reverses years of steadily declining unemployment rates among adults of all ages. And in fact, more adults have continued to work into their older years over time, with labor force participation rates increasing more rapidly for those aged 55 and over, and particularly for those ages 65 and over, than for younger age cohorts. But now, with millions of older adults suffering job losses due to the economic downturn caused by the COVID-19 pandemic, they may be forced to dip into retirement savings or claim Social Security benefits before their full retirement age, resulting in lower payments permanently and undermining their future economic security.

Another major challenge is that people who lose their jobs often lose health insurance. Losing coverage in the midst of a pandemic is especially troublesome, particularly for those who may become seriously ill if they are infected with the coronavirus – which is more likely among older adults. Older adults ages 55-64 may be able to purchase COBRA from a former employer, purchase coverage in the marketplace, or enroll in Medicaid, depending on their individual circumstances. People ages 65 and older who lose employer-sponsored health insurance along with their jobs can enroll in Medicare if they had deferred enrollment while they continued to work, but this is not an option for younger adults.

Overall, these grim unemployment statistics reinforce the fact that the coronavirus pandemic is not just a major public health challenge, but also a threat to economic and retirement security for millions of older adults as well.

News Release

As Unemployment Skyrockets, KFF Estimates More than 20 Million People Losing Job-Based Health Coverage Will Become Eligible for ACA Coverage through Medicaid or Marketplace Tax Credits

Nearly Six Million Are Not Eligible and Will Have to Pay the Full Cost of Coverage, and Many Could End Up Uninsured

Published: May 13, 2020

Coverage Losses Will Affect At Least a Million Residents in Each of Eight States: California, Texas, Pennsylvania, New York, Georgia, Florida, Michigan and Ohio

With more than 31 million workers filing unemployment claims between March 1 and May 2 as the coronavirus crisis hit the nation’s economy, a new KFF analysis estimates 26.8 million people across the country would become uninsured due to loss of job-based health coverage if they don’t sign up for other coverage.

While most are eligible for coverage under the Affordable Care Act (ACA), not all will take it up. In addition, 5.7 million are not eligible for help under the ACA and would have to pay the full cost of their coverage, and many of them will likely remain uninsured.

The analysis estimates that, based on their incomes and other factors, most (79%) who lost employer coverage and became uninsured are likely eligible for subsidized coverage, either through Medicaid (12.7 million) or through the ACA’s marketplaces (8.4 million).

Overall, nearly 78 million people live in a family experiencing job loss since March 1. Some already have coverage from a source besides the previous employer, which they would retain, or could switch to coverage offered by their spouse’s employer or, for young adults, through parents.

At first, a small number (150,000) who live in states that have not expanded their Medicaid programs to cover low-income childless adults would fall into a “coverage gap,” ineligible for Medicaid but with incomes too low to qualify for tax credits to help with marketplace premiums. The analysis projects that this group would grow to 1.9 million by January 2021 when workers’ unemployment benefits expire, dropping their incomes below the threshold to qualify for tax credits.

“Unlike in past recessions, most of those who lose their job-based coverage will be eligible for health coverage because of the Affordable Care Act, though some may find coverage unaffordable even with subsidies,” Executive Vice President for Health Policy Larry Levitt said. “As unemployment benefits expire, however, about two million more people in states that did not expand their Medicaid programs under the ACA will move into the Medicaid coverage gap and have no affordable option.”

Eight states have at least a million affected residents and account for nearly half of all people losing employer coverage and becoming uninsured: California (3.4 million), Texas (1.6 million), Pennsylvania (1.5 million), New York (1.5 million), Georgia (1.4 million), Florida (1.4 million), Michigan (1.2 million) and Ohio (1 million). These are all large states with many workers in hard-hit industries that often provide health benefits.

The analysis reflects workers’ incomes while working and while employed, family status, and state of residence. It takes into account workers’ expected unemployment benefits, including the $600 per week additional federal supplement available through the end of July.

Other findings include:

  • The analysis estimates 6.1 million children are losing employer coverage, though the vast majority (5.5 million) are eligible for Medicaid or the Children’s Health Insurance Program in their states. These programs generally cover children at higher-income levels than adults.
  • As Congress continues to debate aid to states, the analysis estimates about 16.8 million people who lost employer coverage will be eligible for Medicaid by January 2021, placing a potential strain on state budgets and provider capacity.

Eligibility for ACA Health Coverage Following Job Loss

Authors: Rachel Garfield, Gary Claxton, Anthony Damico, and Larry Levitt
Published: May 13, 2020

Data Note

The economic consequences of the coronavirus pandemic have led to historic levels of job loss in the United States. Social distancing policies required to address the crisis have led many businesses to cut hours, cease operations, or close altogether. Between March 1st and May 2nd, 2020, more than 31 million people had filed for unemployment insurance. Actual loss of jobs and income are likely even higher, as some people may be only marginally employed or may not have filed for benefits. Some of these unemployed workers may go back to work as social distancing curbs are relaxed, though further job loss is also possible if the economic downturn continues or deepens.

In addition to loss of income, job loss carries the risk of loss of health insurance for people who were receiving health coverage as a benefit through their employer. People who lose employer-sponsored insurance (ESI) often can elect to continue it for a period by paying the full premium (called COBRA continuation) or may become eligible for Medicaid or subsidized coverage through the Affordable Care Act (ACA) marketplaces. Over time, as unemployment benefits end, some may fall into the “coverage gap” that exists in states that have not expanded Medicaid under the ACA.

In this analysis, we examine the potential loss of ESI among people in families where someone lost employment between March 1st, 2020 and May 2nd, 2020 and estimate their eligibility for ACA coverage, including Medicaid and marketplace subsidies, as well as private coverage as a dependent (see detailed Methods at the end of this brief). To illustrate eligibility as their state and federal unemployment insurance (UI) benefits cease, we show eligibility for this population as of May 2020 and January 2021, when most will have exhausted their UI benefits.

What are coverage options for people losing ESI?

Eligibility for health coverage for people who lose ESI depends on many factors, including income while working and family income while unemployed, state of residence, and family status. Some people may be ineligible for coverage options, and others may be eligible but opt not to enroll. Some employers may temporarily continue coverage after job loss (for example, through the end of the month), but such extensions of coverage are typically limited to short periods.

Medicaid: Some people who lose their jobs and health coverage—especially those who live in states that expanded Medicaid under the ACA— may become newly eligible1  for Medicaid if their income falls below state eligibility limits (138% of poverty in states that expanded under the ACA). For Medicaid eligibility, income is calculated based on other income in the family plus any state unemployment benefit received (though the $600 per week federal supplemental payment available through the end of July is excluded). Income is determined on a current basis, so prior wages for workers recently unemployed are not relevant. In states that have not expanded Medicaid under the ACA, eligibility is generally limited to parents with very low incomes (typically below 50% of poverty and in some states quite a bit less); thus many adults may fall into the “coverage gap” that exists for those with incomes above Medicaid limits but below poverty (which is the minimum eligibility threshold for marketplace subsidies under the ACA). Undocumented immigrants are ineligible for Medicaid, and recent immigrants (those here for fewer than five years) are ineligible in most cases.

Marketplace: ACA marketplace coverage is available to legal residents who are not eligible for Medicaid and do not have an affordable offer of ESI; subsidies for marketplace coverage are available to people with family income between 100% and 400% of poverty. Some people who lose ESI may be newly-eligible for income-based subsidies, based on other family income plus any state and new federal unemployment benefit received (including the $600 per week federal supplement, unlike for Medicaid).2  While current income is used for Medicaid eligibility, annual income for the calendar year is used for marketplace subsidy eligibility. Advance subsidies are available based on estimated annual income, but the subsidies are reconciled based on actual income on the tax return filed the following year. People who lose ESI due to job loss qualify for a special enrollment period (SEP) for marketplace coverage.3  As with Medicaid, undocumented immigrants are ineligible for marketplace coverage or subsidies. However, recent immigrants, including those whose income makes them otherwise eligible for Medicaid, can receive marketplace subsidies.

ESI Dependent Coverage: People who lose jobs may be eligible for ESI as a dependent under a spouse or parent’s job-based coverage. Some people may have been covered as a dependent prior to job loss, and some may switch from their own coverage to coverage as a dependent.

COBRA: Many people who lose their job-based insurance can continue that coverage through COBRA, although it is typically quite expensive since unemployed workers generally have to pay the entire premium – employer premiums average $7,188 for a single person and $20,576 for a family of four – plus an additional 2%. People who are eligible for subsidized coverage through Medicaid or the marketplaces are likely to opt for that coverage over COBRA, though COBRA may be the only option available to some people who are income-ineligible for ACA coverage.

Short-term plans: Short-term plans, which can be offered for up to a year and can sometimes be renewed under revised rules from the Trump administration, are also a potential option for people losing their employer-sponsored insurance. These plans generally carry lower premiums than COBRA or ACA-compliant coverage, as they often provide more limited benefits and usually deny coverage to people with pre-existing conditions. Even when coverage is issued, insurers generally may challenge benefit claims that they believe resulted from pre-existing medical problems; given the long latency between initial infection and sickness with COVID-19, these plans are riskier than usual during the current pandemic. People cannot use ACA subsidies toward short-term plan premiums.

Our analysis examines eligibility for Medicaid, marketplace subsidies, and dependent ESI coverage. We do not estimate enrollment in COBRA, short-term plans, or temporary continuation of ESI. See Methods for more details.

How does coverage and eligibility change following job loss?

Between March 1st, 2020 and May 2nd, 2020, we estimate that nearly 78 million people lived in a family in which someone lost a job. Most people in these families (61%, or 47.5 million) were covered by ESI prior to job loss. Nearly one in five (17%) had Medicaid, and close to one in ten (9%) were uninsured. The remaining share either had direct purchase (marketplace) coverage (7%) or had other coverage such as Medicare or military coverage (6%) (Figure 1).

Figure 1: Health Insurance Coverage Before and After Job Loss Among People in a Family Experiencing Job Loss as of May 2, 2020

We estimate that, as of May 2nd, 2020, nearly 27 million people could potentially lose ESI and become uninsured following job loss (Figure 1). This total includes people who lost their own ESI and those who lost dependent coverage when a family member lost a job and ESI. Additionally, some people who otherwise would lose ESI are able to retain job-based coverage by switching to a plan offered to a family member: we estimate that 19 million people switch to coverage offered by the employer of a working spouse or parent. A very small number of people who lose ESI (1.6 million) also had another source of coverage at the same time (such as Medicare) and retain that other coverage. These coverage loss estimates are based on our assumptions about who likely filed for UI as of May 2nd, 2020 and the availability of other ESI options in their family (see Methods for more detail).

Among people who become uninsured after job loss, we estimate that nearly half (12.7 million) are eligible for Medicaid, and an additional 8.4 million are eligible for marketplace subsidies, as of May 2020 (Figure 2). In total, 79% of those losing ESI and becoming uninsured are eligible for publicly-subsidized coverage in May. Approximately 5.7 million people who lose ESI due to job loss are not eligible for subsidized coverage, including almost 150,000 people who fall into the coverage gap, 3.7 million people ineligible due to family income being above eligibility limits, 1.3 million people who we estimate have an affordable offer of ESI through another working family member, and about 530,000 people who do not meet citizenship or immigration requirements. We project that very few people fall into the coverage gap immediately after job loss (as of May 2020) because wages before job loss plus unemployment benefits (including the temporary $600 per week federal supplement added by Congress) push annual income for many unemployed workers in non-expansion states above the poverty level, making them eligibility for ACA marketplace subsidies for the rest of the calendar year.

Figure 2: Eligibility for ACA Coverage Among People Becoming Uninsured Due to Loss of Employer-Sponsored Insurance

By January 2021, when UI benefits cease for most people, we estimate that eligibility shifts to nearly 17 million being eligible for Medicaid and about 6 million being eligible for marketplace subsidies (Figure 2), assuming those who are recently unemployed have not found work. Many unemployed workers who are eligible for ACA marketplace subsidies during 2020 would instead be eligible for Medicaid or fall into the coverage gap during 2021. The number in the coverage gap grows to 1.9 million (an increase of more than 80% of its previous size), and the number ineligible for coverage due to income shrinks to 0.9 million.

Estimates of coverage loss and eligibility vary by state, depending largely on underlying state employment by industry and Medicaid expansion status. Not surprisingly, states in which the largest number of people are estimated to lose ESI are large states with many people working in affected industries (Appendix Table 1). Eight states (California, Texas, Pennsylvania, New York, Georgia, Florida, Michigan, and Ohio) account for just under half (49%) of all people who lose ESI. Five of the top eight states have expanded Medicaid, and people eligible for Medicaid among the potentially newly uninsured as of May 2020 in these five states account for 40% of all people in that group nationally. Overall, patterns by state Medicaid expansion status show that people in expansion states are much more likely to be eligible for Medicaid, while those in non-expansion states are more likely to qualify for marketplace subsidies (Figure 3). However, the number of people qualifying for marketplace subsidies is similar across the two sets of states, as more people live in expansion states. Three states that have not expanded Medicaid, including Texas, Georgia, and Florida, account for 30% of people who become marketplace tax credit eligible nationally in May 2020. Assuming unemployment extends into 2021 when UI benefits would likely expire for most families, the proportion eligible for Medicaid would increase in expansion states while non-expansion states may see more nonelderly adults moving into the Medicaid coverage gap (Figure 4; Appendix Table 2).

Figure 3: May 2020 Eligibility for ACA Coverage among People Becoming Uninsured Due to Loss of Employer-Sponsored Insurance, by State Medicaid Expansion Status
Figure 4: January 2021 Eligibility for ACA Coverage among People Becoming Uninsured Due to Loss of Employer-Sponsored Insurance, by State Medicaid Expansion Status

Nearly 7 million people losing ESI and becoming uninsured are children, and the vast majority of them are eligible for coverage through Medicaid or CHIP. Within the 26.8 million people losing ESI and becoming uninsured in May 2020, 6.1 million are children. Because Medicaid/CHIP income eligibility limits for children are generally higher than they are for adults, the vast majority of these children are eligible for Medicaid/CHIP in May 2020 (5.5 million, or 89%) or January 2021 (5.8 million, or 95%).

Discussion

Given the health risks facing all Americans right now, access to health coverage after loss of employment provides important protection against catastrophic health costs and facilitates access to needed care. Unemployment Insurance filings continue to climb each week, and it is likely that people will continue to lose employment and accompanying ESI for some time, though some of them will return to work as social distancing curbs are loosened. The ACA expanded coverage options available to people, and we estimate that the vast majority of people who lose ESI due to job loss will be eligible for ACA assistance either through Medicaid or subsidized marketplace coverage. However, some people will fall outside the reach of the ACA, particularly in January 2021 when UI benefits cease for many and some adults fall into the Medicaid coverage gap due to state decisions not to expand coverage under the ACA.

Both ACA marketplace subsidies and Medicaid are counter-cyclical programs, expanding during economic downturns as people’s incomes fall. In return for additional federal funding to help states finance their share of Medicaid cost during the public health crisis, states must maintain eligibility standards and procedures that were in effect on January 1, 2020 and must provide continuous eligibility through the end of the public health emergency, among other requirements. These provisions may help eligible individuals enroll in and maintain Medicaid, particularly in light of state and federal actions prior to the crisis to increase eligibility verification requirements or transition people off Medicaid.

Our estimates only examine eligibility among people who lost ESI due to job loss and potentially became uninsured. Additional uninsured individuals—including some of the 9% of the 78 million individuals in families where someone lost employment—may also be eligible for Medicaid or subsidized coverage. It is possible that contact with state UI systems may lead them to seek and enroll in coverage, even if they were eligible for financial assistance before job loss but uninsured.

It is unclear whether people losing ESI and becoming uninsured will enroll in new coverage. We did not estimate take-up or enrollment in coverage options but rather only looked at eligibility for coverage. Even before the coronavirus crisis, there were millions of people eligible for Medicaid or marketplace subsidies who were uninsured. Eligible people may not know about coverage options and may not seek coverage; others may apply for coverage but face challenges in navigating the application and enrollment process. Still others may find marketplace coverage, in particular, unaffordable even with subsidies. As policymakers consider additional efforts to aid people, expanding outreach and enrollment assistance, which have been reduced dramatically by the Trump Administration, could help people maintain coverage as they lose jobs.

This is the first economic downturn during which the ACA will be in place as a safety net for people losing their jobs and health insurance. The Trump Administration is arguing in case before the Supreme Court that the ACA should be overturned; a decision is expected by next Spring. The ACA has gaps, and for many the coverage may be unaffordable. However, without it, many more people would likely end up uninsured as the U.S. heads into a recession.

Appendix

Appendix Table 1: May 2020 Eligibility for Coverage Among People Becoming Uninsured due to Job Loss
StateTotal Uninsured Due to ESI LossMedicaid EligibleCoverage GapTax Credit EligibleIneligible for Financial Assistance due to Income, ESI Offer, or Citizenship
US Total26,789,00012,735,000149,0008,350,0005,555,000
Alabama425,000107,00014,000246,00057,000
Alaska58,00041,0009,0007,000
Arizona452,000314,00073,00066,000
Arkansas169,00095,00047,00028,000
California3,427,0002,068,000701,000659,000
Colorado299,000149,00073,00077,000
Connecticut247,000135,00047,00065,000
Delaware76,00046,00015,00014,000
DC55,00047,0001,0007,000
Florida1,418,000301,00034,000835,000248,000
Georgia1,444,000376,00024,000775,000268,000
Hawaii200,000104,00063,00033,000
Idaho113,00066,00029,00018,000
Illinois846,000469,000199,000178,000
Indiana606,000386,000126,00094,000
Iowa251,000127,00076,00049,000
Kansas230,00060,0003,000121,00046,000
Kentucky598,000330,000166,000102,000
Louisiana450,000335,00063,00052,000
Maine99,00050,00030,00019,000
Maryland369,000220,00072,00078,000
Massachusetts621,000277,00089,000255,000
Michigan1,211,000774,000219,000218,000
Minnesota535,000264,00079,000192,000
Mississippi218,00054,0006,000130,00028,000
Missouri480,000125,00010,000269,00076,000
Montana71,00041,00018,00013,000
Nebraska101,00056,00028,00016,000
Nevada434,000254,00085,00095,000
New Hampshire144,00084,00031,00029,000
New Jersey883,000456,000152,000274,000
New Mexico100,00059,00023,00017,000
New York1,471,000880,000291,000300,000
North Carolina723,000167,00013,000408,000134,000
North Dakota53,00023,00016,00014,000
Ohio1,002,000531,000267,000204,000
Oklahoma310,00075,0005,000177,00053,000
Oregon276,000143,00076,00058,000
Pennsylvania1,543,000836,000341,000366,000
Rhode Island134,00075,00021,00038,000
South Carolina403,000111,0005,000225,00062,000
South Dakota32,0008,00017,0007,000
Tennessee417,000136,0004,000210,00067,000
Texas1,608,000328,00030,000881,000370,000
Utah162,00092,00045,00024,000
Vermont48,00026,00012,00010,000
Virginia533,000306,000125,000102,000
Washington835,000426,000150,000259,000
West Virginia130,00082,00029,00018,000
Wisconsin446,000214,000150,00082,000
Wyoming31,0008,0001,00016,0007,000
NOTES: Medicaid eligible includes people eligible for other public coverage. Totals may not sum due to rounding.SOURCE: KFF. See Methods for more details. 
Appendix Table 2: January 2021 Eligibility for Coverage Among People Becoming Uninsured due to Job Loss
StateTotal Uninsured Due to ESI LossMedicaid EligibleCoverage GapTax Credit EligibleIneligible for Financial Assistance due to Income, ESI Offer, or Citizenship
US Total26,789,00016,791,0001,924,0006,184,0001,890,000
Alabama425,000151,000115,000138,00021,000
Alaska58,00045,00010,0003,000
Arizona452,000332,00091,00030,000
Arkansas169,000118,00041,00010,000
California3,427,0002,541,000597,000289,000
Colorado299,000217,00057,00026,000
Connecticut247,000175,00047,00025,000
Delaware76,00054,00017,0005,000
DC55,00050,0002,0003,000
Florida1,418,000418,000351,000528,000120,000
Georgia1,444,000545,000398,000408,00094,000
Hawaii200,000145,00039,00016,000
Idaho113,00084,00023,0006,000
Illinois846,000619,000161,00066,000
Indiana606,000455,000121,00031,000
Iowa251,000182,00057,00012,000
Kansas230,00088,00052,00075,00016,000
Kentucky598,000454,000117,00026,000
Louisiana450,000353,00078,00020,000
Maine99,00068,00026,0004,000
Maryland369,000268,00068,00033,000
Massachusetts621,000456,000102,00063,000
Michigan1,211,000933,000218,00061,000
Minnesota535,000394,000107,00034,000
Mississippi218,00077,00058,00075,0008,000
Missouri480,000166,000119,000168,00027,000
Montana71,00055,00014,0003,000
Nebraska101,00072,00023,0006,000
Nevada434,000331,00064,00039,000
New Hampshire144,000109,00027,0008,000
New Jersey883,000647,000153,00082,000
New Mexico100,00074,00020,0005,000
New York1,471,0001,112,000258,000101,000
North Carolina723,000233,000178,000261,00052,000
North Dakota53,00037,00013,0003,000
Ohio1,002,000738,000211,00053,000
Oklahoma310,000114,00074,000103,00019,000
Oregon276,000203,00053,00020,000
Pennsylvania1,543,0001,161,000295,00087,000
Rhode Island134,00098,00026,00010,000
South Carolina403,000139,00099,000141,00024,000
South Dakota32,00011,0007,00012,0002,000
Tennessee417,000149,00086,000157,00025,000
Texas1,608,000540,000382,000530,000157,000
Utah162,000123,00029,00010,000
Vermont48,00034,00012,0002,000
Virginia533,000382,000110,00042,000
Washington835,000637,000140,00058,000
West Virginia130,00098,00027,0005,000
Wisconsin446,000296,000124,00026,000
Wyoming31,00013,0006,00010,0002,000
NOTES: Medicaid eligible includes people eligible for other public coverage. Totals may not sum due to rounding.SOURCE: KFF. See Methods for more details.

Methods

Methods and Definitions

This analysis uses our ACA eligibility model as applied to the 2018 American Community Survey as a baseline for all calculations. We rely on these calculations to assess the ACA eligibility of a cohort of workers prior to the pandemic (early 2020), during the pandemic (mid-2020), and in the following calendar year (early 2021).   Assessing both insurance coverage changes and ACA eligibility at three time points might help policymakers understand both the immediate coverage needs of the population losing jobs due to the pandemic and the longer-term eligibility of the same population assuming they continue without wages into 2021.

In order to estimate the 2020 population within each state, we linearly extrapolated 2020 state population estimates based on 2018 and 2019 population estimates from the U.S. Census Bureau to determine a population increase factor between 2018 and 2020 within each state. We then applied this multiplier to the weight of each individual in the microdata to approximate state population sizes in mid-2020 rather than mid-2018.   With the exception of this population multiplier, our baseline estimates (described in this brief as “May 2020”) align with other Kaiser Family Foundation products such as our ACA eligibility estimates of the uninsured population.

We summed initial unemployment insurance claims filed across the weeks ending March 7th, 2020 thru May 2nd, 2020 using the Department of Labor’s Employment & Training Administration state-specific statistics to arrive at a nationwide total job loss through early May of approximately 31 million workers. We also assumed unauthorized immigrants in the labor force lost employment proportionally without filing for unemployment. We did not make assumptions about other people losing jobs but not filing for unemployment insurance.

Within each state, we estimated who lost employment using sampling probabilities based on recent labor force changes by industry recorded by the March 2020 Current Population Survey.   For example, leisure and hospitality workers appear more than five times as likely as agricultural workers to have lost a job in March 2020, and these relative probabilities guided sampling of who has become unemployed. We controlled to state unemployment totals (approximately 31 million nationally) for the citizen and legally-present immigrant population, and we separately controlled to state proportional unauthorized labor force unemployment estimate for the undocumented working population.

The American Community Survey does not distinguish between ESI policyholders and those covered as dependents. For all full-time workers losing jobs in our sample, we assumed a family-wide loss of ESI for all people who held ESI if there were no other workers present who both worked at least 30 hour weeks and earned at least $50,000 during the year. If a spouse with wage of at least $50,000 and weekly average hours over 30 were present within the family, we assumed the spouse held the policy (or another policy) and maintained ESI for the entire family.   For part-time workers losing jobs, we assumed a family-wide loss of ESI only when no other workers were present within the family.

We calculated an industry-specific distribution of weekly state unemployment benefit payments from the 2019 Current Population Survey. We then applied a weekly state dollar amount onto most individuals who lost employment according to a random deviate sample using a gamma distribution. After adding unemployment benefit payments onto family income of those imputed to lose jobs, we then scaled each individual weekly payment to account for state-specific generosity using the Department of Labor’s 2018Q4 “Benefits Paid for Total Unemployment divided by Weeks Compensated for Total Unemployment” state-specific estimate divided by the nationwide average of $361.29. This nationwide weekly average amount matched our CPS-based calculated average.   For any individuals imputed to receive a higher weekly state unemployment payment than the state maximum, we capped the imputed amount at the state maximum.

Medicaid eligibility is based on current monthly income. To calculate Medicaid eligibility immediately after job loss, we zeroed out wage and self-employment income for people who lost jobs and calculated monthly family income as a share of poverty based on other family income and the state weekly unemployment benefit.   Following Medicaid eligibility policy, we did not include the Federal weekly supplemental unemployment payments of $600 in the Medicaid eligibility determination.

ACA marketplace subsidy eligibility is based on estimated annual income. To calculate ACA Marketplace subsidy eligibility immediately after job loss, we removed a share of annualized wages and self-employment income in proportion to the calendar week of job loss. For example, calendar year earned income for individuals imputed to lose jobs during the week of March 7th, 2020 were reduced by 75%.   We also counted the receipt of Federal supplemental unemployment insurance payments of $600 for 17 weeks and multiplied the same imputed weekly state unemployment benefit by the maximum allowable weeks.

To re-calculate both Medicaid and ACA Marketplace subsidy eligibility for 2021, we assumed an exhaustion of both the state and Federal unemployment benefit amounts, no return to work among job losers, and counted only other income in the family.

Although our job loss imputation only edited the earned income and public assistance income of the individual worker, that worker’s income changes affect the Medicaid and marketplace tax credit eligibility of family members. Therefore, many statistics throughout this brief present the eligibility dynamics of Americans with any job loss in their family rather than solely the worker.

Medicaid/Other Public Eligible: Includes adults and children who were previously eligible for Medicaid and the Children’s Health Insurance Program (CHIP) but not enrolled as well as those newly eligible after job loss. Also includes some state-funded programs for immigrants otherwise ineligible for Medicaid.

Tax Credit Eligible: Includes individuals who are not eligible for other coverage, such as Medicaid or Employer-Sponsored Insurance (ESI), and who have incomes between 100% and 400% of the federal poverty level (FPL). This number also includes legally residing immigrants with incomes below the poverty level who do not qualify for Medicaid because they have lived in the U.S. for less than five years. Tax credit-eligible population in Minnesota and New York include uninsured adults who are eligible for coverage through the Basic Health Plan.

Ineligible for Financial Assistance due to Income, ESI Offer, or Citizenship: Includes individuals with incomes above 400% FPL and those with an offer of coverage from an employer (though we cannot determine whether the offer of ESI would be considered affordable under the ACA, which would make the individual ineligible for a premium tax credit). This number also includes undocumented immigrants who are barred from purchasing coverage through the Marketplace even without financial assistance.

In the Coverage Gap: Includes uninsured adults in states that have not expanded Medicaid and have incomes above the state’s Medicaid eligibility level (which, in many cases, is 0% FPL for adults without dependent children) but below the poverty, leading them to earn too much to qualify for Medicaid but not enough to qualify for tax credits. Adults in the coverage gap would be eligible for Medicaid if their state expanded under the ACA.

Endnotes

  1. Medicaid already covers many workers, and Medicaid beneficiaries who lose their jobs and income will retain their Medicaid coverage, as there is no lower floor on income eligibility for Medicaid. ↩︎
  2. Notably, eligibility for marketplace subsidies (but not Medicaid) includes the new federal supplemental unemployment insurance benefits recently enacted by Congress for people affected by COVID-19. This supplemental benefit could lead some unemployed low-wage workers who previously were in the “coverage gap” (income below poverty but above state Medicaid limits) to have income above poverty, making them newly eligible for Marketplace subsidies. ↩︎
  3. People who were uninsured while working may be able to enroll in marketplace coverage if they live in a state with a state-run marketplace, most of which have re-opened enrollment to allow residents to obtain marketplace coverage if eligible. However, people who were uninsured while working and live in one of the 32 states that use the federal marketplace do not qualify for a “special enrollment period” to enroll in coverage through the federal marketplace. ↩︎

How Can Lessons from Medicaid Help Connect People to Unemployment Insurance?

Authors: Bradley Corallo and Samantha Artiga
Published: May 12, 2020

Introduction

Millions of people are losing jobs due to the coronavirus pandemic and seeking financial assistance through Unemployment Insurance (UI) programs. While UI can provide an important source of temporary assistance for many people losing jobs, there have been reports of major challenges accessing UI benefits. Although many of these challenges stem from the inability of outdated systems to handle the large influx of applications, people may also face other challenges accessing benefits, such as lack of awareness of eligibility and difficulty completing the application and enrollment process, including providing required documentation. Over time, states have significantly streamlined Medicaid and the Children’s Health Insurance Program (CHIP) application and enrollment processes to overcome many similar challenges to connect eligible people to health insurance coverage. As such, previous experience enrolling individuals into Medicaid and CHIP can provide lessons learned that could help inform efforts to connect people to UI. This brief summarizes some key lessons learned and discusses how states could potentially apply these lessons to UI.

Unemployment Insurance

UI is a federal-state system that helps many people who have lost their jobs by temporarily replacing part of their wages while they seek work. States administer the program, within broad federal guidelines under oversight provided by the Department of Labor. To qualify for UI, a person must have lost a job through no fault of his or her own; be able to work, available to work, and actively seeking work; and have earned at least a certain amount of money during a base period prior to becoming unemployed. Within these broad requirements, states have substantial flexibility to establish eligibility criteria and benefit levels. The Coronavirus Aid, Relief, and Economic Security Act (CARES) expanded UI eligibility and benefits. It provides a $600 weekly federal supplement (available through July 31) to state unemployment benefits and extends the period for receiving unemployment benefits by up to 13 weeks. The Act also extends benefits to many types of workers (e.g., self-employed) who are not eligible for unemployment benefits under state laws.

Over half (55%) of working adults have lost a job or income due to the coronavirus pandemic, and a record 33 million people filed for UI between mid-March and April 25, 2020. However, reports describe UI application processing systems lacking capacity to process the recent surge in UI applications, leading to crashed websites and jammed phone lines, as well as delays in updates to UI systems to reflect the expanded eligibility and benefits provided under the CARES Act. Beyond systems-related problems, individuals may face other challenges accessing UI. For example, individuals may not know they are eligible for UI, particularly if they are not aware of the eligibility expansions under the CARES Act. Individuals also may have difficulty completing the UI application and providing necessary documentation, and there may be high demand for enrollment assistance since many people may be applying for UI for the first time and most will be applying from home due to social distancing policies. A recent survey finds that for every ten people who said they successfully filed for UI during the previous for weeks, three to four additional people tried to apply but could not get through the system to make a claim and two additional people did not try to apply because it was too difficult to do so.

Lessons from Medicaid and CHIP

States have taken an array of actions to help connect eligible people to Medicaid and CHIP coverage that may help inform efforts to connect people to UI. After the passage of CHIP, many states streamlined enrollment processes and conducted outreach and enrollment campaigns to promote enrollment of eligible children. The Affordable Care Act expanded coverage and built on previous state experience with CHIP by establishing streamlined and modernized enrollment processes across all states. Further, some states are taking additional steps to streamline Medicaid and CHIP enrollment in response to COVID-19.

Outreach and Enrollment Assistance

Previous Medicaid and CHIP experience showed that outreach and enrollment assistance were instrumental for making people aware of coverage options and helping them apply. Following implementation of the ACA, federal and state mass marketing campaigns helped raise awareness of coverage options. In addition, one-on-one assistance provided through trusted individuals was key to helping eligible individuals enroll. The federal government and states funded navigators and enrollment assistors to help individuals enroll. Many of these navigators and assisters were associated with community-based organizations. Utilizing trusted individuals within the community to provide outreach and enrollment assistance was particularly important for connecting with harder-to-reach populations and those who need more assistance, including individuals with limited English proficiency.

Outreach and enrollment assistance could be similarly helpful to connect eligible people to UI. This experience suggests that broad marketing campaigns could help raise awareness of expanded UI assistance. Further, it points to the importance of increasing the availability of assistance as demand for UI grows, especially phone-based or online assistance since most people will be applying from home. It also suggests that states may want to explore how they can work with community-based organizations to share information about eligibility for UI and provide enrollment assistance.

Streamlined Enrollment Processes

The ACA established streamlined eligibility and enrollment processes across all states. For example, it eliminated certain requirements, such as face-to-face interviews and asset tests for most groups. It also required states to provide multiple application options, including online, phone, mail, or in-person, and to use available data to verify information when possible. States have additional options to facilitate enrollment, including shortening and simplifying applications, relying on self-attestation of eligibility criteria when possible, and providing presumptive eligibility to individuals while the state completes processing of their application. Some states are taking additional steps to facilitate enrollment of eligible people in response to the COVID-19 outbreak, including further shortening applications, allowing for self-attestation of additional eligibility criteria, and expanding use of presumptive eligibility.

UI programs could draw on these state experiences by simplifying application and eligibility determination processes. UI programs typically require applicants to file claims with documents showing income eligibility (e.g., having a minimum amount of earnings for a number of weeks employed prior to filing) as well as non-monetary eligibility (including the reason for separating from work, availability for work, immigration documents, and/or forms for some jobs where the employers are exempt from paying into the UI program). Some states require a one-week waiting period to receive benefits, meaning that the second week claimed is the first week of payment. After being determined eligible for benefits, individuals will file continuing claims generally every 1-2 weeks, depending on the state, to document that the individual is still searching for work, among other requirements. Previous Medicaid and CHIP experience suggests that states could help facilitate access to UI by reducing these requirements. For example, a number of states have waived the one-week waiting period for benefits and waived or relaxed work search requirements. States could also explore options to shorten and simplify the application for benefits and expand use of self-attestation of eligibility criteria. States also could explore similar presumptive eligibility policies as Medicaid and CHIP to make an initial determination of eligibility and begin paying benefits based on limited information while they work through backlogs to complete verification and review of claims.

Coordination or Integration with Other Programs

All state systems coordinate enrollment in Medicaid, CHIP, and the Marketplace coverage, and many states coordinate Medicaid and CHIP enrollment with non-health programs. In half of states, individuals can use a single application to apply for Medicaid and other programs, such as food or cash assistance, and most of these states process eligibility determinations for these programs through a single system. In states that do not have an integrated application or system, eligibility workers can still refer people to apply for other programs. This integration and coordination helps facilitate access to across programs for eligible individuals.

UI programs could coordinate or integrate enrollment with other programs. Most state UI programs coordinate with other workforce programs, such as job training or placement agencies, but the extent to which UI is coordinated with other assistance programs is unclear. Broader coordination across programs and agencies could facilitate access to UI as well as other assistance programs. For example, states could take action to ensure revenue agencies can share 1099 tax filing information with UI programs to facilitate processing of applications for independent contractors and self-employed workers, who became newly eligible under the CARES Act. Coordination between UI and Medicaid, as well as the Affordable Care Act marketplaces, could be particularly helpful in facilitating access to coverage since many people losing job-based insurance will be eligible under those programs based on their UI benefits.

System Upgrades

Nearly all states have upgraded or replaced their Medicaid eligibility systems to implement the new processes established under the ACA. The ACA provided states enhanced federal funding to support eligibility system upgrades. It took many states years to upgrade or build new systems, and many are still refining and improving them. Medicaid and CHIP system upgrades have increasingly enabled states to use automated enrollment processes that rely on electronic data matches with other data sources, allowing eligible individuals to connect to coverage quickly and easily and reducing administrative burdens on states. Most states report that system upgrades and modernized processes have contributed to improvements in eligibility and enrollment operations compared to before the ACA.

System upgrades could help address the significant challenges many people are facing accessing UI benefits, especially since a number of states are still relying on outdated systems, but it will require significant time and investment to implement upgrades.  In the interim, some states are gating access to systems, for example, by only allowing applicants to file on certain days based on the first letter of their last name. Waiving or reducing requirements to document work search activities may also reduce stress on systems. Some states have also redirected resources and staff to process applications. State UI programs have received federal grants to upgrade systems, but not a sustained federal match for costs.

Conclusion

UI offers an important source of temporary assistance to help people losing jobs as a result of the COVID-19 outbreak. The CARES Act expanded UI benefits to enhance this support. However, many people are facing significant challenges accessing UI benefits. Many of these challenges reflect limitations of outdated systems. However, people may face other challenges, including lack of awareness of eligibility for benefits and difficulty completing application and enrollment processes. Lessons learned from Medicaid and CHIP can help inform state efforts to address these challenges.

News Release

New Analysis Reveals Gaps in Abortion Coverage for Employees with Employer-Sponsored Plans

Published: May 12, 2020

New analysis of KFF’s 2019 Employer Benefits Survey finds that 10% of workers covered by employer-sponsored health insurance are employed at a firm that has asked their insurer or third party administrator to exclude abortion coverage from their health plan. Employer-sponsored coverage is the primary source of health benefits in the U.S., covering 153 million Americans.

Four percent of covered workers are employed at firms that exclude coverage of abortion under any circumstance and 6% are employed at firms that exclude abortion coverage except under some limited circumstances. Covered workers at the largest firms are more likely to work at a firm that excludes abortion coverage than those at smaller firms. Lack of coverage means that people seeking abortion services must fully bear the cost of their abortion, which on average is around $500.

Overall, 3% of firms that offer health benefits reported that they exclude coverage of abortion in some or all circumstances.  Employers who do not explicitly exclude abortion coverage may not necessarily include coverage, and some employers with abortion coverage may not cover it in all circumstances.

Congress is considering including COBRA subsidies in its next coronavirus relief package to help workers who lose their jobs keep their employer coverage. One of the sticking points of the debates has reportedly been whether or not the legislation will include a stipulation that federal funds cannot be used to pay for abortion coverage. Given that many employers do not know whether their plan covers abortion, this restriction could pose some logistical hurdles to implementation or restrictions on abortion coverage.