Gaps in the Emergency Paid Sick Leave Law for Health Care Workers

Authors: Michelle Long and Matthew Rae
Published: Jun 17, 2020

Background

The emergency paid sick leave benefit that took effect in April as part of the Families First Coronavirus Response Act (FFCRA) guarantees eligible workers up to 80 hours of paid leave for a health issue arising from coronavirus. The Act represents the country’s first federal law aimed at providing workers paid leave, though it is set to expire at the end of 2020. In order to reduce the spread of coronavirus, the Centers for Disease Control and Prevention (CDC) has recommended that employers actively encourage employees who are exhibiting symptoms to stay home and maintain physical distancing. The new law temporarily provides short-term paid sick leave to as many as 86.3 million workers1 , according to our analysis of the Census Bureau’s 2019 Current Population Survey (CPS) Annual Social and Economic Supplement (ASEC). However, the emergency paid sick leave provisions leave out a large swath of American workers by excluding those at private businesses with 500 or more employees, and offering broad exemptions for employers of emergency responders and health care workers, regardless of firm size. While most health care employers offer paid sick leave to their workers, that leave usually requires accrual and may not be available to all workers or for as long as the emergency leave in the FFCRA.

While the legislation did not specify who would be classified as a health care worker, the Department of Labor (DOL) subsequently issued guidelines that permit many health care providers as well as a wide range of health-related entities to exempt their workers. Organizations responding to the COVID-19 pandemic, such as hospitals, doctors’ offices, clinics, residential facilities, medical schools, laboratories, pharmacies, and even contractors that provide services to these institutions, can be exempted. Should they choose the exemption, these employers are not required to offer emergency paid sick leave to either employees who provide direct patient care or who provide health-related services but do not have direct exposure to patients, such as janitors and food service workers.

In response to the gaps in emergency paid leave protections for health care and emergency response workers, the New York Attorney General has filed a lawsuit against the Trump Administration2  and several organizations have called on the Department of Labor to reconsider its expansive definitions of workers who may be exempted. Additionally, since the beginning of the pandemic, five states and 14 localities, plus Washington, DC, have enacted new emergency paid sick leave laws or expanded existing ones3 . On May 15, 2020, the House of Representatives passed the HEROES Act, legislation that would remove the federal FFCRA’s exclusion for private employers with 500 or more employees and the exemption for health care and emergency response workers, among several other coronavirus-related provisions. The bill is currently stalled in the Senate.

How Many Health Care Workers Do Not Have Access to the Coronavirus Emergency Paid Sick Leave?

Based on analysis of the 2019 CPS ASEC, we estimate that at least 69.4 million workers, or approximately four in ten workers, are potentially ineligible for emergency paid sick leave benefits. Approximately one in four (25%) of those workers works in the health care industry (Figure 1). In particular, the law automatically excludes the 9.5 million health care workers that work for a private employer with 500 or more employees (6% of the American workforce). An additional 8.1 million health care workers are subject to exemption (5% of the workforce) at their employer’s discretion. Taken together, as many as 17.7 million health care workers are not guaranteed access to emergency paid sick leave benefits under this law.

Figure 1: 1 in 4 Workers Excluded or Exempted from Emergency Paid Sick Leave are Health Care Workers

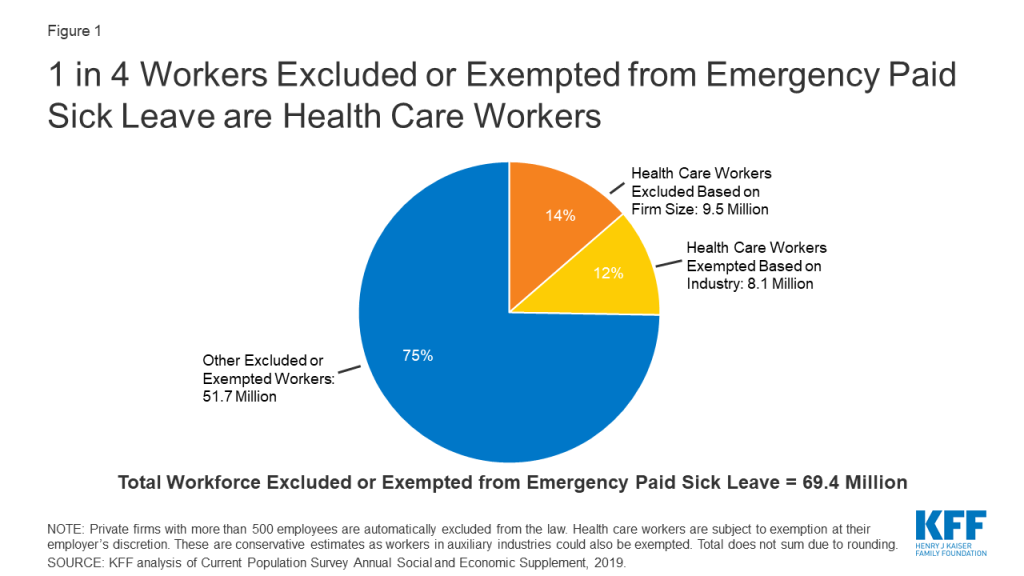
The CDC estimated in late May that more than 63,000 health care personnel had contracted COVID-19. Those working in the health care industry are of particular interest because of their increased risk of contracting the virus from infected patients as well as their potential to transmit the virus to patients at high risk of becoming seriously ill. While it is not known how many employers have elected not to offer emergency paid sick leave benefits under the exemption, we estimated the number of workers in the health care industries most likely to be excluded based on the DOL’s exemption criteria (see the Methodology section). This is a conservative estimate, as it does not include workers in some auxiliary services, such as industries that provide services necessary for the maintenance and operation of health care facilities and that can be exempted under the DOL’s guidance.

While most health care and social assistance firms offer paid sick leave as an employee benefit, whether voluntarily or state/locality-mandated, 15% of workers in these industries do not have any paid sick leave. Moreover, employer paid sick leave programs typically require accrual of time off and offer an average of 7 to 8 days of sick leave, which is fewer than the number of days recommended by the CDC for recovery and quarantine from COVID-19 for health care workers. By contrast, the FFCRA’s emergency paid sick leave law provides 2 weeks of paid sick leave, immediately available to all eligible workers, rendering it particularly valuable during this pandemic. Lack of comprehensive paid sick leave may discourage workers who have symptoms of coronavirus from staying home, potentially exposing their patients and co-workers to the virus.

Who are the Exempted and Excluded Health Care Workers?

Women make up the majority (75%) of the 17.7 million workers in the health care industry who are either automatically excluded from the new emergency paid sick leave law or subject to exemption (Figure 2). Nearly 4 in ten (39%) of them are people of color. Data suggest that due to higher rates of underlying health conditions, communities of color are at increased risk of serious illness if they contract COVID-19 and they face increased challenges related to health care access and social and economic factors. Other data find that communities of color are also experiencing higher rates of death from COVID-19. Additionally, about a quarter (24%) of the health care workforce excluded or subject to exemption are part-time workers, many of whom are less likely to receive any other type of paid leave benefit from their employer, as these benefits are often only available to full-time workers. Moreover, 18% are low-wage4 , for whom having to take unpaid leave when they are sick could put them in a difficult financial situation. Other research finds that lower-wage workers are also less likely to have access to other paid sick leave than higher-wage workers. For example, in 2019, only 47% of lower-income workers in private industry had access to paid sick leave, compared to 90% of higher-wage workers.

Figure 2: Characteristics of Health Care Industry Workers Excluded or Potentially Exempted from Emergency Paid Sick Leave

Many workers in the health care industry work in a setting where they may have exposure to patients and other health care workers (Table 1). More than four in ten (42%) work in hospitals, about a quarter (24%) work in long-term care facilities, which have been disproportionately affected by outbreaks of COVID-19, and about one in five (19%) work in physician offices and other outpatient care centers. Another 15% work outside of patient care settings, such as for the pharmaceutical industry, other medical supply companies, and a variety of other related health services.

Table 1: Worksites of the 17.7 Million Health Care Workers Who May Not Qualify for Emergency Paid Sick Leave
Hospitals42%
Home, nursing, and residential care24%
     Home health care services9
     Nursing care facilities9
     Residential care facilities, without nursing6
Physician offices and outpatient care19%
     Offices of physicians9
     Outpatient care centers11
Medical and pharmaceutical manufacturing7%
       Pharmaceutical and medicine manufacturing3
     Medical equipment and supplies manufacturing4
Other health care services8%
SOURCE: KFF analysis of Current Population Survey Annual Social and Economic Supplement, 2019.

Discussion

Health care workers who continue to work while sick because they cannot afford to stay home without pay may face difficult tradeoffs between the need for an income and concerns about exposing patients or their colleagues. The FFCRA’s emergency paid sick leave provides an economic cushion that could allow health care workers to stay home when they are ill and help curb the spread of the pandemic. However, gaps in the law leave many workers without access, including 17.7 million health care workers. Health care workers without access to other types of paid leave may find it even more difficult to take time off work. Lack of paid sick leave could result in workers being forced to choose between going to work while they have symptoms and staying home without pay. Media reports have indicated that some health care workers are feeling the impact of the lack of access to emergency paid sick leave, with some worrying how they will pay their bills if they get sick with coronavirus and need to take time off work to recover.

New York’s lawsuit argues that the Department of Labor unlawfully allows for exemption of health care and emergency response workers. Additionally, the HEROES Act, passed by the House of Representatives in May 2020, attempts to close many of the gaps in access to emergency paid sick leave by extending the requirement to private firms with 500 or more employees and by removing the exemption for health care providers and emergency responders. These changes, if implemented, may make it easier for sick workers to stay home without losing pay and may help protect the others from exposure to COVID-19.

Methodology

This analysis is based on KFF analysis of the 2019 Community Population Survey Annual Social and Economic Supplement. We include self-employed workers, which make up about 9% of the workforce, and workers in the private sector, state and local governments, and the federal government. We define the health care and emergency response workforce as all individuals who earned at least $1,000 during the past year and indicated that their job was in one of the Census codes listed in Table 2. Excluded workers are those who work for a private firm with 500 or more employees and exempted workers are those who work in the health care or emergency response industries. Looking at industry rather than occupation allows for analysis that more closely resembles the broad exemptions as defined by the DOL, though this list does not include auxiliary industries necessary for the operation and maintenance of health care and emergency response entities, which may also be exempted. We did not include the offices of dentists, chiropractors, optometrists, or ‘other’ health practitioners, which employ an additional 1.4 million workers.

Table 2: Industry Classification Codes
Health Care
Census CodeDescription
2190Pharmaceutical and medicine manufacturing
3960Medical equipment and supplies manufacturing
7970Offices of physicians
8090Outpatient care centers
8170Home health care services
8180Other health care services
8190Hospitals
8270Nursing care facilities
8290Residential care facilities, without nursing
Emergency Response
8370Individual and family services
8380Community food and housing, and emergency services
9470Justice, public order, and safety activities
SOURCE: Current Population Survey Annual Social and Economic Supplement, 2019. Codebook Appendix A.
  1. Our estimates are based on 2019 employment data. In May 2019, 6 million people were unemployed. In May 2020, 21 million people were unemployed. ↩︎
  2. In August 2020, the U.S. District Court for the Southern District of N.Y. ruled in favor of New York and in September 2020, the DOL amended the regulation to more narrowly define ‘health care worker.’ ↩︎
  3. CA, CO, NY, OR, and WA. In CA: Long Beach, Los Angeles City and Co., Oakland, Sacramento City and County, San Francisco, San Jose, and Santa Rosa. San Mateo and Sonoma Counties have temporary emergency paid sick leave laws that are not included here because they only apply to certain employers in unincorporated parts of the county. In other states: Goshen, IN, Wilmington, NC, Philadelphia, PA, Burlington, VA, and Seattle, WA. Source: KFF analysis of A Better Balance Emergency Paid Sick Leave Tracker. Updated Oct. 2020. ↩︎
  4. Low-wage refers to workers in the bottom 25% of earners, or less than $22,000 annually. ↩︎

Under the Radar: States Vary in Regulating and Reporting COVID-19 in Assisted Living Facilities

Authors: Sarah True, Nancy Ochieng, Juliette Cubanski, Wyatt Koma, and Tricia Neuman
Published: Jun 16, 2020

Data Note

Since the COVID-19 pandemic first surfaced in the United States, the number of cases and deaths in long-term care (LTC) facilities has been rising. As of June 4, 2020, over 43,000 COVID-19 related resident and staff deaths have been reported in nursing homes and other long-term care facilities, which is a conservative estimate because not all states publish these data. Among 41 states reporting COVID-19 LTC data at the state level, long-term care facility residents account for 50% or more of all COVID-19 deaths in 27 states. The increase in deaths among long-term care facility residents and staff has become an urgent concern for federal and state policymakers, the long-term care industry, family members of residents, residents themselves, and the general public.

In response to these concerns, on March 13, 2020, the Centers for Medicare & Medicaid Services (CMS) released guidance to limit the spread of the novel coronavirus to nursing home residents and staff, pertaining to visitors and staff screening. On April 2, CMS released guidance recommending universal use of facemasks by nursing home staff, and use of full Personal Protective Equipment (PPE) in facilities with known or suspected COVID-19 cases. As of May 8, nursing facilities are also required by CMS to report COVID-19 cases and deaths to the Centers for Disease Control and Prevention (CDC), and on May 18, CMS released guidance for states related to reopening nursing homes.

Notably, the CMS guidance and reporting requirements apply specifically to nursing facilities that fall under federal regulatory purview, leaving it to states to establish standards for assisted living facilities (ALFs) and other congregate living facilities. Assisted living facilities are home to over 800,000 mostly frail, elderly residents, who also face elevated risk of severe illness if they contract COVID-19, according to the CDC. While a great deal of attention has been paid to efforts to prevent and contain outbreaks of COVID-19 in nursing homes, assisted living facilities have been largely overlooked.

This analysis examines how states are regulating assisted living facilities in response to the COVID-19 pandemic, based on state-issued guidance for assisted living facilities on three key measures identified by CMS pertaining to visitors to facilities, daily staff screening, and universal use of PPE by facility staff, for each of the 50 states and DC. In addition, we tally state-level data on COVID-19 cases and deaths in assisted living facilities among states reporting such data as of June 8, 2020. The estimates reported here represent a subset of the COVID-19 cases and deaths data for long-term care facilities overall, as reported in other KFF analyses. (See Methods for details).

Key Takeaways

  • Ten states impose restrictions on assisted living facilities that are identical to those established by CMS for nursing facilities, i.e., prohibit visitors, require staff screening, and require staff use of PPE.
  • A majority of states prohibit visits to assisted living facilities (26 states plus DC) but recommend rather than require daily staff screening (27 states) and staff use of PPE (27 states).
  • Only 16 states report COVID-19 case and/or death data for assisted living facilities, either as a separate category (11 states) or combined with other long-term care facilities, other than nursing homes (5 states). Only 6 states report COVID-19 deaths occurring in assisted living facilities specifically.
  • Among the 11 states reporting COVID-19 cases for assisted living facilities specifically, a total of 7,703 cases among residents and staff have been reported. Among the six states reporting COVID-19 deaths for assisted living facilities specifically, a total of 643 deaths have been reported.

Variations in guidelines for assisted living facilities across states results in a patchwork of protections against COVID-19 that is likely to result in uneven effects across the country. However, given the paucity of state-reported data on case and death numbers in assisted living facilities specifically, the picture of disease incidence and mortality in these facilities is profoundly incomplete, and undoubtedly an undercount.

We found significant variation in COVID-19 guidance issued to assisted living facilities across states related to visitors, staff screening, and staff use of PPE.

Ten states impose restrictions on assisted living facilities which are identical to those established by CMS for nursing facilities, while other states are mixed in whether they require or recommend adherence to the guidelines in one or more of these areas (Table 1). A handful of states have not issued any guidance in one or more of these areas as of June 1, 2020, including one state (South Dakota) with no guidance issued in any of the three areas.

  • Visitors. More than half of all assisted living facilities in states and DC prohibit visitors (26 states plus DC), while 21 states recommend that assisted living facilities prohibit visitors, and two states provide no guidance on visitation to assisted living facilities (Figure 1).
  • Staff screening. More states recommend than require daily screening of staff for illness in assisted living facilities: 27 states recommend, and 17 states plus DC have this requirement. Six states have not issued guidance related to staff screening.
  • Use of personal protective equipment. More states recommend rather than require staff to use PPE in assisted living facilities: 27 states recommend, and 16 states plus DC require. Seven states have issued no guidance related to PPE use.
Figure 1: More Than Half of States and DC Prohibit Visitation to Assisted Living Facilities To Curb Coronavirus Infections; More Recommend Rather Than Require Screening and Use of PPE in ALFs

Relatively Few States Report COVID-19 Cases and Deaths Separately for Assisted Living Facilities

Our analysis shows that, as of June 8, 2020, 16 states report COVID-19 data for assisted living facilities, including 11 states that report data for assisted living facilities as its own category [CO, CT, FL, MA, MS, ND, NV, OH, RI, TX, UT] and five states that report COVID-19 data for assisted living facilities with congregate settings other than nursing homes, which are separately reported [CA, LA, NC, NY, SC]. Our analysis does not include data for the 23 states and DC that do not report COVID-19 data for assisted living facilities separately from nursing facilities; seven states that report data for nursing facilities, but not for assisted living facilities; and four states that do not report any state-level data.

COVID-19 Cases in Assisted Living Facilities

  • Among the 11 states [CO, CT, FL, MA, MS, ND, NV, OH, RI, TX, UT] reporting COVID-19 cases for assisted living facilities specifically, a total of 7,703 cases among residents and staff have been reported. This total includes 3,829 cases among residents, 1,135 cases among staff, and 2,739 cases among residents and staff not separately reported in two states [MA and UT].
  • Among the four states [CA, LA, NC, SC] that report COVID-19 cases occurring in a non-nursing facility category that includes, but is not limited to, assisted living facilities, a total of 3,386 COVID-19 cases have been reported among residents and staff. This includes 2,419 cases among residents and 967 cases among staff, with only three states reporting on the latter.

Covid-19 Deaths in Assisted Living Facilities

  • Among the six states [CO, CT, NV, RI, TX, MS] reporting COVID-19 deaths for assisted living facilities specifically, a total of 643 deaths have been reported. This includes 642 deaths among residents and one death among staff, with only two states (CO and NV) reporting on the latter.
  • Among the five states [CA, LA, NC, NY, SC] that report COVID-19 deaths in non-nursing facilities including, but not limited to, assisted living facilities, a total of 840 deaths have been reported. This includes 810 deaths among residents and 30 deaths among staff, with only three states reporting on the latter.

Discussion

With national attention focused on the rising number of COVID-19 deaths in nursing homes, this analysis takes a closer look at protections and COVID-19 cases and deaths in assisted living facilities. We found significant variation across states in assisted living facility regulations related to visitation, daily staff screening, and use of PPE, and a dearth of states reporting COVID-19 cases and deaths among residents and staff in these facilities specifically. In the majority of states, regulatory measures meant to protect assisted living facility residents and staff from COVID-19 infection are currently far less stringent than federal recommendations for nursing facilities. In the absence of uniform surveillance and reporting, little is known about the extent to which facilities are adhering to state guidelines or whether states are monitoring their enforcement.

In an effort to control outbreaks in LTC facilities, some states have instituted universal testing of nursing facility residents and staff. While some states, such as Connecticut and New York, now mandate universal testing of staff in both nursing homes and assisted living facilities, some state and national LTC associations are reporting that fewer states are testing both assisted living facilities residents and staff in addition to nursing facility residents and staff. Widespread adoption of universal testing in all LTC facilities and other congregate settings may not be possible, due to limited testing capacity nationwide. While regular screening of residents and staff for fever and respiratory symptoms is now a matter of protocol in most LTC facilities, screening only picks up symptomatic COVID-19 cases, whereas testing can identify asymptomatic carriers as well.

With many governors now moving toward relaxing restrictions that aim to slow the spread of coronavirus infections, some state guidance issued for assisted living facilities will soon expire (unless renewed). For example, executive orders issued by Michigan and Alabama will expire on June 26 and July 3, 2020, respectively. Other states, such as Arizona and North Carolina, have mandated that guidance pertaining to LTC facilities generally will expire upon termination of the state’s emergency declaration related to COVID-19. Ohio recently announced that visits to assisted living facilities will be allowed outdoors starting June 8, but visitors to nursing facilities will remain prohibited.

In terms of reporting of COVID-19 cases and deaths in long-term care facilities, the absence of uniform state reporting requirements for assisted living facilities makes it challenging to contextualize the numbers from the 16 states currently reporting such data separately from other types of long-term care facilities. For example, while CMS now reports the total number of resident beds in each nursing facility with COVID-19 cases, only three out of the 16 states reporting case and death data for assisted living facilities separate from nursing homes (Massachusetts, Connecticut, and North Dakota) also report the number of beds in each facility. This makes it challenging to examine the relationship between facility capacity and number of COVID-19 cases and deaths in assisted living facilities. Furthermore, total COVID-19 case and death counts for assisted living facilities would undoubtedly be much larger if data were released by all states, as CMS now requires for nursing homes nationwide.

This analysis confirms a patchwork state-based regulatory approach to establishing measures to limit the spread of coronavirus infection among assisted living facility residents and staff, and in reporting COVID-19 cases and deaths in assisted living facilities. This situation mirrors a larger national trend in the COVID-19 response, whereby some states have taken more aggressive actions than others and the federal government assumes a “backup” role. This state-by-state approach to the COVID-19 pandemic may result in uneven rates of illness, hospitalizations, and mortality among assisted living residents and staff across the country.

Methods

State Regulation of Assisted Living Facilities and COVID-19

To examine how states are regulating assisted living facilities in response to the COVID-19 pandemic, we collected and analyzed state-issued guidance for ALFs for each of the 50 states and District of Columbia. This information was posted in a variety of online locations across states: some regulatory guidance pertaining to long-term care facilities was posted on state-run websites dedicated to COVID-19-specific information and resources; some was posted on state Department of Health websites, some was stored on Governors’ websites, and some was posted on the websites of other state regulatory agencies, such as the Department of Human Services. State regulatory information was collected via Google keyword searches as well as targeted searches of government websites as listed above.

Regulatory information pertaining to ALFs was also conveyed in a variety of formats, including executive orders or press releases issued by state Governors’ offices, orders or guidance issued by state Public Health departments or other state regulatory agency (such as the Department of Human Services), or information or guidance appearing on state-run websites housing COVID-19-related information.

State regulatory information pertaining to ALFs was initially collected on a rolling basis via online search as detailed above between March 26 and April 20, 2020, and subsequently updated between May 29 and June 1, 2020, and is current as of June 1. Although best efforts were made, due to the wide variation in online location, presentation, and formatting of regulatory information pertaining to ALFs between states, it is possible that the research team inadvertently neglected to include some information, or was not aware of an update to information already collected. In some states, the regulatory guidance was directed to “long-term care” settings generally, in which case it was assumed to apply to ALFs.

State Reporting of COVID-19 Data for Assisted Living Facilities

To collect data on COVID-19 cases and deaths in ALFs, we reviewed public reporting of COVID-19 surveillance data displayed on applicable state-run websites in all states, and collected numbers of cases and deaths for ALFs in states where this data is reported separately from cases and deaths in LTC facilities generally, in order to exclude nursing facilities from our analysis. Not all states report cases and/or deaths in LTC facilities, and some only report this data for nursing homes. State data on COVID-19 cases and deaths was collected between June 5 and June 8, 2020, and is current as of June 8.

We included COVID-19 case and death data for states (n=11) that reported for ALFs specifically, as well as other states (n=5) that report ALF data separately from nursing facilities, but do so within a larger category that includes ALFs along with other non-nursing home facility types. The facility categories used by states reporting for ALFs under a broader classification are: Residential Care Facilities for the Elderly, Residential Care Facilities, Community Residential Care Facilities, Adult Residential Facilities, and Adult Care Facilities. We include these congregate facilities because assisted living facilities represent a large share of their total residents in many states. We intentionally exclude states reporting in broader categories that include nursing facilities because these numbers are reported to CMS separately and our goal is to understand the impact of COVID-19 in assisted living facilities to the extent this is possible with current data limitations.

Notably, not all states report data for both cases and deaths; some report only cases and others report only deaths. Not all states report for staff and residents; some report cases and/or deaths for residents only, and some states (n=2) report aggregate cases for residents and staff. Most states in our analysis (n=12) report cumulative case and death data, however four states (Florida, Mississippi, Utah, and North Dakota) report only active cases. States differ slightly in how many cases constitute a facility “outbreak” which triggers reporting – some states report data for facilities with just one active case, others begin reporting when two or greater cases are reported by facilities. States also differ in whether they report suspected COVID-19 cases and deaths, in addition to confirmed cases – some only report cases confirmed via diagnostic test. For the purpose of this analysis, we have included both suspected and confirmed COVID-19 cases and deaths reported. Additionally, four states (Massachusetts, Rhode Island, Utah, and California) report ranges of cases and/or deaths, versus specific counts. For these states, we used the median of the reported range, or 5 in the case of “5 or above” reported, and 31 for “greater than 30.”

Tables

Table 1: Guidance for Assisted Living Facilities Related to COVID-19, by State (Including DC)(as of June 1, 2020)
VisitationScreeningPersonal Protective Equipment
AlabamaProhibitRequireRequire
AlaskaRecommend prohibitRecommendRecommend1
ArizonaRecommend prohibitRequireRequire
ArkansasProhibitRequireRecommend
CaliforniaProhibitRecommendRequire
ColoradoProhibitRequireRequire
ConnecticutNo guidanceNo guidanceRecommend
DelawareRecommend prohibitRecommendRecommend2
District of ColumbiaProhibitRequireRequire
FloridaProhibitRequireRequire
GeorgiaProhibitRequireRequire
HawaiiRecommend prohibitRecommendRecommend
IdahoProhibitRecommendRecommend
IllinoisRecommend restrictRequireRequire
IndianaRecommend prohibitRecommendRecommend
IowaRecommend prohibitRequireRecommend
KansasRecommend prohibitRecommendRecommend
KentuckyRecommend prohibitRecommendRecommend
LouisianaProhibitRecommendRecommend1
MaineRecommend prohibitRecommendRecommend
MarylandRecommend prohibitRecommendRecommend
MassachusettsProhibitRecommendRecommend
MichiganProhibitRequireRequire
MinnesotaRecommend prohibitRecommendRecommend
MississippiProhibitNo guidanceRecommend
MissouriProhibitRequireRequire
MontanaProhibitRequireNo guidance
NebraskaProhibitNo guidanceRecommend
NevadaRecommend prohibit3Recommend3Recommend3
New HampshireProhibitRecommendRequire
New JerseyRecommend prohibitRecommendRequire
New MexicoProhibitRecommendRequire
New YorkProhibitRequireRequire
North CarolinaRecommend prohibitRecommendRequire
North DakotaRecommend prohibitRecommendRecommend
OhioProhibit4RecommendNo guidance
OklahomaProhibitRecommendNo guidance
OregonProhibitRequireNo guidance
PennsylvaniaRecommend prohibitRecommendRecommend
Rhode IslandProhibitNo guidanceNo guidance
South CarolinaProhibitRecommendRecommend
South DakotaNo guidanceNo guidanceNo guidance
TennesseeProhibitRecommendRecommend5
TexasProhibitRequireRequire
UtahRecommend prohibitNo guidanceRecommend
VermontRecommend prohibitRequireRecommend
VirginiaProhibitRequireRequire
WashingtonProhibitRequireRecommend
West VirginiaRecommend prohibitRecommendRecommend
WisconsinRecommend prohibitRecommendNo guidance
WyomingRecommend prohibitRecommendRecommend
NOTE: Blue highlights indicate states with requirements for ALFs that match CMS requirements for nursing facilities. Gray highlights indicate states with no guidance in specific area. 1PPE recommended for use with symptomatic residents. 2Recommend for staff providing direct care. 3Per official from the Division of Public and Behavioral Health, Nevada Dept. of Health and Human Services. 4The Governor announced a plan to lift the prohibition on visitation beginning on June 8, 2020 . 5PPE recommended when case identified.SOURCE: KFF analysis of state and DC long-term care facility guidance related to COVID-19; detailed methods available in KFF brief, “Under the Radar: States Vary in Regulating and Reporting COVID-19 in Assisted Living Facilities.”
Table 2: Number of States and DC With Specific Guidance for Assisted Living Facilities Related to COVID-19(as of June 1, 2020)
Visitation
   Prohibit27
   Recommend prohibit21
   Recommend restrict1
   No guidance2
Screening
    Require18
   Recommend27
    No guidance6
Staff use of personal protective equipment
   Require17
   Recommend27
   No guidance7
NOTE: Analysis includes 50 states and DC.SOURCE: KFF analysis of state and DC assisted living facility guidance related to COVID-19; detailed methods available in KFF brief, Under the Radar: States Vary in Regulating and Reporting COVID-19 in Assisted Living Facilities.”
Table 3: State Reporting of Assisted Living Facility Cases and Deaths Related to COVID-19(as of June 8, 2020)
 Active or Cumulative CasesResident CasesResident DeathsStaff CasesStaff DeathsResident and Staff CasesAssisted Living Facilities with known Cases
Number of states reporting 131195216
TOTAL 6,2481,4522,102312,7391,261
California1Cumulative1,1684726823096
ColoradoCumulative500139368050
ConnecticutCumulative1,04133781
FloridaActive758447281
Louisiana2Cumulative63091122
MassachusettsCumulative2,726206
MississippiActive140176
NevadaCumulative982344128
New York3Cumulative16958
North Carolina4Cumulative53562225040
North DakotaActive131010
OhioCumulative50824984
Rhode IslandCumulative161298
South Carolina5Cumulative861660041
TexasCumulative736114145
UtahActive135
NOTE: 1Cases and deaths in Residential Care Facilities for the Elderly. 2Cases and deaths in Adult Residential Facilities. 3Deaths in Adult Care Facilities. 4Cases and deaths in Residential Care Facilities. 5Cases and deaths in Community Residential Care Facilities.SOURCE: KFF analysis of state assisted living facility cases and deaths related to COVID-19; detailed methods available in KFF brief, “Under the Radar: States Vary in Regulating and Reporting COVID-19 in Assisted Living Facilities.”
News Release

Nearly 1 in 10 Health Care Workers Lost Their Job Between February and April, But Health Care Employment Rebounded Slightly in May

Published: Jun 16, 2020

A new chart collection explores the impact of the coronavirus pandemic on the U.S. health care workforce, and finds that between February and April 2020, nearly 1.5 million health care jobs were lost. While more than 300,000 health services jobs were recovered in May 2020, mainly in dental offices, employment in some health care settings continued to decrease.

The rise in health care unemployment follows a sharp decline in utilization and revenue for non-emergency services. Many providers delayed or canceled appointments for routine care and elective procedures amid concerns that COVID-19 patients would overwhelm the health system; others closed their facilities entirely. Many patients also chose to forgo non-emergency care, presumably due to stay-at-home orders issued by local governments and fear of contracting the virus in health care settings.

Workers in ambulatory health care settings, like dental and physician’s offices, have been particularly hard-hit, accounting for more than half of total health care job losses between February and May 2020.

The chart collection also includes data on gender disparities and geographic variation in health care job loss, as well as a breakdown of job loss by sector.

The collection is part of the Peterson-KFF Health System Tracker, an online information hub dedicated to monitoring and assessing the performance of the U.S. health system.

For more data, analysis, polling and journalism on the COVID-19 pandemic, visit our special resource page on kff.org.

News Release

Nearly One in Four Workers are at High Risk of Serious Illness with COVID-19, Posing Challenges for Employers as They Reopen 

Published: Jun 15, 2020

A new KFF analysis finds nearly one in four workers (24%) are considered at high risk of serious illness if they get infected by the novel coronavirus, highlighting the challenges that businesses, public offices and other employers face as they move toward reopening.

The analysis estimates 37.7 million workers (based on their work status in 2018) are at high risk of serious illness from COVID-19.  This includes 10 million who are at least 65 years old and an additional 27.7 million who have pre-existing medical conditions that the Centers for Disease Control and Prevention (CDC) says put people at higher risk for severe illness from COVID-19. Many of these people may be out of work right now or working remotely, but would be at greater risk if they had to return to in-person work.

“As an employer, I know that employers are largely on their own to develop policies to reopen safely,” KFF President and CEO Drew Altman said. “These data suggest employers should take into account the higher risk some workers will face, allowing them to work at home where possible, to be tested and to minimize their risks if they return to work.”

The analysis also estimates that 12 million more at-risk adults who do not work themselves live in households with workers. For this group, indirect exposure could be just as serious of a risk as going to work themselves.

The estimates are based on KFF’s analysis of data from the 2018 National Health Interview Survey (NHIS). Workers deemed at high risk based on the CDC’s criteria include those who are at least 65 years old, as well as those with diabetes, heart disease, chronic obstructive pulmonary disease, asthma, a body mass index above 40, or have a functional limitation related to cancer.

More data, analysis, polling and journalism related to the COVID-19 epidemic is available at kff.org.

Almost One in Four Adult Workers is Vulnerable to Severe Illness from COVID-19

Authors: Gary Claxton, Larry Levitt, Rachel Garfield, Rabah Kamal, Tricia Neuman, Jennifer Kates, Josh Michaud, Wyatt Koma, and Matthew Rae
Published: Jun 15, 2020

As states and employers continue to reopen businesses and public offices, important decisions are being made about how to keep workers safe from becoming infected with coronavirus at work or on their commutes to and from their homes. In addition, outbreaks of coronavirus at some businesses, such as food processing facilities and long-term care facilities, highlight the risks faced by essential workers who have continued to work outside the home. Safety considerations will be particularly important for those workers at greater risk of becoming seriously ill if they become infected with coronavirus. This caution applies to older workers in general, as well as to younger workers with certain medical conditions that put them at higher risk of serious illness if they become infected.

We use the National Health Information Survey (NHIS) to look at how many adult workers1  are at increased risk of severe illness if infected with coronavirus, based on risk factors identified by the Centers for Disease Control and Prevention (CDC). These risk factors include having diabetes, chronic obstructive pulmonary disease (COPD), heart disease, a body mass index (BMI) above 40, moderate to severe asthma, and a functional limitation due to cancer. All workers 65 and older also are considered at higher risk. The approach is similar to our prior work identifying at-risk adults and is described in more detail in the Methods.

Who are the At-Risk Workers?

We find that over 90 million adults are at greater risk for severe illness from COVID-19 due to underlying health conditions or age. Of these at-risk adults, we estimate that about 37.7 million were employed at a job or business in the prior year, including 10 million people age 65 and older (19.5% of adults age 65 and older, all of whom are considered at greater risk) and 27.7 million non-elderly adults (Figure 1). These at-risk workers comprise 24% of all adult workers.

Figure 1: Number of Adult Workers Who Are at Risk of Severe Illness From COVID-19, 2018

Among non-elderly adult workers, at-risk workers are older on average than non-elderly workers who are not at risk (average age of 45 versus 40), reflecting the fact that risk status chronic conditions or poor health increases with age. One-half of at-risk non-elderly adult workers are women, which is higher than the percentage (46%) of non-elderly adult workers who are not at risk.

Large shares of at-risk workers — 86% of non-elderly adult at risk workers and 61% of age 65 and older at-risk workers — work full-time (at least 35 hours per week). They have substantial connection to work and may face economic difficulties remaining absent from their jobs even if safety is a question.

The average annual earnings of non-elderly adult at-risk workers was $48,400 in 2018, somewhat lower than the average annual earnings for non-elderly adults workers who were not at risk ($51,900). The median annual earnings was $40,000 for both at-risk and not-at-risk adult non-elderly workers. One-quarter of non-elderly adult at-risk workers had annual earnings of less than $21,100.

The average annual earnings of workers age 65 and older was $49,100 in 2018; median annual earnings were $37,000. One-quarter of workers age 65 and older had annual earnings of less than $17,300.

The importance of at-risk workers’ earnings to themselves and to their families may put added pressure on them to continue to work or return to work even if their safety may be compromised. Not surprisingly, among both non-elderly at-risk workers and workers age 65 and older who live alone, earnings on average account for a very large share of their total annual incomes: 94% among non-elderly at-risk workers and 72% among older at-risk workers in 2018. For those living with others, the at-risk worker’s earnings on average comprised a substantial share of family income. Among non-elderly at-risk workers, their earnings accounted for 57% of family income in families of two or three and 50% in larger families. Among workers age 65 and older who live with others, the older worker’s earnings on average comprised 48% of family income.

Discussion

Most people, including at-risk workers, cannot afford to stay away from work for long periods of time. Some people at risk have likely continued to go to work outside their homes due to the nature of their jobs, perhaps as essential workers. Others may have been accommodated by remote work, which has taken hold to a remarkable degree but is not available to all workers. Some have lost their jobs or may be at risk of losing them. As more workplaces reopen there will be increasing pressures for all workers, including those at higher risk, to return to jobs or seek new jobs outside of their homes. This will raise issue both for employees concerned about their safety and for employers concerned about how to keep these workers safe.

In addition to at-risk people who are workers themselves, there are millions more at-risk adults who themselves are not workers but who live with workers. This indirect exposure could be just as serious of a risk as going to work themselves. We estimate that an additional 12 million at-risk adults who are not workers themselves live with at least one full-time worker. This includes 6.5 million people age 65 and older and about 5.5 million at risk non-elderly adults. This is a conservative estimate because additional non-working at-risk adults live with people who work part time or who are in and out of the work force. The safety of these family members will need to be part of the considerations for employees and employers as businesses continue to refine safety protocols and others reopen their workplaces.

State and local governments and employers themselves are wrestling with how to reopen businesses in the safest ways possible, with risks particularly high for workers who have pre-existing that make them more vulnerable to severe illness from COVID-19. Employers, workers, and governments may need to consider flexible and creative approaches to balance safety and business needs, but with such large number of workers meeting vulnerability criteria, there will be a continuing tension between the economic pressures facing families and businesses and the health and safety of millions of people.

Methods

This analysis uses data from the 2018 National Health Interview Survey (NHIS) to look at the share of workers who would be at increased risk of becoming seriously ill if they become infected with COVID-19. The analysis is similar to our previous [work], where we used the Behavioral Risk Factor Surveillance Survey (BRFSS) to estimate the number of adults who would be at increased risk if they were infected with coronavirus. In that study, we found that about 21% of non-elderly adults have one more of five risk factors that the Centers for Disease Control and Prevention (CDC) have identified as increased risk factors for those infected with coronavirus. The factors we were able to analyze were having diabetes, chronic obstructive pulmonary disease (COPD), heart disease, a body mass index (BMI) above 40, and asthma. In addition, the CDC criteria consider all people over age 65 to be at increased risk. In this brief we use similar information from the 2018 National Health Interview Survey (NHIS) to look at the share and characteristics of adults with these risk factors who are in the workforce.

We use NHIS rather than BRFSS for this analysis because it has more information about the earnings, income and family characteristics of the at-risk population, providing a fuller picture of the economic circumstances of these workers. The sample adult file in NHIS contains information about all of the same health conditions that we used in the previous study, plus the person file has information that allows us to include people who report being functionally limited due to cancer; CDC includes people with compromised immune systems, such as people undergoing treatment for cancer, as being at higher risk of serious illness if infected with coronavirus. With NHIS we find that 22% of non-elderly adults have one or more risk factors for becoming seriously ill with COVID-19, essentially the same share as we calculated under BRFSS. Including those with a functional limitation due to cancer accounts for less than one-half percentage point of this estimate. We note that one downside of using NHIS is that state-level analysis is not possible.

As with BRFSS study, the analysis identifies non-elderly people with one or more risk factors, but in two steps. One pass excludes asthma and the other includes it, and we use only a portion (62%) of the people whose only risk factor is asthma. Unlike our BRFSS analysis, here we incorporate the proportion by assigning risk status to 62% of those whose only risk factor is asthma. The assignment is done by sampling from the asthma risk only group in a way that increases the likelihood of selection with age. (See Zein et al.)

The purpose of the analysis is to look at people who may have difficult avoiding or delaying work if their safety may be compromised; we therefore attempted to focus the analysis on those with a significant amount of work, which we defined as workers who earned $5,000 or more at a job or business during the previous year. This threshold includes 94% of non-elderly adults and 88% of people age 65 and older with any work in the previous year.

We imputed full-time or part-time status for some observations with missing values. NHIS provides a file that multiply imputes family income, earnings and work status for survey respondents. This results in cases in which employment status and earnings are imputed for people who did not otherwise report being employed. Although NHIS contains several questions about hours worked (either in the previous period or usually), these questions do not contain information for respondents who were imputed to be workers and to have earnings. We imputed part-time/full-time status based on their annual earnings, separately for workers under age 65 and those 65 and older. More specifically, for cases where we had information on earnings and hours worked, we calculated the relative proportions of part-time and full-time workers in several earnings groups. We then randomly imputed yes or no for full-time status for the missing cases, using the probabilities associated with their income levels.

We calculated the share of earnings to family income, segmented by family size. For this analysis, we wanted to calculate the ratio for each worker in order to determine the importance of that worker’s earnings to the family. Doing this can create issues in cases where earnings are larger than family income, which can result in very high ratios of earnings to income, which inflate the overall average. To limit the impact of these situations, we capped the ratio associated with any worker to 1 (a worker’s earnings can account for 100 percent of family income but not more than that). A second issue is that the family incomes for some workers with significant earnings can be very low or even zero. This was the case for a small number of observations of at-risk workers (between 6 and 12 unweighted cases had earnings of $5000 or more and family income of less than $1,000. We excluded those cases when we calculated the ratios.

  1. A person is considered to be a worker if they were employed at a job or business in the previous year and had at least $5,000 in annual earnings. ↩︎

This Week in Coronavirus: June 4 to June 11

Published: Jun 12, 2020

Every Friday, we’re recapping the past week in the coronavirus pandemic from our tracking, policy analysis, polling, and journalism.

Certain parts of the U.S. are seeing spikes in COVID-19 cases, possibly spurred by states easing social distancing measures and large gatherings over Memorial Day weekend. A KHN article from this week explains that specific areas of California and certain counties in every Southern state have become “hot spots.”

Total coronavirus cases in the U.S. are still climbing, and this week the cumulative total surpassed 2 million. There have been over 114,000 total confirmed deaths in the U.S.

Here are more of the latest coronavirus stats from KFF’s tracking resources:

Global Cases and Deaths: This week, total cases worldwide passed 7.5 million – with an increase of approximately 878,000 new confirmed cases between June 4 and June 11. There were approximately 30,000 new confirmed deaths worldwide between June 4 and June 11, bringing the total to approximately 421,000 confirmed deaths.

U.S. Cases and Deaths: Total confirmed cases in the US passed the 2 million mark this week, with approximately 151,000 new confirmed cases between June 4 and June 11. There were approximately 5,600 new confirmed deaths this week, bringing the total to nearly 114,000 confirmed deaths in the US.

U.S. Tests: There have been over 21.9 million total COVID-19 tests with results in the United States —with about 3.1 million added since June 4. In the last seven days, 1.0% of the total U.S. population was tested.

State Reports of Long-Term Care Facility Cases and Deaths Related to COVID-19 (Includes Washington D.C.)

  • Data Reporting Status: 47 states are reporting COVID-19 data in long-term care facilities, 4 states are not reporting
  • Long-term care facilities with known cases: 9,192 (across 44 states)
  • Cases in long-term care facilities: 230,776 (across 43 states)
  • Deaths in long-term care facilities: 45,833 (in 40 states)
  • Long-term care facilities as a share of total state cases: 15% (across 43 states)
  • Long-term care facility deaths as a share of total state deaths: 45% (across 41 states)

State Social Distancing Actions (includes Washington D.C.):

  • Social Distancing: 51 states have eased at least one social distancing measure.
  • Stay At Home Order: Original stay at home order in 9 states, stay at home order eased or lifted in 36 states, no action in 6 states
  • Mandatory Quarantine for Travelers: Original traveler quarantine mandate in place in 10 states, traveler quarantine mandate eased or lifted in 15 states, no action in 26 states
  • Non-Essential Business Closures: Some or all non-essential businesses permitted to reopen (some with reduced capacity) in 46 states, no action in 5 states
  • Large Gatherings Ban: Original gathering ban/limit in place in 14 states, gathering/ban limit eased or lifted in 36 states, no action in 1 states
  • State-Mandated School Closures: Closed in 7 states, closed for school year in 36 states, recommended closure in 1 state, recommended closure for school year in 6 states, rescinded in 1 state
  • Restaurant Limits: Original restaurant closures still in place in 8 states, restaurants re-opened to dine-in service (some with reduced capacity) in 42 states, no action in 1 state
  • Primary Election Postponement: Postponement in 14 states, cancelled in 1 state, no postponement in 36 states
  • Emergency Declaration: There are emergency declarations in all 51 states.

State COVID-19 Health Policy Actions (Includes Washington D.C.)

  • Waive Cost Sharing for COVID-19 Treatment: 3 states require, state-insurer agreement in 3 states; no action in 45 states
  • Free Cost Vaccine When Available: 9 states require, state-insurer agreement in 1 state, no action in 41 states
  • States Requires Waiver of Prior Authorization Requirements: For COVID-19 testing only in 5 states, for COVID-19 testing and treatment in 6 states, no action in 40 states
  • Early Prescription Refills: State requires in 18 states, no action in 33 states
  • Premium Payment Grace Period: Grace period extended for all policies in 4 states, grace period extended for COVID-19 diagnosis/impacts only in 4 states, expired in 8 states, no action in 35 states
  • Marketplace Special Enrollment Period: Marketplace special enrollment period still active in 6 states, ended in 6 states, no special enrollment period in 39 states
  • Paid Sick Leave: 13 states enacted, 2 proposed, no action in 36 states

State Actions on Telehealth (Includes Washington D.C.)

38 states overall have taken mandatory action expanding access to telehealth services through private insurers, including:

  • New Requirements for Coverage of Telehealth Services: Parity with in-person services in 6 states, broad coverage of telehealth services in 6 states, limited coverage of telehealth services in 6 states, no action in 33 states
  • Waiving or Limiting Cost-Sharing for Telehealth Services: Waived for COVID-19 services only in 7 states, waived or limited for all services in 9 states, no action in 35 states
  • Reimbursement Parity for Telehealth and In-Person Services: Required for all services in 17 states, no action in 34 states
  • Require Expanded Options for Delivery of Telehealth Services: Yes in 35 states, for behavioral health services only in 1 state, no action in 15 states

Approved Medicaid State Actions to Address COVID-19 (Includes Washington D.C.)

  • Approved Section 1115 Waivers to Address COVID-19: 2 states (Washington and New Hampshire) have approved waivers
  • Approved Section 1135 Waivers: 51 states have approved waivers
  • Approved 1915 (c) Appendix K Waivers: 49 states have approved waivers
  • Approved State Plan Amendments (SPAs): 44 states have temporary changes approved under Medicaid or CHIP disaster relief SPAs, 1 state has an approved traditional SPA
  • Other State-Reported Medicaid Administrative Actions: 51 states report taking other administrative actions in their Medicaid programs to address COVID-19

Adults at Higher Risk of Serious Illness if Infected with Coronavirus: 38% of all U.S. adults are at risk of serious illness if infected with coronavirus (92,560,223 total) due to their age (65 and over) or pre-existing medical condition. Of those at higher risk, 45% are at increased risk of serious illness if infected with coronavirus due to their existing medical condition such as such as heart disease, diabetes, lung disease, uncontrolled asthma or obesity. Among nonelderly adults — low-income, American Indian/Alaska Native & Black adults have a higher risk of serious illness if infected with coronavirus. In both cases – for race and household income – the higher risk of serious illness if infected with coronavirus is chiefly due to a higher prevalence of underlying health conditions and longstanding disparities in health care and other socio-economic factors.


This week’s Coronavirus Policy Watch posts:  

  • In the Middle of the Coronavirus Pandemic: How have Swing Counties Fared? (CPW Post)
  • Medication Abortion and Telemedicine: Innovations and Barriers During the COVID-19 Emergency (News ReleaseCPW Post)

The latest KFF COVID-19 resources:

  • Finding Policy Responses to Rising Intimate Partner Violence during the Coronavirus Outbreak (Issue Brief)
  • How Could the Price of Remdesivir Impact Medicare Spending for COVID-19 Patients? (Issue Brief)
  • U.N. SG Guterres Comments On Global Coronavirus Response, Calls For More Investment In Food Security, Humanitarian Relief (KFF Daily Global Health Policy Report)

Trackers and Tools

  • Updated: State Data and Policy Actions to Address Coronavirus (Interactive)
  • Updated: COVID-19 Coronavirus  (Interactive)
  • Updated: Medicaid Emergency Authority Tracker: Approved State Actions to Address COVID-19 (Issue Brief)

The latest KHN COVID-19 stories:

  • Public Health Officials Face Wave Of Threats, Pressure Amid Coronavirus Response (KHN, Associated Press)
  • If You’ve Lost Your Health Plan In The COVID Crisis, You’ve Got Options (KHN)
  • Health Workers Resort To Etsy, Learning Chinese, Shady Deals To Find Safety Gear (KHN)
  • Update: Lost On The Frontline (KHNThe Guardian)
  • COVID-19 Batters A Beloved Bay Area Community Health Care Center (KHNLA Times)
  • KHN’s ‘What The Health?’: Say What? The Spread Of Coronavirus Confusion (Podcast)
  • Federal Help Falters As Nursing Homes Run Short Of Protective Equipment (KHNNPR)
  • Fighting COVID And Police Brutality, Medical Teams Take To Streets To Treat Protesters (KHNNPR)
  • A Family With Five Doctors — And Two COVID Deaths (KHNThe Guardian)
  • New Coronavirus Hot Spots Emerge Across South And In California, As Northeast Slows (KHNNPR)
  • Exclusive: Nearly 600 — And Counting — US Health Workers Have Died Of COVID-19 (KHNThe Guardian)
  • Rapid Changes To Health System Spurred By COVID Might Be Here To Stay (KHN)
  • At-Home Care Designed For COVID Likely Here To Stay At Cleveland Hospital (KHN)
  • Society Is Reopening. Prepare To Hunker Down At Home Again. (KHN)
  • The Elevator Arises As The Latest Logjam In Getting Back To Work (KHNNPR)
  • For EMTs, There’s No ‘Rule Book’ For Facing A Pandemic And Protests At Once (KHN)
  • Using Stories To Mentally Survive As A COVID-19 Clinician (KHN)
  • At Lake Of The Ozarks, It’s (Almost) Business As Usual, Despite The Coronavirus (KHNUSA Today)

Finding Policy Responses to Rising Intimate Partner Violence during the Coronavirus Outbreak

Authors: Amrutha Ramaswamy, Usha Ranji, and Alina Salganicoff
Published: Jun 11, 2020

Introduction

Across the country, shelter at home orders and social distancing have helped slow the spread of the coronavirus outbreak in many communities. These measures, while helping to flatten the curve, also pose significant risk for those impacted by domestic or intimate partner violence (IPV). Under quarantines, household members, caregivers, and intimate partners are in close contact with one another, often unable to leave if a violent situation arises or escalates.

IPV during Emergencies

Nearly a third of all Americans experience IPV, used interchangeably with domestic violence (DV), within their lifetimes. IPV is defined as sexual violence, stalking, physical violence, and psychological aggression perpetrated by an intimate partner. Although IPV occurs across all demographics, some groups, such as women of color, people with disabilities, LGBTQ individuals, and pregnant women experience IPV at much higher rates. In addition to the risks associated with physical proximity caused by staying home, the economic impacts of the coronavirus pandemic could compound risk for IPV, particularly for women. Loss of jobs and income can exacerbate stress, risk of experiencing violence, or may make some people more financially dependent on an abusive partner.

While there is limited national data on the impact of the outbreak on IPV rates in the US during this time, some localized data is emerging. Examples in the US include Wilmington, North Carolina, where the DV shelter reported a 116% increase in calls from this same time last year, and Oregon, where calls to DV services have reportedly doubled since the emergency began. The National Domestic Violence Hotline has received calls and digital chats about abusive partners using COVID-19 as a scare tactic, such as preventing them from leaving the house or keeping them from seeking medical attention. A study of Los Angeles and Indianapolis police calls found an increase in DV calls, while calls for other crimes, such as burglary, decreased. The National Network to End Domestic Violence (NNEDV) reports hearing from state coalitions that chat and other digital services requests are up, while shelter requests are down.1  Understanding the full toll of the pandemic on IPV may take years, as cases of IPV are known to be undercounted and collecting data during a crisis can be more challenging.

DV service organizations are looking to research on IPV during and after natural disasters in developing guidance during this public health emergency. Natural disasters, similar to a public health crisis like COVID-19, involve threats to life and loss of loved ones, interruption of social systems and services, and a lack of socialization – all which have been linked to an increase in interpersonal violence against women and girls. Evidence suggests that requests for IPV services (particularly shelter) rise after the initial emergency of natural disasters have subsided.2  However, this will be challenging as it is estimated that there were more than 11,336 unmet requests per day for housing and emergency shelter from survivors of IPV last year, before the COVID-19 outbreak.

Policy Options to Support IPV Providers and Survivors

At the federal level, the Violence Against Women Act (VAWA), originally enacted more than 25 years ago, has been a foundational source of funding for resources and community responses to sexual and domestic violence. VAWA expired in 2018, and given the higher risk of IPV resulting from the pandemic, many have renewed the call for its reauthorization, which would ensure these funds continue to be available to address the fallout of the pandemic, particularly for shelters and hotlines. While some VAWA programs have been reappropriated and continue to be funded at their usual level, there are other policies and programs that consider the needs of IPV survivors and support organizations during COVID-19 including:

  • The CARES Act – The CARES Act includes some measures for addressing IPV, such as a moratorium on evictions for those in a covered housing program under VAWA. The act also builds on the existing Family Violence and Prevention Services Act (FVPSA) and provides $2 million for the National DV Hotline and awards $45 million to FVPSA formula grants, including for prevention efforts among Indian tribes and state DV coalitions.
  • The HEROES Act – The fourth proposed federal pandemic relief legislation, the HEROES Act, currently proposes to add $100 million for VAWA programs, such as transitional housing, which is expected to rise in demand as communities begin reopening. FVPSA programs would get an additional $50 million, $2 million of which will go to the National DV hotline. It would also authorize up to $100 million to community-based organizations to assist low-income women and survivors of domestic violence to protect their financial assets in the event of divorce from an abusive spouse. While the bill has passed the House, it is expected to be revised substantially if the Senate takes it up.
  • Telehealth and confidential mental health care – Many IPV programs provide mental health therapy and counseling by licensed practitioners by phone, over chat, or in person. Currently, many programs are looking to expand phone and digital communication abilities. While CMS has temporarily eased telehealth restrictions under HIPAA for some providers during the pandemic, clinicians who serve people affected by IPV must abide by stricter confidentiality laws. In particular, mental health clinicians that practice through DV response services cannot provide care over FaceTime or Skype, which have been approved by CMS for other telehealth services. Abusive partners can use technology to track and monitor those affected by IPV, making confidentiality particularly important for support services. Although each DV program must consider federal and state confidentiality laws, there are some platforms they can use to communicate with survivors.
  • Employer-based paid safe leave – Paid safe days allow people time off work to address issues stemming from sexual or domestic violence, such as physical recovery or obtaining legal or medical services, without losing pay. This can help protect job and financial security for those experiencing IPV. While there is no federal requirement for paid safe days, it has been proposed in federal legislation and is required by some state sick leave policies, typically as a component of an employer’s broader sick leave benefit.

Looking Forward

Some policymakers and DV providers are calling for increased support for IPV response services to help bridge gaps that already existed and address the aftermath of the Coronavirus pandemic. Emerging evidence and prior research shows that the pandemic and the economic fallout will place more people at risk for IPV. For them, the larger question is what the response of policymakers will be in the face of many competing community needs in the wake of the pandemic.

  1. KFF private communication with the National Network to End Domestic Violence (NNEDV) ↩︎
  2. Ibid. ↩︎

This raises the question: How are swing counties affected by the pandemic? In this post, we compare coronavirus cases and death rates across counties in the U.S., based on 2012 and 2016 presidential election voting history, with a particular focus on swing counties. (more…)

In the Middle of the Coronavirus Pandemic: How have Swing Counties Fared?

Authors: Rachel Fehr and Cynthia Cox
Published: Jun 11, 2020

Partisan divides have emerged along many dimensions of the coronavirus pandemic. Republicans are about three times more likely than Democrats to say their state is moving too slowly to reopen business and ease restrictions and Democrats are more likely than Republicans to report taking preventative measures like wearing masks in public. These partisan divides in opinions about the pandemic may be due in part to different partisan attitudes toward the public health response, as well as differences in COVID-19 prevalence between parts of the country. Indeed, as others have shown, the pandemic has hit Democratic counties harder than Republican counties.

This raises the question: How are swing counties affected by the pandemic? In this post, we compare coronavirus cases and death rates across counties in the U.S., based on 2012 and 2016 presidential election voting history, with a particular focus on swing counties. (more…)