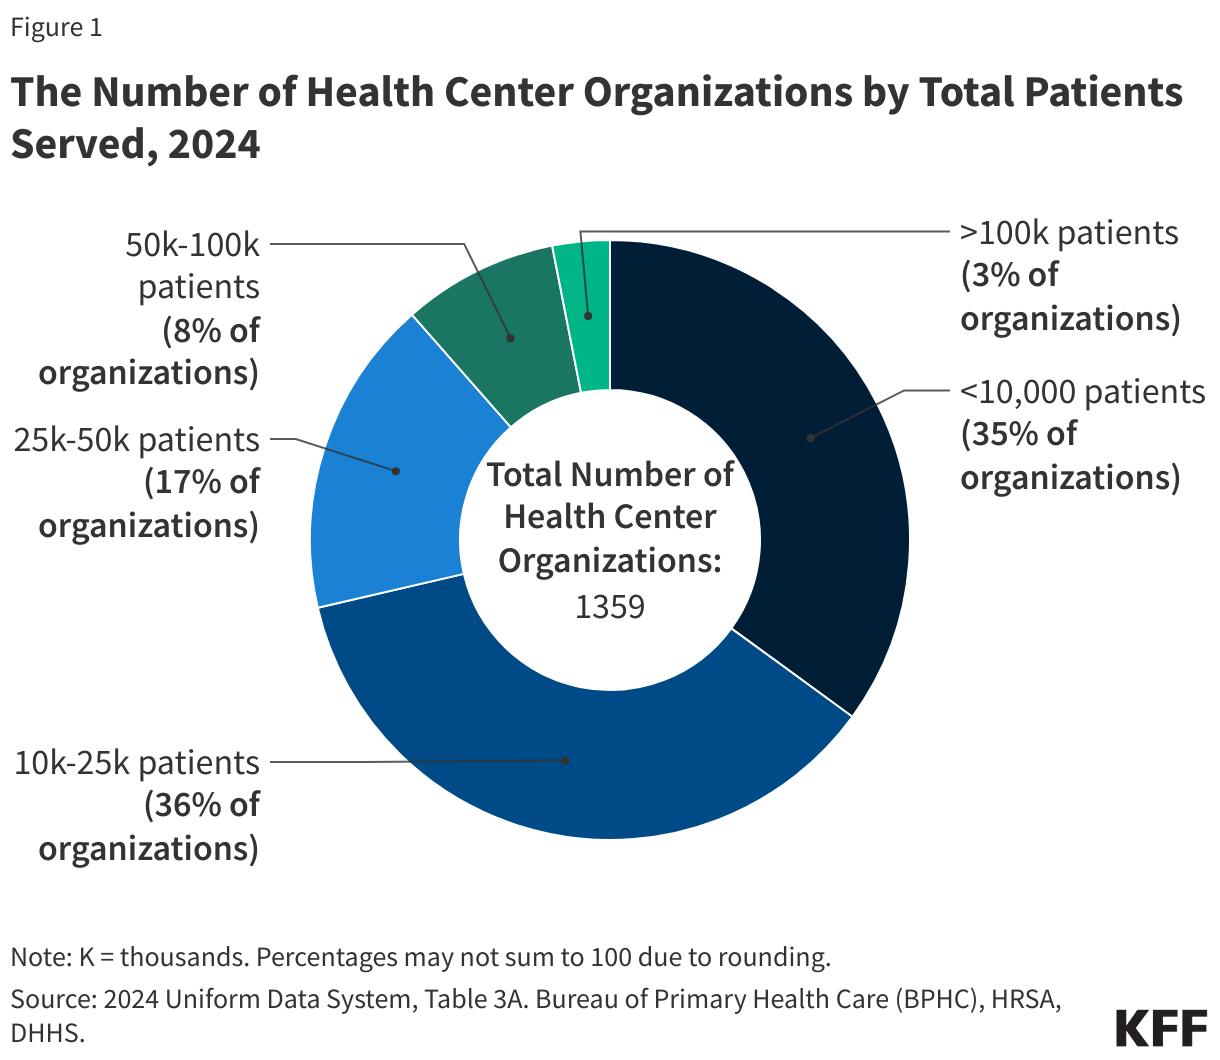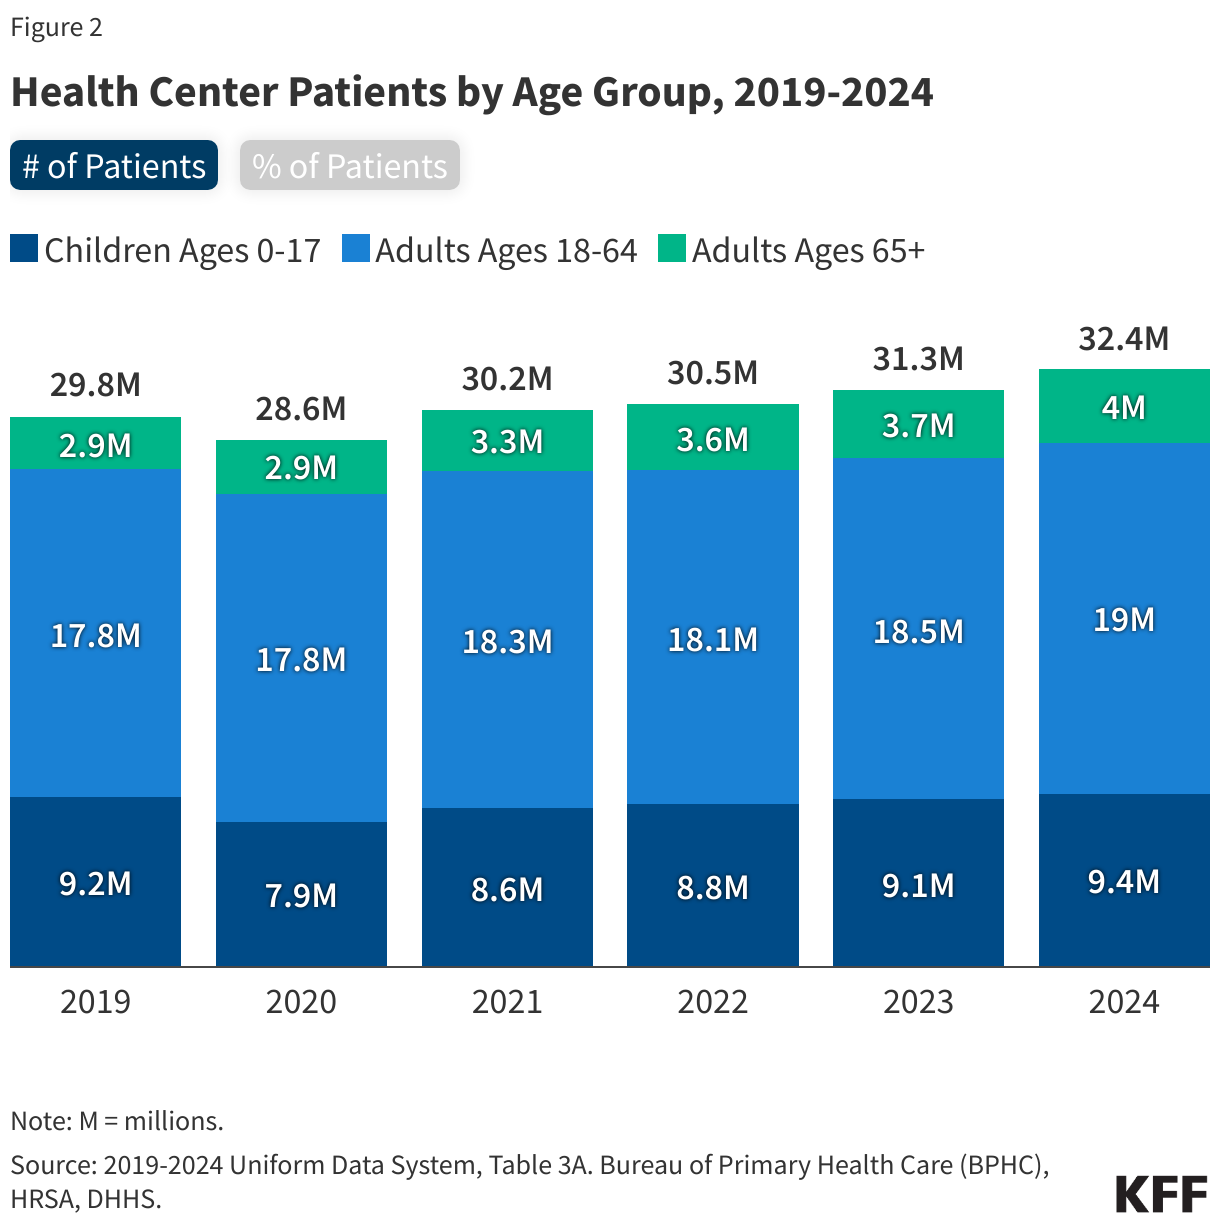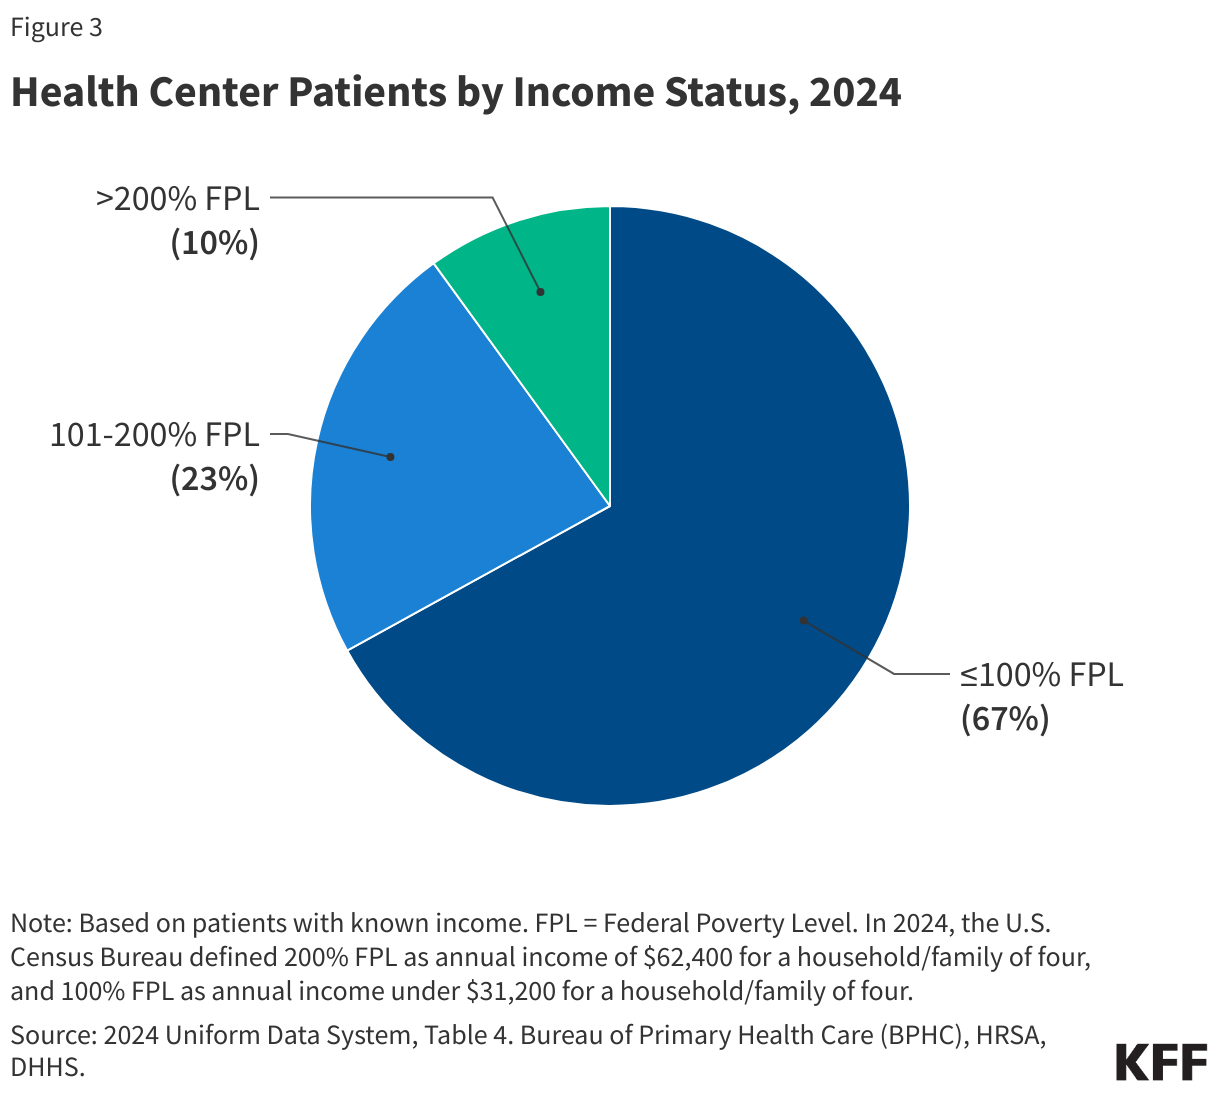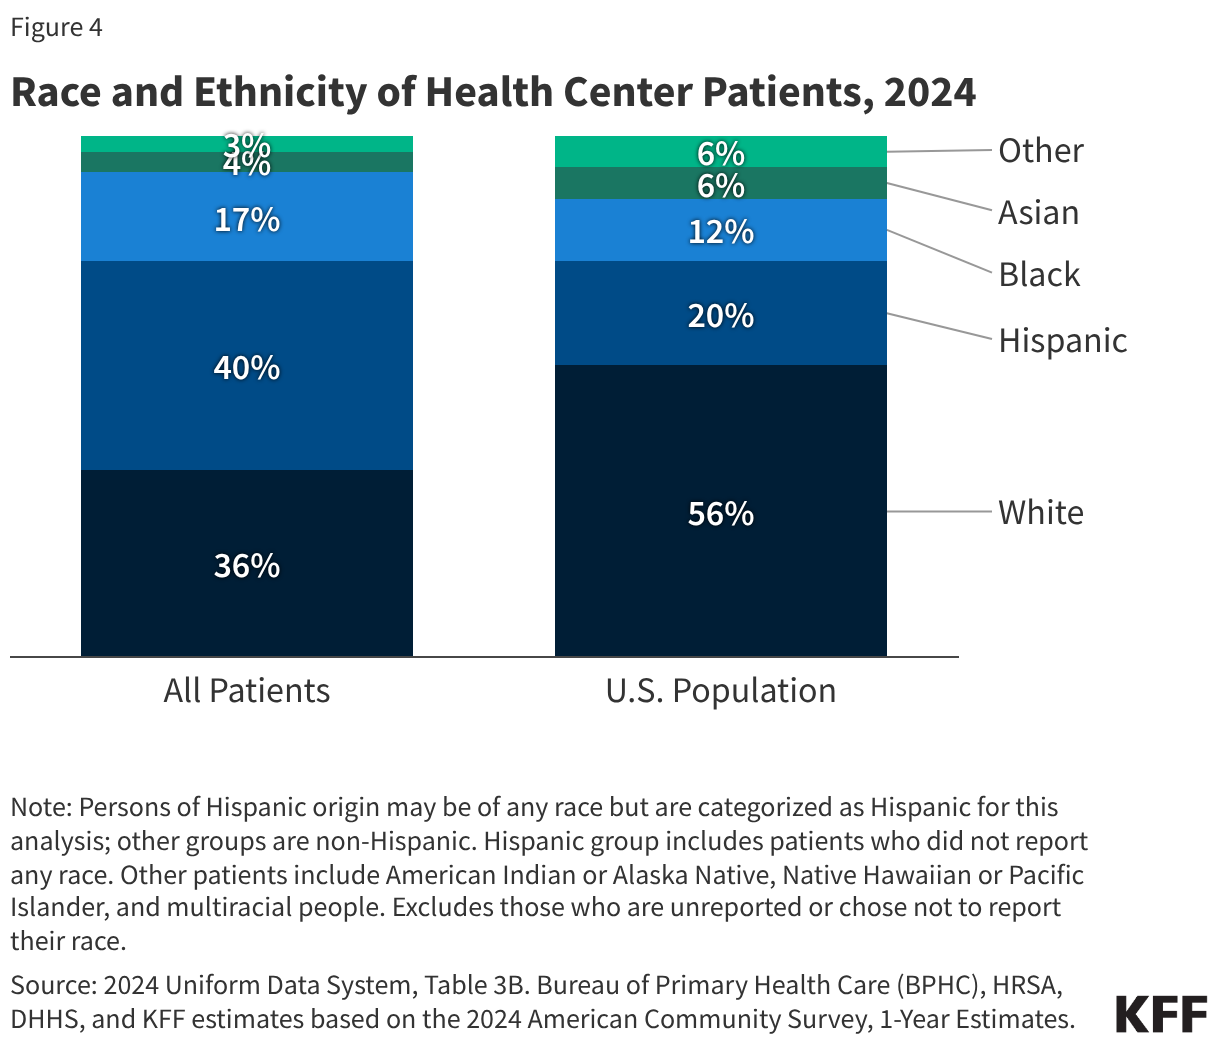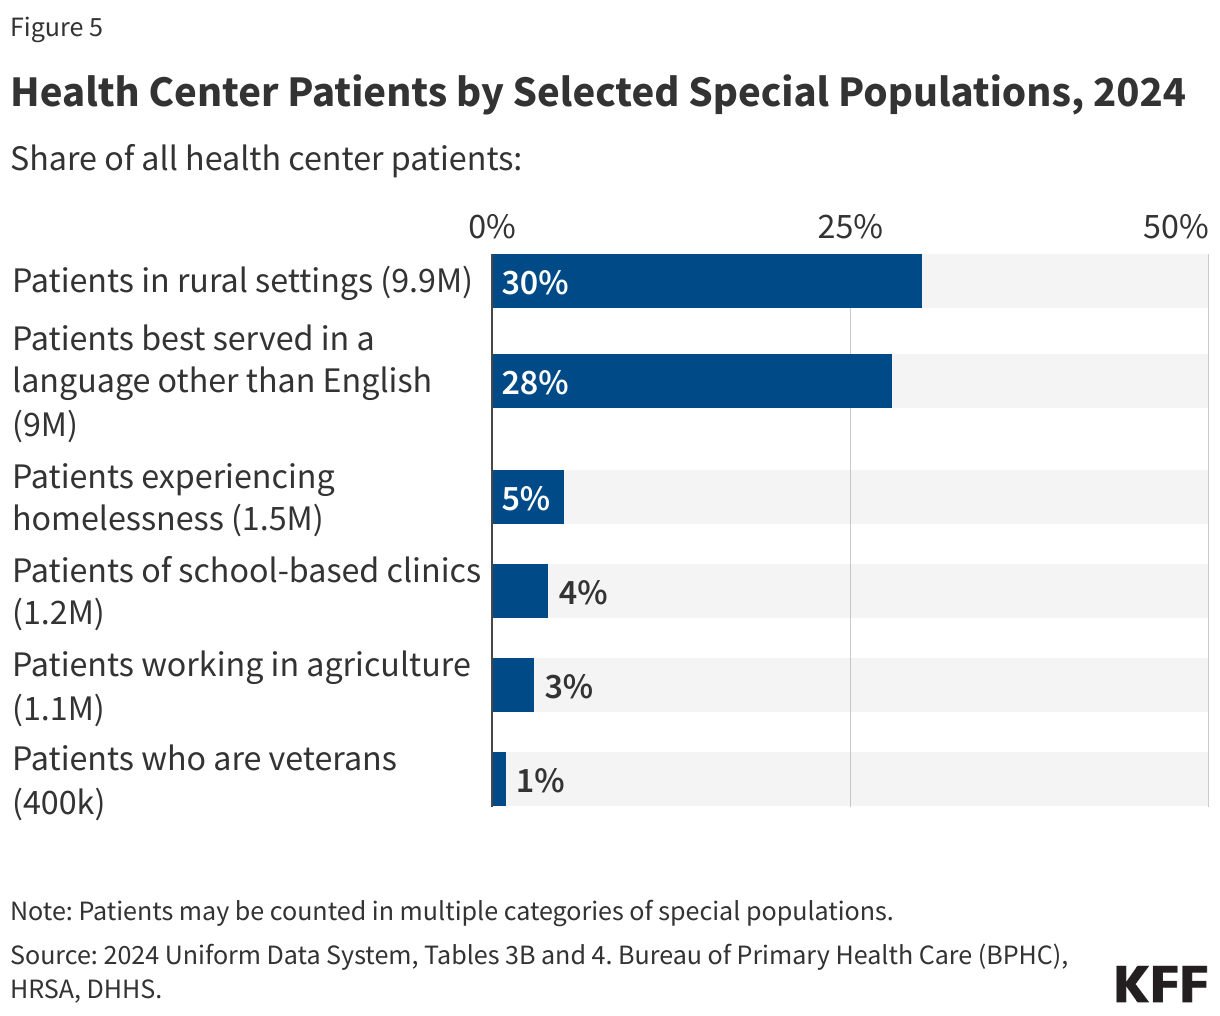
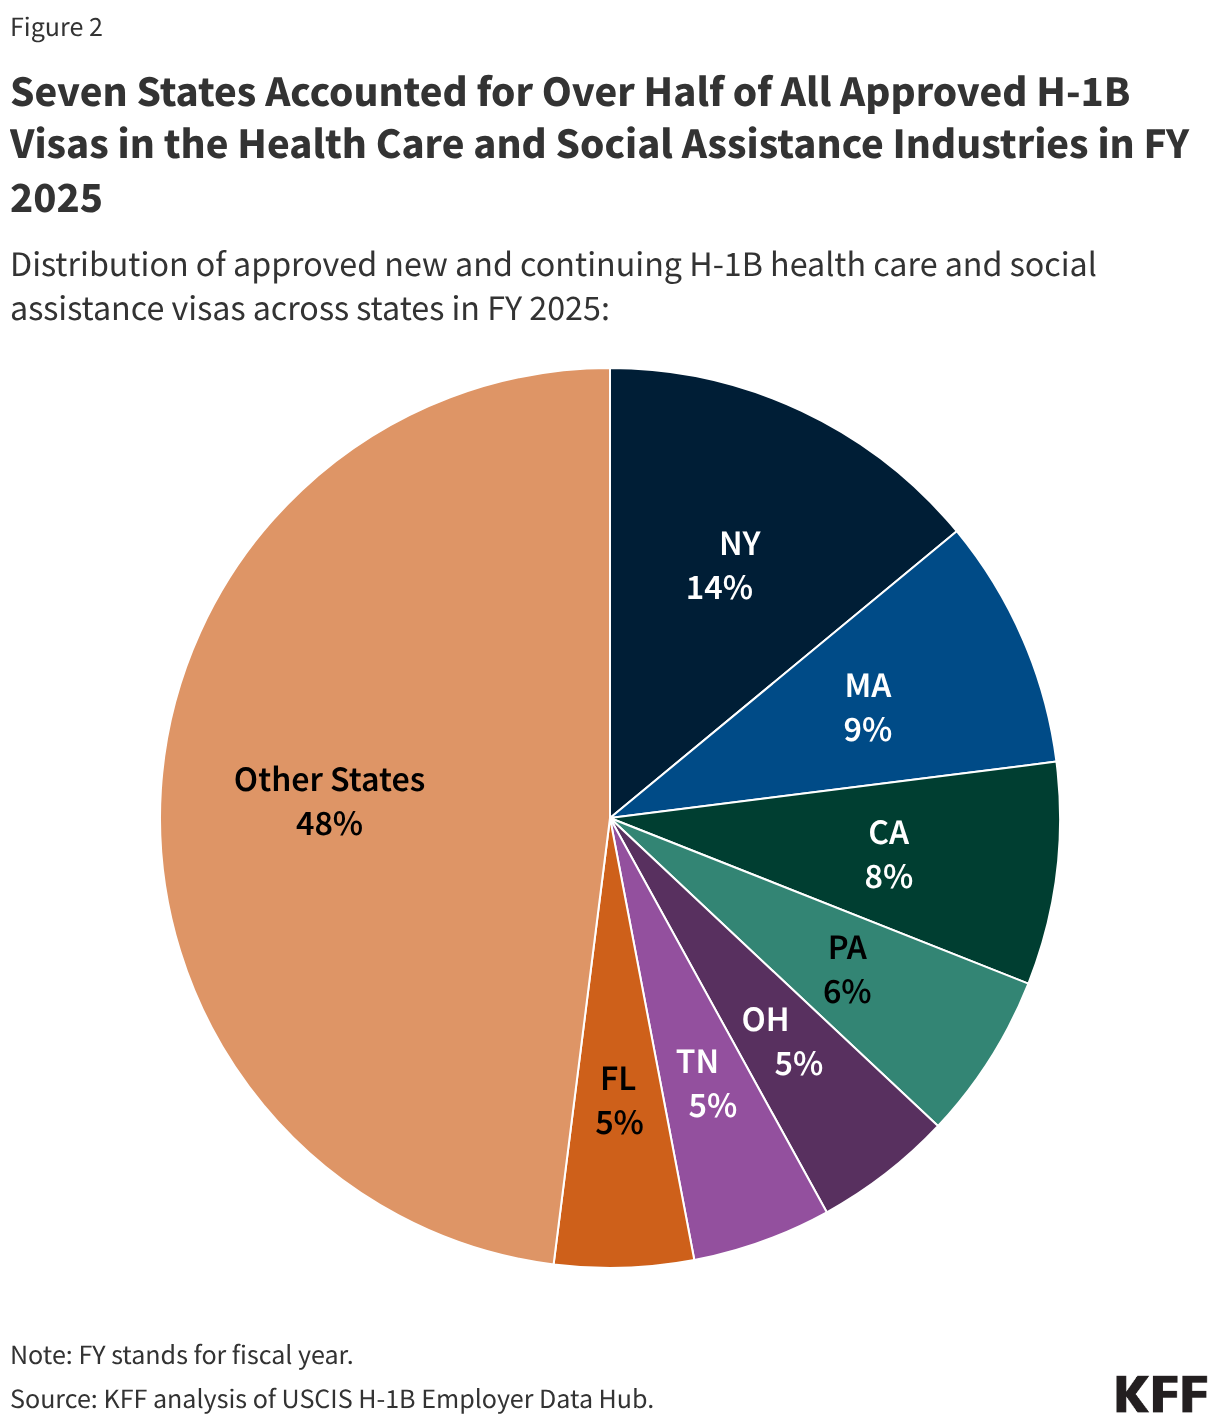
- Health centers served 32.4 million patients in 2024, an increase of over a million from 31.3 million patients in 2023. Nine in ten health center patients live in low-income households, over six in ten are patients of color, and three in ten live in rural areas.
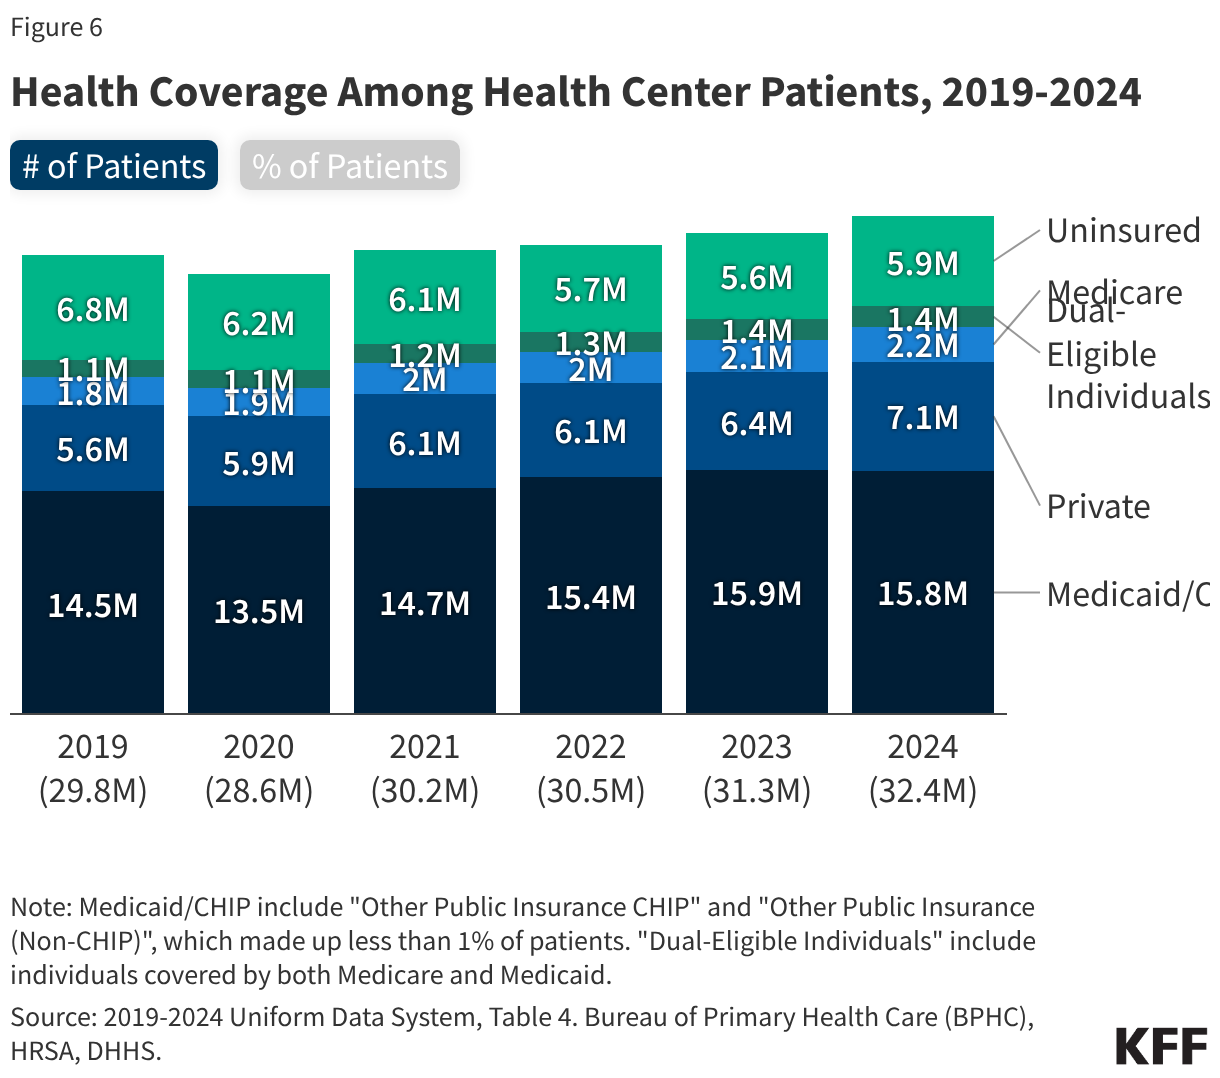
- About half of health center patients are covered by Medicaid while 22% have private insurance (including ACA Marketplace coverage) and 18% are uninsured. Despite an increase in the number of privately insured patients, the number of uninsured health center patients increased in 2024, likely due to the unwinding of the Medicaid continuous enrollment provision that led to a decline in the number of Medicaid patients, following several years in which the number of Medicaid patients increased.
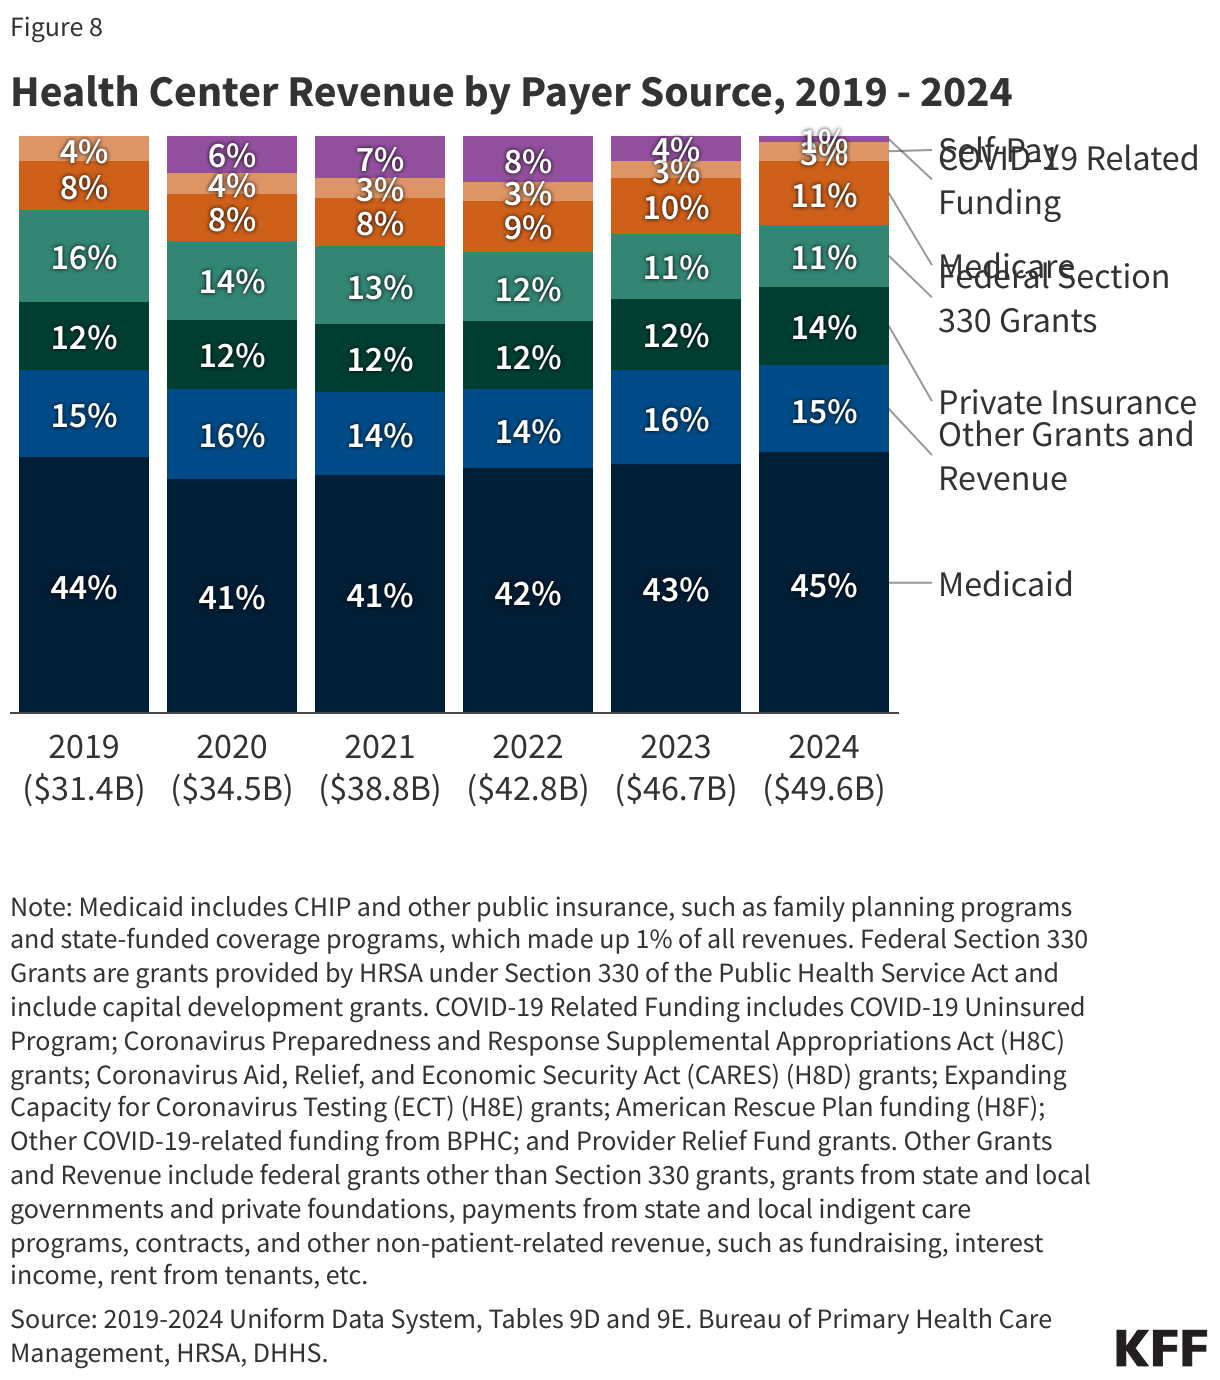
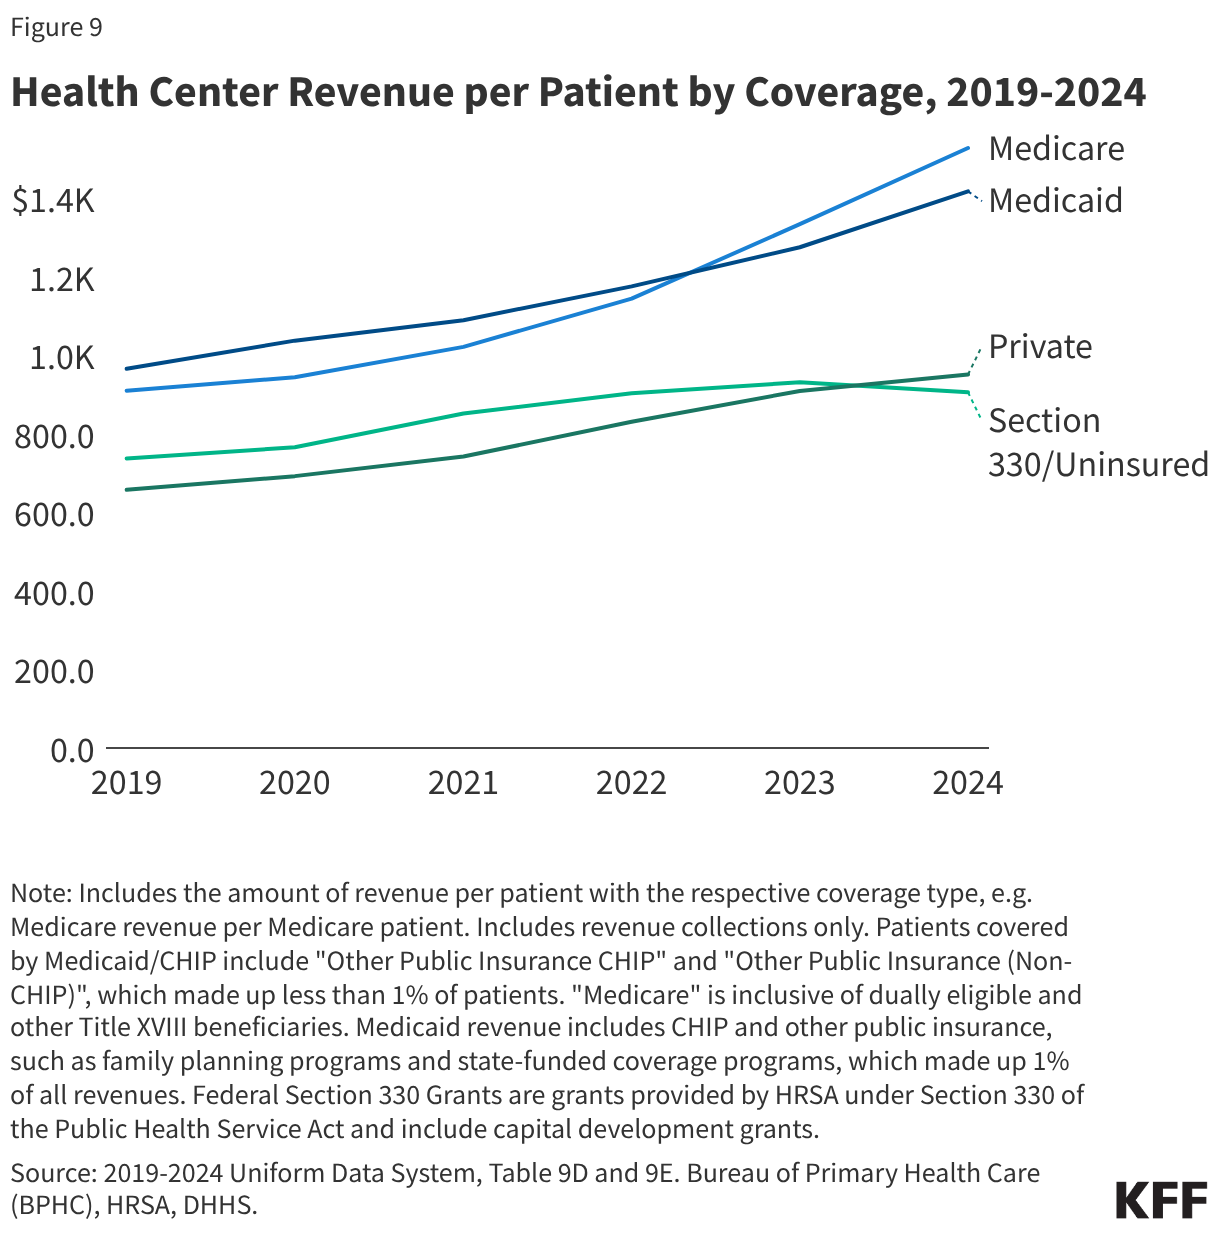
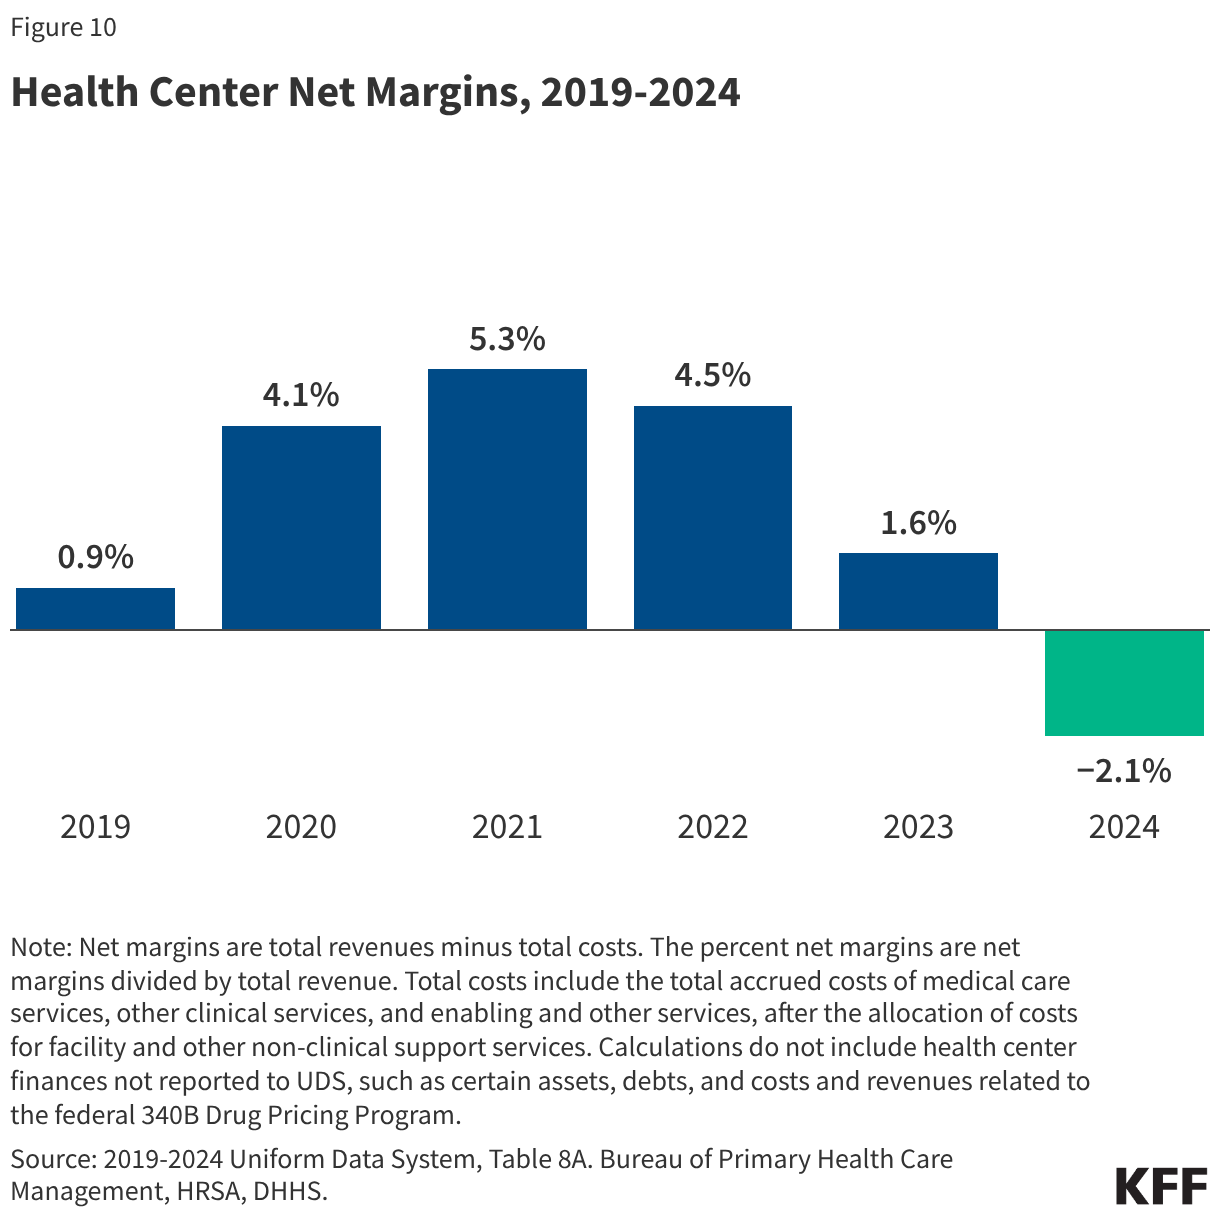
- Medicaid was the largest revenue source for health centers, accounting for 45% of the $49.8 billion in total health center revenue in 2024. Health center revenue increased in 2024 due to growing patient volume and revenue from payers, but net margins that account for revenue and costs fell from 1.6% in 2023 to -2.1% in 2024.
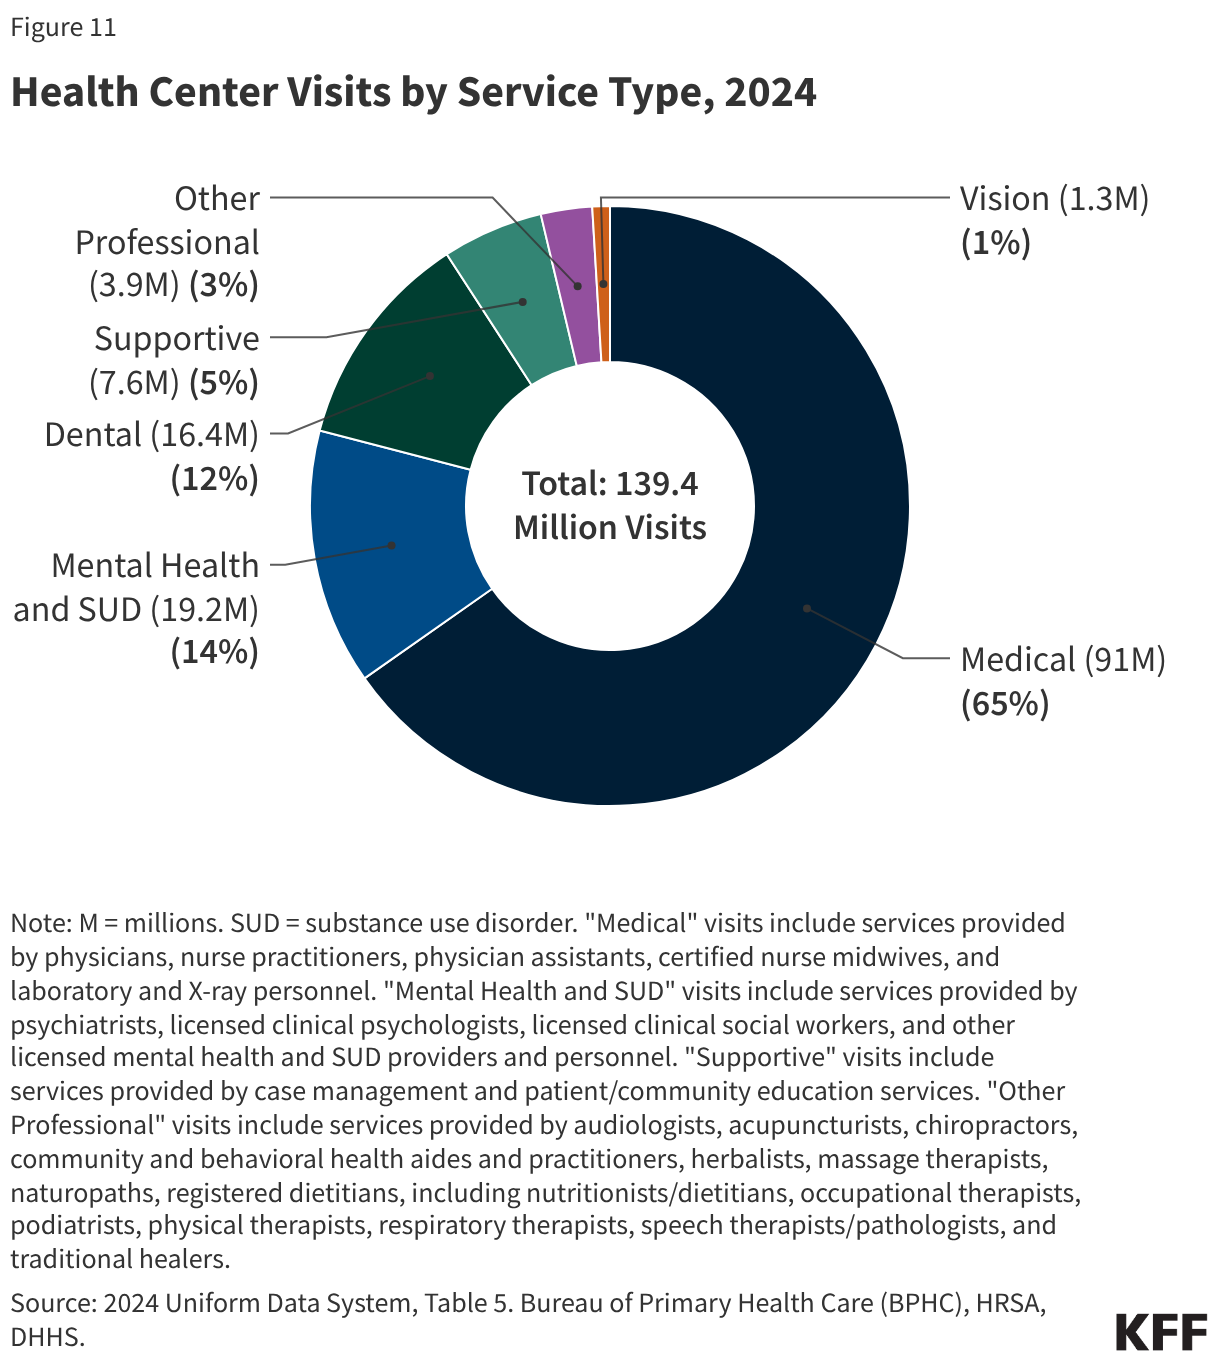
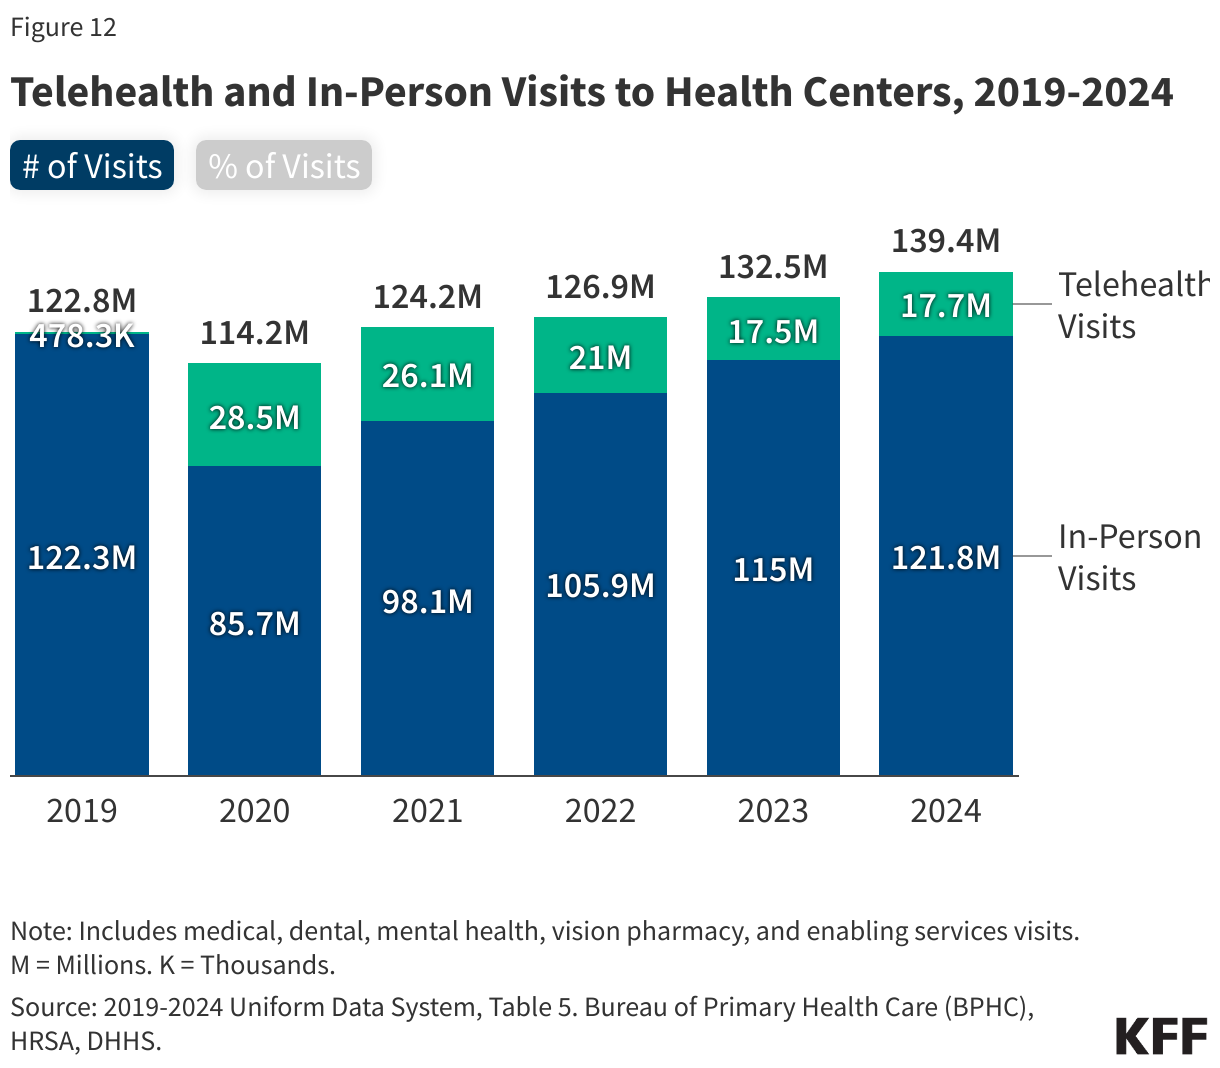
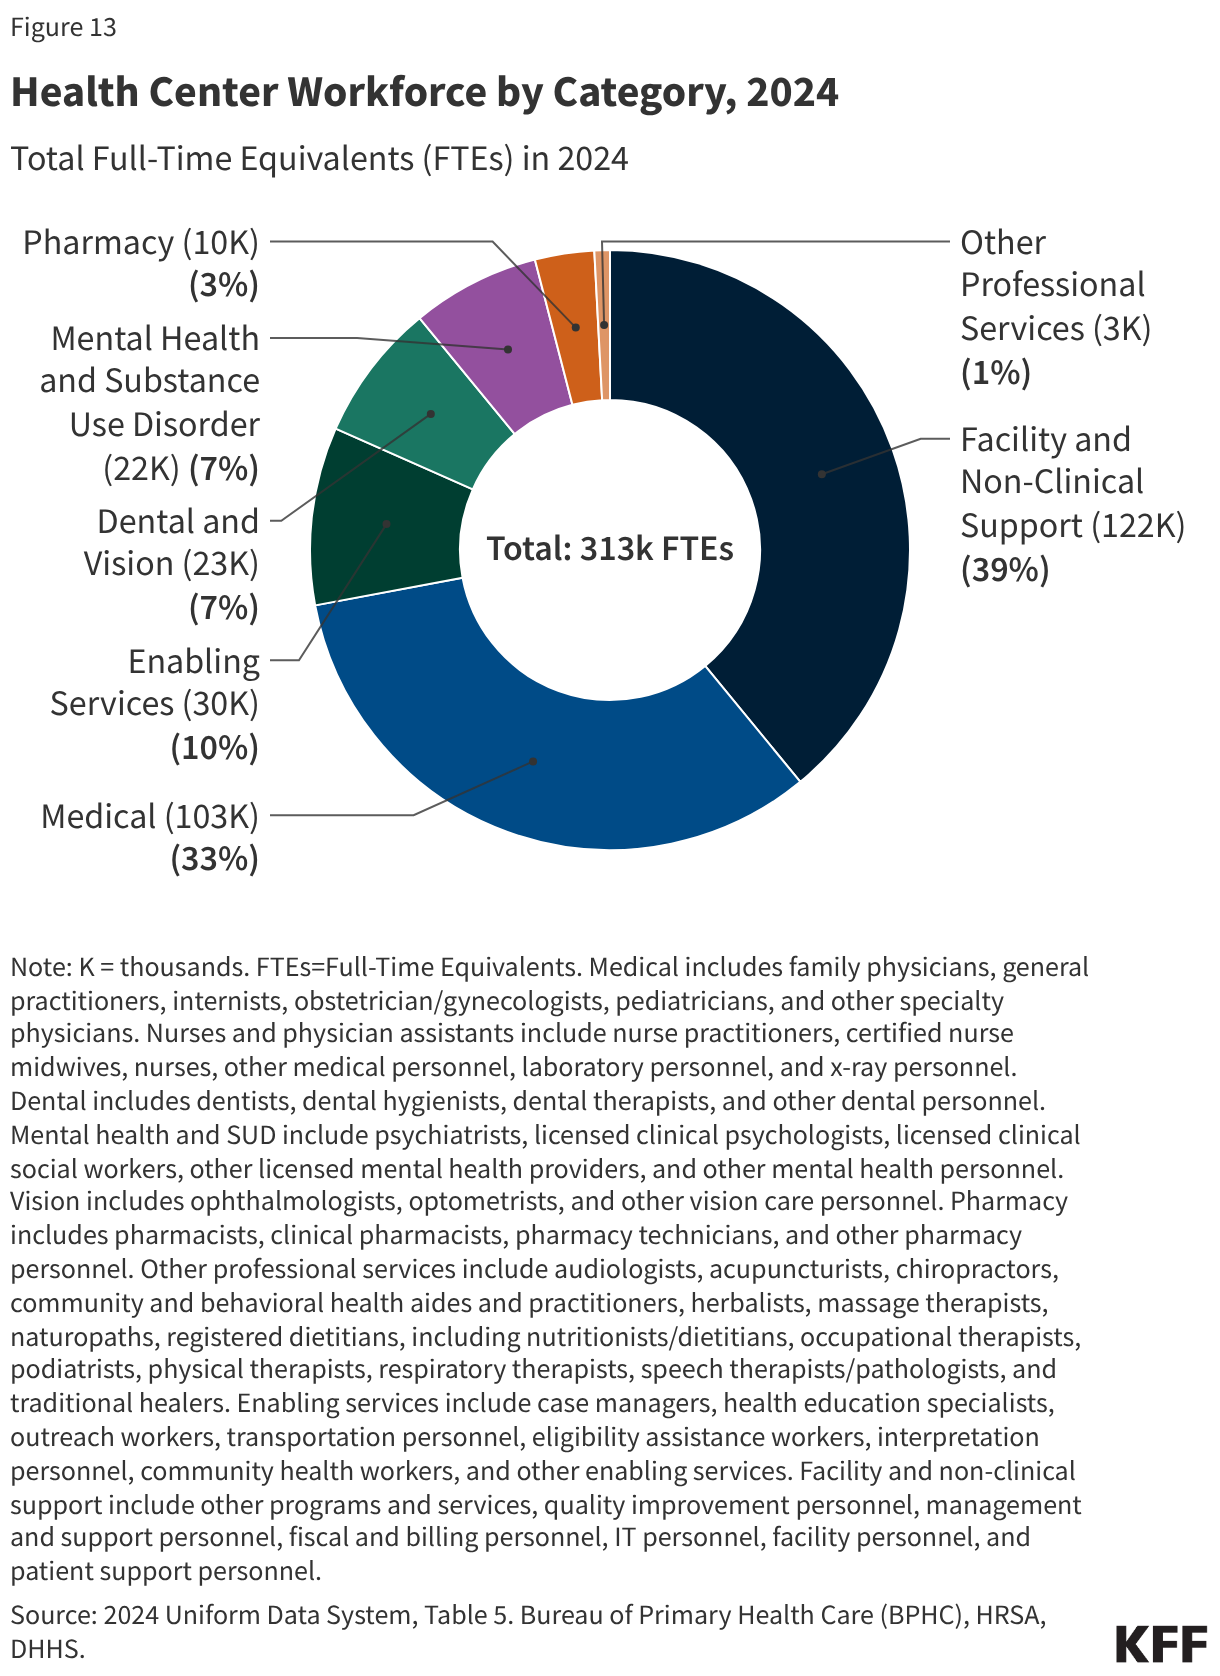
- Of the more than 139 million patient visits in 2024, 65% were for medical services, 14% were for mental health and substance use disorder (SUD) services, and 12% were for dental care. The share of health center visits conducted via telehealth remained steady from 2023, with 17.7 million telehealth visits (13%) in 2024.
- Amid significant federal policy changes and funding uncertainty, health centers face a number of challenges. Changes to Medicaid and the ACA Marketplace included in the 2025 reconciliation law and the expiration of ACA Marketplace enhanced premium tax credits at the end of 2025 are likely to increase the number of uninsured patients and patients who cannot afford out-of-pocket costs, placing new financial burdens on health centers. In addition, increased immigration enforcement in health care settings along with proposed changes to federal immigration policies may sow confusion and fear of using health center services among immigrant patients. At the same time, health centers face ongoing financial uncertainty amid federal funding stand-offs in Congress. The 2026 Consolidated Appropriations Act increases slightly health center funding to $4.6 billion for fiscal year 2026, but only extends funding through December 2026, including for the Community Health Center Fund, which was designed to provide more stable, longer-term funding.
Poll Finding
KFF Tracking Poll on Health Information and Trust: Trust in the CDC and Views of Federal Childhood Vaccine Schedule Changes
Section:
Findings
Key Takeaways
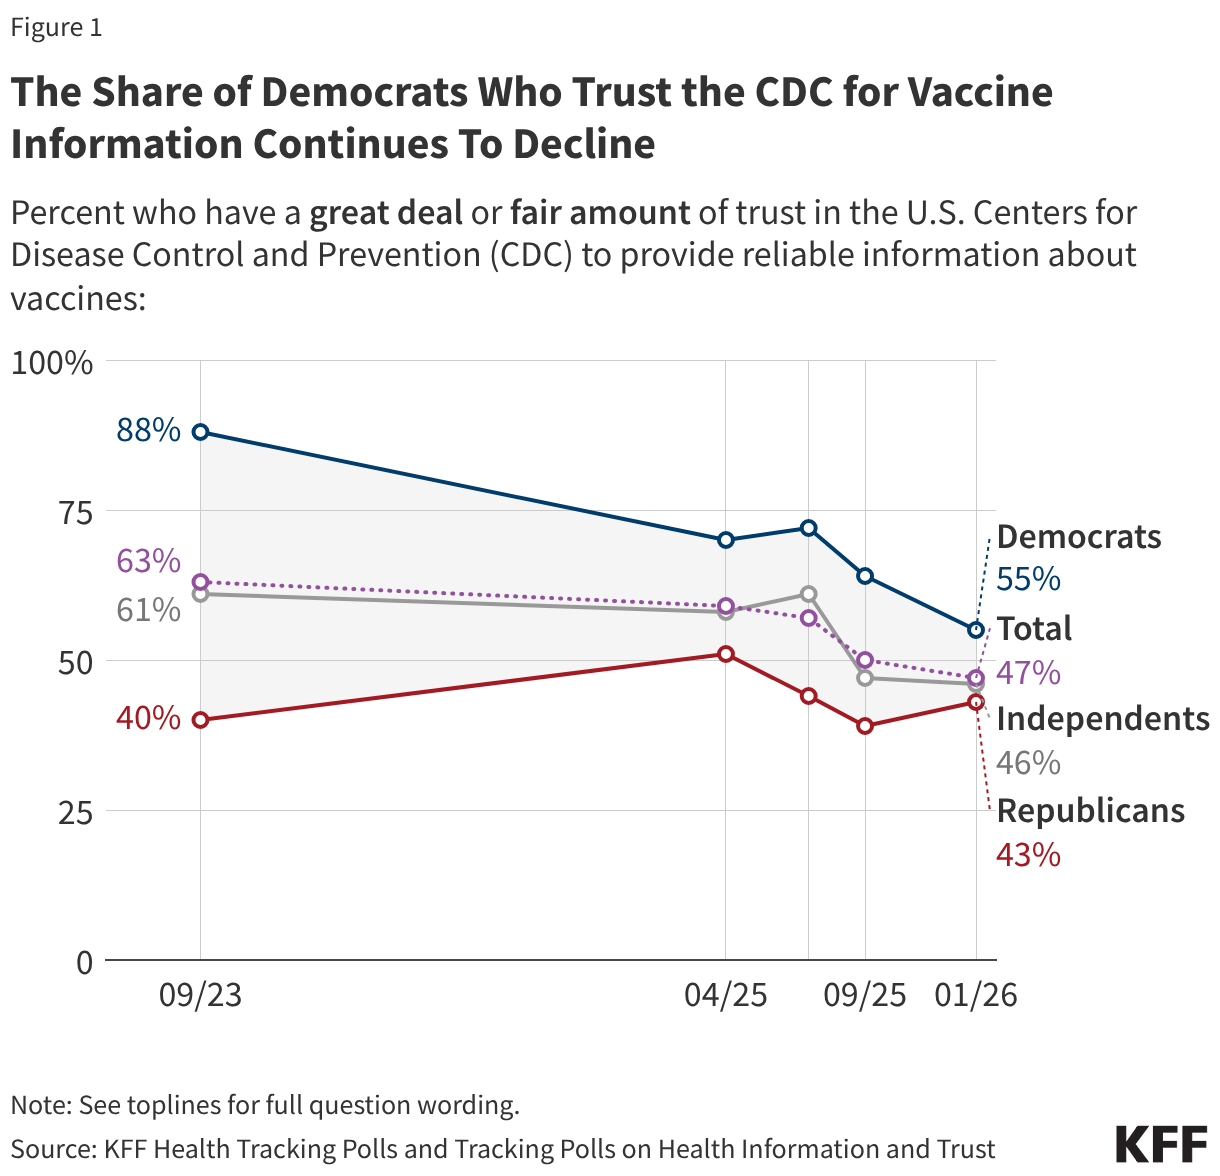
- In the weeks following the Trump administration’s announcement of changes to the recommended childhood vaccine schedule, the public’s trust in the CDC remains at its lowest point since the COVID-19 pandemic, including a 9-percentage point drop among Democrats in recent months saying they trust the CDC for reliable vaccine information. Just over half (55%) of Democrats and fewer Republicans (43%) and independents (46%) now say they trust the agency for vaccine information. In addition, fewer than half of adults (44%) express confidence in U.S. federal health agencies to make recommendations about the childhood vaccine schedule.
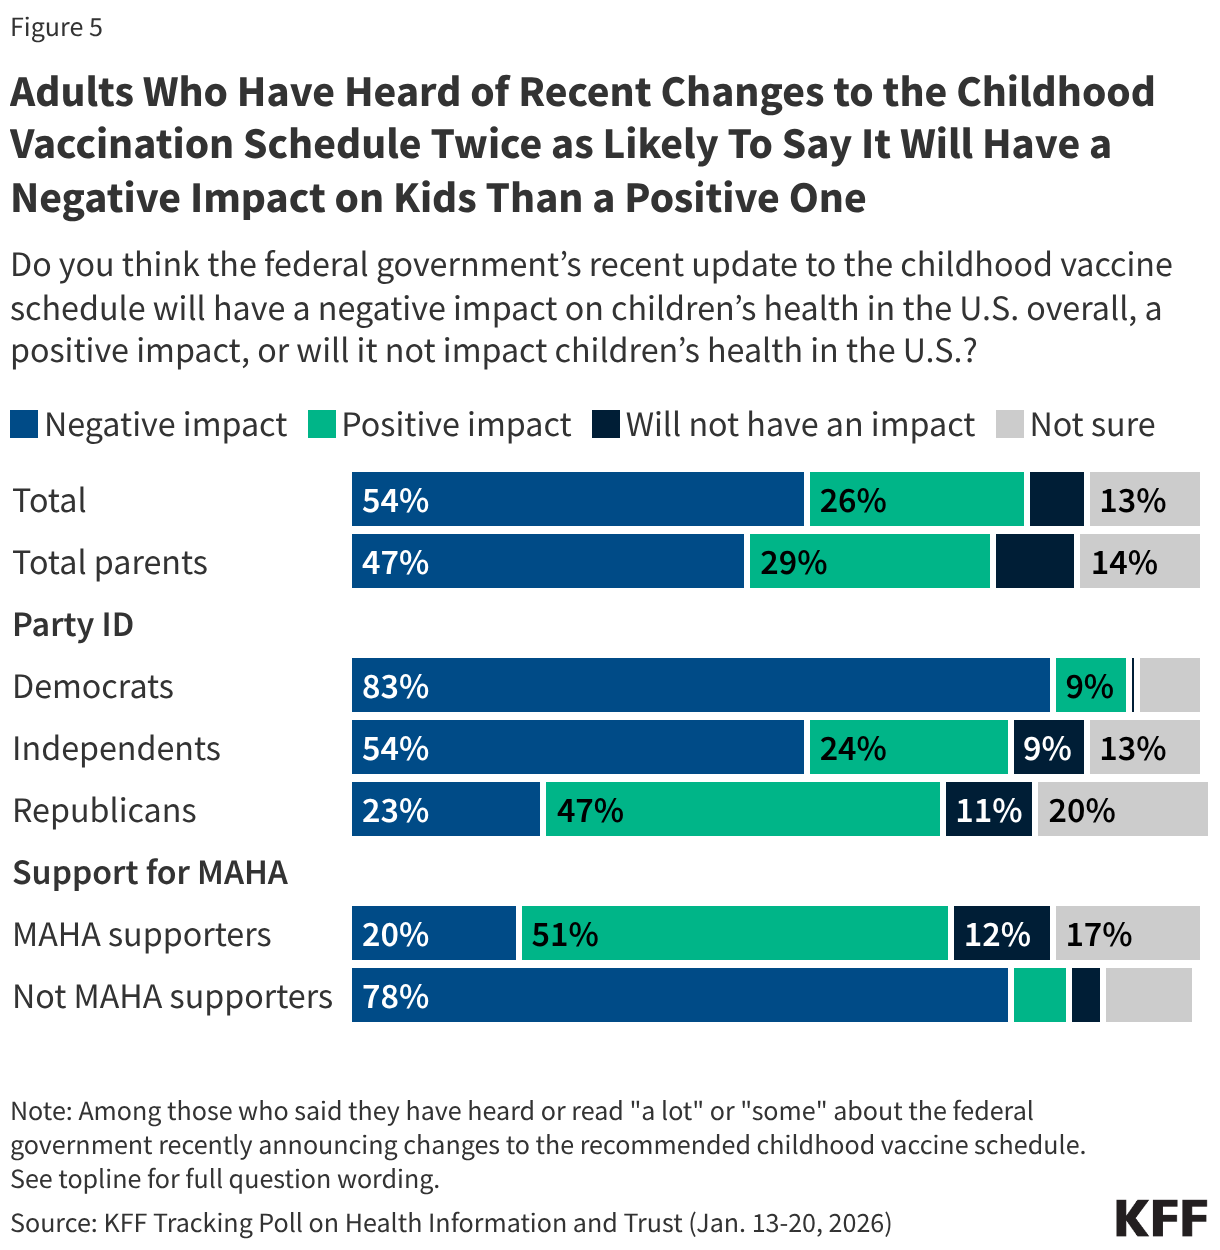
- Among the half of U.S. adults who report hearing about the recent changes to the childhood vaccine schedule, more say the changes will have a negative impact (54%) on children’s health than a positive one (26%). Partisans are split, with most Democrats who are aware of the change saying it will have a negative impact on children (83%, or 63% of all Democrats), while Republicans are more likely to say it will have a positive impact (47% of Republicans who are aware of the change, or 34% of all Republicans). About one in five Republicans who are aware of the changes say they will negatively impact children’s health and an additional one in five say they are not sure.
- At least eight in ten U.S. adults across partisans and parents are confident – including about half who of adults who are “very confident” – in the safety of measles, mumps, and rubella (MMR) and polio vaccines, two longstanding childhood vaccines that continue to be recommended as routine. Majorities of adults are also confident in the safety of two of the vaccines that are no longer universally recommended for children following recent changes, hepatitis B (70%) and flu (65%), though fewer are “very confident,” and views are somewhat divided along partisan lines. Fewer (48%) adults are confident in the safety of COVID-19 vaccines for children, including just one in four who are “very confident.” Partisan divisions are sharpest when it comes COVID-19 vaccines, with just three in ten Republicans compared to eight in ten Democrats expressing confidence that they are safe for children.
Confidence and Trust in Federal Health Agencies
In January, the U.S. Centers for Disease Control and Prevention (CDC) announced the Trump administration’s major changes to the federally recommended vaccination schedule for children. This change – along with changes that started in October 2025 – reduces the number of diseases targeted for routine vaccination from 17 to 11, positioning the U.S. as an outlier among peer nations.1 In the weeks following this change, the latest KFF Tracking Poll on Health Information and Trust finds that the public’s trust in the CDC remains at its lowest level since the beginning of the COVID-19 pandemic. Fewer than half (47%) of the public says they have a “great deal” or “fair amount” of trust in the CDC to provide reliable information about vaccines.
Trust among Democrats has declined by nine percentage points since September 2025 (from 64% to 55%) and is down sharply from 88% in September 2023. About four in ten Republicans (43%) and half of independents (46%) say they trust the CDC for reliable information about vaccines, similar to the shares who said the same in September of last year.
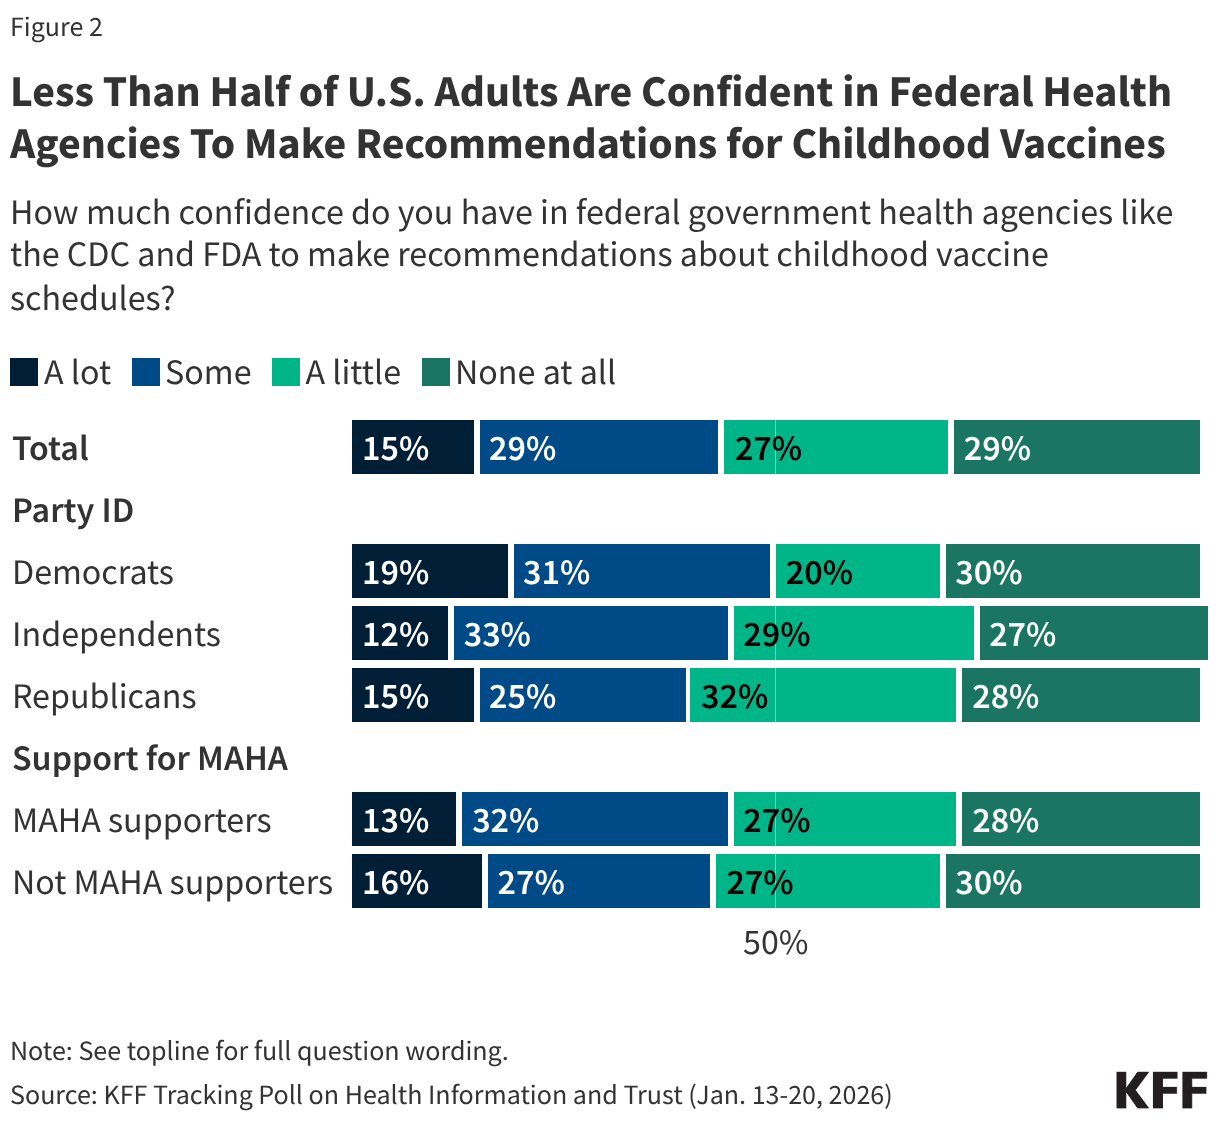
One year into President Trump’s second term, fewer than half of adults are confident in federal health agencies like the CDC and the U.S. Food and Drug Administration (FDA) to carry out some of their responsibilities, including making recommendations for children’s vaccines. Most adults (56%) say they have “little” to “no confidence” in federal health agencies to make recommendations about childhood vaccine schedules, including three in ten (29%) who have no confidence “at all.” Just over four in ten have “a lot” (15%) or “some” (29%) confidence in the agencies’ ability to do this.
About half of Democrats (51%) say they have at least “some” confidence in government health agencies to make recommendations about childhood vaccine schedules, compared to fewer Republicans (40%). Forty-five percent of independents say they are confident in government health agencies to make these recommendations, while 55% say they have “a little” confidence or “none at all.”
Mirroring Republicans, fewer than half of supporters of the Make America Healthy Again (MAHA) movement say they trust U.S. federal health agencies to make recommendations about vaccine schedules (45%). Overall, 45% of U.S adults say they are supporters of the MAHA movement, and this group is largely made up of Republicans and Republican leaners (65%) and Make America Great Again (MAGA) supporters (53%).
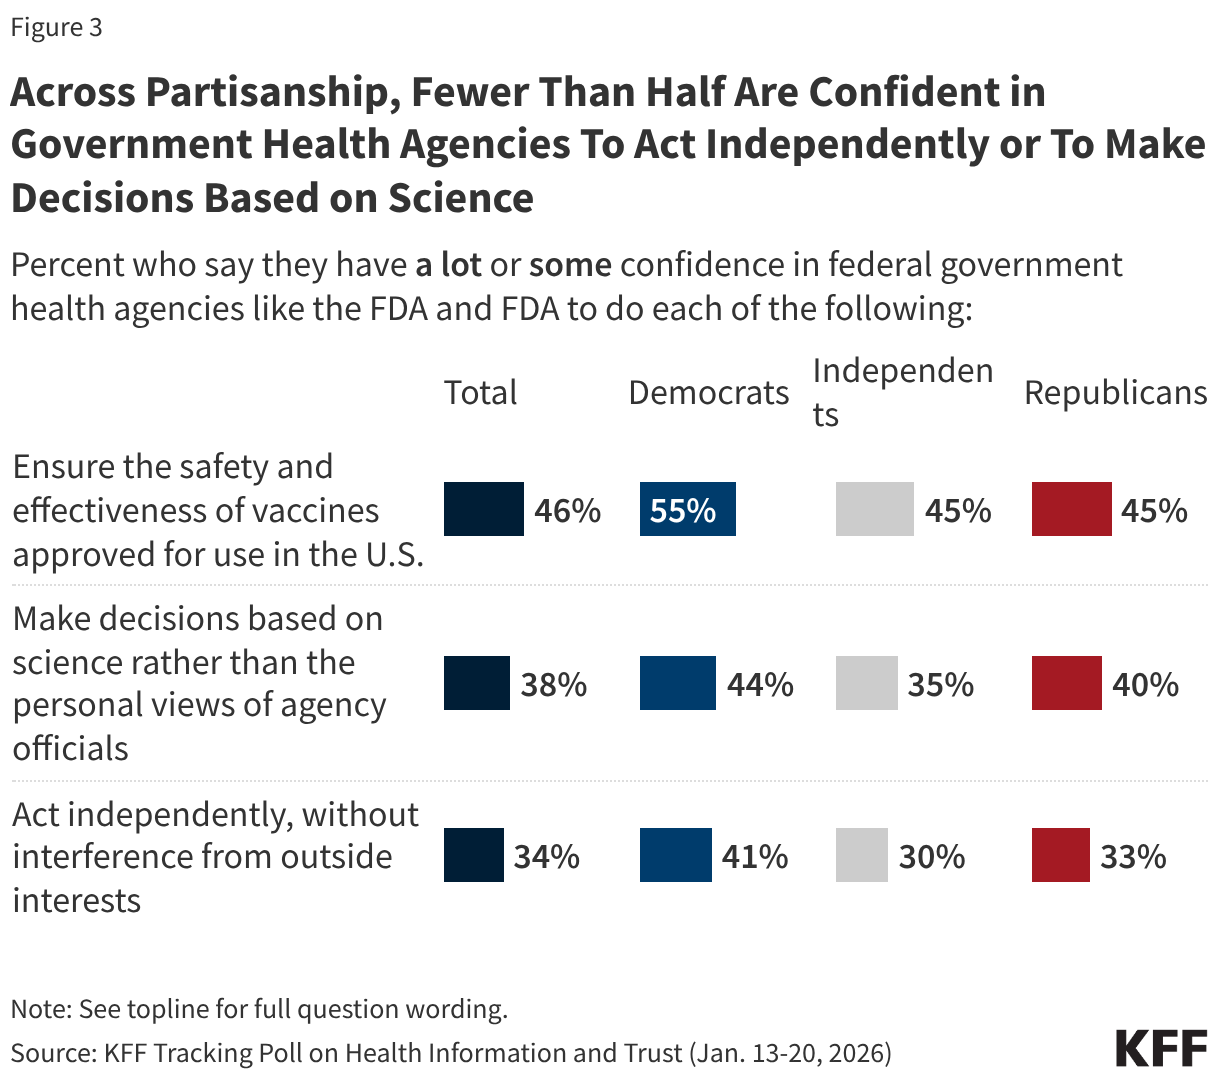
This limited confidence extends beyond childhood vaccine recommendations to other core responsibilities of federal health agencies. Fewer than half of the public have at least “some” confidence in the agencies to ensure safety and effectiveness of vaccines approved for use in the U.S. (46%), make decisions based on science rather than the personal views of agency officials (38%), or act independently, without interference from outside interests (34%).
Democrats have more confidence than Republicans in these agencies to ensure vaccine safety and effectiveness (55% of Democrats vs. 45% of Republicans) and act independently, without outside interference (41% of Democrats vs. 33% of Republicans). Similar minorities of Democrats (44%) and Republicans (40%) express confidence in federal health agencies to make decisions based on science rather than personal views of agency officials.
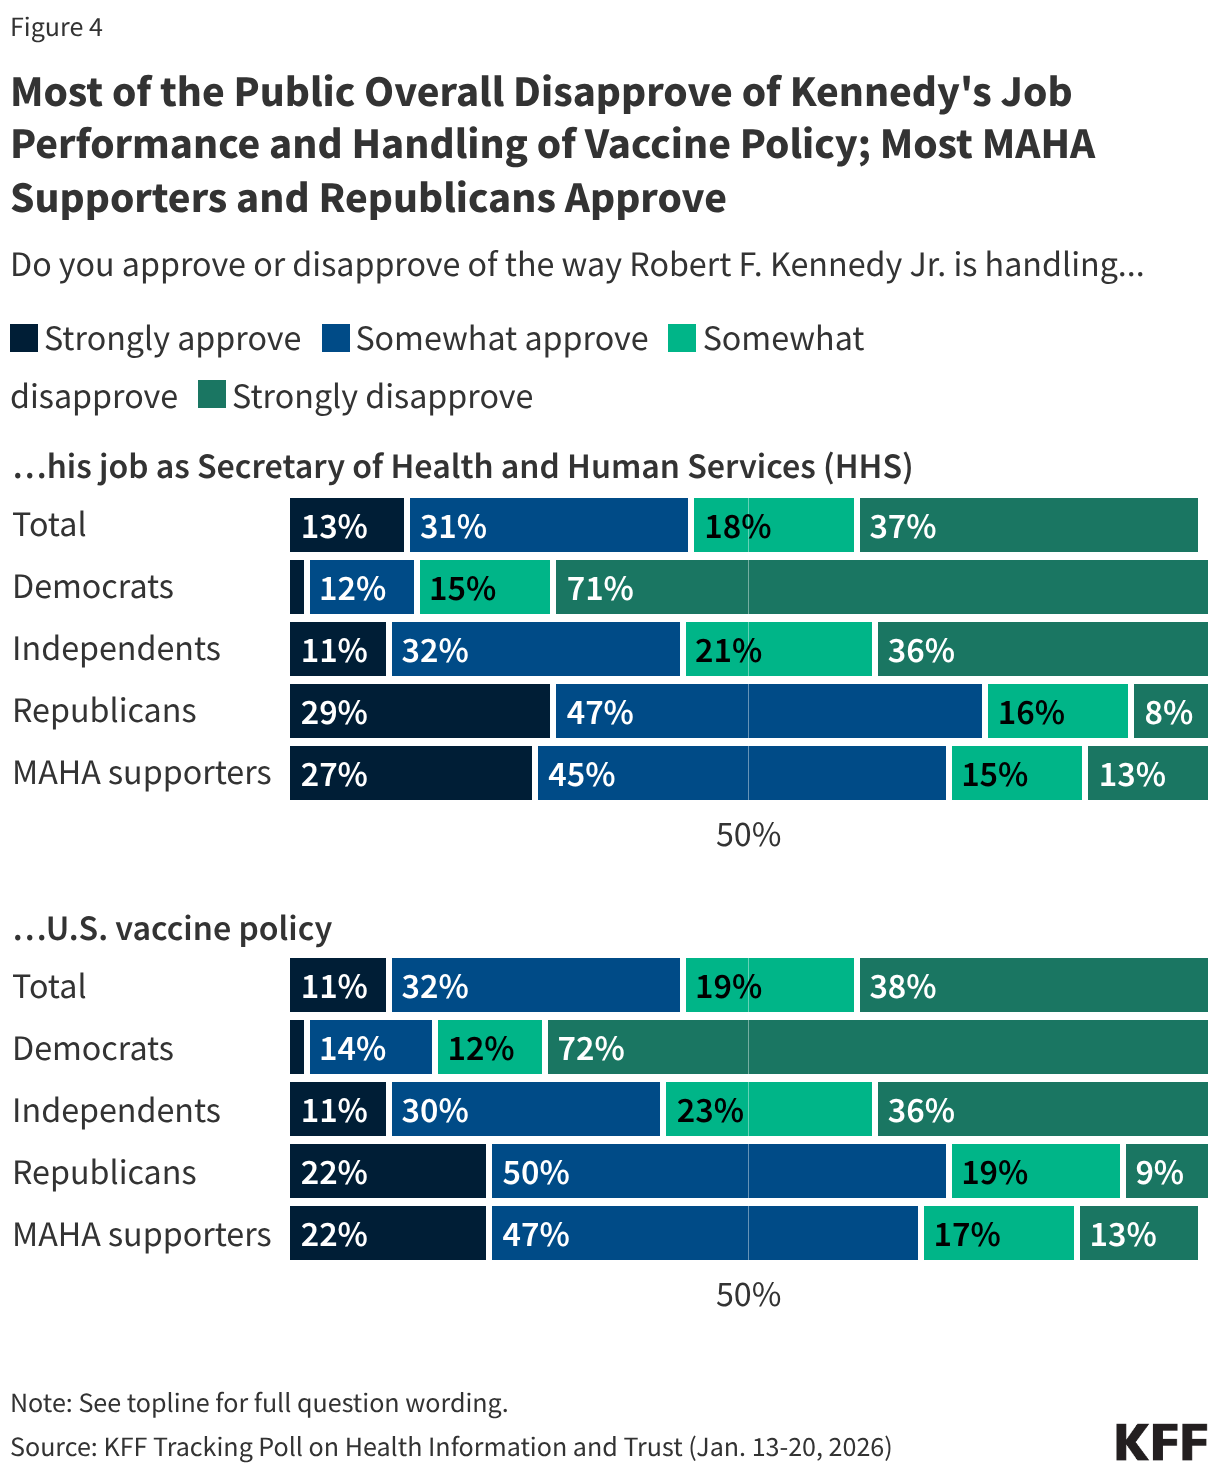
KFF’s latest Tracking Poll on Health Information and Trust finds that a majority of the public continue to disapprove of Robert F. Kennedy Jr.’s job performance as Health and Human Services (HHS) Secretary and his handling of U.S. vaccine policy. About four in ten (44%) say they approve of his handling of his job as HHS Secretary, compared to over half who say they disapprove (55%). Similarly, about four in ten (43%) approve of Kennedy’s handling of U.S. vaccine policy while nearly six in ten (57%) disapprove. This is a slight change from September when 37% approved of his handling of vaccine policy, but views remain sharply divided along partisan lines, with large shares of Democrats disapproving and large shares of Republicans approving. Among supporters of the MAHA movement, about seven in ten approve of Kennedy’s job performance overall (72%) and his handling of vaccine policy (69%).
Reactions to the Federal Changes in the Recommended Childhood Vaccine Schedule
About half of the public, and a similar share of parents, say they have heard “a lot” (14%) or “some” (38%) about the federal government’s recent changes to the recommended childhood vaccine schedule. The other half report limited awareness, including three in ten who have not heard much (28%) and one in five who have heard “nothing at all” (21%).
Among those who have heard at least “some” about the changes, reactions tilt negative but are more positive among Republicans and MAHA supporters. For example, among the half of the public who have heard about the recent changes to the childhood vaccine recommendations, twice as many say the change will have a negative impact on children’s health (54%) as say it will have a positive impact (26%). Views of how the change will impact children is divided among partisans, with about eight in ten Democrats who are aware of the change saying it will negatively impact children’s health (83%, or 63% of total Democrats). Nearly half of Republicans who are aware of the change say it will have a positive impact (47%, or 34% of total Republicans). About one in five Republicans who have heard about the change say it will either have a negative impact (23%) or aren’t sure of the impact it will have (20%).
Again, mirroring views of Republicans overall, about half of MAHA supporters who are aware of the changes say they will positively impact children’s health (51%, 33% of total MAHA supporters), compared to one in five who say it will have a negative impact on children’s health.
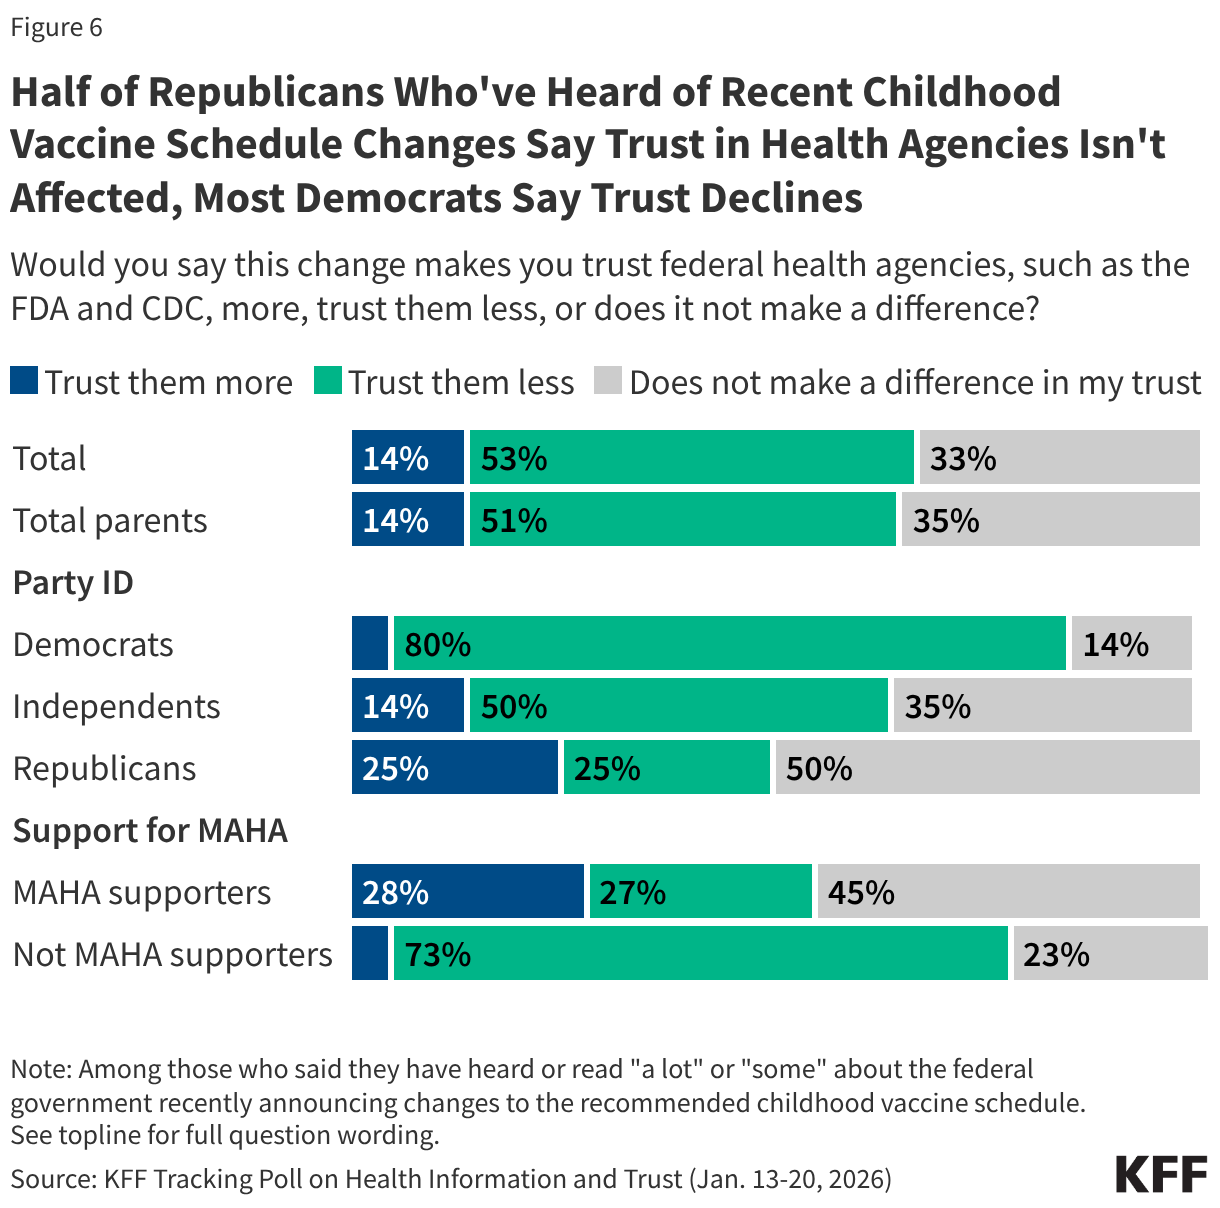
In a statement made about the change, Health Secretary Kennedy predicted it would “rebuild trust in public health.” However, those who are aware of recent changes to the federal vaccine recommendations are also nearly four times as likely to say that the change makes them less trusting of federal health agencies such as the FDA and CDC (53%) rather than more trusting (14%), while one-third of this group (33%) say the change does not make a difference in their trust.
Supporters of the MAHA movement have mixed reactions. Similar shares of MAHA supporters who are aware of the change say it makes them trust federal agencies more (28%) or less (27%), while at least four in ten (45%) say this does not affect their level of trust. Partisans are divided, with most Democrats who are aware of the change saying it makes them less trusting of federal health agencies (80%) while about half of Republicans saying it does not impact their trust.
Confidence in Safety of Vaccines for Children
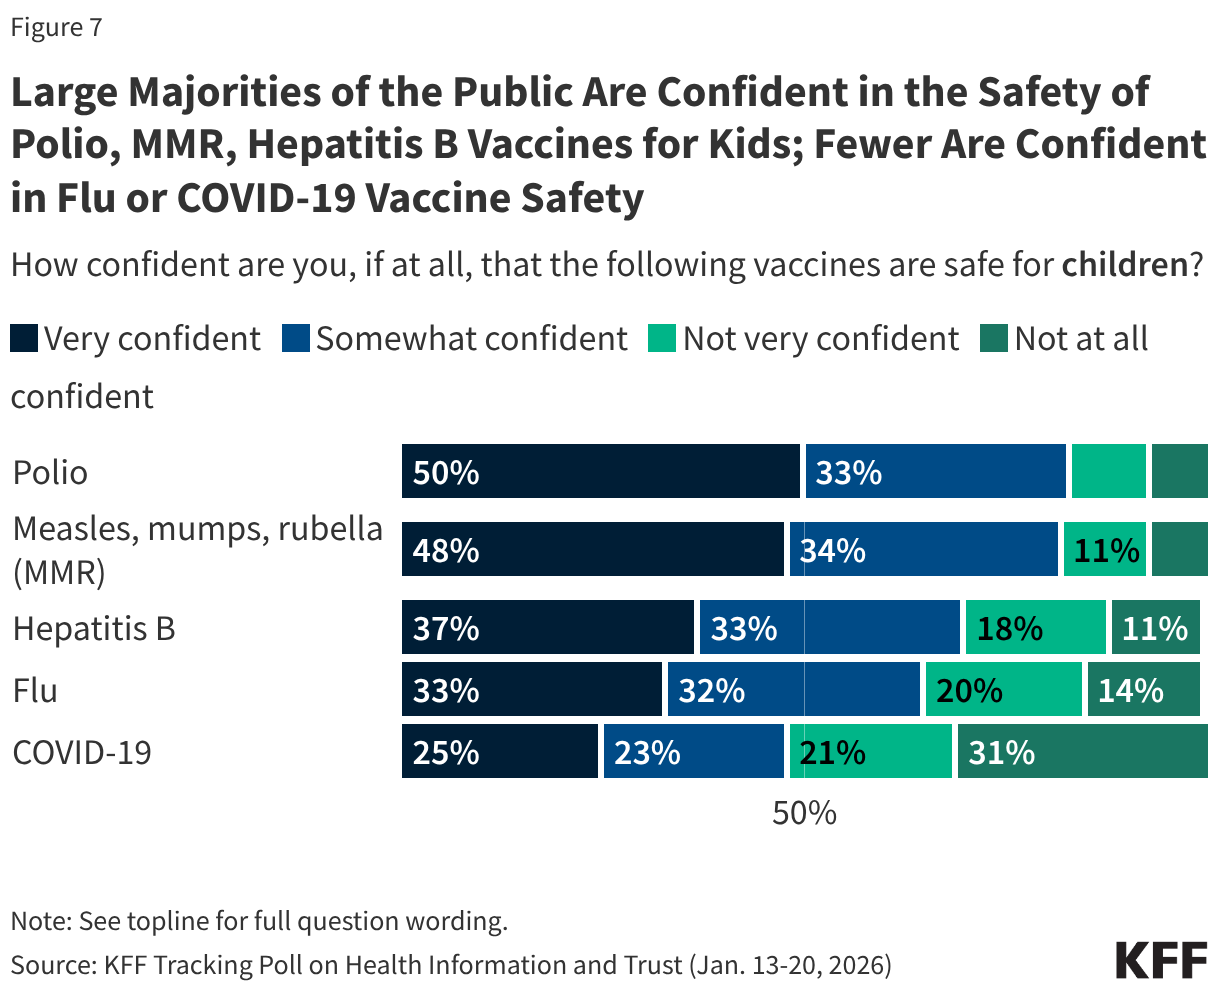
While large majorities of adults are confident in the safety of several vaccines for children, including both the polio vaccine and the measles, mumps, and rubella (MMR) vaccine, public confidence in vaccine safety is somewhat lower for vaccines the federal government has recently shifted from routine recommendations to shared clinical decision-making for children.
Large majorities of adults say they are confident that polio vaccines (82%) and MMR vaccines (81%) are safe for children, including about half who say they are “very confident” (50% and 48% respectively). Both the MMR and polio vaccines continue to be recommended for routine immunization for all children.
While most adults are at least “somewhat confident” in the safety of hepatitis B (70%) and flu vaccines (65%) for children, smaller shares report being “very confident” (37% and 33% respectively). Confidence is lowest for the COVID-19 vaccine, with fewer than half of adults (48%) saying they are confident the COVID-19 vaccine is safe for children, including just one in four who are very confident. Three in ten adults say they are “not at all confident” in the safety of the COVID-19 vaccine for children, more than twice the share for any of the other vaccine asked about in this poll. These three vaccines were moved off the routine recommendation list to shared clinical decision-making, meaning vaccination is now determined through provider-patient discussions rather than recommended for all children.
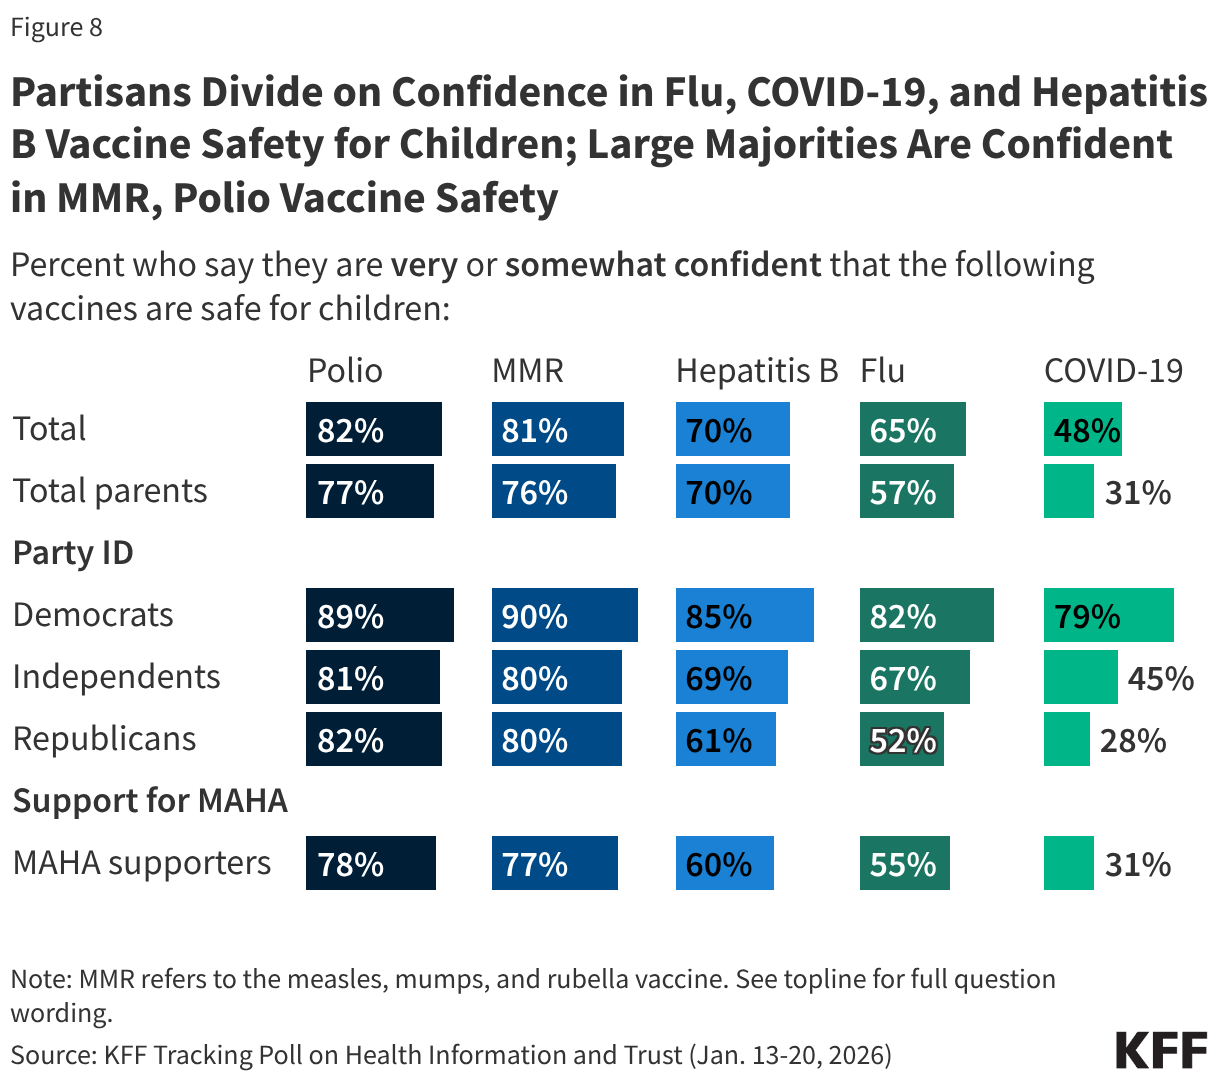
Confidence in long-standing childhood vaccines like MMR and polio is bipartisan, with at least eight in ten across parties saying they are confident these vaccines are safe for children. While at least half across partisans express confidence in the safety of hepatitis B and flu vaccines for children, views are more partisan for these two vaccines that have recently been the subject of changing recommendations from federal health authorities. More than eight in ten (85%) Democrats say they are confident that the hepatitis B vaccine is safe for children, compared with smaller shares of independents (69%) and Republicans (61%). The poll finds a similar pattern for flu vaccines, with about eight in ten Democrats expressing confidence, larger than the share of independents (67%) or Republicans (52%) who say the same.
The partisan divide is widest for the COVID-19 vaccine. About eight in ten Democrats say they are confident in the safety of COVID-19 vaccines for children, nearly three times the share of Republicans who say the same (79% vs. 28%). About four in ten (45%) independents say they are confident in the safety of this vaccine for children. Partisanship has played a significant role in views of the COVID-19 vaccine since it was first available to the U.S. public in 2021.
MAHA supporters are among the groups least confident in the safety of the COVID-19 vaccine for children (31%). However, a majority of MAHA supporters are confident in the safety of the polio vaccines (78%) and MMR vaccines (77%), and to a lesser extent heptatitis B (60%) and the flu vaccine (55%).
Like the public overall, larger shares of parents express confidence in the safety of polio (77%) vaccines, MMR (76%), and to a lesser extent hepatitis B (70%) vaccines for children, compared to the flu (57%) or COVID-19 (31%) vaccines. This is consistent with poll findings from a KFF/Washington Post Survey of Parents, conducted last summer, which showed that trust in the flu and COVID-19 vaccines’ safety for children was divided along partisan lines, while at least eight in ten parents across partisanship were confident in the safety of polio and MMR vaccines.
- With the changes to the vaccine schedule, the measles, mumps, rubella (MMR) vaccine and the polio vaccine remain routinely recommended for all children, while the flu and COVID-19 vaccines have been moved to shared clinical decision-making (SCDM). The hepatitis B vaccine is also no longer being recommended as routine, and instead only for certain high-risk groups and SCDM for others. See the new federally recommended childhood immunization schedule here: https://www.hhs.gov/childhood-immunization-schedule/index.html and KFF analysis of the changes here: https://www.kff.org/other-health/the-new-federal-vaccine-schedule-what-changed/ ↩︎
Methodology
This KFF Tracking Poll on Health Information and Trust was designed and analyzed by public opinion researchers at KFF. The survey was conducted January 13-20, 2026, online and by telephone among a nationally representative sample of 1,426 U.S. adults in English (n=1,355) and in Spanish (n=71). The sample includes 1,028 adults (n=60 in Spanish) reached through the SSRS Opinion Panel either online (n= 1,003) or over the phone (n=25). The SSRS Opinion Panel is a nationally representative probability-based panel where panel members are recruited randomly in one of two ways: (a) Through invitations mailed to respondents randomly sampled from an Address-Based Sample (ABS) provided by Marketing Systems Groups (MSG) through the U.S. Postal Service’s Computerized Delivery Sequence (CDS); (b) from a dual-frame random digit dial (RDD) sample provided by MSG. For the online panel component, invitations were sent to panel members by email followed by up to three reminder emails.
Another 398 (n=11 in Spanish) adults were reached through random digit dial telephone sample of prepaid cell phone numbers obtained through MSG. Phone numbers used for the prepaid cell phone component were randomly generated from a cell phone sampling frame with disproportionate stratification aimed at reaching Hispanic and non-Hispanic Black respondents. Stratification was based on incidence of the race/ethnicity groups within each frame. Among this prepaid cell phone component, 149 were interviewed by phone and 249 were invited to the web survey via short message service (SMS).
Respondents in the prepaid cell phone sample who were interviewed by phone received a $15 incentive via a check received by mail or an electronic gift card incentive. Respondents in the prepaid cell phone sample reached via SMS received a $10 electronic gift card incentive. SSRS Opinion Panel respondents received a $5 electronic gift card incentive (some harder-to-reach groups received a $10 electronic gift card). In order to ensure data quality, cases were removed if they failed two or more quality checks: (1) attention check questions in the online version of the questionnaire, (2) had over 30% item non-response, or (3) had a length less than one quarter of the mean length by mode. Based on this criterion, 2 cases were removed.
The combined cell phone and panel samples were weighted to match the sample’s demographics to the national U.S. adult population using data from the Census Bureau’s 2025 Current Population Survey (CPS), September 2023 Volunteering and Civic Life Supplement data from the CPS, and the 2025 KFF Benchmarking Survey with ABS and prepaid cell phone samples. The demographic variables included in weighting for the general population sample are gender, age, education, race/ethnicity, region, civic engagement, frequency of internet use and political party identification. The weights account for differences in the probability of selection for each sample type (prepaid cell phone and panel). This includes adjustment for the sample design and geographic stratification of the cell phone sample, within household probability of selection, and the design of the panel-recruitment procedure.
The margin of sampling error including the design effect for the full sample is plus or minus 3 percentage points. Numbers of respondents and margins of sampling error for key subgroups are shown in the table below. For results based on other subgroups, the margin of sampling error may be higher. Sample sizes and margins of sampling error for other subgroups are available on request. Sampling error is only one of many potential sources of error and there may be other unmeasured error in this or any other public opinion poll. KFF public opinion and survey research is a charter member of the Transparency Initiative of the American Association for Public Opinion Research.
| Group | N (unweighted) | M.O.S.E. |
|---|---|---|
| Total | 1,426 | ± 3 percentage points |
| Party ID | ||
| Democrats | 473 | ± 6 percentage points |
| Independents | 483 | ± 6 percentage points |
| Republicans | 367 | ± 6 percentage points |
| MAGA Republicans/Republican-leaning independents | 352 | ± 6 percentage points |
| MAHA supporters | 618 | ± 5 percentage points |
| Parents or guardians of children under 18 living in their household | 436 | ± 6 percentage points |