KFF designs, conducts and analyzes original public opinion and survey research on Americans’ attitudes, knowledge, and experiences with the health care system to help amplify the public’s voice in major national debates.
KFF Launches New COVID-19 Vaccine Monitor to Track the Public’s Confidence in the Vaccine and Experiences for the Duration of the Pandemic
First Survey Finds Enthusiasm for Getting Vaccinated Varies Across the Public; Most Fall into “As Soon As Possible” and “Wait and See” Categories, While Some Say “Only if Required” and “Definitely Not”
Republicans and Black Americans are More Likely to Be Hesitant but Even Among These Groups Reasons Vary
KFF has launched a new COVID-19 Vaccine Monitor to dive deeply into the public’s views about the vaccine and experiences getting it for as long as the pandemic lasts.
First results released today show that Americans’ enthusiasm for getting a COVID-19 vaccination varies substantially across groups, with Republicans and Black Americans among those most hesitant.
Overall, 71% of the public says they definitely or probably would get a vaccine, up from 63% in September. Still about a quarter (27%) of the public is vaccine hesitant, saying they probably (12%) or definitely (15%) would not get a COVID-19 vaccination even if it were available for free and deemed safe by scientists.
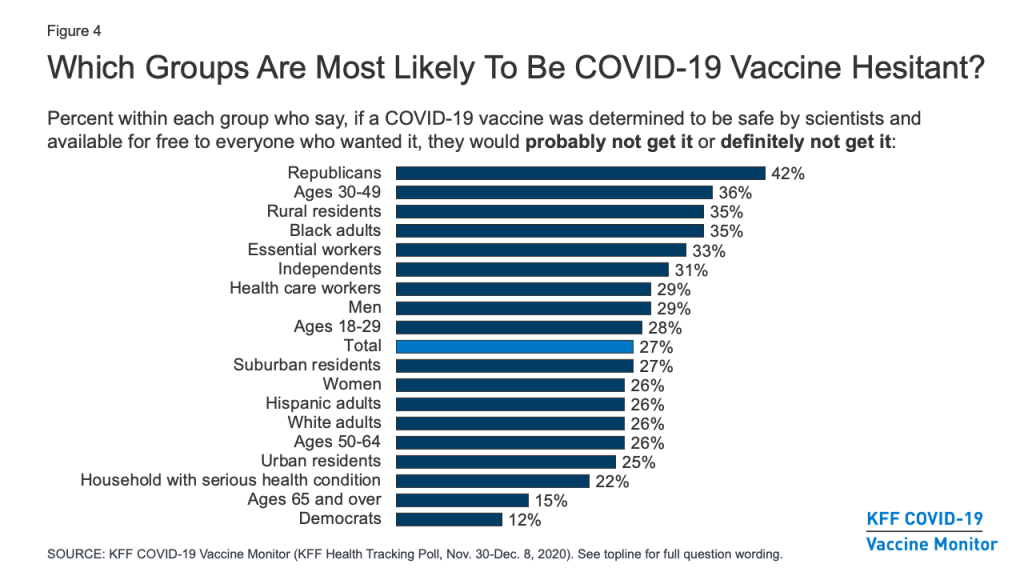
Hesitancy remains highest among Republicans (42%), those ages 30-49 (36%), rural residents (35%), and Black adults (35%), a group that has been disproportionately affected by the pandemic.
Some Black adults are hesitant for reasons that could change with more information. For example: 71% of those who say they won’t get vaccinated say a major reason is that they are worried about possible side effects (which are expected to be mild) and half (50%) say they worry they could get COVID-19 from the vaccine. But nearly as many hesitant Black adults (47%) say they are hesitant to get the COVID-19 vaccine because they don’t trust vaccines in general.
Among another large group of the hesitant – Republicans – top reasons for not getting vaccinated may be tougher to change, including believing the dangers of COVID-19 have been exaggerated (57% of hesitant Republicans cite this as a major reason), and that they don’t trust the government to ensure a vaccine is safe and effective (56%). Nearly as many (54%) also worry about possible side effects.
“Many who are hesitant are in wait-and-see mode, and their concerns include worries about side effects and whether the vaccine can cause COVID-19, which may dissipate as people get more information and see the vaccine introduced successfully among people they know,” KFF President and CEO Drew Altman said.
The initial Monitor survey identifies four broad categories of enthusiasm for getting a vaccination that pose different messaging challenges:
A third of the public (34%) are in the most enthusiastic “as soon as possible” group, who want to get vaccinated as soon as they can. This group is disproportionately made up of Democrats, seniors, white adults, and people with college degrees. Some in this group may become frustrated if they are not among the priority groups receiving early vaccinations.
The “wait and see” group is the largest, comprising 39% of the public, and generally want to see how vaccinations work for other people before getting it themselves. This group looks like the public at large, and their willingness to get vaccinated may depend on what they learn during its initial rollout, including news reports about its effectiveness, safety and side effects.
The “only if required” group is the smallest, representing 9% of the public, and say they would only get vaccinated if required for work, school or other activities. Most (61%) of this group are essential workers who work outside their homes during the pandemic, a category considered high risk for exposure.
The most resistant group, representing 15% of the public, says they would “definitely not” get vaccinated, even if it were deemed safe and available for free. This group is disproportionately made up of Republicans and of people with no more than a high-school level education.
“Many Americans who are hesitant are simply reserving judgment before they are ready to get vaccinated. However, nearly one in four Republicans don’t want to get vaccinated because they don’t believe COVID poses a serious threat,” KFF Executive Vice President Mollyann Brodie said. “It will be a real challenge to undo COVID denialism among this slice of President Trump’s political base.”
Those who are more hesitant to get vaccinated for COVID-19 are also more likely to harbor misconceptions about the pandemic and related public health measures, which may make them less receptive to public health messages generally, including those about the importance of vaccinations.
For example, two-thirds (68%) of the “definitely not” group and more than a third (37%) of the “only if required” group incorrectly believe that wearing a face mask does not protect the wearer from coronavirus. Similarly, more than half (54%) of the “definitely not” group and about three in ten (29%) of the “only if required” group believe that wearing a face mask is harmful to one’s health.
Personal Health Care Providers are the Public’s Most Trusted Sources for Vaccine Information
As with many health topics, the poll finds people’s personal health care providers are at the top of the list as a trusted source of vaccine information, ahead of any national, state, or local messengers.
More than eight in ten (85%) say they trust their own doctor or health care provider to provide reliable information on a COVID-19 vaccine, while about seven in ten also trust national messengers like the U.S. Centers for Disease Control and Prevention (73%), the Food and Drug Administration (70%), and Director of the National Institute of Allergy and Infectious Diseases, Dr. Anthony Fauci (68%), as well as their local public health department (70%).
Somewhat fewer, but still a majority, put at least a fair amount of trust in their state government officials (58%), President-elect Joe Biden (57%), and pharmaceutical companies (53%), while about a third (34%) say they trust President Trump.
Trust in personal doctors is high among all racial and ethnic groups and across partisan groups. When it comes to government sources of information, however, a much larger share of Democrats than Republicans say they trust such sources to provide reliable information about a COVID-19 vaccine, with independents generally falling in the middle.
The survey suggests the race to develop a vaccine is helping to improve the public’s views of pharmaceutical companies. Most (58%) of the public say that drug companies working on a COVID-19 vaccine are equally interested in the public good and making a profit. That contrasts sharply with the public’s view in July that found the majority of the public (76%) say drug makers generally care mostly about profits.
Designed and analyzed by public opinion researchers at KFF, the survey was conducted from Nov. 30-Dec. 8 among a nationally representative random digit dial telephone sample of 1,676 adults, including oversamples of adults who are Black (390) or Hispanic (298). Interviews were conducted in English and Spanish by landline (391) and cell phone (1,285). The margin of sampling error is plus or minus 3 percentage points for the full sample. For results based on subgroups, the margin of sampling error may be higher.
The KFF COVID-19 Vaccine Monitor is an ongoing research project tracking the public’s attitudes and experiences with COVID-19 vaccinations. Using a combination of surveys and focus groups, this project will track the dynamic nature of public reactions as vaccine development unfolds, including vaccine confidence and hesitancy, trusted messengers and messages, as well as the public’s experiences with vaccination as distribution begins.
The KFF COVID-19 Vaccine Monitor is an ongoing research project tracking the public’s attitudes and experiences with COVID-19 vaccinations. Using a combination of surveys and focus groups, this project will track the dynamic nature of public opinion as vaccine development unfolds, including vaccine confidence and hesitancy, trusted messengers and messages, as well as the public’s experiences with vaccination as distribution begins.
Key Findings
With the launch of the KFF COVID-19 Vaccine Monitor, a new KFF survey finds an increase in the share of the public saying they would definitely or probably get a vaccine for COVID-19 if it was determined to be safe by scientists and available for free to everyone who wanted it. This share now stands at 71%, up from 63% in a September survey conducted in partnership with ESPN’s The Undefeated. Following on the heels of the presidential election and promising news about several COVID-19 vaccine candidates, the new survey finds an increase in the share who say they would get vaccinated across racial and ethnic groups, and among both Democrats and Republicans (willingness to get vaccinated among independents has not changed).
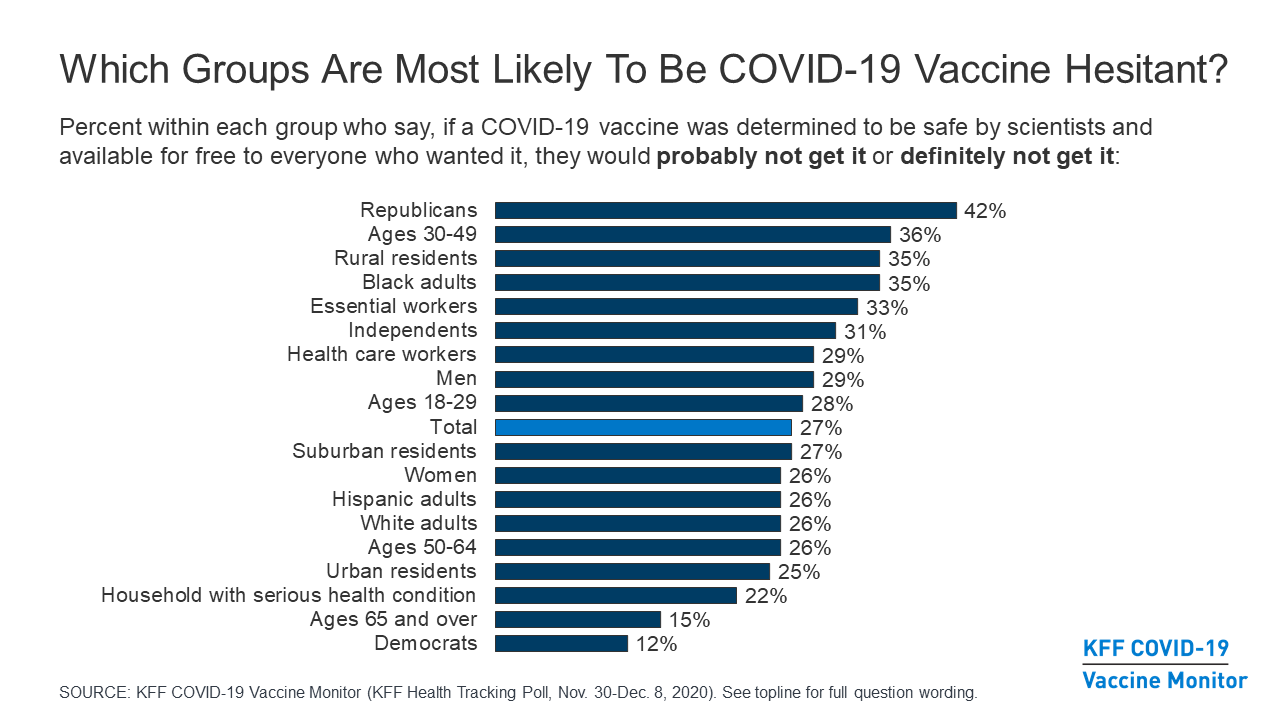
About a quarter (27%) of the public remains vaccine hesitant, saying they probably or definitely would not get a COVID-19 vaccine even if it were available for free and deemed safe by scientists. Vaccine hesitancy is highest among Republicans (42%), those ages 30-49 (36%), and rural residents (35%). Importantly, 35% of Black adults (a group that has borne a disproportionate burden of the pandemic) say they definitely or probably would not get vaccinated, as do one third of those who say they have been deemed essential workers (33%) and three in ten (29%) of those who work in a health care delivery setting .
Among those who are hesitant to get a COVID-19 vaccine, the main reasons are worries about possible side effects (59% cite this as a major reason), lack of trust in the government to ensure the vaccines’ safety and effectiveness (55%), concerns that the vaccine is too new (53%), and concerns over the role of politics in the development process (51%). About half of Black adults who say they probably or definitely won’t get vaccinated cite as major reasons that they don’t trust vaccines in general (47%) or that they are worried they may get COVID-19 from the vaccine (50%), suggesting that messages combatting particular types of misinformation may be especially important for increasing vaccine confidence among this group.
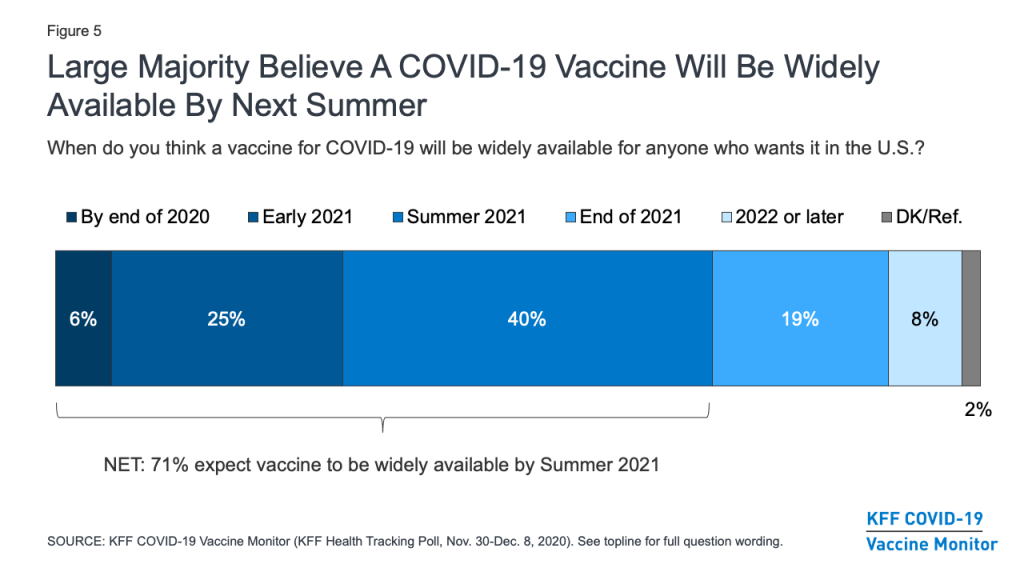
A large majority (71%) of the public believes a vaccine will be widely available for anyone who wants it in the U.S. by the summer of 2021. This includes about three in ten who believe it will be available sooner, either by the end of 2020 or early in 2021. Despite promising news about vaccines by both Pfizer/BioNTech and Moderna, expectations may need to be tempered for this group, given the small number of initial doses available and the hurdles to producing and distributing enough vaccine doses to cover everyone in the United States.
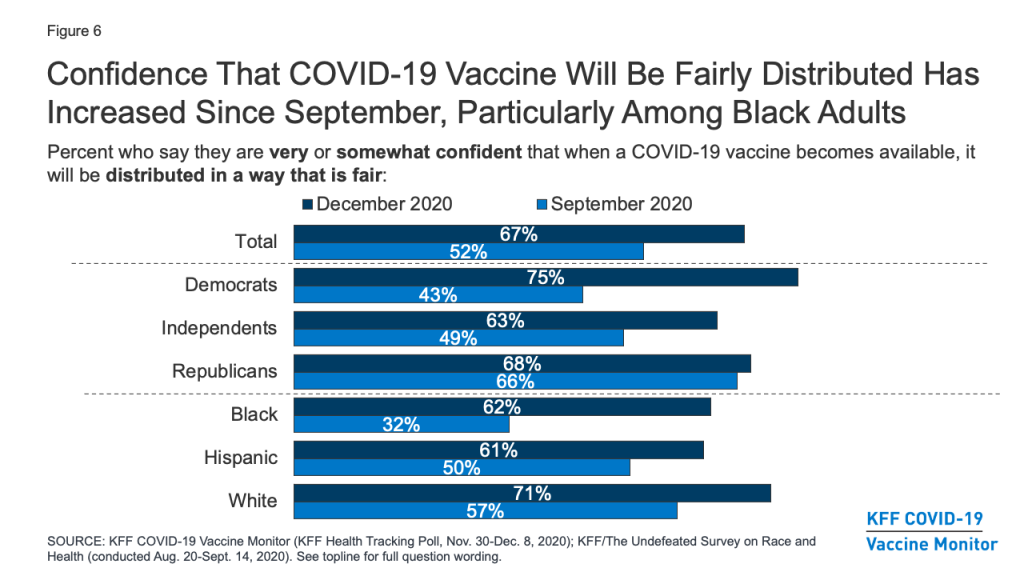
A critical question that has already begun to face policymakers is how to prioritize different groups and ensure equitable distribution of the vaccine. On this question, the public’s confidence has increased markedly over the past several months, particularly among Black Americans. Two-thirds of the public now say they are at least somewhat confident that when a COVID-19 vaccine becomes available, it will be distributed in a way that is fair, up from about half (52%) in September. Among Black Americans, the share has nearly doubled, from 32% to 62%. Still, concerns remain about whether the needs of people of color are being accounted for in the vaccine development process. About half (48%) of Black adults say they are not confident that the development of a COVID-19 vaccine is taking the needs of Black people into account, and over a third (36%) of Hispanic adults say the same about the needs of Hispanic people.
Understanding who the public trusts for reliable vaccine information will be critical for any COVID-19 vaccination outreach effort. The survey finds that, as with many health topics, people’s personal health care providers are the most trusted source for information on COVID-19 vaccines, with 85% saying they trust their own doctor or health care provider at least a fair amount for reliable vaccine information. Some local, state, and national messengers – including the CDC, FDA, Dr. Anthony Fauci, and state and local health officials – are trusted by majorities of the public as well, but trust in these government-affiliated sources divides somewhat on partisan lines, with Democrats tending to express higher levels of trust than Republicans.
The KFF COVID-19 Vaccine Monitor is also tracking the public’s enthusiasm for getting vaccinated and identified four groups of individuals that may require different communication strategies when it comes to a COVID-19 vaccine. These include: the “as soon as possible” group (34% of the public) who say that when a vaccine is approved and widely available, they will get it as soon as they can; the “wait and see” group (39%) who say that they will wait to see how the vaccine is working for other people before getting vaccinated themselves; the “only if required” group (9%) who say they will only get vaccinated if it is required for work, school, or other activities; and the “definitely not” group (15%) who say they definitely would not get a vaccine, even if it was free and determined to be safe by scientists. This last group is likely to be the hardest to convince, given that they have low trust in public health messengers, very low rates of flu vaccination, and high rates of believing misinformation about other public health measures, like mask-wearing.
COVID-19 Vaccine Hesitancy: Trends, Reasons, And Subgroups
Share Of Public Willing To Get Vaccinated For COVID-19 Has Increased
The KFF COVID-19 Vaccine Monitor finds that the share of the public saying they would definitely or probably get a vaccine for COVID-19 if it was determined to be safe by scientists and available for free to everyone who wanted it has increased modestly since September, following the results of the presidential election and promising news about several COVID-19 vaccine candidates. In the new survey, seven in ten (71%) say they would definitely (41%) or probably (30%) get such a vaccine, while about a quarter (27%) say they would probably (12%) or definitely (15%) not get it. The share saying they would definitely or probably get vaccinated is up 8 percentage points from a KFF survey conducted in September in partnership with ESPN’s The Undefeated (from 63% to 71%), while the share saying they would definitely or probably not get vaccinated is down 7 percentage points (from 34% to 27%).
Figure 1: Share Saying They Would Get A COVID-19 Vaccine If It Were Free And Deemed Safe By Scientists Has Increased Since September
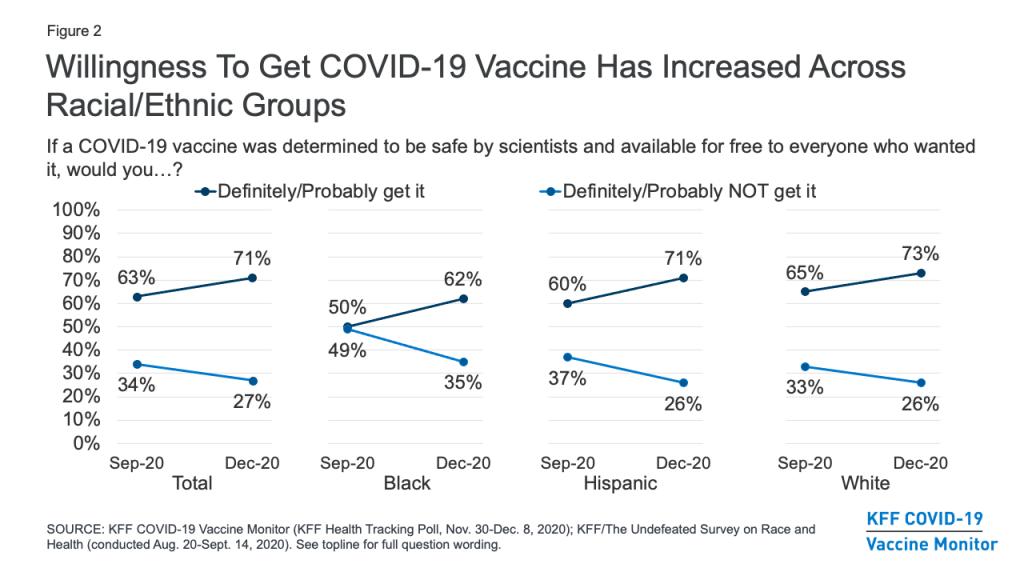
Looking across racial and ethnic groups, there has been an increase in vaccine willingness among Black, Hispanic, and White adults alike. The change is perhaps most dramatic among Black adults, among whom willingness to get vaccinated increased from 50% in September to 62% in December. While Black adults were about evenly split in September on whether or not they would get a COVID-19 vaccine that was free and determined to be safe by scientists, they are now almost twice as likely to say they would get vaccinated as to say they would not (62% vs. 35%).
Figure 2: Willingness To Get COVID-19 Vaccine Has Increased Across Racial/Ethnic Groups
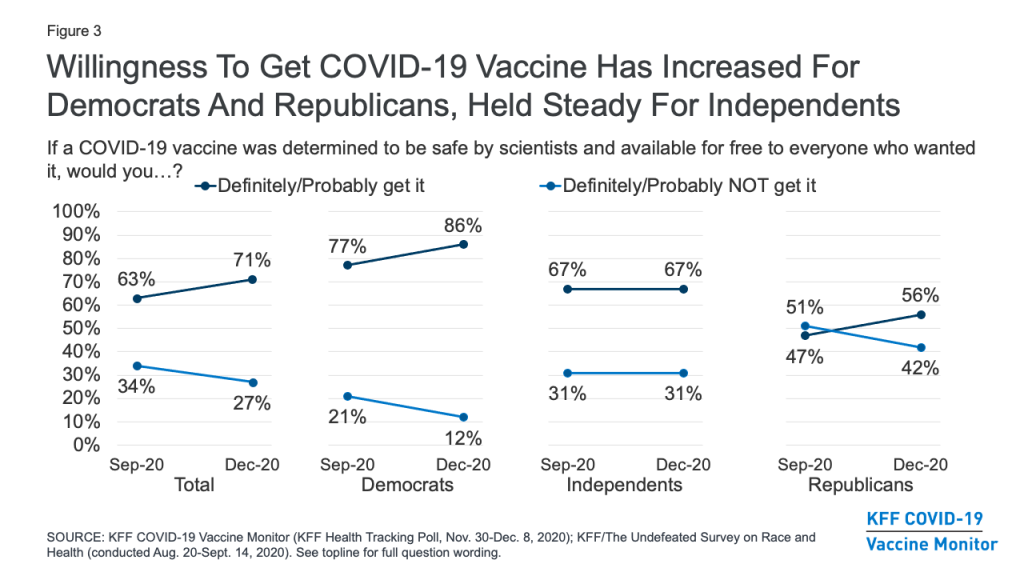
While a large partisan gap remains, willingness to get vaccinated for COVID-19 has increased for both Democrats (from 77% in September to 86% in December) and Republicans (from 47% to 56%), but has remained the same among independents (67%).
Figure 3: Willingness To Get COVID-19 Vaccine Has Increased For Democrats And Republicans, Held Steady For Independents
One-Quarter Remain Hesitant To Get A COVID-19 Vaccine, Including Four In Ten Republicans
About a quarter (27%) of the public remains vaccine hesitant, saying they probably or definitely would not get a COVID-19 vaccine even if it were available for free and deemed safe by scientists. Vaccine hesitancy is highest among Republicans (42%), those ages 30-49 (36%), and rural residents (35%). Importantly, 35% of Black adults (a group that has borne a disproportionate burden of the pandemic) say they definitely or probably would not get vaccinated, as do one-third of those who say they have been deemed essential workers and three in ten (29%) of those who work in a health care delivery setting.
Figure 4: Which Groups Are Most Likely To Be COVID-19 Vaccine Hesitant?
Different Groups Have Different Reasons For COVID-19 Vaccine Hesitancy
Among those who are hesitant to get a COVID-19 vaccine, the main reasons are worries about possible side effects (59% cite this as a major reason), lack of trust in the government to ensure the vaccines’ safety and effectiveness (55%), concerns that the vaccine is too new (53%), and concerns over the role of politics in the development process (51%). About four in ten cite as reasons that the risks of COVID-19 are being exaggerated (43%) or they don’t trust vaccines in general (37%), while about a third say they don’t trust the health care system (35%), and smaller shares say they are worried they may get COVID-19 from the vaccine (27%) or they don’t think they’re at risk of getting sick from the virus (20%).
Among the vaccine hesitant, members of different racial groups have somewhat different reasons for not wanting to get vaccinated. For example, Black adults who are vaccine hesitant are more likely than White adults to cite concerns about side effects (71% vs. 56%) and the newness of the vaccine (71% vs. 48%) as major reasons for not wanting to get vaccinated. Importantly, about half of Black adults who say they probably or definitely won’t get vaccinated cite as major reasons that they are worried they may get COVID-19 from the vaccine (50%) or that they don’t trust vaccines in general (47%), suggesting that messages combatting particular types of misinformation may be especially important for increasing vaccine confidence among this group.
Reasons for vaccine hesitancy also differ somewhat by partisan identification. Among Republicans who say they won’t get vaccinated, a top reason is that they think the risks of COVID-19 are being exaggerated, named as a major reason by 57% of Republicans who are vaccine hesitant (24% of all Republicans).
Table 1: Reasons For Vaccine Hesitancy By Party Identification, Age, and Race/Ethnicity
AMONG THOSE WHO WOULD DEFINITELY NOT OR PROBABLY NOT GET VACCINATED: Percent who say each of the following is a major reason why:
Total
Party ID
Age
Race/Ethnicity
Independent
Republican
18-49
50+
Black
White
Worried about possible side effects
59%
59%
54%
58%
63%
71%
56%
Do not trust the government to make sure the vaccine is safe and effective
55
52
56
55
53
58
54
Vaccine is too new and want to wait and see how it works for other people
53
54
41
57
46
71
48
Politics has played too much of a role in the vaccine development process
51
46
53
47
59
54
49
The risks of COVID-19 are being exaggerated
43
40
57
40
51
33
49
Don’t trust vaccines in general
37
43
31
37
38
47
36
Do not trust the health care system
35
34
36
32
42
28
36
Worried that they may get COVID-19 from the vaccine
27
30
18
26
26
50
21
Don’t think they are at risk of getting sick from COVID-19
20
18
23
18
26
20
19
NOTE: Sample size too small to report separately among Democrats and Hispanics who say they definitely or probably won’t get vaccinated. See Appendix A for tables based on total.
COVID-19 Vaccine Confidence And Expectations
A large majority (71%) of the public believes a vaccine will be widely available for anyone who wants it in the U.S. by the summer of 2021. This includes about three in ten who believe it will be available sooner, either by the end of 2020 or early in 2021. About a quarter (26%) of the public is more skeptical, expecting that a vaccine won’t be widely available until the end of 2021 or sometime in 2022.
Figure 5: Large Majority Believe A COVID-19 Vaccine Will Be Widely Available By Next Summer
A critical question that has already begun to face policymakers is how to prioritize different groups and ensure equitable distribution of the vaccine. On this question, the public’s confidence has increased markedly over the past several months, particularly among Black Americans. Two-thirds of the public now say they are at least somewhat confident that when a COVID-19 vaccine becomes available, it will be distributed in a way that is fair, up from about half (52%) in September (before the presidential election and positive news about several vaccine candidates). Among Black Americans, the share has nearly doubled, from 32% to 62%.
Figure 6: Confidence That COVID-19 Vaccine Will Be Fairly Distributed Has Increased Since September, Particularly Among Black Adults
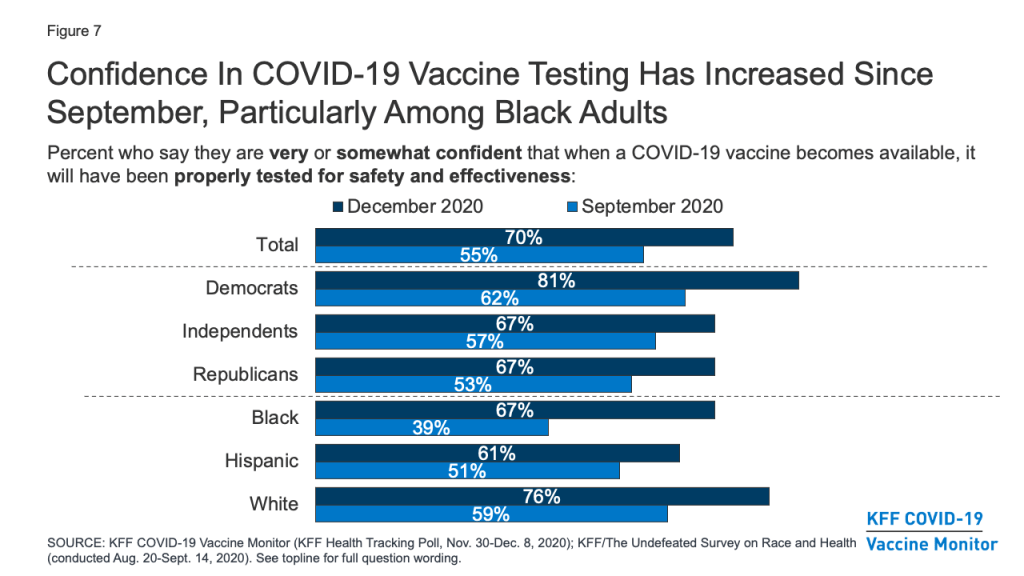
Similarly, a larger share of the public now compared to September say they are very or somewhat confident that when a COVID-19 vaccine becomes available, it will have been properly tested for safety and effectiveness (70%, up from 55% in September). Again, the increase was most pronounced among Black Americans (67%, up from 39%).
Figure 7: Confidence In COVID-19 Vaccine Testing Has Increased Since September, Particularly Among Black Adults
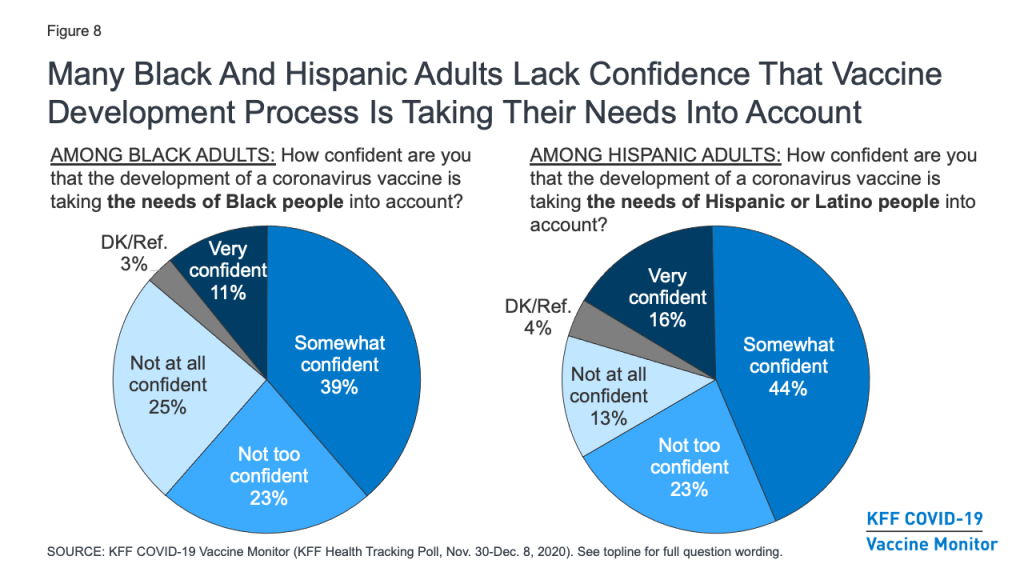
Still, concerns remain about whether the needs of people of color are being accounted for in the vaccine development process. About half (48%) of Black adults say they are not confident that the development of a COVID-19 vaccine is taking the needs of Black people into account (down from 65% in September), and over a third (36%) of Hispanic adults say the same about the needs of Hispanic people.
Figure 8: Many Black And Hispanic Adults Lack Confidence That Vaccine Development Process Is Taking Their Needs Into Account
Other COVID-19 Vaccine Attitudes
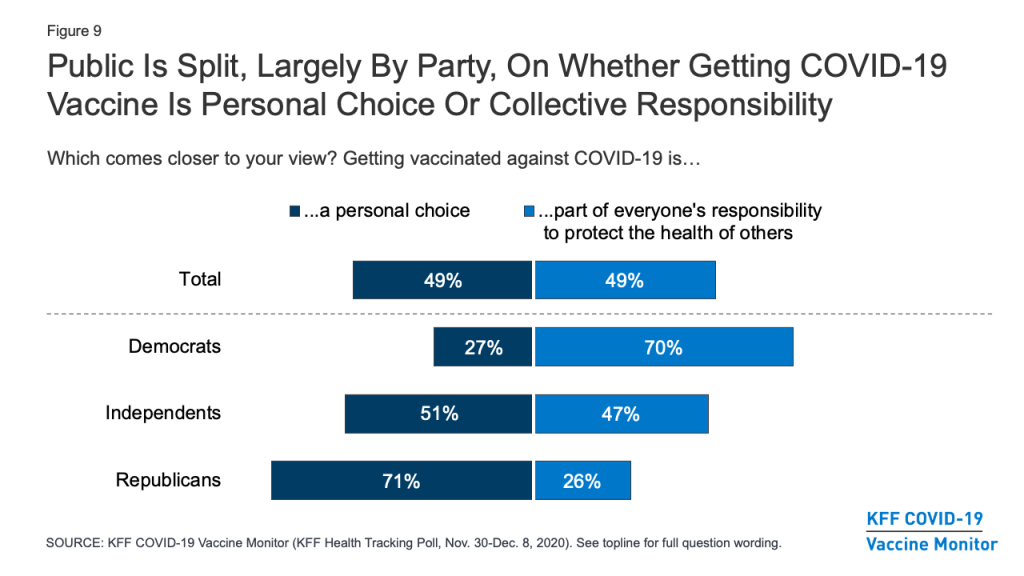
The KFF COVID-19 Vaccine Monitor is also tracking other attitudes related to vaccination and examining the relationship of these attitudes to vaccine hesitancy. One question that has implications for vaccine messaging is whether people think getting vaccinated is more a matter of individual freedom or one of collective responsibility. The latest survey finds the public evenly divided, with about half (49%) saying that getting vaccinated against COVID-19 is “a personal choice” and the other half (49%) saying it is “part of everyone’s responsibility to protect the health of others.” Partisans diverge on this question, with seven in ten Democrats saying getting vaccinated part of everyone’s responsibility to protect public health, and a similar share of Republicans (71%) saying it is a personal choice. As will be shown below, these attitudes are related to people’s personal plans to get a COVID-19 vaccine when one becomes available.
Figure 9: Public Is Split, Largely By Party, On Whether Getting COVID-19 Vaccine Is Personal Choice Or Collective Responsibility
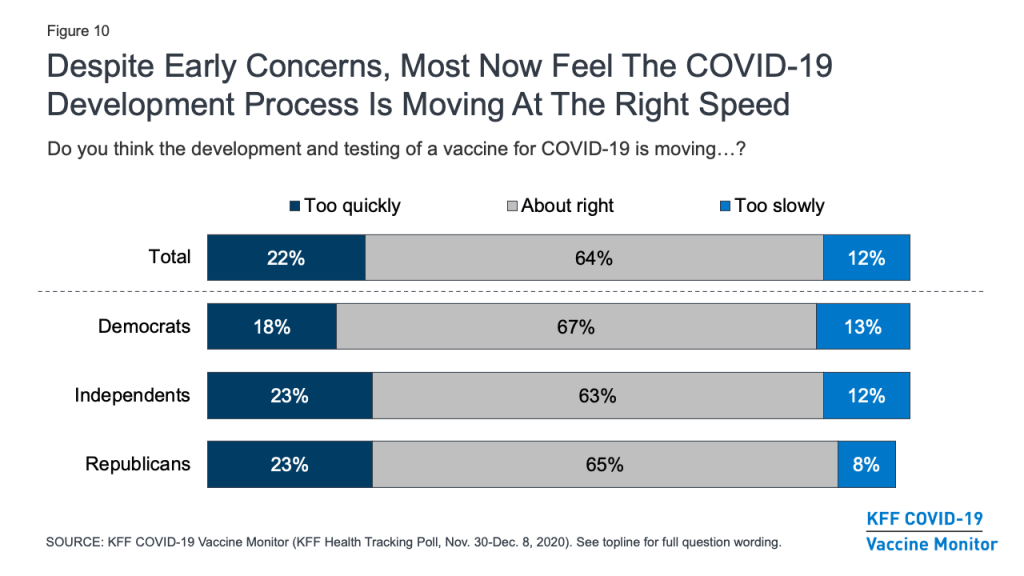
With the name “Operation Warp Speed” given to the U.S. COVID-19 vaccine development effort, there were early concerns that the public would lack trust in a vaccine they might view as being rushed to market. In fact, KFF polling in September and October found that many U.S. adults were concerned that the FDA would rush to approve a vaccine under political pressure from the Trump White House. The latest survey, however, finds that about two-thirds of the public (64%) – including similar shares of Democrats, Republicans, and independents – feel that the development and testing of the vaccine is moving at about the right speed, while small shares say it is moving too quickly (22%) or too slowly (12%).
Figure 10: Despite Early Concerns, Most Now Feel The COVID-19 Development Process Is Moving At The Right Speed
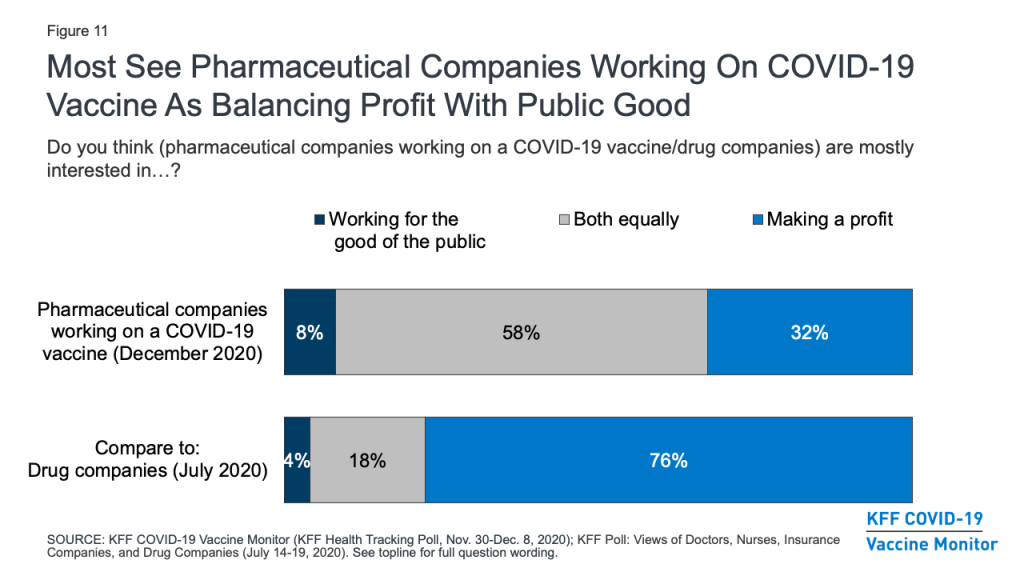
The financial motivations of pharmaceutical companies have also been raised as a potential barrier to gaining the public’s trust in a COVID-19 vaccine. The survey suggests that the public’s typically harsh views of these companies’ profit motives may be somewhat softened in light of the pandemic. A KFF survey earlier this year that asked about “drug companies” in general found that three-quarters (76%) of the public thought these companies were mostly interested in making a profit, while smaller shares said they were mainly interested in working for the good of the public (4%) or about equally motivated by both profits and the public good (18%). The December survey asked more specifically about “pharmaceutical companies working on a COVID-19 vaccine” and found that most (58%) said these companies were equally interested in working for the public good and making a profit, while the share who saw profit as their main motivation was much smaller (32%).
Figure 11: Most See Pharmaceutical Companies Working On COVID-19 Vaccine As Balancing Profit With Public Good
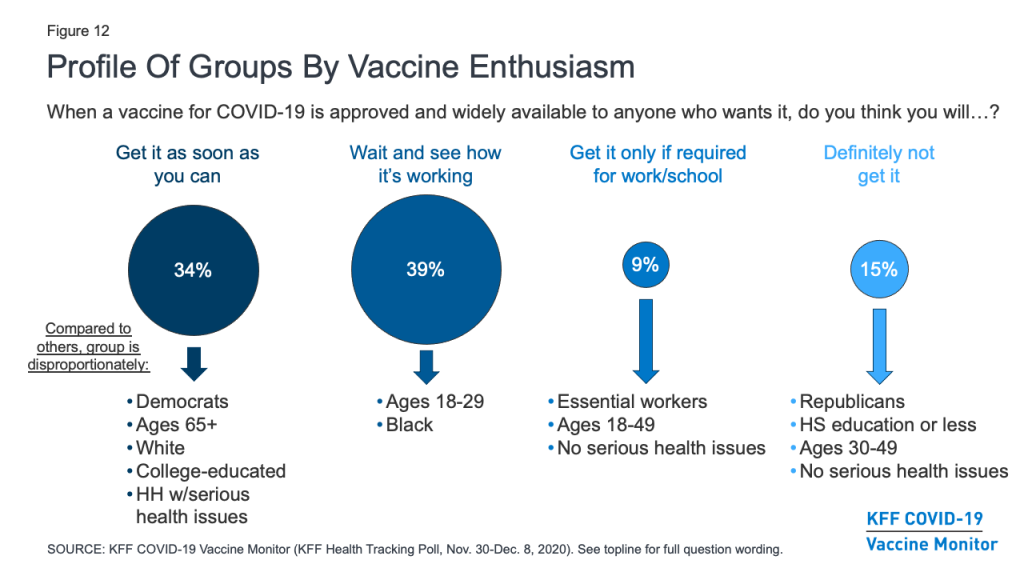
Profiles Of The Public By Vaccine Enthusiasm Levels
The KFF COVID-19 Vaccine Monitor also gauged the public’s enthusiasm for getting vaccinated and identified four groups of individuals that may require different communications strategies when it comes to a COVID-19 vaccine. (See Appendix B for more details about the demographics of each of these groups.)
About a third of the public (34%) belong to the “as soon as possible” group who say that when a vaccine is approved and widely available, they will get it as soon as they can. This group is disproportionately made up of Democrats (43% vs. 32% of the public overall), adults ages 65 and over (33% vs. 21%), White adults (71% vs. 61%), those with college degrees (39% vs. 31%), and those who have a serious health condition or live with someone who does (52% vs. 46%). Given their eagerness to get vaccinated, some people in this group may be frustrated with the pace of vaccine distribution if they do not fall into one of the priority groups for early vaccination. Messages emphasizing the reasons why different groups are prioritized may be important for this group.
About four in ten (39%) of the public belong to the “wait and see” group. These individuals are a mix of those who say they definitely or probably will get vaccinated and those who say they probably will not – but all say that when a vaccine becomes widely available, they will wait until it has been available for a while to see how it is working for other people before getting vaccinated themselves. This group looks a lot like the general public, but it somewhat overrepresents young adults ages 18-29 (28% vs. 21% of the general population) and Black adults (16% vs. 12%). Ultimate willingness to get vaccinated among this group will depend a lot on news coverage of events that unfold during the early rollout of the vaccine with priority populations. What they hear and learn about side effects, efficacy, and access to the vaccine will be important in shaping their ultimate decisions about whether and when to get vaccinated. This group is also likely to be the most dynamic during the early stages of rollout, potentially shifting their responses between “probably will” and “probably won’t” get vaccinated as the narrative around the COVID-19 vaccine changes.
The smallest group – representing 9% of the public – says they will only get vaccinated if it is required for work, school, or other activities. This group is somewhat younger than the general population (74% are under age 50, compared with 54% of all adults). Importantly, about six in ten within this group (61%) say they have been classified as an essential worker, meaning they are required to work outside their home during the pandemic. Though small, the fact that such a large share of this group is in a category at high risk for coronavirus exposure makes them an important group for increasing vaccine confidence.
Finally, 15% of the public falls into the group that is most resistant, those who say they definitely would not get a COVID-19 vaccine, even if it were deemed safe by scientists and available for free. This group is disproportionately made up of Republicans (41% vs. 25% of the general public) and those with no additional schooling beyond high school (53% vs. 38%). It also somewhat overrepresents people ages 30-49 (46% vs. 33%). This group is the most skeptical, and may be the hardest to reach with pro-vaccine messaging.
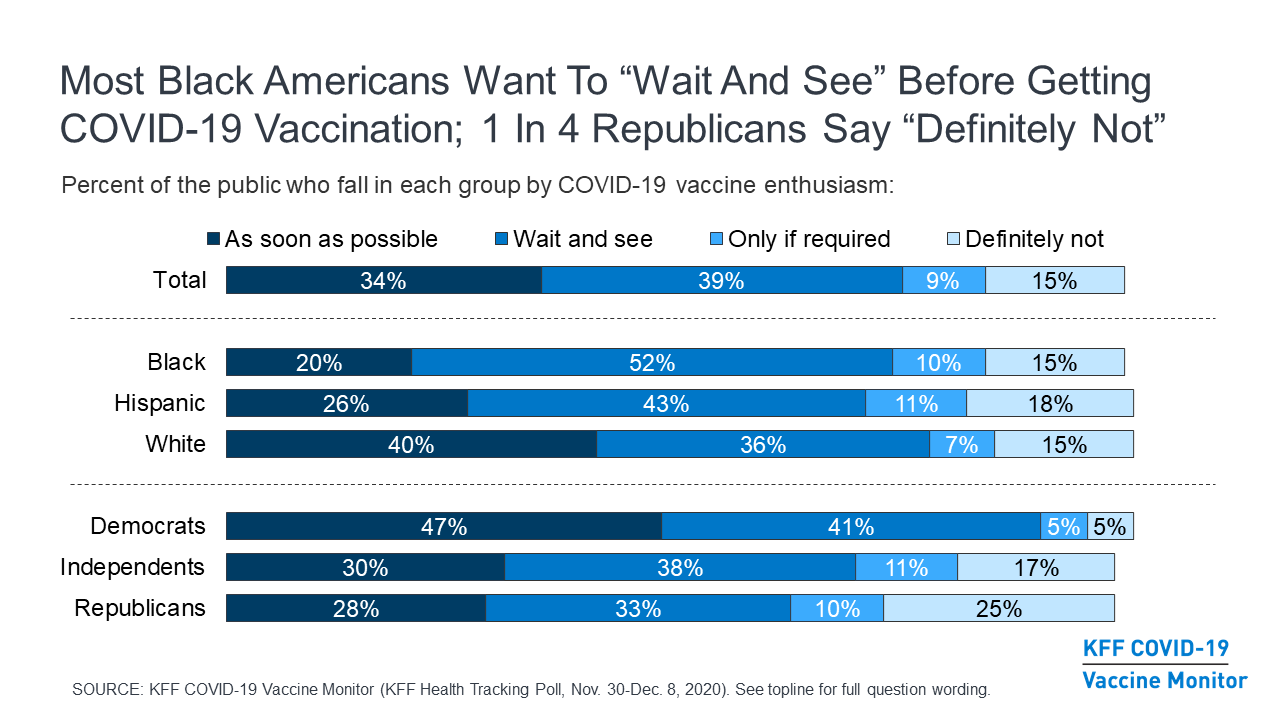
Figure 12: Profile Of Groups By Vaccine Enthusiasm
Looked at another way, the share of the public that falls into each of these groups differs by partisanship and racial and ethnic background. For example, about half of Black adults (52%) fall into the “wait and see” group, compared to about four in ten Hispanic adults (43%) and just over a third of White adults (36%). By contrast, White adults (40%) are more likely than Black adults (20%) or Hispanic adults (26%) to be in the “as soon as possible” group.
Looking across partisan groups, nearly half of Democrats (47%) are in the “as soon as possible” category, compared to about three in ten independents (30%) and Republicans (28%). And while majorities across partisan groups are in one of the first two categories, a quarter of Republicans and 17% of independents say they definitely won’t get the vaccine, much higher than the share among Democrats (5%).
Table 2: COVID-19 Vaccine Enthusiasm By Party Identification And Race/Ethnicity
Percent who say, when a vaccine for COVID-19 is approved by the FDA and widely available to anyone who wants it, they will:
Total
Party ID
Race/Ethnicity
Dem.
Ind.
Rep.
Black
Hispanic
White
Get the vaccine as soon as they can
34%
47%
30%
28%
20%
26%
40%
Wait until it has been available for a while to see how it is working for other people
39
41
38
33
52
43
36
Only get the vaccine if they are required to do so for work, school, or other activities
9
5
11
10
10
11
7
Definitely not get the vaccine
15
5
17
25
15
18
15
Don’t know/Refused
3
2
4
4
3
2
3
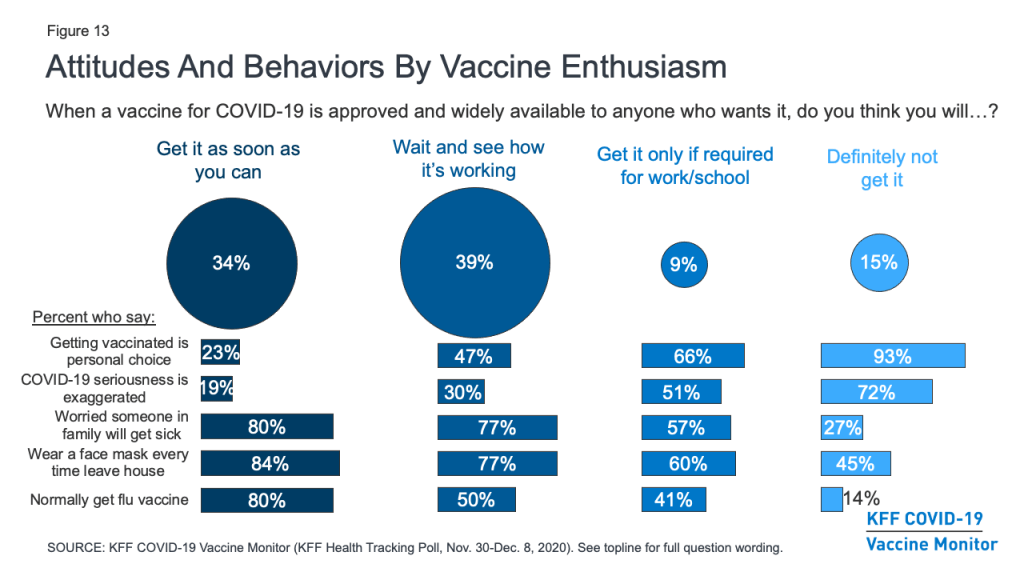
Besides differing in their demographics, these groups also differ in many of their attitudes and behaviors. For example, the vast majority (93%) of those who say they definitely won’t get vaccinated and two-thirds (66%) of those who say they’ll only get vaccinated if required to do so for work or school view getting vaccinated for COVID-19 as a personal choice, compared to about half (47%) of the “wait and see” group and just a quarter (23%) of the “as soon as possible” group. The more hesitant groups are also much more likely than the more enthusiastic groups to say that the seriousness of COVID-19 is generally exaggerated in the news. Conversely, about eight in ten in both the “as soon as possible” (80%) and “wait and see” groups (77%) say they are very or somewhat worried that they or someone in their family will get sick with COVID-19, compared to about six in ten in the “only if required” group (57%) and just a quarter (27%) of the “definitely not” group.
Figure 13: Attitudes And Behaviors By Vaccine Enthusiasm
Behaviors around non-coronavirus vaccines and other protective measures also differ among these groups. For example, about eight in ten in the more vaccine-accepting groups say they wear a face mask every time they leave the house and might be in contact with other people, compared with about six in ten in the “only if required” group and fewer than half (45%) in the “definitely not” group. There is also a linear relationship between vaccine enthusiasm and the share who say they normally get a flu vaccine each year, ranging from 80% in the “as soon as possible” group to just 14% in the “definitely not” group.
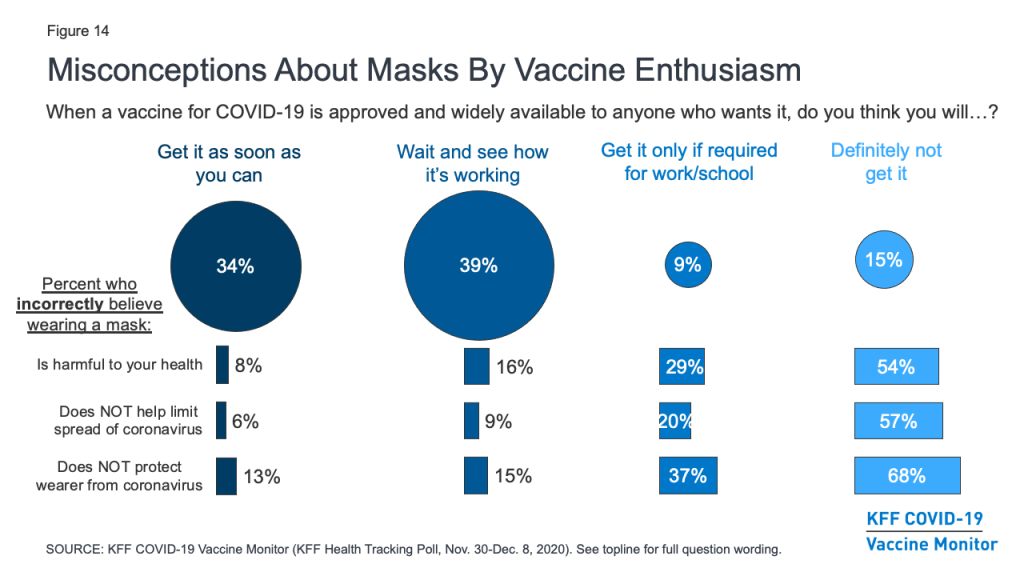
Importantly, the survey also suggests those who are more hesitant to get vaccinated for COVID-19 are also more likely to harbor misconceptions about other important public health measures. For example, about two-thirds (68%) of those who say they definitely won’t get vaccinated and nearly four in ten (37%) of those who say they’ll only get it if required believe that wearing a face mask does not help protect the wearer from coronavirus. Similarly, over half (54%) of the “definitely not” group and three in ten (29%) of the “only if required” group believe that wearing a face mask is harmful to one’s health. Given that the basic public health messaging about the benefits of mask-wearing has not broken through for many of these individuals, novel strategies may be necessary to connect with them with during vaccination outreach efforts.
Figure 14: Misconceptions About Masks By Vaccine Enthusiasm
Trusted Messengers
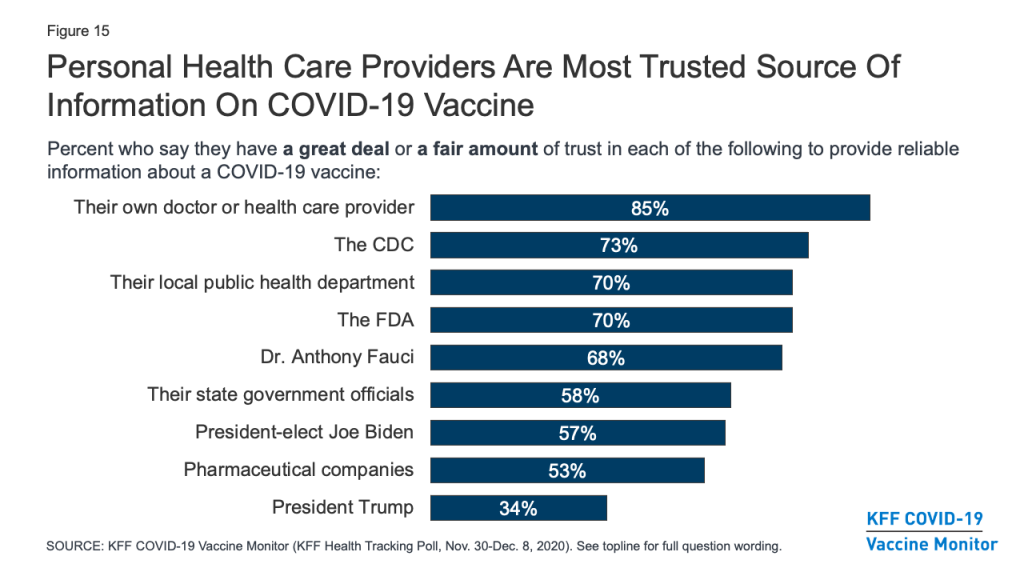
As vaccination efforts continue to roll out, the KFF COVID-19 Vaccine Monitor will be tracking which messengers are the most trusted sources of vaccine information for the public. The latest survey finds that, as with many health topics, people’s personal health care providers are at the top of the list, ahead of any national, state, or local messengers. More than eight in ten (85%) say they trust their own doctor or health care provider “a great deal” or “a fair amount” to provide reliable information on a COVID-19 vaccine. About seven in ten also trust national messengers like the U.S. CDC (73%), FDA (70%), and Dr. Anthony Fauci (68%), as well as their local public health department (70%). Somewhat fewer, but still a majority, put at least a fair amount of trust in their state government officials (58%), president-elect Joe Biden (57%), and pharmaceutical companies (53%), while just 34% say they trust President Trump.
Figure 15: Personal Health Care Providers Are Most Trusted Source Of Information On COVID-19 Vaccine
Trust in personal doctors for vaccine information is universally high across partisan identification and race/ethnicity. However, when it comes to government-affiliated sources of information such as the CDC and even local public health departments, a much larger share of Democrats compared with Republicans say they trust each to provide reliable information about a COVID-19 vaccine, with independents generally falling in the middle. Predictably, trust in President-elect Biden and President Trump falls sharply along partisan lines.
Table 3: Trust In Sources Of COVID-19 Vaccine Information By Party Identification And Race/Ethnicity
Percent who say they trust each of the following a great deal or a fair amount to provide reliable information about a COVID-19 vaccine:
Total
Party ID
Race/Ethnicity
Dem.
Ind.
Rep.
Black
Hispanic
White
Their own doctor or health care provider
85%
93%
84%
81%
85%
75%
87%
The U.S. Centers for Disease Control and Prevention, or CDC
73
88
70
57
78
71
73
The U.S. Food and Drug Administration, or FDA
70
81
67
62
74
66
71
Their local public health department
70
87
67
56
79
65
70
Dr. Anthony Fauci, the director of the National Institute of Allergy and Infectious Diseases
68
90
67
47
77
62
68
Their state government officials
58
77
53
47
65
53
60
President-elect Joe Biden
57
93
52
23
76
58
54
Pharmaceutical companies
53
67
48
45
58
50
54
President Trump
34
7
30
78
12
26
41
Trusted messengers also differ among the different profile groups according to vaccine enthusiasm. The easiest group to convince – those who say they’ll get the vaccine as soon as they can – place a high level of trust in each type of messenger asked about, with the exception of President Trump. The “wait and see” and “only if required” groups both place the highest level of trust in their own health care providers, but majorities of both of these groups also say they trust a variety of national and local messengers including the CDC, FDA, Dr. Anthony Fauci, and their local public health departments. The “only if required” group is somewhat more divided politically, with about four in ten (43%) saying they trust President-elect Biden at least a fair amount for reliable vaccine information and a similar share (46%) saying they trust President Trump.
The group that says they definitely will not get vaccinated may be the hardest to reach with any traditional public health messengers. Very few say they place much trust in most of the messengers asked about at the national, state, or local level. Only two messengers are trusted by at least half the people in this group: their own doctor or health care provider (59%) and President Trump (56%), suggesting that individual health care practitioners will be one of the only avenues for reaching this group with accurate and timely vaccine information.
Table 4: Trust In Sources of COVID-19 Vaccine Information By COVID-19 Vaccine Enthusiasm
Percent who say they trust each of the following a great deal or a fair amount to provide reliable information about a COVID-19 vaccine:
Total
Get it as soon as you can
Wait and see
Get it only if required
Definitely will not get
Their own doctor or health care provider
85%
96%
87%
82%
59%
The U.S. Centers for Disease Control and Prevention, or CDC
73
89
78
68
26
The U.S. Food and Drug Administration, or FDA
70
86
75
66
26
Their local public health department
70
84
76
67
28
Dr. Anthony Fauci, the director of the National Institute of Allergy and Infectious Diseases
68
87
73
64
16
Their state government officials
58
72
61
57
22
President-elect Joe Biden
57
77
62
43
14
Pharmaceutical companies
53
70
53
46
20
President Trump
34
26
28
46
56
Appendices
Appendix A.Shares Who Say They Are Vaccine Hesitant And Reasons Why, By Party Identification, Age, and Race/Ethnicity
Total
Party ID
Age
Race/Ethnicity
Dems
Inds
Reps
18-49
50+
Black
White
Hisp.
Percent who say they would definitely or probably not get vaccinated for COVID-19:
27%
12%
31%
42%
33%
21%
35%
26%
26%
Percent say they would probably or not get vaccinated and each of the following is a major reason why (based on total):
Worried about possible side effects
16%
10%
18%
23%
19%
13%
25%
14%
15%
Do not trust the government to make sure the vaccine is safe and effective
15
8
16
23
18
11
21
14
13
Vaccine is too new and want to wait and see how it works for other people
15
10
17
17
19
10
25
13
16
Politics has played too much of a role in the vaccine development process
14
7
14
22
15
12
19
13
12
The risks of COVID-19 are being exaggerated
12
3
13
24
13
11
12
13
9
Don’t trust vaccines in general
10
5
13
13
12
8
17
9
9
Do not trust the health care system
10
5
11
15
11
9
10
9
7
Worried that they may get COVID-19 from the vaccine
7
5
9
8
8
5
17
6
6
Don’t think they are at risk of getting sick from COVID-19
6
2
6
10
6
5
7
5
7
Appendix B. Demographic Profiles Of Vaccine Enthusiasm Groups
“As soon as possible”
“Wait and see”
“Only if required”
“Definitely won’t get it”
Percent of total public
Percent of total
34%
39%
9%
15%
100%
Gender
Male
49%
46%
53%
53%
49%
Female
51
53
47
47
51
Party ID
Democrats
43%
33%
18%
11%
32%
Independents
27
30
38
34
30
Republicans
20
22
28
41
25
Age
18-29
13%
28%
28%
18%
21%
30-49
26
30
47
46
33
50-64
28
23
21
23
25
65+
33
19
5
11
21
Race/Ethnicity
White, Non-Hispanic
71%
56%
47%
58%
61%
Black, Non-Hispanic
7
16
14
12
12
Hispanic
12
18
20
19
16
Other
8
7
16
7
9
Essential worker status
Employed and essential worker
30%
34%
61%
44%
37%
Employed and not essential worker
21
20
11
14
18
Not employed (includes those who are retired or students)
49
45
27
42
44
Health care worker in household
Health care worker in household
13%
16%
21%
16%
16%
Respondent is a health care worker
5
6
14
3
6
Other household member is a health care worker
7
9
6
11
8
Respondent and another household member are health care workers
1
0
1
2
1
No health care worker in household
86
84
79
84
84
Serious health condition in household
Someone in household has a serious health condition
52%
48%
33%
34%
46%
No one in household has serious health condition
47
50
67
65
53
Community Type
Urban
38%
35%
33%
35%
36%
Suburban
51
53
53
49
51
Rural
11
12
14
16
12
Education
High school or less
30%
41%
31%
53%
38%
Some college
30
30
38
28
30
College+
39
29
31
19
31
Household income
<$40K
33%
37%
31%
35%
35%
$40K-<$90K
27
32
27
26
28
$90K+
33
21
36
29
28
Don’t know/Refused
7
9
6
10
9
Methodology
This KFF COVID-19 Vaccine Monitor survey was designed and analyzed by public opinion researchers at the Kaiser Family Foundation (KFF). The survey was conducted November 30- December 8, 2020, among a nationally representative random digit dial telephone sample of 1,676 adults ages 18 and older (including interviews from 298 Hispanic adults and 390 non-Hispanic Black adults), living in the United States, including Alaska and Hawaii (note: persons without a telephone could not be included in the random selection process). Phone numbers used for this study were randomly generated from cell phone and landline sampling frames, with an overlapping frame design, and disproportionate stratification aimed at reaching Hispanic and non-Hispanic Black respondents. The sample also includes interviews completed with respondents who had previously completed an interview on the KFF Tracking Poll (n =267) or an interview on the SSRS Omnibus poll (and other RDD polls) and identified as Hispanic (n = 80; including 14 in Spanish) or non-Hispanic Black (n=179). Computer-assisted telephone interviews conducted by landline (391) and cell phone (1,285, including 947 who had no landline telephone) were carried out in English and Spanish by SSRS of Glen Mills, PA. To efficiently obtain a sample of lower-income and non-White respondents, the sample also included an oversample of prepaid (pay-as-you-go) telephone numbers (25% of the cell phone sample consisted of prepaid numbers) Both the random digit dial landline and cell phone samples were provided by Marketing Systems Group (MSG). For the landline sample, respondents were selected by asking for the youngest adult male or female currently at home based on a random rotation. If no one of that gender was available, interviewers asked to speak with the youngest adult of the opposite gender. For the cell phone sample, interviews were conducted with the adult who answered the phone. KFF paid for all costs associated with the survey.
The combined landline and cell phone sample was weighted to balance the sample demographics to match estimates for the national population using data from the Census Bureau’s 2019 U.S. American Community Survey (ACS), on sex, age, education, race, Hispanic origin, and region, within race-groups, along with data from the 2010 Census on population density. The sample was also weighted to match current patterns of telephone use using data from the January- June 2019 National Health Interview Survey. The weight takes into account the fact that respondents with both a landline and cell phone have a higher probability of selection in the combined sample and also adjusts for the household size for the landline sample, and design modifications, namely, the oversampling of prepaid cell phones and likelihood of non-response for the re-contacted sample. All statistical tests of significance account for the effect of weighting.
The margin of sampling error including the design effect for the full sample is plus or minus 3 percentage points. Numbers of respondents and margins of sampling error for key subgroups are shown in the table below. For results based on other subgroups, the margin of sampling error may be higher. Sample sizes and margins of sampling error for other subgroups are available by request. Note that sampling error is only one of many potential sources of error in this or any other public opinion poll. Kaiser Family Foundation public opinion and survey research is a charter member of the Transparency Initiative of the American Association for Public Opinion Research.
The Centers for Disease Control and Prevention (CDC) and other public health officials recommend that people who are sick with COVID-19 should stay home and that employers should consider implementing a telecommuting program when possible. Benefits such as sick leave and family leave can help employees follow these guidelines. However, the U.S. does not have national standards on paidfamily or sick leave. Our current system is a patchwork of policies that are determined by employers, state and local laws, or negotiated through labor contracts. Offer rates vary between employers, the reasons for needing leave, and the employment status of their workers. The lack of a national policy means some employees are forced to take unpaid leave, or come to work when they are ill. The lack of paid leave disproportionately impacts certain populations, including low-income persons, who are less likely to have access to these benefits, and could have public health consequences if people cannot afford to take time off. Lack of paid leave also has a large impact on women, who take on the bulk of health care responsibilities for their family members and may have to miss work as a result.
While there have been previous congressional efforts to create a uniform national floor for paid leave, this issue has gained new urgency with efforts to stem the spread of COVID-19. Since the outbreak began in the U.S., the President has signed into law the Families First Coronavirus Response Act as well as the C.A.R.E.S. Act. These laws include the following emergency short-term paid sick leave benefits and longer-term paid family leave policies.
Employers with fewer than 500 employees and all public employers are required to provide up to two weeks of fully-paid sick leave (up to $5,110) for immediate use to workers unable to work due to their own quarantine or symptoms of coronavirus, and up to two-thirds of regular pay for two weeks (up to $2,000) for employees who are unable to work in order to care for someone in quarantine or whose child’s school or daycare is closed because of coronavirus.
Separately, employers with fewer than 500 employees and all public employers are required to provide paid family leave to workers who are unable to work because their child’s school or daycare has closed due to coronavirus in the amount of two-thirds of their regular pay (up to $10,000) for up to 12 weeks, after a 10-day unpaid waiting period.
The emergency paid family leave benefit only applies to employees covered by Title II of the Family and Medical Leave Act (FMLA); therefore, most federal employees are not eligible.
Neither emergency paid leave provision applies to employees of private businesses with 500 or more employees.
Health care workers, emergency responders, and certain federal employees in the Executive Branch may also be excluded from receiving these benefits.
Workers employed by a business with fewer than 50 employees may also be excluded from receiving these benefits if their reason for missing work is due to their child’s school or daycare closure.
Participating employers will receive advanceable quarterly tax credits to cover the costs of providing the new leave benefits.
All provisions take effect 15 days after enactment (April 1, 2020), do not provide for retroactive benefits, and expire December 31, 2020.
Access to paid sick leave benefits varies greatly between employees, employers, and regions.
Sick leave benefits typically allow employees to miss work without losing pay when they or a family member has a short-term illness. There is no federal requirement that employers offer employees paid sick leave, but some employees, including federal government employees, have generally had access to paid sick leave through employee benefits packages.
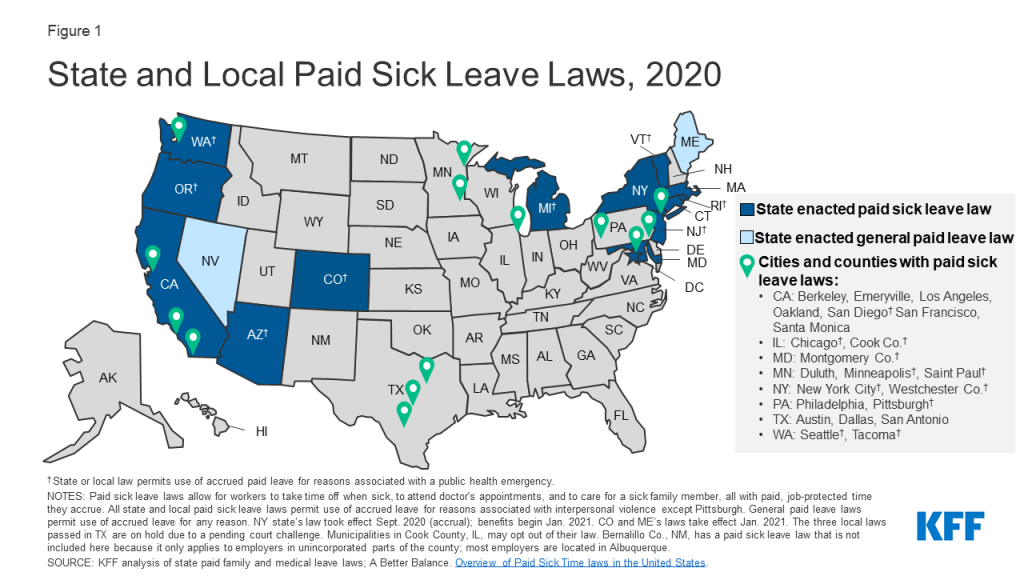
Thirteen states plus D.C. and 22 cities and counties1 have passed laws requiring that eligible employees get paid time off to care for themselves or sick family members. Another two states (ME and NV) require employers to provide general paid time off for workers to use as needed, including for sick leave (Figure 1). These state and local laws, however, do not apply to all workers in these locations; small employers are sometimes exempt, and part-time workers and those who have worked for their employers for a short duration may not be eligible for these benefits. Additionally, the duration, accrual rates, and circumstances under which paid sick leave may be taken vary by policy and state. Eight states’ and 11 localities’ requirements explicitly apply to public health emergencies, such as closure of a business or child’s school to protect public health.
In response to coronavirus, on March 17, 2020, New York state implemented a temporary emergency paid sick leave law for workers who are subject to coronavirus-related quarantine (or to care for their children subject to quarantine). Since then, another four states, plus D.C., and 14 localities2 have passed their own emergency paid sick leave laws, many aimed at closing the gaps in the federal FFCRA legislation.
Figure 1: State and Local Paid Sick Leave Laws, 2020
Research suggests that paid sick leave can help stem the spread of illness by reducing presenteeism (going to work ill) in the workplace and the chance of sending sick children to school or daycare. Sick workers are more likely to stay home when they do not lose pay. Parents with paid sick leave benefits may be less likely to send sick children to school than parents without these benefits.
How many workers have paid sick leave?
According to the Bureau of Labor Statistics, three in four (75%) of workers in private industry have access to at least some paid sick leave, as do approximately nine in ten (91%) state and local government workers.
However, there are wide disparities in access to paid sick leave (Table 1). Among private industry workers, rates of paid sick leave rise with wages, with about half (49%) of workers in the lowest wage quartile ($13.25/hour on average) having this benefit, compared to 92% in the highest quartile. Less than half of part-time workers (45%) in private industry have paid sick leave, compared to 86% of full-time employees. The lower likelihood of paid sick leave for part-time workers has a disproportionate impact on women, who are more likely than men to hold part-time jobs. Workers in certain industries are more likely to have paid sick leave than in others. Union workers (88%) and workers are larger employers (88%) are more likely than non-union workers (74%) and workers at smaller employers (66%) to offer paid sick leave to their workers. Access to paid sick leave also varies by worker occupation. For example, 95% of workers in management, business, and financial occupations have paid sick leave, compared to 57% of workers in construction, extraction, farming, fishing, and forestry occupations.
Among workers in private industry who have paid leave benefits, the average duration is seven days; however, one-quarter (25%) of workers have fewer than five days. For state and local government workers, the average is 11 days, and 9% have fewer than five days.
Table 1. Share of Private Industry and Government Workers with Access to Paid Sick Leave, 2020
Private Industry
State/Local Govt.
All Workers
75%
91%
Full-Time
86%
99%
Part-Time
45%
46%
Union
88%
98%
Non-Union
74%
86%
Average Wage:
Lowest 25%
49%
79%
Second 25%
80%
96%
Third 25%
87%
97%
Highest 25%
92%
96%
Employer Size:
<50 workers
66%
86%
50-99 workers
74%
93%
100-499 workers
82%
90%
500+ workers
88%
93%
Worker Occupations:
Management, business, and financial
95%
–
Teachers
–
93%
Service
59%
85%
Sales and related
65%
–
Office and administrative support
84%
93%
Construction, extraction, farming, fishing, and forestry
57%
–
Installation, maintenance, and repair
79%
–
Production, transportation, and material moving
72%
90%
NOTE: Dash indicates no workers in this category or data did not meet publication criteria. Ninety-four percent of registered nurses in the civilian workforce (private industry and state and local government) have access to paid sick leave.
Most workers do not have paid family and medical leave benefits.
Should the coronavirus require employees to stay home from work for longer periods, some may turn to family and medical leave benefits, which typically can be used for longer-term illnesses. This is particularly important for COVID-19, given that some infected persons could be quarantined for as long as 14 days.
There is no federal requirement for employers to provide paid family and medical leave. The Family and Medical Leave Act (FMLA) requires eligible employers to provide 12 weeks of unpaid family leave to care for seriously ill family members, and job protection when employees return to work. Employees can use family leave to care for children or other relatives, including aging parents, who are at heightened risk for coronavirus. Women are the primary caregivers for the nation’s older population, comprising roughly two-thirds of informal caregivers, and many work outside the home.
The FMLA protections apply to 60% of the workforce, as the law only applies to employers with at least 50 employees, and not all employees within covered worksites are eligible. This means that in addition to losing pay when they take medical leave, many workers’ jobs may not be protected by the FMLA.
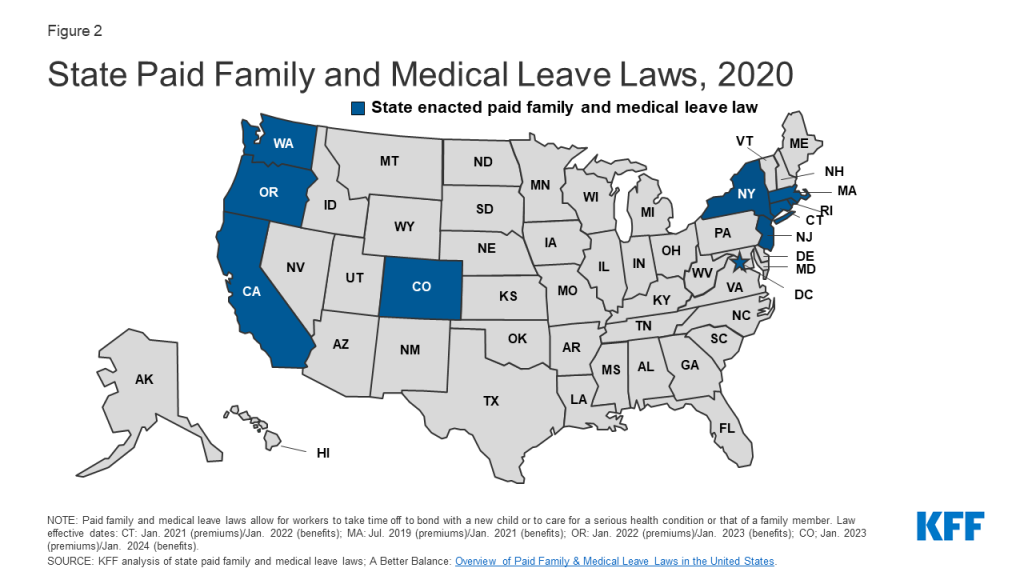
Currently, nine states and D.C. have enacted paid family leave laws, with partial wage replacement up to a designated cap (Figure 2). Duration of leave varies by state, but most provide for 6 to 12 weeks, and all allow leave for the care of seriously ill children, spouses, partners, parents, and in some cases to all blood relatives. Some of these state policies use disability benefits systems to provide the wage replacement.
Figure 2: State Paid Family and Medical Leave Laws, 2020
How many workers have paid family and medical leave?
Despite strong publicsupport and the growing interest in paid family and medical leave at the local level, only 20% of private industry workers and 26% of state and local government workers have access to it, with wide variation around worker and employer characteristics (Table 2). As with access to paid sick leave, full-time workers, higher-wage earners, workers at larger employers, and management/professional occupations are more likely to have access to paid family leave than their counterparts.
Table 2. Share of Private Industry and Government Workers with Access to Paid Family Leave, 2020
Private Industry
State/Local Govt.
All Workers
20%
26%
Full-Time
24%
28%
Part-Time
8%
12%
Union
18%
28%
Non-Union
20%
23%
Average Wage:
Lowest 25%
8%
21%
Second 25%
19%
26%
Third 25%
23%
25%
Highest 25%
33%
29%
Employer Size:
1-49 workers
13%
26%
50-99 workers
19%
19%
100-499 workers
22%
29%
500+ workers
31%
24%
Worker Occupations:
Management, professional, and related
33%
27%
Teachers
–
28%
Service
12%
23%
Sales and office
21%
24%
Natural resources, construction, and maintenance
13%
27%
Production, transportation, and material moving
11%
22%
NOTE: Dash indicates no workers in this category or data did not meet publication criteria. Thirty-six percent of registered nurses in the civilian workforce (private industry and state and local government) have access to paid sick leave.
SOURCE: U.S. Bureau of Labor Statistics, National Compensation Survey, March 2020. Excel dataset.
Few low-wage workers have worked at home.
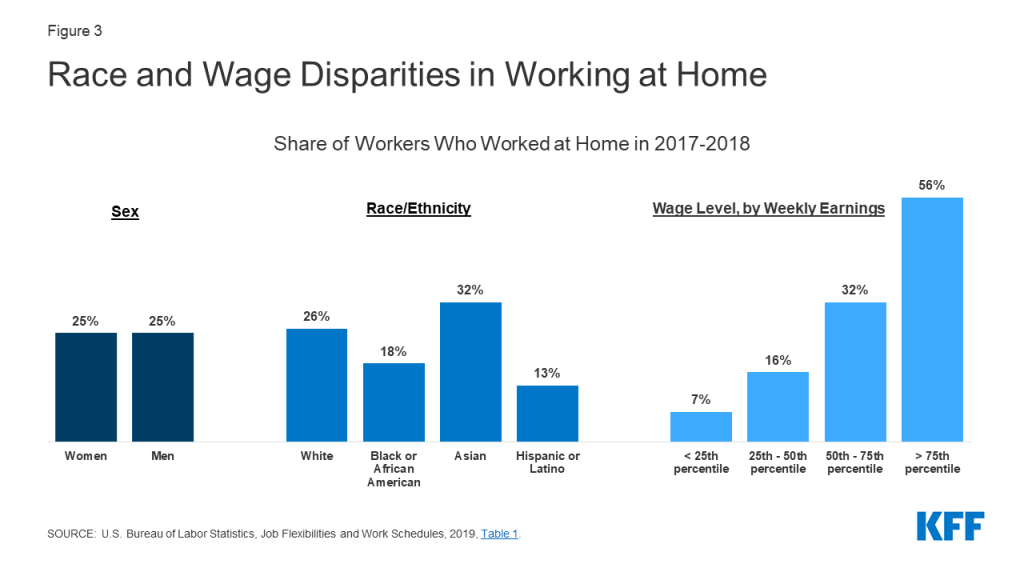
The CDC has also encouraged employers to consider greater use of telecommuting as part of the push for social distancing during the pandemic. However, not all employers or job positions are amenable to telecommuting. Just a quarter (25%) of workers worked at home in 2017-2018. The rate of telecommuting varies greatly between industries, with almost half of workers in financial activities and professional services (47%) having worked at home, compared to less than a tenth of workers in leisure and hospitality industries (7%). Within industries, there can be variation by position. Half (51%) of those in management positions have worked at home, compared to 7% in maintenance and repair positions. The share is also lower among workers with lower wages as well as Hispanic workers (Figure 3).
Figure 3: Race and Wage Disparities in Working at Home
Among workers with children, mothers are usually the ones to stay home when children are sick. Most do not get paid during this time.
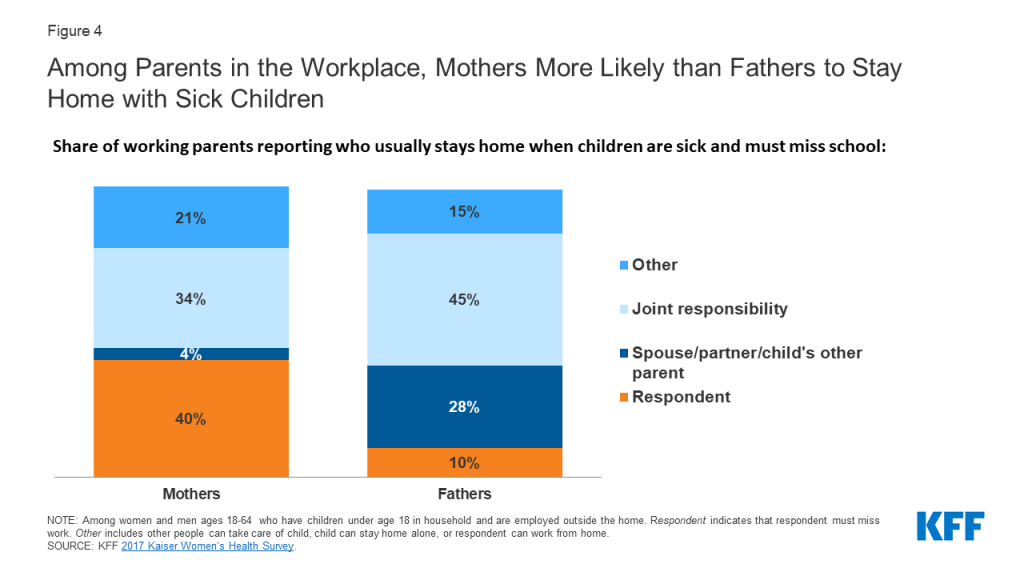
The limits on paid leave benefits are also of importance to parents who work outside the home, as some schools across the country have closed and many others are considering it in response to COVID-19. Women comprise nearly half of the nation’s workforce and are usually the ones to care for children when they are sick and cannot attend school or daycare. Four in ten (40%) mothers working outside the home say they must take time off work and stay home when their children are sick, compared to 10% of fathers working outside the home (Figure 4). However, more than half (56%) of the working mothers who must miss work when their children are sick forgo their wages when they take time off (Figure 5).
Figure 4: Among Parents in the Workplace, Mothers More Likely than Fathers to Stay Home with Sick ChildrenFigure 5: Many Working Mothers Are Not Paid When They Take Time Off to Care for Sick Children
Having to miss work to care for a sick child has a disproportionate impact on workers who are low-income or in part-time jobs, as they are less likely than their counterparts to have paid sick leave or family leave benefits (Table 3). Furthermore, mothers in part-time jobs are more likely to report they have to miss work when their child is sick (51%) compared to about a third (36%) of their full-time counterparts. Low-income mothers who must miss work when their child is sick are also far more likely to lose pay (73%) compared to higher-income mothers (47%).
Table 3. Paid Leave Among Working Mothers, 2017
Does your employer offer you:
When your child is sick do you:
Paid sick leave
Paid family leave
Have to miss work
Lose pay when you miss work
Mothers <200% FPL
56%*
40%*
43%
73%*
Mothers ≥200% FPL
70%
54%
38%
47%
Mothers Full-Time Employment
76%
58%
36%
49%
Mothers Part-Time Employment
34%*
22%*
51%*
n/a
NOTES: Among women ages 18-64 who have children under 18. The Federal Poverty Level (FPL) was $20,420 for a family of three in 2017. Some estimates are “n/a” because point estimates do not meet the minimum standards for statistical reliability.*Statistically significant difference from >200% FPL or Full Time (p<.05).SOURCE: KFF, 2017 Kaiser Women’s Health Survey.
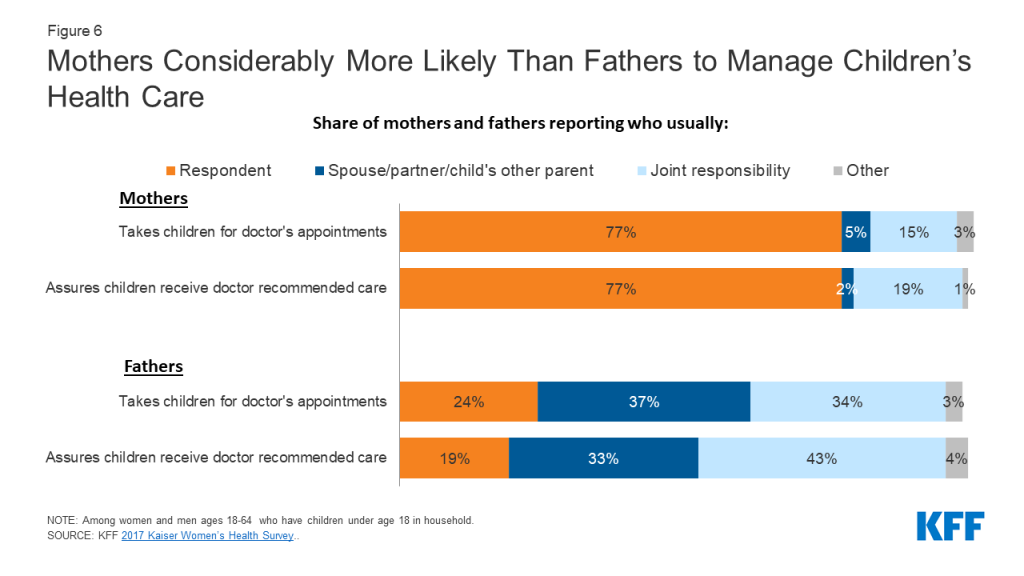
Should children become sick with COVID-19, lack of paid leave will also have a disproportionate impact on the nation’s mothers, who, more often than fathers, report being the primary person to take children for doctor’s appointments (77% mothers, 24% fathers) or obtain any recommended follow up care (77% mothers, 19% fathers) (Figure 6). Women also comprise the majority of caregivers for aging and sick parents.
Figure 6: Mothers Considerably More Likely Than Fathers to Manage Children’s Health Care
Conclusion
The COVID-19 pandemic is shining a spotlight on gaps in employer leave benefits and the risk of employees losing pay if they stay home because they are sick or to care for others. Some employers have changed policies in light of this situation and are now offering more workers paid leave, which may encourage employees to stay home if they are sick and reduce risks to public health. Some employers say that they do not have the means to offer paid leave to their employees. While this pandemic adds new urgency to this issue, it is important to recognize that nearly all workers will need to take time off at some point during the course of their careers either for their own health or to care for a family member. However, those who earn the lowest wages are the least likely to have this important benefit. These individuals had a gap in benefits before the COVID-19 pandemic, and unless long term action is taken, will likely continue to lack paid leave after the urgency of the pandemic is behind us.
Bernalillo Co., NM, has a paid sick leave law that is not included here because it only applies to employers in unincorporated parts of the county; most employers are located in Albuquerque. ↩︎
San Mateo and Sonoma Counties (CA) have temporary emergency paid sick leave laws that are not included here because they only apply to certain employers in unincorporated parts of the county. ↩︎
Recent KFF analysis suggests that the overall uninsured rate may not have changed that substantially during the pandemic. On one hand, this is good news since early estimates predicted a drastic increase in the uninsured rate given the scale of employment losses. On the other hand, if the uninsured rate has indeed held steady, it would mean there are still tens of millions of people without health coverage during the pandemic. Many of these uninsured people are eligible for financial assistance under the Affordable Care Act (ACA), but they may have just hours left to sign up for coverage before the ACA Open Enrollment window closes at midnight December 15.
As the chart below shows, most of the uninsured in a typical year are eligible for financial help to buy coverage, and of those, most are eligible for a free or nearly free plan. Before the pandemic, about one in four uninsured people were eligible for Medicaid and another third were eligible for financial assistance on the Marketplaces, meaning, in total, 57% of the uninsured could get financial help to access coverage. In fact, most of those eligible for help can get free (or nearly free) insurance coverage. The 24% of uninsured people who are eligible for Medicaid (6.7 million people) generally would pay no premium to sign up, and another 16% of the uninsured (4.5 million people) are eligible for a Bronze plan with a $0 premium.
More than a month into the current Marketplace Open Enrollment period for 2021, signups in federal exchange states appear strong, but the vast majority of signups are from returning enrollees. We still are not seeing a surge of signups from new enrollees relative to past years, but many people who are uninsured may be surprised at what they find if they look at their options.
The federal Open Enrollment period runs through midnight December 15, but it extends into January in most states that operate their own health insurance exchanges. There is no deadline to sign up for Medicaid. If you have questions about signing up for coverage, please see our FAQ page.
On December 11, the Food and Drug Administration (FDA) issued the first emergency use authorization (EUA) for a COVID-19 vaccine – the Pfizer-BioNTech vaccine – followed by the Centers for Disease Control and Prevention (CDC)’s recommendation for use, clearing the way for delivery and administration of the vaccine throughout the country. Initially, supply will be very limited, meaning states have to make difficult decisions about who should get the first allocations.
To help guide these decisions, the CDC’s Advisory Committee on Immunization Practices (ACIP) released an interim recommendation on December 1 for the highest priority group (“Phase 1a”) to include health care workers (HCWs) and long-term care (LTC) residents; we estimate that this populations together represents about 17.6 million people. ACIP also provided further guidance regarding sub-prioritization within these groups. While ACIP has yet to finalize recommendations on subsequent prioritization (expected soon), according to presentations and materials provided in recent ACIP meetings, the committee is likely to recommend that (non-health care) essential workers be the next priority group (“Phase 1b”), followed by persons age 65 and older and those with conditions that place them at high risk for severe illness from COVID-19 (“Phase 1c”). These groups are much larger, which will likely make the next stages of prioritization much more difficult given that supply will still be limited (according to ACIP, there are an estimated 87 million essential workers, 53+ million seniors and more than 100 million individuals with high-risk medical conditions).
States look to and often follow ACIP guidance, but the federal recommendations are not binding and some states may choose to depart from the prioritization sequence outlined by ACIP, which could mean that initial access will depend on where people live. To see where states stand on prioritization, we collected and reviewed all statements and releases from state officials that reference the criteria they will use to prioritize vaccines during Phase 1, as defined by ACIP (these prioritization criteria build on and add detail to states’ initial vaccine distribution plans, which we already examined here). We did not assess how individual facilities (such as hospitals) will allocate vaccines once they arrive at their doors.
Findings
All states have released updated prioritization criteria for Phase 1, primarily in response to ACIP deliberations and guidance. Some had planned emergency meetings in anticipation of the FDA’s announcement and ACIP’s follow-on recommendation. Importantly, most indicate that these criteria could change depending on supply, vaccine characteristics, and other factors.
Most states are following ACIP’s Phase 1a recommendation.
45 states are following ACIP’s interim Phase 1a recommendation to prioritize HCWs and LTC residents. Some states will start vaccinating both of these groups together, while others will start with one of these groups first as they await more supply to start vaccinating the other. Still, even with these state criteria, decisions about how to allocate limited initial vaccines to HCWs and LTC residents will mostly be left to facilities.
7 states depart from ACIP’s Phase 1a recommendation in some way. For example, the District of Columbia and Utah include HCWs in Phase 1a but LTC residents in Phase 1b. In addition to HCWs and LTC residents, Nevada, New Hampshire, and Wyoming also include law enforcement in Phase 1a (per ACIP’s proposed framework, they are in 1b). Massachusetts also includes people incarcerated in prisons and those living in homeless shelters in Phase 1a (neither is explicitly mentioned in ACIP’s Phase 1 framework).
More than 20 states also provide further sub-prioritization rankings or criteria within HCW and/or LTC resident groupings. For example, Alabama segments HCWs into “very-high”, “high”, and “medium” risk. Idaho provides specific rankings within each group. Texas groups Phase 1a into “first” and “second” tier.
The majority of states are still developing criteria for subsequent Phase 1 prioritization, but there are already some differences from ACIP’s preliminary framework.
30 states indicate that they are still developing more specific criteria for these next phases.
Of the 21 with criteria, 8 follow ACIP for Phase 1b and 5 follow ACIP for 1c.
The main differences lie in where states place people ages 65 and older and those with high risk medical conditions, relative to essential workers. For example, Alabama, Delaware, Florida, Maryland, North Carolina, and Tennessee each prioritize those 65+ and/or those with high risk medical conditions over non-health essential workers; North Carolina and Tennessee prioritize those with high risk medical conditions over those ages 65 and older.
In addition, some include other congregate settings (not indicated in ACIP’s framework). Alabama, Nebraska, Nevada, North Carolina and Oklahoma explicitly include those living in homeless shelters and prisons in Phases 1b or c. Delaware and Tennessee explicitly include people incarcerated in prisons in 1c.
Discussion
Our review finds that almost all states hew to ACIP regarding initial allocations of a COVID-19 vaccine (Phase 1a) and have looked specifically at ACIP for decision-making. Beyond that, a good number of states are still developing criteria for Phases 1b-c. Given that ACIP has yet to issue recommendations for these phases, states may be waiting for further guidance. However, based on ACIP’s preliminary framework, there are some differences between state priorities and where ACIP is likely to land, primarily related to the prioritization of seniors and/or those with high risk medical conditions relative to non-health essential workers. Moreover, these later prioritization decisions are likely to be more difficult given the large numbers of people in these groups and continued limits on vaccine supply.
Table 1: Sources for State Prioritization Criteria
As the U.S. prepares for nationwide distribution of vaccines to combat COVID-19, some are asking whether people who get the first of two doses will return to complete the series. The leading vaccine candidates from Pfizer/BioNTech and Moderna both require individuals to receive a second shot within a specific timeframe to achieve maximum effectiveness.
This analysis draws on Medicare Part D prescription drug claims data for the herpes zoster vaccine Shingrix, which also requires two doses, to shed light on this potential challenge of the leading COVID-19 vaccine candidates. Shingrix is recommended for adults ages 50 and older to prevent herpes zoster, also known as shingles, a viral infection that causes a painful rash and can lead to long-term pain and other problems. The second dose of Shingrix is to be administered between 2 and 6 months after the first dose. Overall, one-third of adults ages 60 and older in 2018 reported having ever received a shingles vaccine, but this estimate does not provide insight into which groups of older adults were more or less likely to get the second dose within the recommended timeframe after having received the first.
To address this question, we looked at Medicare beneficiaries who received an initial dose of Shingrix in the first half of 2018 to analyze what share received the second dose within the recommended timeframe and which subgroups of beneficiaries were more or less likely to receive both doses. Because people 65 and older are expected to be one of the earlier groups to receive COVID-19 vaccination, this analysis offers insight into what the experience might be among older adults in receiving the full regimen of multidose COVID-19 vaccines.
The majority of Medicare beneficiaries who received an initial dose of the Shingrix vaccine received the second dose within six months, but follow-up rates were lower among beneficiaries in communities of color, those who are younger than age 65 with long-term disabilities, and low-income beneficiaries.
Most (74%) Medicare beneficiaries who received an initial dose of Shingrix between January and June of 2018 received the second dose within 6 months (Figure 1). Conversely, 1 in 4 beneficiaries (26%) who received an initial dose of Shingrix between January and June 2018 did not receive the second dose within the recommended timeframe. An additional 6% of beneficiaries received the second dose after the 6-month timeframe but no later than the end of 2018.
Follow-up Shingrix vaccination rates were higher among White beneficiaries (76%) than among Hispanic (58%), American Indian/Alaska Native (61%), Black (61%), and Asian/Pacific Islander beneficiaries (69%). In other words, roughly 4 in 10 Black, Hispanic, and American Indian/Alaska Native beneficiaries did not receive their second shingles shot within the recommended 6-month timeframe. The share of beneficiaries receiving the second dose by the end of 2018 was higher among each group, but all estimates for beneficiaries of color were lower than for White beneficiaries.
Medicare beneficiaries under age 65, who qualify for Medicare because of a long-term disability, were less likely than beneficiaries ages 65 and older to receive a second dose of Shingrix within 6 months. Among beneficiaries under age 65 who received a first dose of Shingrix between January and June of 2018, 66% received a second dose within 6 months of their first dose – a lower rate than among beneficiaries ages 65 to 74 (75%), 75 to 84 (76%), and 85 and older (71%).
Beneficiaries with incomes less than 150% of poverty were less likely than beneficiaries with higher incomes to receive the second dose of the shingles vaccine within 6 months. (We used the share of beneficiaries receiving Part D low-income subsidies (LIS) as a proxy for low income). Only 64% of beneficiaries with lower incomes received the second dose within 6 months of their first dose in 2018, compared to 77% of those with higher incomes.
Notably, unlike the COVID vaccine which will be covered at no cost for Medicare beneficiaries, the Shingrix vaccine is not free to Medicare beneficiaries without LIS, but it is covered at very low cost to beneficiaries who receive LIS. In 2018, Medicare Part D enrollees without LIS paid an average of $57 out of pocket for each shot, while those who received LIS paid $5. (Under Part D, a separate copayment is required for each dose in the series.) It is possible that out-of-pocket costs deterred some beneficiaries from getting the follow-up shingles vaccine, but other factors may also be barriers to completing the series, such as lack of communication between providers and patients or misunderstanding about the necessity of the second dose, the hassle factor of a return visit to a doctor’s office or pharmacy for the second shot, or being deterred by adverse effects after the first dose. Patients can sign up on the Shingrix website to receive a second dose reminder, but doing so requires knowledge and action by patients. Research shows that pharmacist reminder calls can also help boost compliance with the shingles vaccine series, but this may not happen systematically across all providers.
The fact that the second dose of the two leading COVID-19 vaccine candidates is administered no more than one month after the first dose – versus up to 6 months between the first and second doses of the shingles vaccine – could mitigate some of the loss to follow up observed with the shingles vaccine. Moreover, preliminary evidence showing that the two COVID-19 vaccines closest to FDA authorization are highly effective in preventing COVID-19, a potentially fatal disease, may translate to higher take-up rates for the second shot than we observed with Shingrix. In addition, states and vaccine providers are being encouraged by the Centers for Disease Control and Prevention to attempt to schedule a second dose appointment at the time of a patient’s first dose. As part of a national vaccine education campaign, having systems in place for providers to communicate with patients about returning for a second dose is likely to be important in ensuring full compliance with the new COVID-19 vaccines. But the differences we observed in the percent of beneficiaries in different racial and ethnic groups, different age cohorts, and different income levels who received the second dose of Shingrix also underscore the challenges ahead in inoculating vulnerable populations against COVID-19.
Juliette Cubanski and Tricia Neuman are with KFF. Anthony Damico is an independent consultant.
Data and Methods
This analysis is based on 2018 Medicare Part D prescription drug event claims data from a 20% sample of Medicare beneficiaries from the Centers for Medicare & Medicaid Services (CMS) Chronic Conditions Data Warehouse (CCW). Our analysis includes 0.8 million Part D enrollees who were enrolled for the full 2018 calendar year and who received an initial shot of Shingrix between January and June of 2018. Shingrix was approved by the U.S. Food & Drug Administration in October 2017.
Our estimate of beneficiaries with incomes less than 150% of the federal poverty level (FPL) is based on the share of Part D enrollees receiving full or partial Part D Low-Income Subsidies (LIS).
Here’s our recap of the past week in the coronavirus pandemic from our tracking, policy analysis, polling, and journalism.
The U.S. surpassed 15.6 million total cases this week as an independent Food and Drug Administration panel of outside advisers supported emergency use authorization for the Pfizer COVID-19 vaccine.
At KFF, our new analysis provides national and state-level estimates of the number of health care workers and long-term care residents who are expected to be part of the group first in line to receive the coronavirus vaccine. KHN reports that there won’t be enough to vaccinate everyone in the priority group in the first few weeks. Meanwhile advocacy groups for certain workers are already pushing to be next in line as “people who keep society functioning.”
In an event held today by KFF and the Morehouse School of Medicine’s Satcher Health Leadership Institute, panelists discussed racial health disparities that have surfaced during the pandemic and what could be done to assure equity as COVID-19 vaccines come to market. This was part of a larger discussion on racism and discrimination in health care.
The economic impact of the pandemic has contributed to job losses, but as analysts write in Policy Watch this week, declines in employer sponsored insurance are far less than overall declines in employment and may have been offset by strong enrollment in Medicaid and the Affordable Care Act Marketplaces.
Here are the latest coronavirus stats from KFF’s tracking resources:
Global Cases and Deaths: Total cases worldwide reached 69.6 million this week – with an increase of nearly 4.4 million new confirmed cases in the past seven days. There were approximately 75,600 new confirmed deaths worldwide, bringing the total for confirmed deaths near 1.6 million.
U.S. Cases and Deaths: Total confirmed cases in the U.S. passed 15.6 million this week. There was an increase of nearly 1.5 million confirmed cases between Dec. 4 and 10. Approximately 15,800 confirmed deaths in the past week brought the total in the United States to 292,100.
Race/Ethnicity Data: Hispanic individuals made up a higher share of cases compared to their share of the total population in 42 of 46 states reporting cases. In 6 states (OR, WA, MA, NC, PA, and NH), Hispanic peoples’ share of cases was more than 2.5 times their share of the population. Black individuals made up a higher share of cases/deaths compared to their share of the population in 27 of 50 states reporting cases and 30 of 49 states reporting deaths. In 4 states (ME, VT, NH, and MI) the share of COVID-19 related deaths among Black people was at least two times higher than their share of the total population. COVID-19 continues to have a sharp, disproportionate impact on American Indian/Alaska Native as well as Asian people in some states. In 7 states, the share of COVID-19 related deaths among AIAN people was at least two times higher than their share of the total population (AK, NM, MT, AZ, MS, WA and NE).
This month the Centers for Disease Control and Prevention (CDC) adopted a recommendation that health care workers and long-term care residents should be the first to receive the COVID-19 vaccine once it is authorized or approved by the FDA.
A new KFF analysis estimates there are 15.5 million people working in health care settings who have direct patient contact, 1.2 million nursing facility residents and another 800,000 assisted living facility residents nationwide. These 17.6 million adults, about 7% of U.S. adults, would qualify for priority vaccinations as the first doses of vaccines are distributed to states this month, based on the CDC recommendation.
The analysis shows the share of each state’s adult population who are health care workers with direct patient contact or nursing facility residents, ranging from 4% in Washington, DC to 10% in North Dakota. California has the largest number of adults in these groups, more than 1.7 million, followed by Texas (1.3 million) and New York (1.2 million). Due to data limitations, our state-level estimates do not include people who live in assisted living facilities or in other residential settings.
While no public information has been released about initial state allotments of COVID-19 vaccines, certain states may be faced with inadequate vaccine supply for their priority population and will then have to apply additional factors to determine priority recipients. For the full state-by-state estimates and discussion read the full brief, Estimates of the Initial Priority Population for COVID-19 Vaccination by State.
On December 1, 2020, the Advisory Committee on Immunization Practices (ACIP) of the Centers for Disease Control and Prevention’s (CDC), issued an initial recommendation, adopted by the CDC director, that health care personnel and residents of long-term care facilities should be the first to be offered a COVID-19 vaccine once it is authorized or approved by the FDA (See Appendix A). The ACIP recommendation recognizes that health care workers, who are at higher risk of exposure to people with COVID-19, are essential for preserving health care capacity during the pandemic. Further, it recognizes that long-term care residents are at high risk of serious illness if infected with the virus and account for 40% of all COVID-19 deaths. States have the authority to make their own allocation decisions, although most will likely follow the ACIP guidelines for the initial priority groups.
This analysis provides new national and state-level estimates of the number of health care workers and long-term care residents who are expected to be part of the group first in line to receive the COVID-19 vaccine to gain insight into how this initial priority population varies across states. These estimates are based on our analysis of the 2019 American Community Survey (ACS) and Certification and Survey Provider Enhanced Reports (CASPER) data.
Our health care worker estimates may be lower than others because they are limited to people working in health care settings who are likely to have direct patient contact based on their occupation and who have current ties to the workforce. We include workers providing direct clinical care, such as doctors, nurses, and aides; workers providing direct patient support, such as environmental and food staff; and first-line supervisors and managers of these occupations. Moreover, the estimates are based on state of residence of the health care worker. Some health care workers may work in a different jurisdiction than where they live. For example, many health care workers in the District of Columbia live in Virginia and Maryland. Our national estimates of long-term care facility residents include individuals living in certified nursing facilities and assisted living facilities, but not others who live in other residential settings. Due to data limitations, our state-level estimates do not include people who live in assisted living facilities or in other residential settings.
Findings
Nationwide, there are 19.7 million adults working in health care settings, of which roughly 15.5 million are estimated to have direct patient contact. In addition, there are 1.2 million nursing facility residents and about 800,000 assisted living facility residents. Together, health care workers with direct patient contact and residents in either nursing facility or assisted living facilities account for approximately 17.6 million people or about 7% of the adult population in the U.S.
The number of people in this initial priority group varies widely across states. The number of adults who are health care workers who have direct patient contact or are nursing facility residents ranges from 23,800 who live in Washington, D.C. to nearly 1.7 million who live in California, while the share of adults in these groups varies from roughly 4.4% in DC to at least 8% in 7 states, with North Dakota having the highest share (10%), following by Pennsylvania (8.3%), Minnesota (8.1%) and Rhode Island (8.1%). As noted earlier these estimates do not include people who live in assisted living facilities or in other residential settings.
Discussion
The Department of Health and Human Services (HHS) has announced that about 40 million doses of vaccine could be available by the end of December 2020, enough to vaccinate 20 million people given that two doses are required for the main vaccine regiments that are furthest along in the authorization process. More recent media reports indicate the number of vaccines available for early distribution may be lower than initially projected. HHS plans to allocate vaccinations to states based on each state’s share of the total U.S. adult population but, to date, has not publicly released information on the actual number of vaccines that will be allocated to each state.
Variations in the number of health care workers and long-term care residents across states may result in uneven effects across states in their ability to immunize priority populations using their initial vaccine allotments. While some states may have an adequate supply to vaccinate their priority population, others may fall short and may need to decide who goes first among people in this initial group. Further, as states allocate vaccines down to the local level, the ability of counties, municipalities, and health care systems to vaccinate health care workers and long-term care residents could vary, depending on their supply of vaccines and the demographics of their communities. In instances where supply is insufficient to fully vaccinate the initial priority population, ACIP notes that jurisdictions may consider first offering the vaccine to health care personnel whose duties require proximity (within 6 feet) to other people and that, if vaccine supply remains limited, additional factors might be considered for sub-prioritization of health care personnel. Similarly, ACIP notes that jurisdictions might consider first offering vaccinations to residents and health care personnel in skilled nursing facilities because of the risk of COVID-19 related mortality among residents in those settings.
Table 1: Estimated Health Care Workers and Nursing Facility Residents by State, 2019
State
Total Adults
Initial Priority Population
Health Care Workers with Direct Patient Contact
Nursing Facility Residents
Total
Priority Population as a Share of Total Adults
United States*
250,235,900
15,525,100
1,246,100
16,771,200
6.7%
Alabama
3,697,300
225,300
22,700
248,000
6.7%
Alaska
526,200
33,000
500
33,500
6.4%
Arizona
5,485,500
289,300
10,300
299,600
5.5%
Arkansas
2,237,600
145,500
17,300
162,700
7.3%
California
29,920,500
1,558,100
100,000
1,658,000
5.5%
Colorado
4,377,800
263,500
16,000
279,500
6.4%
Connecticut
2,736,600
197,200
19,600
216,800
7.9%
Delaware
742,000
54,800
3,900
58,800
7.9%
District of Columbia
544,800
22,500
1,300
23,800
4.4%
Florida
16,839,200
991,500
71,200
1,062,700
6.3%
Georgia
7,832,000
405,700
22,900
428,600
5.5%
Hawaii
1,049,200
56,700
3,400
60,100
5.7%
Idaho
1,308,500
76,800
3,300
80,100
6.1%
Illinois
9,583,100
626,500
65,600
692,100
7.2%
Indiana
4,987,100
324,800
37,600
362,400
7.3%
Iowa
2,348,800
148,900
22,300
171,200
7.3%
Kansas
2,126,800
147,400
16,800
164,200
7.7%
Kentucky
3,342,400
215,200
21,500
236,700
7.1%
Louisiana
3,429,500
226,300
25,900
252,100
7.4%
Maine
1,064,800
75,000
5,800
80,900
7.6%
Maryland
4,569,400
294,400
16,500
310,900
6.8%
Massachusetts
5,323,100
390,300
34,400
424,700
8.0%
Michigan
7,664,100
516,800
37,500
554,400
7.2%
Minnesota
4,233,200
319,400
23,400
342,800
8.1%
Mississippi
2,182,700
136,300
15,900
152,200
7.0%
Missouri
4,604,900
308,900
37,300
346,200
7.5%
Montana
818,000
54,700
3,800
58,500
7.1%
Nebraska
1,409,100
100,000
10,600
110,600
7.8%
Nevada
2,350,500
101,900
5,600
107,500
4.6%
New Hampshire
1,064,100
75,400
6,400
81,800
7.7%
New Jersey
6,790,900
439,000
42,400
481,400
7.1%
New Mexico
1,576,900
101,000
5,500
106,500
6.8%
New York
14,985,700
1,103,600
89,800
1,193,400
8.0%
North Carolina
7,886,700
472,500
36,100
508,600
6.4%
North Dakota
557,200
50,400
5,300
55,800
10.0%
Ohio
8,827,900
631,100
71,900
702,900
8.0%
Oklahoma
2,893,300
183,000
17,200
200,200
6.9%
Oregon
3,287,200
201,300
4,700
206,000
6.3%
Pennsylvania
9,802,200
740,100
72,500
812,600
8.3%
Puerto Rico
2,594,600
92,300
Not Available
Not Available
Rhode Island
817,600
58,400
7,600
66,000
8.1%
South Carolina
3,895,400
223,000
15,600
238,600
6.1%
South Dakota
642,400
45,200
5,600
50,800
7.9%
Tennessee
5,159,400
324,700
26,600
351,400
6.8%
Texas
20,987,700
1,202,100
90,700
1,292,800
6.2%
Utah
2,234,700
124,600
5,600
130,100
5.8%
Vermont
486,800
33,000
2,400
35,400
7.3%
Virginia
6,360,800
367,100
19,600
386,600
6.1%
Washington
5,795,500
327,800
15,100
342,900
5.9%
West Virginia
1,389,500
97,600
9,300
106,900
7.7%
Wisconsin
4,434,500
299,100
21,200
320,400
7.2%
Wyoming
430,200
25,800
2,200
28,100
6.5%
NOTE: *Excludes an estimated 800,000 assisted living facility resident; when included, 17.6 million people are part of the priority population nationally, about 7% of the adult population.SOURCE: KFF Analysis of the 2019 American Community Survey and KFF analysis of 2019 Certification and Survey Provider Enhanced Reports (CASPER) data.
Methods
The estimates of health care workers and the total population are based on a KFF analysis of the 2019 American Community Survey (ACS), 1-year file. The ACS includes a 1% sample of the US population. The health care industry is defined as industry codes 5070 and 7970 through 8290 and does not include the childcare or vocational training industries. Retail pharmacies are included as a healthcare industry. For more information see here. This analysis only includes those individuals who work in health care settings, so does not include professionals working in other care settings, such as school nurses, and does not include individuals who provide other services to clients, such as social services. We exclude individuals in these industries who are not currently in the labor force. For information on how the healthcare workforce has changed during the course of the pandemic see here.
We defined health care workers who likely have direct patient contact by reviewing the occupation codes of workers in healthcare industries. We included workers providing direct clinical care, such as doctors, nurses, and aides; workers providing direct patient support, such as environmental and food staff; and first line supervisors and managers of these occupations. We excluded administrative and managerial staff who are likely able to work remotely and/or not expected to have direct patient contact through their job duties. It is possible that estimate includes some workers who normally have direct patient contact but who can work remotely, for example, through the use of telehealth.
The estimates of nursing facility residents are based on KFF analysis of 2019 Certification and Survey Provider Enhanced Reports (CASPER) data. The CASPER system includes data for all certified nursing facilities in the U.S. See here for more information on these data and methods. The nationwide estimate of residents in assisted living facilities is from the 2016 National Study of Long-Term Care Providers. Note that estimates of residents in nursing facility and assisted living facilities are from different sources, represent different time periods and may include a small number of overlapping residents.
Appendix
Appendix A: ACIP Recommendation and Definitions
On December 1, 2020, ACIP recommended that, when a COVID-19 vaccine is authorized by FDA and recommended by ACIP, both 1) health care personnel and 2) residents of long-term care facilities be offered vaccination in the initial phase of the COVID-19 vaccination program
ACIP defines health care personnel as paid or unpaid persons serving in health care settings who have the potential for direct or indirect exposure to patients or infectious materials. These include people providing clinical care as well as support staff members, such as food and environmental staff.
ACIP defines long-term care facility residents as adults who reside in facilities that provide a variety of services, including medical and personal care, to persons who are unable to live independently. These include adults residing in skilled nursing facilities, nursing homes, and assisted living facilities.
Job losses caused by the coronavirus pandemic have threatened to disrupt health coverage for millions of people as most working-age adults get coverage for themselves and their families through their work. Tracking real-time changes in coverage and the uninsured rate is difficult to do with much precision because the large national surveys that produce these estimates lag by months or years, and private surveys generally lack sufficient sample to measure coverage changes precisely. Many real-time surveys have faced challenges of high rates of survey nonresponse (not responding to the survey or particular questions) particularly among populations most likely affected by the economic downturn, including the Census Bureau’s Household Pulse Survey. However, various sources of administrative data allow us to piece together what might be happening to health coverage rates amid the pandemic.
Declines in employer sponsored insurance are far less than overall declines in employment. First, using administrative data insurers file with state regulators (compiled by Mark Farrah Associates TM), we can see how enrollment in employer plans has changed through the end of September. Although employment rates fell by 6.2% from March to September, enrollment in the fully-insured group market decreased by just 1.5% over the same period.
If we extrapolate this finding to the entire group market, including self-insured employer plans, this would suggest that a total of roughly 2 to 3 million people may have lost employer-based coverage between March and September. To be very clear, this is only a rough estimate. We do not have reliable data for self-insured employers (which insure about 6 in 10 people with employer coverage and tend to be larger), and those employers may have made different decisions than fully-insured employers did about layoffs and whether and how to maintain coverage for employees.
Loss of employer-based coverage may have been offset by strong enrollment in Medicaid and Marketplaces. Many of those who lost job-based health coverage would have qualified for Medicaid or for a special enrollment opportunity to purchase individual market health coverage (either on- or off- exchange). Preliminary administrative data for the Medicaid program shows enrollment increased by 4.3 million people (6.1%) from February through July 2020. More recent data for 30 states show that enrollment in managed care plans increased by about 5 million, or 11.3%, from March to September 2020. Nationally, MCOs cover over two-thirds of Medicaid beneficiaries. States attribute these increases to rising unemployment (and loss of employer sponsored insurance) as well as the “maintenance of eligibility” (MOE) requirements tied to a 6.2 percentage point increase in the federal match rate (FMAP) authorized by the Families First Coronavirus Response Act (FFCRA) – which prevents states from disenrolling Medicaid beneficiaries if they accept the additional federal funding.
Using the same administrative data above (from Mark Farah Associates TM), we find that enrollment in the individual market was fairly steady from March to September 2020. In normal years, there is typically more attrition during these months as more people leave the market than come in during special enrollment periods (SEP). However, SEP enrollment was higher this year in healthcare.gov and state based exchanges.
While much is unknown, a review of administrative data suggest that the uninsured rate may not have changed much during the pandemic to date. There is still much we do not know, and these administrative data do not account for other changes like people aging on to Medicare and population growth. Nonetheless, it appears that the decline in employer-based health insurance coverage may have been offset by gains in Medicaid and largely steady enrollment in the individual market.
There are several possible explanations for the relatively modest decrease in employer-based coverage despite massive job losses. First, many of the people who have lost employment likely were never enrolled in coverage through their job in the first place; lower wage workers are less likely to be covered by their employer’s plan and, similarly, job losses have been highest and most sustained among industries that tend to have lower coverage offer rates (e.g., retail, service, hospitality). Second, many people who lost their jobs may have been able to retain their health coverage temporarily. A number of employers elected to keep furloughed or laid off workers enrolled in their firm’s plan at least in the short term. In addition, an unknown number of permanently laid off employees may have elected COBRA (which would be classified as group coverage) at their own expense, although this number is likely small due to the high costs of such coverage. Employment rates are starting to recover but a larger share of people filing unemployment claims say their job loss is permanent compared to earlier in the pandemic, suggesting there may be more coverage loss to come.
That the uninsured rate may not have substantially changed this year could be taken as both good news and bad news. A largely flat uninsured rate would be good news because health insurance coverage rates tend to fall whenever there is an economic downturn in the United States. Between many employers maintaining coverage and the Affordable Care Act along with Medicaid serving as a safety net for those who did lose coverage, the uninsured rate in the U.S. does not appear to have risen nearly as much as it could have, given the scale of employment losses.
The bad news is that, if the uninsured rate has indeed held steady, there are still tens of millions of people without health coverage during the worst pandemic to hit the country in one hundred years. Despite some recent legislation and administrative action aimed at protecting the uninsured from some of the costs associated with COVID-19 testing and treatment, those without coverage still face tremendous financial and health risks.
Four out of ten people who were uninsured before the pandemic could be getting health insurance coverage for free, either through Medicaid or a zero-premium bronze plan on the exchange. Open Enrollment for 2021 coverage on the ACA exchange markets is now in its fifth week and early figures show that, while overall enrollment is strong, new enrollment is about the same as past years. The Trump Administration has drastically reduced funds for ACA outreach and marketing activities, as well as for navigators who help people enroll in Marketplace coverage. President-elect Biden has vowed to reinstitute funding for ACA marketing, outreach, and navigator programs. The federal Open Enrollment period will have ended by the time Biden takes office, but he could open a new SEP without limitations on who qualifies to enroll.