KFF designs, conducts and analyzes original public opinion and survey research on Americans’ attitudes, knowledge, and experiences with the health care system to help amplify the public’s voice in major national debates.
Despite the slow roll-out of COVID-19 vaccination in the U.S., the pace of vaccination has begun to pick up across the country. U.S. vaccine supply is running at about 11 million doses per week, with an average of 1.7 million doses being administered per day; shots are now getting into people’s arms as fast as they’re becoming available. This is in part due to the easing of vaccine supply constraints, as the Biden administration has released more doses and provided more predictability to states, and production schedules have sped up. Still, the number of people eligible in states is increasing, and these next few weeks will be critical ones in the race to vaccinate as many people as possible, due to continued spread of COVID-19 and the emergence of viral variants. Given what we know about projected supply, where could we be with vaccination by the end of the first quarter of this year (March 31)?
To answer this question, we looked at the number of doses estimated to be delivered by Pfizer and Moderna, the two manufacturers with authorized vaccines in the U.S., between now and the end of March. The U.S. has purchased 600 million doses (300 million from each company) which, given the two-dose regimen required by these vaccines, is enough to vaccinate 300 million people. Even without the addition of any new vaccine, this would go far in achieving U.S. population immunity (though it is widely expected that the FDA will authorize Johnson &Johnson’s one shot vaccine soon, increasing supply to more than enough to reach the entire U.S. population).
Pfizer has said that it expects to deliver 120 million doses to the U.S. by the end of March, 20 million ahead of its original schedule. Moderna has said it will deliver 100 million doses. Assuming these production schedules hold, that means that 220 million doses, enough to fully vaccinate 110 million people, will be delivered within a month and a half from today.
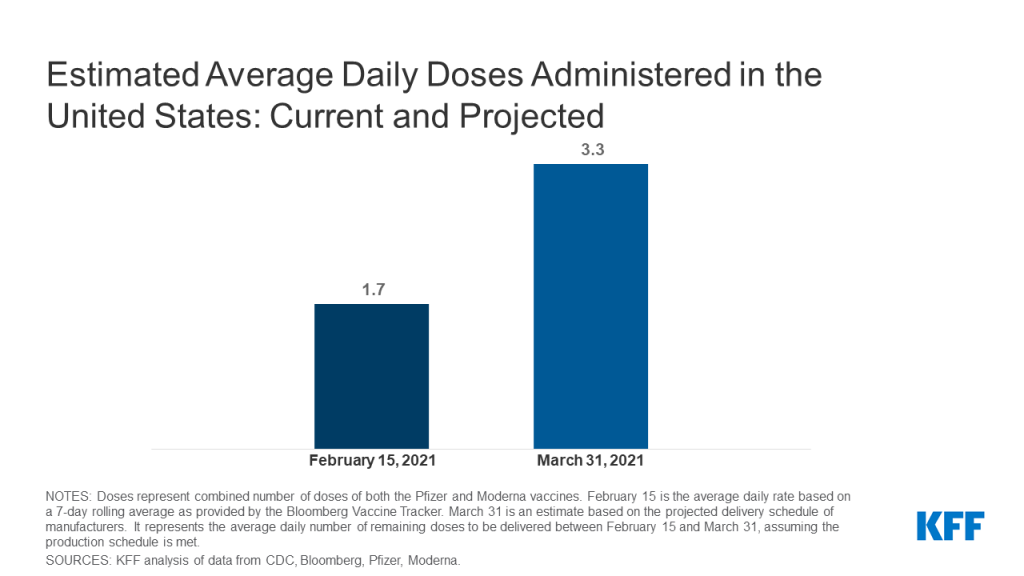
To date, just over 70 million doses have been delivered to states. This leaves close to 150 million doses still to be delivered by the end of March, which translates into about 3.3 million doses, on average, per day between now and then, or almost double the recent pace of daily vaccinations (see Figure). This could substantially ease waiting lists for vaccination appointments and accommodate broader eligibility, assuming the distribution system continues to expand and smooth out as well.
Figure 1: Estimated Average Daily Doses Administered in the United States: Current and Projected
States have been picking up the pace of vaccinations in recent weeks, suggesting that some early snafus are being resolved, although equity is still lagging across the country. In addition, there continue to be widespread reports of people being confused about where to get vaccinated and having difficulty getting appointments, and states are at very different stages of vaccinating their populations. It’s difficult to know, however, how much of the problem is rooted in an inadequate supply versus the complexity of the distribution system itself.
The Biden Administration is stepping up federally-organized distribution channels, including direct partnerships with retail pharmacy chains, mass vaccination sites and health centers. As supply increases, those mechanisms will likely become increasingly important in getting more people vaccinated in a race against the spread of viral variants.
On February 15, 2021, HealthCare.gov, the federal health insurance marketplace serving 36 states, reopened for enrollment for 12 weeks. Though styled as a “special” enrollment period, it will operate more like an open enrollment period; no qualifying life event is required to apply. People who are currently uninsured can enroll, and people already enrolled in marketplace plans can change to different policies. Nearly all state-run marketplaces also have re-opened enrollment to their residents. At the outset, this COVID enrollment period may not seem all that different from the open enrollment period that just ended, though other changes (planned or under discussion) could make it easier for people to sign up this time.
How many people are eligible to sign up?
An estimated 8.9 million uninsured Americans are eligible for marketplace subsidies today but not enrolled. Racial and ethnic minorities are disproportionately represented in this population. (Figure 1)
Another 6 million uninsured are eligible to buy unsubsidized coverage through the marketplace today. This includes 3.4 million whose income is too high (over 400% FPL) to qualify for subsidies. In addition, people who already enrolled in marketplace coverage through HealthCare.gov (8.3 million) will have an opportunity to change plans during the COVID enrollment period. In some state-based marketplaces, already-enrolled consumers also can change plans during this period; consumers should check with their state-based marketplace for more details.
Are marketplace health plans affordable?
In 2020, 84% of marketplace enrollees received premium tax credits (PTC) that reduced their monthly premium; 49% also received cost sharing reductions (CSR) that lower deductibles in silver-level plans.
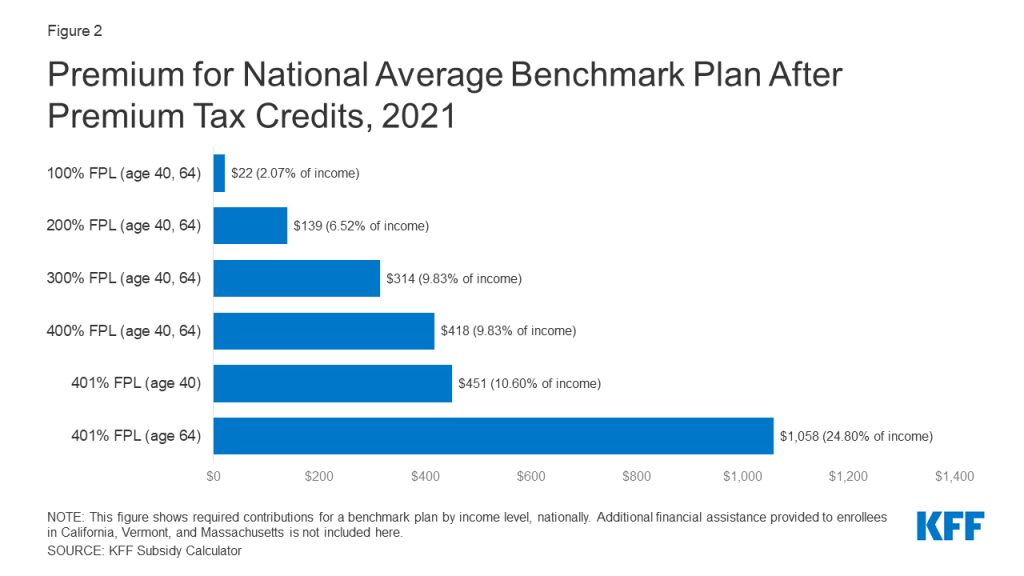
Premium subsidies for marketplace plans are available for people with income between 100% and 400% of the federal poverty level. Subsidies are set to cover the cost of a benchmark (second-lowest cost) silver plan, minus a required individual contribution tied to income on a sliding scale. Even with income at the poverty level ($12,760 in 2021), a person is required to pay $22/month, or 2.07% of household income, for the benchmark silver plan. Subsidies decline steeply as income rises. At twice poverty, a person must contribute $139/month (6.52% of income), and at 3 times poverty $314/month, or 9.83% of income. Above 4 times poverty, marketplace subsidies end, leaving people to pay a substantial share of income for coverage. With age-rating, premiums can top 20% of income for older individuals. (Figure 2)
Figure 2: Premium for National Average Benchmark Plan After Premium Tax Credits, 2021
Premium tax credits can be applied to any metal level marketplace plan, and will cover a greater share of total premium for plans that cost less than the benchmark plan; in some cases the subsidy can cover the full cost of a bronze level plan. An estimated 4 million uninsured people are eligible for a zero-cost bronze plan this year. However, because cost sharing subsidies are only available through silver plans, electing a “free” bronze plan involves serious tradeoffs. Deductibles in bronze plans typically approach $7,000 per year, while silver plan deductibles with CSR can be as low as $200. A KFF survey finds 75% of uninsured individuals are not interested in free bronze plans with such high deductibles. Affordability concerns are cited by two-thirds of the uninsured as the main reason they lack coverage.
Might marketplace subsidies improve?
Congress is considering new COVID relief legislation that would, among other things, increase marketplace subsidy amounts and eligibility. A House bill would extend premium tax credits to individuals with income above 400% FPL and substantially increase tax credits for people with lower income. Millions of currently subsidized marketplace enrollees would be eligible for more affordable coverage. The greatest impact would be felt by approximately 3.4 million current enrollees with income up to 150% FPL (as well as subsidy-eligible uninsured people at that income level) who would be able to buy a zero-premium silver plan with generous cost sharing subsidies. Additionally, uninsured individuals with income above 400% FPL would be newly eligible for tax credits, with the greatest amount of relief available to older adults who face age-rated premiums.
What other factors affect sign ups?
The Biden Administration will invest in a national outreach campaign to inform people about the new marketplace enrollment opportunity. Previously, the Trump Administration had cut spending for marketing by 90%. The KFF tracking poll for December 2020 found that, during the last open enrollment, fewer than 1 in 5 consumers knew the deadline for signing up, even as it approached.
The Trump Administration had also drastically cut spending for navigator enrollment assistance to $10 million per year, compared to $63 million in 2016. Navigator entities tended to front-load their federal awards to maximize help they could offer during open enrollment; leaving many programs with limited resources to help consumers during the COVID enrollment period. At this writing, the Biden Administration has not announced whether or how much additional navigator funding might be released during the COVID enrollment period for HealthCare.gov states. More than $1.3 billion in unspent federal marketplace user fee revenue accumulated during the Trump Administration, leaving money available to invest in consumer assistance, which could have a material impact on signups.
A recent KFF survey found that that consumer assistance matters – 60% of marketplace enrollees faced difficulty applying for coverage in 2020, and 40% of those who got help signing up said they could not have enrolled without it. The survey also found nearly 5 million consumers looked for help in 2020 but could not find it.
The Biden Administration said it will periodically release data on signups during the COVID enrollment period. With a goal of expanding health coverage to as many people as possible during the pandemic, success may well depend on the impact of enhanced premium subsidies (if enacted), as well as the effectiveness of outreach efforts.
Individuals with certain medical conditions are at increased risk of severe illness1 if they become infected with SARS-CoV-2, the virus that causes COVID-19, and as such are recommended by the Centers for Disease Control and Prevention (CDC) for vaccination in the first phases of vaccine roll-out. The CDC estimates that this group represents 81 million people, or 40% of those recommended to receive a COVID-19 vaccine in these initial phases. This is a substantial portion of the nation’s population and, with vaccine supply still limited, not all eligible people will be able to get vaccinated immediately. Indeed, most states have not yet opened up vaccine eligibility to those with high-risk medical conditions, although they represent some of the next in line. Yet, much like states have discretion in deciding when to prioritize groups for vaccination, they also can decide how to define them, including the list of medical conditions that will be considered. Further, states, and counties or cities within states, may differ in their implementation for this population.
Individuals with certain medical conditions are at increased risk of severe illness1 if they become infected with SARS-CoV-2, the virus that causes COVID-19, and as such are recommended by the Centers for Disease Control and Prevention (CDC) for vaccination in the first phases of vaccine roll-out. The CDC estimates that this group represents 81 million people, or 40% of those recommended to receive a COVID-19 vaccine in these initial phases. This is a substantial portion of the nation’s population and, with vaccine supply still limited, not all eligible people will be able to get vaccinated immediately. Indeed, most states have not yet opened up vaccine eligibility to those with high-risk medical conditions, although they represent some of the next in line. Yet, much like states have discretion in deciding when to prioritize groups for vaccination, they also can decide how to define them, including the list of medical conditions that will be considered. Further, states, and counties or cities within states, may differ in their implementation for this population.
The COVID-19 pandemic has underscored the stark racial and ethnic health inequities in the U.S., including among Medicare beneficiaries. Among this group, people of color, including older adults and others on Medicare, account for disproportionate shares of COVID-19 cases, hospitalizations and deaths, according to data presented in a new KFF report about racial and ethnic disparities in health among people with Medicare.
Older Black, Hispanic, and American Indian/Alaska Native adults were nearly twice as likely to die of COVID-19 as older White adults. COVID-19 cases among Black and Hispanic Medicare beneficiaries were 1.6 times higher than the rate observed among White beneficiaries, and COVID-19 cases among American Indian and Alaska Native beneficiaries were 1.7 times higher than among White beneficiaries, the data show. Hospitalization rates for Black, Hispanic, and American Indian/Alaska Native Medicare beneficiaries were at least double the rate among White beneficiaries.
In addition to pandemic-related data, the new report – with more than 20 charts – present the latest data on racial and ethnic health inequities among Medicare beneficiaries in a wide range of areas, including life expectancy, access to care, service utilization, the prevalence of chronic conditions like hypertension and diabetes, as well as demographic and socioeconomic inequities.
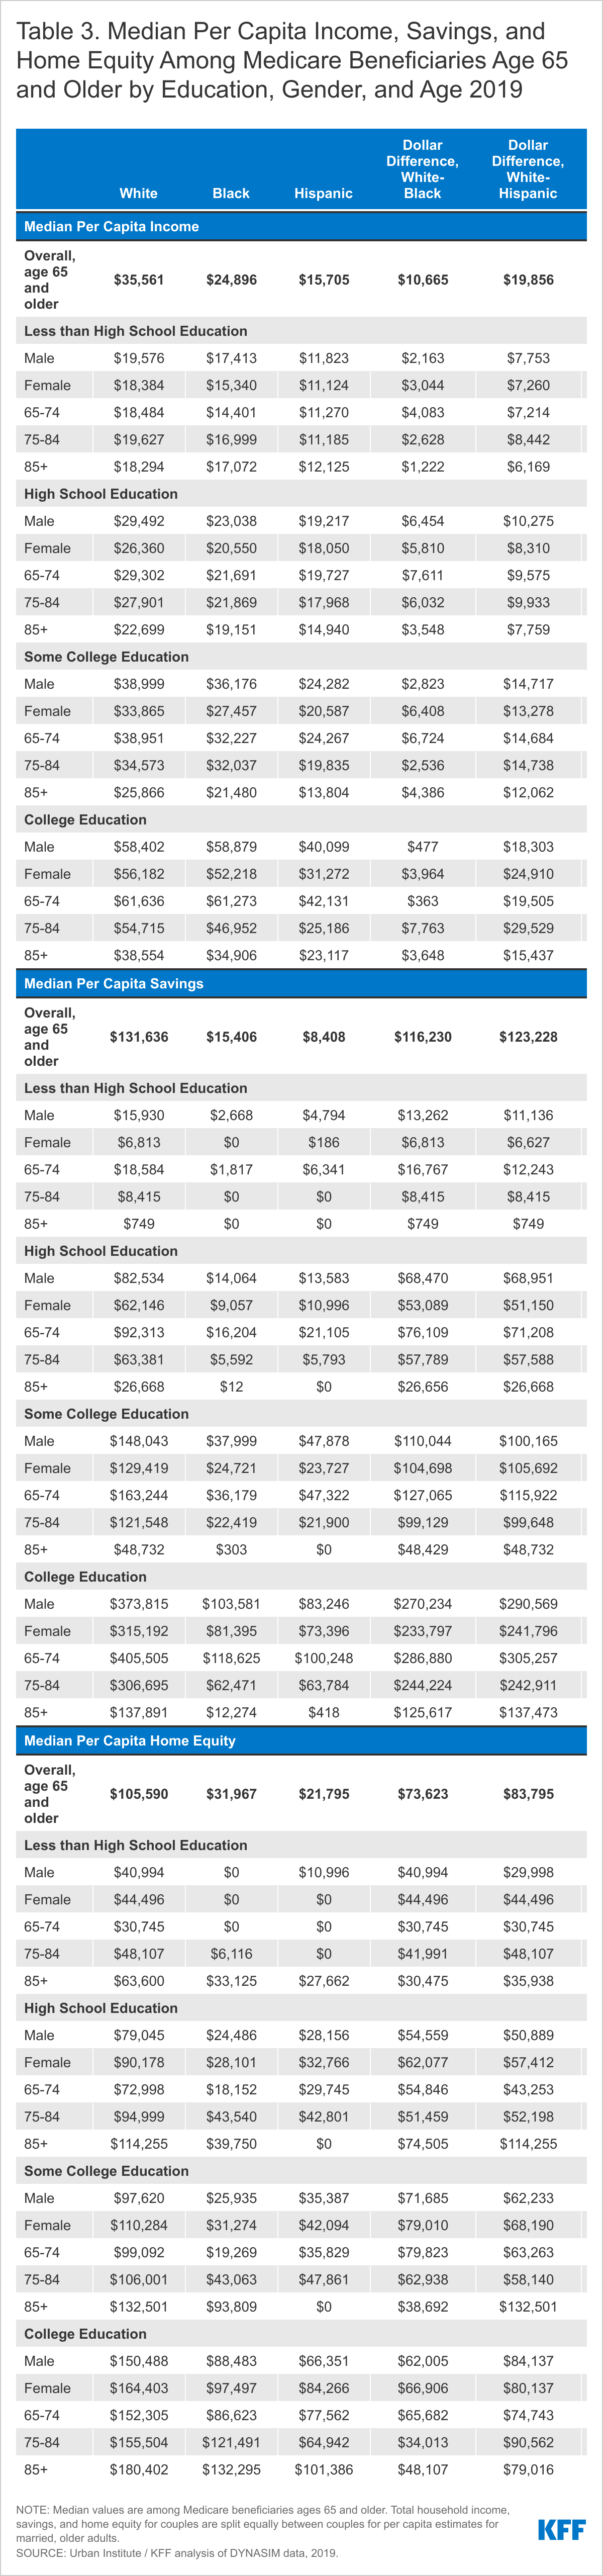
Also new from KFF is an analysis that looks at whether education narrows the gap in wealth among older White, Black, and Hispanic adults. It finds striking differences in median per capita savings and home equity among White, Black, and Hispanic seniors with similar levels of education. It also finds that differences in median per capita income among White, Black, and Hispanic adults ages 65 and older are narrower among people with similar levels of education, but among college graduates, the gap in income is relatively wide between Hispanic and White seniors.
For more data and analysis about racial disparities in health, and about the Medicare population, visit kff.org
Income and wealth inequality persists across generations, adversely affecting people in communities of color at all ages. Older Black and Hispanic adults face their retirement years with less financial security and fewer resources to absorb the financial shock of a major health expense compared to older White adults. In addition, with fewer financial resources, Black and Hispanic seniors are less able than White older adults to help their adult children cover unexpected expenses, afford their first home, or pay for college.
Prior KFF analysis found that Black and Hispanic people with Medicare have lower incomes and less in savings and home equity than White Medicare beneficiaries. In this analysis, we explore whether those gaps in wealth persist among older adults with similar levels of education, both overall and by age and gender. This analysis provides insight into the challenge of addressing intergenerational economic mobility and the potential role of education in mitigating disparities in wealth across race and ethnicity among older adults. It also provides useful context for understanding which subgroups of older adults are most vulnerable to unforeseen health or economic events, such as those stemming from the coronavirus pandemic.
This analysis uses data from the Dynamic Simulation of Income Model (DYNASIM) for 2019, previously described here. Due to data limations, we are unable to disaggregate race/ethnicity beyond White, Black, and Hispanic. Additionally, we are unable to display results that reflect the heterogeneity within Hispanic beneficiaires identifying as Mexican, Cuban, Puerto Rican, Dominican, or Central/South American. Individuals of Hispanic origin referenced in this brief may be of any race; and all other groups are non-Hispanic. We refer to Medicare beneficiaries age 65 and older as older adults.
Key Findings
Differences in median per capita income among White, Black, and Hispanic adults ages 65 and older are narrower when comparing people with similar levels of education, although among college graduates, the gap in income continues to be wide between Hispanic and White seniors. The gaps in savings and home equity remain wide, and are particularly striking among seniors with less than a high school education. The patterns are similar for men and women, as well as across different age groups of older adults.
Income
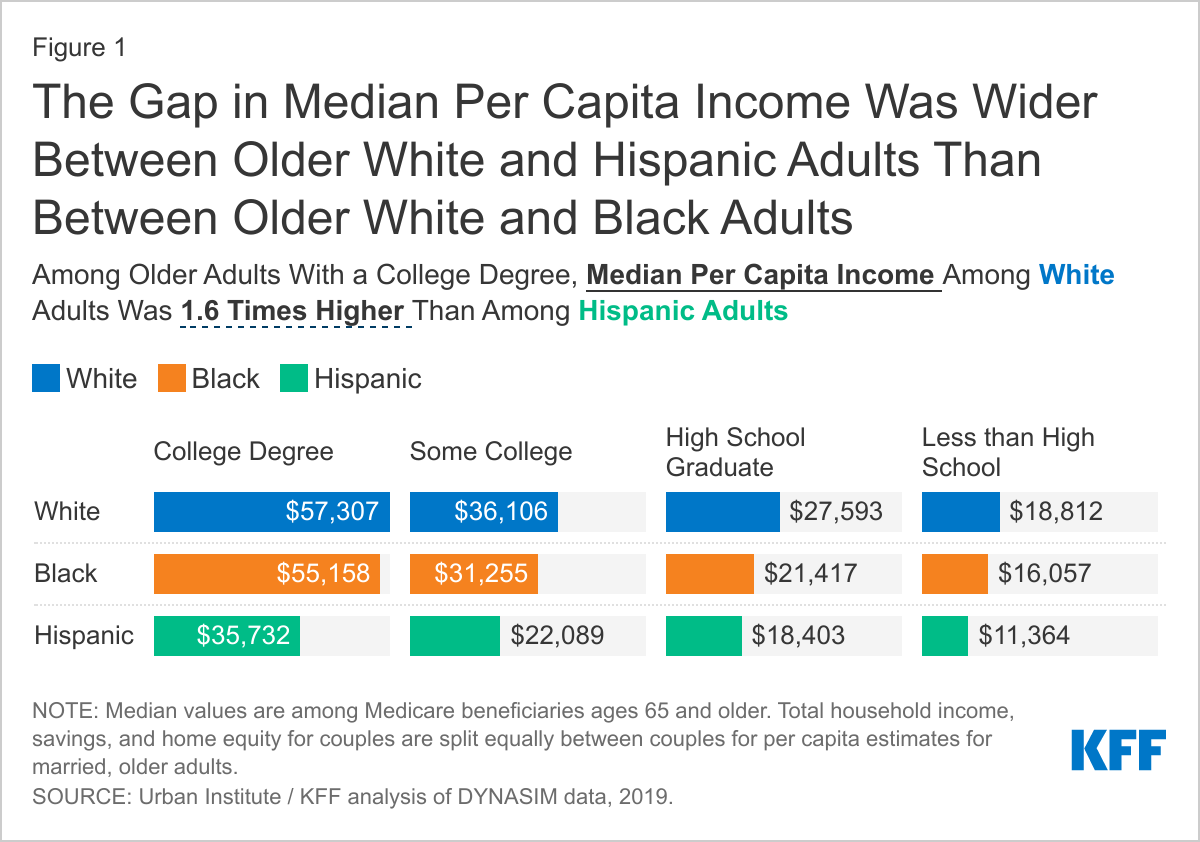
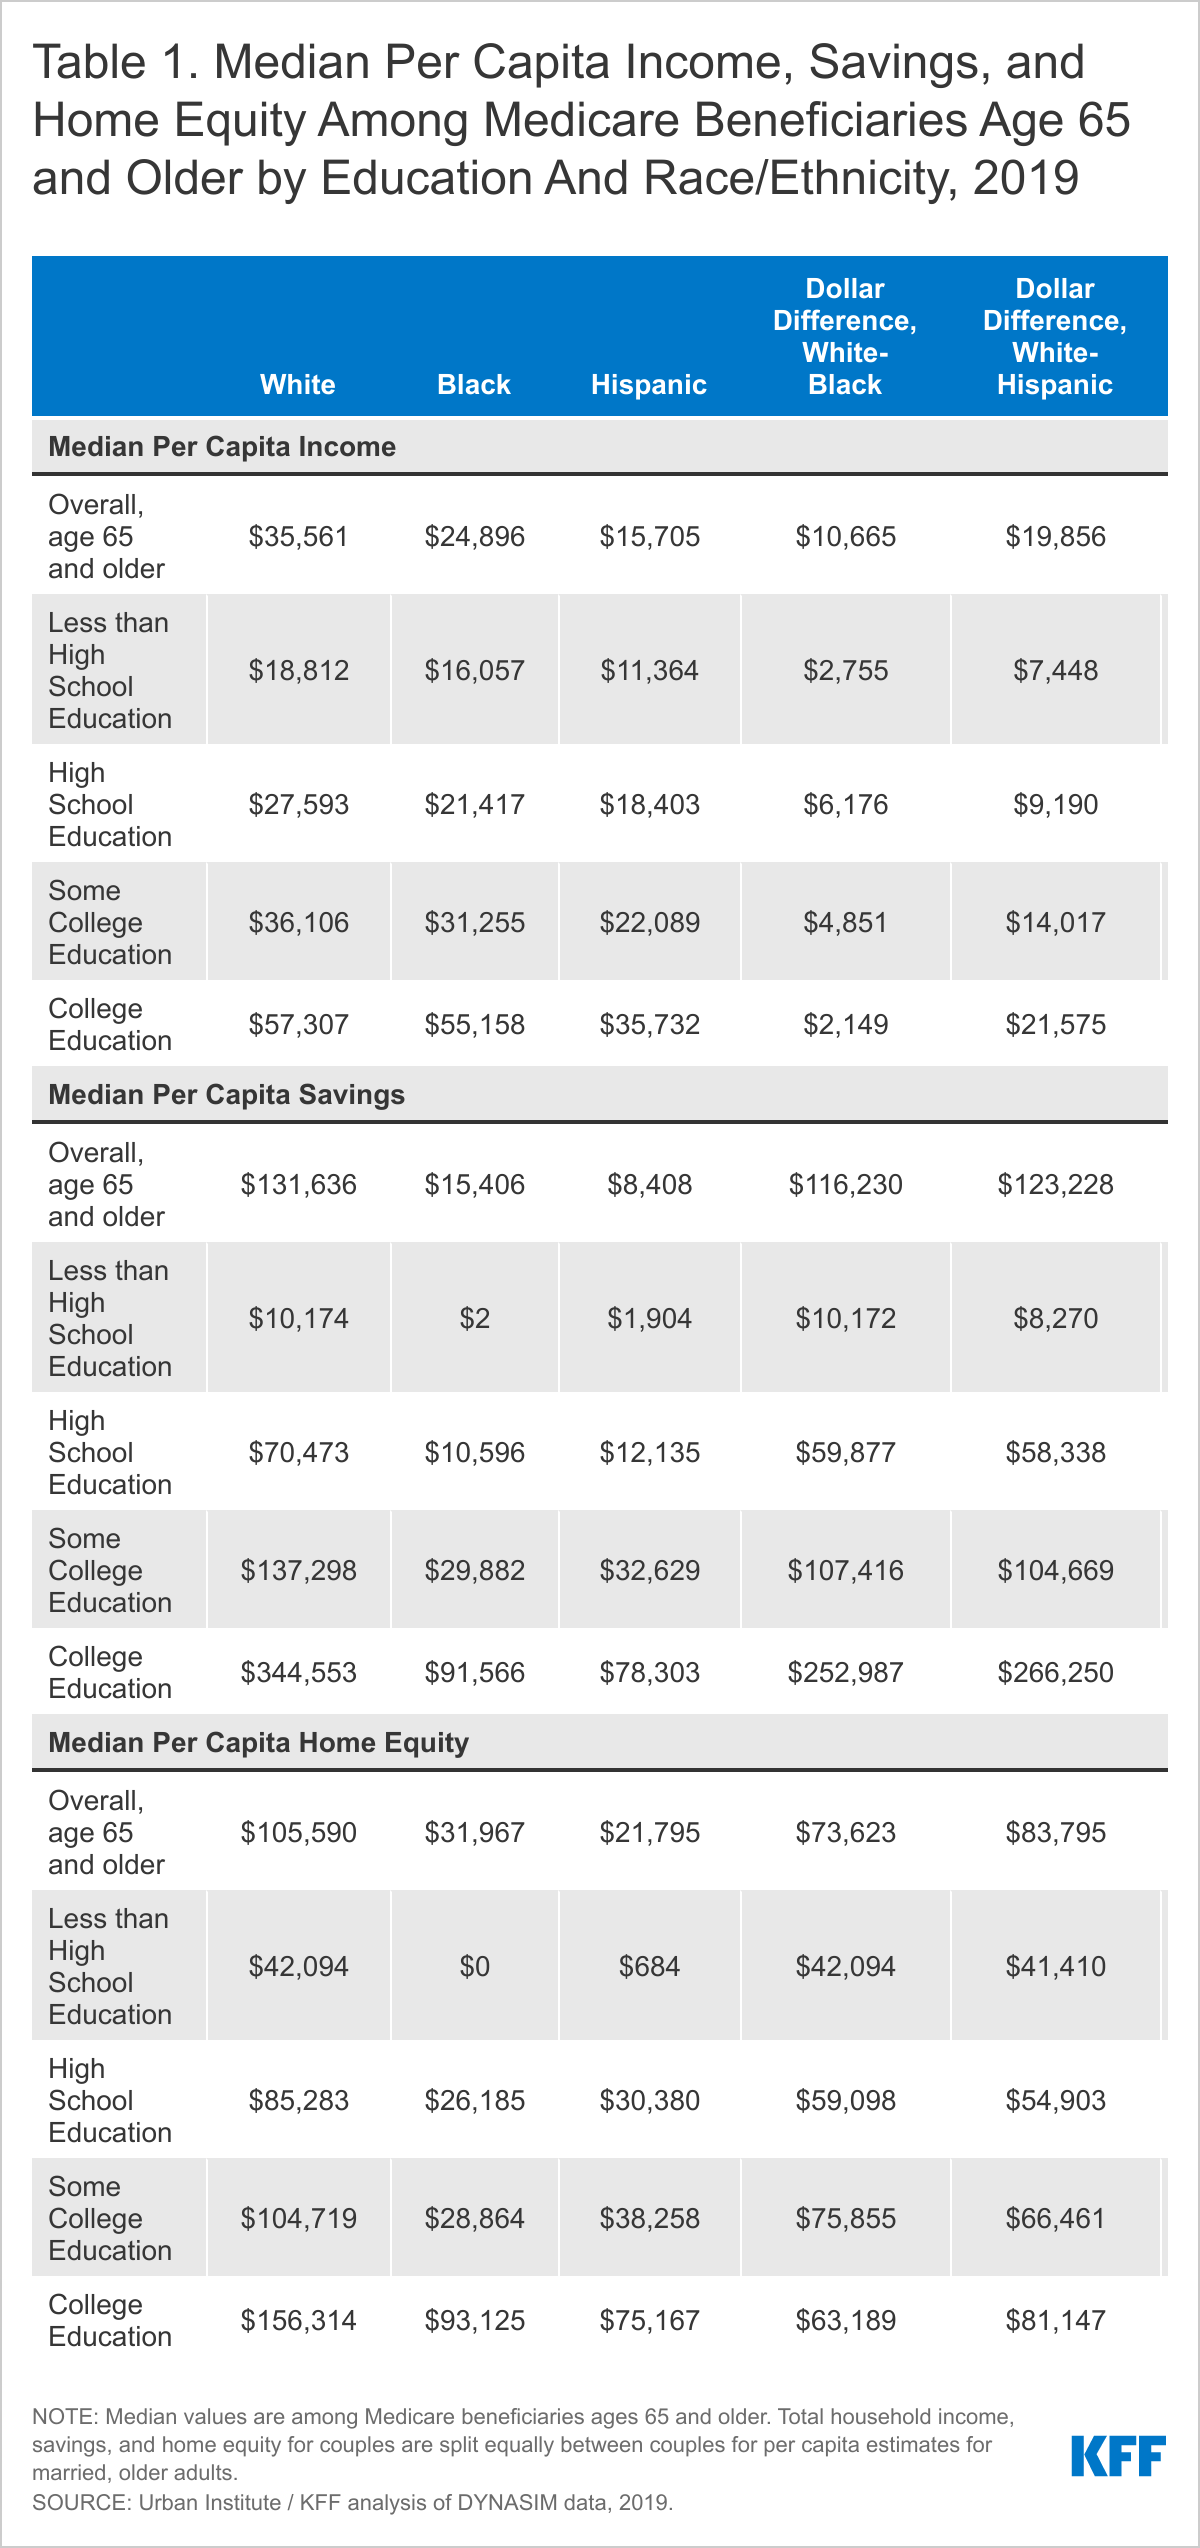
Overall, median per capita income for older White adults was about one and a half times higher than for older Black adults and over two times higher than for older Hispanic adults, but the gap between older White adults compared to older Black and Hispanic adults was smaller when comparing people with similar levels of education. Among those with similar years of education, the gap in median income was wider between White and Hispanic older adults than between White and Black older adults (Figure 1; Table 1).
Among college graduates, older White adults had a median per capita income that was just slightly higher than that of older Black adults ($57,307 vs. $55,158).
However, median per capita income among older White adults with a college education was more than $20,000 a year (1.6 times) higher than among older Hispanic adults with a college education ($57,307 vs $35,732)
Among those with less than a high school education, the median per capita income of older White adults ($18,812) was 1.2 times higher than for older Black adults ($16,057) and 1.7 times higher than for older Hispanic adults ($11,364) (Table 1).
Savings
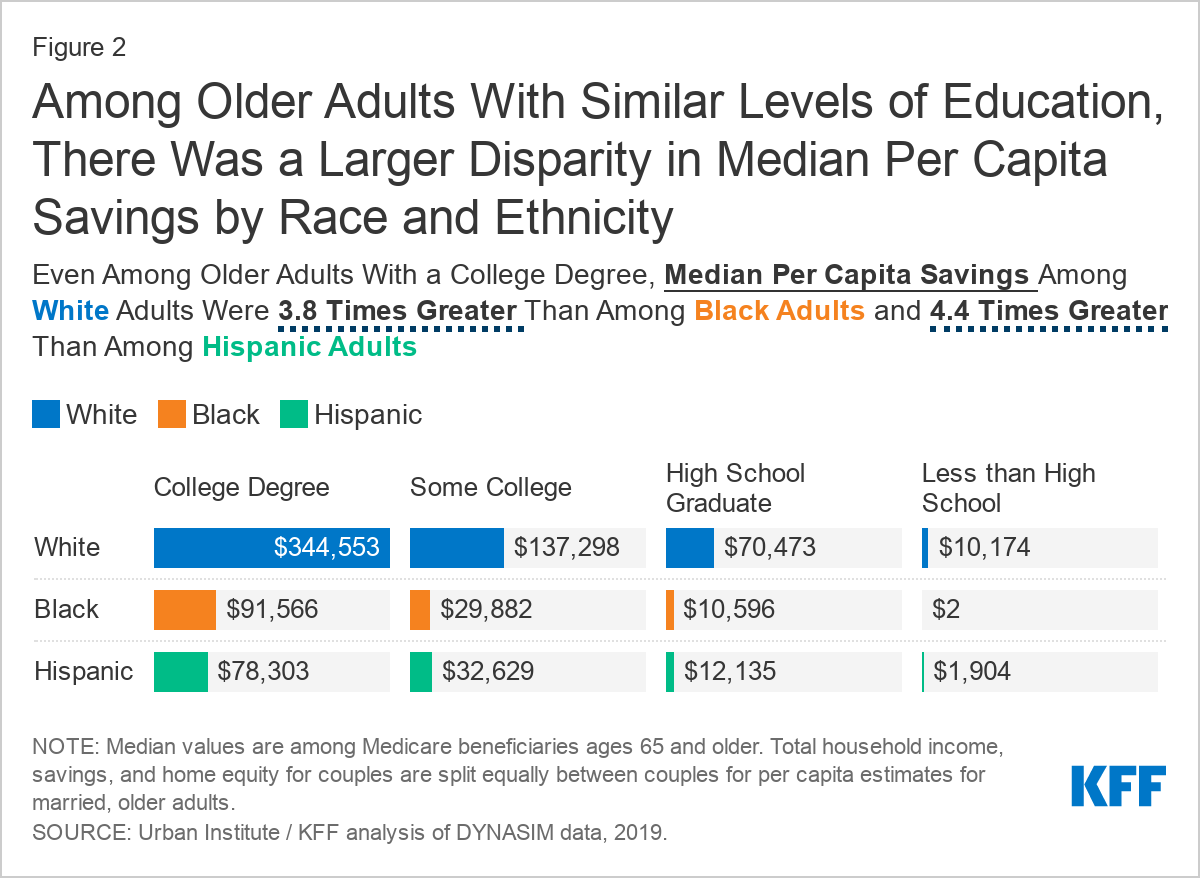
Overall, median per capita savings for older White adults was more than eight times higher than for older Black adults and more than fifteen times higher than for older Hispanic adults (Table 1). Among older adults with similar levels of education, there were large differences in median per capita savings by race and ethnicity (Figure 2).
Among those with a college degree, the median per capita savings for older White adults ($344,553) was more than a quarter of a million dollars higher than for older Black adults ($91,566) or older Hispanic adults ($78,303).
Median per capita savings among older adults with less than a high school education was lower across the board than among those with more years of education. It was still higher for older White adults ($10,174) than for older Black adults ($2) or older Hispanic adults ($1,904) (Table 1).
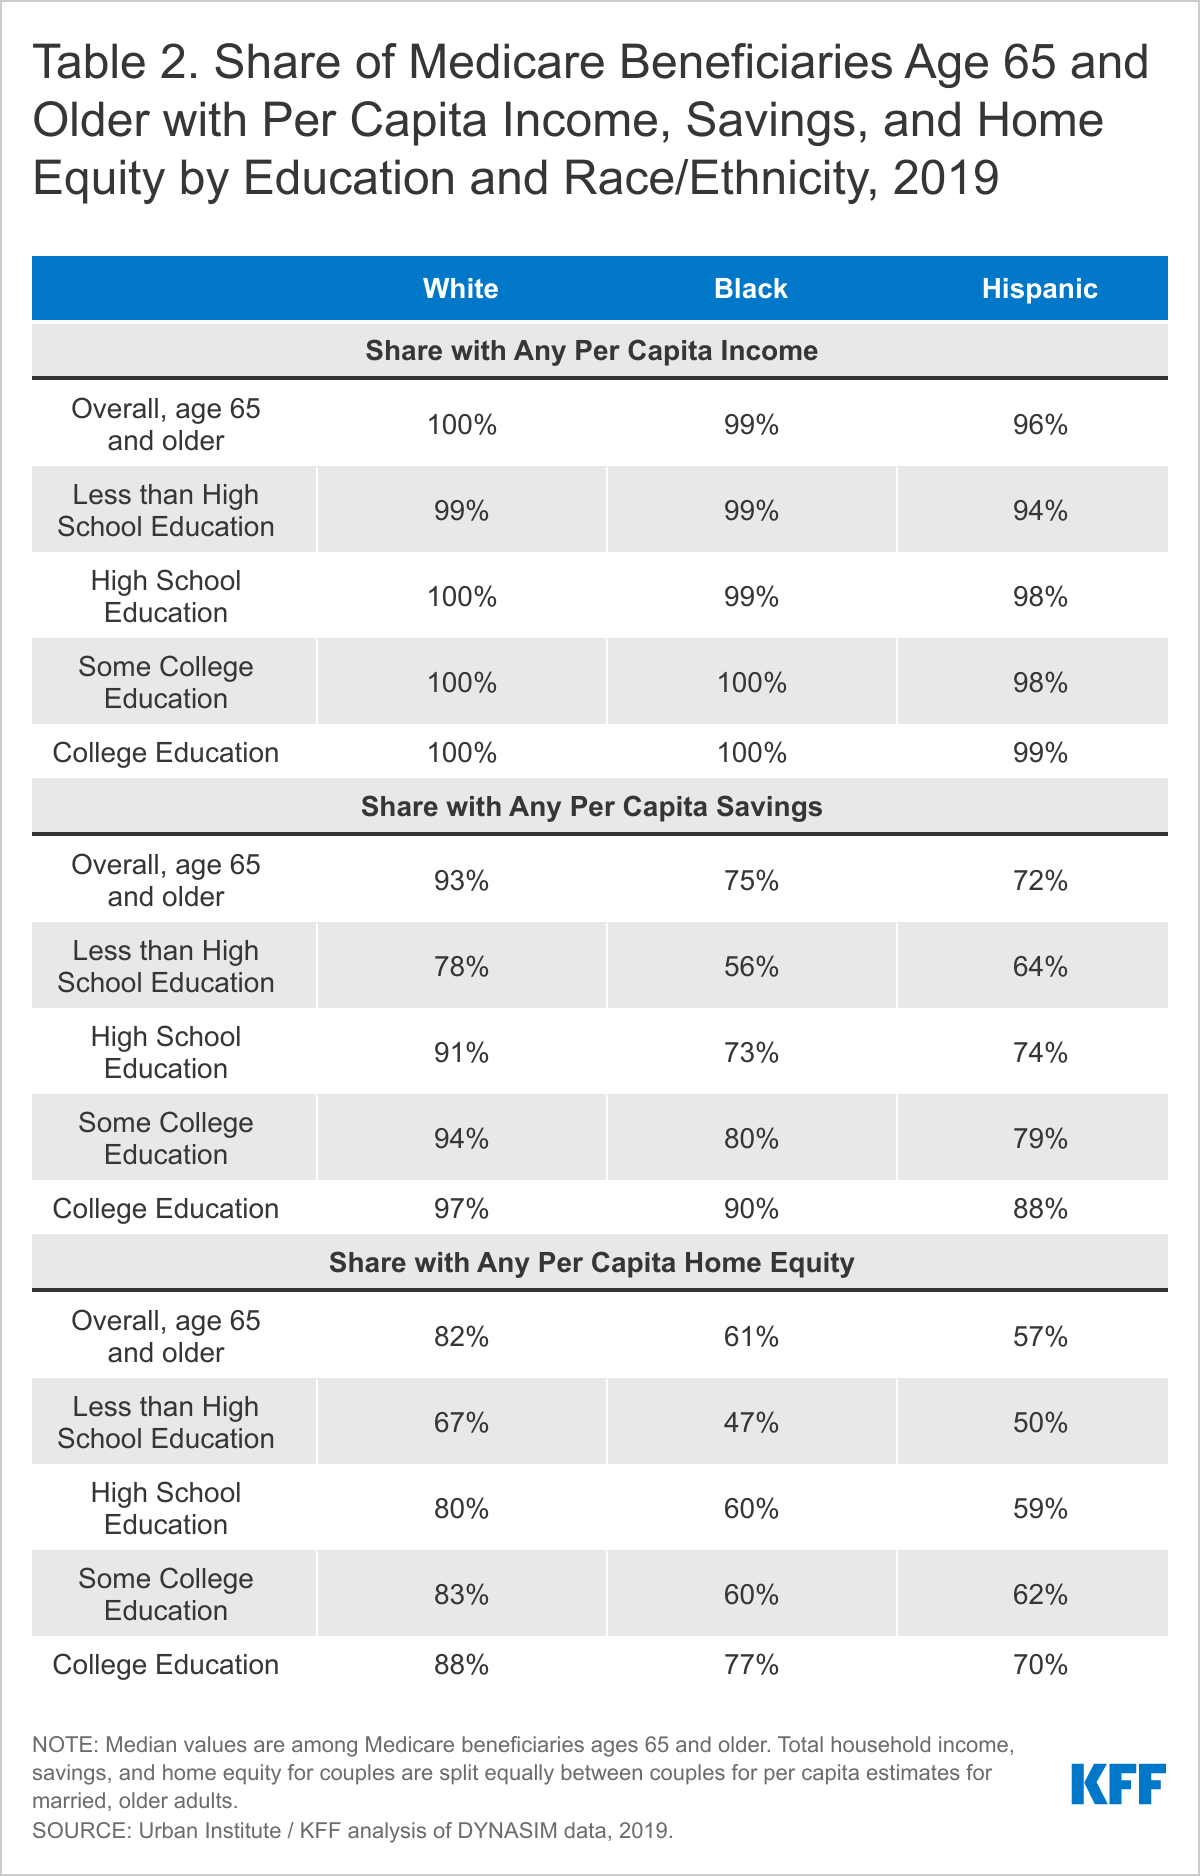
Differences in median per capita savings appear to be driven in part by the share of each group that had any savings.
Overall, nearly all older White adults (93%) had some per capita savings, while a smaller share of older Black (75%) and Hispanic (72%) adults had any savings (Table 2). The vast majority of White, Black and Hispanic adults with a college education had some savings, although the share with any savings was higher among older White adults (97%) than among Black or Hispanic older adults (90% and 88%, respectively).
Among those with less than a high school education, the majority of older White adults had some savings (78%), compared to a little over half of older Black adults (56%) and two-thirds of older Hispanic adults (64%) (Table 2).
Home Equity
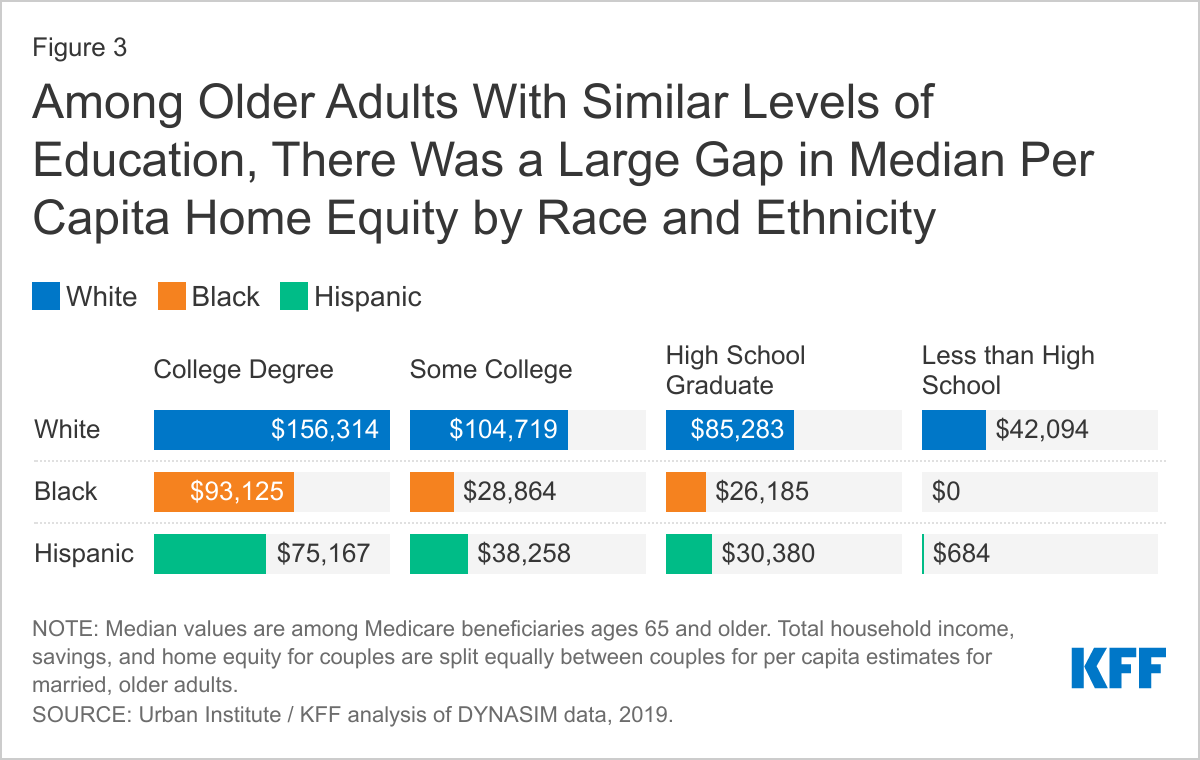
Among older adults overall, median per capita home equity among older White adults was more than three times higher than older Black adults and nearly five times higher than older Hispanic adults (Table 1). Similar to the patterns described for savings, there were wide gaps in per capita home equity by race and ethnicity among older adults with similar levels of education. Among other things, home equity can be an important asset used to pay unexpected, expensive health and long-term care costs (Figure 3).
Among those with a college education, the median per capita home equity of older White adults ($156,314) was 1.7 times higher than that of older Black adults ($93,125 ) and 2.1 times than that of older Hispanic adults ($75,167) (Table 1).
The median per capita home equity was lower for all adults with less than a high school education. Among this group, older White adults had median higher per capita home equity of $42,094, compared to $0 for older Black adults and $684 for older Hispanic adults (Table 1).
There were also wide differences at all education levels in the share of older adults with any home equity by race and ethnicity.
Overall, a larger share of older White adults had any per capita home equity (82%) than older Black (61%) or older Hispanic adults (57%) (Table 2).
Among those with a college education, a larger share of older White adults (88%) had any per capita home equity than older Black (77%) and Hispanic adults (70%) (Table 2).
Two-thirds of older White adults (67%) with less than a high school education had any home equity, compared to about half of older Black (47%) and Hispanic adults (50%) with a similar amount of education (Table 2).
Discussion
When comparing the financial resources of older adults in the U.S. we found that the gap in per capita income between older White adults and older Black and Hispanic adults was smaller among those with similar levels of education than overall for all seniors age 65 and over. However, the differences in savings and home equity remained large. These patterns may be explained in part by smaller shares of older Black and Hispanic adults having any savings or home equity across all education levels. It is also consistent with a larger share of older White adults reporting that they have a college degree (34%) compared to older Black (16%) and Hispanic (15%) adults (KFF analysis of Medicare Current Beneficiary Survery, 2018). Further, it suggests that while education may help decrease differences in income, it appears to have less of an effect on savings and home equity.
These findings are likely the consequence of the long-lasting effects of discriminatory practices and policies that have not only hindered the accumulation of wealth among people of color, but contribute to the persistence of inequality across generations today. As a result, older Black and Hispanic adults have fewer savings or other resources than older White adults to absorb unanticipated medical expenses or other financial shocks, including the economic impact of the pandemic on their families.
Addressing the long-standing inequalities affecting social and economic opportunities is likely to require broad, comprehensive policy solutions. As policymakers and the incoming Administration consider legislation to support the economy and reduce racial inequities, this analysis finds wide disparities in income, savings and home equity that put older Black and Hispanic adults with Medicare in a far weaker financial position than their White counterparts in their retirement years.
Wyatt Koma, Jeannie Fuglesten Biniek, Nancy Ochieng, Tricia Neuman are with KFF. Karen Smith is with the Urban Institute.
This chart collection draws on primary and secondary data analyses by KFF and other sources to examine the characteristics, experiences, and outcomes of the Medicare population by race and ethnicity (see Methods for details on data and analysis). It includes data from a variety of sources to describe demographics, health status and disease prevalence, health coverage, access to care and service utilization, and health outcomes, including the most current data available pertaining to disparities related to COVID-19 within the Medicare population. It also documents disparities in income and wealth among people on Medicare.
Key Takeaways
Life expectancy at age 65 has improved since the enactment of Medicare among all older adults but is lower for Black adults than White or Hispanic adults (18.0, 19.4, and 21.4 years, respectively) and higher for Hispanic adults than Black or White adults.
Overall, Black and Hispanic Medicare beneficiaries have fewer years of formal education and lower median per capita income, savings, and home equity than White beneficiaries.
Among Medicare beneficiaries, people of color are more likely to report being in relatively poor health, have higher prevalence rates of some chronic conditions, such as hypertension and diabetes than White beneficiaries; they are also less likely to have one or more doctor visit, but have higher rates of hospital admissions and emergency department visits than White beneficiaries.
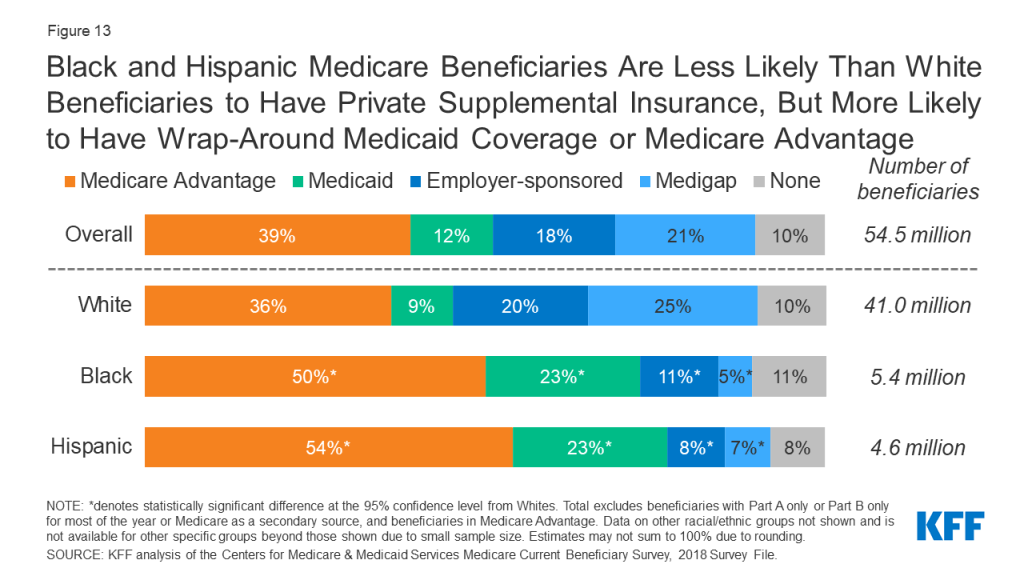
While the vast majority of Medicare beneficiaries across all racial and ethnic groups have some source of supplemental coverage to help fill in Medicare’s benefit gaps and cost-sharing requirements, the share of beneficiaries with different types of coverage varies by race and ethnicity. A smaller share of Black and Hispanic Medicare beneficiaries than White beneficiaries have private supplemental coverage through Medigap or retiree health plans, while a larger share have wrap-around coverage under Medicaid; a larger share of Black and Hispanic than White beneficiaries are enrolled in Medicare Advantage plans
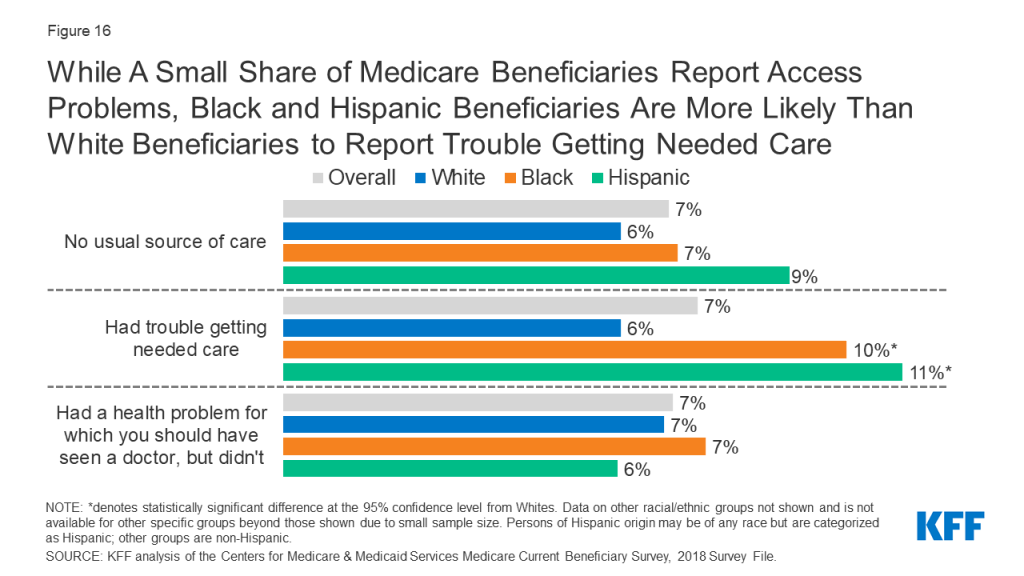
While relatively few Medicare beneficiaries overall report problems with access to care, a larger share of Black and Hispanic beneficiaries report trouble getting needed care than White beneficiaries.
The COVID-19 pandemic has further highlighted stark racial/ethnic health inequities among Medicare beneficiaries, with Black, Hispanic, and American Indian/Alaska Natives accounting for disproportionate rates of COVID-19 cases and hospitalizations. Among adults ages 65 and older, people of color bear disproportionate rates of COVID-19 deaths relative to older White adults.
Report: Overview
Medicare is a national health insurance program that provides coverage to more than 60 million people ages 65 years and older and younger adults with long-term disabilities, including 15 million beneficiaries who are people of color. Medicare covers a broad range of health services, including hospital and physician services, preventive services, skilled nursing facility and home health care, hospice, and prescription drugs. While Medicare has been instrumental in providing adults access to medical care, racial disparities in diagnoses, treatment, and outcomes among beneficiaries persist and have been exacerbated by the coronavirus pandemic.
Medicare has helped to mitigate racial and ethnic inequities in health care in its role as both a regulator and the largest single purchaser of personal health care in the U.S. Prior to the establishment of Medicare, half of older adults lacked health insurance. Soon after its enactment in 1965, Medicare facilitated the integration of hospitals by enforcing Title VI of the Civil Rights Act, which prohibits the distribution of federal funds to institutions that practice discrimination.1 Before then, many hospitals were segregated, and in many parts of the country, Black physicians were unable to practice in hospitals in their community.2 As Dorothy Height, an American civil and women’s rights activist, observed, “the combination of Medicare, Medicaid and the civil rights legislation changed the health care landscape forever for Black Americans and minorities of all ages. Everyone benefited from these policies.”
However, as the coronavirus pandemic has laid bare, racial and ethnic inequities in health and health care persist, including among people with Medicare. Among adults ages 65 and over, COVID-19 related mortality rates for Black and Hispanic adults are nearly double the rate for White adults. In the Medicare population, which includes both older adults and younger adults with long-term disabilities, Black, Hispanic, and American Indian and Alaska Native beneficiaries have borne a disproportionate burden of COVID-19 cases and hospitalizations.
Long before the COVID-19 pandemic, numerous studies documented health inequities among Medicare beneficiaries by race and ethnicity, even after controlling for multiple factors, such as age, sex, and comorbidities. For example, Black Medicare beneficiaries have higher hospital readmission rates than White beneficiaries even after controlling for multiple patient-level factors,3, 4, 5 and in some studies, these disparities persist even within the same hospital or skilled nursing facility,6,7 suggesting that systemic-level factors are driving forces behind these disparities. Moreover, studies have documented racial/ethnic disparities in cancer survival rates and receipt of optimal treatments.8, 9, 10, 11,12
Health inequities among Medicare beneficiaries are attributed to broader structural, socioeconomic, political, and environmental factors that are rooted in years of systemic racism. Socioeconomic disadvantages associated with structural racism shape health outcomes among people of color long before the age of Medicare eligibility is reached and have a cumulative effect over the course of a lifetime, contributing to ongoing or greater inequities in older ages.13,14
This chart collection draws on primary and secondary data analyses by KFF and other sources to examine the characteristics, experiences, and outcomes of the Medicare population by race and ethnicity (see Methods for details on data and analysis). It includes data from a variety of sources to describe demographics, health status and disease prevalence, health coverage, access to care and service utilization, and health outcomes, including the most current data available pertaining to disparities related to COVID-19 within the Medicare population. It also documents disparities in income and wealth among people on Medicare.
While the collection of race and ethnicity data in administrative and survey data has improved over time, sample size and data collection limitations, including limitations related to completion, accuracy, and classifications of race/ethnicity data, preclude analysis of certain racial and ethnic groups consistently across data sources. Further, gaps in data reporting and collection standards, such as the reporting of COVID-19 cases and deaths in nursing homes by race and ethnicity, impede the complete identification of racial and ethnic disparities. These data limitations affect our ability to display results for a consistent set of racial and ethnic groups in this chart collection, especially for Asian, American Indian and Alaska Native, and Native Hawaiian and Other Pacific Islander beneficiaries, and beneficiaries who identify as two more races in some of our analyses. Moreover, due to these data limitations, we are unable to present more nuanced and disaggregated data that reflect the heterogeneity within different racial and ethnic groups. For example, researchers have documented differences in health outcomes within Hispanic subgroups, such as those identifying as Mexican, Cuban, Puerto Rican, Dominican, and Central/South American, that would otherwise be masked.15,16 Throughout this brief, individuals of Hispanic origin may be of any race, but are classified as Hispanic for the analysis; all other groups are non-Hispanic.
Report: Demographics
By 2060, People of Color Will Comprise Close to Half of the U.S Population Ages 65 and Older
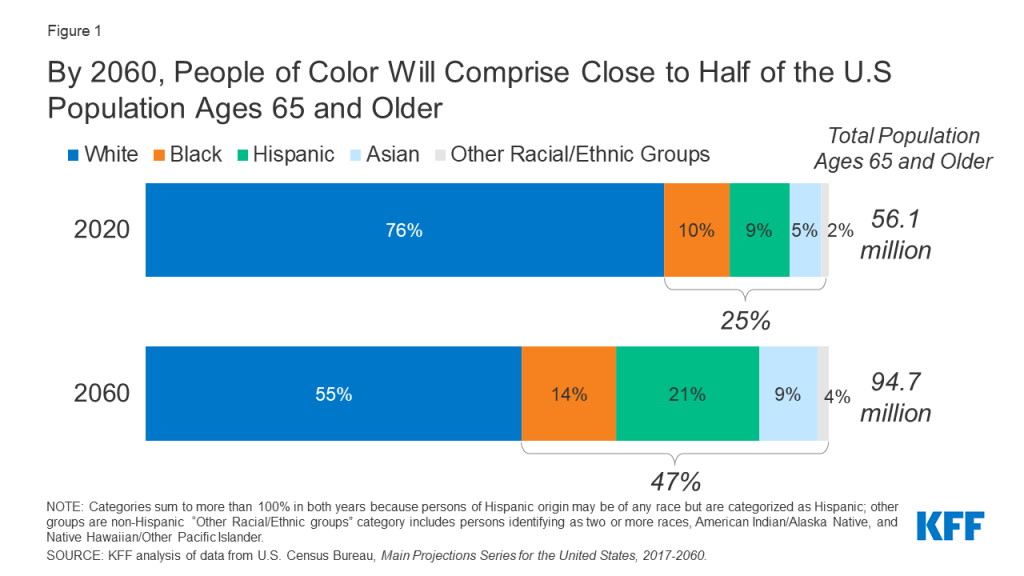
The population of the United States ages 65 and older is projected to grow from 56 million in 2020 to 95 million in 2060, accounting for nearly a quarter of the nation’s total population in 2060.
The U.S population ages 65 and over is also expected to become more diverse over time. Between 2020 and 2060, White adults are projected to account for a decreasing share of adults ages 65 and older, with their population declining from 76% to 55%, while the share of adults ages 65 and older who are people of color is projected to nearly double, from 25% to 47%. Much of this increase reflects growth in the older Hispanic adult population, with the share of adults ages 65 and older who are Hispanic projected to more than double over the next four decades, from 9% in 2020 to 21% in 2060 (Figure 1).
Figure 1: By 2060, People of Color Will Comprise Close to Half of the U.S Population Ages 65 and Older
The Average Number of Years of Life Remaining at Age 65 Is Substantially Lower for Black Adults Than for White or Hispanic Adults
In 2018, adults in the U.S who reached age 65 were expected to live an additional 19.5 years on average –reflecting a 5-year gain in life expectancy since 1960, prior to the enactment of Medicare.17
However, life expectancy at age 65 is lower among Black adults (18 years) than among White adults (19.4 years) and Hispanic adults (21.4 years) (Figure 2). Among adults in all three groups, life expectancy at age 65 is higher for women than men.
Notably, Hispanic male and female adults have the highest life expectancy at age 65, despite being socioeconomically disadvantaged compared to White adults. Research has, in part, attributed this advantage (i.e., “Hispanic paradox”18 ) to lower smoking rates and other positive health behaviors among Hispanic adults relative to other groups, as well as immigration-related processes that indirectly select healthier immigrants.19 However, these findings are still not fully understood. Researchers have also projected that among Hispanic adults born in the United States, this life expectancy advantage is expected to diminish due to increasing prevalence of obesity.20
The Majority of Medicare Beneficiaries Are White Adults, While 24% Are People of Color
In 2018, there were 60.9 million Medicare beneficiaries in total, including adults ages 65 and older and younger adults living with a long-term disability. A majority of Medicare beneficiaries are White, while 24% are people of color. This includes 10% (6 million) Black beneficiaries, 8% (5.1 million) Hispanic beneficiaries, and 6% (3.7 million) beneficiaries in other racial and ethnic groups, including Asian, Native Hawaiian or Other Pacific Islander, and American Indian or Alaska Native people as well as people identifying two or more races (Figure 3).
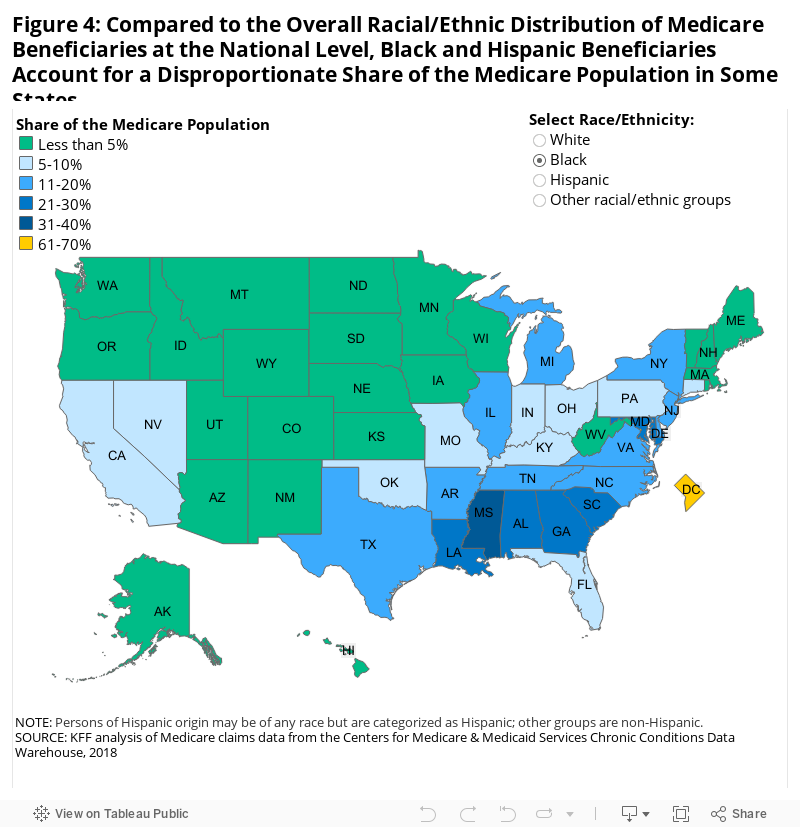
Compared to the Racial/Ethnic Distribution of Medicare Beneficiaries at the National Level, Black and Hispanic Beneficiaries Account for a Disproportionate Share of the Medicare Population in Some States
While the Medicare population in all states is predominantly White, Black and Hispanic beneficiaries account for a disproportionate share of the Medicare population in some states, relative to the racial/ethnic distribution of Medicare beneficiaries at the national level (Table 1, Figure 4). Black adults account for 11% of the Medicare population nationally, but a larger share in 14 states and the District of Columbia, and less than 5% in 22 states. Notably, the share of Black adults in the Medicare population in the District of Columbia (63%) is nearly six times higher than the national average (Table 1). Hispanic adults account for 8% of the Medicare population nationally, but a larger share in nine states, and less than 5% in 35 states and the District of Columbia. In large part, these distributions of Medicare beneficiaries by race and ethnicity reflect the variation in the racial and ethnic composition of the U.S population across states.
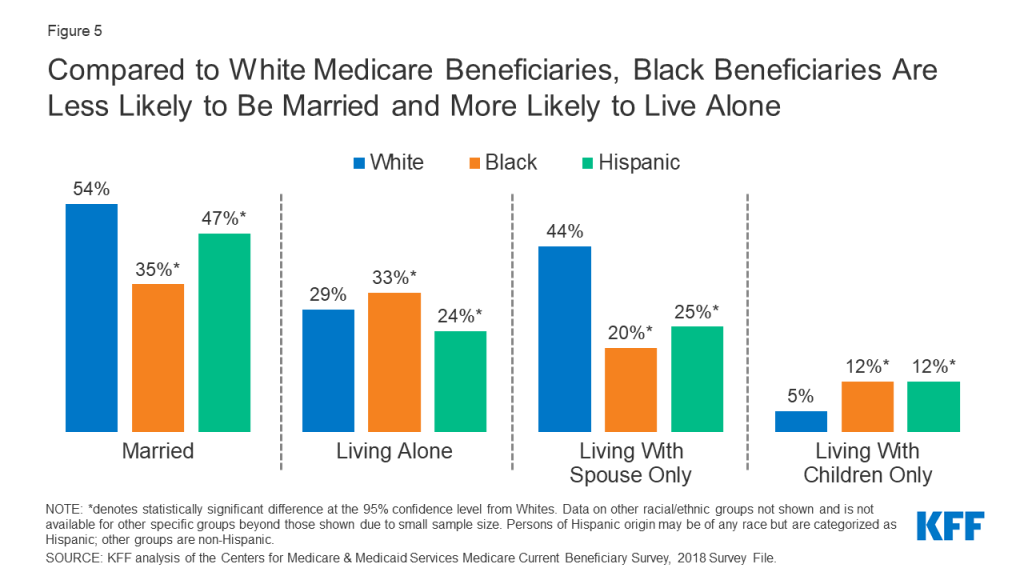
Compared to White Medicare Beneficiaries, Black Beneficiaries Are Less Likely to Be Married and More Likely to Live Alone
Household living arrangements of Medicare beneficiaries differ by race and ethnicity. Researchers have considered living alone as a potential predisposing factor for social isolation, which is a risk factor for poor health outcomes.21
Compared to White beneficiaries, Black beneficiaries are more likely to live alone (54% versus 33%, respectively) (Figure 5). Conversely, smaller shares of Black and Hispanic beneficiaries are married than White beneficiaries (35%, 47%, and 54%, respectively), with Black and Hispanic beneficiaries being less likely to be living with just their spouse compared to White beneficiaries.
Figure 5: Compared to White Medicare Beneficiaries, Black Beneficiaries Are Less Likely to Be Married and More Likely to Live Alone
Larger Shares of Black and Hispanic Medicare Beneficiaries Are Under Age 65 and Living with a Long-Term Disability Compared to White Beneficiaries
The vast majority (86%) of Medicare beneficiaries are ages 65 and older, while 14% are under age 65 and qualify for Medicare due to a long-term disability.
Larger shares of Black (25%) and Hispanic (19%) beneficiaries are under age 65 compared to White beneficiaries (12%) (Figure 6). Beneficiaries under age 65 are more likely than older adults to have lower incomes, report fair or poor health status, and have a cognitive or mental impairment, regardless of race/ethnicity.
Figure 6: Larger Shares of Black and Hispanic Medicare Beneficiaries Are Under Age 65 and Living With a Long-Term Disability Compared to White Beneficiaries
Report: Education, Poverty, And Wealth
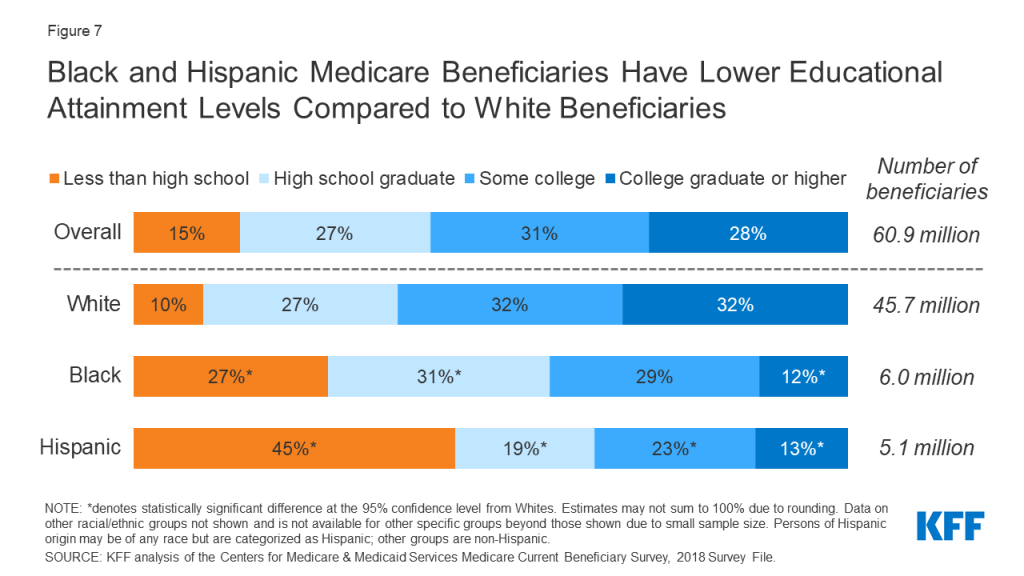
Black and Hispanic Medicare Beneficiaries Have Lower Educational Attainment Levels Compared to White Beneficiaries
Educational attainment, one of the key social determinants of health, varies by race and ethnicity, with Black and Hispanic beneficiaries having fewer years of education compared to White beneficiaries.
More than one quarter of Black (27%) Medicare beneficiaries and nearly one half (45%) of Hispanic beneficiaries have less than a high school education, compared to 10% of White beneficiaries (Figure 7). Conversely, a much smaller share of Black (12%) and Hispanic (13%) beneficiaries than White beneficiaries (32%) have a college degree or higher.
Figure 7: Black and Hispanic Medicare Beneficiaries Have Lower Educational Attainment Levels Compared to White Beneficiaries
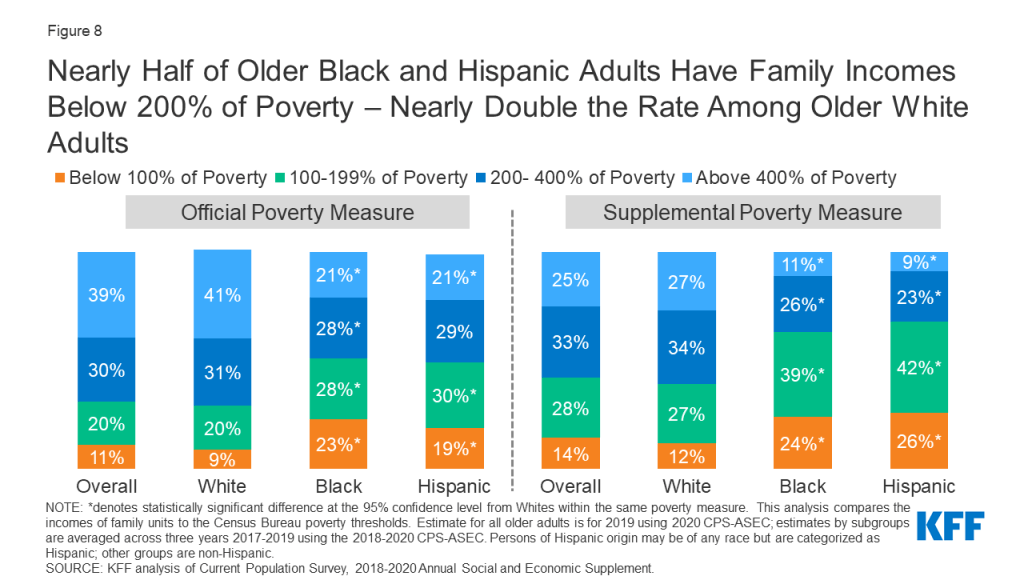
Nearly Half of Older Hispanic and Black Adults Have Family Incomes Below 200% of the Poverty Threshold—Nearly Double the Rate Among Older White Adults
Among people ages 65 and older, Black and Hispanic adults are more likely than older White adults to have family income below poverty, based on both the official poverty measure and the Supplemental Poverty Measure (SPM).
Based on the official poverty measure, nearly half of older Black and Hispanic adults (51% and 49%, respectively) have family incomes below 200% of poverty, compared to just over one quarter (29%) of older White adults (Figure 8).
Figure 8: Nearly Half of Older Black and Hispanic Adults Have Family Incomes Below 200% of Poverty – Nearly Double the Rate Among Older White Adults
The share of Black and Hispanic adults with family income below poverty is higher based on the SPM than under the official poverty measure. The SPM differs from the official poverty measure in that it takes into account several additional financial resources, including in-kind government benefits (e.g., food stamps, housing subsidies), tax credits, out-of-pocket medical expenses, work expenses, homeownership, and geographic variation in housing costs. The SPM also deducts medical out-of-pocket expenses from financial resources, which is an especially important factor in calculating income for older adults. Based on the SPM, 63% of older Black adults and 68% of older Hispanic adults have incomes below 200% of poverty, compared to 39% of older White adults.
Median Per Capita Income, Savings, and Home Equity are Higher for White Beneficiaries Than for Black or Hispanic Beneficiaries
In 2019, half of all Medicare beneficiaries had incomes below $29,655 per person, savings below $73,819 per person, and home equity below $75,346 per person (Figure 9).
Median per capita income among White beneficiaries ($33,718) was double that of Hispanic beneficiaries ($15,611) and 1.5 times higher than median per capita income among Black beneficiaries ($23,050).
The wealth gap, based on median per capita home equity and savings, was notably wider. Median per capita savings among White beneficiaries ($117,803) was more than eight times higher than savings among Black beneficiaries ($14,523) and about twelve times higher than savings among Hispanic beneficiaries ($9,634). Median per capita home equity was more than five times higher among White beneficiaries ($95,001) than among Black beneficiaries ($18,454) or Hispanic beneficiaries ($16,494). Lower savings and home equity among people of color on Medicare than among White Medicare beneficiaries, in part, reflects fewer opportunities among Black and Hispanic adults to accumulate wealth and transfer wealth from one generation to the next.22,23,24
A Wide Racial and Ethnic Disparity in Per Capita Savings Persists Even Among People on Medicare With a College Degree
While educational attainment has been considered by some as a pathway to improving wealth attainment, large racial and ethnic wealth gaps among Medicare beneficiaries persist even among beneficiaries who have attained the highest level of formal education.
Among beneficiaries with a college degree or higher, median per capita savings among White beneficiaries ($328,348) were four times higher than among Black beneficiaries ($82,050) and almost five times higher than among Hispanic beneficiaries ($67,777) (Figure 10). The persistence of the racial wealth gap even at the highest education level reinforces the role of other factors, including structural racism, in generating inequities in Medicare beneficiaries’ financial security.
Report: Health Status And Disease Prevalence
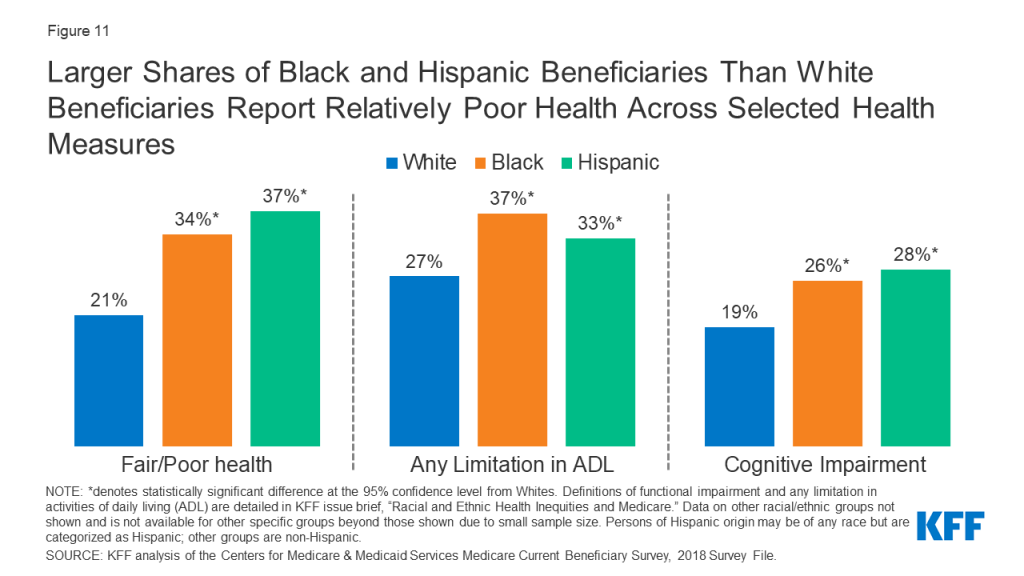
Larger Shares of Black and Hispanic Beneficiaries Than White Beneficiaries Report Relatively Poor Health Across Selected Health Measures
More than a third of Black and Hispanic beneficiaries (34% and 37%, respectively) report being in fair or poor health, compared to 21% of White beneficiaries (Figure 11). Black and Hispanic beneficiaries are more likely than White beneficiaries to have any limitation in activities of daily living (37%, 33%, and 27%, respectively), which is defined as difficulty performing any activities of daily living (e.g., bathing, eating). Limitations in activities of daily living are associated with increased risk of hospitalization, admission to a long-term care facility, and mortality among Medicare beneficiaries.25,26 Additionally, a larger share of Black (26%) and Hispanic (28%) beneficiaries than White beneficiaries (19%) have a cognitive impairment.
Figure 11: Larger Shares of Black and Hispanic Beneficiaries Than White Beneficiaries Report Relatively Poor Health Across Selected Health Measures
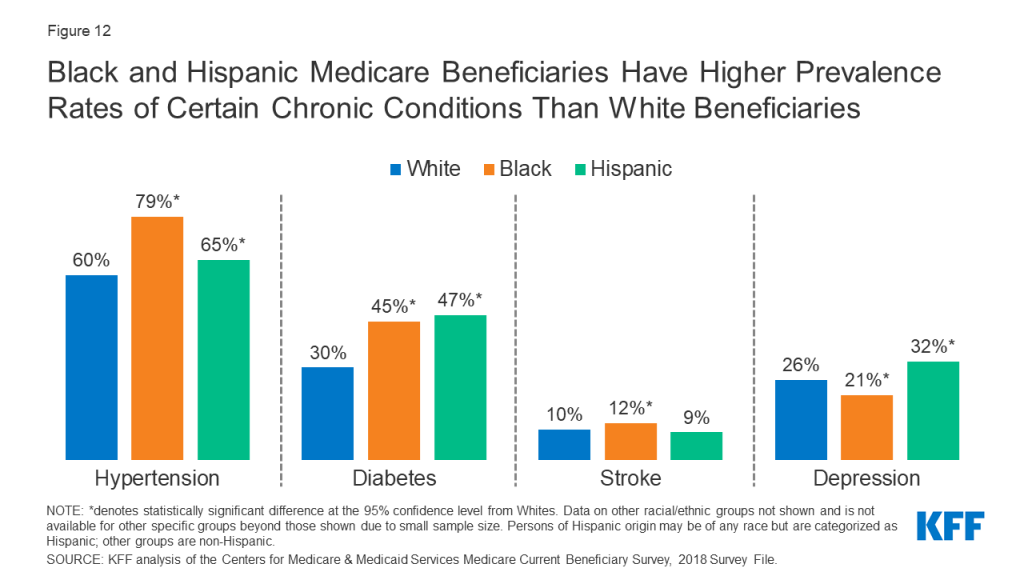
Black and Hispanic Beneficiaries have Higher Prevalence Rates of Certain Chronic Conditions Than White Beneficiaries
The prevalence of certain diseases and chronic conditions varies by race and ethnicity among Medicare beneficiaries. Hypertension is highly prevalent among all Medicare beneficiaries (63%); however, Black and Hispanic beneficiaries have higher rates of hypertension than White beneficiaries (79%, 65%, and 60%, respectively) (Figure 12, Table 3). Additionally, close to half of Black and Hispanic beneficiaries have diabetes, compared to 30% of White beneficiaries. Research has shown that among Medicare beneficiaries with diabetes, Black and Hispanic beneficiaries have the highest amputation rates.27 While the prevalence of stroke is low among all Medicare beneficiaries, the rate is higher among Black beneficiaries than White beneficiaries.
Figure 12: Black and Hispanic Medicare Beneficiaries Have Higher Prevalence Rates of Certain Chronic Conditions Than White Beneficiaries
For other conditions, Black and/or Hispanic beneficiaries have lower prevalence rates than White beneficiaries, including cancer, where prevalence rates are 15% for both Black and Hispanic beneficiaries and 19% for White beneficiaries (Table 3). While a larger share of Hispanic beneficiaries (32%) than White (26%) beneficiaries report depression, a smaller share of Black beneficiaries (21%) report depression compared to White beneficiaries. Hispanic beneficiaries have lower prevalence rates of heart disease (25%) and pulmonary disease (16%) than White beneficiaries (33% and 20%, respectively) (Table 3).
Report: Sources Of Coverage Among Medicare Beneficiaries
Black and Hispanic Medicare Beneficiaries Are Less Likely Than White Beneficiaries to Have Private Supplemental Insurance, but More Likely to Have Wrap-Around Medicaid coverage or Be Enrolled in Medicare Advantage
The vast majority of Medicare beneficiaries across all racial and ethnic groups have some source of supplemental coverage. However, sources of supplemental coverage in Medicare vary by race and ethnicity. While a quarter of White beneficiaries have Medigap, also known as Medicare Supplement Insurance, only 5% of Black beneficiaries and 7% of Hispanic beneficiaries do so (Figure 13, Table 2). Medigap helps to fill in the gaps in traditional Medicare by fully or partially covering Part A and Part B cost-sharing requirements. Black and Hispanic beneficiaries are also less likely than White beneficiaries to have employer or union-sponsored retiree health benefits to supplement Medicare.
Figure 13: Black and Hispanic Medicare Beneficiaries Are Less Likely Than White Beneficiaries to Have Private Supplemental Insurance, But More Likely to Have Wrap-Around Medicaid Coverage or Medicare Advantage
Medicaid provides supplemental coverage to nearly a quarter (23%) of Black and Hispanic beneficiaries, the federal-state program that provides coverage to low-income people, compared to just 9% of White beneficiaries. Additionally, half of Black (50%) and Hispanic (54%) beneficiaries were enrolled in a Medicare Advantage plan in 2018, as compared to just over one third of all White beneficiaries (36%).
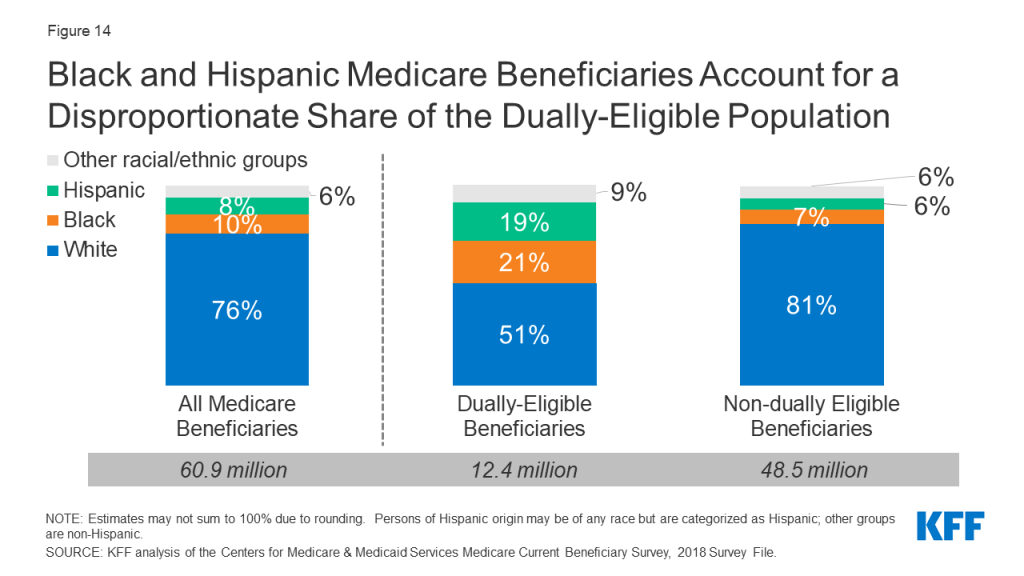
Black and Hispanic Beneficiaries Account for a Disproportionate Share of Beneficiaries Dually Eligible for Both Medicare and Medicaid
Medicaid, the federal-state program that provides coverage to low-income people, is a source of supplemental coverage for Medicare beneficiaries with low incomes and modest assets. Most dually eligible beneficiaries receive both full Medicaid benefits, including long-term services and supports, and payment of their Medicare premiums and cost sharing. Others do not qualify for full Medicaid benefits, but Medicaid covers their Medicare premiums and/or cost sharing through the Medicare Savings Programs.
Together, Black and Hispanic beneficiaries account for 18% of the total Medicare population, but 40% of the Medicare-Medicaid dually eligible population (Figure 14). Compared to all traditional Medicare beneficiaries, dual-eligible beneficiaries are more likely to report poor/fair health status, have lower income, and qualify for Medicare due to a permanent disability.
Figure 14: Black and Hispanic Medicare Beneficiaries Account for a Disproportionate Share of the Dually-Eligible Population
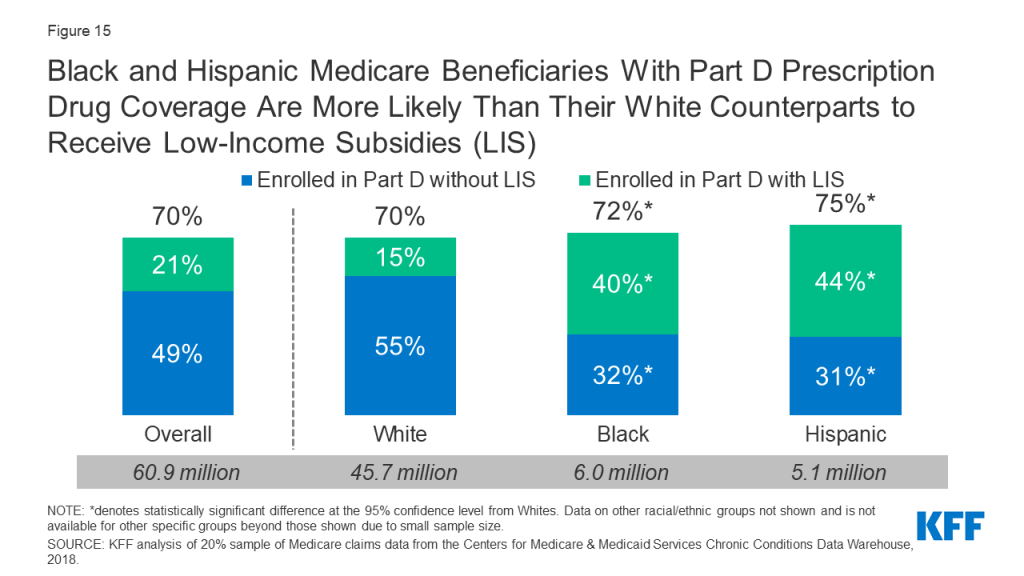
Black and Hispanic Medicare Beneficiaries With Part D Prescription Drug Coverage Are More Likely Than Their White Counterparts to Receive Low-Income Subsidies
The Medicare Part D program provides outpatient prescription drug coverage to Medicare beneficiaries. The majority (70%) of Medicare beneficiaries were enrolled in a Part D drug plan in 2018, with rates of Part D enrollment higher among Black (72%) and Hispanic (75%) beneficiaries than White beneficiaries (70%) (Figure 15).
Figure 15: Black and Hispanic Medicare Beneficiaries With Part D Prescription Drug Coverage Are More Likely Than Their White Counterparts to Receive Low-Income Subsidies (LIS)
This may be partly a function of higher rates of enrollment in Medicaid among Black and Hispanic Medicare beneficiaries than among White beneficiaries, since dual-eligible beneficiaries are automatically enrolled in the Part D program and the Part D Low-Income Subsidy (LIS) program, which provides assistance with Part D premiums and cost sharing. Substantially larger shares (40% and 44%, respectively) of all Black and Hispanic beneficiaries were enrolled in Part D and received premium and cost-sharing assistance through the LIS program, compared to 15% of White beneficiaries.
Report: Access To Care And Service Utilization
While a Small Share of Medicare Beneficiaries Overall Report Access Problems, Black and Hispanic Beneficiaries are More Likely than White Beneficiaries to Report Trouble Getting Needed Care
Overall, relatively few Medicare beneficiaries report problems with access to care, with no significant differences across racial and ethnic groups in the share of beneficiaries without a usual source of care or in the share of beneficiaries delaying needed care. These findings illustrate the importance of health insurance coverage in ensuring access to care and mitigating racial and ethnic disparities in some measures of access.
However, a larger share of Black (10%) and Hispanic (11%) beneficiaries than White beneficiaries (6%) report trouble getting needed care (Figure 16). Recent analysis by the Medicare Payment Advisory Commission (MedPAC) found that in 2019, among Medicare beneficiaries ages 65 and older, people of color were more likely than White beneficiaries to report unwanted delays in getting an appointment and problems finding a new specialist. This pattern was also observed among privately insured adults ages 50-64.
Figure 16: While A Small Share of Medicare Beneficiaries Report Access Problems, Black and Hispanic Beneficiaries Are More Likely Than White Beneficiaries to Report Trouble Getting Needed Care
Black Medicare Beneficiaries Are More Likely to Report Cost-Related Barriers to Care Compared to White Beneficiaries
A larger share of Black and Hispanic beneficiaries than White beneficiaries report problems paying medical bills (21%, 13%, and 9%, respectively) and delaying care due to cost (14%, 12%, and 10% respectively). Among those with problems paying medical bills, a larger share of Black beneficiaries report debt to collection agencies due to medical bills than White beneficiaries (13% versus 4%, respectively) (Figure 17).
Figure 17: Black Medicare Beneficiaries Are More Likely to Report Cost-Related Barriers to Care Compared to White Beneficiaries
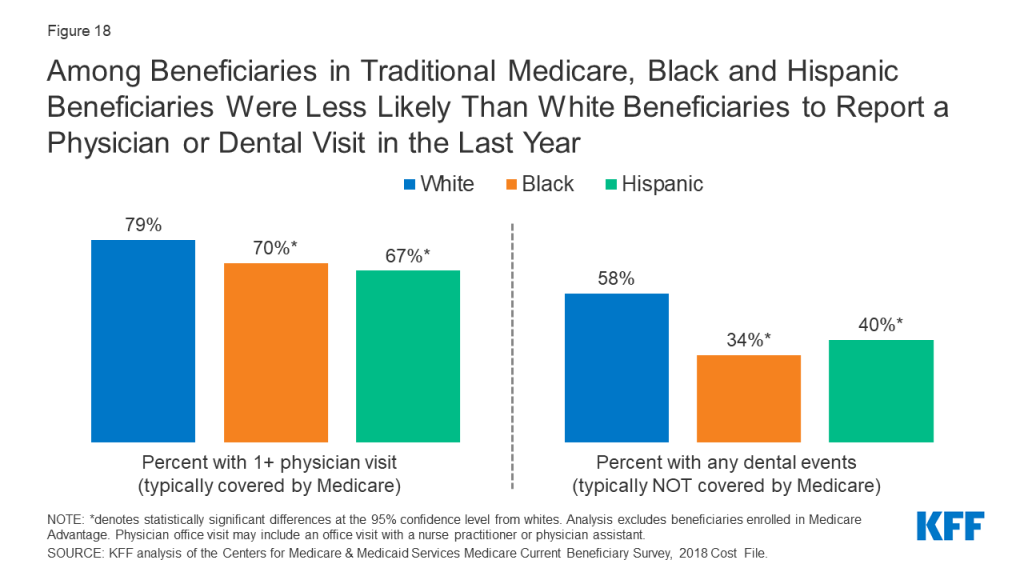
Among Beneficiaries in Traditional Medicare, Black and Hispanic Beneficiaries Were Less Likely Than White Beneficiaries to Report a Physician or Dental Visit in the Last Year
The majority of all beneficiaries in traditional Medicare saw at least one physician in 2018. However, the rate was lower among Black and Hispanic beneficiaries than among White beneficiaries (70% and 67%, respectively, compared to 79%). (Figure 18).
Figure 18: Among Beneficiaries in Traditional Medicare, Black and Hispanic Beneficiaries Were Less Likely Than White Beneficiaries to Report a Physician or Dental Visit in the Last Year
While traditional Medicare provides coverage for an array of medical services, it does not cover routine dental care. Consequently, in 2018, just over half (54%) of the Medicare population saw a dentist in the past year, with lower rates among Black beneficiaries (34%) and Hispanic beneficiaries (40%) than among White beneficiaries (58%) (Table 5).
Among Beneficiaries in Traditional Medicare, a Larger Share of Black Beneficiaries Had One or More Inpatient Stays and Emergency Department Visits Than White Beneficiaries
Among beneficiaries in traditional Medicare, a larger share of Black beneficiaries had an inpatient hospital stay than White beneficiaries (22% versus 15%, respectively) (Figure 19). The share of beneficiaries reporting at least two inpatient stays was also higher among Black beneficiaries (7%) than among White beneficiaries (4%) (Table 5). Racial/ethnic differences in inpatient stays (1+ days and 2+ days) did not differ significantly by self-reported health status.
Figure 19: Among Beneficiaries in Traditional Medicare, a Larger Share of Black Beneficiaries Had One or More Inpatient Stays and Emergency Department Visits Than White Beneficiaries
A larger share of Black beneficiaries had one or more emergency department (ED) visits compared to White beneficiaries (41% versus 27%, respectively). In contrast to inpatient hospital stays, racial differences in ED visit rates by self-reported health status were observed. Specifically, Black beneficiaries in fair/poor health status were more likely than White beneficiaries of similar health status to report any emergency department visit (59% versus 43%, respectively). But even among Medicare beneficiaries in relatively better health (defined as excellent, very good, or good self-reported health status), Black beneficiaries were more likely than White beneficiaries to have an emergency department visit (30% vs. 21%, respectively). Additionally, the share of Black beneficiaries with two or more ED visits (24%) was twice as large as the share among White beneficiaries (12%).
Emergency Department Visit Rates for Hypertension, Diabetes, Stroke, and Heart Failure were Higher among Black Medicare Beneficiaries than Beneficiaries in Other Racial and Ethnic Groups
Among Medicare beneficiaries diagnosed with hypertension, the rate of ED visits among Black beneficiaries (53 per 1,000 people) was at least double the rates among White and Asian beneficiaries (22 and 21 visits per 1,000 people, respectively) and nearly double the rates among Hispanic and American Indian and Alaska Native beneficiaries (Figure 20). Among beneficiaries diagnosed with diabetes, ED visit rates among Black, Hispanic, and American Indian and Alaska Native beneficiaries (22, 17, and 20 visits per 1,000 beneficiaries, respectively) were at least double the rates among White and Asian beneficiaries (8 visits per 1,000 beneficiaries). Asian and Pacific Islander beneficiaries had lower ED visit rates for hypertension, diabetes, stroke, and heart failure compared to beneficiaries in other racial and ethnic groups.
Hospital Readmission Rates are Higher among Black Medicare Beneficiaries than Beneficiaries in Other Racial and Ethnic Groups
The Hospital Readmissions Reduction Program (HRRP), which has been in place since 2012, aims to reduce avoidable hospital readmission rates and improve quality of care by imposing payment penalties on hospitals with excess readmission rates for certain health conditions. In 2018, 30-day readmission rates among Medicare beneficiaries in traditional Medicare were higher among Black beneficiaries (19%) than among White beneficiaries (14%), Hispanic beneficiaries (17%), Asian/Pacific Islander beneficiaries (14%), and American Indian/Alaska Native beneficiaries (16%) (Figure 21). Black beneficiaries had higher odds of being readmitted to a hospital than White beneficiaries, regardless of diagnosis during the first hospitalization or discharge setting.
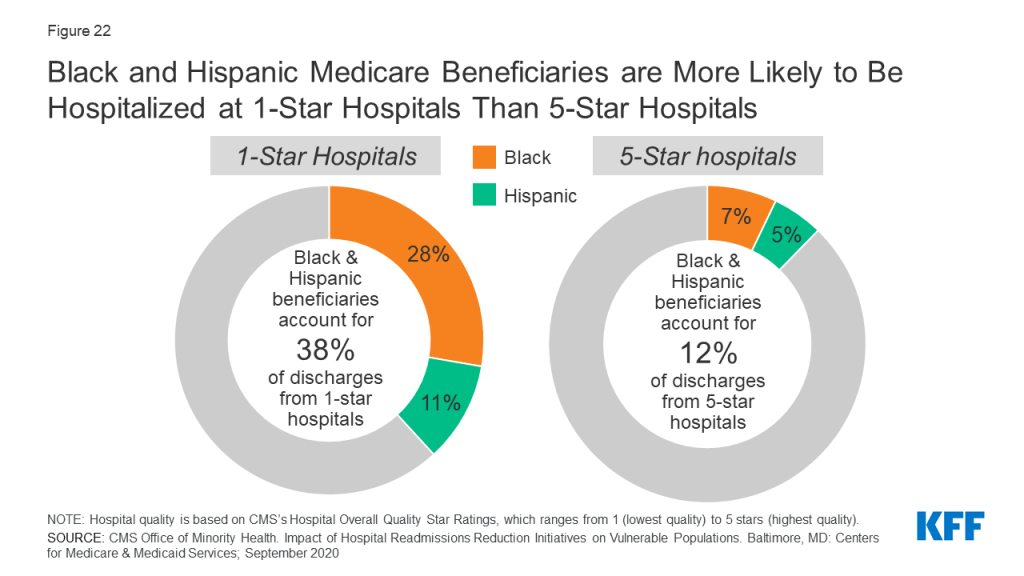
Black and Hispanic Medicare Beneficiaries are More Likely to be Hospitalized at 1-Star Hospitals than 5-Star Hospitals
CMS’s overall hospital quality star rating summarizes hospital performance on various measures, such as rates of readmissions, healthcare-associated infections, and value of care for certain health conditions (e.g., pneumonia) into a single star rating for each hospital, which ranges from 1 star (lowest quality) to 5 stars (highest quality). In 2018, Black and Hispanic beneficiaries accounted for 28% and 11% of discharges from 1-star hospitals, respectively, but only 7% and 5% of discharges from 5-star hospitals, respectively (Figure 22).
Figure 22: Black and Hispanic Medicare Beneficiaries are More Likely to Be Hospitalized at 1-Star Hospitals Than 5-Star Hospitals
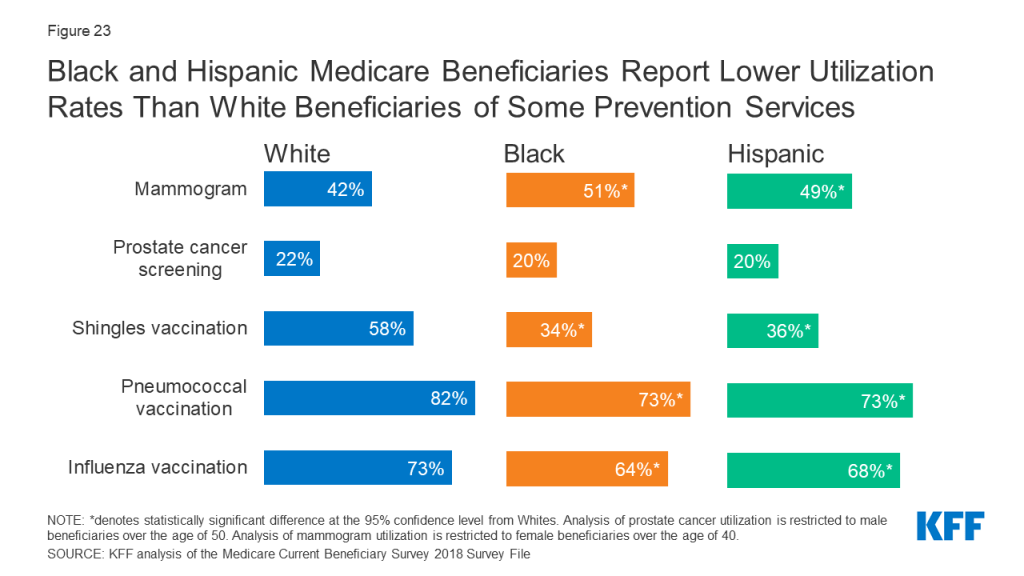
Black and Hispanic Beneficiaries Report Lower Utilization Rates Than White Beneficiaries of Some Prevention Services
Medicare provides coverage for a wide range of preventive and screening services, including a “Welcome to Medicare” physical exam during the first year of Medicare enrollment, immunization for various conditions (including influenza), and screening exams for cancers.
Overall, less than a quarter (21%) of male beneficiaries ages 50 and older reported receiving a prostate cancer screening, with no statistically significant differences by race or ethnicity (Figure 23). Less than half (43%) of all female beneficiaries ages 40 and older reported receiving a mammogram in the past year, with Black and Hispanic beneficiaries being more likely than White beneficiaries to receive a mammogram in the past year (51%, 49%, 42%, respectively).
Figure 23: Black and Hispanic Medicare Beneficiaries Report Lower Utilization Rates Than White Beneficiaries of Some Prevention Services
Notable racial and ethnic disparities in immunization rates were also observed among Medicare beneficiaries. Smaller shares of Black and Hispanic beneficiaries reported receiving a flu vaccination than White beneficiaries (64%, 68%, and 73%, respectively). Research has shown that the gap in flu vaccination is even greater when it comes to receipt of high-dose influenza vaccine,28 which is specifically targeted to adults ages 65 and older. Additionally, compared to White beneficiaries, Black and Hispanic beneficiaries had lower rates of pneumococcal vaccination and shingles vaccination. Several potential factors may contribute to racial and ethnic disparities in vaccination uptake, including, but not limited to, differential access to and use of preventive health care services, concerns or misconceptions about vaccine safety, and persistent medical mistrust rooted in a history of racial discrimination and mistreatment in the health care sector.
Report: Covid-19
COVID-19 Death Rates Among Hispanic, American Indian/Alaska Native, and Black Adults Ages 65 and Older are Nearly Double the Rate Among Older White Adults
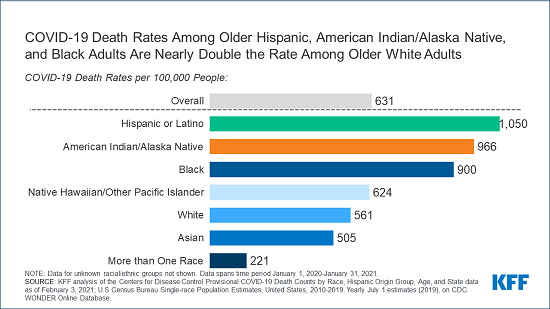
People of color have experienced disproportionate rates of COVID-19 cases, hospitalizations, and deaths. Specifically, among adults ages 65 and older, the mortality rates per 100,000 people were higher for older Hispanic adults (1,050 deaths per 100,000), older American Indian/Alaska Native adults (966 deaths per 100,000), and older Black adults (900 deaths per 100,000) than for older White adults (561 deaths per 100,000) (Figure 24).
Among Adults Ages 65 and Older, COVID-19 Represents a Larger Share of Deaths Among People of Color than White People Since January 2020
Among older Hispanic adults, COVID-19 deaths account for 25% of all causes of death—2.3 times higher than the share among older White adults (11%) (Figure 25). For older American Indian/Alaska Native, Asian, Black, and Native Hawaiian or Other Pacific Islander adults, COVID-19 deaths account for 23%, 17%, 16%, and 16% of deaths from all causes, respectively.
COVID-19 Cases Are Higher Among American Indian/Alaska, Hispanic, and Black Beneficiaries Than Among White Beneficiaries
From January 1 to November 21, 2020, COVID-19 cases among American Indian and Alaska Native, Black, and Hispanic Medicare beneficiaries (4,598, 4,343, and 4,243 cases per 100,000 respectively) were 1.7, 1.6, and 1.6 times higher, respectively, than among White beneficiaries (2, 655 cases per 100,000) (Figure 26).
COVID-19 Hospitalization Rates Are Higher Among American Indian/Alaska Native, Black, and Hispanic Beneficiaries Than Among White Beneficiaries
From January 1, 2020 to November 21, 2020, hospitalization rates for American Indian/Alaska Native, Black, and Hispanic Medicare beneficiaries were 2.9 times, 2.7 times, and 2.1 times respectively, higher than White beneficiaries (592 hospitalizations per 100,000) (Figure 27).
Analysis of patient data from health records shows that in addition to having higher rates of infections, hospitalizations, and mortality, people of color have been more likely to require more intensive level of treatment at the time of COVID-19 diagnosis, such as inpatient hospitalization or the use of oxygen and ventilation. Further, the COVID-19 pandemic has exacerbated mental health outcomes among older Hispanic adults, with older Hispanic adults reporting higher rates of depression or anxiety (33%) than older White (23%), Black (26%), and Asian (17%) adults.
The CARES Act includes a provision requiring Medicare Part B to cover a vaccine for COVID-19 at no cost to Medicare beneficiaries. However, 35% of Black adults ages 18 and older say they would definitely or probably not get a vaccine even if it was deemed safe by scientists and offered at no cost, with about half (48%) saying they are not confident that the needs of Black people are being accounted for in the COVID-19 vaccine development process. This finding reflects well-founded medical mistrust among African Americans, based on a history of racial abuse and malpractice within the medical system, as exemplified by the Tuskegee syphilis experiment, involuntary medical experimentation of Henrietta Lacks,29 and ongoing forms of medical racism, such as under prescribing of pain medications for Black people due to racial bias.
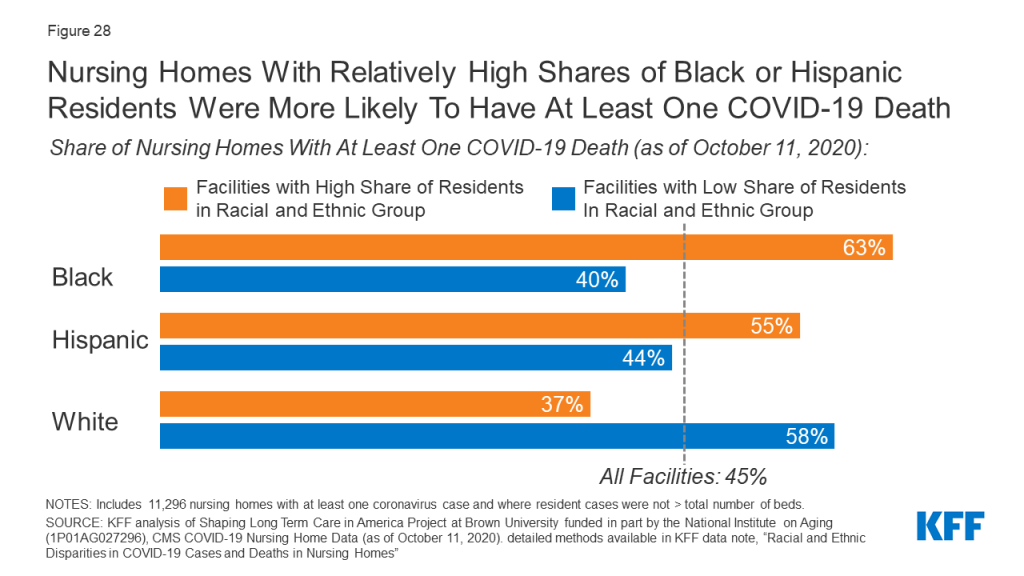
Nursing Homes with Relatively High Shares of Black or Hispanic Residents Were More Likely to Have At Least One COVID-19 Death
Older adults in long-term care facilities, such as nursing homes, have also been disproportionately impacted by the COVID-19 pandemic, with long-term facilities accounting for 7% of total cases and 40% of total deaths in the U.S. More than half of nursing homes with a high share (defined as 20% or more of residents) of Black residents (63%) and Hispanic residents (55%) reported at least one COVID-19 death, compared to 37% of nursing homes with a high share of White residents (Figure 28).
Figure 28: Nursing Homes With Relatively High Shares of Black or Hispanic Residents Were More Likely To Have At Least One COVID-19 Death
Nancy Ochieng, Juliette Cubanski, Tricia Neuman, and Samantha Artiga are with KFF. Anthony Damico is an independent consultant.
Methods
Data Sources Used in Analysis
The Centers for Medicare & Medicaid Services (CMS) 2018 Chronic Conditions Data Warehouse (CCW) was used to provide state-level estimates of the Medicare population, by race and ethnicity.
The CMS Medicare Current Beneficiary Survey (MCBS) 2018 Survey File was used to describe Medicare beneficiary characteristics, supplemental coverage, and access to care. The analysis on supplemental coverage was limited to beneficiaries enrolled in Part A and Part B for most months of the year, excluding those with Part A or Part B only and Medicare as a Secondary Payer for most months of the year. The MCBS 2018 Cost Supplement File was used to describe service utilization among Medicare beneficiaries in fee-for-service (FFS).
Analysis on Medicare Part D enrollment was based on prescription drug event claims data from a sample of Medicare beneficiaries (20% sample for 2018) from the CMS Chronic Conditions Data Warehouse (CCW).
The CMS Office of Minority Health’s Mapping Medicare Disparities Tool, which uses 2018 administrative claims data from the Chronic Conditions Warehouse, was used to describe emergency department visit rates. This data was limited to Medicare beneficiaries enrolled in FFS. Medicare Advantage enrollees were excluded from this analysis because claims data are not available for these beneficiaries.
Urban Institute’s Dynamic Simulation of Income Model (DYNASIM4) was used to describe Medicare beneficiaries’ income and assets in 2019. Detailed methodology is previously discussed here.
The 2018-2020 Current Population Survey March Annual Social and Economic Supplement (CPS ASEC) was used to provide subgroup estimates of poverty under the official and supplemental poverty measure over the period of 2017-2019. The 2020 CPS-ASEC was used to produce poverty rates for all older adults in 2019 The poverty rates presented in this analysis apply to the non-institutionalized Medicare population. The CPS ASEC poverty thresholds are different from the Health and Human Services (HHS) poverty guidelines (sometimes referred to as the “federal poverty level”). Detailed methodology is previously discussed here.
Elizabeth Arias and Jiaquan Xu, “United States Life Tables, 2018” National Vital Statistics Reports 69, no. 12 (November 2020) was used to describe life expectancy at age 65 by race and gender.
Data on COVID-19 deaths among adults ages 65 and over were obtained from the Centers for Disease Control and Prevention, “Deaths involving coronavirus disease 2019 (COVID-19) by race and Hispanic origin group and age, by state” as of February 3, 2021 ( https://data.cdc.gov/NCHS/Deaths-involving-coronavirus-disease-2019-COVID-19/ks3g-spdg). The CDC WONDER online database was used to obtain 2019 U.S Census Bureau single-race population estimates in order to calculate death rates per 100,000 people.
Tables
Endnotes
David Barton Smith, The Power to Heal: Civil Rights, Medicare, and the Struggle to Transform America’s Health Care System (Nashville: Vanderbilt University Press, 2016). ↩︎
Emily A. Largent, “Public Health, Racism, and the Lasting Impact of Hospital Segregation,” Public Health Reports 133, no. 6 (2018): 715–20, https://doi.org/10.1177/0033354918795891. ↩︎
Anouk Lloren et al., “Measuring Hospital-Specific Disparities by Dual Eligibility and Race to Reduce Health Inequities,” Health Services Research 54, no. February (2019): 243–54, https://doi.org/10.1111/1475-6773.13108. ↩︎
Nicholas S. Downing et al., “Association of Racial and Socioeconomic Disparities With Outcomes Among Patients Hospitalized With Acute Myocardial Infarction, Heart Failure, and Pneumonia: An Analysis of Within- and Between-Hospital Variation,” JAMA Network Open 1, no. 5 (2018): e182044, https://doi.org/10.1001/jamanetworkopen.2018.2044. ↩︎
Yue Li et al., “Medicare Advantage Associated With More Racial Disparity Than Traditional Medicare For Hospital Readmissions,” Health Affairs 36, no. 7 (2017): 1328–35, https://doi.org/10.1377/hlthaff.2016.1344. ↩︎
Downing et al., “Association of Racial and Socioeconomic Disparities With Outcomes Among Patients Hospitalized With Acute Myocardial Infarction, Heart Failure, and Pneumonia: An Analysis of Within- and Between-Hospital Variation.” ↩︎
Maricruz Rivera-hernandez et al., “Racial Disparities in Readmission Rates among Patients Discharged to Skilled Nursing Facilities,” Journal of the American Geriatrics Society 67, no. 8 (2019): 1672–79, https://doi.org/10.1111/jgs.15960.Racial. ↩︎
Jolyn Taylor et al., “Disparities in Treatment and Survival among Elderly Ovarian Cancer Patients,” Gynecologic Oncology 151, no. 2 (2018): 269–94, https://doi.org/10.1016/j.ygyno.2018.08.041. ↩︎
Jeffrey H. Silber et al., “Disparities in Breast Cancer Survival by Socioeconomic Status Despite Medicare and Medicaid Insurance,” Milbank Quarterly 96, no. 4 (2018): 706–54, https://doi.org/10.1111/1468-0009.12355. ↩︎
Ikumi Suzuki et al., “Racial Disparities in Outcome among Head and Neck Cancer Patients in the United States: An Analysis Using SEER-Medicare Linked Database.,” Journal of Clinical Oncology 37, no. 15 (2018): 6051–6051, https://doi.org/10.1200/JCO.2019.37.15_suppl.6051. ↩︎
Clara Lam et al., “Differences in Cancer Survival among White and Black Cancer Patients by Presence of Diabetes Mellitus: Estimations Based on SEER-Medicare-Linked Data Resource,” Cancer Medicine 7, no. 7 (2018): 3434–44, https://doi.org/10.1002/cam4.1554. ↩︎
Sikander Ailawadhi et al., “Racial Disparities in Treatment Patterns and Outcomes among Patients with Multiple Myeloma: A SEER-Medicare Analysis,” Blood Advances 3, no. 20 (2019): 2986–94, https://doi.org/10.1182/bloodadvances.2019000308. ↩︎
Arline T Geronimus, “The Weathering Hypothesis and the Health of African-American Women and Infants: Evidence and Speculations.,” Ethn Dis. 2, no. 3 (1992): 207–21. ↩︎
Arline T. Geronimus et al., “‘Weathering’ and Age Patterns of Allostatic Load Scores among Blacks and Whites in the United States,” American Journal of Public Health 96, no. 5 (2006): 826–33, https://doi.org/10.2105/AJPH.2004.060749. ↩︎
Dinorah Martinez Tyson et al., “Unpacking Hispanic Ethnicity—Cancer Mortality Differentials Among Hispanic Subgroups in the United States, 2004–2014,” Frontiers in Public Health 6, no. August (2018): 1–11, https://doi.org/10.3389/fpubh.2018.00219. ↩︎
Fatima Rodriguez et al., “Disaggregation of Cause-Specific Cardiovascular Disease Mortality Among Hispanic Subgroups,” JAMA Cardiology 2, no. 3 (2017): 240–47, https://doi.org/10.1001/jamacardio.2016.4653. ↩︎
Robert Grove and Alice Hetzel, Vital Statistics Rates in the United States: 1940-1960 (Washington, DC: U.S Government Printing Office, 1968); Elizabeth Arias, Brian L. Rostron, and Tejada-Vera Betzaida, “United States Life Tables, 2005,” National Vital Statistics Reports 58, no. 10 (2010); Jiaquan Xu et al., “Deaths: Final Data for 2007,” National Vital Statistics Reports 58, no. 19 (2010), available at https://www.cdc.gov/nchs/data/hus/2010/022.pdf. ↩︎
Jennifer Van Hook, Michelle Frisco, and Carlyn Graham, “Signs of the End of the Paradox? Cohort Shifts in Smoking and Obesity and the Hispanic Life Expectancy Advantage,” Sociological Science 7 (2020): 391–414, https://doi.org/10.15195/v7.a16. ↩︎
Michelle L. Frisco, Jennifer Van Hook, and Robert A. Hummer, “Would the Elimination of Obesity and Smoking Reduce U.S. Racial/Ethnic/Nativity Disparities in Total and Healthy Life Expectancy?,” SSM – Population Health 7 (2019): 100374, https://doi.org/10.1016/j.ssmph.2019.100374. ↩︎
Van Hook, Frisco, and Graham, “Signs of the End of the Paradox? Cohort Shifts in Smoking and Obesity and the Hispanic Life Expectancy Advantage.” ↩︎
National Academies of Sciences, Engineering, and Medicine, Social Isolation and Loneliness in Older Adults: Opportunities for the Health Care System (Washington, DC: The National Academies Press, 2020). ↩︎
Alexandra Killewald and Brielle Bryan, “Falling Behind: The Role of Inter- and Intragenerational Processes in Widening Racial and Ethnic Wealth Gaps through Early and Middle Adulthood,” Social Forces 97, no. 2 (2018): 705–40. ↩︎
Tyson H. Brown, “Diverging Fortunes: Racial/Ethnic Inequality in Wealth Trajectories in Middle and Late Life,” Race and Social Problems 8, no. 1 (2016): 29–41, https://doi.org/10.1007/s12552-016-9160-2. ↩︎
Ling Na et al., “Activity Limitation Stages Are Associated With Risk of Hospitalization Among Medicare Beneficiaries,” PM and R 9, no. 5 (2017): 433–43, https://doi.org/10.1016/j.pmrj.2016.09.008. ↩︎
Jibby E. Kurichi et al., “Predicting 3-Year Mortality and Admission to Acute-Care Hospitals, Skilled Nursing Facilities, and Long-Term Care Facilities in Medicare Beneficiaries,” Archives of Gerontology and Geriatrics 73 (2017): 248–56, https://doi.org/10.1016/j.archger.2017.08.005. ↩︎
Bjoern Suckow et al., “Hemoglobin A1c Testing and Amputation Rates in Black, Hispanic, and White Medicare Patients,” Annals of Vascular Surgery 36 (2016): 208–17, https://doi.org/10.1016/j.avsg.2016.03.035. ↩︎
Laura L. Hall et al., “A Map of Racial and Ethnic Disparities in Influenza Vaccine Uptake in the Medicare Fee-for-Service Program,” Advances in Therapy 37, no. 5 (2020): 2224–35, https://doi.org/10.1007/s12325-020-01324-y. ↩︎
Rebecca Skloot, The Immortal Life of Henrietta Lacks (Crown Publishing Group, 2010). ↩︎
A new issue brief shows where Americans typically get flu vaccines in the U.S. and how much it costs to administer flu and other vaccines. Among the analysis’ findings: while most people get flu vaccines at a doctor’s office or retail health clinic, White people are more likely than Black, Hispanic, Asian, and American Indian or Alaska Native adults to get vaccinated through a retail pharmacy or store – a discrepancy could have implications for the COVID-19 vaccine rollout.
The issue brief is available in full on the Peterson-KFF Health System Tracker, an online information hub dedicated to monitoring and assessing the performance of the U.S. health system.
People with medical conditions that put them at higher risk of developing serious COVID-19 illness are next in line to get vaccinated in many states, though states are making very different choices about how to prioritize those within this large group, finds a KFF analysis of state policies.
The U.S. Centers for Disease Control and Prevention (CDC) estimates that there are 81 million adults nationwide with conditions that it identifies as posing an increased risk of severe illness from COVID-19 and are therefore recommended to be prioritized for vaccination. This represents a substantial portion of the nation’s population and, with vaccine supply still limited, not all eligible people will be able to get vaccinated immediately. In addition, there are likely millions of others with a second set of medical conditions that the CDC says might put people at increased risk.
Among states that have released detailed information about how they are prioritizing people with high-risk conditions, 14 include all the conditions identified by the CDC as posing an increased risk in this priority group, while most other states vary from the CDC’s priorities, either limiting the high-risk conditions included, adding other conditions considered from the possible risk factor list, or creating their own list altogether. To date, 14 states have not yet shared their list of conditions or allude more generally to “high risk conditions” without detailing them.
The analysis finds:
As of Feb. 15, 17 states had opened up vaccine eligibility in part or in full to people with high-risk conditions, though additional states are expected to do so over the next few weeks.
Almost all states that list eligible conditions or rely on the CDC’s list of increased-risk conditions include cancer, chronic kidney disease, chronic obstructive pulmonary disease, heart conditions, organ transplant, sickle cell disease, and Type 2 diabetes in their priority populations. There is less consistency for other increased-risk conditions, including obesity (29 states), pregnancy (27), and smoking (16).
Six states also include all the conditions that might put people at an increased risk, while others include only some in their priority group. The most common conditions included are Type 1 diabetes (22) followed by immunocompromised state (19) and pulmonary fibrosis (16).
Most states do not provide detail on if or how eligibility will be confirmed. For those that do, most say they will rely on an individual’s self-attestation that they have a priority condition.
“Currently, if you have a major medical condition like cancer or kidney disease or COPD, how soon you have a chance to get vaccinated clearly depends on what state you live in”, KFF President and CEO Drew Altman said.
The wide variety in state approaches to prioritizing people with high-risk medical conditions mirrors their approaches with other phases of the vaccine rollout, resulting in different prioritization and eligibility across states and posing challenges for residents hoping to learn when they may be eligible.
In his column, Drew Altman shows why vaccine hesitancy will naturally decrease as more and more people see their family members and friends vaccinated without adverse consequences. He writes, “As vaccine hesitancy diminishes, efforts can focus most on the groups most likely to be persistently vaccine resistant, including in the Black community and rural America.”
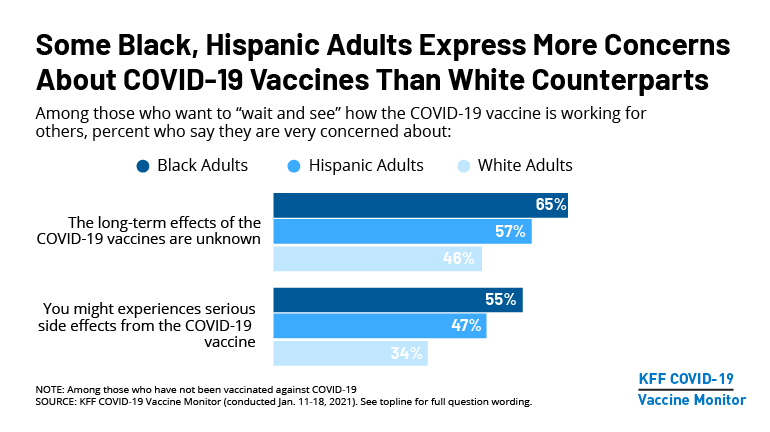
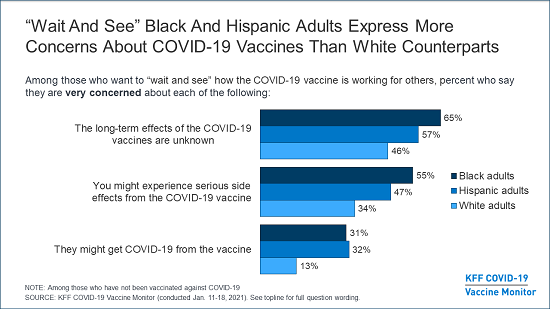
Vaccine Monitor reports that nearly a third of the public wants to “wait and see” how COVID-19 vaccines work before getting one, examining how this group’s views vary by party ID and race/ethnicity in ways that could influence effective messaging.
Earlier this week a report looked at the public’s response to a series of open-ended questions aimed at better understanding people’s concerns around receiving a COVID-19 vaccine — and the views of the messages and messengers that could affect their willingness to get one. It includes direct quotes from the more than 1,000 people interviewed. This and other COVID-19 Vaccine Monitor content is available via a dashboard.
A KFF analysis finds that most older adults have not yet been vaccinated against the potentially deadly virus in the states reporting this data, as vaccine supplies remain limited and most states have only recently begun to make people 65 and older eligible.
Meanwhile, a new map and tables show who is currently eligible to receive the COVID-19 vaccine in each state by the following categories:
Age,
People with High-Risk Medical Conditions,
People Living in Congregate Settings,
K-12 School Personnel,
Law Enforcement and Public Safety Personnel,
Correctional Facility Inmates and Staff,
Grocery and Food Service Workers,
and Transit Workers.
An updated KFF brief explores what’s known about the pandemic’s impact on people’s mental health and substance use and its implications for Americans’ well-being. Among the conclusions: young adults have been especially hard hit, more women than men are facing mental health challenges, people experiencing job or income losses are at higher risk for problems, essential workers face greater challenges than other workers, and communities of color are disproportionately affected.
With the Biden Administration announcing that vaccines will ship directly to community health centers, a Policy Watch post looks at issues they will need to confront in proposing to use federally qualified centers as key distribution points for the vaccine.
Here are the latest coronavirus stats from KFF’s tracking resources:
Global Cases and Deaths: Total cases worldwide stand at nearly 108 million this week – with an increase of 2.9 million new confirmed cases in the past seven days. There were approximately 85,900 new confirmed deaths worldwide, bringing the total for confirmed deaths to nearly 2.4 million.
U.S. Cases and Deaths: Total confirmed cases in the U.S. approached 27.4 million this week. There was an increase of about 712,300 confirmed cases between Feb. 4 and Feb.11. Approximately 19,500 confirmed deaths in the past week brought the total in the United States to 475,400.
Updated: The Implications of COVID-19 for Mental Health and Substance Use (News Release, Issue Brief)
At This Early Stage of the COVID-19 Vaccine Roll-Out, Most Older Adults Have Not Yet Been Vaccinated As Supply Remains Limited (News Release, Issue Brief)
Seeing Others Vaccinated May Be The Best Cure For Vaccine Hesitancy (Full Column, Axios Column)
Biden Wants to Partner with Health Centers to Promote More Equitable Access to COVID-19 Vaccines (Policy Watch)
Nearly a third (31%) of the public says they want to “wait and see” how a COVID-19 vaccine works for others before they would get it, representing a critical group for efforts aimed at boosting vaccinations.
The latest analysis from the KFF COVID-19 Vaccine Monitor highlights how attitudes differ by partisan identification and race and ethnicity in ways that could affect what vaccination messages are most persuasive to subgroups. For example:
Republicans and Republican-leaning independents in the “wait and see” group are more likely to believe that the threat posed by COVID-19 is exaggerated and that vaccination is a personal choice. Messages that focus on how getting vaccinated can protect people’s own health and the health of their families may resonate more with Republican audiences than those that emphasize the seriousness of the pandemic or the broader societal benefits.
Black and Hispanic adults who want to “wait and see” are more likely than White adults to worry that someone in their family will get sick from COVID-19 and to express concern about serious side effects. About 3 in 10 also say they are “very concerned” that they could get COVID-19 from a vaccine, suggesting an opportunity to correct misperceptions about how the vaccine works among this group.
Available through the Monitor’s online dashboard, the new analysis also examines how different subgroups in the “wait and see” group respond to messages and information about vaccination and which sources of vaccine information they most trust.
The KFF COVID-19 Vaccine Monitor is an ongoing research project tracking the public’s attitudes and experiences with COVID-19 vaccinations. Using a combination of surveys and qualitative research, this project tracks the dynamic nature of public opinion as vaccine development and distribution unfolds, including vaccine confidence and hesitancy, trusted messengers and messages, as well as the public’s experiences with vaccination.