Assessing the Role of Treaties, Conventions, Institutions, and Other International Agreements in the Global COVID-19 Response: Implications for the Future

Authors: Anna Rouw, Adam Wexler, Jennifer Kates, Kate Toole, Anjali Britto, and Rebecca Katz
Published: Jan 24, 2023

Key Findings

The COVID-19 pandemic has tested global health governance and international law in unprecedented ways, revealing weaknesses and gaps in the existing global health security architecture and fueling debate over how to strengthen global governance of disease. In December of 2021, the World Health Assembly (WHA) agreed to launch a process to develop a new international agreement on pandemic prevention, preparedness and response, with at least an initial outcome expected in 2024. To date, there has been no detailed examination of existing global health treaties, commitments, partnerships, organizations, and other global health agreements (hereafter referred to as “agreements”) to identify gaps and potential areas of collaboration moving forward. To help inform these discussions, we reviewed existing agreements to assess their potential role in pandemic preparedness and response efforts, and whether they were used to respond to COVID-19. Key findings are as follows:

  • 71 agreements were identified as having a role in global health. These agreements, some of which are more than 100 years old and others that were established only recently, address a wide range of areas including diseases (HIV, malaria, tuberculosis, etc.), vulnerable populations (children, women, refugees, etc.), the environment, and trade/intellectual property, among others.
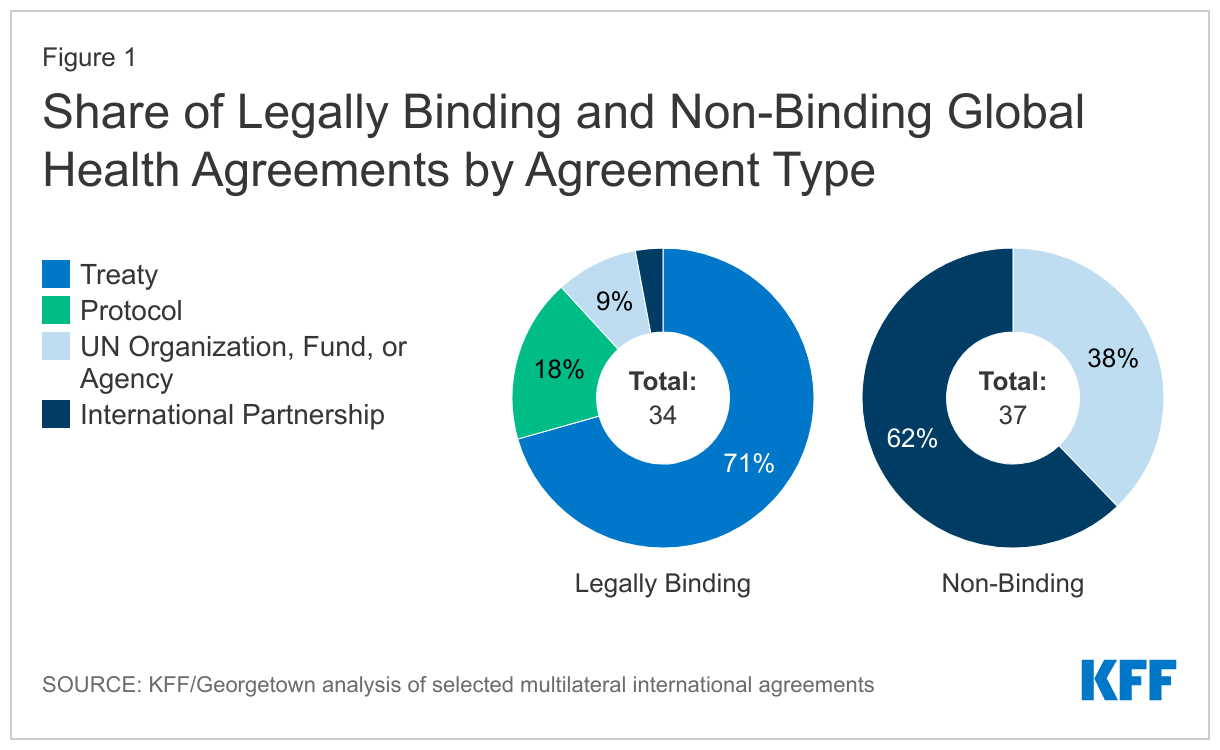
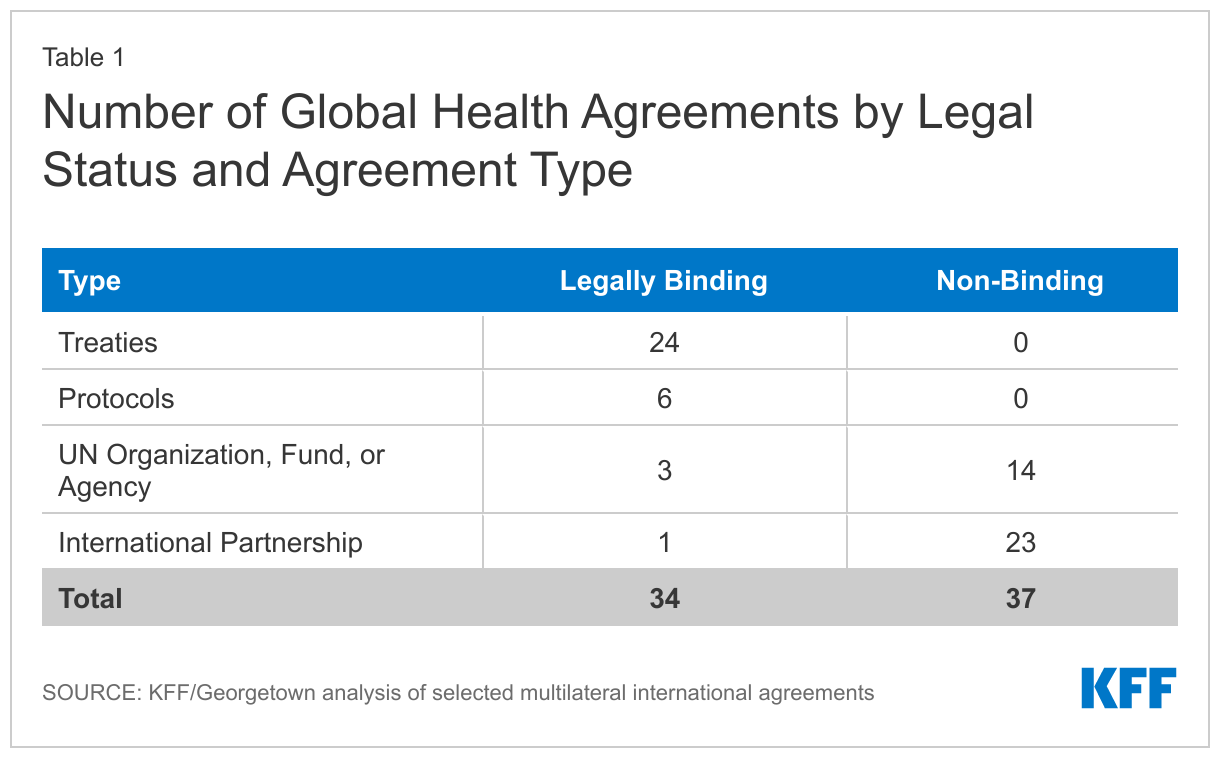
  • Nearly half (34) of these agreements are binding under international law. Legally binding agreements are those intended to create enforceable legal obligations in the international arena on their parties.1  The 34 binding agreements include treaties, protocols (which are associated with existing treaties), and the terms of memberships in some United Nations (UN) entities such as the World Health Organization (WHO). The remaining 37 agreements, while not legally binding, may confer obligations and commitments upon participating countries.
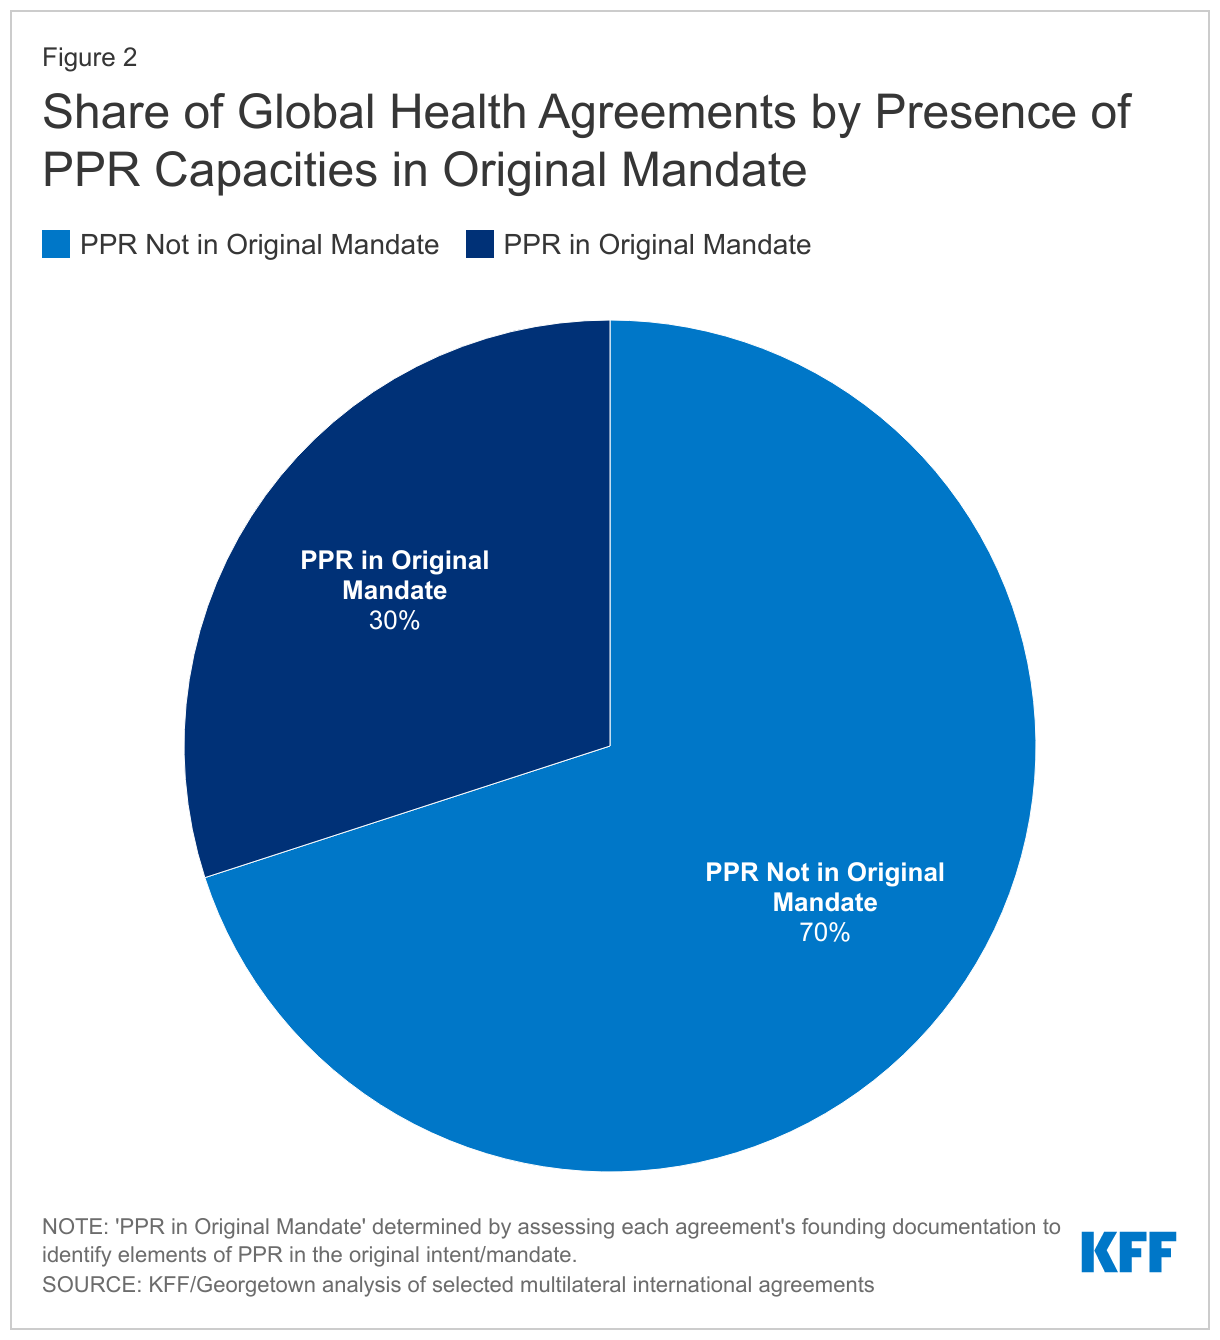
  • Less than one-third (21 or 30%) of the agreements have pandemic preparedness and response (PPR) as part of their original mandate. Of these 21 agreements, 9 are legally binding under international law.
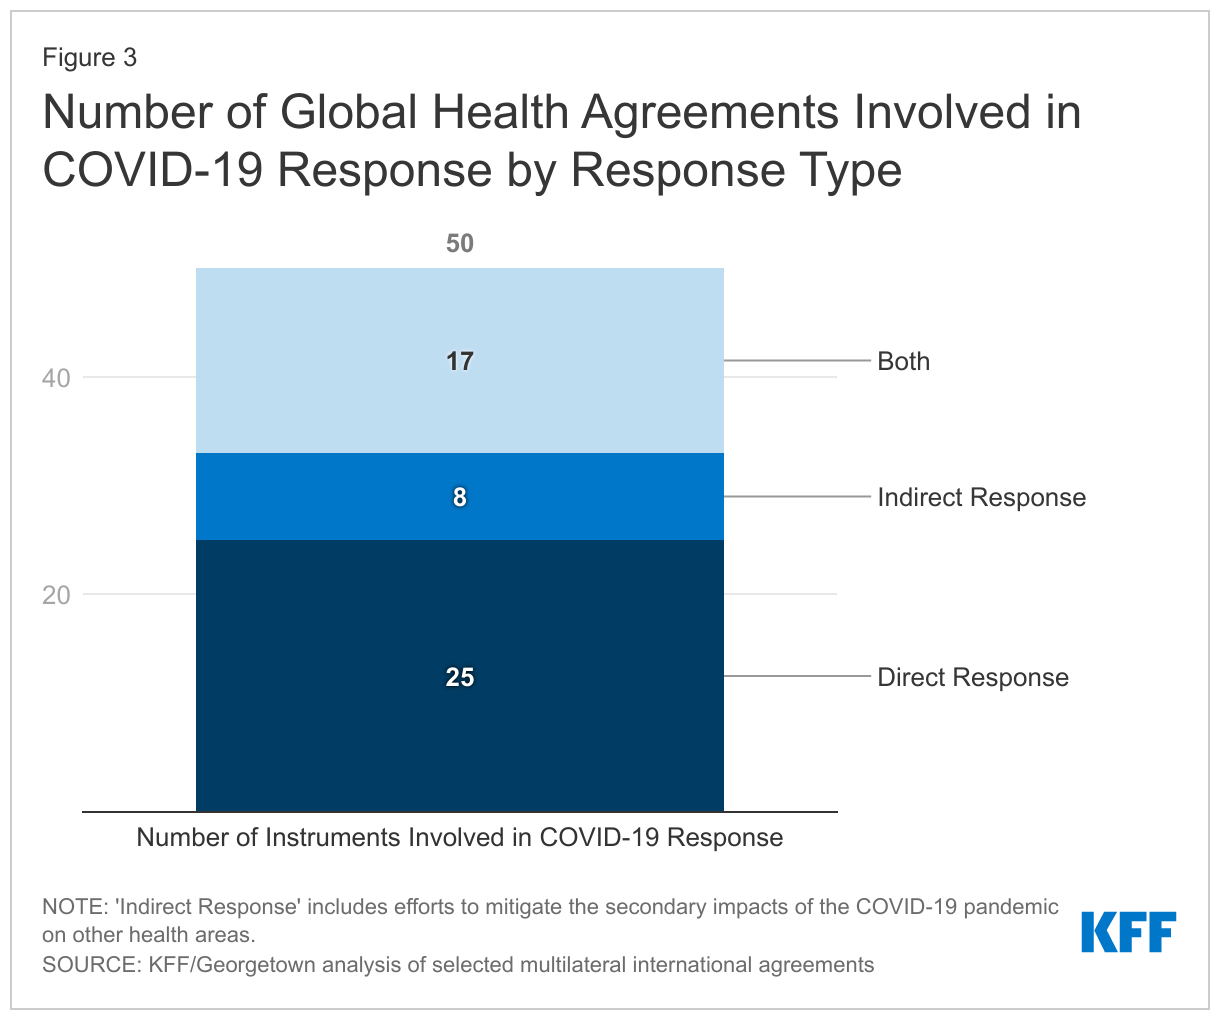
  • Still, most (50 or 70%) of these agreements participated in the COVID-19 response. They were either involved directly (25), via activities specifically aimed at addressing the pandemic, indirectly (8), through activities that addressed the impacts of the pandemic on other health areas, or some combination of both (17). Thirty-six did not have PPR in their original mandate but either adapted existing efforts or started new activities to address the pandemic.
  • The 71 agreements identified in this review could play a key role in the next phase of pandemic preparedness and response, including many that did not have PPR in their original mandate. As the global community considers a new international instrument to help prepare for and respond to future pandemics, our analysis finds that many of the existing agreements were mobilized to address COVID-19 and others have PPR as part of their original mandate. The extent to which these existing agreements could be part of future preparedness efforts remains to be seen but further research could help to highlight whether additional strengthening or further adaptation is needed, as well as highlight gaps that may persist.

Introduction

The COVID-19 pandemic tested global health governance and international law in unprecedented ways, revealing weaknesses and gaps in the existing global health security architecture and fueling debate over how to strengthen global governance of disease. Starting in late 2020, nations and expert groups began discussing the potential need for a new international agreement addressing pandemic preparedness and response (PPR). In December 2021, the World Health Assembly (WHA) agreed to launch a process to develop such an agreement. As part of this process, the WHA has established an Intergovernmental Negotiating Body (INB) “to draft and negotiate a WHO convention, agreement or other international agreement on pandemic prevention, preparedness and response” with an outcome for consideration expected in 2024. At its meeting held in July 2022, INB members agreed that at least some elements of the new international pandemic agreement should be legally-binding, although this decision is not yet final. The INB recently released a draft of the agreement which lays out a proposed governance structure for the new agreement as well as the PPR activities parties may be expected to undertake, such as improving supply chains and logistics networks, supporting information sharing and technology transfer, increasing research and development capabilities, and strengthening health systems and workforce. However, final text is not expected until 2024.

To help inform the current conversation, we reviewed existing international global health agreements (e.g. International Health Regulations), organizational charters (e.g., World Health Organization; Global Fund to Fight AIDS, Tuberculosis and Malaria; etc.), and institutions that have issued declarations addressing global health issues (e.g., World Bank, G7, G20, etc.) to assess their role in pandemic preparedness and response efforts, including whether they have played a role in the COVID-19 response, to help identify existing gaps and potential areas of collaboration with other organizations in the PPR space. This analysis builds on work researchers at KFF and Georgetown University conducted more than a decade ago exploring U.S. involvement in international health treaties and other global health organizations. For this analysis, we confirmed whether the agreements included in our original analysis were still active and identified additional agreements that should be included (e.g., those that have taken on a greater role in health or were created since the original paper was published). We assessed the extent to which each agreement has been involved in the COVID-19 response (either directly or indirectly) and/or possessed pandemic preparedness and response capacities. We considered agreements to be “directly” involved in the COVID-19 response if they addressed the impacts of COVID itself (e.g., provided medical countermeasures or other COVID-specific support). Agreements considered to be “indirectly” involved were those that sought to address the impacts of COVID on other health areas (e.g., provided support to maintain or reduce the effect of COVID on the response to another communicable disease). We defined agreements broadly to include both those that were legally-binding as well as non-binding agreements, partnerships, and the charters establishing United Nations entities and formally established global institutions (see Methodology for more detail).

Findings

Overall, we identified 71 global health agreements, including 46 that were included in our original analysis.2  An additional 13 were already established but had not been originally included (they had taken on a greater role in health) and 12 were more recently created. The earliest agreement was established in 1902 (the Pan American Health Organization, originally the Pan-American Sanitary Bureau) and the most recent in 2021 (The Treaty of the African Medicines Agency). They span a range of focus areas, including diseases (HIV, malaria, tuberculosis, etc.), vulnerable populations (children, women, refugees, etc.), the environment, and trade/intellectual property, among others, and have varying levels of enforcement power and strength. Though a minority of the agreements reviewed had PPR in their original mandate, most were utilized in the COVID-19 response in some way, with many organizations taking on new roles to do so. Our specific findings are as follows:

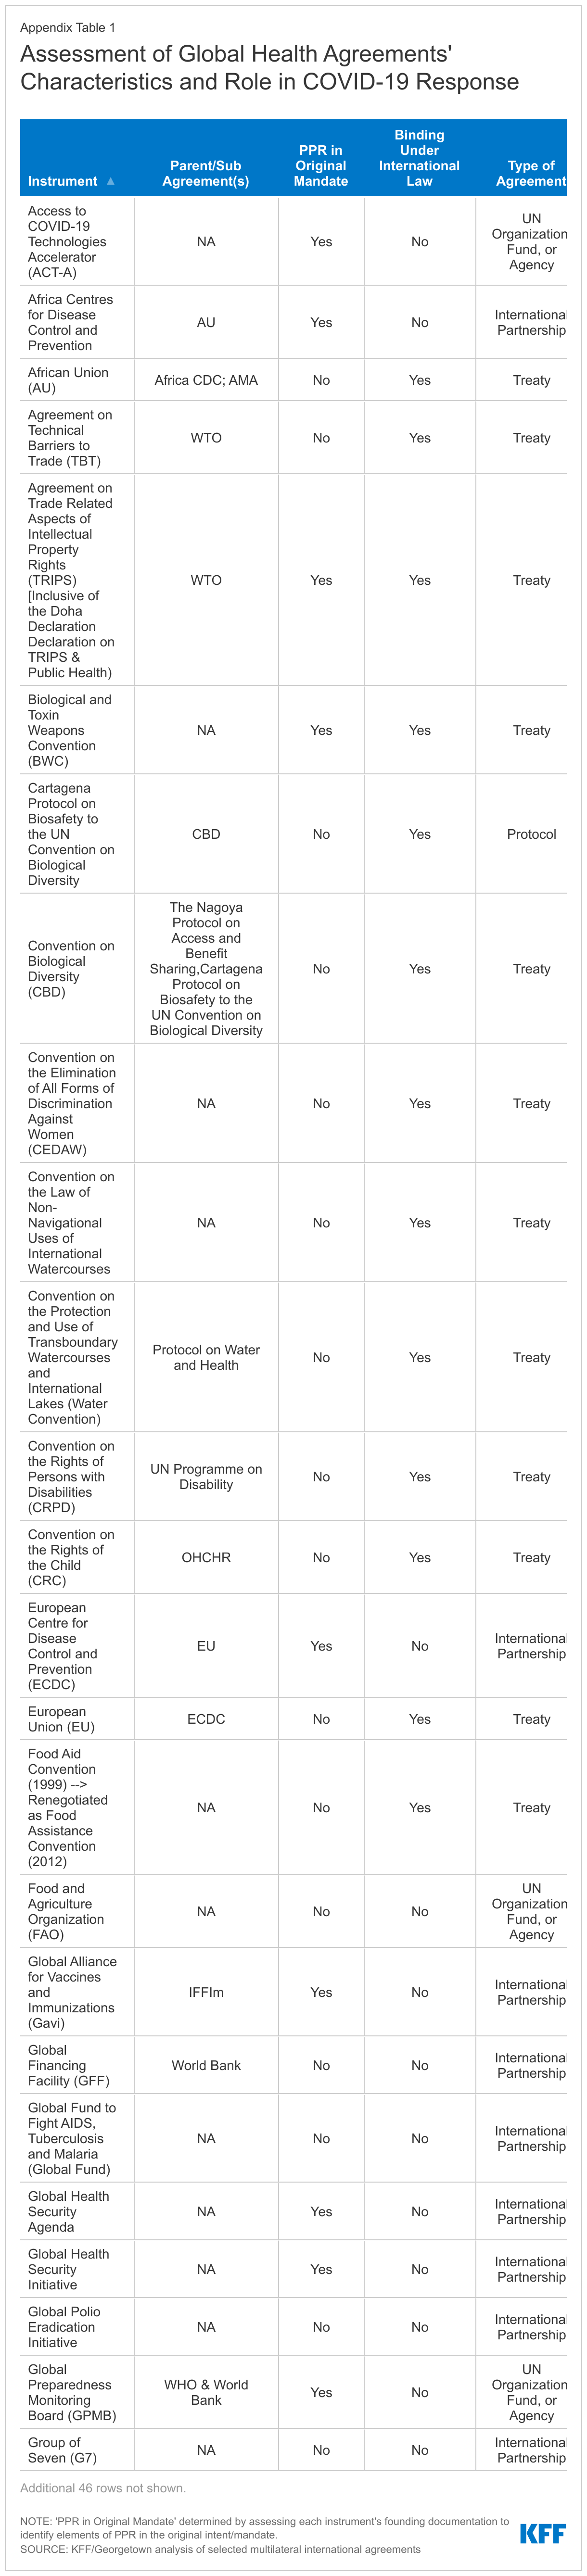
  • Nearly half (34) of the 71 agreements reviewed are legally-binding under international law (see Figure 1). These include 24 treaties, 6 protocols (which are associated with existing treaties), 3 United Nations organizations, funds, or specialized agencies (WHO, WTO, and WIPO), and one other international agreement (OECD) (see Table 1). Treaties include trade-related agreements under the World Trade Organization (WTO), which are binding under international law for WTO member countries, membership in international health organizations such as the World Health Organization (WHO) and the Pan American Health Organization (PAHO), and other legally binding agreements such as the International Health Regulations (2005)3 . Protocols include many of the agreements focused on environmental issues such as the Kyoto and Nagoya protocols.
  • The remaining 37 agreements are not legally-binding under international law, but include agreements that confer obligations on members, including participation in organizations with global health mandates. Most of these (23) are “international partnerships”, which include initiatives such as the Sustainable Development Goals (SDGs) and Universal Health Coverage (UHC) 2030, as well as formal institutional arrangements of regional member states, such as the Africa Centres for Disease Control and Prevention (CDC), and broader alliances such as the Group of Seven (G7), Group of Twenty (G20), and North American Leaders’ Summit (NALS). “United Nations organizations, funds, or agencies” made up the remainder (14) and include entities such as the United Nations Environmental Programme (UNEP), United Nations Children’s Fund (UNICEF), and United Nations Population Fund (UNFPA).
Share of Legally Binding and Non-Binding Global Health Agreements by Agreement Type
Number of Global Health Agreements by Legal Status and Agreement Type

PPR in Original Mandate

  • Of the 71 agreements examined, 21 (30%) included PPR, in some capacity, as part of their original mandate (see Figure 2). For example, the International Health Regulations (IHR) (2005) require countries to possess certain capacities around PPR, including detecting, assessing, reporting, and responding to public health emergencies. The Africa CDC’s agreement obligates the body to work with member countries to build disease surveillance systems capable of identifying health threats and to provide response support during health emergencies. Similarly, the European Centre for Disease Control and Prevention’s founding documents outline a surveillance and response strategy for emerging health threats. The Agreement on Trade Related Aspects of Intellectual Property Rights (TRIPS) and the accompanying Doha Declaration on the TRIPS Agreement and Public Health recognize the gravity of public health emergencies and speak to the potential for intellectual property rights flexibilities in the context of these public health emergencies.
  • Nine of these 21 are legally-binding. These are: The Agreement on the Application of Sanitary and Phytosanitary Measures (SPS Agreement), Biological and Toxin Weapons Convention (BWC); The IHR (2005); The Nagoya Protocol on Access and Benefit-Sharing; The Pan-American Sanitary Code; The Protocol on Water and Health; The TRIPS Agreement; the Treaty of the African Medicines Agency, and the World Health Organization.
Share of Global Health Agreements by Presence of PPR Capacities in Original Mandate

COVID-19 Responses

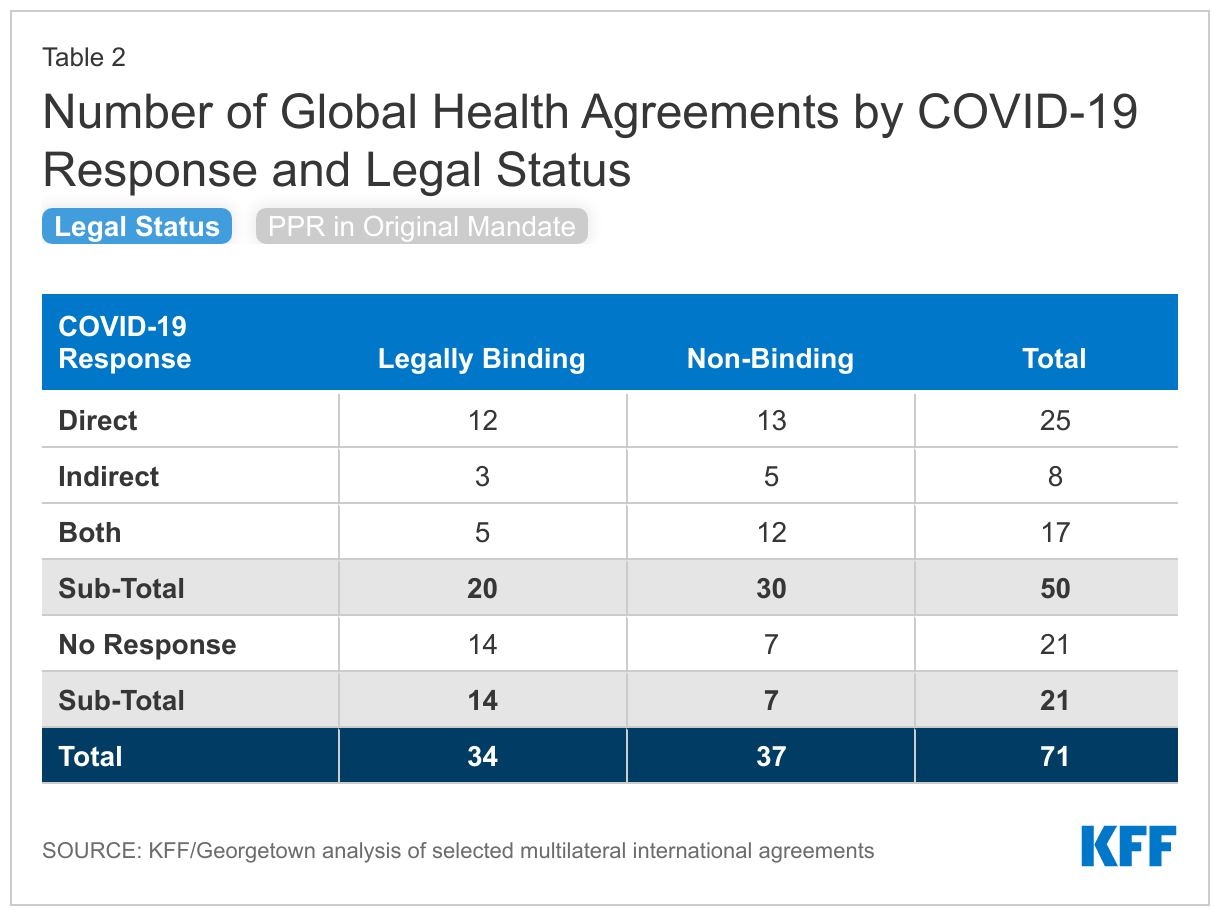
  • Most (50 or 70%) of the agreements reviewed were utilized to respond to the COVID-19 pandemic either directly (25), via activities specifically aimed at addressing the pandemic, indirectly (8), through activities that addressed the impacts of the pandemic on other health areas, or some combination of both (17) (see Figure 3). Twenty-one of these agreements are legally-binding (see Table 2).
  • The 25 agreements that exclusively supported the direct impacts of COVID-19 undertook a range of activities, such as provisioning medical countermeasures, training health care workers, shoring up laboratories and other health systems, and developing new governance mechanisms to coordinate the response. For example, the Access to COVID-19 Tools Accelerator (ACT-A) supported a range of activities focused on addressing the COVID-19 pandemic, including supporting the procurement of diagnostic tools, therapeutics, vaccines, and personal protective equipment, the World Organisation for Animal Health created several expert groups to develop guidelines related to animal health and COVID-19, and the Global Polio Eradication Initiative shifted its efforts to assist in the COVID-19 response by training laboratory workers to detect the virus.
  • Eight addressed only the indirect impacts of COVID-19 on other areas that aligned with their mandates. For example, the Stop TB Partnership issued guidance to help high TB burden countries integrate their TB and COVID-19 testing systems, and the Joint United Nations Programme on HIV/AIDS (UNAIDS) provided guidance on maintaining progress on HIV prevention in the context of the COVID-19 pandemic.
  • Seventeen engaged in both direct and indirect COVID-19 responses. For example, the Global Fund to Fight AIDS, Tuberculosis and Malaria procured COVID-19 diagnostics, treatments, and oxygen for the countries in which it works and set up the COVID-19 Response Mechanism (C19RM) to fund countries’ efforts to mitigate the impacts of COVID-19 on HIV, TB, and malaria; the United Nations World Food Programme supported both the delivery of COVID-19 supplies, such as personal protective equipment (PPE), as well as food assistance to address food insecurity resulting from the pandemic; and the Pan American Health Organization (PAHO) assisted countries in the procurement and delivery of vaccines, as well as provided guidance on maintaining essential health services in the context of COVID-19.
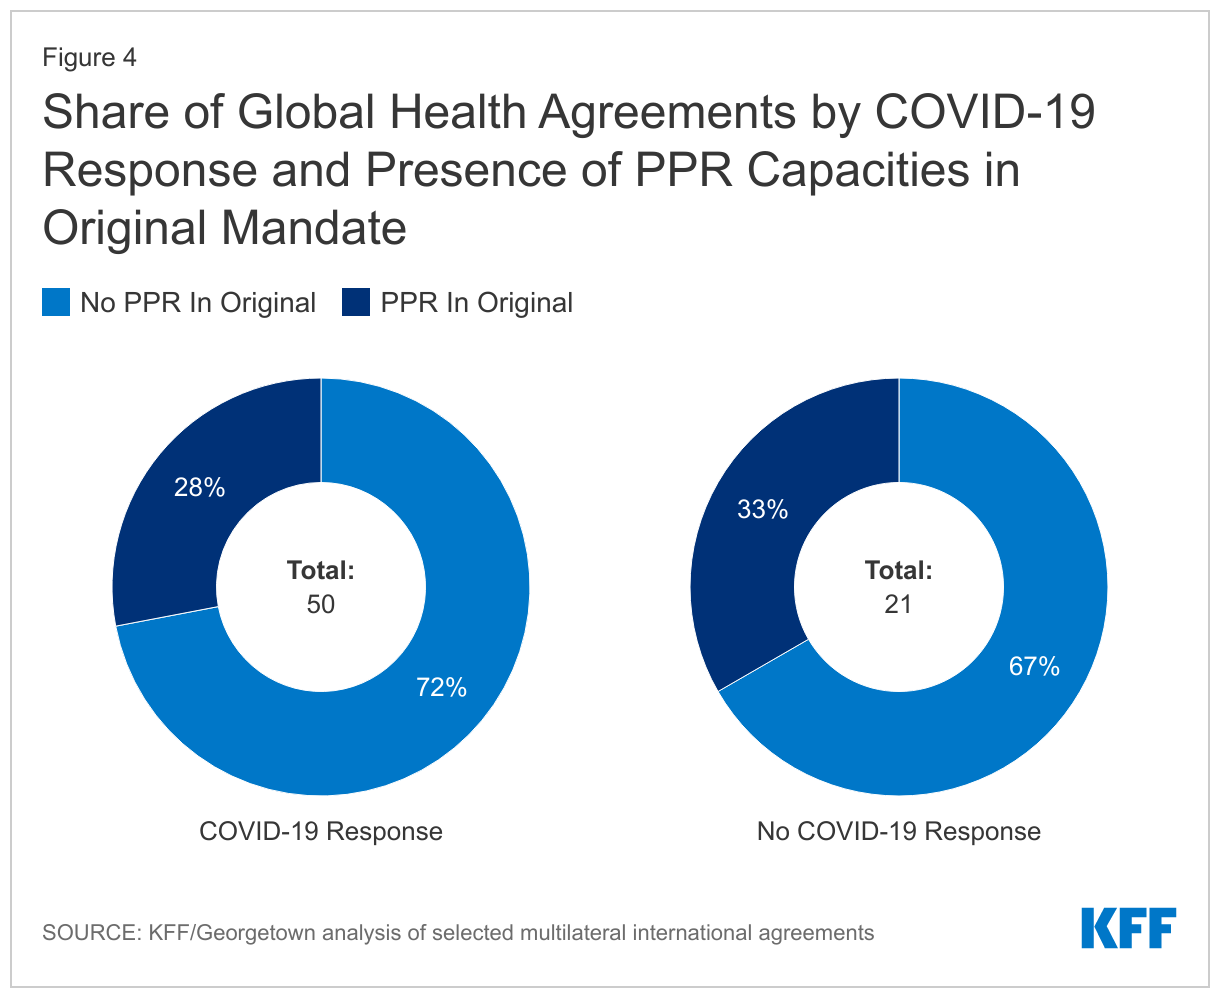
  • Most of the agreements involved in responding to COVID-19 (36 of 50) did not have PPR in their original mandate but adapted to address the pandemic (see Figure 4). These include the Global Fund, which established the COVID-19 Response Mechanism (C19RM) to provide grants to low- and middle-income countries for the purchase of test, treatments, and personal protective equipment (PPEs), and the World Bank, which established the COVID-19 Fast Track Facility and provided support for vaccine rollout.
  • A subset of agreements that were not involved in the COVID-19 pandemic response (7) contain PPR capacities in their original mandate. In some cases, this may be because COVID-19 fell outside their organizational scope (for example, water-borne diseases) or because these agreements were created very recently (for example, the Treaty of the African Medicines Agency).
Number of Global Health Agreements Involved in COVID-19 Response by Response Type
Share of Global Health Agreements by COVID-19 Response and Presence of PPR Capacities in Original Mandate
Number of Global Health Agreements by COVID-19 Response and Legal Status

Discussion

The COVID-19 pandemic has highlighted major gaps in global pandemic preparedness and response capabilities. This analysis outlines the international agreements already involved in pandemic preparedness and response to inform the development of a new pandemic agreement designed to address these gaps. Overall, we find that most of the agreements reviewed (50 of 71) have been involved in addressing the COVID-19 pandemic, either directly or indirectly. Most of these do not have PPR in their original mandate but, rather adapted to address the pandemic. In addition, half of the 71 agreements (34) are legally-binding, including 20 that responded to COVID. This suggests that there are already capacities to address PPR within existing agreements that could potentially be coordinated with a new framework. Importantly, though, this analysis does not attempt to assess the effectiveness of an agreement’s response to COVID-19 or its PPR capabilities more broadly, and future research could seek to do so. In addition, while most of the agreements responding to COVID-19 did so by adapting their work, we did not assess what was required to make such adaptations (e.g., whether new authorizations or mandates were needed). As global leaders continue to pursue the development of a new pandemic instrument, this review may help to identify agreements with existing PPR capabilities, including whether they need strengthening or further adaptation, as well as highlight gaps that may persist.

Methodology

We sought to identify multilateral international treaties, commitments, partnerships, organizations, and other agreements (“agreements”) that were health-specific or had a significant health component.4 

We started with the list of agreements compiled and criteria used for our previous analysis, “U.S. Participation in International Health Treaties, Commitments, Partnerships, and Other Agreements”. Since the original report was completed over a decade ago, we revisited and reviewed the initial list to confirm whether each agreement was still active. We also revisited the sources (listed below) to determine if additional agreements warranted inclusion in this analysis (for example, if they had taken on a greater role in health or were created after the initial analysis). Each agreement was reviewed by multiple members of the team to ensure the accuracy of categorizations.

We analyzed both legally binding and nonbinding agreements and categorized each by type of agreement, and whether components of PPR were present in the agreement’s founding documents.5  Legally binding agreements were compiled based on a review of the Department of State’s required annual report to Congress on all Treaties in Force, the United Nations Treaty Collection, the Library of Congress reference collection on Treaties, the Congressional Research Service, and other reference documents. Nonbinding agreements were compiled based on a desktop review and include multilateral organizations, partnerships, consortia, and other arrangements. As such, the nonbinding list of agreements is comprehensive to the best of our knowledge but may not be exhaustive.

We then assessed each agreement to determine if it was involved in responding to COVID-19 either directly (through actions or the provision of services aimed at addressing the COVID-19 pandemic) or indirectly, to address the secondary effects of the pandemic (e.g., actions or the provision of services aimed at addressing other health-related activities, such as food aid, that have been directly affected by the pandemic). If an agreement was deemed to be “directly” involved in the COVID-19 response, it was automatically included under the PPR categorization. Agreements addressing the “secondary effects” of the COVID-19 response might not necessarily mean they would be involved in PPR activities. As such, there were several that were not involved in the COVID-19 response that were included under the PPR categorization. If an agreement was not deemed to be involved in the COVID-19 response or PPR, it was listed as “Other”. Several agreements resulted from or are directly related to previously established agreements (e.g., the Nagoya Protocol was established following the Convention on Biological Diversity) or are under the auspices of another entity (e.g., WHO manages the implementation of the International Health Regulations). In these instances, the parent agreement is classified as having the same role in the COVID-19 response as the sub-agreements.

Table 3: Agreement Role(s) in Global COVID-19 Response: Definitions
CategoryDefinition
COVID-19 Response
       DirectSupports efforts aimed directly at responding to and mitigating the impacts of the COVID-19 pandemic.
       Secondary EffectsSupports mitigating the potential effects on other health activities resulting from the COVID-19 pandemic.
Pandemic Preparedness & Response (PPR)Manages, directs, or supports efforts to prepare and respond to potential disease outbreaks. If an agreement is categorized as contributing to the COVID-19 response (either direct or secondary effects), it is deemed to also support PPR, but not vice versa.
OtherAims to prevent or reduce the likelihood of virus emerging that could result in a pandemic or aids in the strengthening of country health systems.

Appendix

Assessment of Global Health Agreements' Characteristics and  Role in COVID-19 Response

Anna Rouw, Adam Wexler and Jen Kates are with KFF.Kate Toole, Anjali Britto, and Rebecca Katz are with Georgetown University.

  1. KFF, “U.S. Participation in International Health Treaties, Commitments, Partnerships, and Other Agreements.” September 2010. ↩︎
  2. This total is inclusive of entities that have transformed or been renamed since the last publication (e.g. the International Health Partnership is now Universal Health Coverage 2030). ↩︎
  3. The International Health Regulations (2005) were created under the auspices of another agreement included in this analysis, the WHO Constitution. ↩︎
  4. The United Nations defines multilateral treaties as international agreements concluded between three or more parties, each possessing treatymaking capacity. Parties that have treaty-making capacity include sovereign States as well as international organizations with treaty-making capacity (e.g., the European Union). See: The United Nations Treaty Handbook. Bilateral agreements (country-to-country) were not included in this analysis. ↩︎
  5. See KFF, “U.S. Participation in International Health Treaties, Commitments, Partnerships, and Other Agreements” for categorical definitions on the type of agreement, focus area, and legal status (September, 2010). ↩︎

How Will the Prescription Drug Provisions in the Inflation Reduction Act Affect Medicare Beneficiaries?

Authors: Juliette Cubanski, Tricia Neuman, Meredith Freed, and Anthony Damico
Published: Jan 24, 2023

On August 16, 2022, President Biden signed into law the Inflation Reduction Act of 2022, which includes a broad package of health, tax, and climate change provisions. The law includes several provisions to lower prescription drug costs for people with Medicare and reduce drug spending by the federal government. These provisions will take effect beginning in 2023 (Figure 1). This brief examines the potential impact of these provisions for Medicare beneficiaries nationally and by state.

The Inflation Reduction Act includes two policies that are designed to have a direct impact on drug prices:

  • Requires the federal government to negotiate prices for some high-cost drugs covered under Medicare. Medicare Part D and Part B drug spending is highly concentrated among a relatively small share of covered drugs, mainly those without generic or biosimilar competitors. Under the Inflation Reduction Act, brand-name and biologic drugs without generic or biosimilar equivalents covered under Medicare Part D (retail prescription drugs) or Part B (administered by physicians) that are among the highest-spending Medicare-covered drugs and are nine or more years (small-molecule drugs) or 13 or more years (biologicals) from FDA approval are eligible for negotiation. The number of negotiated drugs is limited to 10 Part D drugs in 2026, another 15 Part D drugs in 2027, another 15 Part B and Part D drugs in 2028, and another 20 Part B and Part D drugs in 2029 and later years.
    • The number of Medicare beneficiaries who will see lower out-of-pocket drug costs in any given year under this provision, and the magnitude of savings, will depend on which drugs are subject to negotiation, the number of Medicare beneficiaries who use those drugs, and the price reductions achieved through the negotiation process relative to prices that would have been applied in the absence of the new law.
  • Requires drug manufacturers to pay rebates to Medicare if they increase prices faster than inflation for drugs used by Medicare beneficiaries. From 2019 to 2020, half of all drugs covered by Medicare had price increases above the rate of inflation over that period (which was 1%, prior to the recent surge in the annual inflation rate), and among those drugs with price increases above the rate of inflation, one-third had price increases of 7.5% or more, the annual inflation rate in early 2022. The inflation rebate provision will be implemented in 2023, using 2021 as the base year for determining price changes relative to inflation. (The legislation originally included drug use by people with private insurance in the calculation of the rebate, but that language was dropped based on a ruling by the Senate parliamentarian that it did not comply with budget reconciliation rules.)
    • The number of Medicare beneficiaries who will see lower out-of-pocket drug costs in any given year and the amount of out-of-pocket savings under this provision will depend on how many beneficiaries use drugs whose prices increase more slowly than would otherwise occur and the magnitude of price reductions relative to baseline prices. For Part B drugs with price increases greater than inflation, beneficiary coinsurance will be based on 20% of the drug’s lower inflation-adjusted price. This provision could have spillover effects on people with private insurance if it results in slower price growth for drugs covered by private insurance.

The Inflation Reduction Act includes several provisions that will reduce out-of-pocket spending for Medicare beneficiaries:

  • Caps Medicare beneficiaries’ out-of-pocket spending under the Medicare Part D benefit, first by eliminating coinsurance above the catastrophic threshold in 2024 and then by adding a $2,000 cap on spending in 2025. The law also limits annual increases in Part D premiums for 2024 to 2030 and makes other changes to the Part D benefit design. Under current law, the catastrophic threshold is based on the amount beneficiaries themselves pay out-of-pocket plus the value of the manufacturer discount on the price of brand-name drugs in the coverage gap phase. In 2022, the catastrophic threshold is set at $7,050, and beneficiaries pay about $3,000 out of pocket for brand-name drugs before reaching the catastrophic coverage phase, where they pay 5% coinsurance on their drugs until the end of the year. Based on current estimates, beneficiary out-of-pocket spending at the catastrophic coverage threshold is estimated to increase from $3,000 in 2022 to roughly $3,100 in 2023 and $3,250 in 2024.
    • In 2020, 1.4 million Medicare Part D enrollees without low-income subsidies had annual out-of-pocket drug spending of $2,000 or more, including 1.3 million enrollees who had spending above the catastrophic coverage threshold (which equaled roughly $2,700 in out-of-pocket costs that year for brand-name drugs alone). (See Table 1 for state-level estimates.) Among these 1.4 million enrollees, most (1.0 million or 69%) spent between $2,000 and $3,000 out of pocket, while roughly 0.3 million (19%) had spending of $3,000 up to $5,000, and 0.2 million (11%) spent $5,000 or more out of pocket.
    • These estimates of how many beneficiaries will be helped by capping out-of-pocket drug spending under Medicare Part D starting in 2024 are conservative because they do not account for expected increases in annual out-of-pocket drug spending between 2020 and 2024/2025, the increase in the number of beneficiaries on Medicare, or higher utilization and spending associated with the increased affordability of prescription drugs due to this benefit improvement.
    • Capping out-of-pocket drug spending under Medicare Part D will be especially helpful for beneficiaries who take high-priced drugs for conditions such as cancer or multiple sclerosis. For example, in 2020, among Part D enrollees without low-income subsidies, average annual out-of-pocket spending for the cancer drug Revlimid was $6,200 (used by 33,000 beneficiaries); $5,700 for the cancer drug Imbruvica (used by 21,000 beneficiaries); and $4,100 for the MS drug Avonex (used by 2,000 beneficiaries).
  • Limits cost sharing for insulin to $35 per month for people with Medicare, beginning in 2023, including covered insulin products in Medicare Part D plans, beginning January 1, 2023, and for insulin furnished through durable medical equipment under Medicare Part B, beginning July 1, 2023. (A provision to limit monthly insulin copays for people with private insurance did not receive the 60 votes needed to remain in the bill after being ruled out of compliance with reconciliation rules by the parliamentarian and was removed from the legislation prior to passage.)
    • 3.3 million Medicare Part D enrollees used an insulin product in 2020 (the most recent data available), including 1.7 million enrollees without low-income subsidies who spent $54 on average per insulin prescription that year. The number of Medicare beneficiaries who will pay less out of pocket for insulin beginning in 2023 will depend in part on whether they are currently enrolled in a Part D plan that is participating in an Innovation Center model in which participating plans cover selected insulin products at a monthly copayment of $35.
  • Eliminates cost sharing for adult vaccines covered under Medicare Part D, as of 2023, and improves access to adult vaccines under Medicaid and CHIP.
    • 4.1 million Medicare beneficiaries received a vaccine covered under Part D in 2020, including 3.6 million who received the vaccine to prevent shingles. (See Table 1 for state-level estimates.)
    • The Medicaid and CHIP provision improves vaccine coverage for Medicaid-enrolled adults because vaccine coverage is optional and varies by state. According to a recent survey, half of states (25) did not cover all vaccines recommended by the Advisory Committee on Immunization Practices (ACIP) in 2018–2019, and 15 of 44 states responding to the survey imposed cost sharing requirements on adult vaccines.
  • Expands eligibility for full Part D Low-Income Subsidies (LIS) in 2024 to low-income beneficiaries with incomes up to 150% of poverty and modest assets and repeals the partial LIS benefit currently in place for individuals with incomes between 135% and 150% of poverty. Beneficiaries receiving partial LIS benefits typically pay some portion of the Part D premium and standard deductible, 15% coinsurance, and modest copayments for drugs above the catastrophic threshold, while those receiving full LIS benefits pay no Part D premium or deductible and only modest copayments for prescription drugs until they reach the catastrophic threshold, when they face no cost sharing.
    • 0.4 million Medicare beneficiaries received partial LIS benefits in 2020. Annual out-of-pocket costs for these beneficiaries could fall by close to $300, on average, under the new law, based on the difference between average out-of-pocket drug costs for LIS enrollees receiving full benefits versus partial benefits in 2020. (See Table 1 for state-level estimates.)
    • This provision will benefit low-income Black and Hispanic Medicare beneficiaries in particular, who are more likely than white beneficiaries to have incomes between 135% and 150% of poverty.

    The Inflation Reduction Act also includes a provision to further delay implementation of the Trump Administration’s drug rebate rule until 2032, rather than take effect in 2027. The rebate rule would eliminate the anti-kickback safe harbor protections for prescription drug rebates negotiated between drug manufacturers and pharmacy benefit managers (PBMs) or health plan sponsors in Medicare Part D. This rule was estimated to increase Medicare spending and premiums paid by beneficiaries.

    Discussion

    High and rising drug prices are a top health care affordability concern among the general public, with large majorities of Democrats and Republicans favoring policy actions to lower drug costs. Provisions in the Inflation Reduction Act are expected to lower out-of-pocket spending by people with Medicare and lower drug spending by the federal government. Prior to consideration by the Senate, CBO estimated the prescription drug provisions would reduce the federal deficit by $288 billion over 10 years (2022-2031). CBO has not yet released a final estimate of budget effects that reflect changes made to the legislation before final passage, such as the $35 per month limit on cost sharing for insulin for people with Medicare and the removal of the provision that applied the inflation rebate to prescription drug use by people with private insurance.

    The prohibition against the federal government negotiating drug prices was a contentious provision of the Medicare Modernization Act of 2003, the law that established the Medicare Part D program, and lifting this prohibition has been a longstanding goal for many Democratic policymakers. The pharmaceutical industry has argued that allowing the government to negotiate drug prices would stifle innovation. CBO has estimated that 15 out of 1,300 drugs, or 1%, would not come to market over the next 30 years as a result of the drug provisions in the reconciliation legislation.

    The requirement for drug companies to pay rebates for price increases faster than inflation will help to limit annual increases in drug prices for people with Medicare and possibly also those with private insurance. While it is possible that drug manufacturers may respond to the inflation rebates by increasing launch prices, overall, this provision is expected to limit out-of-pocket drug spending growth and put downward pressure on premiums by discouraging drug companies from increasing prices faster than inflation.

    Capping Medicare beneficiaries’ out-of-pocket spending under the Medicare Part D benefit – first by eliminating coinsurance above the catastrophic threshold in 2024 and then by adding a $2,000 cap on spending in 2025 – will be the first major change to the Medicare Part D benefit since 2010, when lawmakers included a provision in the Affordable Care Act to close the so-called Part D “donut hole.” A cap on out-of-pocket drug spending for Medicare Part D enrollees will provide substantial financial protection to people on Medicare with high out-of-pocket drug costs. This includes Medicare beneficiaries who take just one very high-priced specialty drug for medical conditions such as cancer, hepatitis C, or multiple sclerosis and beneficiaries who take a handful of relatively costly brand or specialty drugs to manage their medical conditions.

    Number of Medicare Beneficiaries Who Could Be Affected By Prescription Drug Provisions in the Inflation Reduction Act, By State

    This work was supported in part by Arnold Ventures. KFF maintains full editorial control over all of its policy analysis, polling, and journalism activities.Juliette Cubanski, Tricia Neuman, and Meredith Freed are with KFF. Anthony Damico is an independent consultant.

Explaining the Prescription Drug Provisions in the Inflation Reduction Act

Published: Jan 24, 2023

The Inflation Reduction Act of 2022, signed into law by President Biden on August 16, 2022, includes several provisions to lower prescription drug costs for people with Medicare and reduce drug spending by the federal government. This legislation has taken shape amidst strong bipartisan, public support for the government to address high and rising drug prices. CBO estimates that the drug pricing provisions in the law will reduce the federal deficit by $237 billion over 10 years (2022-2031).

The prescription drug provisions included in the Inflation Reduction Act will:

This brief summarizes these provisions and discusses the expected effects on people, program spending, and drug prices and innovation.

Require the Federal Government to Negotiate Prices for Some Drugs Covered Under Medicare

Under the Medicare Part D program, which covers retail prescription drugs, Medicare contracts with private plan sponsors to provide a prescription drug benefit. The law that established the Part D benefit included a provision known as the “noninterference” clause, which stipulates that the HHS Secretary “may not interfere with the negotiations between drug manufacturers and pharmacies and PDP [prescription drug plan] sponsors, and may not require a particular formulary or institute a price structure for the reimbursement of covered part D drugs.” In addition, the Secretary of HHS does not currently negotiate prices for drugs covered under Medicare Part B (administered by physicians). Instead, Medicare reimburses providers based on a formula set at 106% of the Average Sales Price (ASP), which is the average price to all non-federal purchasers in the U.S, inclusive of rebates (other than rebates paid under the Medicaid program).

The Part D non-interference clause has been a longstanding target for some policymakers because it has limited the ability of the federal government to leverage lower prices, particularly for high-priced drugs without competitors. Medicare Part D and Part B drug spending is highly concentrated among a relatively small share of covered drugs, mainly those without generic or biosimilar competitors. A recent KFF Tracking Poll finds large majorities support allowing the federal government to negotiate drug prices and this support holds steady even after the public is provided with the arguments that were made for and against this proposal.

Provision Description

The Inflation Reduction Act amends the non-interference clause by adding an exception that requires the Secretary of HHS to negotiate prices with drug companies for a small number of single-source brand-name drugs or biologics without generic or biosimilar competitors that are covered under Medicare Part D (starting in 2026) and Part B (starting in 2028). Under the new Drug Price Negotiation Program, the number of drugs selected for price negotiation is 10 Part D drugs for 2026, another 15 Part D drugs for 2027, another 15 Part D and Part B drugs for 2028, and another 20 Part D and Part B drugs for 2029 and later years. These drugs will be selected from the 50 drugs with the highest total Medicare Part D spending and the 50 drugs with the highest total Medicare Part B spending. The number of drugs with negotiated prices available will accumulate over time.

Certain categories of drugs are excluded from the negotiation process, including:

  • Drugs that have a generic or biosimilar available
  • Drugs that are less than 9 years (for small-molecule drugs) or 13 years (for biological products) from their FDA-approval or licensure date
  • “Small biotech drugs” (until 2029), defined as those which account for 1% or less of Part D or Part B spending and account for 80% or more of spending under each part on that manufacturer’s drugs
  • Drugs with Medicare spending of less than $200 million in 2021 (increased by the CPI-U for subsequent years)
  • Drugs with an orphan designation as their only FDA-approved indication
  • All plasma-derived products

The legislation also delays selection of biologic drugs for negotiation by up to two years if a biosimilar product is likely to enter the market in that time.

The law establishes an upper limit for the negotiated price (the “maximum fair price”) for a given drug. The limit is the lower of the drug’s enrollment-weighted negotiated price (net of all price concessions) for a Part D drug, the average sales price for a Part B drug, or a percentage of a drug’s average non-federal average manufacturer price: 75% for small-molecule drugs and vaccines more than 9 years but less than 12 years beyond approval; 65% for drugs between 12 and 16 years beyond approval or licensure; and 40% for drugs more than 16 years beyond approval or licensure.

When negotiating the “maximum fair price” for a drug, the HHS Secretary is required to consider the following criteria:

  • The manufacturer’s research and development costs, including the extent to which the manufacturer has recouped these costs
  • The current unit costs of production and distribution
  • Federal financial support for novel therapeutic discovery and development related to the drug
  • Data on pending and approved patent applications, exclusivities, and certain other applications and approvals
  • Market data and revenue and sales volume data in the US
  • Evidence about alternative treatments, including:
  • The extent to which the drug represents a therapeutic advance as compared to existing therapeutic alternatives and the costs of these alternatives
  • Prescribing information for the drug and its therapeutic alternatives
  • Comparative effectiveness of the drug and its therapeutic alternatives, taking into accounts their effects on specific populations, such as individuals with disabilities, the elderly, the terminally ill, children, and other patient populations
  • The extent to which the drug and its therapeutic alternatives address unmet needs for a condition that is not adequately addressed by available therapy.

The law explicitly directs that the HHS Secretary “shall not use evidence from comparative clinical effectiveness research in a manner that treats extending the life of an elderly, disabled, or terminally ill individual as of lower value than extending the life of an individual who is younger, non-disabled, or not terminally ill.”

Part D drugs with negotiated “maximum fair prices” are required to be covered by all Part D plans. Medicare’s payment to providers for Part B drugs with negotiated prices will be 106% of the maximum fair price (rather than the current payment of 106% of the average sales price). (A separate section of the law increases Medicare payments to providers for the administration of biosimilar biologic products to 108% of the average sales price from October 1, 2022 through December 31, 2027.)

An excise tax will be levied on drug companies that do not comply with the negotiation process. The excise tax starts at 65% of a product’s sales in the U.S. and increases by 10% every quarter to a maximum of 95%. As an alternative to paying the tax, manufacturers can choose to withdraw all of their drugs from coverage under Medicare and Medicaid. In addition, manufacturers that refuse to offer an agreed-upon negotiated price for a selected drug to “a maximum fair price eligible individual” (i.e., Medicare beneficiaries enrolled in Part B and/or Part D) or to a provider of services to maximum fair price eligible individuals (such as a physician or hospital) will pay a civil monetary penalty equal to 10 times the difference between the price charged and the maximum fair price.

The timeline for the negotiation process spans roughly two years, although the timeline is modified for 2026, the first year that negotiated prices will be available under this new program (Figure 1). For the 10 Part D drugs with negotiated prices taking effect on January 1, 2026, the list of 10 Part D drugs selected for negotiation will be published on September 1, 2023, based on spending data for the 12-month period from June 1, 2022 to May 31, 2023. The period of negotiation between the Secretary and manufacturers of these drugs will occur between October 1, 2023 and August 1, 2024, and the negotiated “maximum fair prices” will be published no later than September 1, 2024. For 2027, which is an example of timing for a typical year in terms of the timeline for establishing negotiated prices, the list of 15 Part D drugs selected for negotiation will be published on February 1, 2025. The period of negotiation between the Secretary and manufacturers of the selected drugs will occur between February 28, 2025 and November 1, 2025 and the negotiated “maximum fair prices” will be published no later than November 30, 2025. For Part B drugs, the initial period of drug price negotiation between the Secretary and manufacturers of selected drugs will take place between February 28, 2026 and November 1, 2026, with negotiated prices first available in 2028.

Figure 1: Medicare Drug Price Negotiation Timeline for 2026 & 2027

The legislation appropriates funding of $3 billion in fiscal year 2022 for implementing the drug price negotiation provisions over the 2023-2031 period.

Effective Date

Negotiated prices for the first set of selected drugs covered under Part D will be available in 2026. For drugs covered under Part B, the first year negotiated prices will be available is 2028.

People Affected

The provision to allow the Secretary to negotiate drug prices will put downward pressure on both Part D premiums and out-of-pocket drug costs, although the number of Medicare beneficiaries who will see lower out-of-pocket drug costs in any given year under the drug price negotiation program and the magnitude of savings will depend on how many and which drugs are subject to the negotiation process and the price reductions achieved through the negotiations process relative to what prices would otherwise be.

Budgetary Impact

CBO estimates $98.5 billion in Medicare savings over 10 years (2022-2031) from the drug negotiation provisions in the Inflation Reduction Act.

Effects on the Development of New Drugs

CBO estimates that the drug pricing provisions in the Inflation Reduction Act, including but not limited to the new Medicare drug price negotiation program, will have a very modest impact on the number of new drugs coming to market in the U.S. over the next 30 years: 13 fewer out of 1,300, or a reduction of 1% (about 1 fewer drug over the 2023-2032 period, about 5 fewer drugs in the subsequent decade, and about 7 fewer drugs in the decade after that).

Require Drug Manufacturers to Pay Rebates for Price Increases Above Inflation for Drugs Used by People with Medicare

To date, Medicare has had no authority to limit annual price increases for drugs covered under Part B or Part D. In contrast, Medicaid has a rebate system that requires drug manufacturers to provide refunds if prices grow faster than inflation. Year-to-year drug price increases exceeding inflation are not uncommon and affect people with both Medicare and private insurance. Our analysis shows that half of all drugs covered by Medicare had list price increases that exceeded the rate of inflation between 2019 and 2020. A separate analysis by the HHS Office of Inspector General showed average sales price (ASP) increases exceeding inflation for 50 of 64 studied Part B drugs in 2015.

Provision Description

The Inflation Reduction Act requires drug manufacturers to pay a rebate to the federal government if prices for single-source drugs and biologicals covered under Medicare Part B and nearly all covered drugs under Part D increase faster than the rate of inflation (CPI-U). Price changes will be measured based on the average sales price for Part B drugs and the average manufacturer price for Part D drugs. If price increases are higher than inflation, manufacturers will be required to pay the difference in the form of a rebate to Medicare. The rebate amount is equal to the total number of units sold in Medicare multiplied by the amount, if any, by which a drug’s price in a given year exceeds the inflation-adjusted price. For Part B drugs with price increases greater than inflation, beneficiary coinsurance will be based on 20% of the drug’s lower inflation-adjusted price. The base year for measuring cumulative price changes relative to inflation is 2021.

Rebate dollars would be deposited in the Medicare Supplementary Medical Insurance (SMI) trust fund. Manufacturers that do not pay the required rebate amount will face a penalty equal to at least 125% of the original rebate amount.

The legislation appropriates 10-year (2022-2031) funding of $160 million to the Centers for Medicare & Medicaid Services (CMS) for implementing the inflation rebate provisions ($80 million for Part B and $80 million for Part D).

Effective Date

The Part D inflation rebate provision takes effect in 2022, the starting point for measuring drug price increases, with rebate payments required beginning in 2023. The Part B inflation rebate provision takes effect in 2023.

People Affected

These provisions are expected to limit out-of-pocket drug spending growth for people with Medicare and put downward pressure on premiums by discouraging drug companies from increasing prices faster than inflation. The number of Medicare beneficiaries who will see lower out-of-pocket drug costs in any given year resulting from these provisions will depend on how many and which drugs have lower price increases and the magnitude of price reductions relative to what prices would otherwise be.

Budgetary Impact

CBO estimates a net federal deficit reduction of $63.2 billion over 10 years (2022-2031) from the drug inflation rebate provisions in the Inflation Reduction Act. This includes net savings of $56.3 billion ($71.8 billion in savings to Medicare and $0.3 billion in savings for other federal programs, such as DoD, FEHB, and subsides for ACA Marketplace coverage, offset by $15.7 billion in additional Medicaid spending) and higher federal revenues of $6.9 billion.

Effects on Launch Pricing

Drug manufacturers may respond to the inflation rebates by increasing launch prices for drugs that come to market in the future. CBO projects that higher launch prices would primarily affect Medicaid spending. This is because, although the basic Medicaid drug rebate would be larger (since it is calculated as a percentage of the average manufacturer price), the higher Medicaid drug rebates would not offset higher launch prices. According to CBO, Medicare Part D plan sponsors and private insurers would be less affected than Medicaid by higher launch prices because they would still be able to negotiate rebates with drug companies and potentially refuse to cover drugs with very high launch prices. However, they may have less leverage in some instances, such as when there are no therapeutic alternatives available or when drugs are covered under a Part D “protected class”. In addition, if launch prices rise for Part B drugs, the HHS Secretary would have no authority to negotiate lower prices unless and until the new drug meets the criteria for selection for drug price negotiation under the negotiation process described above.

Cap Out-of-Pocket Spending for Medicare Part D Enrollees and Other Part D Benefit Design Changes

Medicare Part D currently provides catastrophic coverage for high out-of-pocket drug costs, but there is no limit on the total amount that beneficiaries pay out of pocket each year. Under the current benefit design, Part D enrollees qualify for catastrophic coverage when the amount that they pay out of pocket plus the value of the manufacturer discount on the price of brand-name drugs in the coverage gap phase exceeds a certain threshold amount. Enrollees with drug costs high enough to exceed the catastrophic threshold are required to pay 5% of their total drug costs above the threshold until the end of the year unless they qualify for Part D Low-Income Subsidies (LIS). In 2022, the catastrophic threshold is set at $7,050, and beneficiaries pay about $3,000 out of pocket for brand-name drugs before reaching the catastrophic coverage phase.

Medicare pays 80% of total costs above the catastrophic threshold (known as “reinsurance”) and plans pay 15%. Medicare’s reinsurance payments to Part D plans now account for close to half of total Part D spending (47%), up from 14% in 2006 (increasing from $6 billion in 2006 to $52 billion in 2021).

Under the current structure of Part D, there are multiple phases, including a deductible, an initial coverage phase, a coverage gap phase, and the catastrophic phase. During the coverage gap benefit phase, enrollees pay 25% of drug costs for both brand-name and generic drugs; plan sponsors pay 5% for brands and 75% for generics; and drug manufacturers provide a 70% price discount on brands (there is no discount on generics). Under the current benefit design, beneficiaries can face different cost-sharing amounts for the same medication depending on which phase of the benefit they are in, and can face significant out-of-pocket costs for high-priced drugs because of coinsurance requirements and no hard out-of-pocket cap.

Provision Description

The Inflation Reduction Act amends the design of the Part D benefit. For 2024, the law eliminates the 5% beneficiary coinsurance requirement above the catastrophic coverage threshold, effectively capping out-of-pocket costs at approximately $3,250 that year. Beginning in 2025, the legislation adds a hard cap on out-of-pocket spending of $2,000, indexed in future years to the rate of increase in per capita Part D costs (Figure 2).

Figure 2: Changes to Medicare Part D for Brand-Name Drug Costs

The law also modifies liability for Medicare Part D plans and drug manufacturers, starting in 2025, and reduces Medicare’s liability for spending above the out-of-pocket cap. Medicare’s share of total costs above the spending cap (“reinsurance”) will decrease from 80% to 20% for brand-name drugs and to 40% for generic drugs. Medicare Part D plans’ share of costs will increase from 15% to 60% for both brands and generics above the cap, and drug manufacturers will be required to provide a 20% price discount on brand-name drugs. The legislation also requires manufacturers to provide a 10% discount on brand-name drugs between the deductible and the annual out-of-pocket spending cap, replacing the 70% price discount in the coverage gap phase under the current benefit design.

The law also provides for an adjustment to the calculation of the base beneficiary premium for 2024 through 2029, limiting premium increases to no more than 6% from the prior year. For 2030, the bill includes a provision to lower the beneficiary share of the cost of standard drug coverage (currently set at 25.5%) to ensure that the premium does not increase by more than 6% from 2029. The legislation also allows Part D enrollees the option of spreading out their out-of-pocket costs over the year rather than face high out-of-pocket costs in any given month.

Effective Date

The Part D benefit redesign provisions take effect beginning in 2024, with the elimination of the 5% coinsurance for catastrophic coverage and the first year of the Part D premium adjustment. Other changes take effect in 2025, including the $2,000 cap on out-of-pocket drug spending, spreading out of costs, and changes to liability for total costs above the spending cap.

People Affected

Medicare beneficiaries in Part D plans with relatively high out-of-pocket drug costs are likely to see substantial out-of-pocket cost savings from these changes. This includes Medicare beneficiaries with spending above the catastrophic threshold due to just one very high-priced specialty drug for medical conditions such as cancer, hepatitis C, or multiple sclerosis and beneficiaries who take a handful of relatively costly brand or specialty medications to manage their medical conditions.

Based on our analysis, 1.4 million Part D enrollees incurred annual out-of-pocket costs for their medications above $2,000 in 2020, averaging $3,355 per person. This estimate includes 1.3 million enrollees who had spending above the catastrophic coverage threshold (which equaled roughly $2,700 in out-of-pocket costs that year for brand-name drugs alone). These estimates are a conservative measure of how many beneficiaries will be helped by capping out-of-pocket drug spending under Medicare Part D starting in 2024 because they do not account for expected increases in annual out-of-pocket drug spending between 2020 and 2024/2025, the increase in the number of beneficiaries on Medicare, or higher utilization and spending associated with the increased affordability of prescription drugs due to this benefit improvement.

Based on their average out-of-pocket spending, these 1.4 million Part D enrollees would have saved $1,355, or 40% of their annual out-of-pocket costs, on average, if a $2,000 cap had been in place in 2020. Part D enrollees with higher-than-average out-of-pocket costs will save substantial amounts with a $2,000 out-of-pocket spending cap. For example, the top 10% of beneficiaries (145,000 enrollees) with average out-of-pocket costs for their medications above $2,000 in 2020 – who spent at least $5,567 – would have saved $3,567 (64%) in out-of-pocket costs with a $2,000 cap.

Capping out-of-pocket drug spending under Medicare Part D will be especially helpful for beneficiaries who take high-priced drugs for conditions such as cancer or multiple sclerosis. For example, in 2020, among Part D enrollees without low-income subsidies, average annual out-of-pocket spending for the cancer drug Revlimid was $6,200 (used by 33,000 beneficiaries); $5,700 for the cancer drug Imbruvica (used by 21,000 beneficiaries); and $4,100 for the MS drug Avonex (used by 2,000 beneficiaries).

With the new hard cap on out-of-pocket spending, it is possible that enrollees could face higher Part D premiums resulting from higher plan liability for drug costs above the spending cap, though these premium increases could be mitigated by the provisions to stabilize premiums between 2024 and 2030. Plans will likely face financial incentives to exercise greater control of costs below the new spending cap, such as through more utilization management or increased generic drug utilization, which could help to limit potential premium increases.

Budgetary Impact

CBO estimates these provisions will increase federal spending by $30 billion over 10 years (2022-2031), which consists of $29.9 billion in higher spending associated with Part D benefit redesign and $0.1 billion in higher spending associated with the provision to spread out out-of-pocket costs.

Limit Cost Sharing for Insulin for People with Medicare

For Medicare beneficiaries with diabetes who use insulin, coverage is provided under Medicare Part D, the outpatient prescription drug benefit, and may also be covered under Part B when used with an external insulin pump. Because Part D plans vary in terms of the insulin products they cover and costs per prescription, what enrollees pay for insulin products also varies. Beneficiary coinsurance under Medicare Part B is 20% of the Medicare-approved amount.

Currently, Medicare beneficiaries can choose to enroll in a Part D plan participating in an Innovation Center model in which enhanced drug plans cover insulin products at a monthly copayment of $35 in the deductible, initial coverage, and coverage gap phases of the Part D benefit. Participating plans do not have to cover all insulin products at the $35 monthly copayment amount, just one of each dosage form (vial, pen) and insulin type (rapid-acting, short-acting, intermediate-acting, and long-acting). In 2022, a total of 2,159 Part D plans are participating in this model, or roughly one third of all Part D plans. Nearly half (45%) of non-LIS enrollees are in PDPs participating in the insulin model in 2022, based on August 2021 enrollment. The model was launched in response to rising prices for insulin, which have attracted increasing scrutiny from policymakers, leading to congressional investigations and overall concerns about affordability and access for people with diabetes who need insulin to control blood glucose levels.

Provision Description

The Inflation Reduction Act limits monthly cost sharing for insulin products to no more than $35 for Medicare beneficiaries, including insulin covered under both Part D and Part B, and no deductible will apply. All Medicare Part D plans, both stand-alone drug plans and Medicare Advantage drug plans, will be required to charge no more than $35 for whichever insulin products they cover, although plans will not be required to cover all insulin products. For 2026 and beyond, the law limits monthly Part D copayments for insulin to the lesser of $35, 25% of the maximum fair price (in cases where the insulin product has been selected for negotiation), or 25% of the negotiated price in Part D plans.

Effective Date

The monthly cap on insulin cost sharing in Medicare takes effect January 1, 2023 for insulin covered under Part D and July 1, 2023 for insulin covered under Part B.

People Affected

A $35 cap on monthly cost sharing for insulin products is expected to lower out-of-pocket costs for insulin users in Medicare Part D without low-income subsidies. In 2020, 3.3 million Medicare Part D enrollees used insulin. Among Medicare Part D insulin users who do not receive low-income subsidies, average out-of-pocket costs per prescription across all insulin products was $54 in 2020 – over 50% more than the $35 monthly copay cap for insulin that will begin in 2023.

According to our analysis of 2019 Part D formularies, a large number of Part D plans placed insulin products on Tier 3, the preferred drug tier, which typically had a $47 copayment per prescription during the initial coverage phase. However, once enrollees reached the coverage gap phase, they faced a 25% coinsurance rate, which equates to $100 or more per prescription in out-of-pocket costs for many insulin therapies, unless they qualified for low-income subsidies. Paying a flat $35 copayment rather than 25% coinsurance or a higher copayment amount could reduce out-of-pocket costs for many insulin products.

Budgetary Impact

CBO estimates additional federal spending of $5.1 billion ($4.8 billion for Medicare Part D and $0.3 billion for Medicare Part B) over 10 years (2022-2031) associated with the insulin cost-sharing limits in the Inflation Reduction Act.

Eliminate Cost Sharing for Adult Vaccines Covered Under Part D and Improve Access to Adult Vaccines in Medicaid and CHIP

Medicare covers vaccines under both Part B and Part D. This separation of coverage for vaccines under Medicare is because there were statutory requirements for coverage of a small number of vaccines under Part B before the 2006 start of the Part D benefit. Vaccines for COVID-19, influenza, pneumococcal disease, and hepatitis B (for patients at high or intermediate risk), and vaccines needed to treat an injury or exposure to disease are covered under Part B. All other commercially available vaccines needed to prevent illness are covered under Medicare Part D.

For the influenza, pneumococcal pneumonia, hepatitis B, and COVID-19 vaccines covered under Medicare Part B, patients currently face no cost sharing for either the vaccine itself or its administration. For other Part B vaccines, such as those needed to treat an injury or exposure to a disease such as rabies or tetanus, Medicare covers 80% of the cost, and beneficiaries are responsible for the remaining 20%. Unlike most vaccines covered under Part B, vaccines covered under Part D can be subject to cost sharing, because Part D plans have flexibility to determine how much enrollees will be required to pay for any given on-formulary drug, including vaccines. (Part D enrollees who receive low-income subsidies (LIS) generally pay relatively low amounts for vaccines and other covered drugs.) Under Part D, cost sharing can take the form of flat dollar copayments or coinsurance (i.e., a percentage of list price).

With regard to Medicaid and CHIP, coverage of adult vaccines is optional and varies by state. According to a recent survey, half of states (25) did not cover all vaccines recommended by the Advisory Committee on Immunization Practices (ACIP) in 2018–2019, and 15 of 44 states responding to the survey imposed cost sharing requirements on adult vaccines.

Provision Description

The Inflation Reduction Act requires that adult vaccines covered under Medicare Part D that are recommended by the Advisory Committee on Immunization Practices (ACIP), such as for shingles, be covered at no cost. This makes coverage of vaccines under Medicare Part D consistent with coverage of vaccines under Medicare Part B, such as the flu and COVID-19 vaccines. The law also requires state Medicaid and CHIP programs to cover all approved adult vaccines recommended by ACIP and vaccine administration, without cost sharing.

Effective Date

These provisions take effect in 2023.

People Affected

Eliminating cost-sharing for adult vaccines covered under Medicare Part D could help with vaccine uptake among older adults and will lower out-of-pocket costs for those who need Part D-covered vaccines. Our analysis shows that in 2020, 4.1 million Medicare beneficiaries received a Part D-covered vaccine, including 3.6 million who received the vaccine to prevent shingles, and aggregate out-of-pocket spending on Part D vaccines was $0.3 billion. In 2018, Part D enrollees without low-income subsidies paid an average of $57 out of pocket for each dose of the shingles shot, which is generally free to most other people with private coverage.

Requiring state Medicaid and CHIP programs to cover all adult vaccines recommended by ACIP without cost sharing is expected to increase access to some adult vaccines under Medicaid. Using a recent survey’s state level data and 2019 adult Medicaid enrollment data, a separate KFF analysis estimates about 4 million adults could gain coverage of at least one or more vaccines.

Budgetary Impact

CBO estimates that these provisions will increase federal spending by $7 billion over 10 years (2022-2031), including $4.4 billion for Medicare and $2.5 billion for Medicaid and CHIP.

Expand Eligibility for Part D Low-Income Subsidies

Provision Description

The Part D Low-Income Subsidy (LIS) Program helps beneficiaries with their Part D premiums, deductibles, and cost sharing, providing varying levels of assistance to beneficiaries at different income and asset levels up to 150% of poverty. Based on data from CMS, in 2020, 13.1 million Medicare beneficiaries received either full or partial LIS benefits, representing 28% of all Part D enrollees that year.

Medicare beneficiaries who are also enrolled in Medicaid, who generally have incomes up to 135% of poverty, automatically receive full LIS benefits. Individuals who do not automatically qualify for LIS can enroll if they meet certain income and asset requirements set by the federal government and can receive full or partial LIS benefits depending on their income and assets. Beneficiaries qualify for full LIS benefits if they have income up to 135% of poverty and resources up to $9,900 individual, $15,600 couple in 2022 (including a $1,500 per person allowance for funeral/burial expenses). Beneficiaries qualify for partial LIS benefits if they have income between 135-150% of poverty and resources up to $15,510 individual, $30,950 couple in 2022.

Beneficiaries who receive full LIS benefits pay no Part D premium or deductible and only modest copayments for prescription drugs until they reach the catastrophic threshold, at which point they face no additional cost sharing. Some beneficiaries who receive partial LIS benefits pay no monthly premium while others pay a partial monthly Part D premium (with subsidies of 75%, 50%, or 25% of the monthly premium, depending on their income); all partial LIS recipients also pay an $89 annual deductible (in 2022), 15% coinsurance up to the out-of-pocket threshold, and modest copayments for drugs above the catastrophic threshold.

The Inflation Reduction Act makes individuals with incomes up to 150% of poverty and resources at or below the limits for partial LIS benefits eligible for full benefits under the Part D Low-Income Subsidy Program. The law eliminates the partial LIS benefit currently in place for individuals with incomes between 135% and 150% of poverty.

Effective Date

Expansion of eligibility for full Part D LIS benefits takes effect in 2024.

People Affected

Providing full Medicare Part D LIS benefits to Part D enrollees with incomes up to 150% of poverty could help an estimated 0.4 million beneficiaries, based on the number of beneficiaries receiving partial LIS benefits in 2020. Annual out-of-pocket drug costs for these beneficiaries could fall by close to $300, on average, based on the difference between average out-of-pocket drug costs for LIS enrollees receiving full benefits versus partial benefits in 2020 – plus additional savings associated with more generous premium subsidies.

These averages understate the potential cost savings for the smaller share of low-income enrollees with extraordinarily high drug costs, such as partial LIS beneficiaries who take high-cost specialty drugs. This is because for high-cost drugs, with total prices in the thousands of dollars, 15% coinsurance can translate into substantial out-of-pocket costs. For example, partial LIS enrollees taking Humira or Enbrel for rheumatoid arthritis would pay around $1,900 for a year’s worth of these medications in 2022, while full LIS enrollees would pay less than $20 annually. Thus, savings for partial LIS enrollees would be roughly $1,900 on cost sharing for one of these medications alone. Annual savings would be similar for other high-cost specialty drugs, with the majority of savings occurring below the catastrophic threshold where partial LIS enrollees currently pay 15% coinsurance but full LIS enrollees pay low flat copays for brand-name drugs of either $3.95 or $9.85, depending on their income and asset levels.

Budgetary Impact

CBO estimates that this provision will increase federal spending by $2.2 billion over 10 years (2022-2031).

Further Delay Implementation of the Trump Administration’s Drug Rebate Rule

Provision Description

The Inflation Reduction Act further delays implementation of the November 2020 final rule issued by the Trump Administration that would have eliminated rebates negotiated between drug manufacturers and pharmacy benefit managers (PBMs) or health plan sponsors in Medicare Part D by removing the safe harbor protection currently extended to these rebate arrangements under the federal anti-kickback statute. This rule was slated to take effect on January 1, 2022, but the Biden Administration delayed implementation to 2023, the Infrastructure Investment and Jobs Act signed into law on November 15, 2021 delayed implementation to 2026, and the Bipartisan Safer Communities Act signed into law on June 25, 2022 included a further delay to 2027.

Effective Date

This provision takes effect in 2027, delaying implementation of the rebate rule until 2032.

People affected

Since the rebate rule never took effect, delaying it is not expected to have a material impact on Medicare beneficiaries. Had the rule taken effect, it was expected to increase premiums for Medicare Part D enrollees, according to both CBO and the HHS Office of the Actuary (OACT). OACT estimated that a small group of beneficiaries who use drugs with significant manufacturer rebates could have seen a substantial decline in their overall out-of-pocket spending under the rule, assuming manufacturers passed on price discounts at the point of sale, but other beneficiaries would have faced out-of-pocket cost increases.

Budgetary Impact

Because the rebate rule was finalized (although not implemented), its cost has been incorporated in CBO’s baseline for federal spending. Therefore, delaying implementation of the rebate rule is expected to generate savings. CBO estimates savings of $122.2 billion from delaying implementation of the Trump Administration’s rebate rule between 2027 (when the Inflation Reduction Act delay takes effect) and 2032. In addition, CBO estimated savings of $50.8 billion between 2023 and 2026 for the three-year delay of this rule included in the Infrastructure Investment and Jobs Act and savings of $20.9 billion in 2026 and 2027 for the one-year delay included in the Bipartisan Safer Communities Act. This is because both CBO and Medicare’s actuaries estimated substantially higher Medicare spending over 10 years as a result of banning drug rebates under the Trump Administration’s rule – up to $170 billion higher, according to CBO, and up to $196 billion higher, according to the HHS Office of the Actuary (OACT).

This work was supported in part by Arnold Ventures. KFF maintains full editorial control over all of its policy analysis, polling, and journalism activities

State Policies for Expanding Medicaid Coverage of Community Health Worker (CHW) Services

Authors: Sweta Haldar and Elizabeth Hinton
Published: Jan 23, 2023

Many states use community health worker (CHW) services to address the health needs of targeted populations, including enrollees with chronic conditions or complex behavioral or physical health needs. Services provided by CHWs may include culturally appropriate health promotion and education, assistance in accessing medical and non-medical services, translation services, care coordination, and social support. Research evidence indicates CHW interventions can be effective in reducing health disparities in communities of color and promoting health equity.1 ,2 ,3  These interventions have also been shown to be effective in improving health for individuals with a wide range of chronic conditions.4  Though few studies have focused on CHW programs serving Medicaid beneficiaries, some evidence exists that these interventions can reduce health care costs and improve outcomes.5  CHW services may also potentially play a role in helping individuals access health care in areas with provider shortages.6  In September 2022, the Biden Administration announced that it was awarding $225 million in American Rescue Plan funding to train over 13,000 CHWs, the largest ever one-time federal investment in the CHW workforce. The Consolidated Appropriations Act of 2023 also authorized $50 million annually to build CHW workforce capacity from state fiscal year (FY) 2023 through FY 2027.7  These investments represent growing interest among federal and state policymakers in the potential role of CHWs in strengthening population health.

KFF’s 22nd annual Medicaid budget survey (conducted in 2022) asked states about CHW coverage policies in place as of July 1, 2022 (the beginning FY 2023 for most states)8  and planned for FY 2023. Key findings from the survey (supplemented by other available research) include:

  • Medicaid payment for CHW services: As of July 1, 2022, over half of responding states (29 of 48) reported allowing Medicaid payment for services provided by CHWs.9 
  • CHW coverage changes planned for FY 2023: A number of states reported plans to implement Medicaid coverage/payment of CHW services under state plan authority or through other coverage pathways, including under Section 1115 authority. Notably, a few states reported planning to target CHW interventions to pregnant and postpartum populations.
  • Certification and training. Though the survey did not include questions about CHW certification and training programs, several states reported plans to introduce new certification and/or standardized training programs for CHWs in FY 2023.
  • Efforts to expand CHW workforce. States also reported working with stakeholders to identify best practices for expanding the number of CHWs and for supporting broader acceptance of CHWs by Medicaid providers, health plans, and enrollees.

Background

Community Health Workers (CHWs) are frontline workers who have close relationships with the communities they serve, allowing them to better liaise and connect community members to health care systems.10  They often share life experiences, language, socioeconomic status, and race/ethnicity with members of the communities in which they work, allowing them to foster greater trust between community members and the health care system.11  As of May 2021, there were an estimated 61,010 CHWs working in the United States.12 

CHW examples include care coordinators, community health educators, outreach and enrollment agents, patient navigators, and peer educators. Services provided by CHWs may include culturally appropriate health promotion and education, assistance in accessing medical and non-medical services, translation services, care coordination, patient advocacy, home visits, and social support.13  CHWs have also played an important role in trying to mitigate the spread of COVID-19.14  Training and certification requirements for CHWs vary widely, depending on the specific role/responsibilities and employer (e.g., community-based organizations, federally qualified health centers (FQHCs), health departments, or hospitals). No national curriculum or core training exists; however, in recent years, some states have developed standardized core competency trainings and certification requirements for CHWs.15  The move to greater standardization of the CHW role may carry some trade-offs, as some studies have found that more explicitly defining the role of CHWs and introducing certification can create new barriers to entry into the profession, undermining the grassroots nature of the workforce.16 ,17 

Historically, most CHW programs have been run and funded through community health centers and other community-based organizations.18  States may authorize Medicaid payment for certain CHW services under state plan or Section 1115 demonstration authority. States may allow or require managed care organizations (MCOs) to provide CHW services or include CHWs in care teams. Many states use CHW services to address the health needs of targeted populations including enrollees with chronic conditions or complex behavioral or physical health needs, enrollees receiving targeted case management services, or frequent users of health care services.19 

Findings

MEDICAID CHW SERVICE coverage approaches

States can take a variety of approaches to authorize payment for or encourage use of CHW services within Medicaid programs. State approaches to covering CHW services may be influenced by state specific factors including existing delivery systems and payment models and state policy and program goals. Primary coverage approaches and general considerations are outlined below:

  • State plan coverage. States can authorize Medicaid payment for CHW services under different state plan benefits including under the preventive services benefit20  or outpatient services benefit. Requirements for authorizing coverage vary by specific state plan benefit.21  Generally, Medicaid payment is authorized for a specific set of services, provided under the supervision of a physician or licensed provider. States may also define CHW certification and training requirements.22  Federal Medicaid rules require services authorized under state plan to be available to all full benefit Medicaid beneficiaries (with certain exceptions).
  • ACA Health Home option. The Medicaid health homes state plan option (created under Section 2703 of the Affordable Care Act (ACA))23  allows states to establish health homes to coordinate care for individuals with chronic conditions. States may encourage or require use of CHWs as part of a Health Homes care team. States receive a 90% federal match rate for qualified Health Home service expenditures for the first eight quarters under each Health Home state plan amendment (SPA);24  states can (and have) created more than one Health Home program to target different populations. As of September 2022, 19 states (including DC) had a total of 33 approved Medicaid health home models.
  • Managed care arrangements. Some states provide CHW services through Medicaid managed care arrangements, including by adding requirements related to CHWs in MCO contracts. CHW services may be reflected in the medical component of the MCO capitation rate (e.g., if these services are specifically authorized under the state plan and the MCO is required to provide them, or if services fall under care coordination provisions25 ). MCOs may also choose to provide CHW services as “value-added” services even when they are not covered under the state plan (or factored into the capitation rate).26  As of July 2022, 41 states (including DC) contract with comprehensive, risk-based managed care plans to provide care to at least some of their Medicaid beneficiaries.
  • Section 1115 demonstration waivers. Under Section 1115 waiver authority certain Medicaid requirements can be waived and states can be permitted to use federal Medicaid funds in ways that federal rules do not otherwise allow. For example, states may cover CHW services under Section 1115 demonstration authority by allowing CHWs to provide services to Medicaid certain enrollees (e.g., as part of a pilot program), through authorizing incentive payments for CHW-related activities, or by providing funding for CHW infrastructure. Alternative delivery system models requiring team-based care may also allow for more flexibility in paying for CHW services. CHW provisions may be part of broader (and often complex) state Section 1115 waivers which usually involve a lengthy approval (and negotiation) process with the Centers for Medicare and Medicaid Services (CMS). Section 1115 waivers are generally approved for five years and are subject to transparency, public notice, evaluation, and other federal requirements.

As of July 1, 2022, over half of responding states (29 of 48) reported allowing Medicaid payment for services provided by CHWs (Figure 1).27 ,28  Coverage approaches vary and may include payment authorized under state plan, CHWs included as part of a Health Home program care team, CHWs included as members of interdisciplinary teams or networks under a Section 1115 demonstration waiver, or CHW services provided by MCOs.29 

States that Allow Medicaid Payment for Services Provided by Community Health Workers (CHWs) as of July 1, 2022

CHW COVERAGE UNDER STATE PLAN AUTHORITY

Nine states (California, Indiana, Louisiana, Minnesota, North Dakota, Nevada,30  Oregon, Rhode Island, and South Dakota) reported payment is authorized under the Medicaid state plan for a specific set of services provided by CHWs as of July 1, 2022.31 , 32 ,33 , 34   This includes four states (California, Louisiana, Nevada, and Rhode Island) that implemented coverage in 2022 (FY 2022 or the beginning of FY 2023). Four additional states (Illinois, Kentucky, Michigan, and New York) reported plans to implement coverage of CHW services under state plan authority in FY 2023.

States that Authorize State Plan Coverage for CHW Services, FY 2022-2023

The table below summarizes features of a few recently implemented CHW state plan amendments.

Examples of States Implementing State Plan Coverage for CHW Services in FY 2022

At least four additional states reported plans to implement Medicaid coverage/payment of CHW services under state plan authority (as a covered benefit) in FY 2023, including:

  • In Illinois, CHWs are currently funded through Medicaid MCO administrative dollars and through the Healthcare Transformation Collaborative. Medicaid MCOs may employ CHWs or pay for CHW services with administrative dollars. Healthcare Transformation Collaboratives are provider-led collaboratives focused on innovative and equity-focused solutions to reimagine healthcare in Illinois; many have incorporated CHWs in their proposals. The state is working to add certified CHWs as a Medicaid provider type and covered Medicaid service through a state plan amendment; this will allow CHWs to bill Medicaid directly and be reimbursed for services. A CHW certification is under development.
  • Kentucky currently has a CHW program funded with state dollars. It is a collaboration between the Department for Public Health and the University of Kentucky. State legislation was passed in the 2022 Kentucky legislative session mandating that the Department for Medicaid Services reimburse for CHWs and work with other stakeholders to create a public/private partnership that expands CHWs throughout the state. The Department is currently working with stakeholders to identify best practices and reimbursement models to expand the CHW footprint in 2023.
  • Michigan Medicaid has developed and enhanced contract requirements for MCOs relative to the provision of CHW services, while direct reimbursement mechanisms have not (to date) been defined or implemented through program policy. MCOs have been required to ensure they meet the contractually defined ratio of CHWs to members which has evolved from a volume ratio of 1:20,000 to 1:5,000 over time. In FY 2023, Michigan will be exploring opportunities to leverage learnings from the CHW services through MCOs and identifying appropriate policy, coverage, and reimbursement methodology to support broader acceptance and use of CHWs across all managed care programs and fee-for service. The state reported plans to add CHW services as a covered benefit in FY 2023.
  • New York will seek a state plan amendment to add coverage of CHWs for pregnant and postpartum individuals in 2023.

CHW COVERAGE INITIATIVES under DEMONSTRATION AND Other authorities

Several states reported other CHW coverage initiatives planned for FY 2023 including under Section 1115 demonstration authority or planned as part of a CMS Center for Medicare and Medicaid Innovation (CMMI) model. Examples include:

  • As part of the MassHealth Section 1115 demonstration, Massachusetts has provided delivery system reform incentive payment (DSRIP) funding to accountable care organizations (ACOs) to hire CHWs and has funded CHW core competency trainings (which align with CHW core competencies developed by the Massachusetts Department of Public Health and enable CHWs to meet one of the qualifications for CHW certification). The state has also developed and funded advanced CHW trainings in mental health, substance use disorder, and telehealth and trainings for CHW supervisors. As of July 2022, 600 health care workers had participated in the CHW core competency and CHW supervisor trainings. As part of their next Section 1115 waiver, the state has authority to sub-capitate primary care within ACO models, which will allow financing of team-based care for primary care services in a non-FFS model. These sub-capitation funds can be used to hire CHWs in support of the team-based care model. The state will also be funding additional core competency and advanced trainings in mental health, substance use disorder, and telehealth trainings for CHWs during the next waiver period.
  • Maine plans to add CHWs to its maternal opioid model of care early FY 2023. This model is a Center for Medicare and Medicaid Innovation (CMMI) initiative that supports the delivery of integrated physical and behavioral health care and wrap-around services for pregnant and postpartum women with opioid use disorder and their infants. Maine’s model provides a team-based approach to care for the eligible population, currently including a perinatal provider, substance use counselor, patient navigator, nurse care manager, recovery coach, and perinatal provider.
  • The New Jersey Division of Medical Assistance and Health Services (DMAHS), in partnership with the state Department of Health (DOH), have identified CHWs as a promising resource to enhance care coordination, address disparities, and improve outcomes for Medicaid beneficiaries. To support and advance this work, the state has requested expenditure authority as part of its Section 1115 renewal application to support a set of CHW pilots, to be administered by interested MCOs in collaboration with DMAHS and the NJ DOH's Colette Lamothe-Galette Community Health Worker Institute.35  (The goal of the Institute is to create a standardized community health worker training and certification program, resulting in a robust CHW workforce.) DMAHS also participates in a CHW sustainability workgroup led by DOH members from the Institute.
  • North Carolina will incorporate CHWs as “care management extenders” within their “Tailored Plan” care management model. The state will launch its “Tailored Plans” on April 1, 2023, offering integrated services to enrollees with significant behavioral health needs and intellectual/developmental disabilities (I/DD). Care management extenders can support care managers in delivering care management and meeting member contact requirements.36  CHWs that have completed the NC CHW standardized core competency training meet extender qualification requirements. North Carolina Medicaid is also preparing to leverage existing contract authority with its “Standard Plans” to expand the number of CHWs used throughout its Medicaid managed care system by establishing a CHW staffing requirement ratio. The state is also considering how health plan-level requirements filter down to providers with local care management responsibilities and how to encourage community-based organization partnership and deployment of CHWs.

Looking Ahead

In this year’s 22nd annual budget survey, states reported focusing on both longstanding issues and new priorities, including new and expanded initiatives to improve equity and reduce health disparities, improve behavioral health access and supports, and address workforce challenges. Many states also reported new and expanded benefits related to enrollees’ social needs. Research indicates community health workers can play a role in reducing racial and ethnic health disparities and addressing health-related social needs among Medicaid beneficiaries. CHWs may also potentially play a role in helping individuals access health care in areas with provider shortages.37  As states look to expand the use of CHWs in the future, evidence from recently implemented and existing CHW programs and from the infusion of ARPA and other federal funds to increase CHW workforce capacity may provide important experience and lessons to inform these efforts.

  1. Chidinma A. Ibe, Debra Hickman and Lisa A. Cooper, “To Advance Health Equity During COVID-19 and Beyond, Elevate and Support Community Health Workers,” JAMA Health Forum 2, no.7 (July 2021), https://doi.org/10.1001/jamahealthforum.2021.2724. ↩︎
  2. Sonia Ahmed, et al. “Community health workers and health equity in low- and middle-income countries: systematic review and recommendations for policy and practice,” International Journal for Equity in Health 21, no. 49 (April 2022), https://doi.org/10.1186/s12939-021-01615-y. ↩︎
  3. Miya L. Barnett, et al. “Mobilizing Community Health Workers to Address Mental Health Disparities for Underserved Populations: A Systematic Review” Administration and Policy in Mental Health and Mental Health Services Research 45, (July 2017), https://doi.org/10.1007/s10488-017-0815-0. ↩︎
  4. Richard Crespo et al. “An Emerging Model for Community Health Worker–Based Chronic Care Management for Patients With High Health Care Costs in Rural Appalachia.” Preventing Chronic Disease 17 (February 2020), http://dx.doi.org/10.5888/pcd17.190316. ↩︎
  5. Erica T. Marshall, et al, “Home Visits for Children With Asthma Reduce Medicaid Costs.” Preventing Chronic Disease 17 (February 2020), http://dx.doi.org/10.5888/pcd17.190288. ↩︎
  6. Tanekwah Hinds, Community Health Workers Bridge the Gap for Providers and Communities. (Community Catalyst, April 2022), https://www.communitycatalyst.org/blog/community-health-workers-bridge-the-gap-for-providers-and-communities#.Y5N4uvfMI2w. ↩︎
  7. Consolidated Appropriations Act, 2023 (P.L. 117-328). ↩︎
  8. State fiscal years begin on July 1 except for these states: New York on April 1; Texas on September 1; Alabama, District of Columbia, and Michigan on October 1. ↩︎
  9. States were asked, “As of July 1, 2022, does your state allow for Medicaid payment for services provided by a CHW – i.e., an individual who serves as a liaison between the community and health care and social services including, for example, promotoras, care coordinators, community health educators, outreach and enrollment agents, patient navigators, etc. (but excluding doulas and peer educators)?” ↩︎
  10. Community Health Workers (American Public Health Association), https://www.apha.org/apha-communities/member-sections/community-health-workers ↩︎
  11. Role of Community Health Workers (National Heart, Lung and Blood Institute, June 2014), https://www.nhlbi.nih.gov/health/educational/healthdisp/role-of-community-health-workers.htm. ↩︎
  12. Occupational Employment and Wage Statistics, May 2021 (U.S. Bureau of Labor Statistics, May 2021), https://www.bls.gov/oes/current/oes211094.htm. ↩︎
  13. Role of Community Health Workers (National Heart, Lung and Blood Institute, June 2014), https://www.nhlbi.nih.gov/health/educational/healthdisp/role-of-community-health-workers.htm. ↩︎
  14. Elinor Higgins, States Engage Community Health Workers to Combat COVID-19 and Health Inequities (National Academy for State Health Policy, June 2020), https://www.nashp.org/states-engagecommunity-health-workers-to-combat-covid-19-and-health-inequities/ ↩︎
  15. Statewide Training Approaches for Community Health Workers (National Association of Community Health Workers, August 2021), https://nachw.org/wp-content/uploads/2021/09/8.25.21StatewideTraining.pdf. ↩︎
  16. Theresa H. Mason, Carl H. Rush and Meredith K. Sugarman, Statewide Training Approaches for Community Health Workers. (National Association of Community Health Workers, August 2021), https://nachw.org/wp-content/uploads/2021/09/8.25.21StatewideTraining.pdf. ↩︎
  17. Megan Coffinbargar, April J. Damian and John M. Westfall, “Risks and Benefits to Community Health Worker Certification.” Health Affairs Forefront (July 2022), doi: 10.1377/forefront.20220705.856203.   ↩︎
  18. Medicaid Coverage of Community Health Worker Services (Medicaid and CHIP Payment and Access Commission, April 2022), https://www.macpac.gov/wp-content/uploads/2022/04/Medicaid-coverage-of-community-health-worker-services-1.pdf. ↩︎
  19. Ibid. ↩︎
  20. A 2014 update to the Center for Medicare and Medicaid Services’ (CMS) regulatory definition of preventive services allows these services to be provided by non-licensed providers, including CHWs. ↩︎
  21. For example, to add coverage under the preventive services benefit, states need to submit a state plan amendment (SPA) that describes the specific CHW services to be delivered, qualifications for practitioners who will deliver the services, limitations on services, and payment methodology. For CHW services covered under the outpatient hospital services benefit, states are not required to identify these services in the state plan. https://www.macpac.gov/wp-content/uploads/2022/04/Medicaid-coverage-of-community-health-worker-services-1.pdf ↩︎
  22. Medicaid Coverage of Community Health Worker Services (Medicaid and CHIP Payment and Access Commission, April 2022), https://www.macpac.gov/wp-content/uploads/2022/04/Medicaid-coverage-of-community-health-worker-services-1.pdf. ↩︎
  23. ACA, P.L. 111-148, as amended ↩︎
  24. For substance use disorder (SUD) Health Homes approved on or after October 1, 2018, the SUPPORT Act extends the enhanced federal match rate from eight to ten quarters. ↩︎
  25. 42 CFR § 438.208(b)(2) ↩︎
  26. Medicaid Coverage of Community Health Worker Services (Medicaid and CHIP Payment and Access Commission, April 2022), https://www.macpac.gov/wp-content/uploads/2022/04/Medicaid-coverage-of-community-health-worker-services-1.pdf. ↩︎
  27. States were asked, “As of July 1, 2022, does your state allow for Medicaid payment for services provided by a CHW – i.e., an individual who serves as a liaison between the community and health care and social services including, for example, promotoras, care coordinators, community health educators, outreach and enrollment agents, patient navigators, etc. (but excluding doulas and peer educators)?” ↩︎
  28. KFF analysis of state responses revealed states may have interpreted questions about CHW policies differently. KFF attempted to verify/confirm policies in place by pulling state plan amendments (SPAs) and conferring with other sources. ↩︎
  29. KFF count of states that “allow Medicaid payment” for CHW services may differ from and include more states than reported by other sources, as KFF broadly defined related Medicaid CHW coverage approaches to include coverage under Medicaid state plan authority (see EN 31 below), CHWs as part of a Health Home program care team (allowed or required by state), CHWs included as members of interdisciplinary team or network under Section 1115 waiver (allowed or required by state), and CHW services provided by MCOs (allowed or required by state). KFF count may include states that allow MCOs to provide CHW services using administrative funds or as “value-added” services. ↩︎
  30. Nevada also provides coverage of CHW services for Group VIII expansion adults through a separate ABP State Plan Amendment. ↩︎
  31. States were asked “As of July 1, 2022, is payment authorized under the State Plan for a specific set of services provided by CHWs under the supervision of, or recommended by, a physician or other licensed provider?” ↩︎
  32. Alaska provides state plan coverage for Community Health Aides/Practitioners (CHA/Ps) but the state confirmed CHA/Ps are service providers, not public health workers and do not fit the definition of CHW established by the APHA. However, Alaska may be counted as a state that allows payment for CHW services in other sources. ↩︎
  33. KFF analysis of state responses revealed states may have interpreted questions about CHW policies differently. KFF attempted to verify/confirm policies in place by pulling state plan amendments (SPAs) and conferring with other sources. ↩︎
  34. Several states reported that they authorize payment under the state plan for a specific set of services provided by CHWs but are not reflected in our count / here. These states were excluded because we were unable to identify/locate the corresponding state plan amendment. These states may have been referencing coverage under the ACA Health Homes state plan option. States that were excluded from the state plan authority count were not reported by other sources as reimbursing for CHW services under state plan authority. ↩︎
  35. Colette Lamothe-Galette Community Healthworker Institute (State of New Jersey Department of Health), https://www.nj.gov/health/fhs/clgi. ↩︎
  36. Tailored plan members have access to a dedicated care manager who will work with a multidisciplinary team to deliver integrated, whole-person care. ↩︎
  37. Tanekwah Hinds, Community Health Workers Bridge the Gap for Providers and Communities. (Community Catalyst, April 2022), https://www.communitycatalyst.org/blog/community-health-workers-bridge-the-gap-for-providers-and-communities#.Y5N4uvfMI2w. ↩︎
News Release

KFF’s Kaiser Health News Launches Weekly “KHN Health Minute” on CBS News Radio

Published: Jan 20, 2023

KFF’s Kaiser Health News (KHN) is launching a weekly one-minute health information segment for CBS News Radio stations that will help millions of listeners stay informed and make better health decisions.

CBS News Radio began offering the KHN Health Minute to its more than 700 affiliate stations weekly on Jan. 12. The brief segments will include a broad range of health stories and consumer information reported by KHN’s nationwide team of health reporters. Listeners can expect stories ranging from navigating medical bills and debt, to changes in health care delivery and policy and public health. A signature focus of the minutes will be on what all the changes and policy debates that people hear about actually mean for them.

In the first KHN Health Minute, hear how noise pollution affects health and why an optimistic outlook may help people live longer.

The collaboration is the latest product of an ongoing partnership between CBS News and KHN.

“Expanding on KHN’s partnership with CBS, I’m thrilled to offer the network’s radio listeners across the country the KHN Health Minute,” said KHN Editor-in-Chief Elisabeth Rosenthal. “It offers a fun, fast and informative way to keep up with the latest and most important health care news.”

“Every day health news is in the headlines as we battle new and emerging threats. Our listeners will benefit greatly with this topical information that is both accessible and actionable,” said Craig Swagler, vice president and general manager of CBS News Radio. “The powerful audience reach of the radio medium connects on-the-go listeners with health information they need and can use instantaneously.”

Listeners can check for the KHN Health Minute on their local CBS News Radio station.

The broader partnership also features regular appearances by Dr. Céline Gounder, KHN’s senior fellow and editor-at-large for public health, on all of CBS News’ platforms, as well as stories, segments, and specials drawing upon reporting from across KHN’s newsroom and bureaus. It includes the popular “Bill of the Month” series, in which Rosenthal appears regularly on “CBS Mornings” to discuss surprising medical bills and what they tell us about the U.S. health care system. “Bill of the Month” is a collaborative investigative project of KHN and NPR.

KHN, a program of KFF, is an award-winning news service with a national newsroom in Washington, D.C., and a rapidly growing network of regional bureaus in California, the Midwest, the Mountain States, and the South, as well as a new Rural Health Desk. KHN works with many editorial partners, and media outlets can republish KHN stories at no charge. News organizations interested in working with KHN should contact the news service at KHNPartnerships@kff.org.

About KFF and KHNKHN (Kaiser Health News) is a national newsroom that produces in-depth journalism about health issues. Together with Policy Analysis, Polling and Survey Research and Social Impact Media, KHN is one of the four major operating programs at KFF. KFF is an endowed nonprofit organization providing information on health issues to the nation.

About CBS News Radio:

CBS News Radio provides news, talk, information, entertainment, and special events coverage to more than 700 radio stations in the United States, with affiliates in 24 of the top 25 markets. CBS News Radio is also heard hourly on the SiriusXM Platform on P.O.T.U.S. (Channel 124). CBS News Radio is home to the “CBS World News Roundup,” the nation’s longest-running news program, debuting in 1938. In addition to providing breaking news and information, the division provides simulcasts of the CBS EVENING NEWS, FACE THE NATION, and 60 MINUTES to affiliates. CBS News Radio programming is available digitally through the CBS News Radio app, Apple Music, Amazon’s Alexa service, and on the web.

Follow CBS News Radio on Twitter, Facebook, and online at CBSNews.com/Radio.


News Release

Leading up to the 50th Anniversary of the Now-Overturned Roe, New KFF Brief Presents an Analysis of Current Legal Challenges to State Abortion Bans

Published: Jan 20, 2023

As the nation marks the 50th anniversary of the Supreme Court of the United States landmark Roe v. Wade decision, which the Supreme Court overturned, 14 states have active litigation challenging state abortion bans and restrictions. A new KFF brief explains how individuals and organizations suing to block the bans are framing their legal challenges based on different state constitutional protections and state laws now that the battleground over abortion rights rests with states.

The legal challenges presented in state courts generally fall into three categories:

  • Broad Constitutional Challenges: In Ohio, Oklahoma, Georgia, and Utah, among others, the abortion ban challenges include claims that state constitutional protections, such as liberty, due process, and privacy rights include a right to abortion.
  • Health Care Amendment Challenges: Some state constitutions were amended to include a right to make health care and health insurance decisions in efforts to block the ACA’s individual coverage mandate. In Wyoming and Ohio, abortion advocates argue that this amendment includes the right to decide whether to have an abortion.
  • Religious Freedom Challenges: In Florida, Indiana, Kentucky, Utah, and Wyoming, people from various religious backgrounds argue abortion bans infringe on their religious rights.

In time, these challenges will reach each state’s highest court, ultimately deciding the constitutionality of state-level abortion bans determining whether abortion will be available in the state.

Review the brief “Legal Challenges to State Abortion Bans Since the Dobbs Decision” to learn more.

Legal Challenges to State Abortion Bans Since the Dobbs Decision

Authors: Mabel Felix, Laurie Sobel, and Alina Salganicoff
Published: Jan 20, 2023

Key Takeaways

The Supreme Court of the United States decision in Dobbs returned the decision to restrict or protect abortion to states. In many states, abortion providers and advocates are challenging state abortion bans contending that the bans violate the state constitution or another state law.

These challenges generally fall into three categories:

  • Broad Constitutional Challenges: In Ohio, Oklahoma, Georgia, and Utah, among others, the abortion ban challenges include claims that state constitutional protections, such as liberty, due process, and privacy rights encompass a right to abortion.
  • Health Care Amendment Challenges: Some state constitutions were amended to include a right to make health care and health insurance decisions in an effort to block the ACA’s individual coverage mandate. In Wyoming and Ohio, abortion advocates argue that this amendment includes the right to make a decision about whether or not to have an abortion.
  • Religious Freedom Challenges: In Florida, Indiana, Kentucky, Missouri, Utah, and Wyoming people from various religious backgrounds argue abortion bans either unduly infringe on their religious exercise or violate state constitutional protections against the establishment of religion.

A number of state courts have responded favorably to many of these arguments and have temporarily blocked several bans while litigation on their constitutionality is ongoing. In time, these challenges will reach each state’s highest court, which will be the ultimate arbiter of the constitutionality of state-level abortion bans.

Introduction

Since the Supreme Court’s decision in Dobbs v. Jackson Women’s Health Organization, overturning Roe v. Wade and Planned Parenthood v. Casey, the legal landscape at the state level has been activated as never before. With the aim of restricting access to abortion, many states moved swiftly to lift court orders previously blocking bans, revive dormant pre-Roe bans, certify “trigger” bans, and enact new laws. Lacking federal protections, abortion providers have been on the front lines challenging these bans in state courts, questioning their constitutionality, not under the United States Constitution, but under each state’s constitution. Since the Dobbs decision, 23 states have tried to implement a complete ban or a pre-viability ban. In 6 states, these laws are currently blocked by courts. For an overview of the current legal status of abortion across the country, please see our abortion dashboard.

Although State Constitutions are similar to one another in many respects, each state has its unique judicial history and binding precedent, with State Supreme Court rulings diverging on liberty, privacy, and due process protections. Additionally, some states have amended their constitutions to include different abortion protections, while others have moved to assert that their constitution confers no right to abortion. Given these differences, abortion bans and restrictions that may be unconstitutional in some states, may be constitutionally permissible in others. As a result, the types of challenges on state constitutional grounds have varied in states banning – or attempting to ban – abortion access, including those where the question of a constitutional right to abortion had never reached their highest courts, the ultimate arbiters of the constitutionality of state laws.

Despite the variety in the types of legal challenges to abortion bans, a few patterns in the approaches have emerged in the abortion litigation landscape. In this issue brief, we present an overview of some of the types of challenges presented in state courts since the Dobbs ruling in June 2022 and highlight some of the novel strategies that are being used to defend access to abortion in states that have enacted abortion bans.

Background

Before the Supreme Court of the United States (SCOTUS) Dobbs decision, the supreme courts of ten states had recognized a constitutional right to abortion in their states’ constitutions, but often under differing guarantees and protections. For example, in Montana in 1999, the state’s highest court found that the state constitution contained stringent protections of the right to privacy, exceeding those provided by the federal constitution, and, as such, ruled that procreative autonomy (the right to decide whether or when to have children) is protected under the right to privacy. Florida and Minnesota are two other states where the highest courts have ruled that their states’ constitutions include a more expansive right to privacy than SCOTUS had found in the federal constitution. In Massachusetts, the state’s highest court recognized that the right to abortion is found within the state constitutional due process rights.

Currently, nine state supreme court decisions finding state constitutional protections for abortion are binding precedent and have not been overturned by a subsequent decision or constitutional amendment. (Table 1). Just as SCOTUS overturned Roe, state supreme courts may overturn their previous decisions upholding the right to abortion in their state constitutions. In 2018, the Iowa Supreme Court found that the state constitutional rights of due process and equal protection encompassed the right to abortion. However, in June 2022, the Iowa court reversed itself, finding that the state constitution confers no fundamental right to abortion.

States Where the Highest Court Has Recognized the State Constitution Protects the Right to Abortion

While a state’s highest court has final say about the constitutionality of laws under its constitution, the legislature and electorate may amend the constitution at a future date, rendering previous court decisions moot or severely impacting the landscape of litigation in that state. For example, in 2000 the Tennessee Supreme Court issued a decision finding the state’s constitutional protections for privacy encompassed a right to abortion. However, in 2014, voters approved a ballot measure amending the state’s constitution and explicitly expressing that the constitution did not confer a right to abortion, superseding the 2000 court’s ruling. In addition to Tennessee, Arkansas, Louisiana, and West Virginia (Table 2) have passed ballot measures to amend their state constitutions to curtail the right to abortion. Although these amendments may not explicitly prohibit abortion in the state, they can prevent the state supreme courts from ruling that other, broader constitutional protections encompass a right to abortion. This allows state legislatures to enact abortion bans and restrictions with the confidence that the state’s highest court will not find them unconstitutional and unenforceable.

State Constitutional Amendments Curtailing the Right to Abortion

After the Dobbs decision, some states used ballot measures to attempt to amend their constitutions. The ballot measures seeking to curtail the right to abortion in Kansas and Kentucky failed, while California, Michigan, and Vermont (Table 3) successfully passed constitutional amendments recognizing a right to abortion. Enshrining these rights in the state constitution amounts to a much stronger, more stable protection than simply enacting laws recognizing such a right, which can be repealed with a change in party control of a state legislature. In contrast, a constitutional amendment that explicitly protects a right to abortion, or reproductive autonomy more broadly is much harder to change or repeal.

State Constitutional Amendments Protecting the Right to Abortion

Challenges in State Courts Following the Dobbs Decision

Who is challenging the abortion bans in state courts?

Most legal challenges to state abortion bans are being brought by abortion care providers and clinics, presenting claims on behalf of themselves, their staff, and their patients. This is common in lawsuits regarding the right to access abortion care. Many prominent cases, such as Planned Parenthood v. Casey and Dobbs v. Jackson Women’s Health Organization, have been brought by providers and clinics.

Although there is a long history of providers and clinics challenging abortion restrictions, officials in some states dispute the legal “standing” providers have to bring these suits. For courts to be able to hear a case at all there must be a party with a real, concrete injury whose protection depends on an intervention by the Court. Usually, a person can only challenge the constitutionality of a law if it infringes on their own rights, not broadly the rights of others. However, legal challenges to abortion bans and restrictions brought by providers and clinics generally argue there is a constitutional right to receive abortion care and restrictive laws violate this right. In this way, providers argue that the rights of their patients – not necessarily their own – are being infringed by the bans.

This practice of suing to vindicate the rights of a closely related party (in this case providers and their patients) is called “third-party standing.” It allows a person or organization to assert the rights of another individual when it is difficult for them to assert their own rights, and the parties’ interests are closely aligned.  Given the time limited duration of a pregnancy, it is difficult for pregnant people to personally challenge abortion restrictions while often facing numerous obstacles including financial limitations, and concerns for privacy and personal safety. For almost 47 years, federal and state courts have permitted doctors and clinics to sue on their behalf. The Supreme Court of the United States established third-party standing for abortion doctors on behalf of their patients in a 1976 decision, Singleton v. Wulff. That case was brought by two doctors challenging the exclusion of abortion in Missouri’s Medicaid program. Justice Blackmun wrote for the court, “aside from the woman herself, the physician is uniquely qualified, by virtue of his confidential, professional relationship with her, to litigate the constitutionality of the state’s interference with, or discrimination against, the abortion decision.” Singleton recognized that women can be fearful to assert their abortion rights out of concern for their privacy.

However, since the Supreme Court’s decision in Dobbs, some state courts have become more receptive of arguments against providers’ third party standing. Most notably, in Florida, a state Court of Appeals called into question providers’ ability to sue on behalf of patients in its decision refusing to block an abortion ban. If the ability of providers and clinics to bring challenges to courts is curtailed, it may be more difficult for these challenges to proceed successfully if only those who are seeking abortion are permitted to sue.

In addition to clinics and providers, other individuals and groups have challenged abortions bans. Some recent notable cases include a challenge under the Indiana Religious Freedom Restoration Act, where five unnamed women and a Jewish pro-choice organization are contesting the constitutionality of the state ban constitutionality on freedom of religious exercise grounds. This challenge is detailed below. Another notable case is the lawsuit disputing the constitutionality of the Wyoming’s total abortion ban, where a pregnant woman and a woman of reproductive age, along with two physicians, a clinic, and an advocacy organization are suing the state. This challenge rests on constitutional privacy rights and the right to make health care decisions. And, finally, in Wisconsin, the state’s Attorney General and Medical Examining Board filed a lawsuit seeking judgment that the state’s pre-Roe ban is unenforceable, arguing that the ban is incompatible and at odds with the many other abortion statutes the state enacted since the decision in Roe.

Types of Challenges

General Constitutional Challenges

In many states, lawsuits challenging the constitutionality of bans argue that the laws violate due process, liberty, equal protection, or privacy rights, or a combination of these rights. Although the states’ constitutional protections are similar, state Supreme Courts have diverged in their interpretation of these rights, with some recognizing that certain state constitutional rights are more expansive than their federal counterparts. There is active litigation in Ohio, Oklahoma, Georgia, Indiana, Kentucky, Utah and Wyoming, which include constitutional violations as the part of the basis of their challenges to the states’ abortion bans.

In issuing a preliminary injunction blocking the enforcement of Ohio’s abortion ban, the state trial court judge found that the Ohio Constitution includes the right to abortion in the right to “liberty” and in the “Due Course of Law” provision which states: “All courts shall be open, and every person, for an injury done him in his land, goods, person or reputation, shall have a remedy by due course of law, and shall have justice administered without denial or delay. Suits may be brought against the state, in such courts and in such manner, as may be provided by law.” The court also relied on the Health Care Amendment to the constitution which is discussed below.

In Wyoming, the presiding judge also found that the abortion ban’s exceptions regarding cases of rape or incest and medical emergencies could be found to be unconstitutionally vague. Judges in both Ohio and Wyoming also found the abortion bans would violate each state’s equal protection provisions, despite the states’ arguments that these laws apply to everyone equally.

In January 2023, the South Carolina Supreme Court struck down the state’s 6 -week ban as violating the state’s constitutional privacy provision. Unlike the U.S. federal constitution, South Carolina’s constitution has an explicit right to privacy. While each state court is independent and is not obliged to follow other state court decisions, the South Carolina Supreme Court reviewed the decisions of other state Supreme Courts to inform their own ruling that the right to privacy includes the right to abortion. Ten other states also have an explicit right to privacy in their state constitutions.1 

Health Care Amendment Challenges

In Wyoming and Ohio, the legal challenges to abortion bans revolve around some of these same constitutional protections most other challenges rely on, but also around each respective state constitution’s amendment regarding health care and health insurance. These two states, along with Alabama, Arizona, and Oklahoma2 , amended their constitutions in the wake of the passing of the Affordable Care Act (ACA), to create a right to make health care and insurance decisions and block the insurance coverage mandate in the federal ACA. By creating a right to make decisions about health care and health insurance, the state legislatures hoped they could secure the individual right to refuse to purchase health insurance and to ensure the right to purchase private health insurance, thereby circumventing the law’s individual mandate to obtain insurance. In Wyoming, the constitutional amendment was approved in a ballot measure in the November 2012 elections. This amendment safeguards the right to health care access, broadly giving every adult the right to make his or her own health care decisions. In Ohio, the Health Care Freedom Amendment was approved in a November 2011 ballot measure. This amendment protects the right to purchase health care, stating that “[n]o federal, state, or local law or rule shall prohibit the purchase or sale of health care or insurance.”

Despite the narrow intent of the amendments to block ACA implementation, their broad language has allowed providers and advocates in Ohio and Wyoming to successfully argue that these measures create a general constitutional right to make health care decisions. And abortion, they argue, is health care under any ordinary definition of health care. Thus, providers argue, these amendments protect the right to make health care decisions and then logically protecting the decision about whether to have an abortion, making Ohio’s 6-week LMP ban and Wyoming’s total ban unconstitutional.

In response, state defendants that oppose abortion rights in both cases argue these health care amendments do not remove a state’s ability to regulate health care, or outlaw abortion. The state Courts in both states, however, were receptive to the argument that the right to make health care decisions encompasses the right to make decisions about whether to have an abortion and blocked the bans from being enforced. Judges in both courts asserted that, regardless of the intent with which the amendment was passed, the plain meaning of the language used in it likely conferred a right to abortion. In short, the state trial court judges agreed with the argument that abortion qualifies as health care and the general constitutional protection to make health care decisions created by the amendments would make the bans unconstitutional. Both cases are expected to reach each state’s highest court, where the constitutionality of the bans will ultimately be decided.

Religious Freedom Challenges based on State Constitutions and The Religious Freedom Restoration Act

Individuals, religious faith leaders and organizations have brought legal challenges in several states including Florida, Indiana, Kentucky, Missouri, Utah and Wyoming claiming their state’s abortions restrictions violate their religious freedom.  Some of these litigants base their claims solely on the state’s constitution’s right to freely exercise one’s religion, while others are challenging their state abortion restrictions on their state’s Religious Freedom Restoration Act. Indiana’s case is the only religious challenge to an abortion ban to date where a court has responded to the state RFRA arguments at hand and evaluated their validity.

The plaintiffs in Indiana have based their challenge only on the state’s RFRA law. The Indiana RFRA law, adopted in 2015, “prohibits government action that substantially burdens a person’s religious exercise, unless the burden is in furtherance of a compelling governmental interest and is the least restrictive means of furthering that interest.” Several states have similar laws that are modeled after a 1993 federal law by the same name, which applies only to federal laws, not to state or local laws.   Federal and state RFRA laws have been used to challenge laws requiring contraceptive coverage and anti-discrimination laws. Most notably, the federal Religious Freedom Restoration Act was the basis for the lawsuit brought by Hobby Lobby to challenge the contraceptive coverage requirement based on the for-profit corporation’s religious objections to certain contraceptive methods.

In the Indiana case, a group of women and a religious pro-choice organization argue the state’s abortion ban substantially burdens their religious exercise. Specifically, the plaintiffs argue that their respective religions (Judaism, Islam, and Unitarian Universalism) direct them to obtain abortion care under circumstances that the ban does not allow. This includes situations where the pregnancy jeopardizes the mental health of the pregnant person or their physical health, without necessarily causing serious risk of substantial and irreversible physical impairment of a major bodily function, as the ban’s health exception would require. Plaintiffs thus argue that their sincere beliefs would be substantially burdened if the ban went into effect. They further argue that the state’s right to protect potential life is not a strong enough interest to overcome their religious exercise rights – which are protected by Indiana’s RFRA – and bar them from receiving abortion care in situations where their sincerely held religious beliefs would call for them to seek it.

On December 2, 2022, the Marion County Superior Court granted a preliminary injunction, blocking the ban from being enforced against the plaintiffs, while the underlying question is resolved. Another Indiana state trial court had already issued an order blocking this ban from being enforced due to a previous challenge to the law, which argued the liberty guarantees of the Indiana Constitution provide a right to privacy that includes the right to determine whether not to have an abortion. The state has appealed both court decisions blocking enforcement of the ban and is requesting the Indiana Supreme Court eliminate the preliminary injunction in the RFRA challenge.

Conclusion

The fate of the constitutionality of abortion bans and the legal availability of abortion services in states where there are ongoing legal battles will most likely rest on each state’s highest court. Since SCOTUS issued its decision in Dobbs, the South Carolina Supreme Court has ruled that their state constitution protects the right to abortion. Conversely, a week before Dobbs’ decision, the Iowa Supreme Court overturned their previous decision, and found that their state constitution does not include any protections for abortion. It will take some time for the other cases underway to reach their respective State Supreme Courts and to have decisions on the states’ constitutional protections of abortion that will ultimately affect abortion access across the nation.

Appendix Table 1

Active State Challenges
  1. The states of Alaska (Const. art. 1, § 22), Arizona (Const. art. 2, § 8), California (Const. art. 1, § 1), Florida (Const. art. 1, § 23), Hawai’i (Const. art. 1, § 6), Illinois (Const. art. 1, § 6), Louisiana (Const. art. 1, § 5), Montana (Const. art. 2, § 10), New Hampshire (Const. art. 2-b), South Carolina (Const. art. 1, § 10), and Washington (Const. art. 1, sec. 7) all contain explicit protections of the right to privacy. ↩︎
  2. Oklahoma Constitution Article II, § 37. ↩︎

What to Know about Medicare Spending and Financing

Published: Jan 19, 2023

Medicare, the federal health insurance program for 65 million people ages 65 and older and younger people with long-term disabilities, helps to pay for hospital and physician visits, prescription drugs, and other acute and post-acute care services. This brief provides an overview of Medicare spending and financing, based on the most recent historical and projected data published in the 2022 annual report of the Board of Medicare Trustees and the 2022 Medicare baseline and projections from the Congressional Budget Office (CBO). The brief highlights trends in Medicare spending and key drivers of spending growth, including higher enrollment, growth in health care costs, and increases in payments to Medicare Advantage plans.

Key Facts about Medicare Spending and Financing

  • In 2021, Medicare benefit payments totaled $829 billion, up from $541 billion in 2011. Spending on Part B services (including physician services, outpatient services, and physician-administered drugs) accounts for the largest share of Medicare benefit spending (48% in 2021).
  • Payments to Medicare Advantage plans for Part A and Part B benefits nearly tripled as a share of total Medicare spending between 2011 and 2021, from $124 billion to $361 billion, due to steady enrollment growth in Medicare Advantage plans and higher per person spending in Medicare Advantage than in traditional Medicare.
  • Medicare spending (net of income from premiums and other offsetting receipts) is projected to rise from 10% of total federal spending in 2021 to 18% in 2032, and from 3.1% to 3.9% of GDP over these years, due to growing Medicare enrollment, increased use of services and intensity of care, and rising health care costs.
  • Average annual growth in Medicare per capita spending is projected to be 5.4% between 2020 and 2030, on par with the 5.3% growth rate in private health insurance per capita spending over these years.
  • Funding for Medicare, which totaled $888 billion in 2021, comes primarily from general revenues (46%), payroll tax revenues (34%), and premiums paid by beneficiaries (15%).
  • The Medicare Hospital Insurance (Part A) trust fund, which pays for inpatient hospital, skilled nursing facility, home health and other Part A services, is projected to be depleted in 2028, based on the latest projections from the Medicare Trustees.

Overview of Medicare Spending

Medicare Accounts for 21% of National Health Spending and 10% of the Federal Budget

Medicare plays a major role in the health care system, accounting for 21% of total national health spending in 2021, 26% of spending on both hospital care and physician and clinical services, and 32% of spending on retail prescription drug sales (Figure 1).

In 2021, Medicare Accounted for 21% of Total National Health Spending

In 2021, Medicare spending, net of income from premiums and other offsetting receipts, totaled $689 billion and accounted for 10% of the federal budget—a similar share as spending on Medicaid, the Affordable Care Act (ACA), and the Children’s Health Insurance Program combined, and defense spending (Figure 2).

In 2021, Medicare Spending Accounted for 10% of the Federal Budget

Historical and Projected Medicare Spending

Medicare spending on Part A, Part B, and Part D benefits in 2021 totaled $829 billion, up from $541 billion in 2011, according to the Medicare Trustees (Figure 3). These amounts reflect gross spending, not subtracting premiums or other offsetting receipts, and include spending on beneficiaries in both traditional Medicare and Medicare Advantage. Medicare benefit spending is expected to grow to $1.8 trillion in 2031 (Figure 3).

Medicare Benefits Spending Is Projected to Increase from $829 Billion in 2021 to $1.8 Trillion in 2031, Due to Growth in the Medicare Population and Increases in Health Care Costs

CBO projects that between 2021 and 2032, net Medicare spending—after subtracting premiums and other offsetting receipts—will grow as a share of both the federal budget, from 10.1% to 17.8%, and the nation's economy, from 3.1% to 4.3% of gross domestic product (GDP). Projected spending growth for Medicare is due in part to growing enrollment in Medicare related to the aging of the population, increased use of services and intensity of care, and rising health care costs.

Over the longer term, net Medicare spending will increase to 5.9% of GDP in 2052, according to CBO's most recent long-term projections. CBO projects that rising health care costs per person will account for two-thirds of the increase in spending on the nation's major health care programs (Medicare, Medicaid, and subsidies for ACA Marketplace coverage) over the next 30 years, and the aging of the population will account for one-third.

Spending on Physician and Other Outpatient Services Accounts for a Growing Share of Medicare Spending

Spending on benefits under each part of Medicare (A, B, and D) increased in dollar terms between 2011 and 2021, but the distribution of total benefit payments by part has changed over time. Spending on Part B benefits, including physician services, hospital outpatient services, physician-administered drugs, and other outpatient services, increased from 41% in 2011 to 48% in 2021, and now accounts for the largest share of total spending on Medicare benefits (Figure 4). The share of total spending on Part A benefits (mainly hospital inpatient services) decreased from 47% to 39%, reflecting a shift from inpatient to outpatient services. Moving forward, Medicare spending on physician services and other services covered under Part B is expected to grow to just over half of total Medicare spending by 2031, while spending on hospital care and other services covered under Part A is projected to decrease further as a share of the total.

Spending on Physician Services and Other Medicare Part B Services Now Accounts for the Largest Share of Total Medicare Benefits Spending

Spending on Part D prescription drug benefits has been a roughly constant share of total Medicare spending since the drug benefit began in 2006 (around 12-13%) and is expected to account for a similar share in the coming decade (11% in 2031). This projection does not take into account any savings to Medicare associated with implementation of the prescription drug provisions in the Inflation Reduction Act, which CBO projects will reduce the federal deficit by $237 billion between 2022 and 2031.

Spending on Medicare Advantage Has Grown as a Share of Total Medicare Spending

Another notable change in Medicare spending over the past decade is the increase in payments to Medicare Advantage plans, which are private health plans, such as HMOs and PPOs, that cover all Part A and Part B benefits and typically also Part D benefits. Medicare payments to Medicare Advantage plans for benefits covered under Part A and Part B nearly tripled between 2011 and 2021, from $124 billion to $361 billion—increasing from 26% of total Part A and Part B spending to 47% over this period. These payments are expected to increase to $943 billion in 2031, accounting for nearly 60% of total Part A and B spending that year (Figure 5). Beginning in 2023, Medicare spending on Part A and Part B benefits for beneficiaries in Medicare Advantage will exceed Part A and Part B benefits spending for beneficiaries in traditional Medicare.

Payments to Medicare Advantage Plans for Part A and Part B Benefits Nearly Tripled Between 2011 and 2021 from $124 Billion to $361 Billion and Are Projected to Increase to $943 Billion in 2031

Historically, growth in spending on Medicare Advantage is due in large part to steady growth in private plan enrollment. In 2022, 48% of eligible Medicare beneficiaries are enrolled in Medicare Advantage plans, up from 26% in 2011. Based on CBO’s latest Medicare enrollment projections, Medicare Advantage enrollment will increase to 61% of eligible Medicare beneficiaries by 2031.

In addition, Medicare pays more to private Medicare Advantage plans for enrollees than their costs would be in traditional Medicare, on average, and these higher payments have contributed to growth in spending on Medicare Advantage and overall Medicare spending. In 2022, payments to Medicare Advantage plans are estimated to be 104% of what traditional Medicare would have spent on these beneficiaries, on average, according to MedPAC. This percentage is lower than in 2010, when Congress made changes to how Medicare Advantage plans are paid, but it has been trending higher since 2017.

According to the Congressional Budget Office, higher payments to Medicare Advantage plans, relative to traditional Medicare spending, are due to three factors. First, the payment methodology is based on benchmarks that are higher than traditional Medicare spending in half of all U.S. counties. Second, Medicare Advantage enrollees have higher “risk scores” than traditional Medicare beneficiaries in part because plans have a financial incentive to code for diagnoses, which increases the amount they are paid per enrollee. Third, Medicare Advantage plans typically receive higher payments based on their quality-based star ratings ($10 billion in 2022, according to KFF analysis), but these bonus payments do not apply to traditional Medicare.

Administrative Expenses in Traditional Medicare Are Relatively Low, But Higher for Medicare Part D and Medicare Advantage Plans

The overall cost of administering benefits for traditional Medicare is relatively low. In 2021, administrative expenses for traditional Medicare (plus CMS administration and oversight of Part D) totaled $10.8 billion, or 1.3% of total program spending, according to the Medicare Trustees; this includes expenses for the contractors that process claims submitted by beneficiaries in traditional Medicare and their providers.

This estimate does not include insurers’ costs of administering private Medicare Advantage and Part D drug plans, which are considerably higher. Medicare’s actuaries estimate that insurers’ administrative expenses and profits for Part D plans were 8% of total net plan benefit payments in 2021. The actuaries have not provided a comparable estimate for Medicare Advantage plans, but according to KFF analysis, medical loss ratios (medical claims covered by insurers as a share of total premiums income) averaged 83% for Medicare Advantage plans in 2020, which means that administrative expenses, including profits, were 17% for Medicare Advantage plans.

Medicare Spending Grew More Slowly in the Past Decade than in Decades Prior but Faster Growth Is Projected in the Coming Years

Looking at the average annual rate of growth in Medicare spending, both overall and per beneficiary, growth was notably slower in the most recent decade (2010-2020) than in prior decades, and somewhat slower than growth in private health insurance (PHI) per capita spending. For 2020-2030, the Medicare Trustees project that Medicare per capita spending growth will be higher than in the past decade, but on par with growth in private health insurance (PHI) per capita spending (Figure 6).

Growth in Medicare Spending Per Person Over Time Has Been on Par with or Lower than Spending Per Person with Private Health Insurance

Growth in Total Medicare Spending

  • Between 2010 and 2020, average annual growth in total Medicare spending was 5.9%, down from 9.0% between 2000 and 2010. The influx of younger, healthier beneficiaries since 2011, when the baby boom generation started becoming eligible for Medicare, was a contributing factor in the slower rate of growth in overall Medicare spending in the 2010s. Slower growth in Medicare spending can also be attributed to policy changes made by the ACA, including reductions in Medicare payments to plans and providers and increased revenues, and the Budget Control Act of 2011, which lowered Medicare spending through sequestration that reduced payments to providers and plans by 2%, beginning in 2013 and since extended through 2031.
  • Between 2020 and 2030, average annual growth in total Medicare spending is projected to be somewhat higher than between 2010 and 2020 (6.5% vs. 5.9%).

Growth in Medicare Spending Per Person

Prior to 2010, per enrollee spending growth rates were comparable for Medicare and private health insurance. With the recent slowdown in the growth of Medicare spending and the recent expansion of private health insurance through the ACA, the difference in growth rates between Medicare and private health insurance spending per enrollee widened but is expected to be roughly the same over the next decade.

  • In the 1990s and 2000s, Medicare spending per enrollee grew at a similar rate to per enrollee spending among people with private insurance: 5.8% and 5.9%, respectively, in the 1990s and 7.4% and 7.0% in the 2000s.
  • Between 2010 and 2020, Medicare per capita spending was relatively low, and grew more slowly than private insurance spending, increasing at an average annual rate of 1.9% over these years, while average annual private health insurance spending per capita grew at a rate of 2.8%.
  • Between 2020 and 2030, Medicare per capita spending is projected to grow at a faster rate than between 2010 and 2020, on par with average annual growth in per capita private health insurance spending (5.4% vs. 5.3%).

Growth in Per Capita Medicare Spending on Parts A, B, and D

  • Between 2010 and 2020, per capita spending on each of the three parts of Medicare (A, B, and D) grew more slowly than in previous decades (Figure 7). For Part D, estimates are based on spending starting in 2006, the first year of the Part D benefit. For example, the average annual growth rate for Part A was 0.5% between 2010 and 2020, down from 4.5% between 2000 and 2010. For Part B, average annual spending grew at 3.2% between 2010 and 2020, down from 7.0% between 2000 and 2010.
  • Between 2020 and 2030, Medicare’s actuaries project a higher per capita growth rate for each part of Medicare, compared to growth between 2010 and 2020: 4.5% for Part A (up from 0.5%), 7.2% for Part B (up from 3.2%), and 3.7% for Part D (up from 2.0%). The Medicare Trustees project faster growth in Part B per capita spending due to higher spending on outpatient hospital services and physician-administered drugs, while the projected increase in Part D per capita spending growth is driven by a slowdown in the generic dispensing rate and increased specialty drug use, offset somewhat but not completely by higher manufacturer rebates negotiated by private plans. The projections for Part B and Part D do not take into account any savings associated with implementation of the prescription drug provisions in the Inflation Reduction Act. The Medicare Trustees have not yet updated spending projections to reflect these changes.
Growth in Medicare Per Capita Spending on Part B Benefits Has Outpaced Per Capita Spending on Part A and Part D Benefits

How is Medicare Financed?

Funding for Medicare Comes Primarily from General Revenues, Payroll Taxes, and Premiums

Funding for Medicare, which totaled $888 billion in 2021, comes primarily from general revenues (46%), payroll tax revenues (34%), and premiums paid by beneficiaries (15%) (Figure 8). Other sources include taxes on Social Security benefits, payments from states, and interest. The different parts of Medicare are funded in varying ways, and revenue sources dedicated to one part of the program cannot be used to pay for another part.

Medicare Revenues Come from Different Sources, Primarily General Revenues, Payroll Taxes, and Premiums Paid by Beneficiaries
  • Part A, which covers inpatient hospital stays, skilled nursing facility (SNF) stays, some home health visits, and hospice care, is financed primarily through a 2.9% tax on earnings paid by employers and employees (1.45% each). Higher-income taxpayers (more than $200,000 per individual and $250,000 per couple) pay a higher payroll tax on earnings (2.35%). Payroll taxes accounted for 90% of Part A revenue in 2021.
  • Part B, which covers physician visits, outpatient services, preventive services, and some home health visits, is financed primarily through a combination of general revenues (73% in 2021) and beneficiary premiums (25%) (and 2% from interest and other sources). Beneficiaries with annual incomes over $97,000 per individual or $194,000 per couple pay a higher, income-related Part B premium reflecting a larger share of total Part B spending, ranging from 35% to 85% (Figure 9).
  • Part D, which covers outpatient prescription drugs , is financed primarily by general revenues (74%) and beneficiary premiums (15%), with an additional 11% of revenues coming from state payments for beneficiaries enrolled in both Medicare and Medicaid. Higher-income enrollees pay a larger share of the cost of Part D coverage, as they do for Part B.
Medicare Beneficiaries with Higher Incomes Pay Higher Monthly Premiums for Medicare Part B and Part D, Between 35% and 85% of Program Costs Depending on Income

Medicare Advantage Is Not Separately Financed

The Medicare Advantage program (sometimes referred to as Part C) does not have its own separate revenue sources. Funds for Part A benefits provided by Medicare Advantage plans are drawn from the Medicare HI trust fund (accounting for 42% of Medicare Advantage spending on Part A and B benefits in 2021). Funds for Part B and Part D benefits are drawn from the Supplementary Medical Insurance (SMI) trust fund. Beneficiaries enrolled in Medicare Advantage plans pay the Part B premium and may pay an additional premium if required by their plan. In 2022, 69% of Medicare Advantage enrollees pay no additional premium.

Assessing Medicare’s Financial Condition

Medicare’s financial condition can be assessed in different ways, including comparing various measures of Medicare spending—overall or per capita—to other spending measures, such as Medicare spending as a share of the federal budget or as a share of GDP, as discussed above, and estimating the solvency of the Medicare Hospital Insurance (Part A) trust fund.

The Medicare Hospital Insurance Trust Fund Faces Solvency Challenges

The solvency of the Medicare Hospital Insurance trust fund, out of which Part A benefits are paid, is one way of measuring Medicare's financial status, though because it only focuses on the status of Part A, it does not present a complete picture of total program spending. The solvency of Medicare in this context is measured by the level of assets in the Part A trust fund. In years when annual income to the trust fund exceeds benefits spending, the asset level increases, and when annual spending exceeds income, the asset level decreases. When spending exceeds income and the assets are fully depleted, Medicare will not have sufficient funds to pay all Part A benefits for the full year.

Each year, Medicare’s actuaries provide an estimate of the year when the asset level is projected to be fully depleted. In the 2022 Medicare Trustees report, the actuaries projected that the Part A trust fund will be depleted in 2028, six years from now. This is a modest improvement from the projection in the 2021 Medicare Trustees report, when the depletion date was projected to be 2026, based primarily on projections of higher revenues from payroll taxes resulting from higher employment and wage growth. Since 1990, the Trustees have projected that the Medicare Part A trust fund will come within six years of depletion six times (Figure 10).

Since 1990, the Medicare Hospital Insurance Trust Fund Has Come within Six Years of Depletion Six Times, Including the 2022 Projection

The actuaries estimate that in 2028, Medicare will be able to cover almost all of Part A benefits spending with revenues plus the small amount of assets remaining at the beginning of the year, and just under 90% with revenues alone in 2029 through 2031, once the assets are depleted. Over a longer 75-year timeframe, the Medicare Trustees estimate that it would take either an increase of 0.70% of taxable payroll (from 2.9% to 3.6%) or a 15% reduction in benefit payments to bring the Part A trust fund into balance.

The Solvency of the Part A Trust Fund Is Affected by Several Factors

In addition to legislative and regulatory changes that affect Part A spending (including utilization of services and payments for services provided by hospitals, skilled nursing facilities, and other providers, and for Part A services covered by Medicare Advantage plans) and revenues, Part A trust fund solvency is affected by:

  • The level of growth in the economy, which affects Medicare’s revenue from payroll tax contributions: economic growth that leads to higher employment and wages boosts revenue to the trust fund, while an economic downturn can have the opposite effect.
  • Overall health care spending trends: higher health care price and cost growth can lead to higher spending for services covered under Medicare Part A, which could hasten the depletion date, while moderation in the growth of prices and costs could slow spending growth.
  • Demographic trends: this includes the aging of the population, which is leading to increased Medicare enrollment, especially between 2010 and 2030 when the baby boom generation reaches Medicare eligibility age; a declining ratio of workers per beneficiary making payroll tax contributions, which means lower revenue; and other factors, such as fertility rates and immigration.

While Part A is funded primarily by payroll taxes, benefits for Part B physician and other outpatient services and Part D prescription drugs are funded by general revenues and premiums paid for out of separate accounts in the Supplementary Medical Insurance (SMI) trust fund. The revenues for Medicare Part B and Part D are determined annually to meet expected spending obligations, meaning that the SMI trust fund does not face a funding shortfall, in contrast to the HI trust fund. But higher projected spending for benefits covered under Part B and Part D will increase the amount of general revenue funding and beneficiary premiums required to cover costs for these parts of the program in the future.

Impact of COVID-19 on Medicare Spending and Financing

According to the Medicare Trustees, the COVID-19 pandemic has had a significant impact on Medicare spending and financing, and some effects are expected to continue for several years. In terms of revenues, the pandemic initially resulted in a substantial increase in unemployment that caused a drop in payroll tax revenue to the HI trust fund. Spending was affected by new outlays for COVID-19 treatment, testing, and vaccine administration, plus accelerated and advance payments to providers, but this higher spending was more than offset by a steep reduction in spending on non-COVID services, as utilization dropped sharply in 2020. While utilization picked up again in 2021, it remained lower than expected that year. In addition, beneficiaries who died of COVID-19 had higher costs pre-pandemic than the average Medicare beneficiary, and the lower morbidity among the surviving Medicare population contributed to modestly lower costs in 2020 and 2021, according to the Medicare Trustees.

Moving forward, the Trustees project that the spending effects of the pandemic will not have a large effect on the financial status of the Medicare program beyond 2028. Accelerated and advance payments are expected to be fully repaid by the end of 2022. A rebound in employment since the early days of the pandemic has bolstered payroll tax revenue in the short term, while Medicare spending trends are expected to return to pre-pandemic levels in 2024 as beneficiaries seek care that was deferred in 2020 and 2021, which in fact may lead to more intensive and costly services. The morbidity effect associated with deaths due to COVID-19 is expected to decrease over time and end in 2028.

The Future Outlook

Over the longer term, the Medicare program faces financial pressures associated with higher health care costs, growing enrollment, and an aging population. Growth in Medicare spending places pressure on the federal budget, contributes to the depletion of the Part A trust fund, and results in higher Medicare premiums, deductibles, and cost sharing paid by beneficiaries.

A number of changes to Medicare have been proposed in the past to address Medicare’s fiscal challenges, including options such as raising the age of Medicare eligibility and transitioning Medicare to a premium support system. More recently, Congress passed the Inflation Reduction Act of 2022, which aims to control the growth in Medicare prescription drug spending by requiring the federal government to negotiate drug prices in Medicare and requiring drug manufacturers to pay rebates for drug price increases faster than inflation, among other changes. To sustain Medicare for the long run, policymakers may consider adopting broader changes to the program that could include both changes in payments to health care providers and Medicare Advantage plans or reductions in benefits, and additional revenues, such as payroll tax increases or new sources of tax revenue.

At the same time, proposals that could increase Medicare spending are also being discussed, or have been adopted, including policies related to provider payments and Medicare benefit improvements. For example, the recently-enacted Consolidated Appropriations Act, 2023 includes several Medicare spending provisions, such as a reduction in the scheduled physician payment cut for 2023 from 4.5% to 2%, increases in payments to certain hospitals, an extension of Medicare telehealth coverage through 2024, and improvements in Medicare coverage of mental health services. Spending on these provisions will be offset in part by extending the 2% Medicare payment sequestration, currently set to expire in 2031, partway into fiscal year 2032. In addition, policymakers have expressed interest in other policies that could increase Medicare spending, such as enhancing Medicare’s benefit package by adding coverage of vision, hearing, and dental care, adding an out-of-pocket spending cap to traditional Medicare, making permanent Medicare coverage of telehealth, and strengthening financial protections for low-income beneficiaries.

While the prospects for proposals that would affect Medicare spending and financing over the long term are unknown, evaluating such changes will involve a consideration of their effects on federal expenditures, the Medicare program’s finances, and beneficiaries, health care providers, and taxpayers.

This work was supported in part by Arnold Ventures. KFF maintains full editorial control over all of its policy analysis, polling, and journalism activities.

News Release

Recent Studies Show That Medicaid Expansion Has Improved the Financial Performance of Hospitals and Other Providers, In Line With Prior Research

Published: Jan 18, 2023

A KFF synthesis of recent studies finds that Medicaid expansion has been beneficial to the finances of hospitals and providers, driving decreases in the share of uninsured patients, increases in Medicaid-covered patients and declines in uncompensated care.

By financing coverage for low-income people who are likely to otherwise be uninsured, Medicaid expansion provides potential economic benefits to the health care providers who provide care to that population. Studies suggest that hospitals experienced higher reimbursements and decreased uncompensated care costs. Studies also find that other providers, including federally qualified health centers and community health centers, experienced increased revenue following expansion.

Some studies find that these economic effects vary by provider type. For example, a few studies find that despite declines in uncompensated care costs, improvements in financial performance were stronger for (or only observed among) rural and small hospitals. A small number of studies suggest that improvements in payer mix and uncompensated care costs at hospitals may have been partially offset by increases in unreimbursed Medicaid care and declines in commercial revenue.

The new KFF analysis, the latest installment in our ongoing effort to document what the research shows about the effects of Medicaid expansion, summarizes 24 studies published between April 2021 and December 2022 on the economic impact of Medicaid expansion on providers. Recent study findings are consistent with previous research in this area.

The findings are particularly relevant given the fiscal stress experienced by Medicaid providers during the coronavirus pandemic, including recent challenges for hospitals as federal relief funds expire. The research also provides context for ongoing policy debates about whether to expand Medicaid in states that have not done so already. State costs also remain a key issue in expansion debates.

Thirty-nine states plus Washington D.C. have adopted Medicaid expansion under the ACA, with the federal government covering 90 percent of the cost and states 10 percent, while 11 states have not.

Prior KFF reports published in 2020 and 2021 reviewed more than 600 studies and concluded that expansion is linked to gains in coverage, improvement in access and health, and economic benefits for states and providers.

What Does the Recent Literature Say About Medicaid Expansion?: Economic Impacts on Providers

Authors: Meghana Ammula and Madeline Guth
Published: Jan 18, 2023

Issue Brief

A substantial body of research has investigated effects of the Affordable Care Act (ACA) Medicaid expansion, adopted by all but 11 states as of January 2023. Prior KFF reports published in 2020 and 2021 reviewed more than 600 studies and concluded that expansion is linked to gains in coverage, improvement in access and health, and economic benefits for states and providers; these generally positive findings persist even as more recent research considers increasingly complex and specific outcomes. This research provides context for ongoing debates about whether to expand Medicaid in states that have not done so already, where coverage options for many low-income adults are limited. In non-expansion states, over two million individuals fall into a coverage gap. Prior efforts at the federal level to temporarily close the coverage gap were unsuccessful in 2021 and 2022, and Republican control of the House of Representatives following the November 2022 midterm elections makes it highly unlikely that Congress will do so in the near future. So, attention once again turns back to non-expansion states, where many officials cite economic concerns about adopting Medicaid expansion.

While states have to cover 10% of the cost of expanding Medicaid, the federal government covers the remaining 90%, providing an infusion of federal funds to expansion states. By financing coverage for low-income people who are likely to otherwise be uninsured, Medicaid expansion provides potential economic benefits to the health care providers who provide care to that population.

This issue brief updates prior KFF literature reviews by summarizing 24 studies published between April 2021 and December 2022 on the economic impact of Medicaid expansion on providers. These studies identify positive effects of Medicaid expansion on the finances of hospitals and other providers, in line with prior research. These findings are particularly relevant given fiscal stress experienced by Medicaid providers during the coronavirus pandemic. While federal relief funds helped prop up hospital margins in the first two years of the pandemic, hospitals began facing increased challenges in 2022 due to ongoing pandemic effects, decreases in government relief, and broader economic trends such as pressure on wages.

Our methodology is consistent with that of prior analyses. Study findings fall into two topic areas: impacts on payer mix and on the financial performance of providers (Figure 1). Within each topic area, we first briefly summarize findings from earlier research (published between January 2014 and March 2021) and then highlight key findings from recent research that add to this body of evidence. For more information about earlier studies, see the 2021 and 2020 literature review sections on the economic impacts on providers. For citations from January 2014 through December 2022, see the Bibliography.

151 Studies Have Considered the Economic Effects of Medicaid Expansion on Providers.

Payer Mix and Uncompensated Care

Prior studies overwhelmingly found that Medicaid expansion has resulted in payer mix improvements (declines in uninsured patients and/or increases in Medicaid-covered patients). Findings include payer mix improvements for hospitalizations, emergency department visits, and visits to community health centers and other safety-net clinics. Studies identify payer mix improvements overall and among patients being treated for a range of specific conditions, including different types of cancer, traumatic injuries, and substance use disorder. In line with payer mix improvements, studies also find decreased uncompensated care costs (UCC) overall and for specific types of hospitals, including those in rural areas.

Consistent with previous research, nearly all recent studies find that expansion has resulted in payer mix improvements, including among patients treated for specific conditions, as well as decreases in UCC. Of eighteen studies that consider the impact of expansion on payer mix, eleven find both decreases in the proportion of uninsured patients and increases in Medicaid-covered patients,1 ,2 ,3 ,4 ,5 ,6 ,7 ,8 ,9 ,10 ,11  and an additional five studies find increases in Medicaid patients but did not study or found no impact of expansion on the proportion of uninsured patients.12 ,13 ,14 ,15 ,16 ,17  In line with these improvements, three studies also find decreased UCC for hospitals and other providers.18 ,19 ,20  Notably, all studies that considered emergency department visits found payer mix improvements. Studies continue to consider and find payer mix improvements for patients treated for specific conditions, such as different types of surgery and behavioral health admissions. Although studies evaluating payer mix most frequently consider hospitals, two recent studies considered coverage of primary care patients; both found that Medicaid-covered visits to primary care providers increased.21 ,22 ,23  Just two recent studies found no impact of expansion on payer mix but were narrowly focused on critical access and safety-net provider.24 ,25 

Financial Performance of Hospitals and Other Providers

Prior research found that Medicaid expansion has improved the financial performance of hospitals and other providers, though these effects may vary somewhat by hospital type. Studies show that expansion contributed to increased hospital revenue overall and from specific services. A few studies indicate that expansion reduced the number of annual hospital closures. Although studies find that expansion has improved provider operating margins and profitability, these findings vary by provider type. For example, a few studies find that despite declines in UCC, improvements in financial performance were stronger for (or only observed among) rural and small hospitals. A small number of studies suggest that improvements in payer mix and UCC at hospitals may have been partially offset by increases in unreimbursed Medicaid care and declines in commercial revenue.

Recent studies continue to find mostly positive financial impacts of expansion on specific types of hospitals, clinics, and other providers. Of eight studies in this area, six find that expansion resulted in positive financial outcomes for a range of provider types,26 ,27 ,28 ,29 ,30 ,31  while two recent studies suggest that these positive effects did not extend to critical access hospitals or free and charitable clinics.32 ,33 

  • Hospitals. Studies suggest that hospitals experienced higher reimbursements and that decreased uncompensated care costs outweighed increases in unreimbursed Medicaid care for a net positive effect.34 ,35  One study found that expansion was associated with a large reduction in hospital closures, but that this effect was concentrated among hospitals without obstetrics units, while expansion had no lasting effects on closures of hospital-based obstetrics units.36  Federal law requires all states, including those that have not expanded Medicaid, to provide Medicaid coverage to pregnant women with incomes up to at least 138% of the poverty level.37 
  • Clinics and primary care providers. Studies find that federally qualified health centers and community health centers experienced increased revenue following expansion.38 ,39  Also, one study found higher salary growth for primary care providers in expansion versus non-expansion states.40 

Looking Ahead

These new studies add to the body of prior research finding overwhelmingly positive economic effects of expansion on providers. Such findings are particularly relevant given the fiscal stress experienced by Medicaid providers during the coronavirus pandemic, including recent challenges faced by hospitals as federal relief funds expire. This research also provides context for ongoing debates about whether to expand Medicaid in states that have not done so already. Additionally, earlier literature on the financial impact of expansion on states found positive effects, including budget savings, revenue gains, and overall economic growth. Although research in this area appears to have slowed, these findings remain relevant: state costs continue to be a key issue in expansion debates and there have been fluctuations in state economic conditions during the COVID-19 pandemic. Future research could also capture the effect of the additional temporary fiscal incentive included in the American Rescue Plan Act (ARPA) of 2021 (estimated to more than offset the state costs of expansion for the first two years following implementation).41 

Bibliography

Bibliography, January 2014 to December 2022

Bibliography (.pdf)

Endnotes

  1. Diana Hamer et al., "Effect of Medicaid Expansion on Visit Composition in a Louisiana Health Care System," Ochsner Journal 22 no. 2 (June 2022): 154-162, https://doi.org/10.31486/toj.21.0106 ↩︎
  2. Fan Zhao and Roch A. Niango, "Medicaid Expansion’s Impact on Emergency Department Use by State and Payer," Health Policy Analysis 25 no. 4 (April 2022), https://doi.org/10.1016/j.jval.2021.09.014 ↩︎
  3. Jayani Jayawardhana, "Impact of Medicaid Expansion on Mental Health and Substance Use Related Emergency Department Visits," Substance Abuse 43 no. 1 (July 2021): 356-363, https://doi.org/10.1080/08897077.2021.1941521 ↩︎
  4. Vashisht V. Madabhushi, "Impact of the Affordable Care Act Medicaid Expansion on Reimbursement in Emergency General Surgery," Journal of Gastrointestinal Surgery 26 (May 2021): 191-196, https://doi.org/10.1007/s11605-021-05028-8 ↩︎
  5. Ankit Mishra et al., "ACA Medicaid Expansion Reduced Disparities in Use of High-volume Hospitals for Pancreatic Surgery," Pancreas Presented at the Academic Surgical Congress 2020 170 no. 6 (December 2021): 1785-1793, https://doi.org/10.1016/j.surg.2021.05.033 ↩︎
  6. Benjamin B. Albright et al., "Medicaid Expansion Reduced Uninsured Surgical Hospitalizations And Associated Catastrophic Financial Burden," Health Affairs 40 no. 8 (August 2021), https://doi.org/10.1377/hlthaff.2020.02496 ↩︎
  7. Ashley Lall et al., "Analysis of Emergency Department Utilization in Medicaid Expansion and Non-expansion States," Cureus 13 no. 10 (October 2021), https://doi.org/10.7759/cureus.18561 ↩︎
  8. Blake T. McGee et al., "Associations of Medicaid Expansion With Access to Care, Severity, and Outcomes for Acute Ischemic Stroke," Circulation: Cardiovascular Quality and Outcomes 14 no. 10 (October 2021), https://doi.org/10.1161/CIRCOUTCOMES.121.007940 ↩︎
  9. Theodoros V. Giannouchous et al., "The Effect of the Medicaid Expansion on Frequent Emergency Department Use in New York," Administration of Emergency Medicine 61 no. 6 (September 2021): 749-762, https://doi.org/10.1016/j.jemermed.2021.07.003 ↩︎
  10. Michael K. Dalton et al., "The Impact of the Affordable Care Act’s Medicaid Expansion on Patients Admitted for Burns: An Analysis of National Data," Burns 48 no. 6 (September 2022): 1340-1346, https://doi.org/10.1016/j.burns.2021.10.018 ↩︎
  11. Gianna Dingillo, Christine E. Alvarado, and Christopher W. Towe, "Affordable Care Act Medicaid Expansion is Associated With Increased Utilization of Minimally Invasive Lung Resection for Early Stage Lung Cancer," The American Surgeon (November 2022), https://journals.sagepub.com/doi/10.1177/00031348221138081 ↩︎
  12. Each of the studies that found no impact studied providers that saw very small numbers of uninsured patients in both time periods. ↩︎
  13. Nina Mulia, Camiillia K. Lui, Kara M. K. Bensley, and Meenakshi S. Subbaraman, "Effects of Medicaid Expansion on Alcohol and Opioid Treatment Admissions in U.S. Racial/Ethnic groups," Drug and Alcohol Dependence 231 no. 1 (February 2022), https://doi.org/10.1016/j.drugalcdep.2021.109242 ↩︎
  14. Jacques A. Greenberg et al., "Association of the Affordable Care Act With Access to Highest-Volume Centers for Patients with Thyroid Cancer," Surgery 171 no. 1 (September 2021): 132-139, https://doi.org/10.1016/j.surg.2021.04.059 ↩︎
  15. Jacob K. Greenberg, Derek S. Brown, Margaret A. Olsen, and Wilson Z. Ray, "Association of Medicaid Expansion Under the Affordable Care Act with Access to Elective Spine Surgical Care," Journal of Neurosurgery Epub ahead of print (September 2021), https://doi.org/10.3171/2021.3.SPINE2122 ↩︎
  16. Hannah T. Neprash, Anna Zink, Bethany Sheridian, and Katherine Hempsted, "The Effect of Medicaid Expansion on Medicaid Participation, Payer Mix, and Labor Supply in Primary Care," Journal of Health Economics 80 (December 2021), https://doi.org/10.1016/j.jhealeco.2021.102541 ↩︎
  17. Gianna Dingillo, Christine E. Alvarado, and Christopher W. Towe, "Affordable Care Act Medicaid Expansion is Associated With Increased Utilization of Minimally Invasive Lung Resection for Early Stage Lung Cancer," The American Surgeon (November 2022), https://journals.sagepub.com/doi/10.1177/00031348221138081 ↩︎
  18. Taitane Santos, Simone Singh, and Gary J. Young, "Medicaid Expansion and Not-For-Profit Hospitals’ Financial Status: National and State-Level Estimates Using IRS and CMS Data, 2011-2016," Sage Journals Medical Care Research and Review 79 no. 3 (April 22, 2021): 448-457, https://doi.org/10.1177/10775587211009720 ↩︎
  19. Paula Chattarjee, Rachel M. Werner, and Karen E. Joynt Maddox, "Medicaid Expansion Alone Not Associated With Improved Finances, Staffing, Or Quality At Critical Access Hospitals," Health Affairs 40 no. 12 (December 2021), https://doi.org/10.1377/hlthaff.2021.00643 ↩︎
  20. Qian Lou, Ali Moghtaderi, Anne Markus, and Avi Dor, "Financial Impacts of the Medicaid Expansion on Community Health Centers," Health Services Research 57 no. 3 (October 2021): 634-643, https://doi.org/10.1111/1475-6773.13897 ↩︎
  21. However, only one of these studies found that uninsured visits decreased (the other found no change). ↩︎
  22. Diana Hamer et al., "Effect of Medicaid Expansion on Visit Composition in a Louisiana Health Care System," Ochsner Journal 22 no. 2 (June 2022): 154-162, https://doi.org/10.31486/toj.21.0106 ↩︎
  23. Hannah T. Neprash, Anna Zink, Bethany Sheridian, and Katherine Hempsted, "The Effect of Medicaid Expansion on Medicaid Participation, Payer Mix, and Labor Supply in Primary Care," Journal of Health Economics 80 (December 2021), https://doi.org/10.1016/j.jhealeco.2021.102541 ↩︎
  24. Paula Chattarjee, Rachel M. Werner, and Karen E. Joynt Maddox, "Medicaid Expansion Alone Not Associated With Improved Finances, Staffing, Or Quality At Critical Access Hospitals," Health Affairs 40 no. 12 (December 2021), https://doi.org/10.1377/hlthaff.2021.00643 ↩︎
  25. Karen E. Lasser et al., "Changes in Hospitalizations at US Safety-Net Hospitals Following Medicaid Expansion," Jama Network Open Health Policy 4 no. 6 (June 2021), https://doi.org/10.1001/jamanetworkopen.2021.14343 ↩︎
  26. Yanlei Ma, David Armstrong, Gaetano Forte, and Hao Yu, "Effects of the Affordable Care Act Medicaid Expansion on the Compensation of New Primary Care Physicians," Official Journal of the Medical Care Section, American Public Health Association 60 no. 8 (August 2022): 636-644, https://journals.lww.com/lww-medicalcare/Abstract/2022/08000/Effects_of_the_Affordable_Care_Act_Medicaid.13.aspx ↩︎
  27. Shiyin Jiao, R. Tamara Konetzka, Harold A. Pollack, and Elbert S. Huang, "Estimating the Impact of Medicaid Expansion and Federal Funding Cuts on FQHC Staffing and Patient Capacity," Multidisciplinary Journal of Population Health and Health Policy 100 no. 2 (April 2022): 504-524, https://doi.org/10.1111/1468-0009.12560 ↩︎
  28. Taitane Santos, Simone Singh, and Gary J. Young, "Medicaid Expansion and Not-For-Profit Hospitals’ Financial Status: National and State-Level Estimates Using IRS and CMS Data, 2011-2016," Sage Journals Medical Care Research and Review 79 no. 3 (April 22, 2021): 448-457, https://doi.org/10.1177/10775587211009720 ↩︎
  29. Caitlin Carrol, Julia D. Interrante, Jamie R. Daw, and Katy Backes Kozhimannil, "Association Between Medicaid Expansion and Closure of Hospital-Based Obstetric Services," Health Affairs 41 no. 4 (April 2022), https://doi.org/10.1377/hlthaff.2021.01478 ↩︎
  30. Vashisht V. Madabhushi, "Impact of the Affordable Care Act Medicaid Expansion on Reimbursement in Emergency General Surgery," Journal of Gastrointestinal Surgery 26 (May 2021): 191-196, https://doi.org/10.1007/s11605-021-05028-8 ↩︎
  31. Qian Lou, Ali Moghtaderi, Anne Markus, and Avi Dor, "Financial Impacts of the Medicaid Expansion on Community Health Centers," Health Services Research 57 no. 3 (October 2021): 634-643, https://doi.org/10.1111/1475-6773.13897 ↩︎
  32. Julie S. Darnell and Lindsay O'Brien, "Location, Location, Location: The Affordable Care Act's Impact on Free Clinics Depends on What State They're In," Journal of Health Care for the Poor and Underserved 33 no. 2 (May 2022): 887-901, https://doi.org/10.1353/hpu.2022.0070 ↩︎
  33. Paula Chattarjee, Rachel M. Werner, and Karen E. Joynt Maddox, "Medicaid Expansion Alone Not Associated With Improved Finances, Staffing, Or Quality At Critical Access Hospitals," Health Affairs 40 no. 12 (December 2021), https://doi.org/10.1377/hlthaff.2021.00643 ↩︎
  34. Vashisht V. Madabhushi, "Impact of the Affordable Care Act Medicaid Expansion on Reimbursement in Emergency General Surgery," Journal of Gastrointestinal Surgery 26 (May 2021): 191-196, https://doi.org/10.1007/s11605-021-05028-8 ↩︎
  35. Taitane Santos, Simone Singh, and Gary J. Young, "Medicaid Expansion and Not-For-Profit Hospitals’ Financial Status: National and State-Level Estimates Using IRS and CMS Data, 2011-2016," Sage Journals Medical Care Research and Review 79 no. 3 (April 22, 2021): 448-457, https://doi.org/10.1177/10775587211009720 ↩︎
  36. Caitlin Carrol, Julia D. Interrante, Jamie R. Daw, and Katy Backes Kozhimannil, "Association Between Medicaid Expansion and Closure of Hospital-Based Obstetric Services," Health Affairs 41 no. 4 (April 2022), https://doi.org/10.1377/hlthaff.2021.01478 ↩︎
  37. Thus, the authors note that because Medicaid eligibility limits for pregnant individuals were already at or higher than the newly expanded limit for adults, the expansion would likely only improve the financial performance of obstetrics units indirectly (if hospitals used the additional revenue to cross-subsidize obstetric services). ↩︎
  38. Shiyin Jiao, R. Tamara Konetzka, Harold A. Pollack, and Elbert S. Huang, "Estimating the Impact of Medicaid Expansion and Federal Funding Cuts on FQHC Staffing and Patient Capacity," Multidisciplinary Journal of Population Health and Health Policy 100 no. 2 (April 2022): 504-524, https://doi.org/10.1111/1468-0009.12560 ↩︎
  39. Qian Lou, Ali Moghtaderi, Anne Markus, and Avi Dor, "Financial Impacts of the Medicaid Expansion on Community Health Centers," Health Services Research 57 no. 3 (October 2021): 634-643, https://doi.org/10.1111/1475-6773.13897 ↩︎
  40. Yanlei Ma, David Armstrong, Gaetano Forte, and Hao Yu, "Effects of the Affordable Care Act Medicaid Expansion on the Compensation of New Primary Care Physicians," Official Journal of the Medical Care Section, American Public Health Association 60 no. 8 (August 2022): 636-644, https://journals.lww.com/lww-medicalcare/Abstract/2022/08000/Effects_of_the_Affordable_Care_Act_Medicaid.13.aspx ↩︎
  41. Thus far, Missouri and Oklahoma implemented expansion in July 2021 following successful ballot initiatives the prior summer, and South Dakota plans to implement expansion in July 2023 following a successful ballot initiative in November 2022. ↩︎