Introduction
Women’s health outcomes are shaped not only by access to care, health insurance, and affordability, but also by the social and economic factors that drive health, discrimination, and experiences within the health care system, which have become a larger focus in providing equitable health care in recent years. One of the Institute of Medicine’s six domains of healthcare quality is patient-centered care: providing care that is respectful of and responsive to individual patient preferences, needs, and values and ensuring that patient values guide all clinical decisions. Measures of patient experience and Consumer Assessment of Healthcare Providers and Systems (CAHPS) Surveys have also become more widely used among health care organizations and clinics interested in assessing the patient-centeredness of the care they deliver and areas of improvement. in the health care system, which have become a larger focus in providing equitable health care in recent years.
This brief presents findings from the 2022 KFF Women’s Health Survey (WHS) on women’s experiences with the health care system including screening for social determinants of health, provider communication and interactions, and discrimination. The KFF WHS is a nationally representative survey of 5,145 self-identified women ages 18 to 64, conducted May 10 – June 7, 2022. See the Methodology section for more details.
Summary of Findings
- Among women ages 18-64 who have seen a health care provider in the past two years:
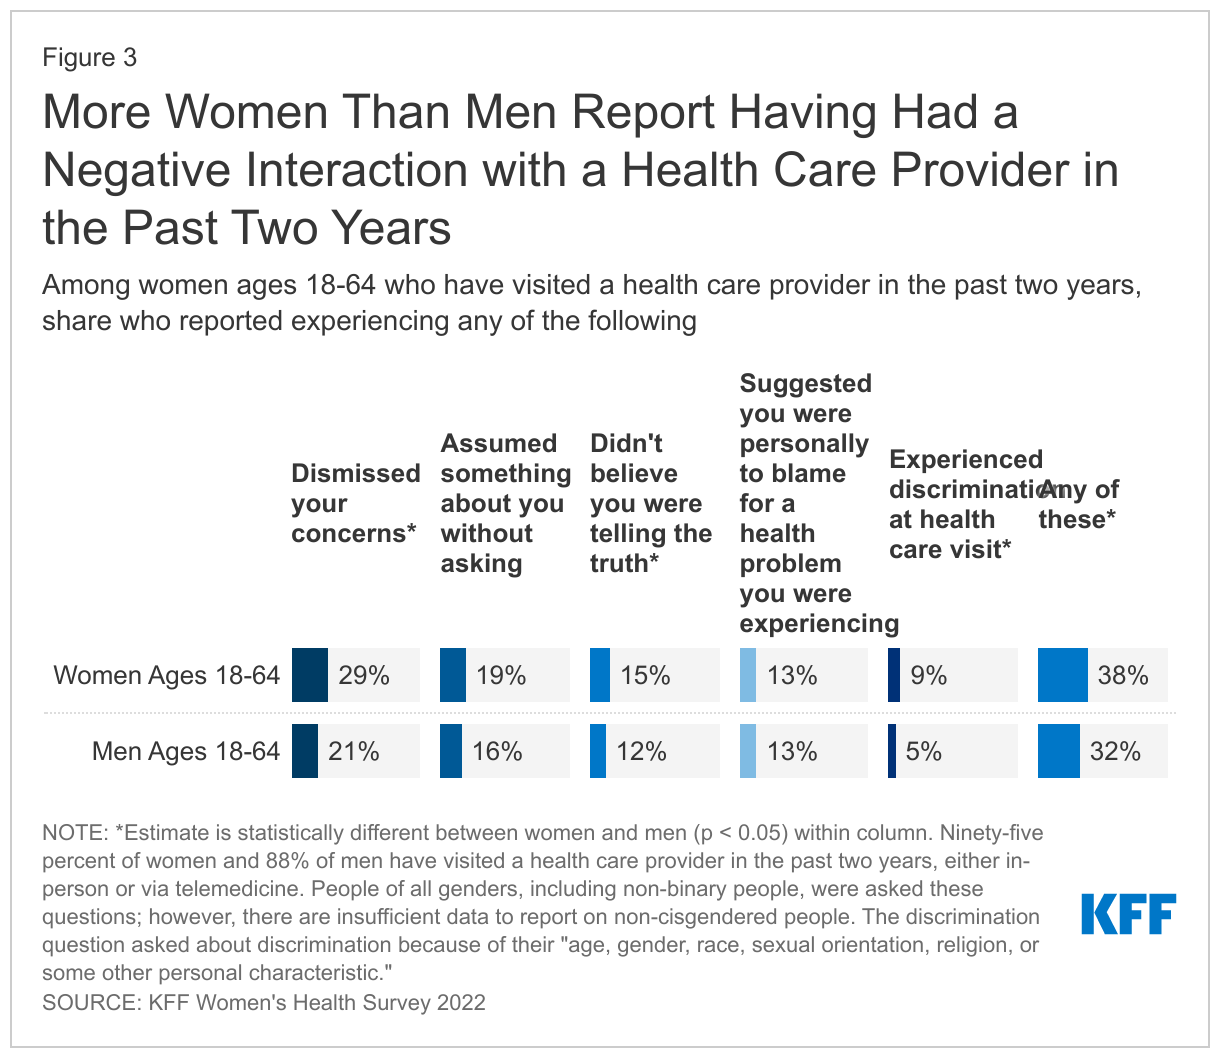
- Twenty-nine percent report that their doctor had dismissed their concerns in that time period, 15% reported that a provider did not believe they were telling the truth, 19% say their doctor assumed something about them without asking, and 13% say that a provider suggested they were personally to blame for a health problem. A higher share of women (38%) than men (32%) report having had at least one of these negative experiences with a health care provider.
- One in ten (9%) women ages 18-64 say that they have experienced discrimination because of their age, gender, race, sexual orientation, religion, or some other personal characteristic during a health care visit in the past two years.
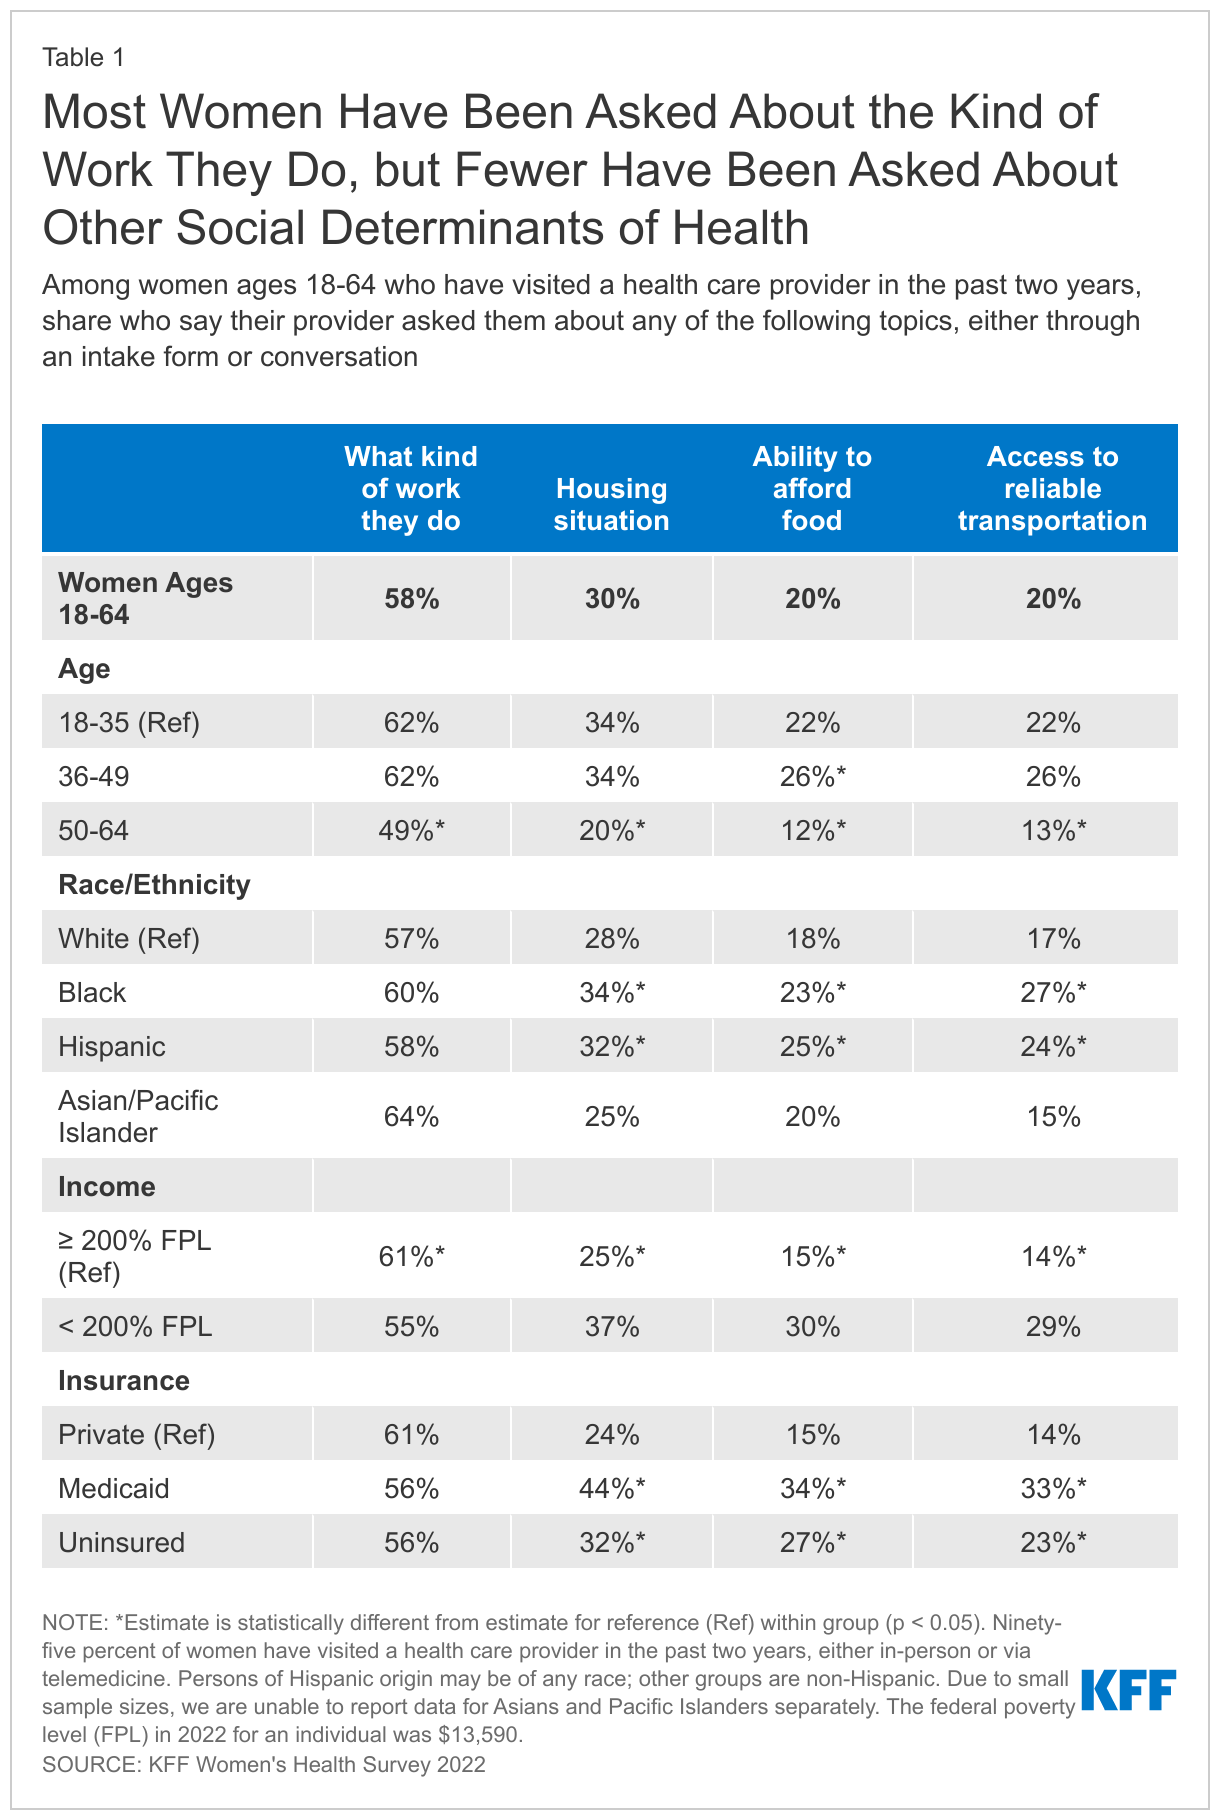
- Few women report being asked about social and economic factors that may influence health. While 58% report that in the past two years their provider asked them about what kind of work they do, far fewer report having been asked about their housing situation (30%), their ability to afford food (20%), or access to reliable transportation (20%). Women with Medicaid and those with low incomes are more likely to say they have been asked about these last three indicators than women with private insurance and those with higher incomes.
- Communication is an important component of health care quality; however, 21% of women (including 38% of uninsured women), say it is difficult to find a doctor who explains things in a way that is easy to understand.
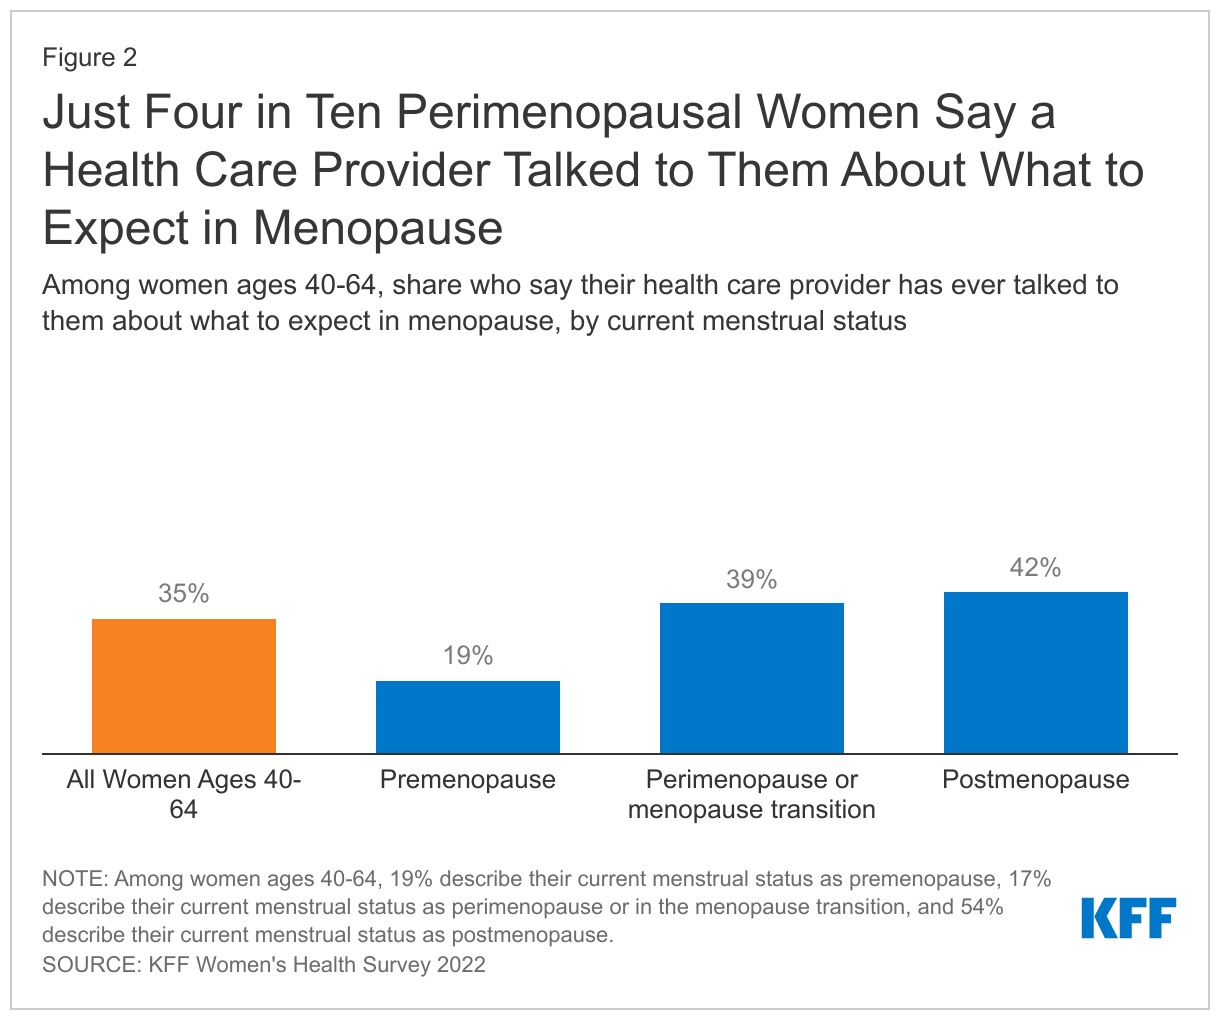
- Just over one-third (35%) of women ages 40-64 say their health care provider ever talked to them about what to expect in menopause.
Screening for Social Determinants of Health
In recent years, the social determinants of health have been recognized as critical factors that shape health outcomes. These factors include housing, transportation, nutrition, and financial well-being. Although there are no formal recommendations for routine screening for social determinants of health, a recent review conducted for the U.S. Preventive Services Task Force found that screening for risk factors including housing, food security, and transportation shows positive effects on health outcomes. In fact, six health professional organizations specifically encourage social risk screening and referrals in clinical settings (American Academy of Family Physicians, American Academy of Pediatrics, American College of Obstetricians and Gynecologists, American College of Physicians, American Diabetes Association, and American Osteopathic Association).
HRSA-funded federally qualified health centers (FQHCs), which provide primary care services in underserved areas, must report whether they screen patients for social risk factors and if so, the total number of patients that screened positive for food insecurity, housing insecurity, financial strain, and lack of transportation/access to public transportation. One study found that the majority of FQHCs collected this type of information, but some evidence suggests these screenings may be less common in other health care settings. Medicaid contracts are also increasingly requiring managed care plans to screen for the social determinants of health and many plans report being engaged in activities to address enrollees’ social needs.
Nearly three in five (58%) women who have visited a doctor in the past two years say they were asked about the kind of work they do, but only one in five were asked about their ability to afford food (20%) or access to reliable transportation (20%).
Fifty-eight percent of women who have seen a health care provider in the past two years report that their provider asked about what kind of work they do in the past two years (Table 1).
Three in ten (30%) women who have seen a health care provider in the past two years report having been asked about their housing situation, with higher shares among uninsured women (32%), women with Medicaid coverage (44%), and women with low incomes (37%).
Fewer women report that their provider asked them about their ability to afford food (20%) or access to reliable transportation (20%). A larger share of uninsured women (27% and 23%, respectively) and women with Medicaid (34% and 33%, respectively) say they were asked about these two topics than women with private insurance (15% and 14%, respectively).
Black and Hispanic women are more likely than White women to say they were asked about their housing situation, ability to afford food, and access to reliable transportation. Women ages 18-35 are more likely than women ages 50-64 to say they have been asked about all of these topics by their provider in the past two years.
A higher share of women in 2022 say that in the past two years their health care provider asked them about their housing, ability to afford food, and access to transportation than did in 2020 (19%, 13%, and 13%, respectively).
Provider Communication
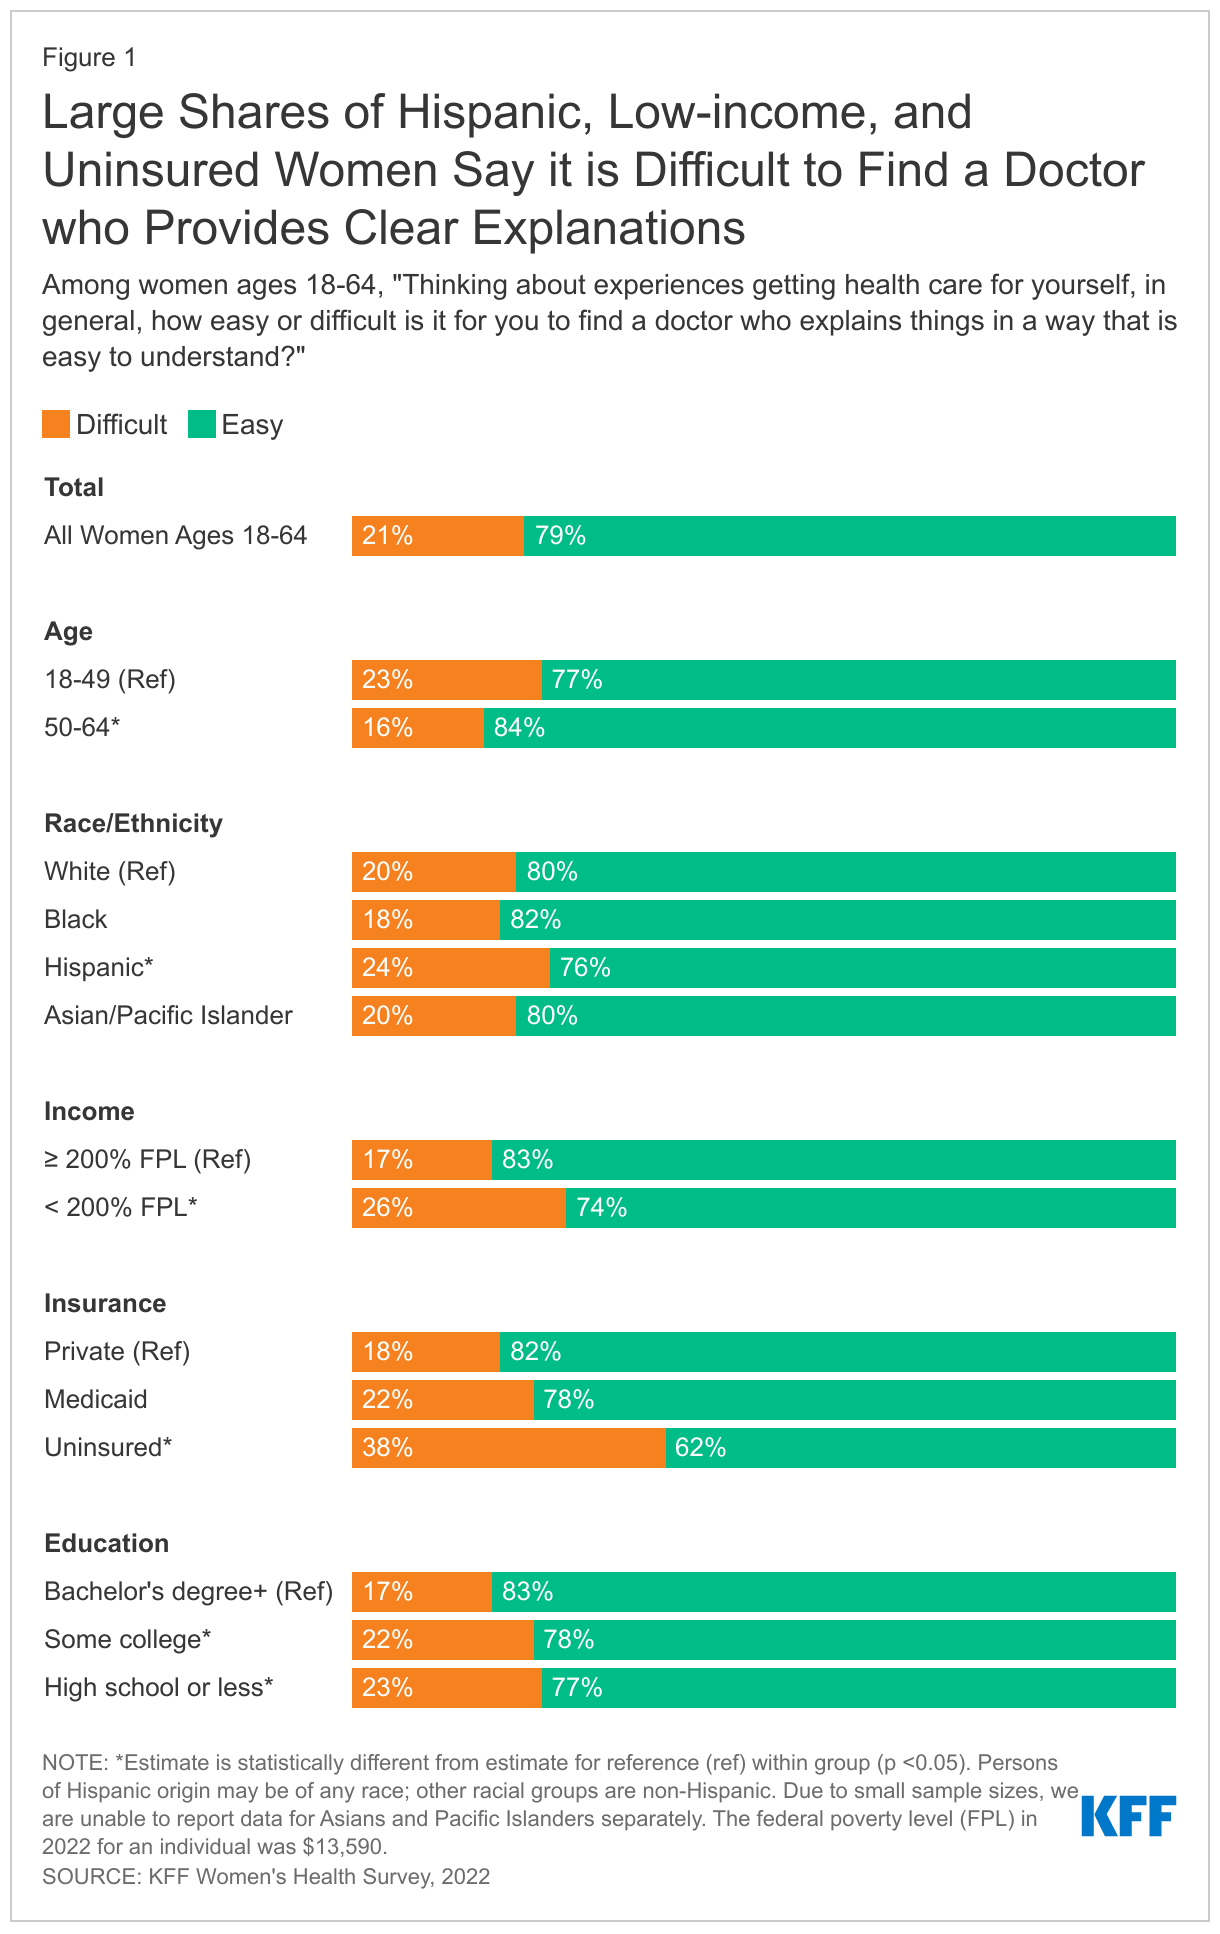
Communication is an important component of health care quality but one in five (21%) women say it is difficult to find a doctor who explains things in a way that is easy to understand.
Approximately one in four younger women (23%), women with a high school degree or less (23%), Hispanic women (24%), and women with low incomes (26%) have found it difficult to find a doctor who explains things in a way that is easy to understand (Figure 1). This share was highest among uninsured women, where more than one-third (36%) say it is difficult. These findings could reflect language barriers experienced by people with limited English proficiency, and difficulties faced by people with lower health literacy.
Menopause is a topic that has received little attention and there is a lack of information about what to expect during menopause.
One aspect of women’s health that is often not discussed with clinicians is menopause and what women can expect during this transition. Just over one-third (35%) of women ages 40-64 say their health care provider ever talked to them about what to expect in menopause (Figure 2), with wide variation by current menstrual status. Forty-two percent of women who have gone through menopause, 39% of those currently going through menopause, and 19% of premenopausal women say a provider has ever talked to them about what to expect in menopause. Providing information about what to expect during menopause can ease women’s concerns about the changes they may experience after their reproductive years and offer women options for clinical interventions.
Provider Interactions
Women are more likely than men to report experiencing certain negative provider interactions.
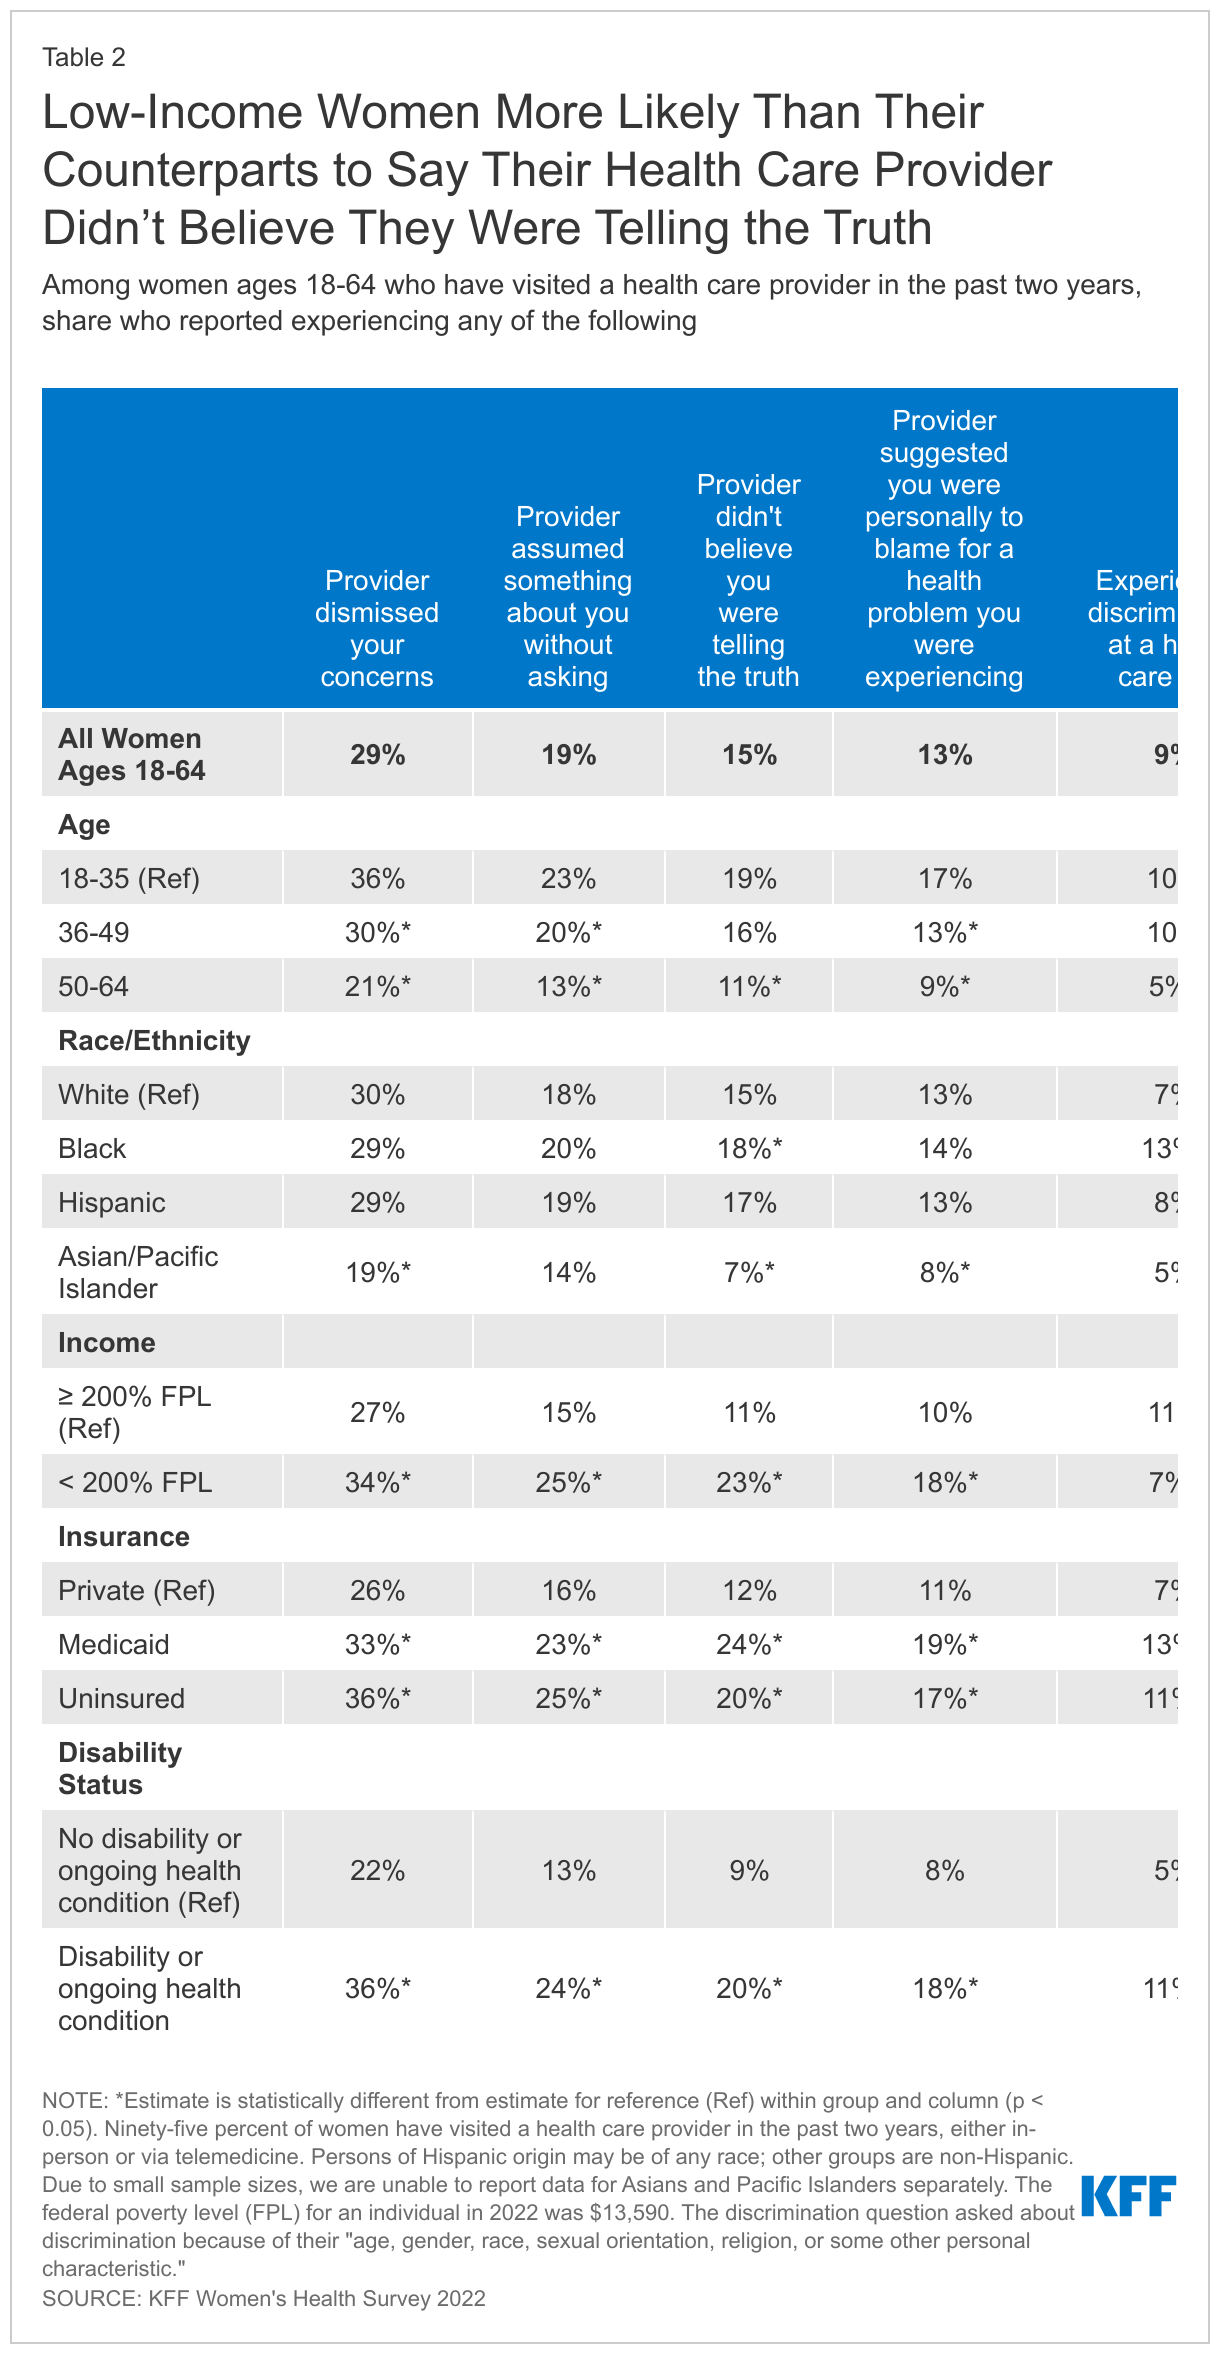
Negative interactions within the health care system can contribute to poorer health outcomes, distrust of the health care system, and health inequities. Among women and men ages 18-64 who have visited a health care provider in the past two years, 29% of women ages 18-64 report that their doctor had dismissed their concerns during that time, compared to 21% of men (Figure 3). Fifteen percent of women said they have had a provider not believe they were telling the truth, compared to 12% of men. Nine percent of women who have visited a health care provider in the past two years said they had experienced discrimination because of their age, gender, race, sexual orientation, religion, or some other personal characteristic, compared to 5% of men.
A similar share of women (19%) and men (16%) who have been to a doctor in the past two years say their doctor assumed something about them without asking in the past two years. The same share of women and men say that a provider suggested they were personally to blame for a health problem (13%). Overall, a higher share of women than men say they have had at least one of these experiences in the past two years (38% vs. 32%).
Among women who have visited a health care provider in the past two years, larger shares of those who are covered by Medicaid or uninsured, or who have low incomes, or a disability or ongoing health condition report having had each of these four negative experiences with their provider during that time period.
Thirty-six percent of women with a disability or ongoing health condition report that a health care provider had dismissed their concerns in the past two years compared to 22% of women who do not (Table 2). A higher share of Black women (18%) who have seen a provider in the past two years say that their provider did not believe they were telling the truth than White women (15%), and a higher share of White women than Asian/Pacific Islander (7%) women say the same. More than four in ten women ages 18-35 (46%), uninsured (46%), with Medicaid coverage (44%), or with a disability or ongoing health condition (45%) who have been to a doctor in the past two years report having had at least one of these interactions.
The impacts of bias, racism, and discrimination in health care has garnered increased attention in recent years and is recognized as having detrimental effects on women’s health. Some women report experiencing discrimination at higher rates than others. Twice as many women (10%) ages 18-49 say they have experienced discrimination during a health care visit as women ages 50-64 (5%) (Table 2). A larger share of Black women ages 18-64 who have visited a health care provider in the past two years reports experiencing discrimination than White women (13% vs. 7%). Women with low incomes and those with Medicaid or who are uninsured also report experiencing discrimination because of their age, gender, race, sexual orientation, religion, or some other personal characteristic at higher rates than their counterparts.
Our discrimination survey question aims to understand people’s perceptions of various actions and experiences as discrimination. Whereas some other surveys have asked respondents about experiencing “unfair treatment” in a variety of different settings or in general, our survey takes a different approach by asking one specific question about perceived discrimination in the context of a health care visit in the past two years. People may experience different types of unfair treatment but not necessarily describe it as discrimination. As a result, surveys that ask about unfair treatment more broadly tend to have higher shares of respondents who say they have experienced that.
Conclusion
The role of social determinants on health outcomes has garnered increased recognition in recent years. Providers are increasingly discussing factors with their patients that shape access to health care and health outcomes such as food insecurity and transportation challenges, although ensuring providers have resources with which to connect patients to address these social determinants is still a challenge. Gender bias and racial discrimination in the health care system can contribute to health disparities and poorer health outcomes. Women are more likely than men to report having experienced some type of health care bias, particularly those who are in poorer health, younger, or have low incomes.
Efforts to improve provider communication and interactions and address discrimination could improve women’s experiences with the health care system, alleviate some of the barriers many women still experience when they seek care, and reduce health disparities.