News Release

As the Courts Weigh the Future of the ACA’s Preventive Services Coverage, a New Analysis Shows that Most People with Private Insurance Received At Least One of Those Benefits in 2018

Published: Mar 20, 2023

The provision of the Affordable Care Act (ACA) that requires most private health plans to cover many preventive services without any cost-sharing for their enrollees is being challenged in federal court. The U.S. District Court in the Northern District of Texas in September concluded that aspects of the requirement were unconstitutional and violated religious rights but has allowed the provision to remain in effect while it considers a remedy.

As the courts consider the ACA’s preventive services requirement, a new KFF analysis finds that roughly 100 million people received ACA-required preventive services with no patient cost-sharing in a typical year.

Overall, about 60% of the 173 million people enrolled in private health coverage used at least one of the ACA’s no-cost preventive services in 2018 prior to the COVID-19 pandemic.

The most commonly received preventive services include vaccinations, well woman and well child visits, and screenings for heart disease, cervical cancer, diabetes, and breast cancer. COVID-19 vaccines are also provided at no cost to patients under the ACA’s preventive services requirement, though how many people will take them up in the future is uncertain.

Women and children are more likely than men to have used at least one no-cost preventive service through their private insurance in 2018.

Preventive Services Use Among People with Private Insurance Coverage” also looks at variations in the use of preventive services in the large group, small group and individual markets. It is available through the Peterson-KFF Health System Tracker, an online information hub that monitors and assesses the performance of the U.S. health system. 

In addition, other KFF resources explain the Braidwood Management Inc. v. Becerra case and its implications:

Explaining Litigation Challenging the ACA’s Preventive Services Requirements: Braidwood Management Inc. v. Becerra

Learn about the implications of the most recent legal challenge contesting the ACA requirement that most private insurance plans cover specific preventive care items and services at no cost to patients.

PrEP FAQs

Answer key questions about pre-exposure prophylaxis (PrEP) and its coverage, which prompted the court challenge.

Many Women Use Preventive Services, but Gaps in Awareness of Insurance Coverage Requirements Persist: Findings from the 2022 KFF Women’s Health Survey

Review findings on women’s receipt of cancer screenings and other preventive services as well as knowledge of insurance coverage requirements for these services.

Preventive Services Covered by Private Health Plans under the Affordable Care Act

Read a summary of the federal requirements for coverage for preventive services in private plans, major updates to the requirement, and recent policy activities.

Preventive Services Tracker

Explore the adult preventive services most private plans must cover, including a summary of the recommendation, the target population, and related federal coverage clarifications.


Preventive Services Use Among People with Private Insurance Coverage

Authors: Krutika Amin, Brett Lissenden, Allison Carley, Gregory Pope, Gary Claxton, Matthew Rae, Shameek Rakshit, and Cynthia Cox
Published: Mar 20, 2023

This analysis of claims data estimates that six in ten people with private health insurance – or about 100 million people – used at least one preventive service covered without any out-of-pocket costs through a provision of the Affordable Care Act (ACA) in a typical year prior to the COVID-19 pandemic (2018).

The provision that requires most private health plans to cover many preventive services without any cost-sharing for their enrollees is being challenged in federal court. The U.S. District Court in the Northern District of Texas in September concluded that aspects of the requirement were unconstitutional and violated religious rights but has allowed the provision to remain in effect while it considers a remedy.

The most commonly received preventive services include vaccinations, well woman and well child visits, and screenings for heart disease, cervical cancer, diabetes, and breast cancer. COVID-19 vaccines are also provided at no cost to patients under the ACA’s preventive services requirement, though how many people will take them up in the future is uncertain.

Women and children are more likely than men to have used at least one no-cost preventive service through their private insurance. The analysis also looks at variations in the use of preventive services in the large group, small group and individual markets. It is available through the Peterson-KFF Health System Tracker, an online information hub that monitors and assesses the performance of the U.S. health system.

Medicaid Coverage of Behavioral Health Services in 2022: Findings from a Survey of State Medicaid Programs

Authors: Madeline Guth, Heather Saunders, Bradley Corallo, and Sophia Moreno
Published: Mar 17, 2023

Medicaid plays a key role in covering and financing care for people with behavioral health conditions. Nearly 40% of the nonelderly adult Medicaid population (13.9 million enrollees) had a mental health or substance use disorder (SUD) in 2020. Most enrollees with behavioral health conditions qualify for Medicaid because of their low incomes. Behavioral health services are not a specifically defined category of Medicaid benefits: some may fall under mandatory Medicaid benefit categories (e.g., psychiatrist services may be covered under the “physician services” category), and states may also cover behavioral health benefits through optional benefit categories (e.g., case management services, prescription drugs, and rehabilitative services). Behavioral health services for children are particularly comprehensive due to Medicaid’s EPSDT benefit for children: children diagnosed with behavioral health conditions receive any service available under federal Medicaid law necessary to correct or ameliorate the condition. However, the same is not required for adults.

To better understand the variation in access to behavioral health services for adults in Medicaid, KFF surveyed state Medicaid officials about behavioral health benefits covered for adult enrollees in their fee-for-service (FFS) programs. These questions were part of KFF’s Behavioral Health Survey of state Medicaid programs, fielded as a supplement to the 22nd annual budget survey of Medicaid officials conducted by KFF and Health Management Associates (HMA). A total of 45 states (including the District of Columbia) responded to the behavioral health benefits survey. This issue brief uses the survey data to describe the landscape of behavioral health service coverage across states, including themes across and within service categories. Additional state-by-state detail is available in KFF’s Medicaid Behavioral Health Services data collection. Further policy context is available in a series of behavioral health briefs that can be accessed in the “Behavioral Health Supplemental Survey” section on this page.

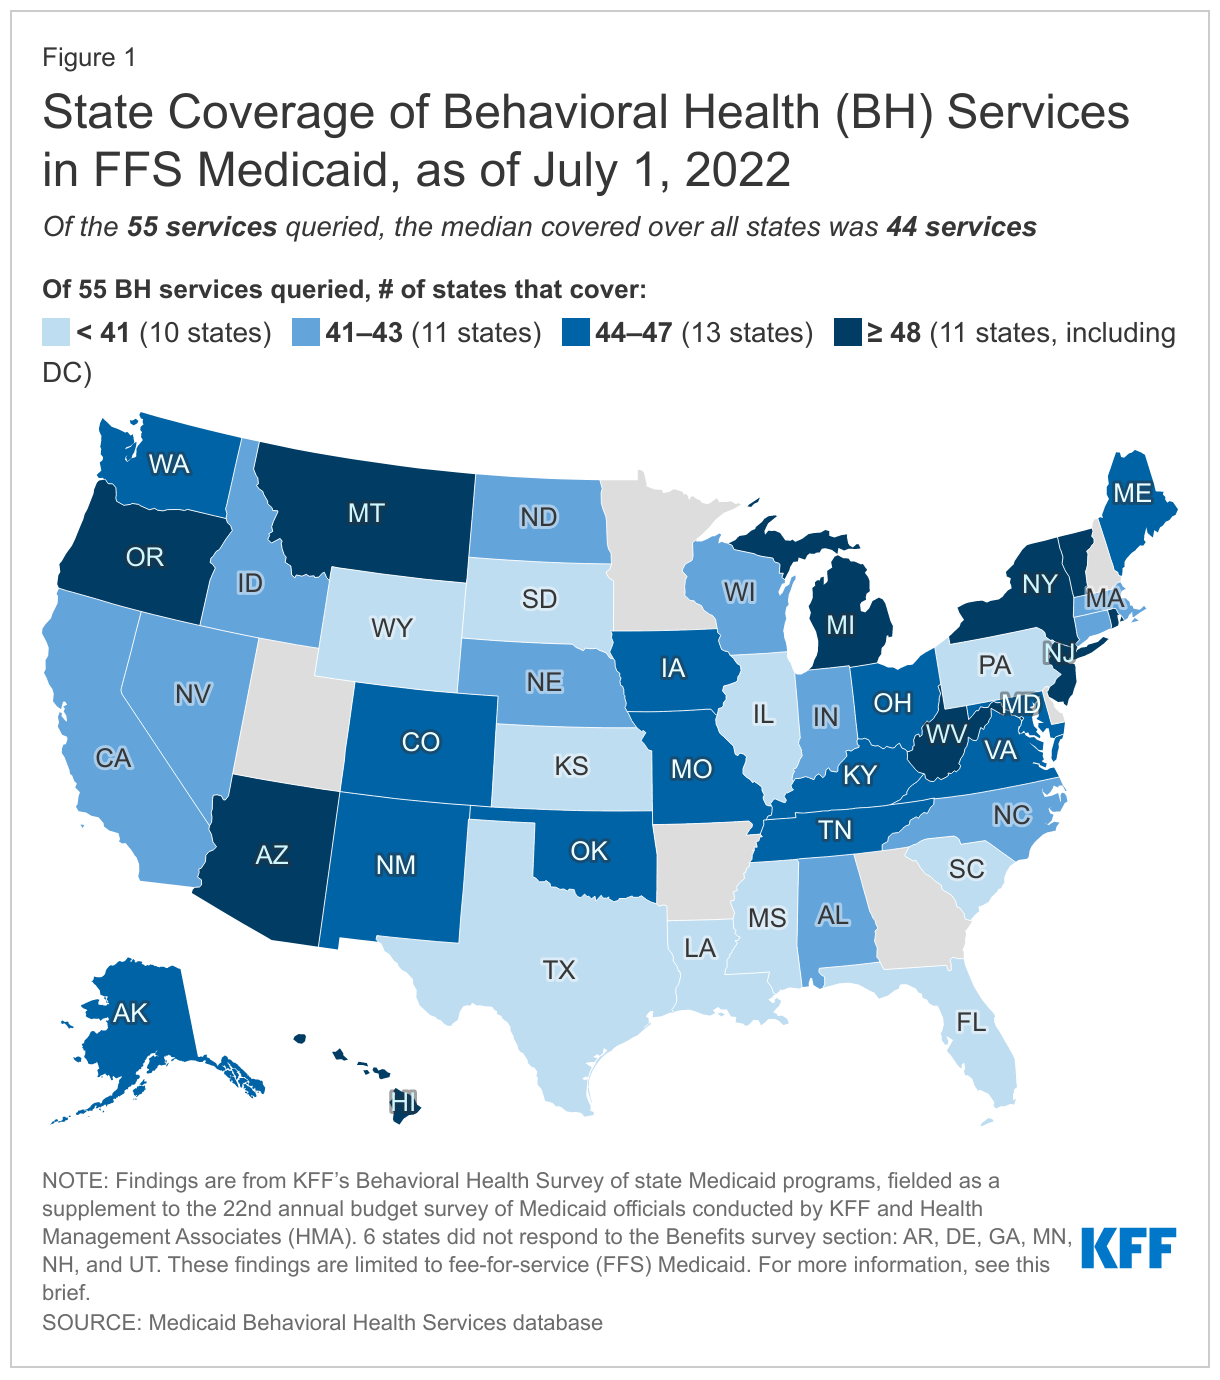
Medicaid coverage of behavioral health services varied moderately across states, with the median number of covered services at 44 of the 55 services queried (Figure 1). We provided state Medicaid officials with a list of 55 behavioral health benefits and asked them to indicate which were covered under their FFS Medicaid programs for adults, as of July 1, 2022 (for more information on survey methods, see Appendix A). We grouped the benefits queried by service category: institutional care/intensive, outpatient, SUD, naloxone (without prior authorization), crisis, integrated care, and other services. Notably, all but one state (SC) reported coverage of at least half of all services queried, with a median coverage rate of four-fifths of all services (44 of 55). These high rates of coverage reflect state trends in recent years to expand Medicaid services across the behavioral health care continuum—however, coverage of services may not translate into access to care, particularly given workforce shortages that make accessibility a challenge for Medicaid enrollees (as well as people with private insurance). We also asked states that reported coverage of each service to indicate any copay requirements as well as notable limits on the services (such as day limits or other utilization controls, including prior authorization requirements).1  Across services, most states reported no copay requirements, but limits were more common.

State Coverage of Behavioral Health (BH) Services in FFS Medicaid, as of July 1, 2022

These findings are limited to FFS Medicaid and do not comprehensively capture variation in coverage for managed care organizations (MCOs) or Section 1115 waivers. Within each service category, we asked states to note differences in coverage for populations receiving services from MCOs or through Section 1115 waivers. Most states continue to rely on MCOs to deliver inpatient and outpatient behavioral health services, and these MCOs may offer services to their adult enrollees that differ from those available on a FFS basis. States also may use Section 1115 waivers to operate their Medicaid programs in ways that differ from what is required by federal statute; these can include “comprehensive” waivers that make broad changes in Medicaid benefits and other program rules or more targeted demonstrations. For state-specific information on behavioral health benefit coverage variation in MCOs or Section 1115 waivers as reported by states, see footnotes on indicators in the data collection. See also Appendix A for a summary of survey methods.

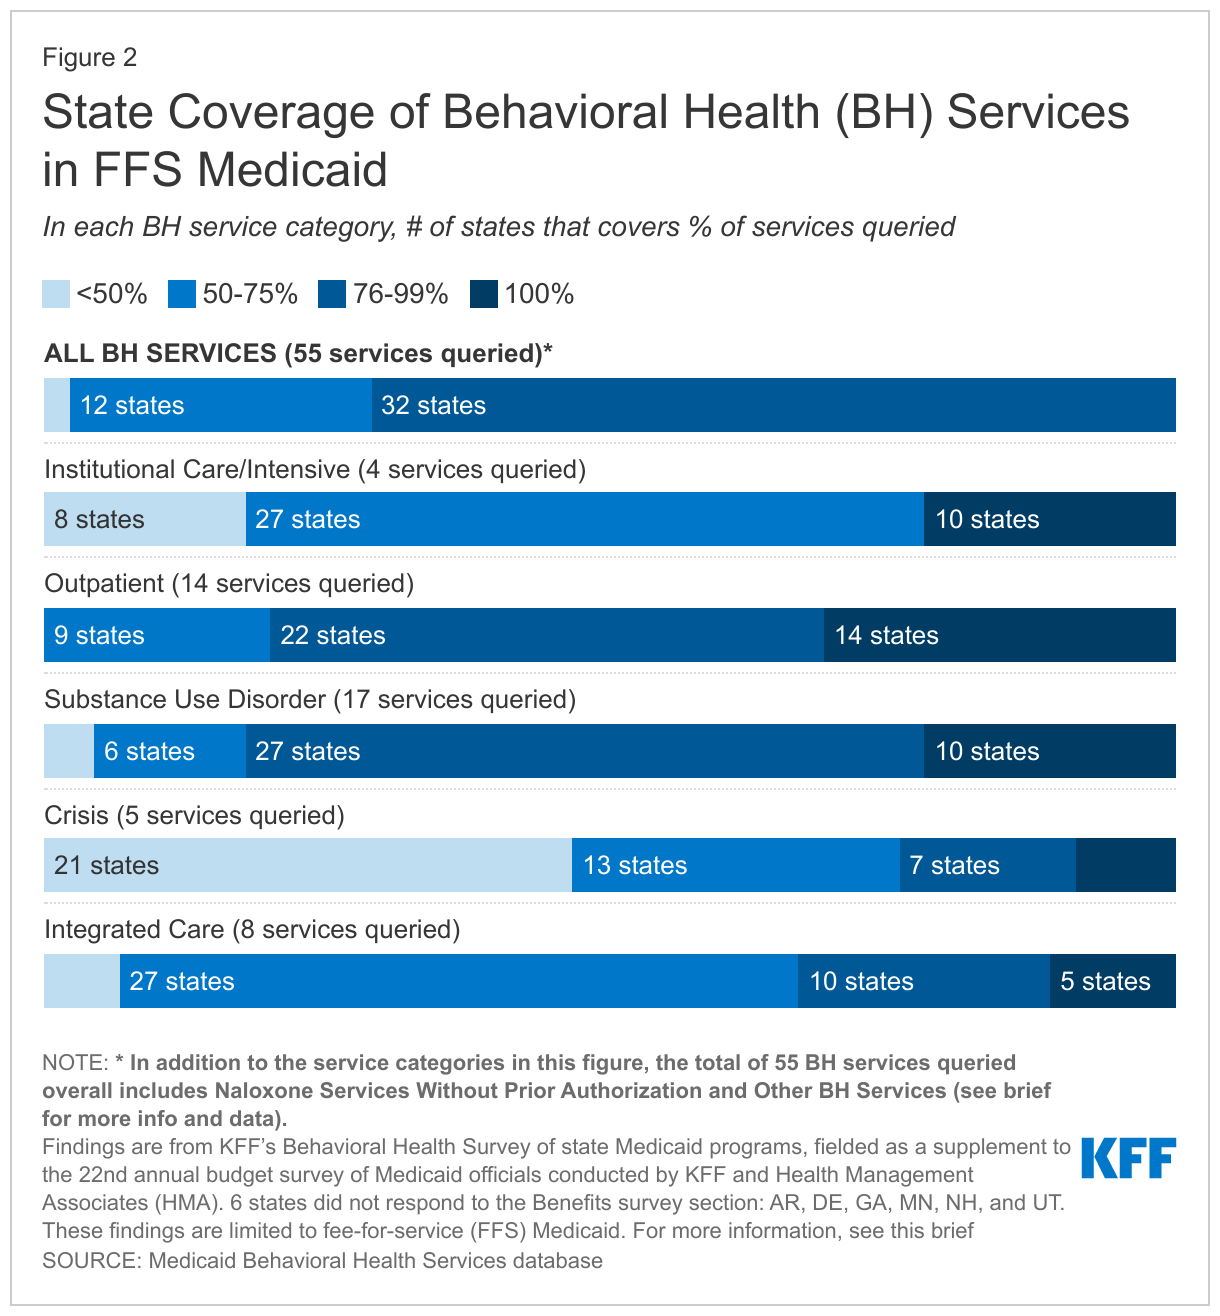
Across responding states, coverage rates were highest for SUD and outpatient services and lowest for crisis services (Figure 2). As indicated in Figure 2, for each service category, the majority of responding states covered more than 50% of the services queried, with at least a few states reporting coverage of 100% of services queried. Some states reported high coverage rates across service categories, including six states that cover more than 90% of all services queried: NY, AZ, OR, MI, NJ, and WV. Each of these states cover all services in multiple of the categories: for example, MI and OR each cover 100% of the services queried in the institutional, outpatient, SUD, and integrated care categories.2 

State Coverage of Behavioral Health (BH) Services in FFS Medicaid

Additional detail on definitions of and trends within each service category, including copays and limits, is included in the bullets below. For a detailed table showing the number of states with coverage of each individual benefit, see Appendix B.

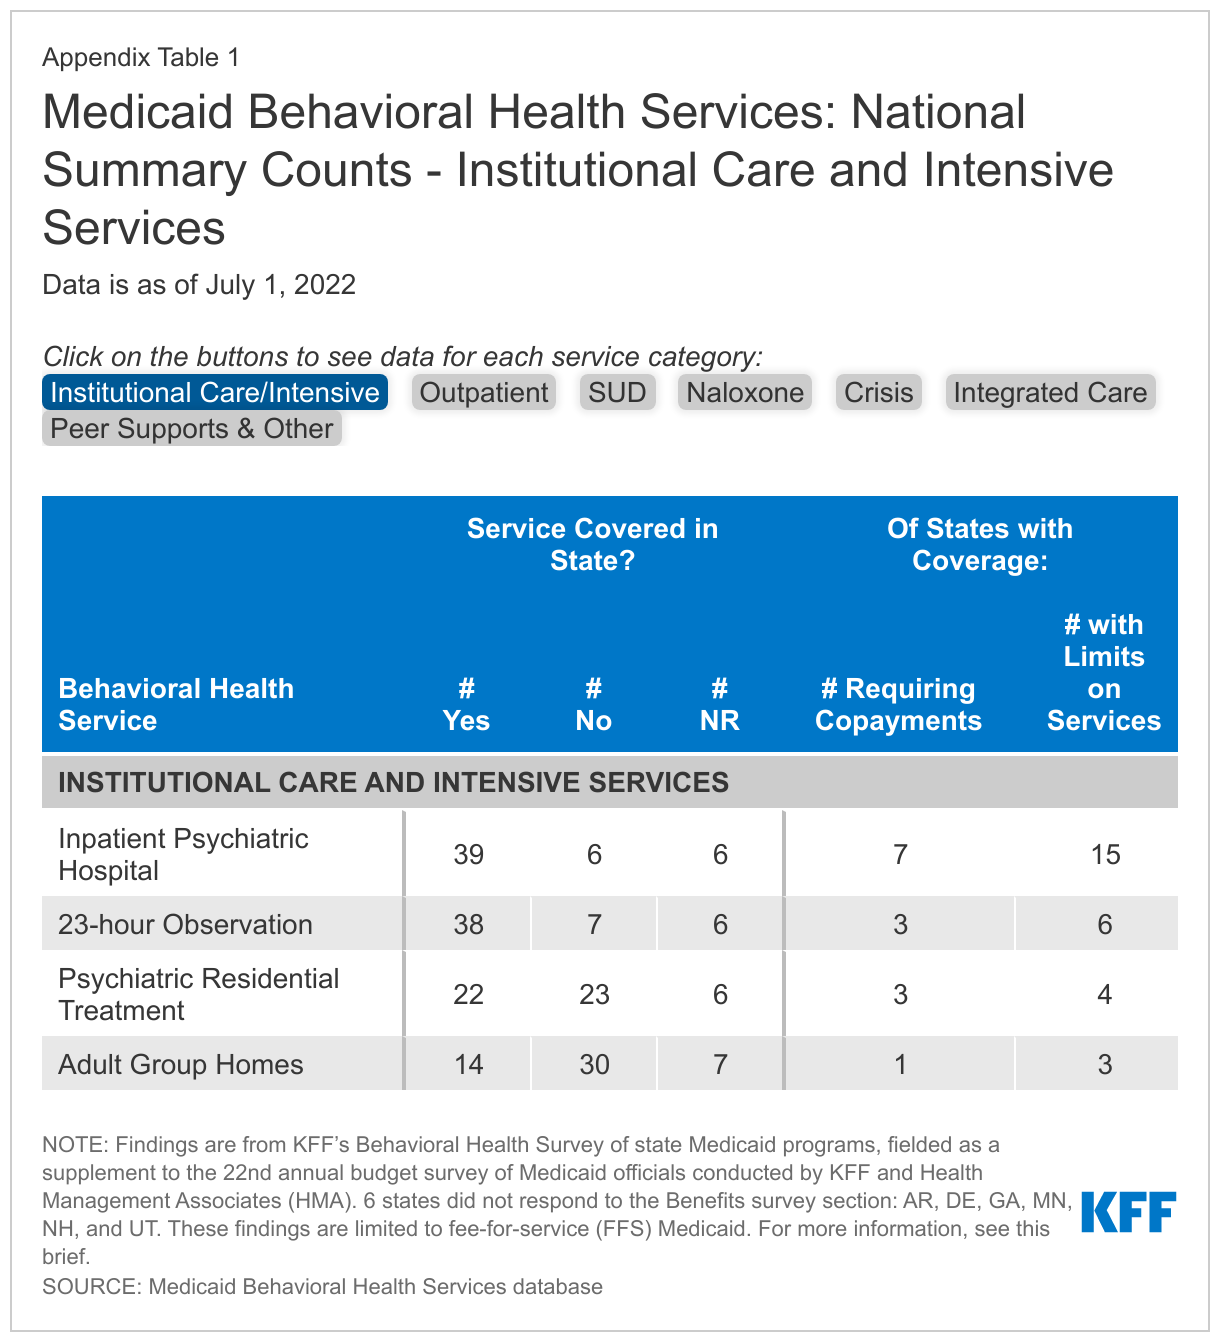
  • Institutional care and intensive services are typically reserved for situations that require a higher level of care and monitoring, such as behavioral health emergencies or long-term treatment for those with ongoing needs. Although a large majority of responding states report coverage of inpatient psychiatric hospital services and 23-hour observation, fewer than half of states report coverage of psychiatric residential treatment and adult group homes. Within this category, limits and copays are most common for psychiatric inpatient care, with more than one-third of covering states reporting limits and nearly one-fifth reporting copays. In states without Section 1115 waivers of the IMD payment exclusion, the number of psychiatric or residential care facilities that accept Medicaid may be restricted.
  • Outpatient services include a wide range of psychiatric services provided in outpatient settings. Services in this category range from psychiatric testing—which may be used to inform diagnosis of mental health conditions—to more intensive services, like partial hospitalization services—a more intensive treatment that occurs multiple times a week on an outpatient basis. While all or nearly all states cover evaluation and testing services as well as individual, family, and group therapy, there is more variation in coverage of ADL/Skills training, case management, and day treatment services. Within this category, states were most likely to report limits for case management and copays for therapy (individual, family, or group).
  • Services to treat SUD were queried in categories that follow the level of care criteria from the American Society of Addiction Medicine (ASAM), ranging from early intervention to more intensive services, such as medically monitored intensive inpatient services (which may be subject to the IMD exclusion). Most states reported the highest coverage rates for SUD services compared to the other categories, likely bolstered by provisions in the SUPPORT Act. Within this category, nearly all states cover outpatient SUD treatment, while states were least likely to cover clinically managed high intensity residential services. As services grow in intensity, the number of states placing limits on the service also increases. Also within this service category, all or nearly all states reported coverage of medications for SUD treatment, including buprenorphine, naltrexone, and methadone. About one-third of states report limits for buprenorphine, but fewer limits are reported for naltrexone, which is not a controlled substance. For most SUD medications, about one-quarter of states report copay requirements (whereas fewer states report copays for services across the ASAM levels).
    • We also asked states to report coverage of naloxone (without prior authorization requirements), which is used to reverse an opioid overdose and is prescribed to people with opioid use disorder, but may be available over the counter in the future. Nearly all states cover at least one formulation of naloxone without a prior authorization. A handful of states place other limits on these prescriptions and fewer than one-third of states require copays. (Data for this service category is not shown in Figure 2, but can be found in Appendix B.)
  • Crisis services provide specialized responses to enrollees experiencing behavioral health emergencies. These services aim to reduce the reliance on law enforcement professionals, emergency departments, and other organizations staffed by people who are not behavioral health professionals. States were less likely to cover crisis services compared to other categories: for most states, crisis services was the category for which the state reported the lowest coverage rate, including several states that reported covering none of the crisis services queried. In contrast, four states (AZ, NM, NY, and TN) reported covering every crisis service queried. The wide range of coverage across states may reflect the emerging nature of crisis management in behavioral health. Within this category, states most frequently covered mobile crisis services (about three-quarters of responding states). This relatively higher coverage rate could be in part connected to the American Rescue Plan Act’sprovision of a new option and enhanced funding for states to provide community-based mobile crisis intervention services.
  • Integrated care services provide behavioral health care in conjunction with physical health care. Examples include mental health screening in primary care settings and psychiatric evaluation with medical services. Traditionally, physical and behavioral health services have been delivered separately, but a growing body of evidence supports their integration. Coverage of services in this category varies; collaborative care model services are covered least frequently and psychiatric evaluations with medical services, as well as Medicaid individual/family counseling, are covered most often. For most integrated care services, few states reported copays, and limits were somewhat more common (fewer than one-fifth of states).

We also asked states to report coverage of a few additional behavioral health benefits in an “other” category. For example, more than four-fifths of responding states cover peer support services, which are provided by individuals who have personally experienced behavioral health challenges. These professionals may help enrollees with emotional support or navigation of health care or other social services. Peer supports has been identified as one method that states are using to extend the Medicaid behavioral health workforce.

Looking ahead, states may continue the trend of expanding Medicaid behavioral health benefits and may also enhance access to behavioral health care through other programs or policies. Since FY 2016, behavioral health benefits have been the most frequent category of service expansions reported on KFF’s annual Medicaid budget survey. For example, in FY 2022 and/or FY 2023, a number of states reported expanding coverage of crisis services and/or of services aimed to improve the integration of physical and behavioral health care. As access to behavioral health care is a key Medicaid priority at both the state and federal levels, these trends are likely to continue into the future. Notably, comprehensive coverage of behavioral health services has been linked to higher Medicaid acceptance rates by providers. In addition to further expanding coverage of behavioral health services, states may take additional policy actions to increase access and improve outcomes for enrollees with behavioral health conditions. For example, states may pursue initiatives to address behavioral health workforce shortages, such as by adopting permanent expansions of behavioral health telehealth policy to facilitate access to care. State Medicaid agencies may also play a role in developing, implementing, and helping to fund a statewide crisis system, including 988 crisis hotline services. KFF surveyed states on these and other behavioral health policies, with the results to be published in a series of briefs that can be accessed in the “Behavioral Health Supplemental Survey” section on this page. Finally, in addition to state Medicaid policy, federal legislation could continue to shape the behavioral health landscape for Medicaid enrollees.

This work was supported in part by Well Being Trust. KFF maintains full editorial control over all of its policy analysis, polling, and journalism activities.

This brief draws on work done under contract with Health Management Associates (HMA) consultants Angela Bergefurd, Gina Eckart, Kathleen Gifford, Roxanne Kennedy, Gina Lasky, and Lauren Niles.

Appendix A: Methodology

KFF contracted with Health Management Associates (HMA) to survey Medicaid directors in all 50 states and the District of Columbia to identify those behavioral health services covered for adult beneficiaries in their programs. The survey instrument captured information about services covered, copay requirements, and notable limits on those services as of July 1, 2022. The survey data is summarized in this brief and published on a state-by-state basis in KFF’s Medicaid Behavioral Health Services data collection. This data reflects what the states reported on the survey; responses vary in level of detail and were not verified through another source.

The survey asked states to report coverage of services in their fee-for-service (FFS) programs for categorically needy (CN) traditional Medicaid adults ages 21 and older. The survey did not ask about service coverage for medically needy (MN) coverage groups, which may differ from the state’s CN benefit package. Children were excluded from the survey because all children under age 21 enrolled in Medicaid through the categorically needy pathway are entitled to the Early and Periodic Screening, Diagnostic, and Treatment (EPSDT) benefit, which requires states to cover all screening services for children as well as any services “necessary… to correct or ameliorate” a child’s physical or mental health condition (regardless of whether the service is covered for adults). All but six states (AR, DE, GA, MN, NH, UT) submitted survey responses, though in some instances a responding state may have left a particular service row blank. The territories are not included in the data.

We provided states with a list of 55 optional Medicaid behavioral health services. For each service, the state selected from a yes/no dropdown menu on the survey to indicate whether the service was covered. The list of behavioral health services included in this survey was based on the services queried by KFF in a similar 2018 survey; the 2018 data is available in the data collection. While we have posted data for both years, the data should not be compared across years as a trend due to changes in question phrasing over time.

Note that while this survey focused on coverage in FFS, most states continue to rely on MCOs to deliver inpatient and outpatient behavioral health services, and these MCOs may offer services to their adult enrollees that differ from those available on a FFS basis. States had an opportunity on the survey to note differences in required minimum benefits for MCOs, as well as differences in benefit coverage under Alternative Benefit Plans (benefit plans that Medicaid expansion states are required to design, in line with federal guidelines, for newly eligible ACA expansion adults) or Section 1115 waiver programs. To the extent that they were reported, these notes are included in the data collection as state-specific footnotes. However, the level of comprehensiveness of states’ responses in capturing these differences varies, and the level of information provided is likely inconsistent across states. Therefore, while the state-specific footnotes may provide useful context about coverage in an individual state, they should not be taken as a complete list of differences in benefit coverage under managed care, Alternative Benefit Plans, or Section 1115 waiver programs nationally.

Additional information on Medicaid coverage of behavioral health services is available here and here.

Appendix B: Summary Table

Medicaid Behavioral Health Services: National Summary Counts - Institutional Care and Intensive Services
  1. Specifically, we asked states to describe any “notable limits on services or days or other utilization controls.” This question was open to state interpretation, so limits may not be consistently reported across states. ↩︎
  2. Also, NY covers all services in the crisis, SUD, and integrated care categories; AZ covers all services in the institutional, outpatient, crisis, and SUD categories; NJ covers all services in the institutional, outpatient, and integrated care categories; and WV covers all services in the outpatient and SUD categories. ↩︎
News Release

As State Medicaid Programs Prepare to Resume Disenrollments, Many States Are Using a Range of Strategies to Make it Easier for People Who Remain Eligible to Retain Coverage, But in Others it Will be More Difficult

Annual 50-State Survey Looks at Medicaid Eligibility, Enrollment, and Renewal Policies

Published: Mar 16, 2023

With pandemic-era protections for Medicaid enrollees set to expire this month, state Medicaid programs are gearing up to resume eligibility checks and disenrollments. But how the unwinding of the federal continuous enrollment provision affects enrollees and state budgets will vary according to states’ differing approaches and administrative capabilities, a new KFF survey finds.

The 21st annual KFF survey of state Medicaid and Children’s Health Insurance (CHIP) Program officials finds that many states are using an array of strategies to promote continuity of coverage, while other states have adopted policies that may make it harder for people who are still eligible to retain coverage. Staffing shortages and systems limitations could also affect whether eligible enrollees are able to remain enrolled.

The survey, conducted by KFF in collaboration with the Georgetown University Center for Children and Families, presents a snapshot of actions that states are taking to prepare for the unwinding of the provision that has paused Medicaid disenrollments since February 2020. It also highlights states’ Medicaid eligibility, enrollment, and renewal policies and procedures in place as of January 2023.

KFF has estimated that enrollment in Medicaid and CHIP will have grown by 23.3 million enrollees, to nearly 95 million, by the end of March when the continuous enrollment provision expires. Millions of beneficiaries are expected to be disenrolled over the next year, including some who are no longer eligible for Medicaid and others who still qualify but lose coverage due to administrative paperwork problems.

In the new survey, the one-third of states that were able to report projected coverage losses estimate that about 18 percent of Medicaid enrollees will be disenrolled after the continuous enrollment provision ends. The estimates range from seven percent to 33 percent of total enrollees and are consistent with other estimates that about 15 million people may lose Medicaid coverage over the coming year.

There is variation in the strategies states are adopting that could affect the amount of coverage losses, including:

  • Taking 12-14 months to complete renewals following the end of the continuous enrollment provision (43 states). Taking more time can help prevent inappropriate terminations of those who are still eligible but could maintain enrollment of ineligible people for longer.
  • Improving rates of renewals using ex parte processes that use reliable data sources — such as the Federal Data Services Hub and Supplemental Nutrition Assistance Program (SNAP) information — to verify ongoing eligibility, reducing the administrative burden on both states and enrollees (30 states).
  • Contacting enrollees when renewal action is needed and following up with those who don’t respond (36 states). About half of the states (27) have been flagging individuals who may no longer be eligible or who did not respond to renewal requests.
  • Adopting continuous eligibility policies for children, postpartum and for some adults that will help more people retain coverage during the unwinding. A total of 37 states have extended postpartum coverage to 12 months and 26 states provide 12-month continuous eligibility to some or all children in Medicaid and CHIP.

At the same time, some states have not adopted these strategies. Several states lack fully automated systems, processing some or most renewals manually (12 states) and others have ex parte renewal rates below 25 percent (11 states), which will increase the administrative burden on staff and enrollees. Even among states that adopt policies to promote continuity of coverage, implementation of policies and systems capacity will be key in how enrollees fare during the unwinding.

The challenge of processing an unprecedented volume of eligibility renewals and disenrollments comes at a time when most state Medicaid programs face significant staffing challenges. The survey finds that more than half of reporting states have staff vacancy rates greater than 10 percent for eligibility workers (16 of 26 reporting states) and slightly less than half for call center staff (13 of 28 reporting states).

These and other findings from the survey will be discussed today at a public web briefing. An archived video recording of the briefing will be available on kff.org later today.

The full survey report, “Medicaid and CHIP Eligibility and Enrollment Policies as States Prepare for the Unwinding of the Pandemic-Era Continuous Enrollment Provision,” includes state-level data about Medicaid and CHIP eligibility in every state. Also available are other recent KFF analyses related to the end of the continuous enrollment provision, including “Unwinding the Continuous Enrollment Provision: Perspectives from Current Medicaid Enrollees” and “Medicaid Enrollment Growth: Estimates by State and Eligibility Group Show Who may be at Risk as Continuous Enrollment Ends.

News Release

Annual Update of Key Health Data Collection by Race and Ethnicity, Now Including Mental Health Measures

Published: Mar 15, 2023

The annual update of KFF’s collection of wide-ranging data on health and health care by race and ethnicity is now available, and this year includes measures on mental health care access, mental illness, substance use disorder, suicide rates, and drug overdose death rates.

The handy reference, “Key Data on Health and Health Care by Race and Ethnicity,” has nearly 50 charts and up to 70 data measures that highlight the scale and scope of disparities among six racial and ethnic groups in three broad categories: health coverage and access to and use of care; health status, outcomes, and behaviors; and social determinants of health.

When the measures are examined collectively to see how Asian, Hispanic, Black, American Indian and Alaska Native (AIAN), and Native Hawaiian and Other Pacific Islander (NHOPI) people fare compared to White people, readers can see the extent of disparities experienced by specific groups. For example, Black people fared worse than White people in 55 measures of health and health care and Hispanic people fared worse than White people in 44 of them. However, the data may mask disparities faced by subgroups within these broad racial and ethnic categories. For example, while Asian people fare the same or better than White people on many measures, certain ethnic subgroups of Asian people may fare worse. Further, ongoing data gaps and limitations hinder the ability to have a comprehensive understanding of the experiences of smaller groups, such as AIAN and NHOPI people.

The overview of how specific racial/ethnic groups fared compared to White people is a gateway to explore the detailed findings, some of which have received attention or policy action recently:

  • Among adults with any mental illness, Black (39%), Hispanic (36%), and Asian (25%) adults were less likely than White (52%) adults to receive mental health services as of 2021.
  • 2020 data reflect that AIAN people had the highest rates of drug overdose deaths compared with all other racial and ethnic groups. Drug overdose death rates among Black people exceeded rates for White people as of 2020, reflecting larger increases among Black people in recent years.
  • Although Black people did not have higher cancer incidence rates than White people overall and across most types of cancer that were examined, they were more likely to die from cancer.
  • At birth, AIAN and Black people had a shorter life expectancy compared to White people as of 2021, and AIAN, Hispanic, and Black people experienced larger declines in life expectancy than White people between 2019 and 2021. These life expectancy trends may matter in any discussion of increasing the age of eligibility for Medicare.
  • Black infants were more than two times as likely to die as White infants, and AIAN infants were nearly twice as likely to die as White infants as of 2021. Black and AIAN women also had the highest rates of pregnancy-related mortality.

The Estimated Value of Tax Exemption for Nonprofit Hospitals Was About $28 Billion in 2020

Published: Mar 14, 2023

Editor’s note: This analysis was revised on March 27, 2023 to account for data anomalies and incorporate corrections, including to our estimate of the value of property tax exemption. These corrections result in a modest increase in the total estimated value of tax exemption, from $27.6 to $28.1 billion.

Over the years, some policymakers have questioned whether nonprofit hospitals—which account for nearly three-fifths (58%) of community hospitals—provide sufficient benefit to their communities to justify their exemption from federal, state, and local taxes. This issue has been the subject of renewed interest in light of reports of nonprofit hospitals taking aggressive steps to collect unpaid medical bills, including suing patients over unpaid medical debt, including patients who are likely eligible for financial assistance. Further, recent research indicates that nonprofit hospitals devote a similar or smaller share of their operating expenses to charity care in comparison to for-profit hospitals. In light of these concerns, several policy ideas have been floated to better align the level of community benefits provided by nonprofit hospitals with the value of their tax exemption.

This data note provides an estimate of the value of tax exemption for nonprofit facilities based on hospital cost reports, filings with the Internal Revenue Service (IRS), and American Hospital Association (AHA) survey data (see Methods for additional details). We define the value of tax exemption as the benefit of not having to pay federal and state corporate income taxes, typically not having to pay state and local sales taxes and local property taxes, and any increases in charitable contributions and decreases in bond interest rate payments that might arise due to receiving tax-exempt status. (For additional information, see Methods.)

Results

The total estimated value of tax exemption for nonprofit hospitals was about $28 billion in 2020 (Figure 1). This represented over two-fifths (44%) of net income (i.e., revenues minus expenses) earned by nonprofit facilities in that year. To put the value of tax exemption in perspective, our estimate is similar to the total value of Medicare and Medicaid disproportionate share hospital (DSH) payments in the same year ($31.9 billion in fiscal year 2020) (i.e., supplemental payments to hospitals that care for a disproportionate share of low-income patients which are intended, in part, to offset the costs of charity care and other uncompensated care).

The total estimated value of tax exemption for nonprofit hospitals was about $28 billion in 2020

The estimated value of federal tax-exempt status was $14.4 billion in 2020, which represents about half (51%) of the total value of tax exemption. This is primarily due to the estimated value of not having to pay federal corporate income taxes ($10.3 billion). In addition, we assumed that individuals contribute more to tax-exempt hospitals because they can deduct donations from their income tax base ($2.5 billion) and issue bonds at lower interest rates because the interest is not taxed ($1.6 billion). Our estimates of changes in charitable contributions and interest rates on bonds only account for federal tax rates for simplicity and may therefore understate the total value of tax exemption because they do not account for the effects of state taxes.

The total estimated value of state and local tax-exempt status was $13.7 billion in 2020, which represents about half (49%) of the total value of tax exemption. This amount includes the estimated value of not having to pay state or local sales taxes ($5.7 billion), local property taxes ($5.0 billion) or state corporate income taxes ($3.0 billion).

The total estimated value of tax exemption (about $28 billion) exceeded total estimated charity care costs ($16 billion) among nonprofit hospitals in 2020 (Figure 2), though charity care represents only a portion of the community benefits reported by these facilities. Hospital charity care programs provide free or discounted services to eligible patients who are unable to afford their care and represent one of several different types of community benefits reported by hospitals. TheInternal Revenue Service (IRS) also defines community benefits to include unreimbursed Medicaid expenses, unreimbursed health professions education, and subsidized health services that are not means-tested, among other activities. One study estimated that the value of tax exemption exceeded the value of community benefits broadly for about one-fifth (19%) of nonprofit hospitals during 2011-2018 or about two-fifths (39%) when considering the incremental value of community benefits provided relative to for-profit facilities. Other research suggests that nonprofit hospitals devote a similar or smaller share of their operating expenses to charity care and unreimbursed Medicaid costs—which accounted for most of the value of community benefits in 2017—when compared to for-profit hospitals.

The total estimated value of tax exemption (about $28 billion) exceeded total estimated charity care costs ($16 billion) among nonprofit hospitals in 2020, though charity care represents only a portion of the community benefits reported by these facilities

The value of tax exemption grew from about $19 billion in 2011 to about $28 billion in 2020, representing a 45 percent increase (Figure 3). The value of tax exemption increased in most of the years (7 out of 9) in our analysis, though there was a notable decrease of $5.8 billion in 2018. The largest single-year increase was $4.1 billion in 2020. The large decrease in the value of tax exemption in 2018 coincided with the implementation of the Tax Cuts and Jobs Act of 2017, which permanently reduced the federal corporate income tax rate from 35 to 21 percent and therefore decreased the value of being exempt from federal income taxes.

The value of tax exemption grew from about $19 billion in 2011 to about $28 billion in 2020, representing a 45 percent increase

The large increase in the value of tax exemption in 2020 overlapped with the start of the COVID-19 pandemic. This increase primarily reflects a large increase in aggregate net income for nonprofit hospitals in 2020. Although there were disruptions in hospital operations in 2020, hospitals received substantial amounts of government relief, and it is possible that other sources of revenue, such as from investment income, may have also increased. Increases in net income in turn increased the value of not having to pay federal and state income taxes.

Increases in the estimated value of tax exemption over time also reflect net income growth that preceded the pandemic as well as increases in estimated property values, supply expenses, and charitable contributions, each of which would carry tax implications if hospitals lost their tax-exempt status (e.g., with some supply expenses being subject to sales taxes). Even when setting aside the strong financial performance of nonprofit hospitals in 2020 as a potential outlier, total net income among nonprofit facilities increased substantially in the preceding years, before increasing further in 2020. Although we are not able to directly observe the value of the real estate owned by hospitals, the estimated value of exemption from local property taxes—which is based on our analysis of property taxes paid by for-profit hospitals—increased by 63 percent from 2011 to 2019. Finally, the supply expenses in our analysis increased by 44 percent and charitable contributions increased by 49 percent from 2011 to 2019.

Discussion

The estimated value of tax exemption for nonprofit hospitals increased from about $19 billion in 2011 to about $28 billion in 2020. The rising value of tax exemption means that federal, state, and local governments have been forgoing increasing amounts of revenue over time to provide tax benefits to nonprofit hospitals, crowding out other uses of those funds. This has raised questions about whether nonprofit facilities provide sufficient benefit to their communities to justify this tax benefit. Federal regulations require, among other things, that nonprofit hospitals provide some level of charity care and other community benefits as a condition of receiving tax-exempt status. However, a 2020 Government Accountability Office (GAO) report raised questions about whether the government has adequately enforced this requirement. Further, some argue that the federal definition of “community benefits” is too broad—e.g., by including medical training and research that could benefit hospitals directly—though others believe that the definition is too narrow. Most states have additional community benefit requirements for nonprofit or broader groups of hospitals—such as providing charity care to patients below a specified income threshold—though there is little information about the effectiveness of these regulations or the extent to which they are enforced.

Several policy ideas have been floated at the federal and state level that would increase the regulation of community benefits spending among nonprofit hospitals or among hospitals more generally. These include proposals to create or expand state requirements that hospitals provide charity care to patients below a specified income threshold, mandate that nonprofit hospitals provide a minimum amount of community benefits, establish a floor-and-trade system where hospitals would be required to either provide a minimum amount of charity care or subsidize other hospitals that do so, create mechanisms to increase the uptake of charity care, expand oversight and enforcement of community benefit requirements, replace current tax benefits with a subsidy that is tied to the value of community benefits provided, and introduce reforms intended to better align community benefits with local or regional needs. These policy options would inevitably involve tradeoffs. While they may expand the provision of certain community benefits, hospitals would incur new costs as a result, which could in turn have implications for what services they offer, how much they charge commercially insured patients, and how much they invest in the quality of care.

Methods

Our analysis defined the value of tax exemption as the benefit of not having to pay federal or state corporate income taxes, typically not having to pay state and local sales taxes and local property taxes, and any increases in charitable contributions and decreases in bond interest rate payments that might arise due to receiving tax-exempt status. To estimate the value of these benefits, we drew on methods from three studies and a report commissioned by the American Hospital Association (AHA). As is the case with prior work, we assumed that nonprofit hospitals and health systems would take various allowed deductions if they were required to pay taxes, but we do not capture all nuances of the tax code, nor do we model any other actions that hospitals take to reduce their tax burden, such as by changing how they operate or changing how they account for revenues and expenses. Two of the studies that we draw from estimated the total value of tax exemption or of federal tax exemption. Our estimates are smaller than these amounts, which likely reflects aspects of our approach that are more conservative than these papers. We detail our specific approach for each component below.

As a starting point, we relied on RAND Hospital Data, which applies cleaning and processing steps to annual cost report data submitted by hospitals to the Healthcare Cost Report Information System (HCRIS). Every Medicare-certified hospital must submit a cost report to a Medicare Administrative Contractor (MAC) under contract with the Centers for Medicare & Medicaid Services (CMS), meaning that HCRIS pulls data from all US hospitals except federal hospitals and some children’s hospitals. We used the calendar year version of RAND Hospital Data, which apportions data from different cost reports for hospitals that do not use a calendar year reporting period. For example, 2019 data reflect the weighted average of hospital finances during various periods from 2018 through 2020 (i.e., both before and during the COVID-19 pandemic) for a subset of hospitals. We excluded hospitals in the U.S. Territories and hospitals that did not report positive operating expenses in a given year (about 0.3% of remaining hospitals). We also relied on the AHA Annual Survey Database and IRS Form 990 data, focusing on hospitals and systems that we were able to match to RAND Hospital Data. We imputed values for supply expenses, charitable contributions, and tax-exempt bonds in instances where data were missing or unavailable for a given hospital or health system or year. We did not attempt to impute net income when missing (about 1.0% of remaining hospitals).

Federal corporate income tax. We estimated the federal corporate income tax that a given nonprofit hospital or health system would have to pay without the tax exemption by multiplying an estimate of taxable income by the federal corporate income tax rate, which was 35 percent from 2011 through 2017 but decreased to 21 percent in 2018. Our estimate of taxable income reflects the difference between revenues and expenses, accounting for deductions allowed under the federal tax code for interest rate payments, state corporate income taxes, state and local sales taxes, and local property taxes and adjusting for estimated changes in charitable contributions and bond interest rate payments. Hospitals may report unrealized gains or losses on financial instruments, which do not affect their tax base, as part of their net income. We aggregated hospital level data to the system level, as applicable, before estimating tax benefits. Aggregate estimates of tax benefits are lower when calculated at the system versus hospital level, as systems may be able to offset taxable profits from one system member with losses from another. We also modeled options for businesses to offset taxable income with losses in earlier and later years. Other studies have used an alternative approach that multiplies net income by estimates of effective tax rates based on tax filings from for-profit hospitals, nursing homes, and residential care facilities. Using this approach would have increased our estimates by $3.6 billion. We chose our approach because it is more closely tied to financial data from nonprofit hospitals.

State corporate income tax. We estimated the state corporate income tax that a given nonprofit hospital or health system would have to pay without tax exemption by multiplying an estimate of their taxable income in a given state by the state corporate income tax rate. We used a similar approach to estimating taxable income as above, except that we did not deduct the state corporate income tax (by definition) and we did not allow entities to offset taxable income with losses from later years, in line with state law. We obtained state corporate income tax rates by year from the Tax Foundation.

State and local sales taxes. We estimated the state and local sales taxes that a given nonprofit hospital or health system would have to pay without tax exemption by multiplying their total non-pharmaceutical supply expenses (or, for a system, the total supply expenses among member hospitals in a given state) by the average state and local sales tax rate in that state. We obtained total non-pharmaceutical supply expenses from the AHA Annual Survey Database. We obtained average state and local tax rates by state and year from the Tax Foundation.

Property taxes. We estimated the local property taxes that a given nonprofit hospital would have to pay without the tax exemption based on the amount paid by for-profit hospitals that reported this information. In the small number of states with five or more for-profit hospitals, we calculated the median ratio of property taxes to operating expenses among for-profit hospitals for a given state and year and then multiplied this amount by the operating expenses for a given nonprofit hospital. In states with fewer than five for-profit hospitals, we instead relied on the national median ratio among for-profit hospitals.

Charitable contributions. If nonprofit hospitals were no longer tax-exempt, donors who take itemized deductions for income taxes would no longer be able to deduct their contributions. We assumed that donors would decrease their contributions by an amount equal to their tax increase. We estimated this amount by multiplying charitable contributions by the estimated average household marginal tax rate of donors to health care organizations (32% from 2011 to 2017 and 23% from 2018 to 2020). Our 2011 to 2017 estimate of the marginal tax rate comes from a previous study. We updated this amount for 2018 to 2020 based on a Tax Policy Center estimate of the decrease in the average effective marginal tax rate for all donors in 2018 as a result of changes to the tax code. We estimated charitable contributions from Internal Service Revenue (IRS) Form 990 data by subtracting government grants and in-kind contributions from total contributions, gifts, grants, and other related amounts.

Bond interest rate payments. We assumed that, if interest rate payments from hospitals to bondholders were taxed, issuers would increase interest rates accordingly. We estimated the difference between taxable and non-taxable interest rates by: (1) estimating the average taxable interest rate using a rolling average of the Moody’s Seasoned Aaa and Baa index over the previous 10 years, (2) assuming a marginal tax rate for investors of 24 percent (based on a Capital Group post suggesting that municipal bonds are a better investment than taxable bonds for individuals with a marginal tax rate of 24% or higher), (3) assuming that average bond interest rates for nonprofit hospitals are equal to the after-tax bond interest rates among for-profit hospitals (so that investors are indifferent between the two), and (4) taking the difference. To estimate the value to a given hospital of paying lower interest rates, we multiplied the difference by the total value of tax-exempt bonds issued, which we obtained from IRS Form 990 data.

We used RAND Hospital Data to estimate charity care costs in 2020 based on amounts reported by the hospitals in our tax exemption analysis. HCRIS instructions indicate that hospitals should report amounts related to both their charity care and uninsured discounts as part of their charity care costs. After cleaning these data, we imputed values in instances where data were missing.

This work was supported in part by Arnold Ventures. KFF maintains full editorial control over all of its policy analysis, polling, and journalism activities.

News Release

Nonprofit Hospitals’ Tax-Exempt Status Worth About $28 Billion, New KFF Analysis Finds

Published: Mar 14, 2023

Editor’s Note: The press release was updated on March 27, 2023, to reflect corrections in the underlying analysis, resulting in a modest increase in the total estimated value of tax exemption, from $27.6 to $28.1 billion.

The tax-exempt status of the nation’s nonprofit hospitals collectively was worth about $28 billion in 2020, a new KFF analysis of hospital financial data estimates.

The total reflects the estimated federal, state and local taxes that nonprofit hospitals do not have to pay. It also includes estimated increases in charitable contributions and decreases in bond interest rate payments due to hospitals having tax-exempt status.

Nearly three-fifths of the nation’s community hospitals are nonprofits, an Internal Revenue Service designation that requires hospitals to provide charity care and other benefits to their communities in exchange for federal tax-exempt status.

The $28 billion total is much higher than the $16 billion in free or discounted services provided by nonprofit hospitals in 2020 through their charity care programs, though charity care is just one element of the community benefits nonprofit hospitals provide. Other community benefits include unreimbursed expenses related to Medicaid and health professional education, and certain subsidized health services.

The Estimated Value of Tax Exemption for Nonprofit Hospitals Was About $28 Billion in 2020” is available as part of KFF’s expanding work examining the business practices of hospitals and other providers, and their impact on costs and affordability.

News Release

Challenges to the FDA’s Approval of Medication Abortion Pills Could Curtail Access Throughout the United States

Published: Mar 14, 2023

In anticipation of a ruling in a case with enormous implications for access to medication abortion in the United States, a new KFF brief explains the impact of this case, and others filed in federal courts, involving the FDA’s regulation of medication abortion. The case that has gotten the most attention recently is Alliance for Hippocratic Medicine (AHM) v. FDA, filed in November 2022, a challenge to the FDA’s decision to approve mifepristone (the first medication taken as part of the medication abortion drug regimen) and to include misoprostol in the medication abortion regimen. The outcome of AHM v. FDA, along with the other challenges, could have ramifications for access to medication abortion throughout the country, including in states where abortion is legal and protected. The outcome could also potentially have broader implications for the FDA’s authority in regulating drugs.

Read the brief, “Legal Challenges to the FDA Approval of Medication Abortion Pills,” which focuses on the major claims in the AHM case. Many of the issues raised in the brief will also be relevant to the other abortion cases involving the FDA and its role in approving and regulating mifepristone.

News Release

As Congress Considers Reauthorizing PEPFAR, A New Policy Watch Asks and Answers Fundamental Questions

Published: Mar 13, 2023

As Congress considers reauthorizing the President’s Emergency Plan for AIDS Relief (PEPFAR) for a fourth time, a new KFF Policy Watch details key facts about the program and top issues related to its authorization and funding. Created in 2003 as the U.S. government’s signature global health effort in the fight against HIV, PEPFAR is broadly regarded as one of the most successful programs in global health history, with the U.S. government reporting tens of millions of lives saved over the past 20 years. However, the reauthorization comes in a period of heightened debate over the federal budget in a divided Congress.

The Policy Watch asks and answers frequently asked, fundamental questions about PEPFAR’s reauthorization, including:

•    Will PEPFAR end without reauthorization?

•    Are there any provisions of the program that would end without reauthorization?

•    Is PEPFAR reauthorization required for the program to receive continued funding?

•    What are some issues to consider for PEPFAR’s future, and are these affected by reauthorization?

Read “PEPFAR Reauthorization 2023: Key Issues” and access a variety of resources about the program in our PEPFAR Policy Resource Hub