- Large majorities of parents have positive views of long-standing childhood vaccinations for measles, mumps, and rubella (MMR) and polio, saying these vaccines are important for children in their community to get (90% and 88%, respectively) and that they are confident they are safe for children (84% and 85%). About eight in ten parents support current state laws, saying students should be required to be vaccinated against measles and polio to attend public schools with some exceptions (81%). These views are consistent across partisan lines, with large majorities of parents who identify as Democrats, independents, and Republicans viewing MMR and polio vaccines as safe and important for children to get and supporting policies that require these vaccines in public schools.
- Views on seasonal vaccines for flu and especially COVID-19 are more divided, with much smaller shares of parents expressing confidence that these vaccines are safe for children (65% for flu and 43% for COVID-19) and saying they are important for children in their community to get (56% and 43%, respectively). Parents’ views on COVID-19 and flu vaccines divide along partisan lines, with Democratic parents much more likely than Republican parents to hold positive views of both. Republican parents who support the Make America Great Again (MAGA) movement express the most skeptical attitudes towards vaccines for children, particularly when it comes to confidence in the safety of COVID-19 (14%) and flu (48%) vaccines.
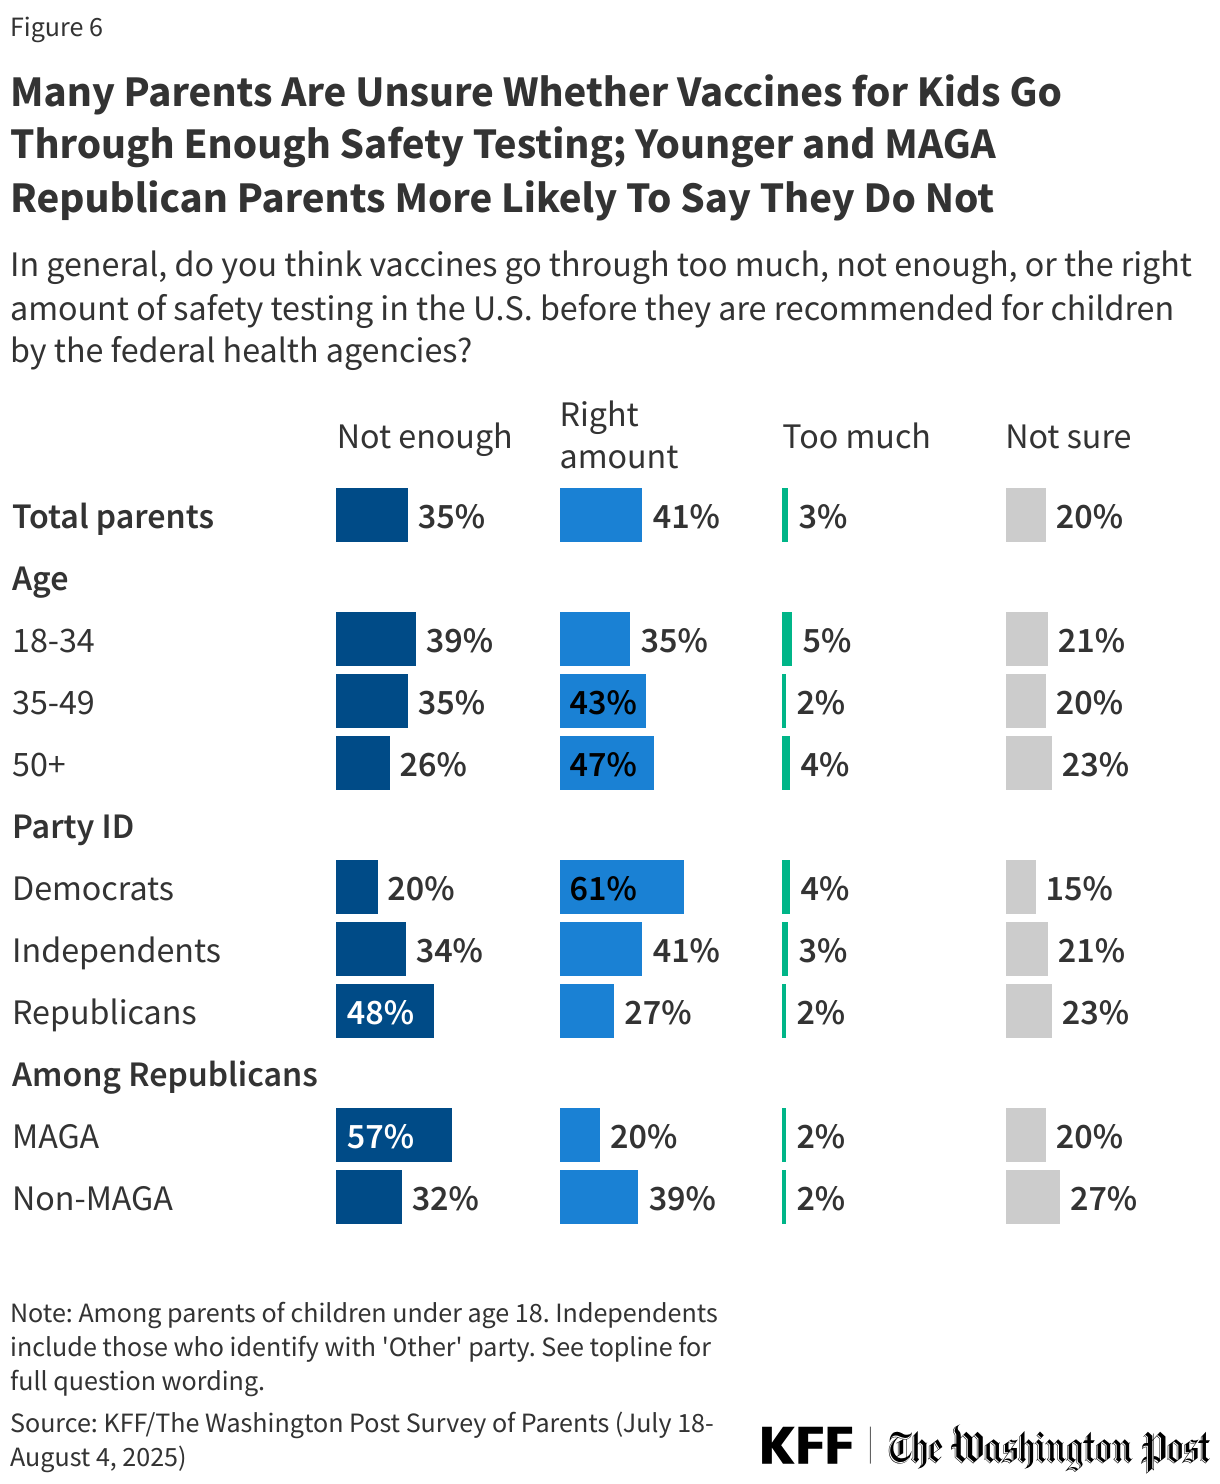
- In addition to partisan divisions, parents under age 35 express greater concern about vaccine safety compared with parents ages 35 and over, perhaps an indication of shifting attitudes with younger generations of parents. For example, four in ten (39%) younger parents say vaccines do not go through enough safety testing before being recommended for children compared with about one-third (35%) of parents ages 35 to 49 and one quarter (26%) of parents ages 50 and older.
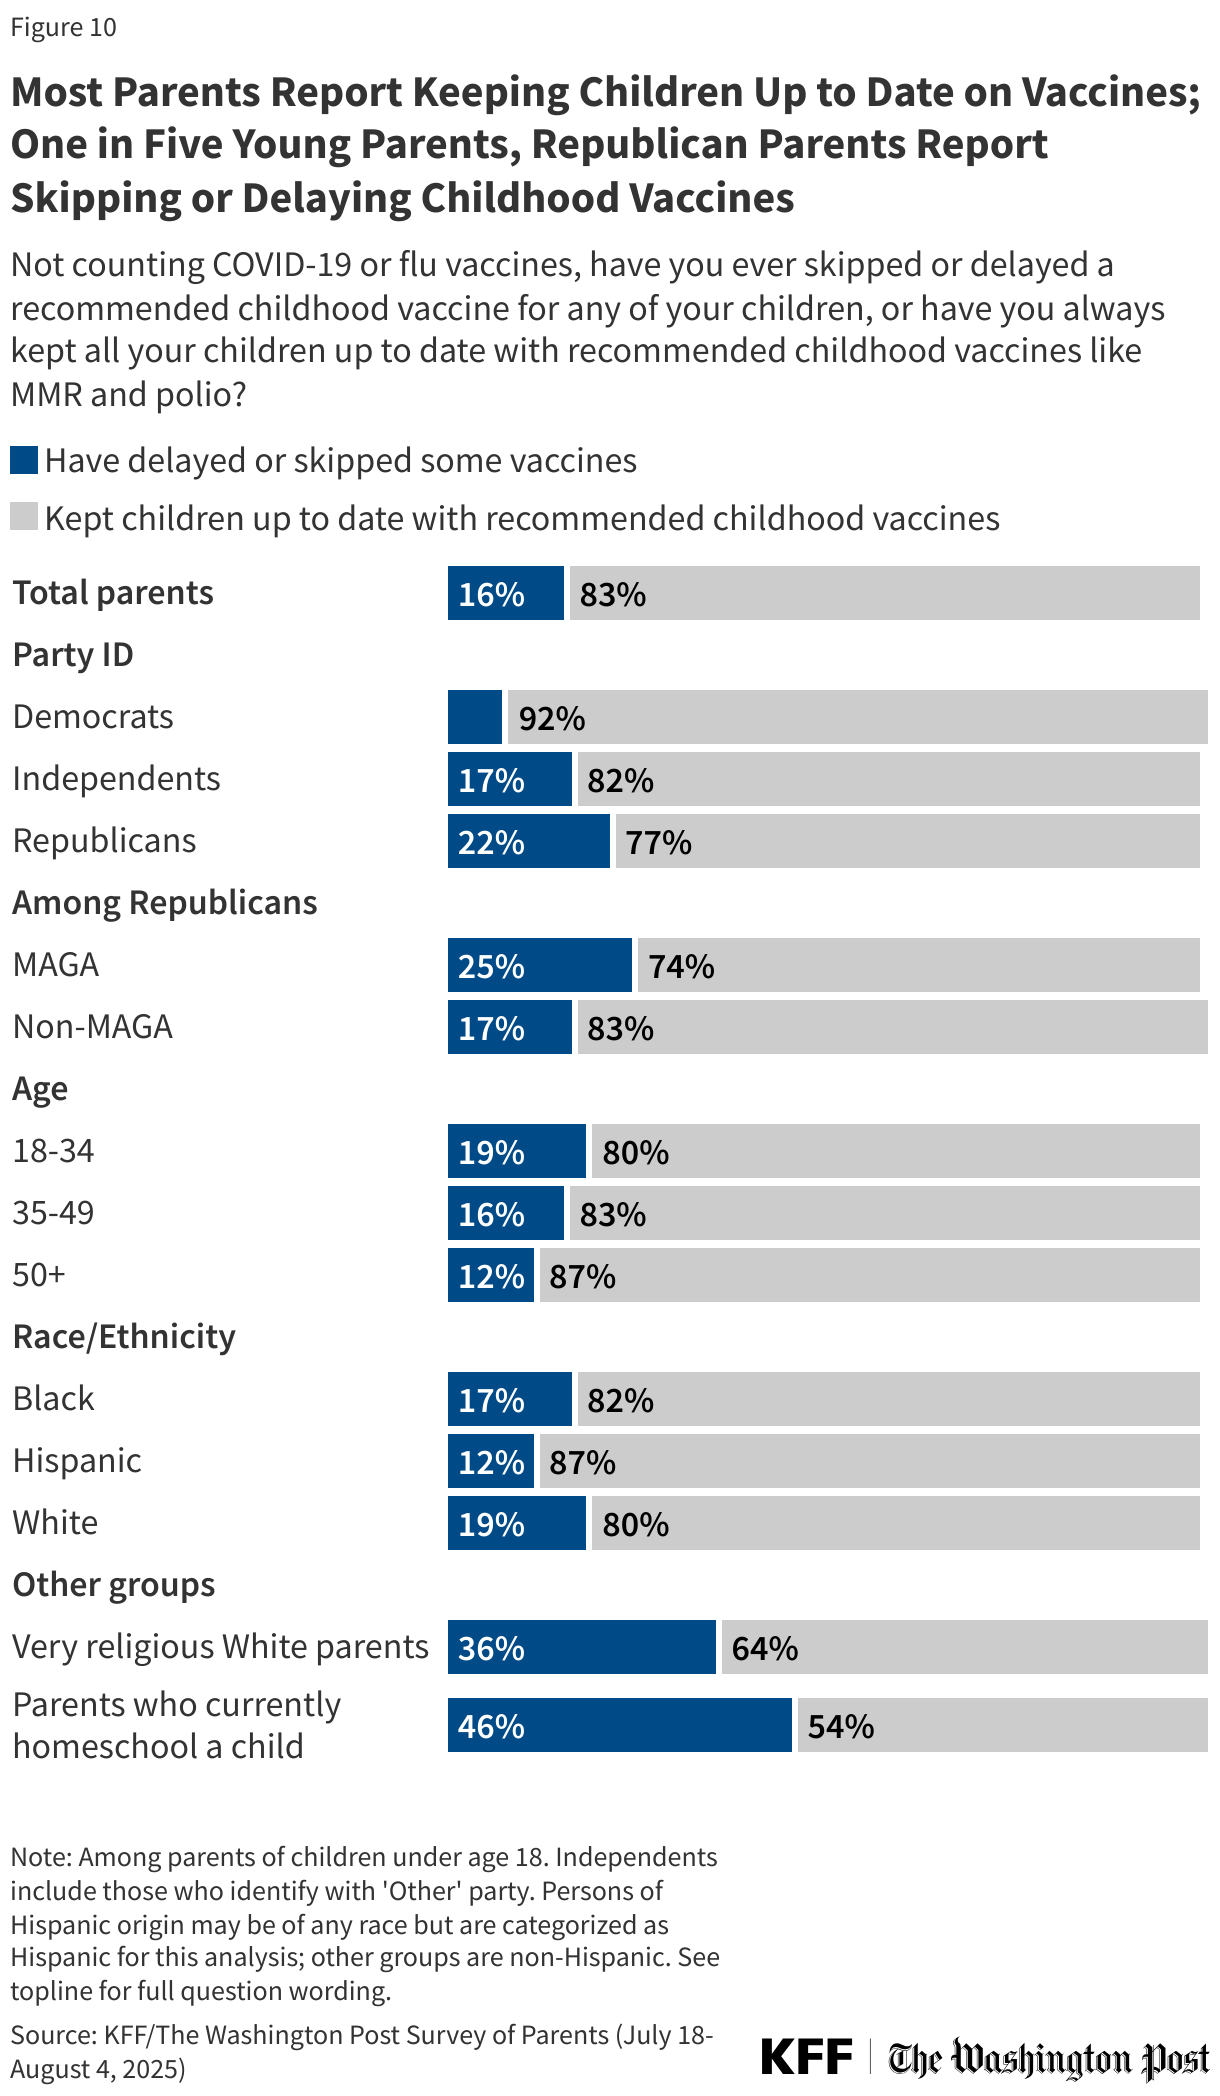
- While a large majority of parents report keeping their children up to date on vaccinations, one in six (16%) parents say they have ever skipped or delayed at least one childhood vaccine other than flu or COVID-19 immunizations. About one in five Republican parents (22%), rising to one in four MAGA Republicans (25%), report skipping or delaying any childhood vaccines, higher than the share of Democratic (8%) parents who report this. Younger parents are also somewhat more likely to report skipping or delaying vaccines than older parents, regardless of the age of their children; 19% of parents under age 35 say they have skipped or delayed at least one childhood vaccine compared with 12% of those age 50 and over. Most parents who skip or delay vaccines cite side effects and safety as their top reasons, while few cite reasons related to a child’s health condition or access to health care.
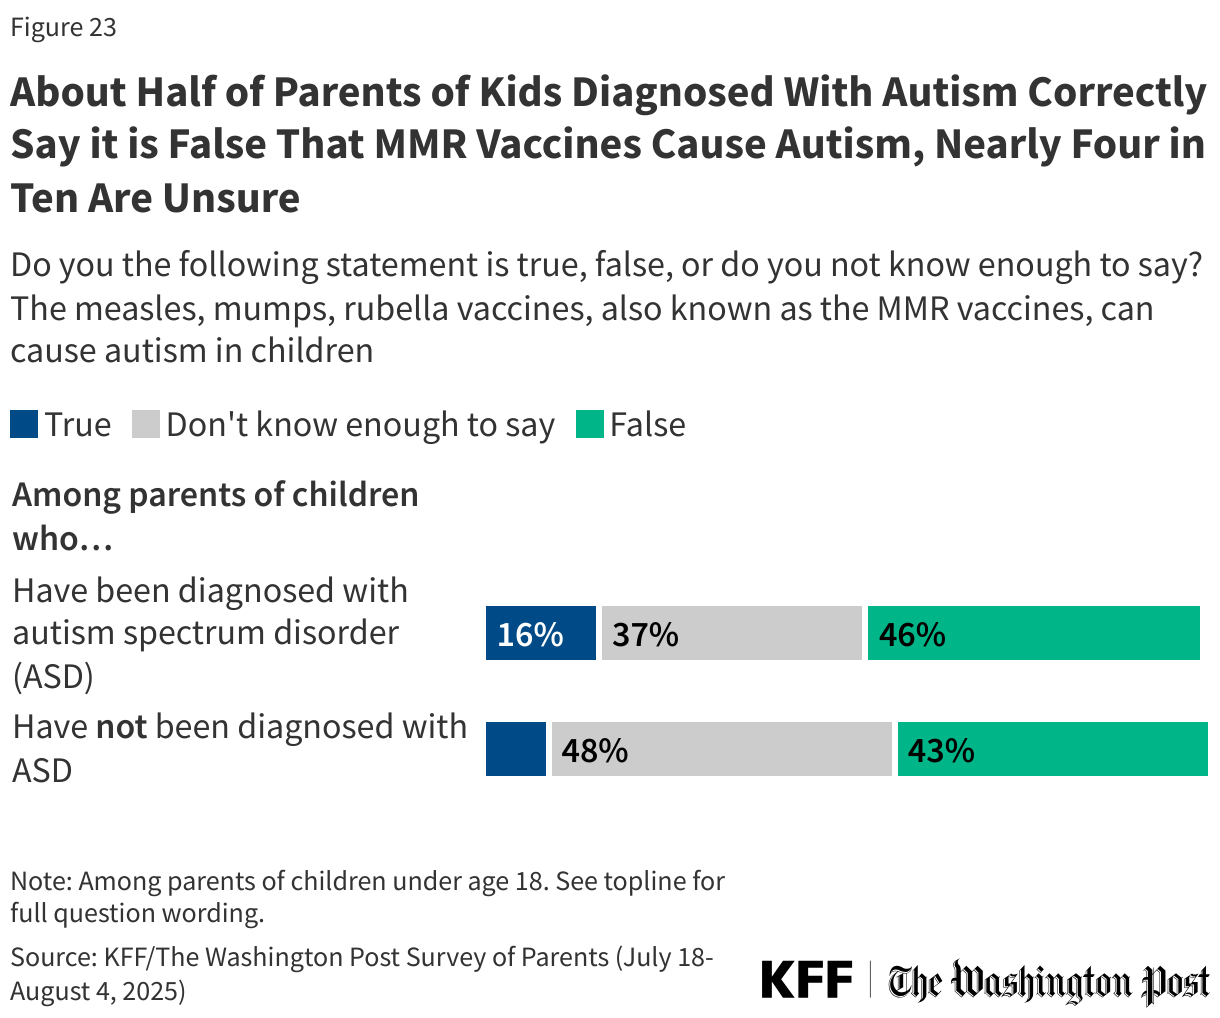
- Before his confirmation and in his role as HHS Secretary, Robert F. Kennedy Jr. has amplified claims about vaccines that have been rejected by scientists and public health officials. He has suggested, without evidence, that the number of recommended childhood vaccines has led to a rise in chronic disease in the U.S., that MMR vaccines can cause autism, and that the measles vaccine causes the illness it prevents. More recently, Kennedy has promoted Vitamin A as an effective treatment for measles. Asked about each of these claims, many parents are uncertain what to believe. While about one in ten or fewer parents say each claim is true and between a quarter and half say each is false, substantial shares – between four in ten and two-thirds – say they don’t know enough to say. On the widely circulated claim that MMR vaccines can cause autism in children, 9% of parents believe this to be true, rising to 16% among parents who have a child with autism spectrum disorder.
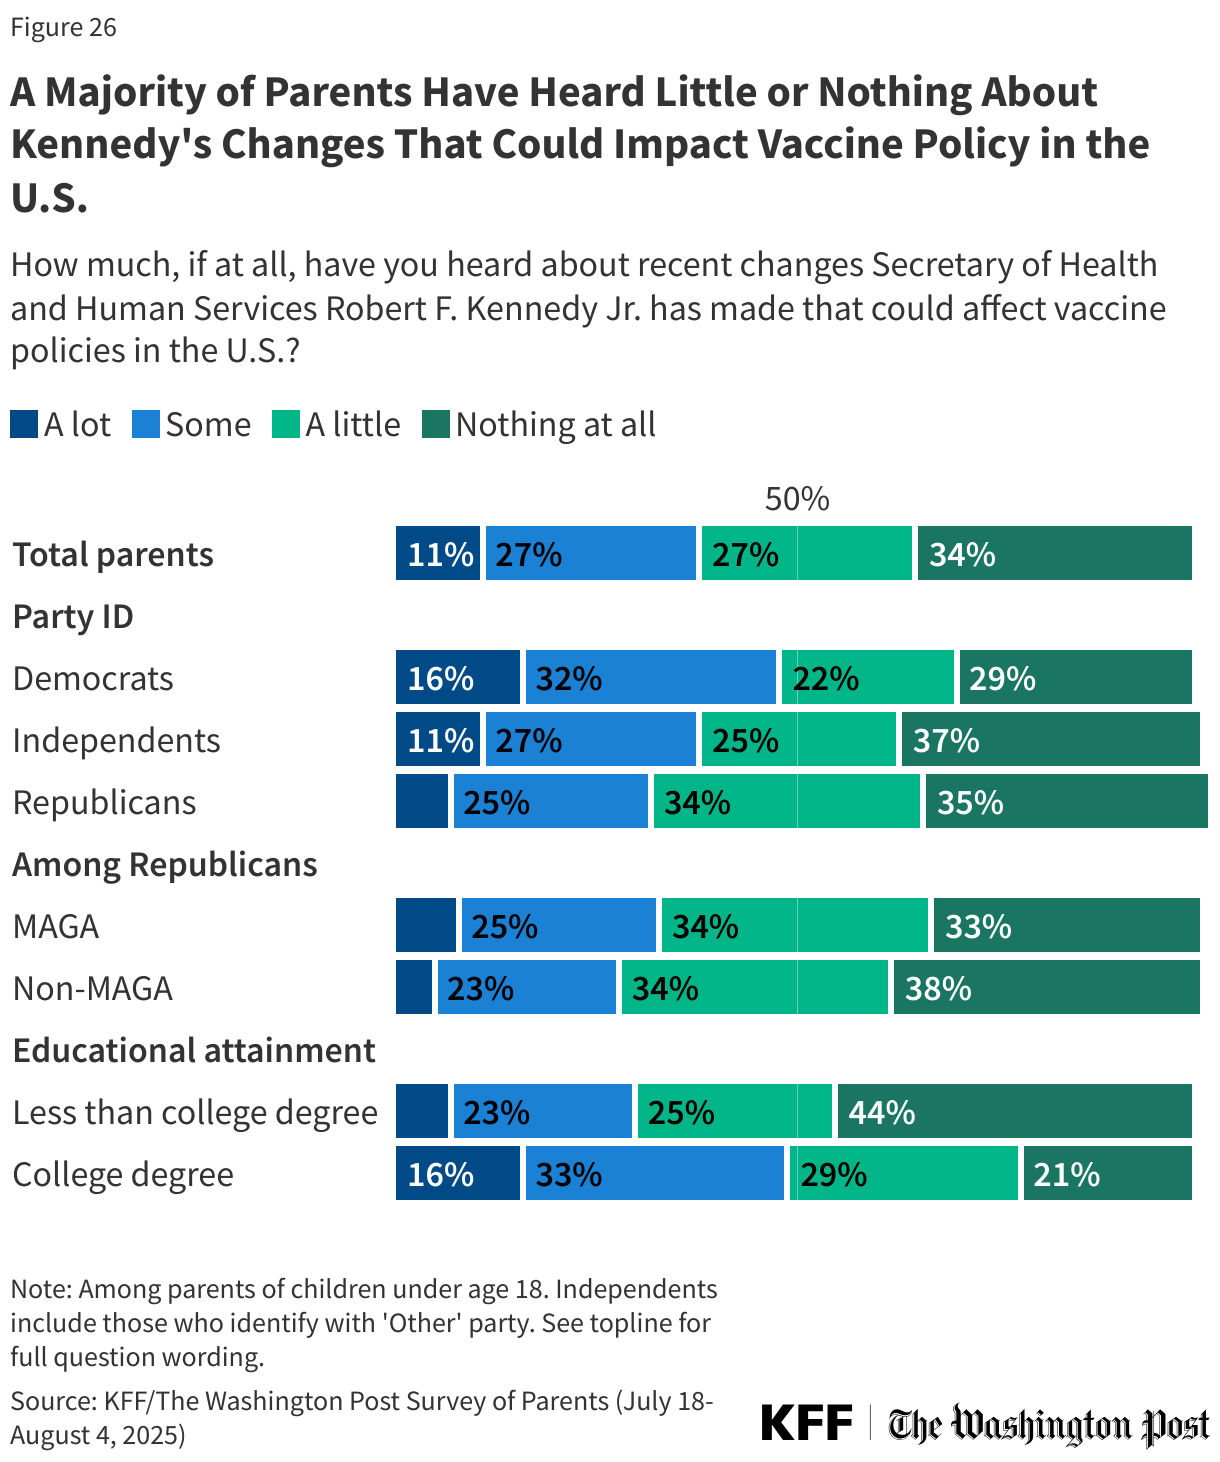
- Six in ten parents have heard little to nothing about HHS Secretary Kennedy’s recent changes that could impact vaccine policies in the U.S., while just one in ten (11%) have heard “a lot” and one-quarter (27%) have heard “some” about these changes. Awareness is higher among older parents, Democratic parents, and parents with a college degree. When asked how they expect these changes to impact vaccine policy in the U.S., parents are divided, and many are not sure whether they will have an impact on access to vaccines, safety, or the influence of pharmaceutical companies. Democratic parents are considerably more likely than Republican parents to say these changes will make access more difficult (52% vs. 7%) and will make childhood vaccines less safe (40% vs. 5%). Republican parents are more likely than Democrats to say Kennedy’s changes will decrease pharmaceutical companies’ influence on vaccine policy (32% vs. 11%) but most parents across groups expect no changes or say they’re not sure.
Parents’ Views of Vaccine Safety and Importance
Parents overwhelmingly value long-standing childhood vaccines but are more divided when it comes to the COVID-19 and flu vaccines for children. Across parties, large majorities of parents see the measles, mumps, and rubella (MMR) and polio vaccines as important for children in their communities and are confident in their safety, but opinions on flu vaccines and especially COVID-19 vaccines are more mixed and sharply divided along partisan lines.
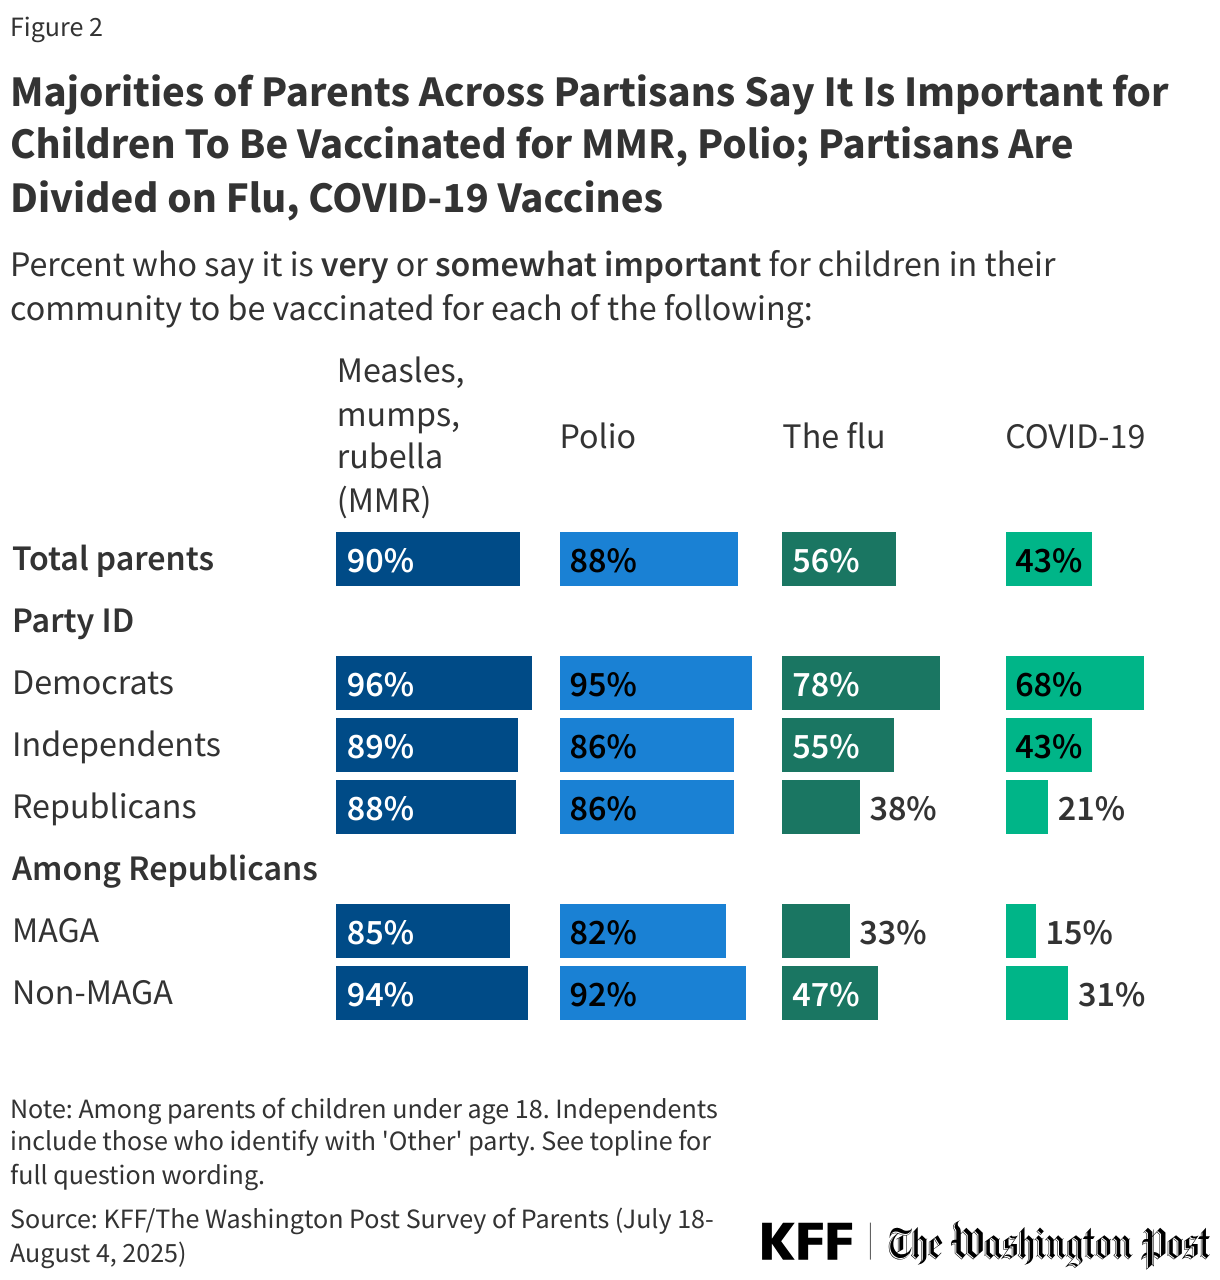
About nine in ten parents say it is important for children in their community to receive vaccines for MMR (90%) and polio (88%), including about seven in ten who say each is “very important” (70% and 68% respectively). A smaller share, but still a majority (56%) of parents say it is important for children in their community to be vaccinated against the flu, while fewer than half (43%) say the same about COVID-19, including one in five who say it is “very important.”
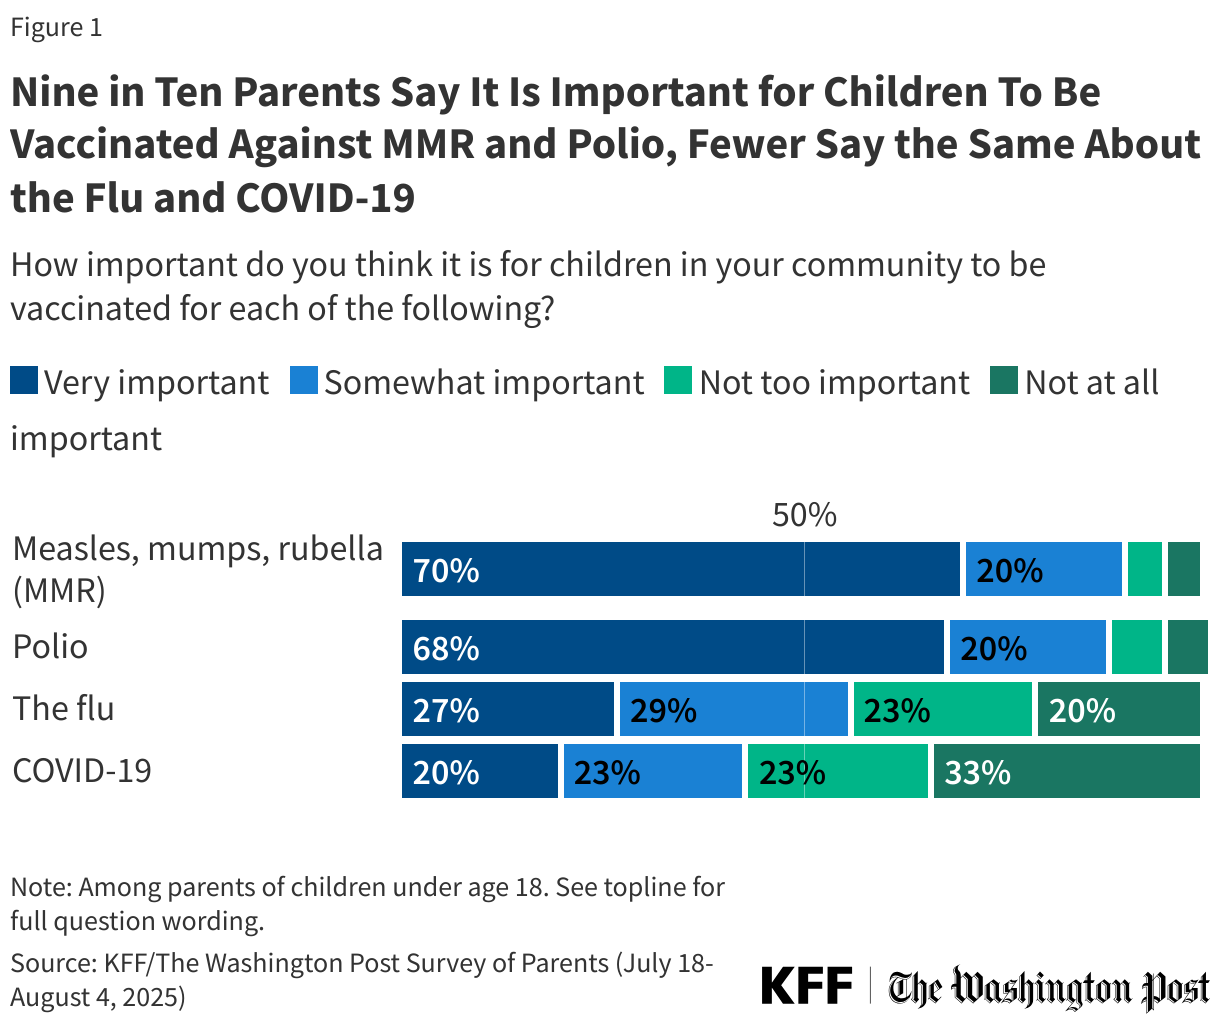
While large majorities of parents regardless of partisanship agree that the MMR and polio vaccines are important for children to get, parents are divided along partisan lines when assessing the importance of COVID-19 and flu shots for children in their community. Democratic parents are more than three times as likely as Republican parents to say it is “very” or “somewhat” important for children in their community to be vaccinated for COVID-19 (68% vs. 21%) and twice as likely to say it is important for children to be vaccinated for the flu (78% vs. 38%). About four in ten independent parents (43%) say the COVID-19 vaccine is important for children, and just over half (55%) say the same of the flu vaccine.
Republican parents are not a monolith, as those who support the Make America Great Again (MAGA) movement are between 9 and 16 percentage points less likely than non-MAGA Republican parents to say each of these vaccines are important for children to receive. Even still, a majority of MAGA Republican parents and non-MAGA Republican parents alike say it is important for children in their community to receive MMR and polio vaccines.
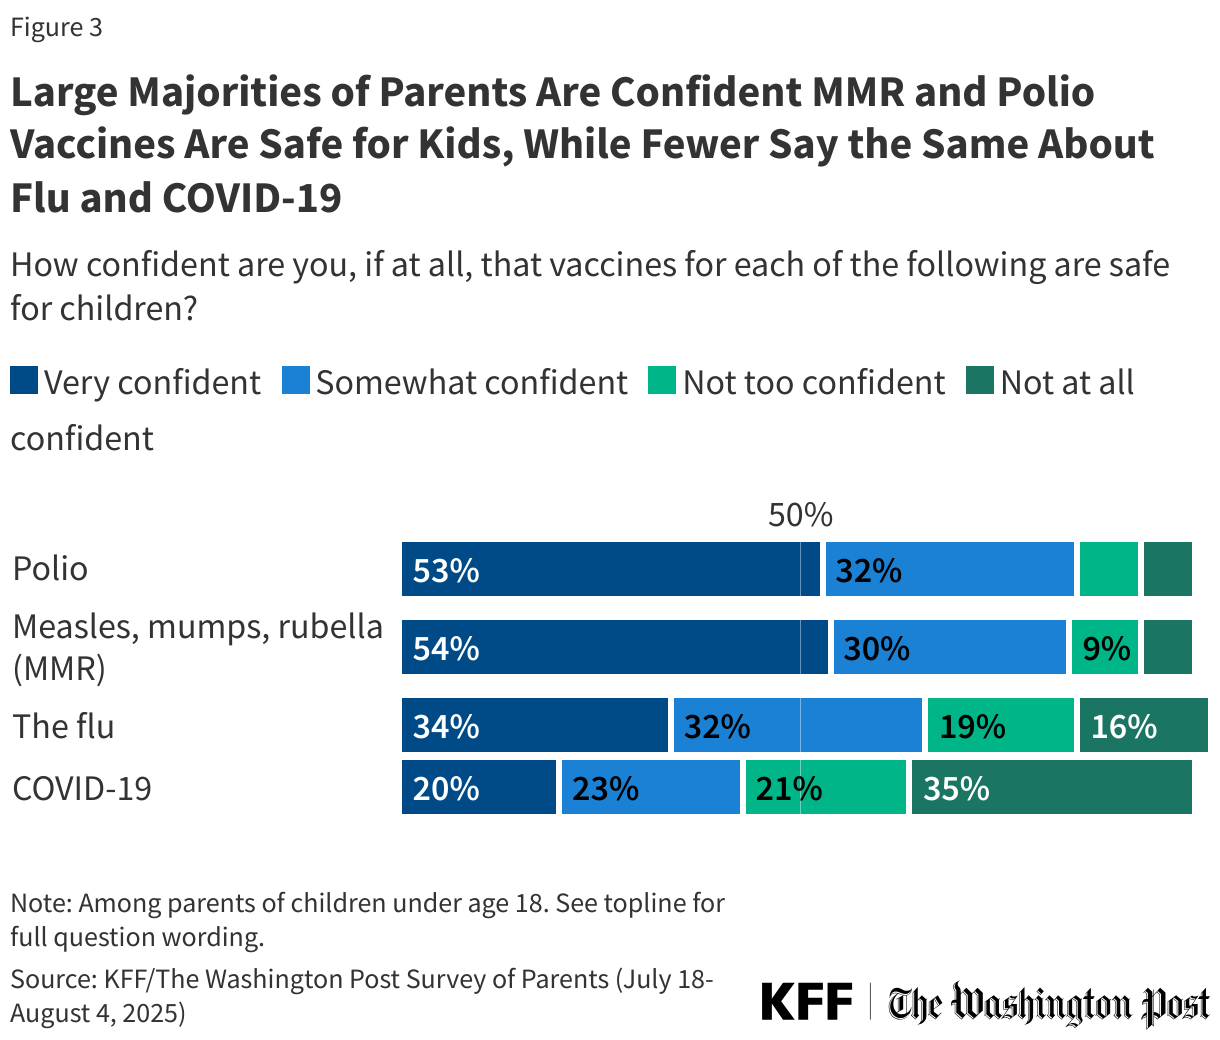
Mirroring parents’ opinions on the importance of childhood and annual vaccines, large majorities of parents express confidence in the safety of childhood vaccines for polio and MMR, while views on the safety of flu and COVID-19 vaccines are more divided.
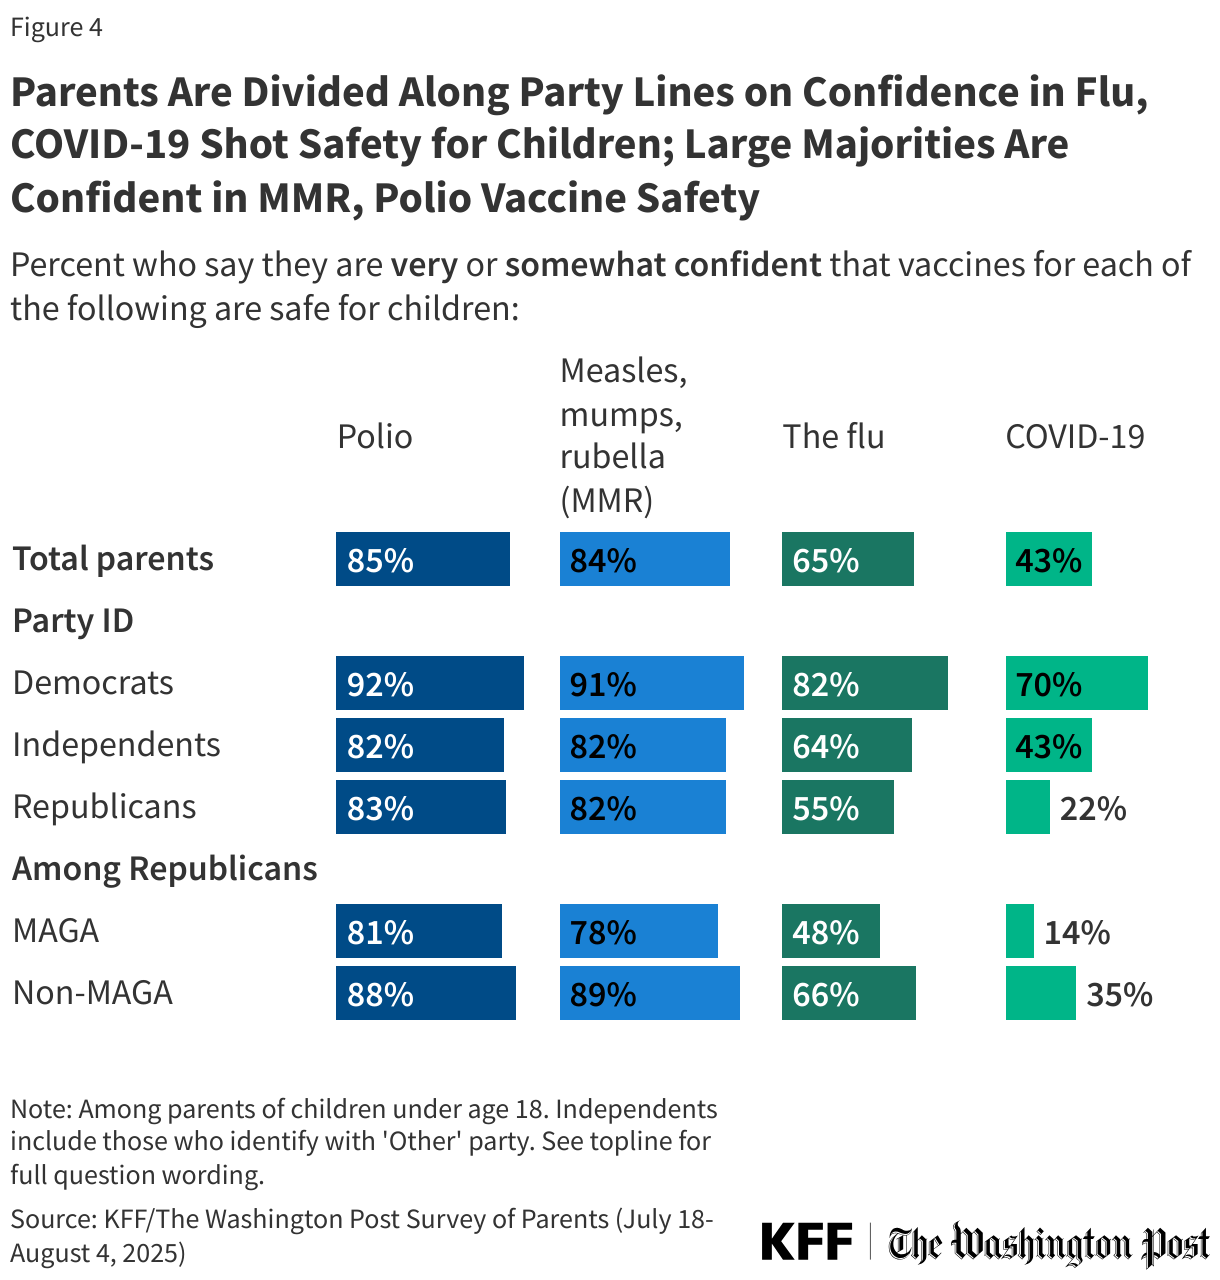
Just over eight in ten parents say they are either “very” or “somewhat confident” that polio vaccines (85%) and MMR vaccines (84%) are safe for children, including about half who say they are “very confident” (53% and 54% respectively). A smaller majority of parents express confidence in the safety of flu vaccines (65%), including about one-third who are “very confident” (34%). About four in ten (43%) parents are confident in the safety of COVID-19 vaccines for children, including one in five who are “very confident.”
While majorities of parents across partisanship say they are confident in the safety of polio and MMR vaccines for children, confidence in the safety of annual flu and COVID-19 vaccines for children differs.
At least eight in ten parents across partisanship say they are least “somewhat” confident in the safety of MMR and polio vaccines for children. About eight in ten (82%) Democratic parents say they are confident in the safety of flu vaccines for children, larger than the share of Republican (55%) or independent (64%) parents who say the same. Partisans are more deeply divided on confidence in the COVID-19 vaccine. Seven in ten Democratic parents say they are confident in the safety of COVID-19 vaccines for children, more than three times the share of Republicans who say the same (70% vs. 22%). About four in ten (43%) independent parents say they are confident in the safety of the COVID-19 vaccine for children.
The public overall and parents in the U.S. have been divided along partisan lines when it comes to the COVID-19 vaccine since it became available in 2021, when Republican adults were particularly hesitant to get themselves or their children vaccinated, past KFF polling finds.
The division when it comes to the flu vaccine, however, is more prominent now since the pandemic, and may be linked to concerns about vaccines generally. While the newly reformed Advisory Committee on Immunization Practices (ACIP) under HHS Secretary Kennedy has reaffirmed the existing recommendation that anyone ages 6 months and older should receive an annual flu vaccine, the panel recommended against vaccines containing a preservative called thimerosal, which has been falsely linked to autism. This recommendation comes despite scientific evidence that these vaccines are safe. Vaccines containing thimerosal comprised less than 6% of the U.S. influenza vaccine supply in 2024.
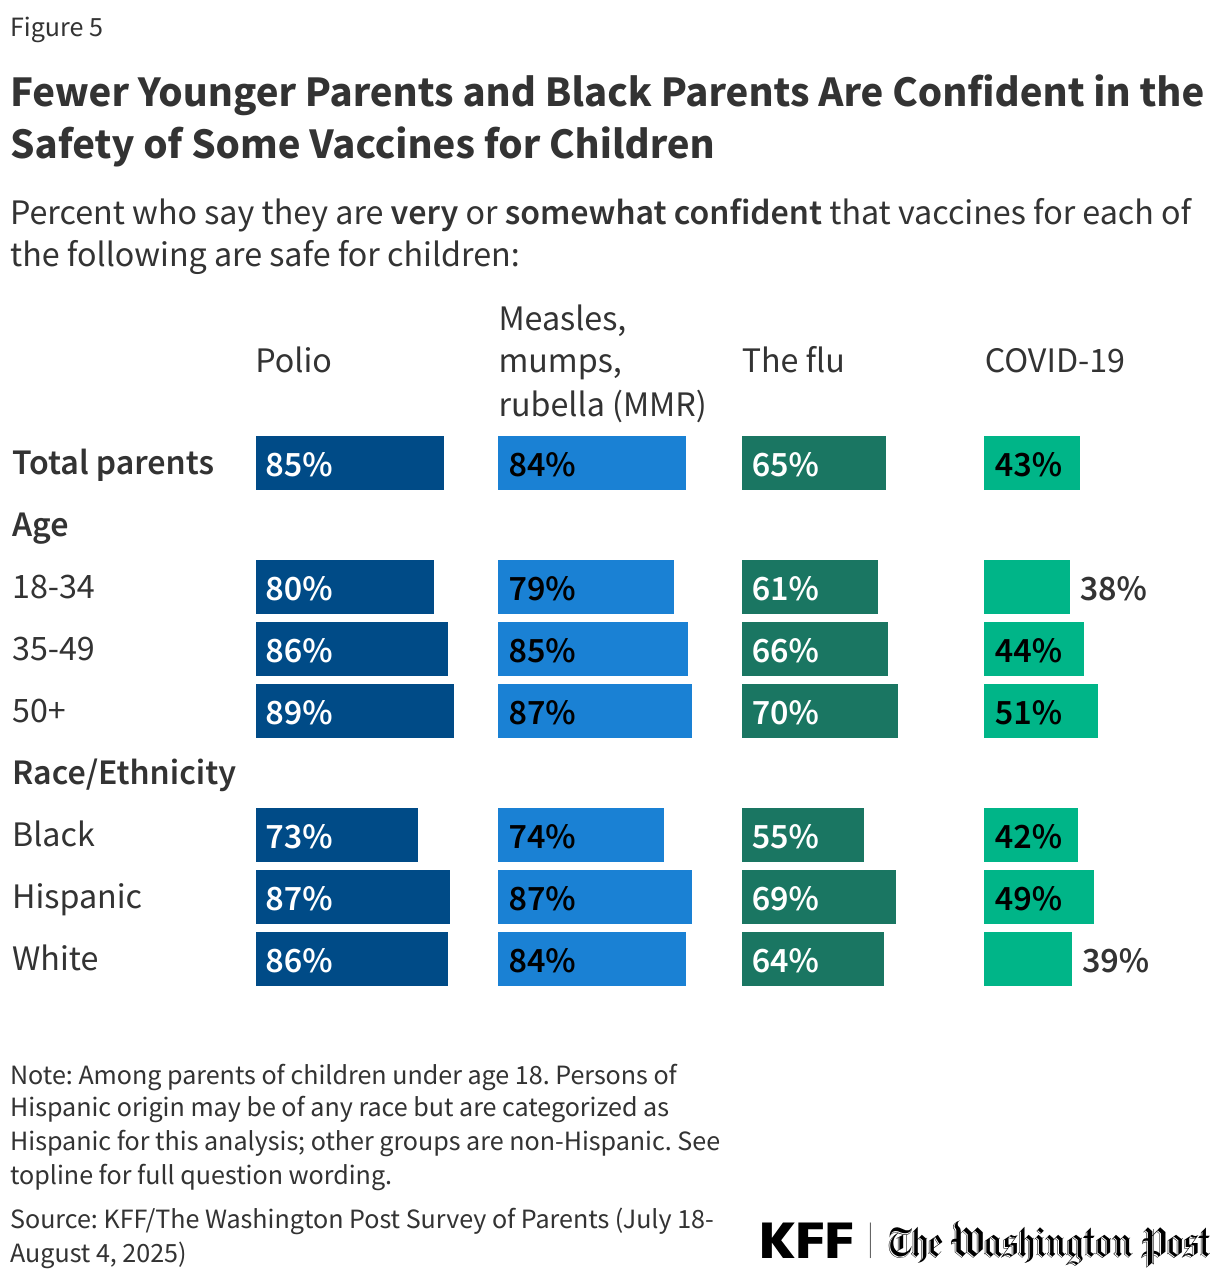
Black parents and parents under age 35 are less likely than other groups to say they are confident in the safety of some vaccines. For example, just over half (55%) of Black parents say they are confident the flu vaccines are safe for children compared to about two-thirds of White parents (64%) and seven in ten (69%) Hispanic parents. While majorities across racial and ethnic groups express confidence in the safety of MMR and polio vaccines, Black parents are at least 10 percentage points less likely than White parents and Hispanic parents to express confidence in the safety of each of these vaccines.
Parents under age 35 are also less likely than older parents – particularly those ages 50 and older – to say they are either “very” or “somewhat confident” that routine vaccines are safe for children. The widest gap between younger and older parents is on confidence in the safety of COVID-19 vaccines for children, with just under four in ten (38%) parents under age 35 expressing confidence compared to about half (51%) of parents ages 50 and older.
Parents’ Views of Vaccine Safety Testing, Schedule, and Spacing
In his role as HHS Secretary, Robert F. Kennedy Jr. has called into question the safety of vaccines, arguing that they do not go through enough safety testing, including placebo testing. The American Academy of Pediatrics (AAP) released a statement ensuring that childhood vaccines are “carefully studied, including with placebos” to ensure safety and effectiveness before they are available to the public. This poll shows that parents are divided over the question of whether vaccines go through enough safety testing before being recommended for children, with many being unsure what to believe.
About four in ten (41%) parents say vaccines go through “the right amount” of safety testing in the U.S. before being recommended for children by federal health agencies, while about one-third (35%) say vaccines do not go through enough safety testing. An additional one in five parents express uncertainty, saying they are not sure whether vaccines are adequately safety tested. Very few parents overall (3%) say vaccines go through “too much” safety testing before being recommended for children.
Just as they differ on their confidence in safety, partisans differ on whether they think there is enough safety testing of vaccines, with about half (48%) of Republican parents saying there is not enough safety testing of vaccines before they are recommended for children, more than twice the share of Democratic (20%) parents who say the same. Republican parents are not a monolith, as those who say they support the Make America Great Again (MAGA) movement are more likely than Republicans who do not to say there is not enough testing (57% vs. 32%).
Views on the adequacy of safety testing for childhood vaccines also differ by age, with about four in ten (39%) parents under age 35 and about one-third (35%) of those ages 35 to 49 saying there is not enough safety testing compared to fewer parents ages 50 and older (26%).
Earlier this summer, Secretary Kennedy took a step towards changing vaccine policy in the U.S. by firing the President Biden-appointed ACIP and rebuilding it with the goal to review the current vaccine schedule for children. Secretary Kennedy himself and some of the members of the new committee have raised doubts about the current number of vaccines in the schedule, questioning whether the interactions between vaccines are safe for children. However, clinical studies have shown the current vaccine schedule and getting multiple doses when age appropriate to be safe.
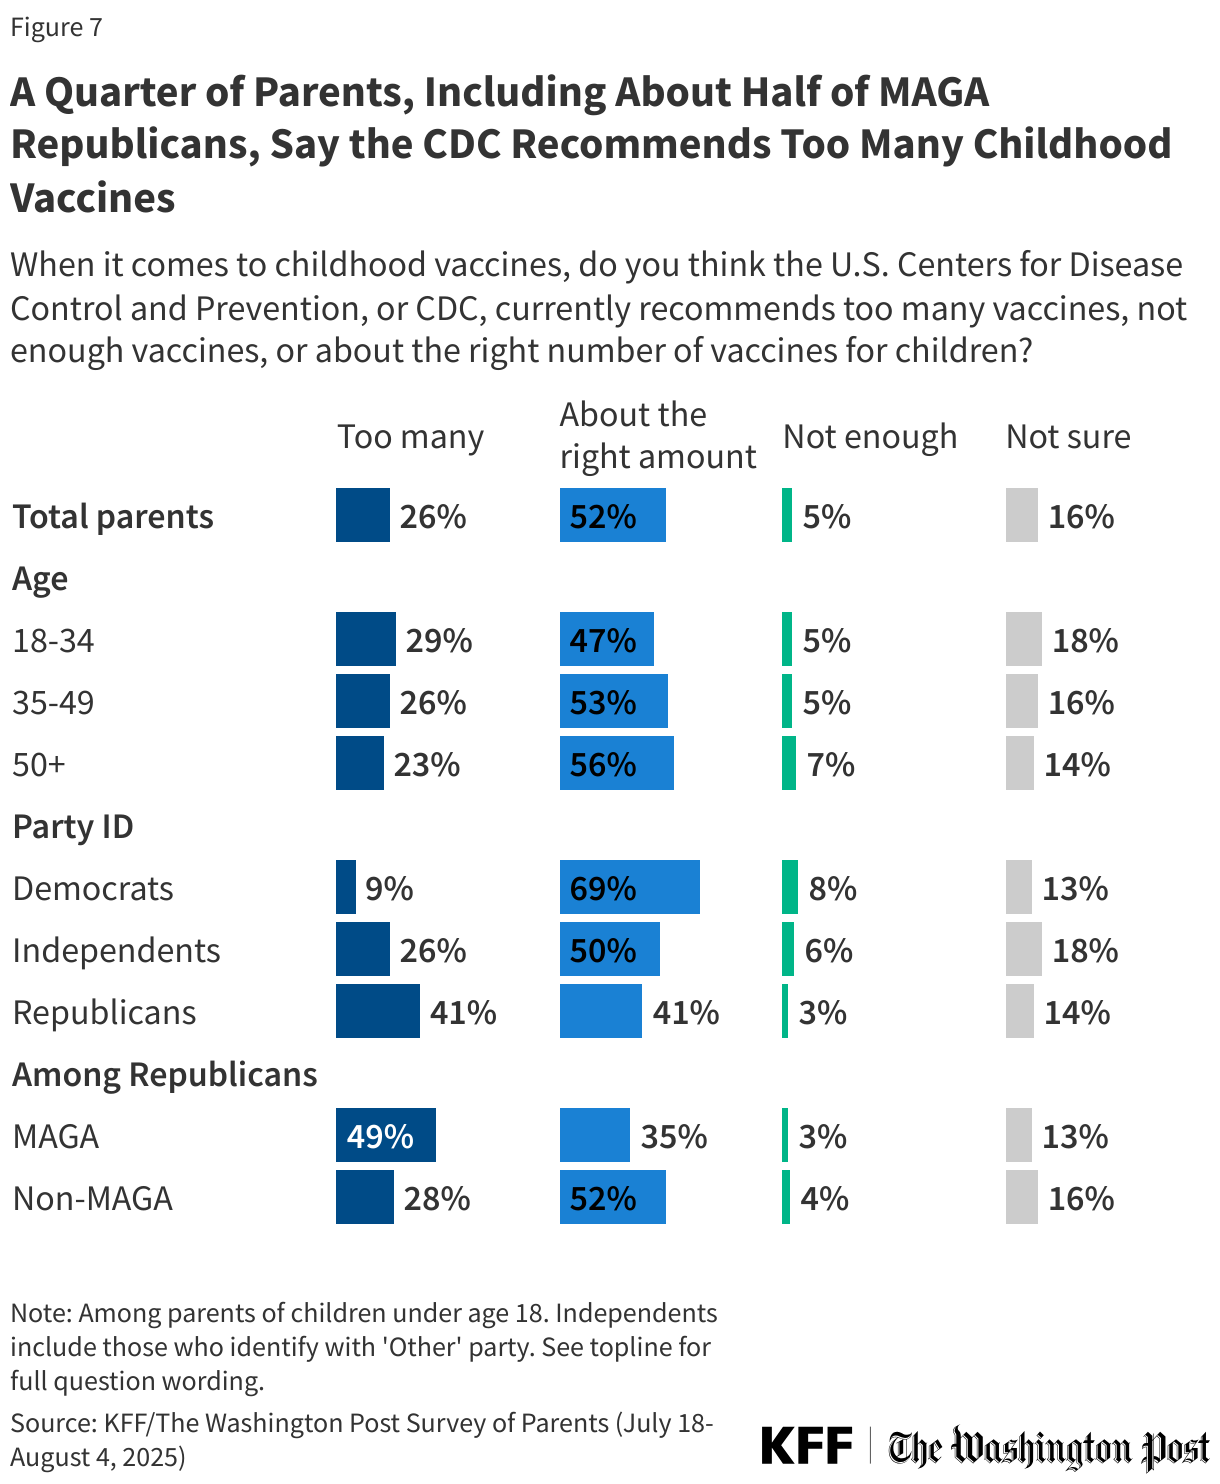
About half (52%) of parents say the CDC currently recommends “about the right amount” of childhood vaccines, while a quarter say the CDC recommends “too many” childhood vaccines (26%). One in six parents say they are not sure (16%), and 5% say the CDC does not recommend enough vaccines for children. A larger share of Republican parents (41%) than Democratic (9%) or independent (26%) parents say the CDC recommends “too many” vaccines, rising to about half (49%) of MAGA Republicans.
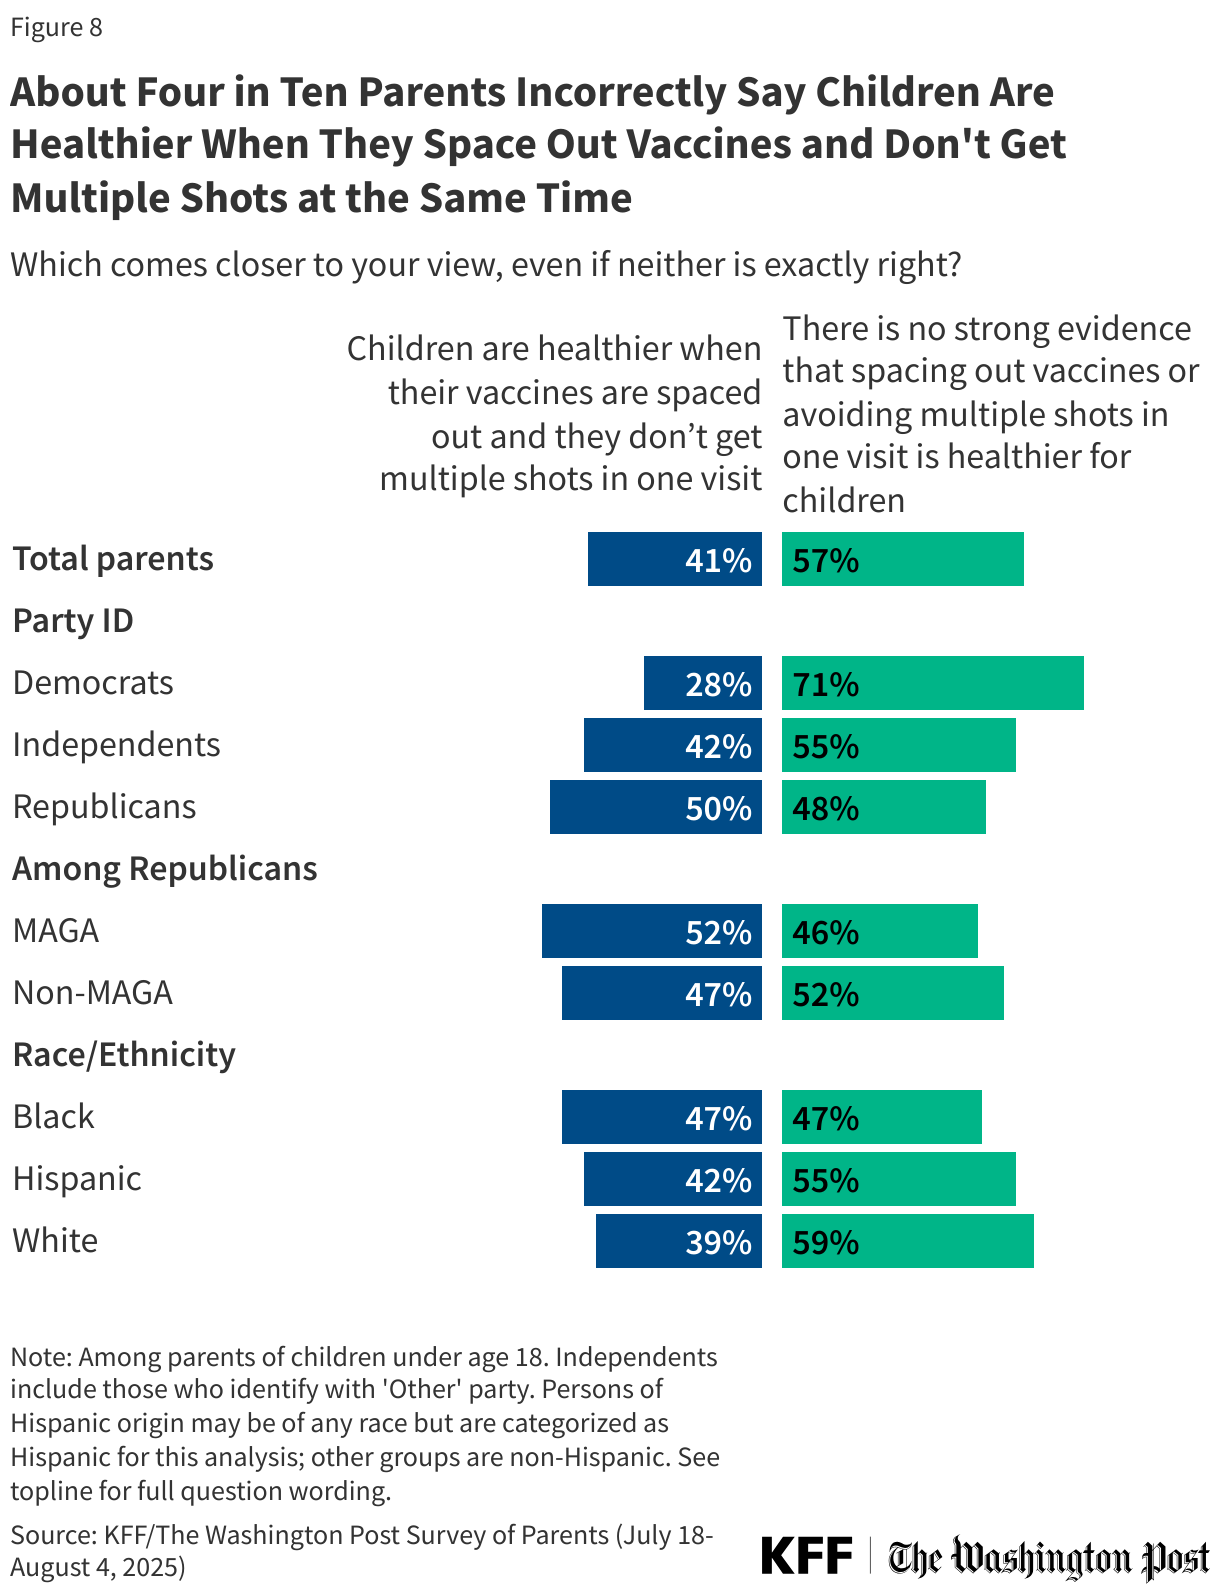
The CDC’s current childhood immunization schedule is based on how children’s immune systems respond to vaccines at particular ages as well as their likelihood of exposure to different diseases. The CDC advises that parents follow the timing of the immunization schedule, and there is no evidence that delaying or spacing out shots for children offers better protection or reduces serious effects. Parents, however, are divided on the question of whether childhood vaccines should be spaced out, with most (57%) correctly saying there is no strong evidence that spacing out vaccines or avoiding multiple shots in one visit is healthier for children, while four in ten (41%) incorrectly say that children are healthier when their vaccines are spaced out and they don’t get multiple shots in one visit.
Half of Republican parents and four in ten (42%) independent parents incorrectly say children are healthier when their vaccines are spaced out compared to about three in ten (28%) Democrats. About half (47%) of Black parents and about four in ten Hispanic (42%) and White (39%) parents hold this misconception.
How Parents Identify Themselves When It Comes to Vaccine Views
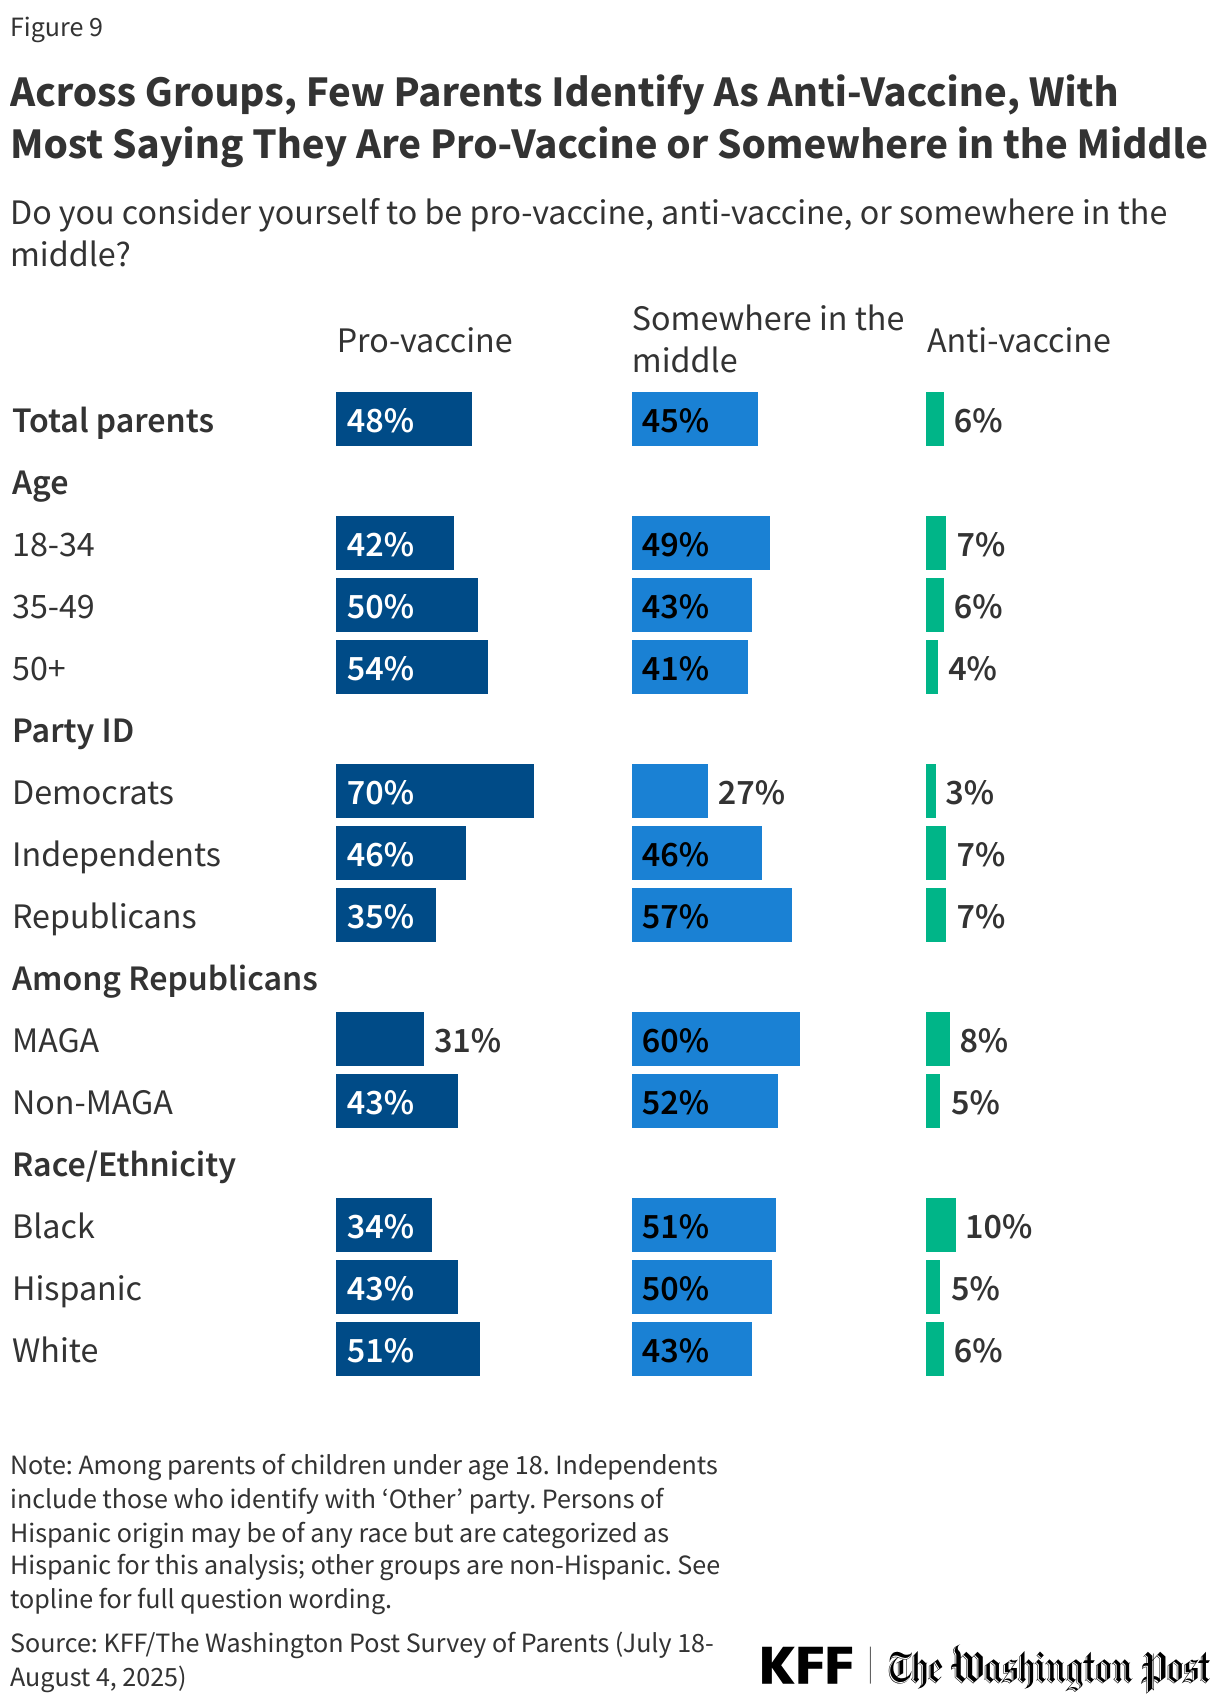
While many parents express at least some level of concern or uncertainty about vaccine safety, very few (6%) say they consider themselves “anti-vaccine.” Similar shares of parents identify as either “pro-vaccine” (48%) or “somewhere in the middle” (45%). Six in ten Republican parents (57%), including six in ten MAGA Republicans and about half (52%) non-MAGA Republicans, say they are “somewhere in the middle” when it comes to vaccine attitudes. Most (70%) Democratic parents say they are “pro-vaccine.” White parents are more likely to be “pro-vaccine” than Black or Hispanic parents (51% v. 34% v. 43% respectively), while larger shares of Black parents (51%) and Hispanic parents (50%) say they are “somewhere in the middle.”
While anti-vaccine parents express vaccine skeptic views on other questions, and pro-vaccine parents are generally accepting and confident in vaccines, parents who identify as “somewhere in the middle” hold mixed views. For example, few “pro-vaccine” parents (17%) say childhood vaccines do not go through enough safety testing compared to much larger shares of parents who consider themselves anti-vaccine (64%) or somewhere in the middle (51%).
Skipping and Delaying Childhood Vaccines: Which Parents Do It and Why?
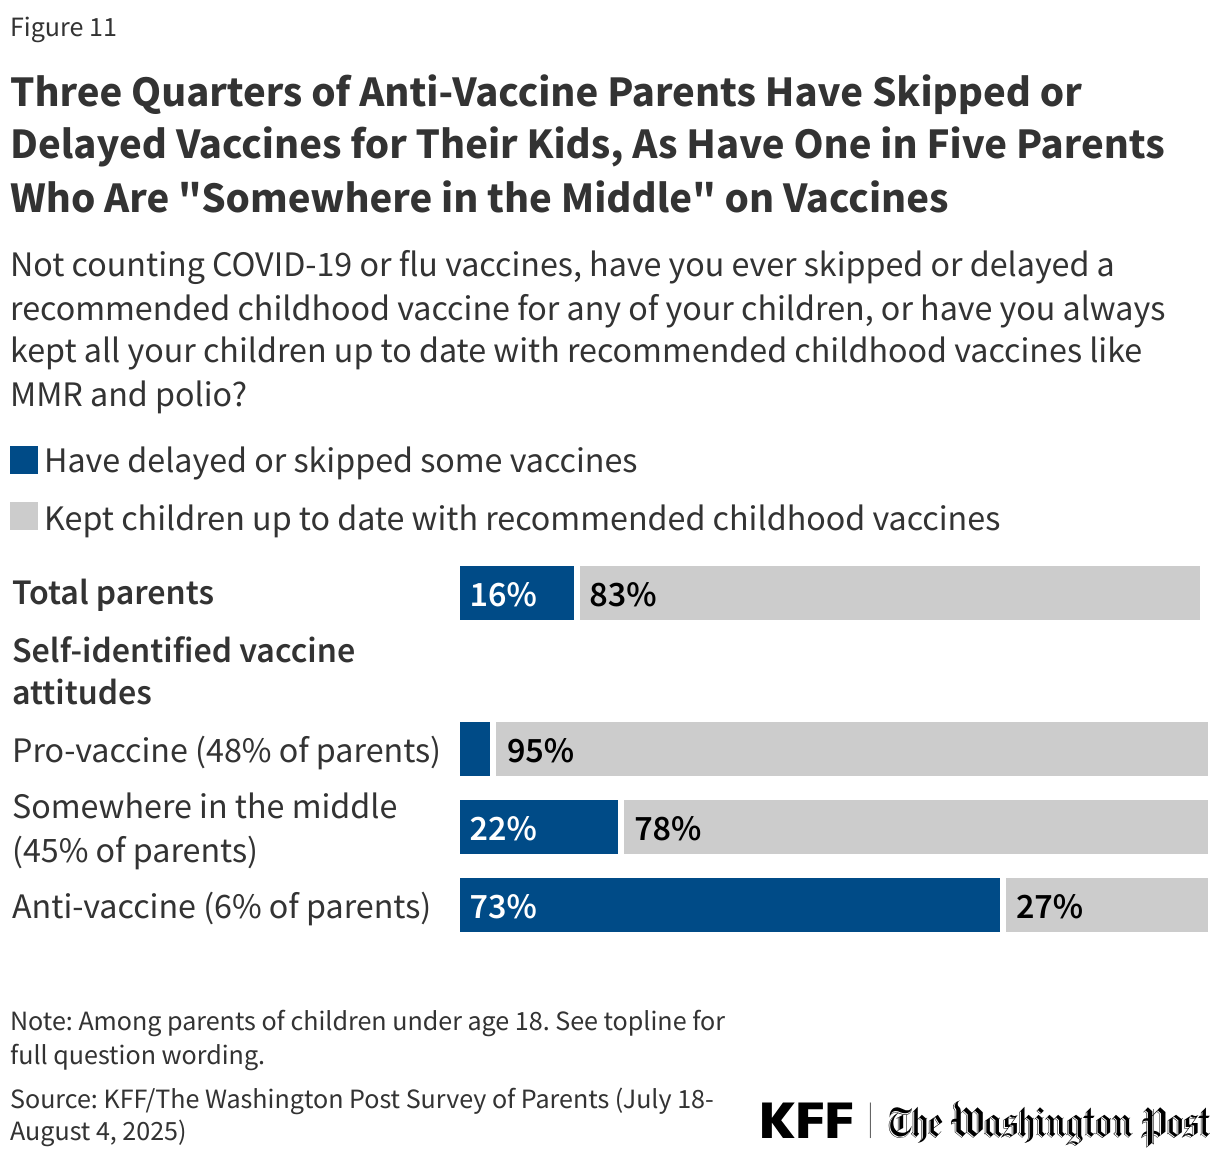
As large shares of parents express positive attitudes towards childhood vaccines, most parents also report keeping their children up to date on childhood vaccines (83%). However, about one in six (16%) parents say they have ever skipped or delayed at least one childhood vaccine for any of their children (excluding seasonal vaccines like flu and COVID-19). Like vaccine attitudes, parents’ decisions about vaccination also differ along partisan lines. Republican parents are nearly three times as likely to report skipping vaccinations for their children compared to parents who are Democrats (22% vs. 8%). This partisan gap in parents’ reports of keeping children’s vaccinations up to date is consistent with trends KFF polls have found since the COVID-19 pandemic led to deepening partisan divides in vaccine attitudes among all adults.
Similar to differences seen in some vaccine attitudes, younger parents are more likely than older parents to report skipping or delaying childhood vaccines. About one in five (19%) parents under age 35 report skipping or delaying vaccines for their children, regardless of the age of their child. This is larger than the shares of parents ages 35 to 49 (16%) or parents ages 50 and older (12%) who say the same.
Among White parents, religious beliefs play a role in childhood vaccine decisions. About one in five (19%) White parents overall report skipping or delaying vaccines for their children, rising to about one-third (36%) of White parents who describe themselves as “very religious.” Parents who homeschool their children are nearly four times as likely to report skipping or delaying vaccines compared to parents who have never homeschooled (46% vs. 12%).
About three quarters (73%) of the 6% of parents who describe themselves as “anti-vaccine” say they have skipped or delayed vaccines for their children. The vast majority (95%) of “pro-vaccine” parents have kept their children up to date with recommended vaccines. While most parents who describe themselves as “somewhere in the middle” on vaccines have kept their children up to date (78%), about one in five (22%) of these parents say they have ever skipped or delayed a childhood vaccine for their kids.
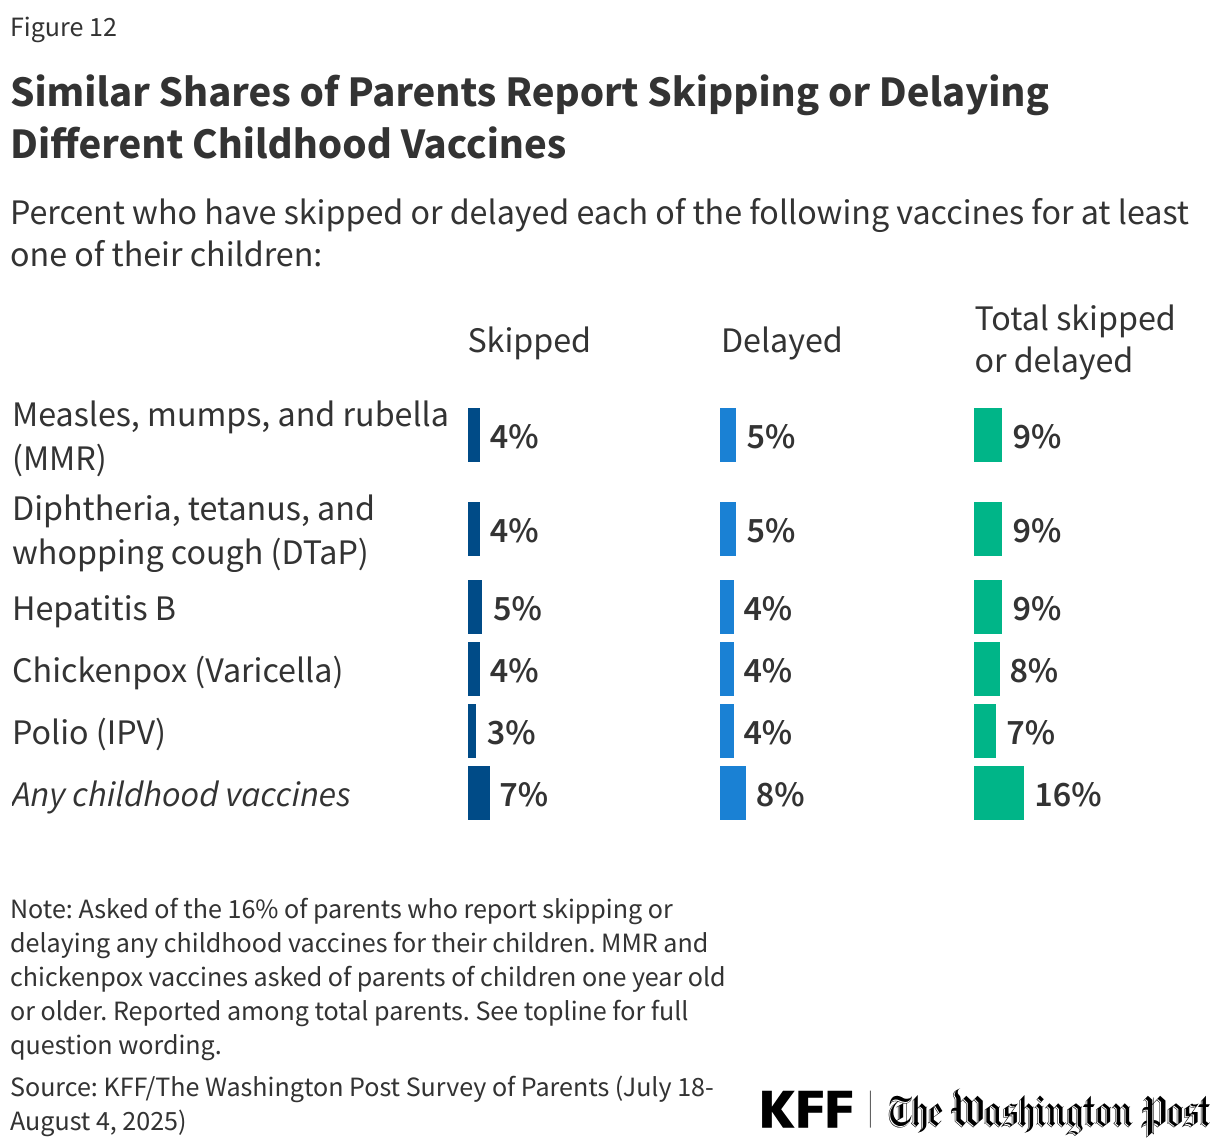
When asked which specific childhood vaccines they have skipped or delayed, similar shares of parents report skipping or delaying the MMR vaccine (4% skipped, 5% delayed), DTaP (4% skipped and 5% delayed), hepatitis B (5% skipped and 4% delayed), chickenpox (4% skipped and 4% delayed), and polio (3% skipped and 4% delayed) vaccines. While just 6% of parents say they have skipped or delayed all the vaccines asked about in this poll, one in ten (10%) say they have skipped or delayed at least 2 childhood vaccines for their children, and 8% have skipped or delayed at least three. Overall, 8% of parents report delaying at least one of these vaccines, while 7% report forgoing at least one vaccine entirely.
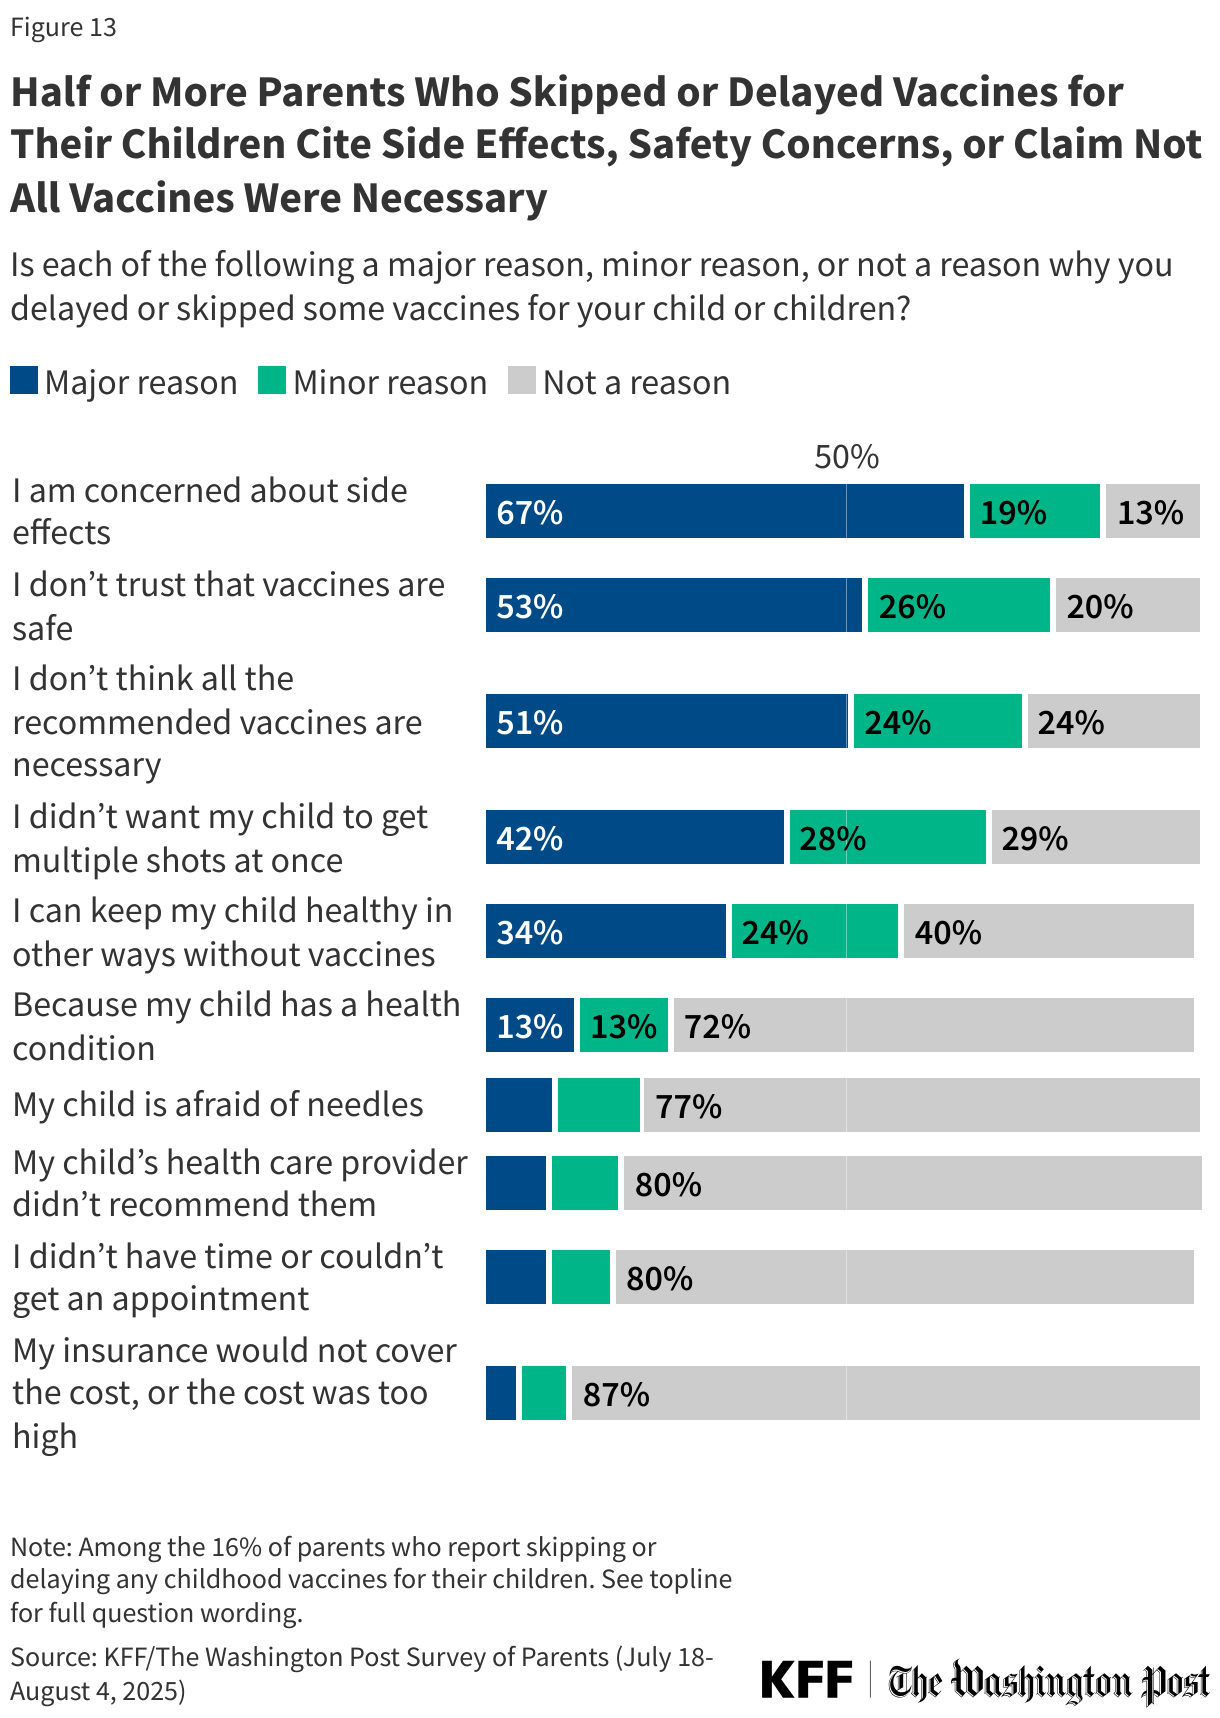
Parents’ reasons for skipping or delaying vaccines for their own children mirror many of the general concerns and uncertainty expressed by parents overall. About two-thirds (67%) of parents who skipped or delayed vaccines for their child say concerns about side effects were a “major reason” for their decision. About half of these parents say not trusting that vaccines are safe (53%) or not thinking all the recommended vaccines are necessary (51%) are major reasons they skipped or delayed their child’s vaccines.
About four in ten (42%) parents who skipped or delayed vaccines for their child say not wanting their child to get multiple shots at once was the major reason, followed by about one-third (34%) who say they skipped or delayed vaccines because they can keep their child healthy in other ways without vaccines. About one in ten parents who skipped or delayed vaccines say the major reason was that their child is afraid of needles (10%) or their doctor did not recommend vaccination (9%).
Few vaccine-skipping parents cite access reasons, such as not having time or not being able to get an appointment (9%) or that the cost was too high (5%). One in eight (13%) parents say a major reason they skipped or delayed vaccines for their child was that their child has a health condition, while one in eight (13%) say this was a minor reason and nearly three in four (72%) parents who skipped vaccines say a medical condition was not a reason for skipping vaccines for their child.
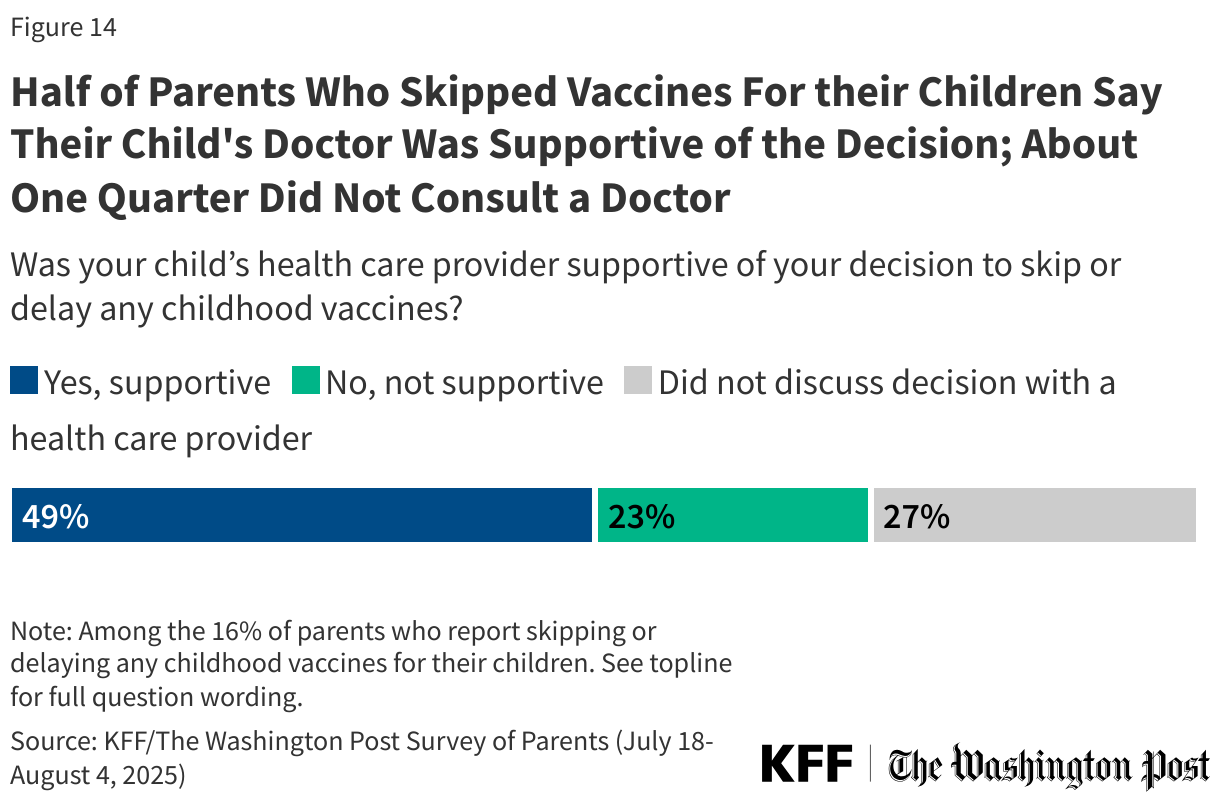
Half of parents who delayed or skipped vaccines for their children say their child’s health care provider was supportive of their decision (49%), while one in five say their doctor was not supportive (23%) and about one in four (27%) say they did not discuss the decision with a health care provider. Similar shares of parents across age groups and with children in different age cohorts say their doctor was supportive of their decision to delay or skip vaccines.
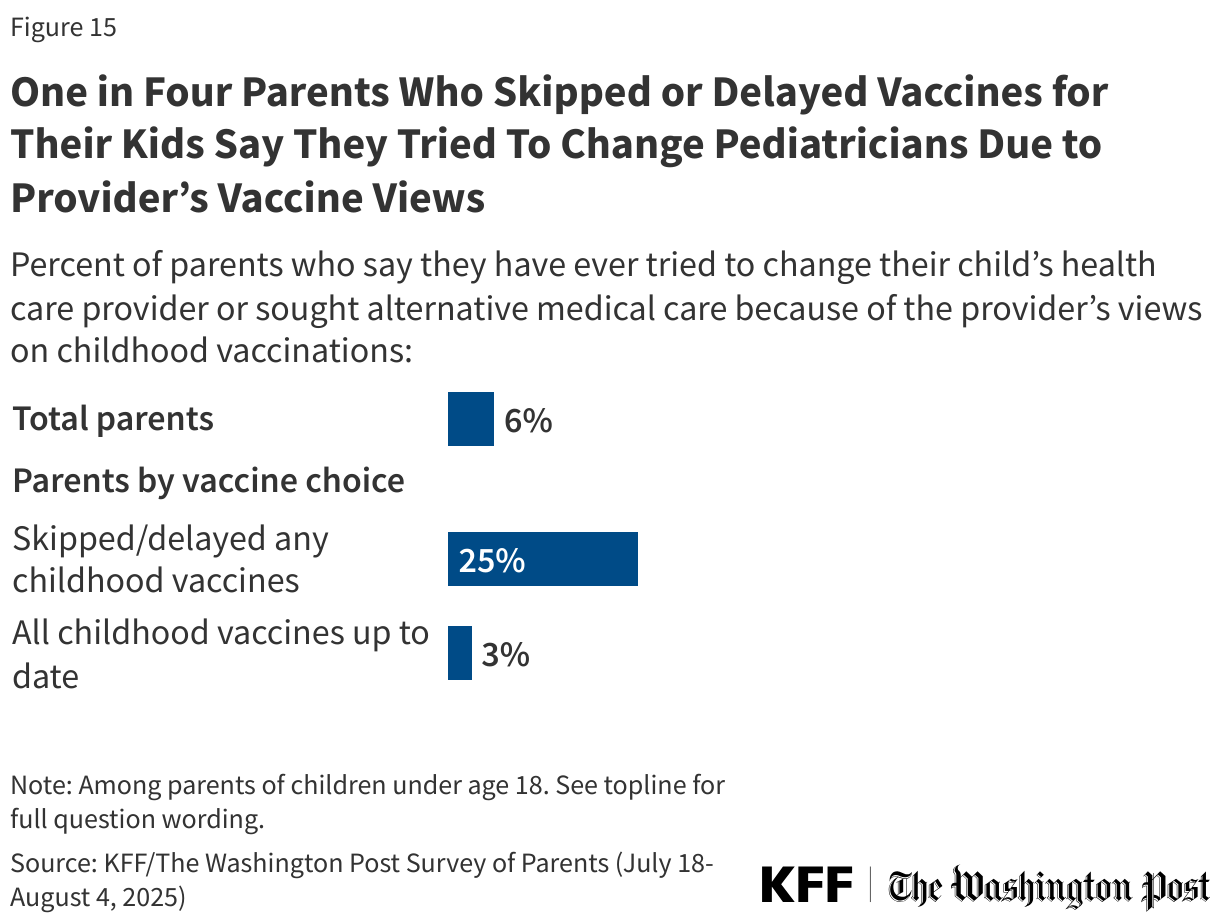
Some parents may be self-selecting pediatricians who align with their vaccine views. One in four parents who have skipped or delayed vaccines for their children say they have ever changed or tried to change their child’s provider due to the provider’s views on vaccines. Few (3%) parents who keep their children up to date on vaccines say the same.
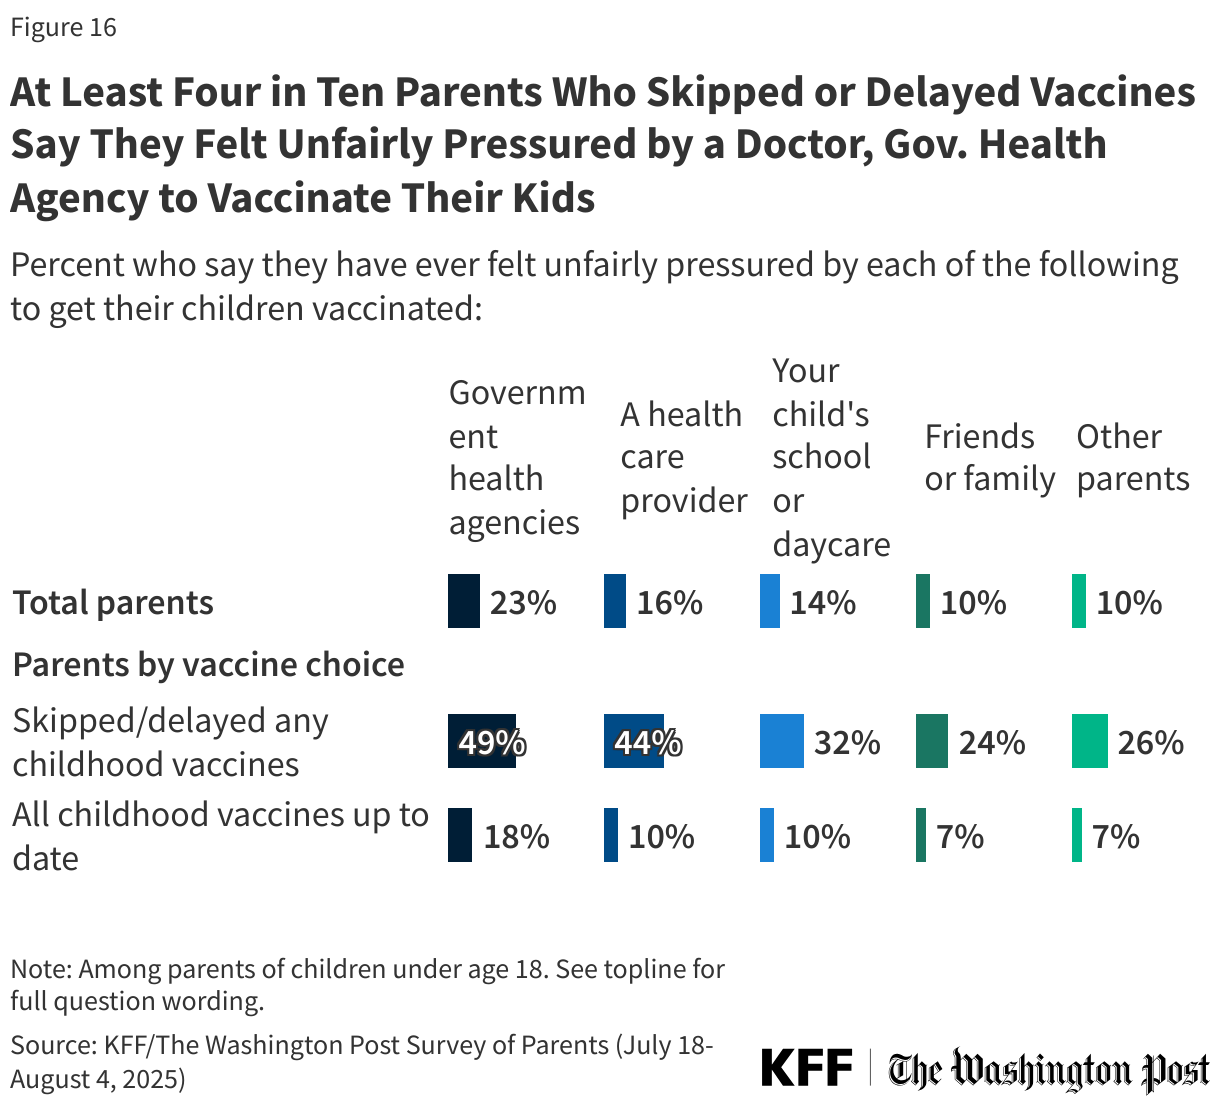
Few parents report feeling pressured by peers or doctors to vaccinate their children, though those who have skipped or delayed vaccines are more likely to report feeling pressure. About one in four (23%) parents overall say they have felt unfairly pressured by government health agencies to vaccinate their children, rising to about half (49%) among parents who have skipped or delayed vaccines. Smaller shares say they have felt pressure from a health care provider (16% overall, 44% among parents who skipped or delayed vaccines), their child’s school or daycare (14% overall, 32% among parents who skipped or delayed vaccines), friends or family (10% overall, 24% among parents who skipped or delayed vaccines), or other parents (10% overall, 26% among parents who skipped or delayed vaccines). Few parents who report keeping their children up to date on vaccines report feeling pressure from these sources.
The Role of Schools
At this time, all 50 states and D.C. have state laws that require children starting school to be vaccinated against MMR and polio at the federally recommended ages, though Florida has announced that the state will end all vaccine mandates, including for school children. While there is no federal law regarding childhood vaccinations, recommendations about school requirements are issued by the CDC’s Advisory Committee on Immunization Practices (ACIP). Each state has its own laws determining school vaccination requirements, including policies for exemptions. While all states allow for medical exemptions from school vaccine requirements, some states additionally allow for religious or other personal-belief exemptions.
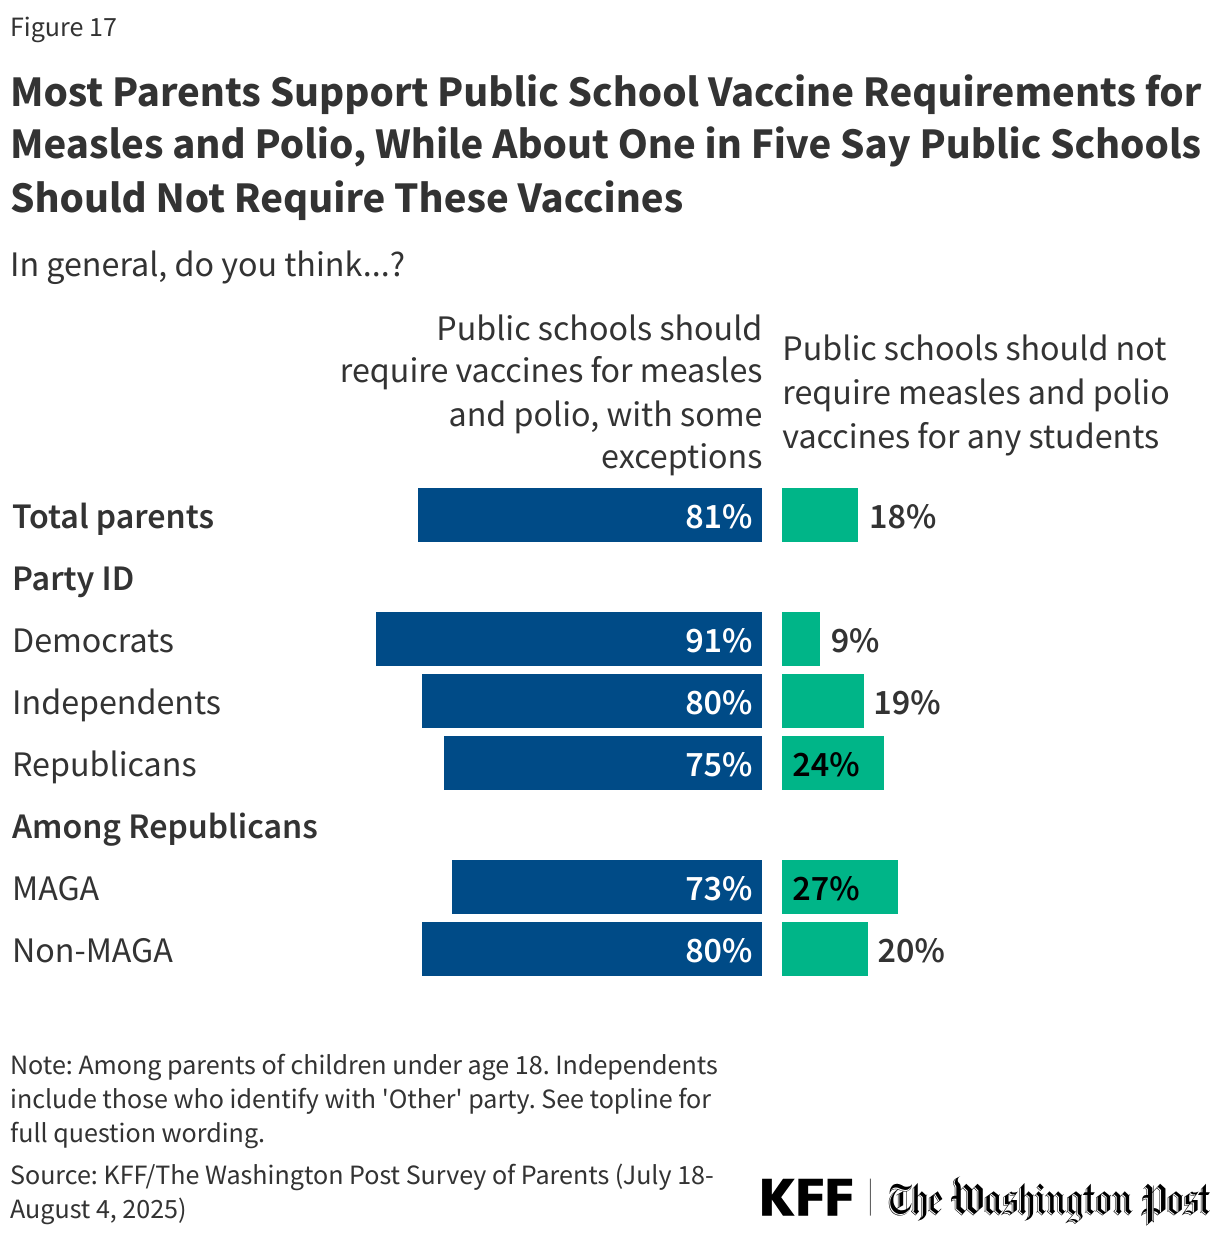
Overall, parents largely support these policies, with about eight in ten (81%) parents saying public schools should require vaccines for measles and polio with some exceptions, while about one in five (18%) say public schools should not require measles and polio vaccines for any students. While Republican parents and independents are each more likely than Democrats to say public schools should not require these vaccines, majorities across these groups nonetheless support such requirements.
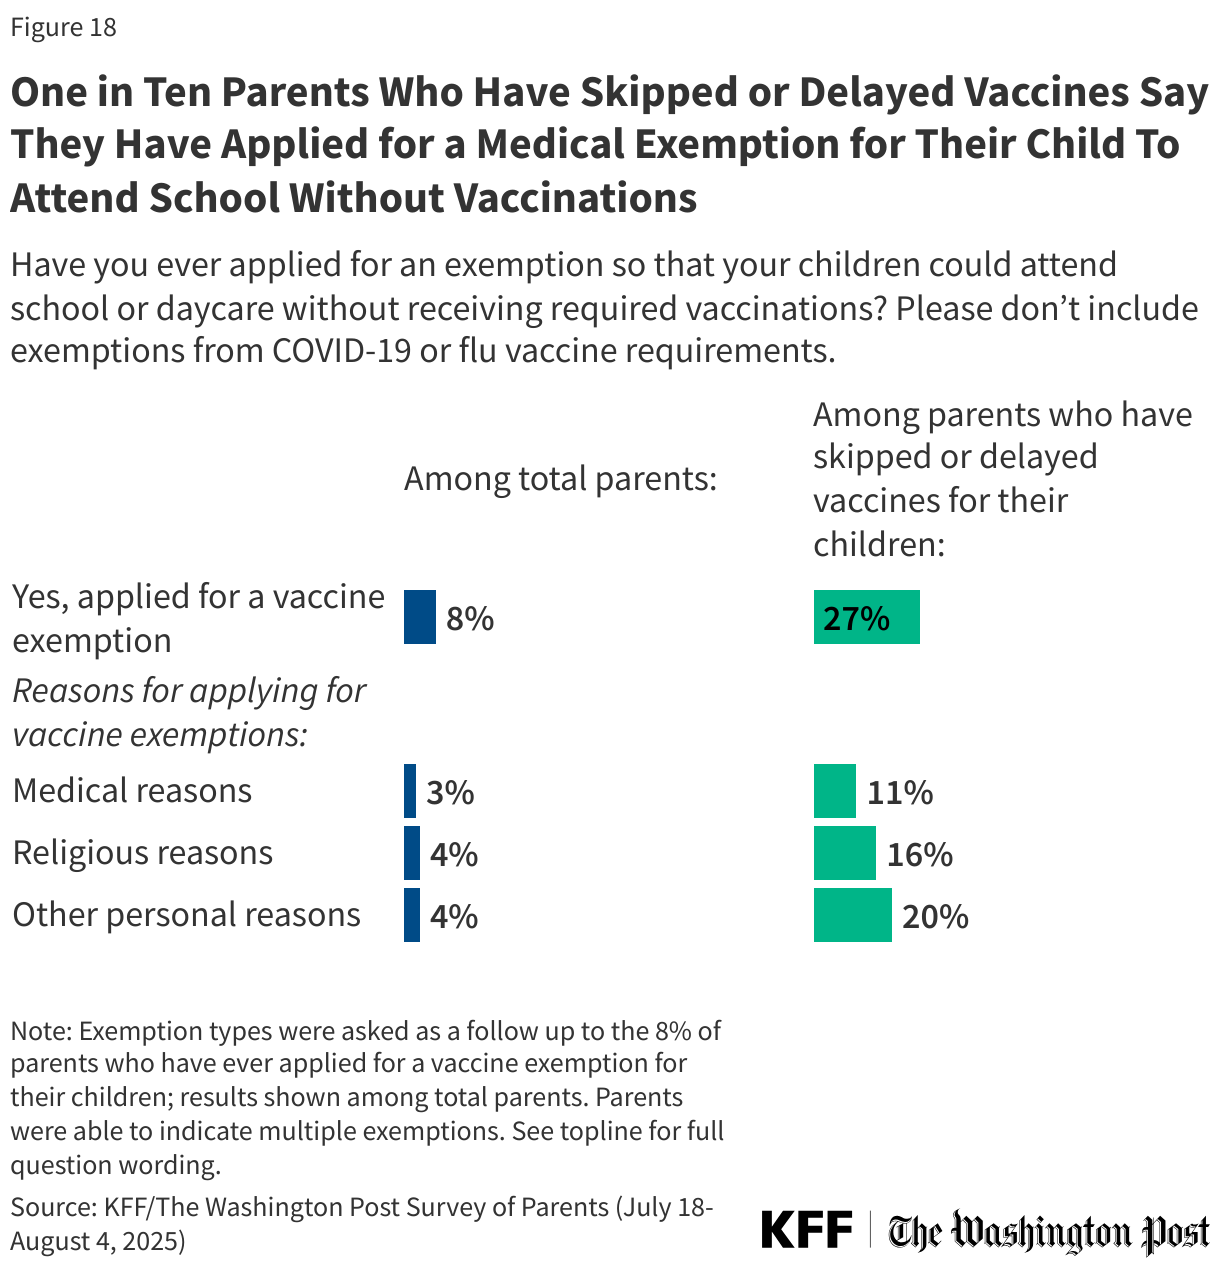
Eight percent of parents overall, including about one in four (27%) of those who have skipped or delayed vaccines, say they have applied for an exemption so their child could attend school or daycare without receiving required vaccines. The most common type of exemption is for personal reasons, reported by 4% of parents overall and one in five parents who have skipped or delayed any vaccinations for their children. Religious reasons for exemption are cited by 4% of parents overall, and one in six (16%) parents who have skipped or delayed vaccinations for their children. Medical exemptions are least common, reported by 3% of parents overall and one in ten (11%) parents who have skipped vaccines for their children.
About two-thirds (64%) of parents who applied say their exemption was approved, while 36% say it was denied. Among all parents, 5% say they applied for an exemption, and it was granted and 3% say they applied and were denied. In a policy statement, the American Academy of Pediatrics (AAP) “advocates for the elimination of nonmedical exemption from immunizations” citing their role in increasing the risk of measles and other vaccine preventable disease outbreaks.
One in five parents of children ages 6-17, including four in ten (42%) of those who have skipped or delayed vaccinations, say they have homeschooled their child for reasons other than the COVID-19 school shutdowns. Consistent with previous polling on homeschooling by The Washington Post, vaccine requirements do not appear to be the main motivation for homeschooling for most parents. Three in ten homeschool parents say school vaccine requirements were a major (14%) or minor (16%) reason for homeschooling their child, while seven in ten (69%) say school vaccine policies were not a reason. One in five parents who currently or previously homeschooled their children say they applied for a school vaccine exemption at some point.
Parents’ Views of the HPV Vaccine
Introduced in 2006, vaccines for human papillomavirus (HPV) prevention have been the source of some controversy. HPV is a sexually transmitted infection (STI) that can cause cervical cancer and other cancers. The HPV vaccines available in the U.S. have been clinically proven to be safe and effective at preventing HPV-related infections and cancers. Children can be vaccinated for HPV as young as 9 in some states, though the CDC recommends routine vaccination against HPV between ages 11 and 15. While health experts broadly recommend the vaccine for adolescents and children before an exposure to HPV, its connection to STIs has fueled debate over whether it should be given to children. About two-thirds of parents (64%) say they have heard “a lot” (22%) or “some” (41%) of the vaccine that prevents HPV, including similar shares of parents of girls and boys.
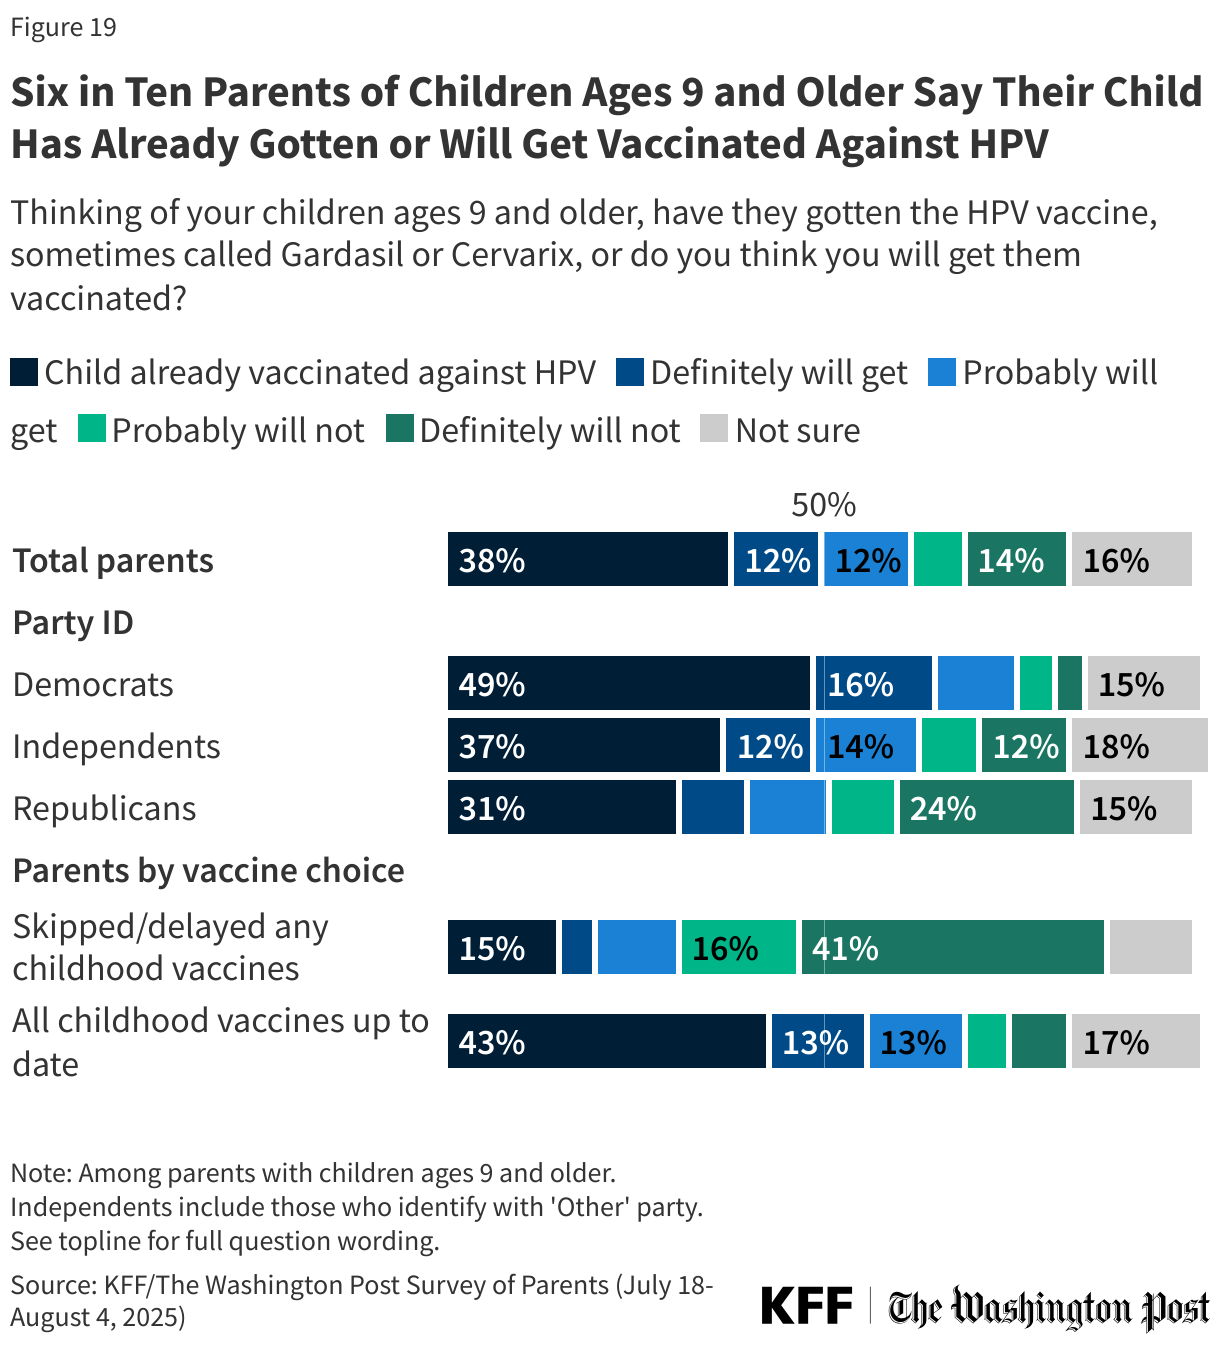
About six in ten (62%) parents of children ages 9 and older say their child has already received the HPV vaccine, or they probably or definitely will get it. This rises to about seven in ten (69%) among parents who have kept all their children up to date on other childhood vaccines. As with vaccine uptake for other childhood vaccines, Democratic parents (76%) are more likely to say their child will get or has gotten vaccinated against HPV, though half (51%) of Republican parents of eligible children say the same. About six in ten (62%) independent parents say they have gotten their child vaccinated against HPV or plan to do so. Similar shares of parents of boys and girls say they have gotten or will get their older children vaccinated.
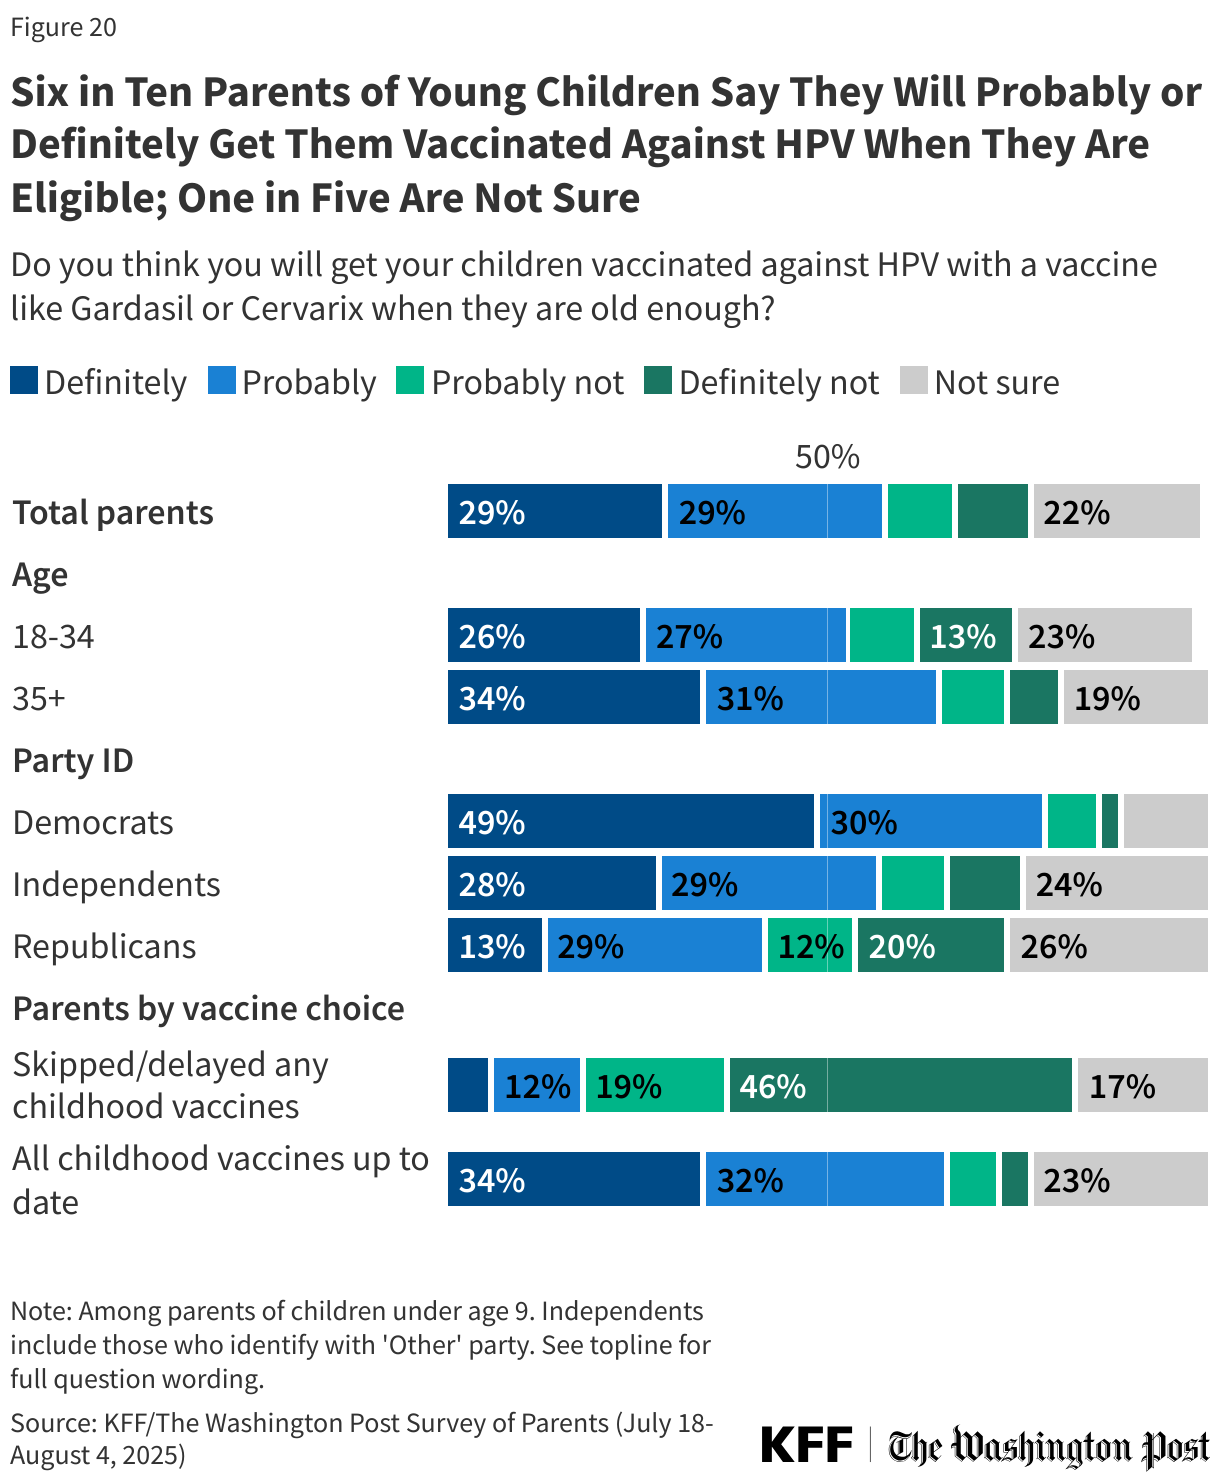
Among parents of children under age 9 who are not yet eligible for HPV vaccination, about six in ten say they will definitely (29%) or probably (29%) get their child vaccinated against HPV, while one in five say they probably (9%) or definitely (10%) will not vaccinate their child. One in five (22%) are not sure. Larger shares of Democratic parents (79%) and parents who have not skipped any childhood vaccines for their children (66%) say they will probably or definitely get their children vaccinated against HPV when they are eligible, compared with about four in ten (42%) Republican parents and one in five (19%) of those who have skipped or delayed childhood vaccines.
In Their Own Words: Why do you think you will not get your child vaccinated against HPV?
In a follow up question, parents who said they “probably” or “definitely” would not get their child vaccinated against HPV told us why that is. Many offered responses related to concerns about the HPV vaccine being associated with unsafe sexual behavior and did not see a need to give that to their children, as well as anecdotes of side effects.
“Risks outweigh the benefits. This is a disease caused by a virus you get due to unwise behavior.” – Republican parent of a teenage boy and girl, age 51, Wisconsin
“They should not be engaging in sexual activity until marriage, and they explicitly understand the risks without the vaccine, and of course, the sinful nature.” – Independent parent of a pre-teen girl, age 34, Pennsylvania
“[I] know someone who had a vaccine injury from the vaccine and because it is a newer vaccine unsure of effectiveness and risk of long-term complications.” – Republican parent of a teenage girl, age 38, Louisiana
“Children should not be having a sexual relationship and being exposed to disease.” – Republican parent of a teenage boy, age 54, Pennsylvania
“I have personally known multiple people with severely adverse health effects directly caused by that vaccine. It also sends a message to our children that we expect them to be sexually immoral. It appears to have been more of a money grab than an actually useful vaccine.” – Independent parent of a teenage boy, age 43, Florida
“I’ve seen mixed information about the vaccine not just from parents. I would like to do further research about the potential adverse effects and benefits before making a decision.” – Democratic parent of pre-teen girls, age 41, Texas
Belief in False and Misleading Claims About Measles and Vaccines
Before his confirmation and in his role as HHS Secretary, Robert F. Kennedy Jr. has amplified claims about vaccines that have been rejected by scientists and public health officials. Along with firing and reassembling the ACIP, Kennedy has said he will investigate the childhood vaccination schedule, suggesting without evidence that the number of recommended childhood vaccines has led to a rise in chronic disease in the U.S. Kennedy has also repeated false claims that vaccines, including MMR, can cause autism and that the measles vaccine causes the illness it prevents. More recently, Kennedy has promoted Vitamin A as an effective treatment for measles, despite public health experts’ warning that supplements cannot substitute for vaccination.
Relatively few parents think false or misleading claims about vaccines and measles are true, but many are uncertain, with at least four in ten saying they do not know enough to say. At the same time, the share who say these false claims are true is higher among Republican parents, particularly those who identify as supporters of the Make America Great Again (MAGA) movement.
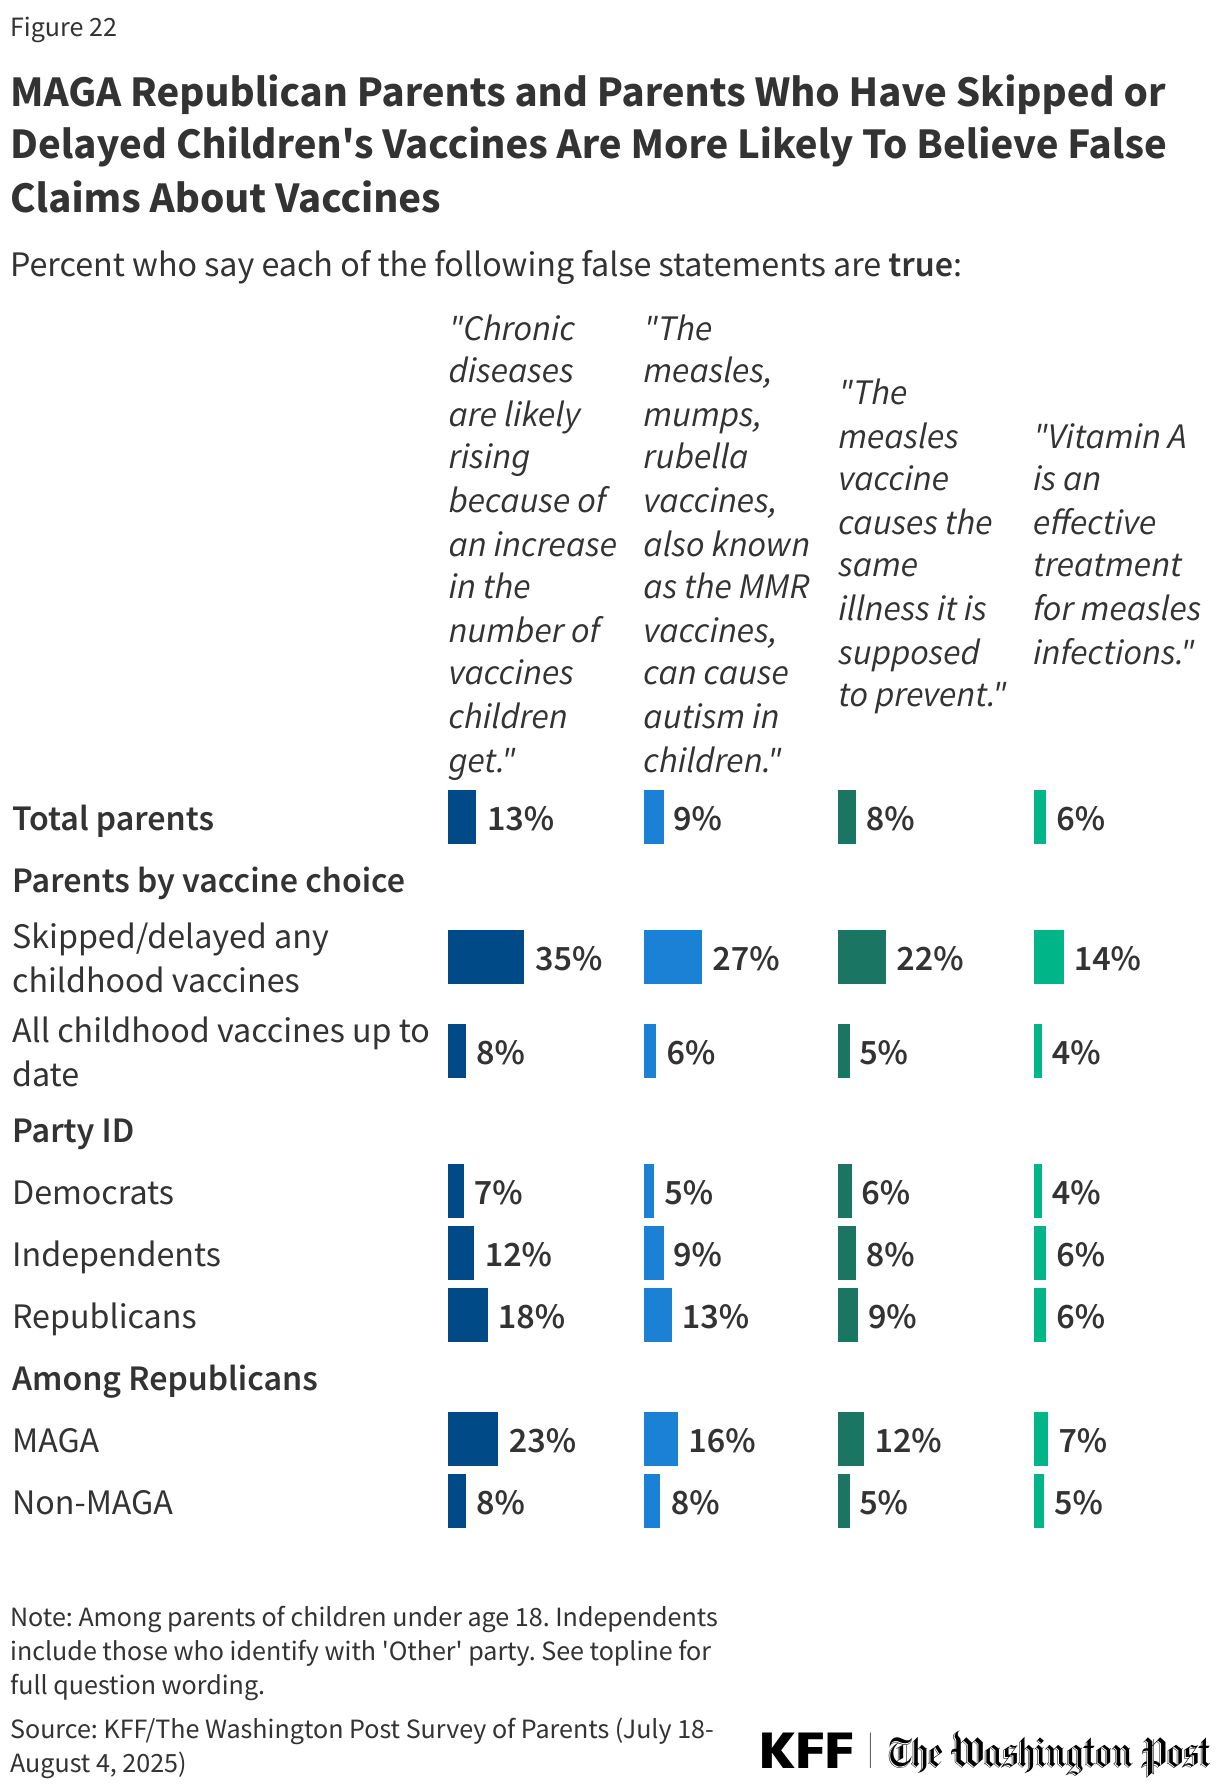
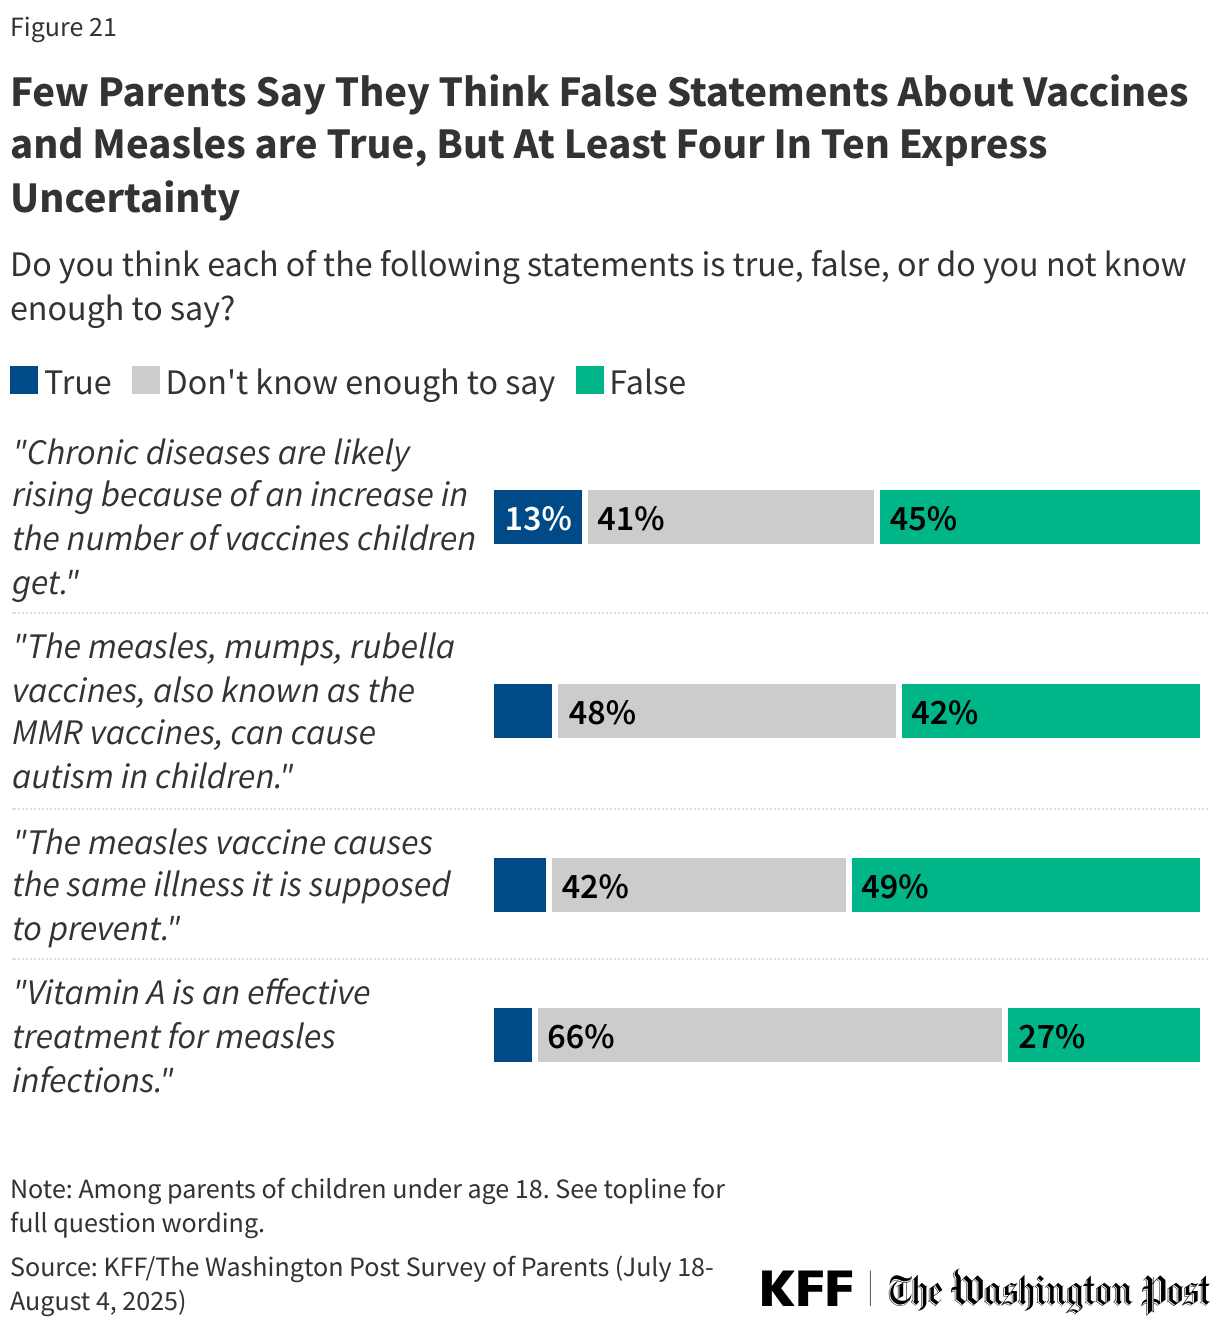
Overall, few parents say they think it is true that chronic diseases are rising because of an increase in the number of vaccines children get (13%), that MMR vaccines can cause autism in children (9%), that the measles vaccine causes the same illness it is supposed to prevent (8%), or that vitamin A is an effective treatment for measles (6%). For each of claim related to vaccines, between four in ten and half say they are false, including that the measles vaccines cause the same illness they are supposed to prevent (49%), that chronic disease are likely rising due to an increase in the number of childhood vaccines (45%), or that MMR vaccines can cause autism in children (42%). Assessing the false claim that Vitamin A is an effective treatment for measles, about one in four correctly say it is false (27%), while two-thirds (66%) say they do not know enough to say.
Republican parents are about twice as likely as Democratic parents to believe that chronic diseases are rising because of an increase in the number of vaccines children get (18% v. 7%) and that the MMR vaccines can cause autism in children (13% v. 5%). Belief in each of the three claims related to vaccines and measles is higher among parents who are MAGA Republicans compared to non-MAGA Republicans; nonetheless, most MAGA supporters either express uncertainty or say these claims are false.
Parents who say they skipped or delayed recommended vaccines for their children are far more likely than those who have kept their children up to date to believe these myths.
The claim linking MMR vaccines to autism is one that has a long history, and previous KFF polling has found many parents are uncertain about the facts around autism and vaccines. The poll finds that parents who say their child has been diagnosed with autism spectrum disorder are more likely than those whose children have not to say it is true that MMR vaccines can cause autism in children (16% v. 9%). About one-third (37%) of parents of children diagnosed with autism say they do not know enough to answer.
Confidence in Federal Health Agencies and Changes to Vaccine Policy
Amid criticism of federal health agencies, Robert F. Kennedy Jr. was appointed HHS Secretary, and said his priority was to strengthen the agencies’ independence and base decisions on scientific evidence. Six months into his term as Secretary, parents’ confidence in federal health agencies to carry out some of their core functions is mixed.
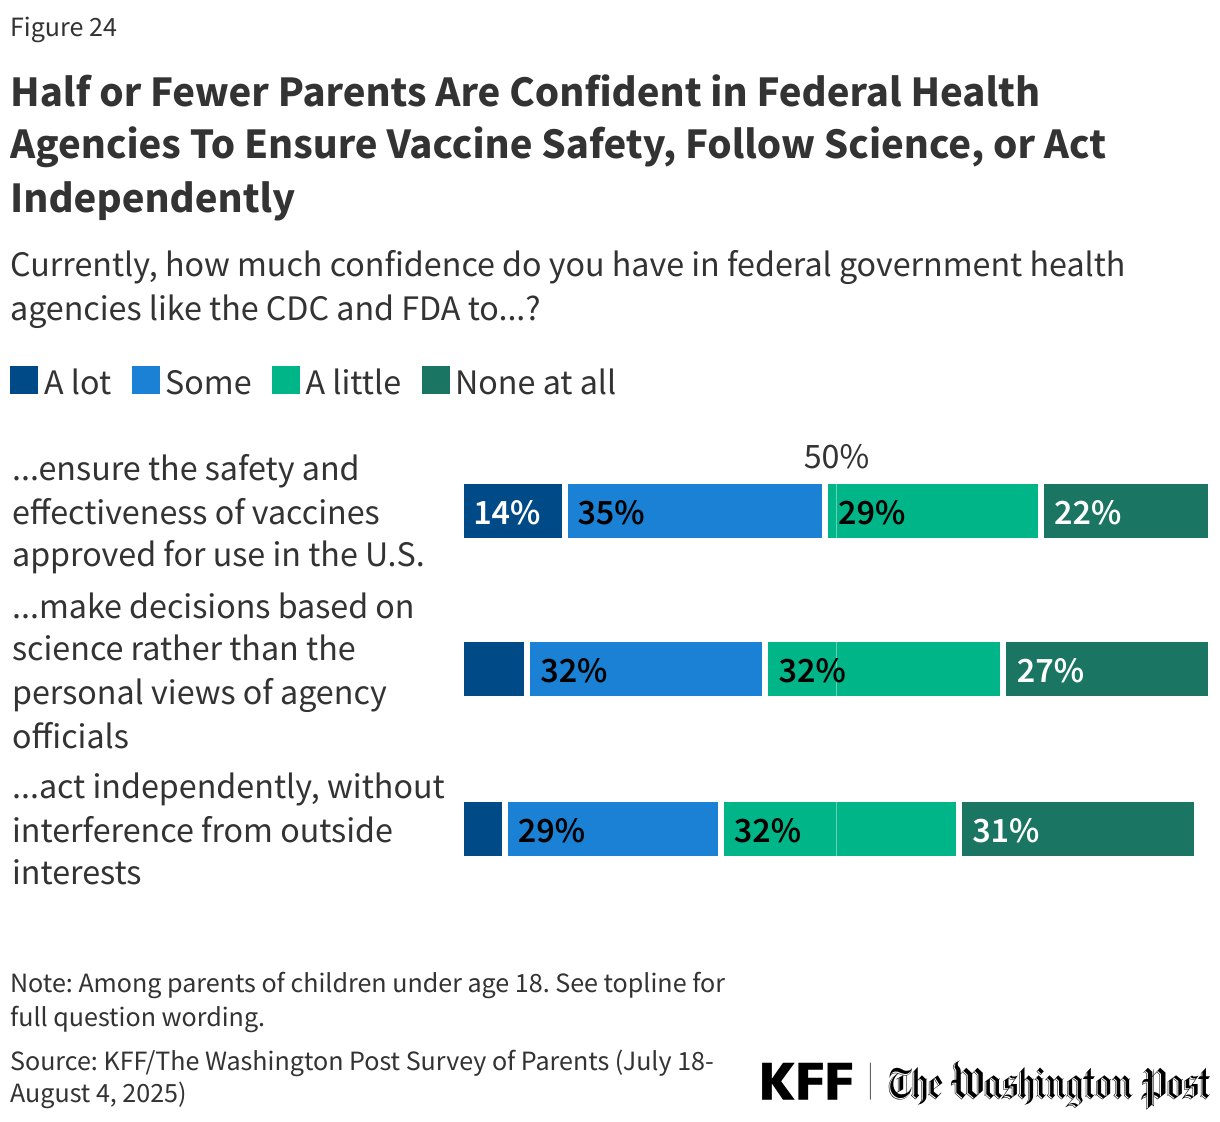
About half (49%) of parents say they have “a lot” or “some confidence” in government health agencies like the CDC and FDA to ensure the safety and effectiveness of vaccines. Fewer than half express confidence in these agencies to make decisions based on science rather than the views of agency officials (40%) or to act independently without interference from outside interests (35%).
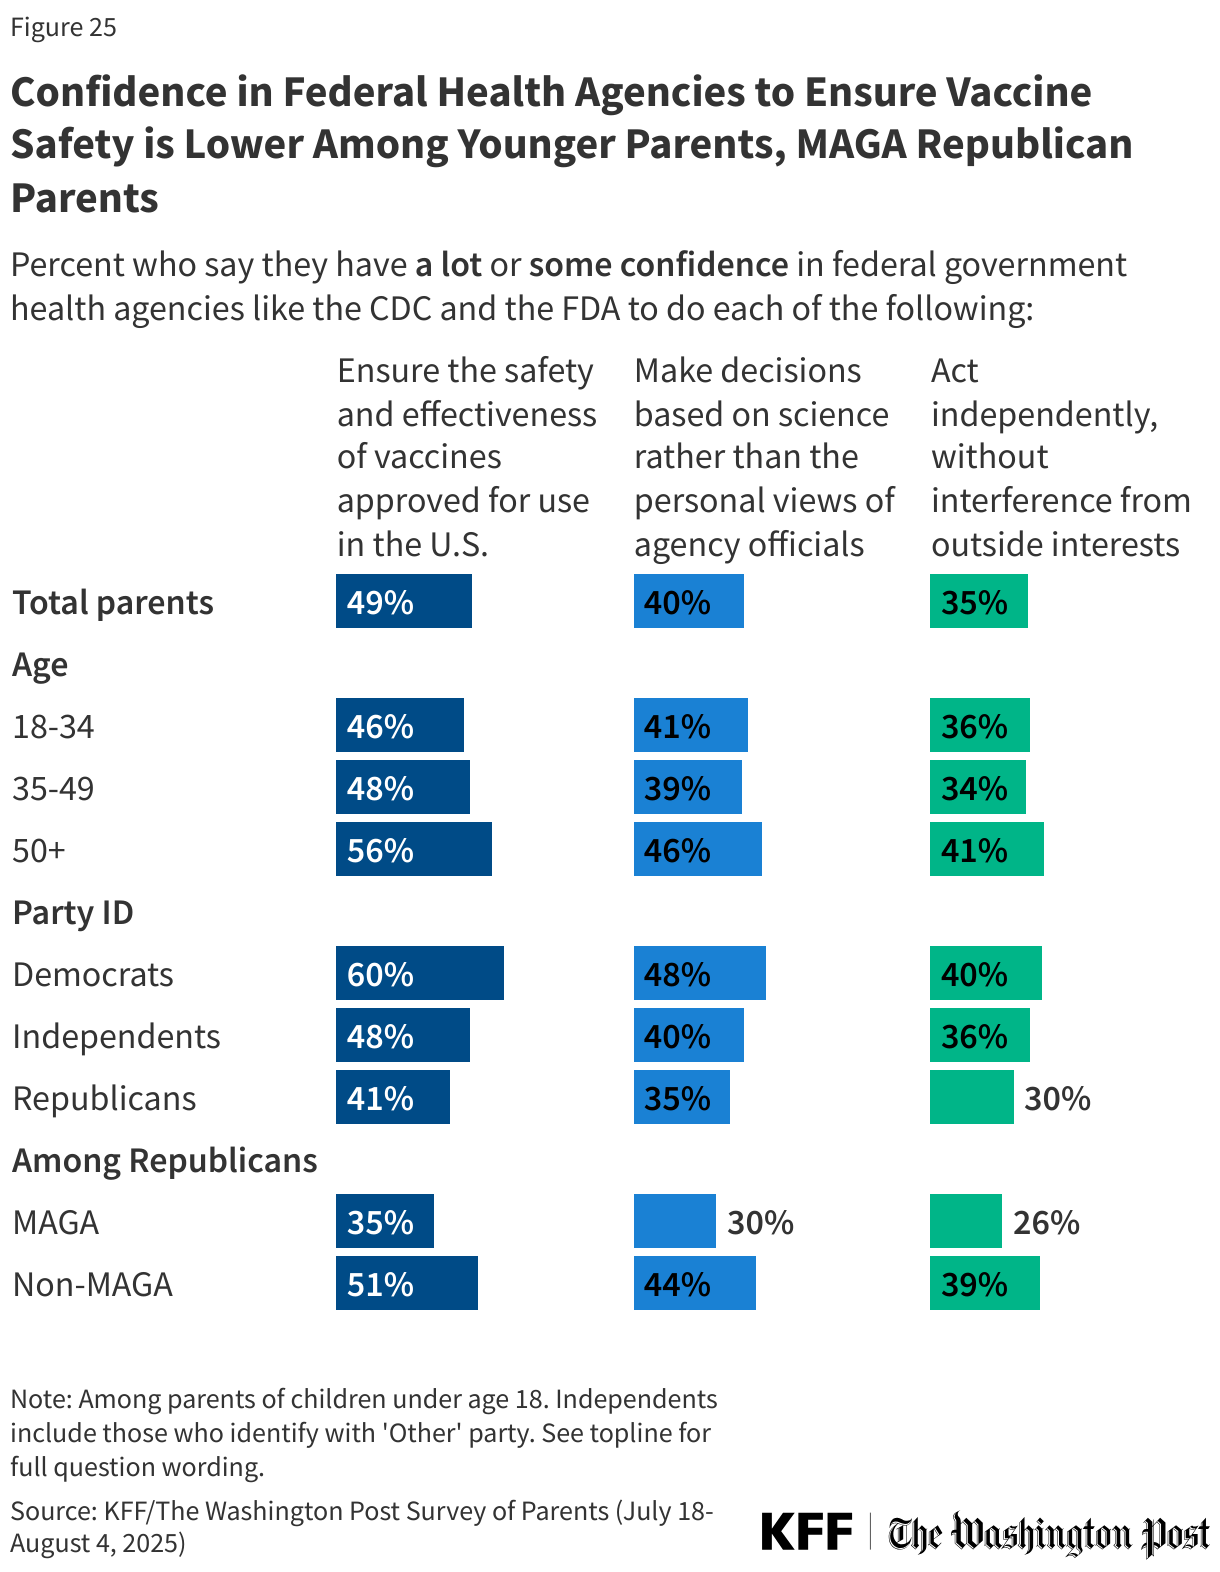
Republican parents are less likely than Democratic parents to express confidence in government health agencies to ensure the safety and effectiveness of vaccines (41% v. 60%), make decisions based on science rather than the views of agency officials (35% v. 48%), or to act independently without outside interference (30% v. 40%).
Even among parents who are ostensibly among the current administration’s most ardent supporters (Republicans who say they support the MAGA movement), fewer than half express at least some confidence in federal government health agencies to ensure the safety and effectiveness of vaccines, make decisions based on science, or act independently.
Parents under age 50, who are more likely to express vaccine-skeptical attitudes and to report skipping or delaying vaccines for their children, are less likely than older parents to express confidence in government health agencies to ensure vaccine safety and effectiveness and to act independently without outside interests.
Since his appointment as Secretary of Health and Human Services, Robert F. Kennedy Jr. has made several changes to U.S. vaccine policy, including replacing the ACIP, removing COVID-19 vaccine recommendations for healthy children, and cancelling funding for mRNA vaccine research. This survey, fielded late July to early August 2025, finds that fewer than half of parents have heard about these changes.
About four in ten (38%) parents have heard “a lot” (11%) or “some” (27%) about recent changes Kennedy has made that could affect vaccine policies in the U.S., while about one in four (27%) have heard “a little” and one-third (34%) have heard “nothing at all.” Parents with a college degree (49%) and Democrats (49%) are more likely than their counterparts to say they have heard at least “some” about these recent changes.
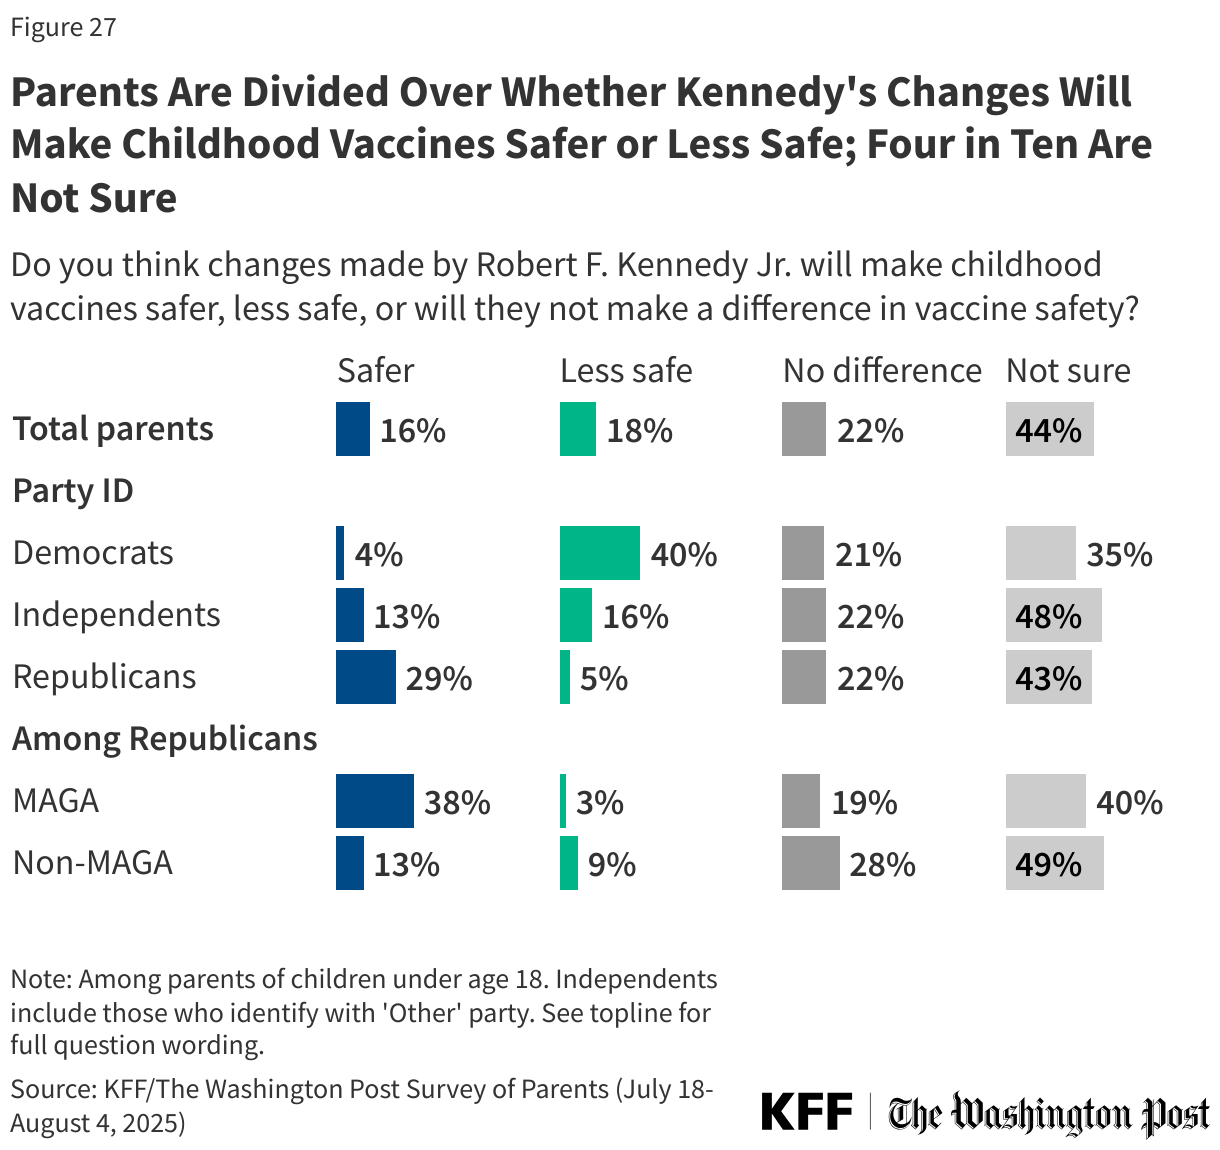
When it comes to expectations of the impact of these changes, parents are split along party lines. One in six parents (16%) say the changes made by Kennedy will make childhood vaccines safer, about one in five (18%) say the changes will make childhood vaccines less safe, and an additional one in five say these changes will not make a difference (22%). The largest share of parents, more than four in ten (44%), say they are not sure how these changes will impact safety.
Partisans are split, with about three in ten (29%) Republican parents, rising to nearly four in ten (38%) MAGA Republicans, saying these changes will make childhood vaccines safer, compared to 4% of Democratic parents. Four in ten Democratic parents and 5% of Republican parents say the changes will make vaccines less safe. About one in five parents across partisans say the changes will not make a difference, and at least one-third say they are not sure.
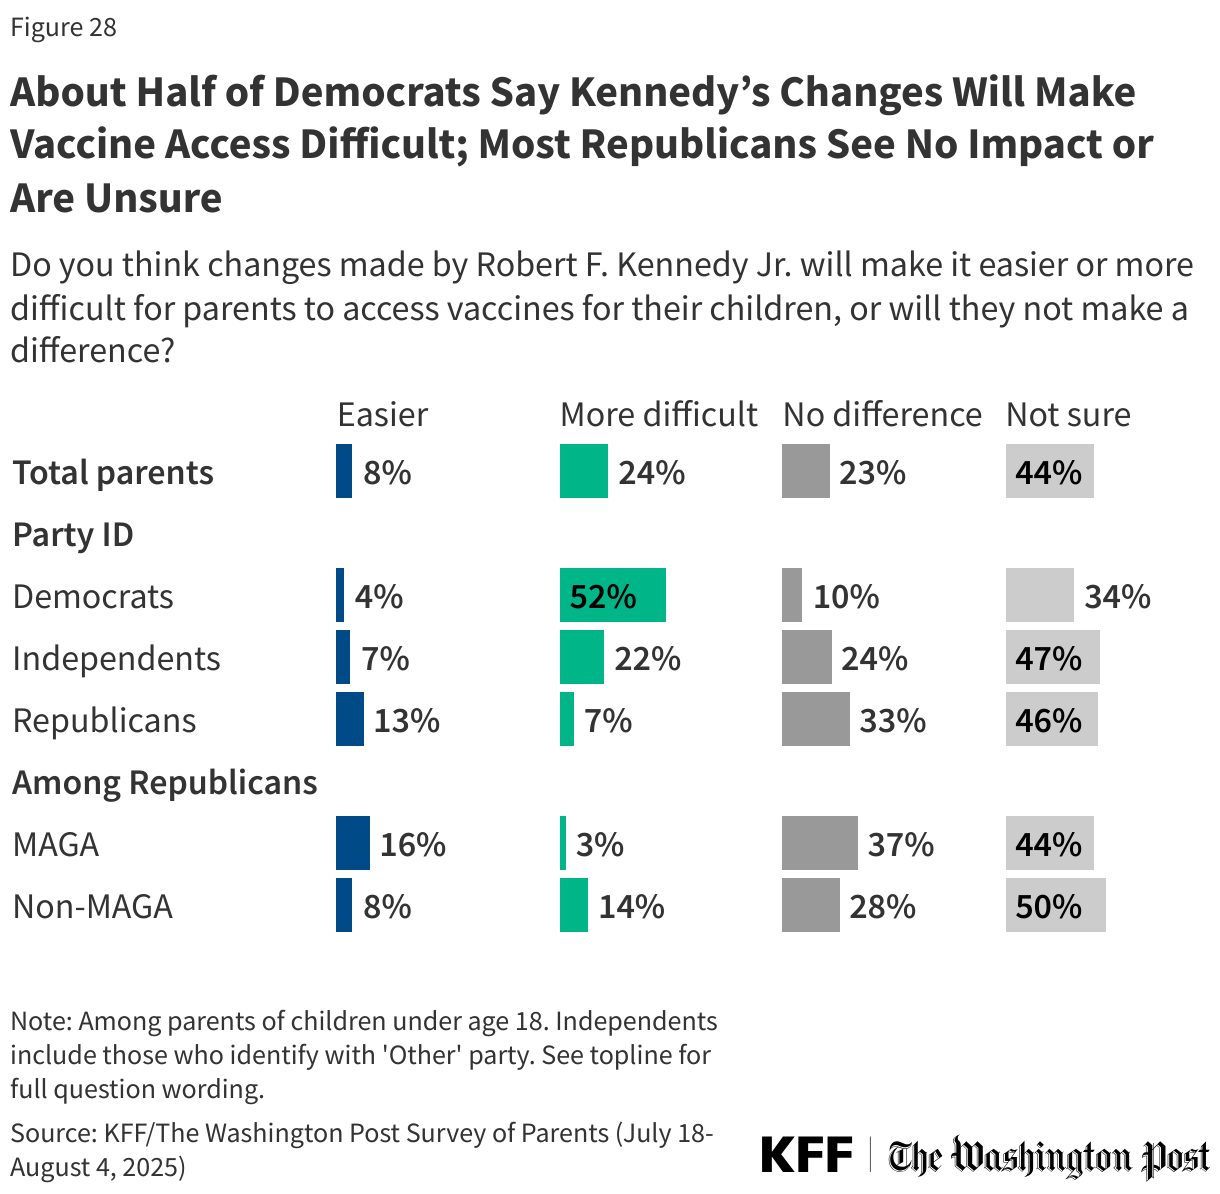
Fewer than one in ten (8%) parents say that changes made by Kennedy will make it easier for parents to access vaccines for their children, about one in four (24%) say these changes will make it more difficult, and about one in four say it will not make a difference (23%). The largest share (44%) say they are not sure.
Again, partisans are split, with half of Democratic parents (52%) saying Kennedy’s changes will make it more difficult to access vaccines. Most Republican parents say Kennedy’s changes will not make a difference in access to childhood vaccines (33%) or that they are not sure (46%).
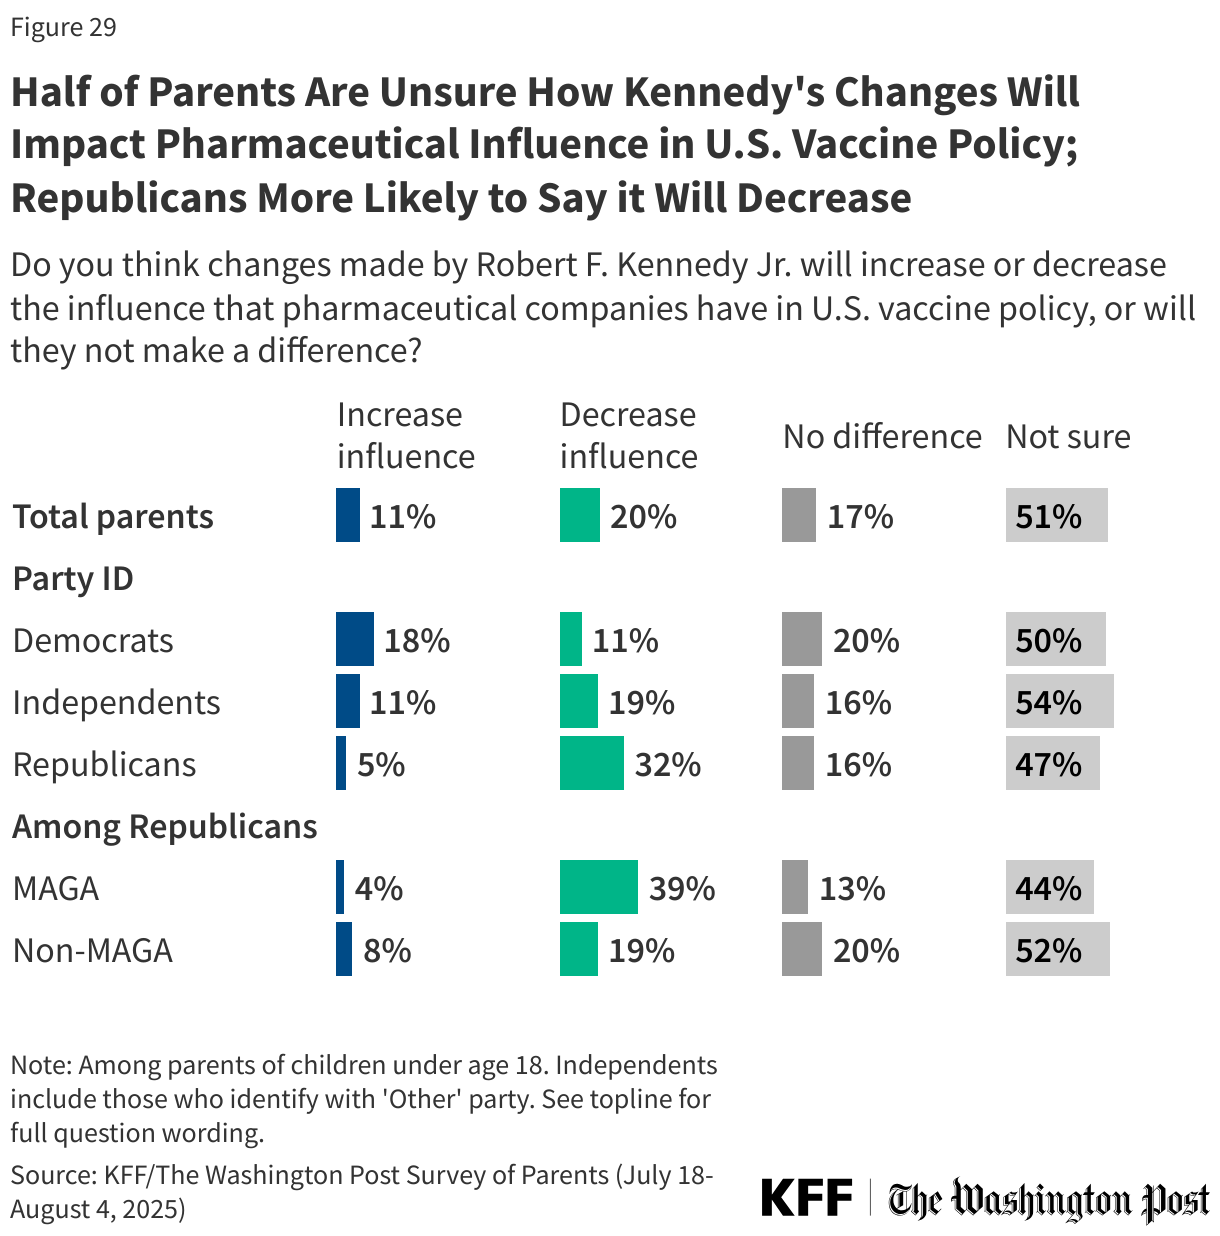
Secretary Kennedy has promised radical transparency and a decrease in the pharmaceutical industry’s influence on U.S. vaccine policy, yet about half (51%) of parents are unsure whether Kennedy’s policies will achieve this decreased influence. One in five (20%) say Kennedy’s changes will decrease pharmaceutical company influence in U.S. vaccine policy, about one in ten (11%) say they will increase influence, and one in six (17%) parents say it won’t make a difference.
Half of Republicans (47%) and Democrats (50%) say they are not sure if Kennedy’s changes will increase or decrease pharmaceutical company influence in U.S. vaccine policy. One-third (32%) of Republicans expect the changes to decrease pharmaceutical company influence, while one in five Democrats say it will either increase (18%), or will not make a difference (20%).