News Release

What is the Potential Impact of New Drugs for Obesity and Alzheimer’s Disease on Medicare Costs, Coverage and Beneficiaries? 

Published: May 18, 2023

Two new KFF analyses examine the potential impact of Medicare coverage of new prescription drugs for obesity and Alzheimer’s disease on program spending and beneficiary out-of-pocket costs, as well as the role that the Inflation Reduction Act could play in mitigating these effects.

Manufacturers of both types of drugs are lobbying for broad Medicare coverage of them, though they face different challenges.

The availability of effective weight-loss drugs, including Novo Nordisk’s Ozempic and Wegovy (semaglutide) and Eli Lilly’s Mounjaro (tirzepatide), has the potential to be transformative for people who struggle with obesity and obesity-related medical conditions. But, as the first analysis explains, these drugs, which are expensive, are not covered by Medicare because current law prohibits Medicare from covering drugs prescribed for weight loss. Congress would need to amend the law for weight-loss drugs to be covered under Medicare, though coverage could also potentially be achieved administratively through a demonstration waiver or a Center for Medicare and Medicaid Innovation model.

Without coverage, access to these relatively high-priced drugs will continue to be limited to people who can afford them, raising equity concerns. Wegovy, for example, has an estimated annual net price of $13,600. While Black Medicare beneficiaries have the highest rates of obesity, they may be least able to afford these new drugs, given their substantially lower incomes and assets compared with White beneficiaries.

In the fight against Alzheimer’s, the Food and Drug Administration will soon announce whether it will grant full approval to the new drug Leqembi (lecanemab), made by Eisai and Biogen, after granting accelerated approval in January. Our second analysis explains that, if that happens, Medicare is expected to cover Leqembi for all indicated populations. Medicare coverage of a drug that could slow the progression of cognitive decline offers hope for Alzheimer’s patients and their families. But it also raises concerns about the potential impact on Medicare spending.

The take-up rate of Leqembi among eligible individuals is difficult to estimate, but for illustrative purposes, if five percent of the 6.7 million older adults in the United States with Alzheimer’s disease were to take Leqembi, at the annual list price of $26,500, this would add an estimated $8.9 billion to Medicare Part B spending annually, roughly equal to spending on the top three Part B drugs combined in 2021. If double that share were to take the drug, the higher spending would amount to $17.8 billion. Higher spending would likely lead to higher Medicare Part B premiums.

Even if Medicare were to cover Leqembi, patients administered the drug would be responsible for 20 percent of the cost, or more than $5,000 out of pocket in cost sharing each year, unless they have coverage that covers a portion of these costs. With higher rates of dementia and lower incomes among older Hispanic and Black adults than among older White adults in the U.S., Black and Hispanic beneficiaries may be less likely to get this treatment if they can’t afford it.

If covered by Medicare, these drugs could be among the limited number of drugs that would be subject to Medicare’s new drug price negotiation authority under the Inflation Reduction Act – but not for several years. For example, manufacturers of biologic drug products like Leqembi would be exempt from having Medicare-negotiated prices take effect for 13 years from the drug’s licensure date, which for Leqembi itself would be no sooner than 2036. For one of the small-molecule drugs being used for weight loss, negotiated prices could potentially take effect in 2027.

Another provision of the law will cap out-of-pocket Part D spending at $2,000 in 2025. The cap would make weight loss drugs more affordable if they are covered under Part D, but the law’s new cap does not limit out of pocket spending for drugs that are covered under Medicare Part B, as would be the case with Leqembi.

For the full analyses, as well as more data and analyses about Medicare and prescription drugs, visit kff.org.

What Could New Anti-Obesity Drugs Mean for Medicare?

Published: May 18, 2023

This post has been updated to reflect the introduction of legislation in the 118th Congress in July 2023 that would authorize Medicare coverage of weight-loss medications.

A relatively new class of medications is generating excitement in the medical community and among people with obesity and others who struggle to lose weight. Initially approved to treat type 2 diabetes, these drugs, known as GLP-1 (glucagon-like peptide-1) agonists, including Novo Nordisk’s Ozempic and Wegovy (semaglutide) and Eli Lilly’s Mounjaro (tirzepatide), are also highly effective weight loss agents. But they are also expensive, and not covered by Medicare when used for weight loss. In this piece, we discuss Medicare coverage of obesity treatments, the potential cost implications if Medicare covers anti-obesity drugs, and how the Inflation Reduction Act could potentially address these cost concerns.

Medicare coverage of obesity services and treatments currently includes obesity screening, behavioral counseling, and bariatric surgery, but not drugs that are prescribed for weight loss. The 2003 law that established the Medicare Part D prescription drug benefit explicitly prohibits Part D plans from covering drugs used for weight loss, along with some other types of drugs, including agents used for cosmetic purposes or hair growth, fertility drugs, and drugs prescribed to treat sexual or erectile dysfunction.

With evidence that GLP-1s lead to significant weight loss and may offer additional health benefits to people with medical conditions exacerbated by excess weight, manufacturers of these drugs and other stakeholders are pushing for a change in law to allow coverage under Medicare. This push for expanded coverage under Medicare and other insurance plans is taking place despite some uncertainty about the risks associated with their use. A bipartisan group of lawmakers has introduced legislation, the Treat and Reduce Obesity Act, that would authorize Part D coverage of medications when used for the treatment of obesity or weight loss management in overweight individuals with related comorbidities.

Lifting the current law prohibition on coverage of weight-loss drugs would come at a cost to Medicare, given the high price and expected demand. Wegovy, for example, has an annual estimated net price of $13,600. According to a recent study, if 10% of Medicare beneficiaries with obesity use Wegovy, the annual cost to Medicare could be $13.6 billion (based on a 19% obesity rate from traditional Medicare diagnoses in 2021) to $26.8 billion (based on a 41.5% obesity rate from survey data for adults ages 60 and older). Higher take-up rates would mean higher Medicare spending. For context, total annual Part D spending in 2021 was $98 billion. Of note, these estimates do not account for potential reductions in Medicare spending that could occur if weight loss drugs reduce medical spending associated with other diseases, such as heart disease.

Maintaining the status quo, however, could raise both access and equity concerns, given the current price. The annual cost of Wegovy is unaffordable for many Medicare beneficiaries. Moreover, the rate of obesity is highest among Black Medicare beneficiaries compared to beneficiaries in other racial and ethnic groups (Figure 1). Without Medicare coverage, Black beneficiaries may be least able to afford these new drugs, given their substantially lower incomes and assets than White beneficiaries.

The Prevalence Rate of Obesity is Highest Among Black Medicare Beneficiaries Compared to Beneficiaries in Other Racial and Ethnic Groups

The Inflation Reduction Act of 2022 could help lessen the cost impact of weight loss drugs on Medicare and Part D enrollee out-of-pocket spending. If covered by Medicare, weight loss drugs could be among the limited number of drugs that will be subject to Medicare’s new drug price negotiation authority, but not for several years. At the earliest, a negotiated price for semaglutide, for example, would not be available before 2027 (based on FDA approval in late 2017) and not before 2031 for tirzepatide (based on FDA approval in 2022). Another provision would subject weight-loss drugs to the new law’s inflation rebate that aims to limit annual increases in drug prices. A third provision of the law will cap out-of-pocket Medicare Part D spending for covered drugs at $2,000 in 2025, which would certainly help to make these drugs more affordable. But even paying $2,000 out of pocket would still be beyond the reach of many people with Medicare who live on modest incomes.

To limit the potential cost impact to Medicare, lawmakers could consider shortening the period between FDA approval and the year negotiated prices take effect, as proposed in the Biden Administration’s FY2024 budget, but adopting this change to the newly-launched negotiation program seems unlikely in the current political climate. If the underlying Part D law is not changed, adding Medicare coverage for obesity drugs could possibly be achieved through other pathways, such as a demonstration program through the Centers for Medicare & Medicaid Innovation or Section 402 authority.

The availability of effective weight-loss drugs has the potential to be transformative for people who struggle with obesity and obesity-related medical conditions, but without insurance coverage, access to these relatively high-priced drugs will be limited to those who can afford them. While competition among GLP-1 medications could have a moderating effect on launch prices, the combination of intense demand and high prices for these treatments is likely to place tremendous pressure on Medicare spending if coverage is authorized, even in the wake of the prescription drug provisions in the Inflation Reduction Act. A decision to cover weight-loss drugs under Medicare could have ripple effects for employers and other payers if they follow Medicare’s lead.

This work was supported in part by Arnold Ventures. KFF maintains full editorial control over all of its policy analysis, polling, and journalism activities.

Mpox One Year Later: Where is the U.S. today?

Published: May 17, 2023

Introduction

May 18, 2023 marked one year since a case of mpox (monkeypox) was identified in the United States as a part of a new multi-country outbreak in regions where it had not previously been endemic. As a result, the World Health Organization (WHO) declared the mpox outbreak to be a Public Health Emergency of International Concern (PHEIC) on July 23, 2022 and the U.S. declared a Public Health Emergency (PHE) on August 4, 2022. Unlike prior mpox outbreaks, most of those impacted were gay and bisexual men and other men who have sex with men, including those with HIV. Furthermore, the majority of those affected in the U.S. have been people of color.

After the deployment of vaccines and treatments last summer, coupled with growing awareness of the disease, cases began to decline and both the WHO and the U.S. government have since ended their emergency declarations or allowed them to expire. Still, while cases in the U.S. continue to remain low, public health officials have expressed concern that they could rise again this spring and summer; indeed, recently, there was a small but notable outbreak in Chicago, raising questions about whether this is a harbinger for what is to come.

This brief provides an overview of the impact of mpox in the U.S. one year later, the federal response to date, and discusses the future outlook.

The 2022 Mpox Outbreak (as of May 10, 2023)

Global Cases: 87,314

US Cases: 30,395

US Deaths: 42

Source: CDC, 2022 Outbreak Cases and Data. 

The impact

The 2022 mpox outbreak was not evenly distributed across the US. The majority (52%) of cases have been concentrated in the four most populous states (CA, FL, NY, and TX) – disproportionate to their share of the total population — though all states, DC, and Puerto Rico have reported at least 3 cases. In addition, almost all cases have occurred among gay and bisexual men and other men who have sex with men, differing from prior outbreaks in endemic countries.

Data from the CDC  indicate that 99% of cases reported between May and July of 2022 were among men and of those, 94% were among men who had sexual contact with other men. In addition, within this group, those living with HIV have been especially hard hit. Among mpox cases with data available on HIV status, 41% were also HIV positive.

Additionally, people of color, particularly gay and bisexual men of color, have been disproportionately impacted by mpox. While Black people account for 12% of the US population, they account for 33% of mpox cases. Hispanic people account for 19% of the US population but 31% of mpox cases. There are also notable racial and ethnic disparities in deaths associated with mpox with almost all mpox deaths reported in the U.S. to date (92% of 38 deaths with available demographic data) being among Black and Latino people; some of this may have been driven by disproportionate access to mpox vaccines (see below). Further, 94% of those who died were HIV positive, not virally suppressed, and 40% were experiencing homelessness, pointing to overlapping and intersecting drivers of inequality.

Distribution of US Population and Mpox Cases and Vaccination Uptake, by Race/Ethnicity

Federal response to date

Coordination

After the first cases of mpox were identified in May of last year, the CDC and other agencies took initial response steps such as developing an updated case definition for mpox, providing guidance to states and other public health officials with respect to surveillance, reporting, and contact tracing, testing, vaccination, and coordinating with international partners. Some were critical  that the initial response was slow and early on there were substantial hurdles related to testing and vaccine supply and accessibility. In June of 2022, the White House announced a government-wide strategy including an approach to scaling up surveillance, vaccination and testing efforts, and the CDC activated its Emergency Operations Center to enhance operational support, including monitoring and coordination. The federal government also worked to educate health care providers and the public and identify research priorities.

Today, the federal response is coordinated by the National Mpox Response Office at the White House and involves coordination across the federal government, especially within the U.S. Department of Health and Human Services (HHS) and its operating divisions and offices. These include the Office of the Assistant Secretary for Preparedness and Response (ASPR, which includes the Strategic National Stockpile under the Office of Operations and Resources as well as the Biomedical Advanced Research and Development Authority (BARDA)), the Food and Drug Administration (FDA), Health Resources and Services Administration (HRSA), and the National Institutes of Health (NIH). The White House Office of Science and Technology Policy (OSTP) also plays a role.

Testing

Testing for mpox initially took place through the CDC and other public health laboratories and was very limited, creating access challenges for patients and providers. However, capacity ramped up and eventually expanded to commercial laboratories nationwide. Testing capacity grew from 6,000 tests per week in June of 2022 to 80,000 per week by July, with expansions largely due to CDC partnering with commercial laboratories. Because newer assays under emergency use authorization (EUA) are not included in this number, capacity is potentially larger today.

Vaccination

JYNNEOS, the preferred mpox vaccine used in the U.S., has been approved by the FDA for both smallpox and mpox, and is made available to jurisdictions through the Strategic National Stockpile. JYNNEOS, a two-dose regimen, can be used following a known or likely exposure (i.e., post-exposure prophylaxis or PEP) or as a preventive measure before an exposure occurs (i.e., pre-exposure prophylaxis or PrEP).

In the early days of the outbreak, HHS began shipping what was then a very limited supply of vaccines to states on May 21, 2022, using a four-tier distribution strategy that prioritized jurisdictions with the highest mpox case rates (the U.S. had just 65,000 JYNNEOS doses in the stockpile in late June 2022). Additional doses were ordered for the 2020-2023 period, with 6.9 million doses of JYNNEOS expected to be available by mid-2023, enough to vaccinate 3.5 million people. (See our prior analysis for more details.) Recent information suggest this timeline is on track as of March 2023. Today, a jurisdictional threshold approach is being used based on each jurisdiction’s estimated percentage of the nation’s population for whom JYNNEOS vaccination is recommended; jurisdictions can order any quantity of vials up to the threshold.

HHS also maintains a store of more than 100 million doses of the ACAM2000 vaccine, a smallpox vaccine considered effective for mpox, in the strategic national stockpile. However, due to its safety profile, JYNNEOS is the preferred vaccine.

Data on vaccine efficacy against disease ranged from 66% to 86% for two doses and from 36% to 75% for a single dose, depending on the study. A separate analysis of men aged 18-49 found that mpox incidence among those who were unvaccinated was 9.6 times higher than for those fully vaccinated and 7.4 times higher than among those with a single dose.

As of May 5, 2023 more than 1.2 million vaccine doses had been administered. However, just 38% of those vaccinated had been fully vaccinated. In addition, there are significant racial and ethnic disparities in vaccine uptake. Black and Hispanic people account for a smaller share of those with first dose vaccinations than their share of cases while White people have seen a lower case burden relative to their share of the population as a whole and a higher rate of vaccination (see Figure 1). A recent analysis by CDC found that vaccination is low among those at risk, defined as men who have sex with men who have an indication for HIV PrEP. Nationwide, just 23% of the population at risk is estimated to have been fully vaccinated, with significant variation across the country, ranging from just 5% in West Virginia to 67% in Washington, D.C.

Treatment

There are no available treatments that specifically target the mpox virus. However, because the smallpox and mpox viruses are similar, Ticoviromat (TPOXX), an antiviral approved for smallpox, is used to treat severe mpox cases. TPOXX is prescribed for mpox treatment under an expanded access Investigational New Drug (EA-IND) protocol and available from the strategic national stockpile at no cost. On July 1, 2022, HHS reported that the strategic national stockpile had over 1.7 million TPOXX antiviral treatment courses. Through January 2023, 6,832 patients with mpox has been treated with TPOXX.

Because TPOXX for mpox is only available under an EA-IND protocol through the CDC, access can be challenging. Initially, there were many reports of providers facing lengthy and burdensome processes in accessing treatment, creating a barrier for patients and a challenge for provider. In response CDC streamlined the approval process, though it still can take some time for providers to navigate.

In an effort to promote equitable access, jurisdictions can also request oral TPOXX using a threshold approach. TPOXX thresholds are formula driven: 75% is based on the number of jurisdictional cases and 25% on the number of individuals at the highest risk.

Federal Funding

New federal funding to address mpox has not been appropriated by congress, though the White House requested $4.5 billion in the FY23 omnibus spending bill.

Given the lack of new federal investment, agencies have had to use existing resources to fund response activities. For example, CDC has allocated funding to jurisdictions on two occasions through its Public Health Crisis Response Cooperative Agreement: once in December 2022 when $12.5 million was awarded to 21 jurisdictions for vaccination and other mpox response activities and again in January 2023 when $33.7 million was awarded to 53 jurisdictions to respond to remaining cases, prevent future outbreaks through vaccination efforts, and strengthen capacity to respond to future cases. In addition, several agencies, including the CDC and HRSA’s Ryan White HIV/AIDS Program, provided guidance around flexibilities to allow grantees to use existing funding to address mpox. Federal investments have also been directed to mpox research activities across a range of government programs/agencies.

Surveillance

In partnership with states and local jurisdictions, CDC plays the central federal role in mpox surveillance. Jurisdictions collect data which is then reported to and combined by the CDC. CDC then provides surveillance data and reports on a range of variables including:

Public communication and partnerships

The communication to the public and providers around mpox has largely come out of CDC. HHS’ Office of Infectious Disease and HIV/AIDS Policy, the Health Resources Services Administration (HRSA) –  especially within the Ryan White Program – have also played a role.

CDC has provided public education materials to jurisdictions, providers, and individuals though webinars, website materials, and engagement at local events. This includes equity tool kits for local outreach and messaging specifically aimed at the hardest hit communities and communities of color in an effort to address racial/ethnic disparities. CDC also engaged with on the ground partners as part of its vaccine equity pilot project aimed at reducing vaccine inequalities). Applications are now closed but in total 28 applications from 14 states and Puerto Rico were accepted, grouped by two strategies: vaccination events developed to reach specific populations disproportionately affected and vaccination events with a broad reach (though still generally targeting hard hit communities). Examples for projects include events at Southern Decadence and Atlanta Black Pride to provide vaccines and education though community engagement and targeted messaging.

Communication from HHS’ Office of Infectious Disease and the Ryan White Program has focused on the syndemic nature of mpox, HIV, and other STIs. The Ryan White Program has provided education for providers and jurisdictions, flexibility with its grants to respond to mpox, and distributed vaccination through grantees dually funded by Ryan White and HRSA Health Centers.

(In addition, there have been several private sector efforts to address communications gaps such as the mpox education and awareness resources developed by KFF’s Greater Than HIV program).

The Chicago outbreak and the future outlook nationwide

Overall mpox cases in the U.S. remain low but public health officials are monitoring whether there might be a surge of cases as we move into warmer months, a time often associated with more social gatherings and warned of a possible resurgence.

A recent outbreak in Chicago was reported via an alert from the city and raised concerns that this could occur. The alert stated that between mid-April and early May 2023, 13 confirmed or probable mpox cases had been identified in the city (compared to many weeks in February and March when the city reported no cases). Moreover, most cases were among those fully vaccinated, raising questions about vaccine effectiveness, and one-third were among virally suppressed people with HIV. Since this alert was published, more cases have been reported.

It is not yet known what the rest of the year will look like. There could be isolated local outbreaks as has occurred in Chicago or transmission could become more widespread, especially as vaccination lags in terms of initial uptake and second dose completion and potential wanning efficacy. On May 15, 2023, CDC released a Health Alert Network (HAN) message in response to the Chicago outbreak writing that the “spring and summer season in 2023 could lead to a resurgence of mpox as people gather for festivals and other events” and highlighting the important role vaccines play in potentially warding off more serious infection, even if full protection is not provided.

Separately, CDC estimates that if mpox is reintroduced and no additional risk mitigation occurs (i.e. vaccination or behavior changes), the risk of a resurgent outbreak is more than 35% in most jurisdictions and that such outbreaks could be large given that immunity among those most at risk is low.

Discussion

Overall, the public health system for addressing mpox in United States is in a markedly different place than it was one-year ago and is expected to be better able to respond should mpox cases rise. Additionally, providers are generally more knowledgeable about case identification and treatment and the communities most impacted have a better understanding of how to protect themselves, if cases climb.

However, disparities persist and those facing structural barriers and overlapping systems of discrimination — including LGBTQ people, people of color, those with HIV, and people experiencing homelessness — are particularly at risk. Building on lessons learned, including in terms of preparedness, coordination, engagement of hard-hit communities and leveraging an equity framework, will be important both to address lingering inequities today and to respond to potential future outbreaks tomorrow.

Testimony: Prior Authorization in Medicare Advantage

Published: May 17, 2023

Jeannie Fuglesten Biniek, an Associate Director for the Program on Medicare Policy at KFF, testified before the Senate Homeland Security and Government Affairs Committee Permanent Subcommittee on Investigations on May 17, 2023 as part of a hearing on Examining Health Care Denials and Delays in Medicare Advantage. Her testimony describes what the Medicare Advantage market looks like today, the use of prior authorization by Medicare Advantage insurers, and gaps in data that limit oversight and the ability to understand and assess how the use of prior authorization impacts Medicare Advantage enrollees.

News Release

Private Insurers Expect to Pay $1.1 Billion in Rebates This Year for Setting Premiums Too High Relative to Medical Costs

Published: May 17, 2023

Private insurance companies are expecting to pay out about $1.1 billion in rebates this fall under an Affordable Care Act (ACA) provision that requires insurers to spend the bulk of customers’ premium payments on care, a new KFF analysis finds.

Rebates are based on insurers’ experiences over the previous three years. This year’s estimated total is similar to the $1 billion paid out last year, but well short of the $2.5 billion record total paid out in 2020 and $2 billion paid out in 2021. 

Insurers in the individual market expect to owe about $500 million to consumers, including those with ACA marketplace plans, while those in the small-group market expect to owe about $330 million and those in the large group market expect to owe about $250 million. Insurers will determine the final amounts later this year and will issue the rebates to eligible consumers and purchasers in the fall.

The rebates are the result of insurance companies not meeting the ACA’s medical loss ratio threshold, which requires insurers to spend at least 80 percent of premium revenues (85% for large group plans) on health care claims or quality improvement activities. 

This year’s rebates reflect the continued impact of the COVID-19 pandemic, which led to much lower medical-loss rations in 2020 as many people skipped care amid stay-at-home orders and medical offices’ closures.

The estimates are based on an analysis of preliminary data reported by insurers to state regulators and compiled by Mark Farrah Associates. 

State Policy Choices Are Likely to Affect the Extent of Medicaid Enrollment Declines During the Unwinding Period

Authors: Jennifer Tolbert, Sophia Moreno, and Robin Rudowitz
Published: May 9, 2023

NOTE: This analysis, originally published on April 26, 2023, was updated on May 9, 2023 to include newer state data.

Starting on April 1, 2023, all states have begun the process of unwinding the Medicaid continuous enrollment provision. Adopted in March 2020, the continuous enrollment provision has protected coverage for millions enrolled in Medicaid during the past three years. Because states were prohibited from disenrolling people from Medicaid in exchange for enhanced federal funding, enrollment in the program has grown by an estimated 23 million to reach 95 million as of the end of March 2023. Now that continuous enrollment has ended, over the next year (and more quickly in some states), states will redetermine eligibility for everyone enrolled in Medicaid and will disenroll those who are no longer eligible, as well as those who remain eligible but who face barriers to completing the renewal process. Millions of people are expected to lose Medicaid coverage nationally.

The unwinding of the continuous enrollment provision will play out differently across the states based on policy choices states have made and variation in their administrative infrastructures. Some states have adopted multiple policies that are more likely to promote continued coverage among those who remain eligible. Others have adopted fewer of these policies, which will likely lead to a larger number of people losing Medicaid coverage, including some who remain eligible. Additionally, some states have automated eligibility systems that can more easily and accurately process renewals, reducing the number of renewals staff will have to complete manually. Having some way to order states based on their adoption of polices and strategies to promote continued coverage, as well as the capacity of their systems to process the expected volume of renewals, can be helpful for identifying where larger decreases in Medicaid enrollment are more or less likely.

Key Unwinding Metrics

Using data from a survey of state Medicaid eligibility, enrollment, and renewal policies conducted by KFF and the Georgetown University Center for Children and Families (CCF) earlier this year, we have identified 9 key metrics that will support continued Medicaid coverage during the unwinding for those who remain eligible. They include a mix of policy choices and measures of systems capacity and are grouped into three categories: renewal policies in place during the unwinding, systems for processing of renewals, and eligibility policies that promote continued coverage. The metrics include:

Renewal Policies

  • State will take 12-14 months to complete all renewals
  • State follows up on returned mail
  • State follows up with enrollees who have not responded to a renewal request before terminating coverage

System Capacity Measures

  • Processing of renewals is mostly automated
  • 50% or more of renewals are completed on an ex parte basis
  • State has taken steps to improve ex parte renewal rates

Eligibility Policies

  • State has adopted the Medicaid expansion
  • State has adopted 12-month postpartum coverage
  • State has adopted 12-month continuous eligibility for all children in Medicaid and CHIP

Importantly, the data included in this analysis reflect policies and procedures in place as of January 2023; it is possible, likely even, that states have updated some policies in response to guidance from the Centers for Medicare and Medicaid Services (CMS) or mitigation plans developed in coordination with CMS. In addition, some states indicated they were not processing ex parte renewals as of January 2023 and we cannot distinguish between states that paused ex parte renewals while the continuous enrollment provision was in place and those that may not have the system capacity to process ex parte renewals. Ex parte renewals involve automatically renewing coverage based on available data sources. Finally, some states did not provide data for one metric included in this analysis. States with missing data are noted in the figure below.

How Do States Compare Across Unwinding Metrics

Overall, states fall along a spectrum on meeting the metrics. Nine states meet eight or more of the metrics for promoting continuity of coverage, including one state, Colorado, that meets all nine metrics. At the other end of the scale, six states meet four or fewer of the measures (Figure 1). The majority of states fall somewhere in the middle, meeting all of the metrics in some categories but not others. More states (29) meet all of the metrics related to adopting renewal policies that promote continued coverage during the unwinding than meet the standards for metrics in the other two categories (7 states for system capacity and 14 states for eligibility policies).

Key Metrics to Promote Continued Coverage During the Unwinding of the Medicaid Continuous Enrollment Provision

Most states do not have fully automated systems that are capable of completing a majority of renewals using ex parte processes. A total of 42 states do not meet all three of the metrics that measure the capacity of state systems to process ex parte renewals. The total includes 14 states that reported having mostly manual systems for processing renewals or reported processing less than 25% of renewals via ex parte despite having automated systems. The administrative burden on both staff and enrollees is likely to be higher in these states and they will likely face unique challenges as they work to complete the increased volume of renewals during the unwinding period.

Despite fairly broad adoption of the Medicaid expansion and 12-month postpartum coverage, only 14 states have adopted all three eligibility policies, which also includes 12-month continuous eligibility for all children. While these policies are not directly related to the ability to complete the renewal process, they do affect how frequently an enrollee may have their eligibility redetermined, and in the case of adoption of the Medicaid expansion, the likelihood that nonelderly adults will be able to retain coverage when their eligibility is redetermined during the unwinding period. All states will have to implement 12-month continuous eligibility for all children in both Medicaid and CHIP by January 1, 2024; however, currently, only 23 states have adopted this policy.

Implications

Unwinding the Medicaid continuous enrollment provision is expected to be challenging for all states, but state policy choices and system capacity will matter in terms of how many people are able to maintain Medicaid or transition to other types of coverage. This analysis offers one way to assess states on whether their approach to and capacity for processing renewals during the unwinding period are likely to lead to larger or smaller declines in Medicaid enrollment and can be useful for focusing monitoring efforts. However, state policies and procedures are likely evolving, and while this analysis examines state policies, how states implement those policies will be just as important a factor in how the unwinding proceeds across states. Implementation, in turn, will be affected by state staffing capacity, the effectiveness of state outreach to and communications with enrollees, and state engagement with key stakeholders, including MCOs, providers, and community organizations, to assist with enrollee outreach efforts.

Number of Unwinding Metrics Met, Overall and by Category
News Release

After the COVID-19 Public Health Emergency Ends on May 11, Some Consumers Could Face High Prices for COVID-19 Testing

After the public health emergency, private health plans will no longer be required to cover the full cost of COVID-19 tests ordered or administered by a clinician or to reimburse consumers for at-home rapid tests.

Published: May 8, 2023

After the public health emergency ends on May 11, private health plans will no longer be required to cover the full cost of COVID-19 tests ordered or administered by a clinician or to reimburse consumers for at-home rapid tests.

To estimate what consumers might have to pay for tests, KFF’s new analysis draws on claims data showing what private insurers have paid for different types of COVID-19 tests, as well as hospitals’ published “self-pay” prices for patients without insurance and a survey of major retailers’ prices for at-home COVID-19 tests. What consumers pay will depend on their insurance plan or whether they have insurance at all.

The analysis finds the median price of a COVID-19 test in an outpatient clinical setting was $45 among people with large employer-based health coverage in 2021, though prices varied widely. Generally, antigen testing was cheaper than PCR testing, with a median price of $42 for antigen testing compared to $62 for PCR testing. In addition to the cost of the COVID-19 test itself, there may be an additional charge for the associated office visit depending on cost sharing arrangements, which can average about $90 for people with private health insurance. Together, the price for a COVID-19 test in a clinical setting and the associated visit could go up to $150 if a deductible applies.

The median “self-pay” price for someone without health insurance at a hospital or outpatient setting is $51 for a COVID-19 antigen test and $91 for a PCR test. Prices for a COVID-19 PCR test at a hospital also vary widely by state and are most expensive in Alaska, with a median self-pay price of $200, and least expensive in Utah, with a median self-pay price of $41.

The analysis also finds that most at-home rapid tests cost between $12 and $24 per pack (the price per test averages $11). Private insurers will no longer be required to cover the cost of these tests once the public health emergency ends.

Prices for COVID-19 Testing

Published: May 8, 2023

After the public health emergency ends on May 11, private health plans will no longer be required to cover the full cost of COVID-19 tests ordered or administered by a clinician or to reimburse consumers for at-home rapid tests.The analysis looks at what those tests could potentially cost consumers, depending on whether they have insurance and how their insurance covers such tests after the emergency ends. It draws on claims data showing what private insurers have paid for different types of COVID-19 tests, as well as hospitals’ published “self-pay” prices for patients without insurance and a survey of major retailers’ prices for at-home COVID-19 tests.

The analysis is available through the Peterson-KFF Health System Tracker, an online information hub that monitors and assesses the performance of the U.S. health system.


Standardized Plans in the Health Care Marketplace: Changing Requirements

Authors: Karen Pollitz, Justin Lo, and Rayna Wallace
Published: May 8, 2023

Background

For the 2023 coverage year, HealthCare.gov adopted a requirement on participating health insurance insurers to offer standardized plan design (SPD) options to consumers; this requirement will be modified somewhat for 2024 and beyond.1  Such plans apply standardized cost sharing rules to covered benefits.  The federal requirement does not apply to SHOP plans sold to small employers; nor does it apply to state-based marketplaces (SBM), though most SBMs also require SPDs.2 

One purpose of standardized plans is to simplify and streamline plan comparisons. This year the average HealthCare.gov enrollee faces more than 100 plan options – each with various cost-sharing features (deductibles, copays, and coinsurance) applied differently to different categories of benefits – making it challenging to understand and evaluate plan choices. At least for the SPD options (designated as “easy pricing” plans on HealthCare.gov) consumers can be confident that cost-sharing features will not vary for any given benefit category and can focus on comparing other plan features, such as differences in premiums and provider networks, that they also care about. Federal rules will begin to phase in limits on the number of non-standardized plans that HealthCare.gov insurers can offer next year. Other studies have found that too many health plan choices – for example, more than 30 – confuses and overloads consumers and leads to poor enrollment decisions.3 

Another purpose of SPDs can be to maximize access to covered services at lower cost sharing. Except when consumers are eligible for cost-sharing subsidies, known as CSR plans, the annual deductibles in marketplace plans are generally quite high.4  This year the average individual annual deductibles in bronze, silver, and gold plans sold on HealthCare.gov are $7,481, $4,890, and $1,650, respectively. All HealthCare.gov SPDs must waive the deductible and instead apply a fixed dollar copay for the following items and services: primary care and specialist office visits, urgent care visits, outpatient visits for mental health and substance use disorder treatment, physical therapy visits, and generic and preferred-brand drugs. Lowering cost sharing for certain services generally means raising cost sharing for others; that is because at each metal level, marketplace plans must achieve a target actuarial value (a measure of the overall level of cost sharing required in a health plan).

Some state-based marketplaces also design SPDs to promote health equity or other population health goals, for example, minimizing cost-sharing for mental health benefits or for services to treat conditions that disproportionately affect underserved populations.

Standardized plans on HealthCare.gov

The 2023 marketplace rule required HealthCare.gov insurers to offer a standardized qualified health plan (QHP) option at every product network type and metal level throughout each service area where they offer non-standardized QHP options. Under federal regulations, a “product” refers to the particular network type an insurer uses to offer the package of covered health benefits, such as a health maintenance organization (HMO) or a preferred provider organization (PPO).  Within each product, an insurer may offer multiple “plan” options at each metal level.

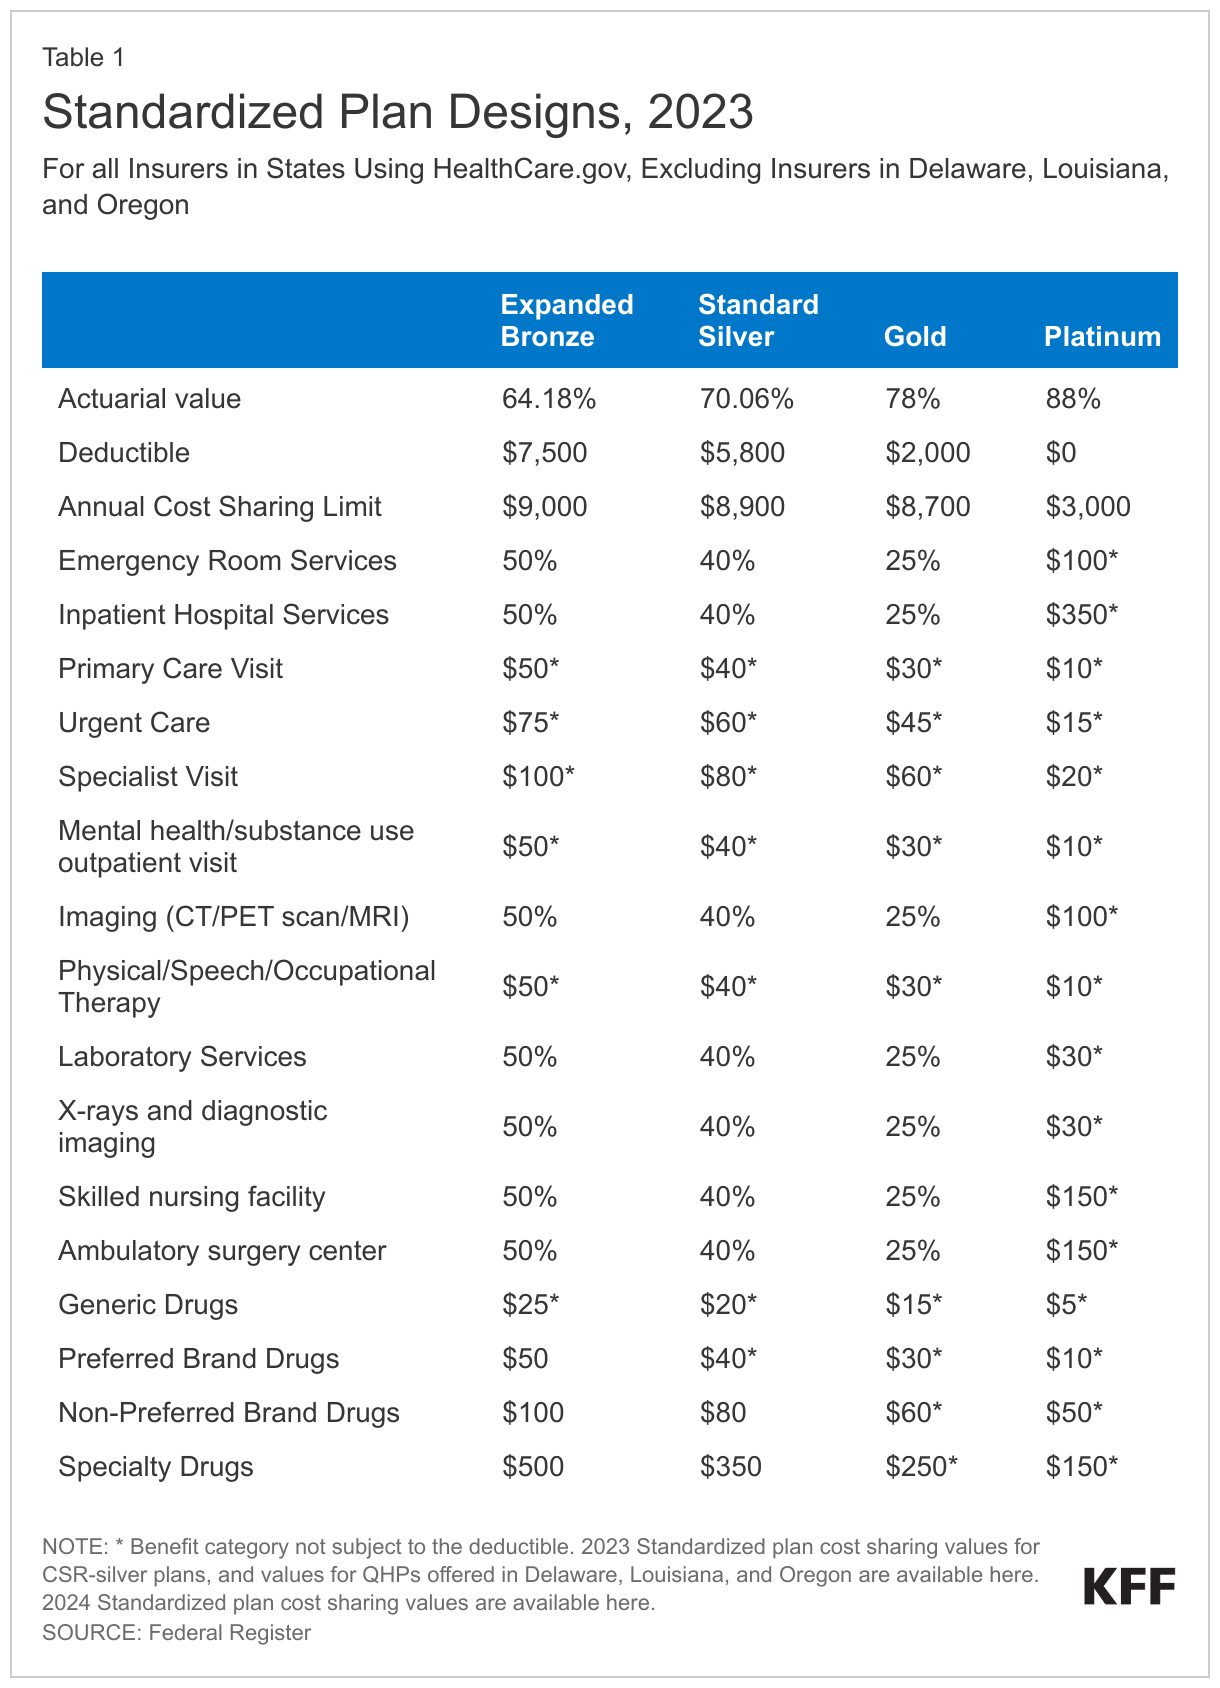
Cost sharing values for 2023 SPD plans are shown in Table 1.5  These plans must also use a comprehensive annual deductible that applies to both medical services and outpatient prescription drugs.  In addition, CMS requires SPD options to use a 4-tier formulary for outpatient prescription drugs. Generally, tier 1 is for generic drugs, tier 2 is for preferred-brand, tier 3 is for non-preferred brand, and tier 4 is for specialty drugs. CMS proposed to also require plans to assign drugs to formulary tiers in this way. However, this requirement was not adopted in the final 2024 marketplace rule;  insurers retain flexibility to assign generic drugs to tiers otherwise designated for brand drugs and vice versa.6 

CMS adopted SPD values it determined to be similar to the most popular QHPs in 2021 in terms of deductibles, annual out-of-pocket (OOP) limits, and other cost-sharing parameters so that SPD options would be similar to plans that most consumers were already enrolled in. In addition, CMS sought to maximize the number and types of services that would be covered pre-deductible. Finally, at each metal level, QHPs must have an actuarial value within a de minimis range of the target actuarial value. CMS adopted SPD cost sharing that result in plans with actuarial values near the lower end of the de minimis range.7 

Standardized Plan Designs, 2023

How does cost sharing compare in SPD and other plans?

Cost-sharing features vary substantially among the major medical QHPs offered on HealthCare.gov. Here we highlight some differences in cost-sharing designs among silver-level (non-CSR) plans in the federal marketplace.

Annual deductibles: The annual comprehensive deductible for silver SPD options this year is $5,800. By contrast, among 1,674 non-standardized silver plans on HealthCare.gov this year, 1,297 plans have a comprehensive annual deductible that ranges between $0 and $9,050 (with an average of $4,365), while 377 charge a separate annual deductible for outpatient prescription drugs.

Primary care office visits: Silver SPD plans this year waive the annual deductible for all primary care visits and require a flat $40 copay in cost sharing. By contrast, among non-standardized silver plans, primary care office visit copays range from $0 to $105 (with an average of $32).  In addition, nearly 500 plans limit the number of primary care office visits in a year that are subject to just a copay; visits beyond the limited number are subject to the annual deductible, and in some of these plans, coinsurance ranging from 10% to 50% may additionally apply.

Outpatient prescription drugs:  SPD plans this year apply 4 tiers to the outpatient prescription drug benefit. (In addition, all marketplace plans must include a zero-cost sharing tier for preventive drugs.)  Under the silver SPD, the annual deductible is waived for generic and preferred brand drugs with copays of $20 and $40 applied, respectively. Non-preferred brand (tier 3) and specialty drugs (tier 4) are subject to copays of $80 and $350, respectively, after the plan’s annual deductible has been satisfied. Of non-standardized silver plans offered on HealthCare.gov this year, 12% apply 5 or more tiers to the outpatient prescription drug benefit.  For drugs on the most expensive tiers in these plans, consumers might be required to pay coinsurance of 40% to 100% or a copay of more than $1,000.

Physical therapy: Silver SPD plans this year waive the annual deductible for physical therapy, speech therapy, and occupational therapy visits and apply a $40 copay. In non-standardized silver plans, physical therapy is often subject to the annual deductible, thereafter a copay (ranging from $5 to $160) or coinsurance (ranging from 5% to 60%) applies.

Inpatient hospital stays: Silver SPD plans this year apply the annual deductible, then 40% coinsurance applies until the patient reaches the annual out-of-pocket (OOP) cost sharing limit of $8,900.  In non-standardized silver plans, the annual deductible typically also applies to inpatient hospital care; then coinsurance applies – sometimes 50% or higher.  Some non-standardized silver plans apply a per-admission or a per-day copay (ranging from $100 to $3,000) instead of coinsurance.

Numbers of plan options

In 2023, of the 6,126 major medical plans offered to individuals on HealthCare.gov, 1,676 were SPD options and 4,450 were non-standardized. While on average, insurers offer roughly 3 non-standardized plan options for each SPD, some offer many more.  Looking just at silver tier HealthCare.gov plans (not including CSR variations), some insurers offered more than 10 non-standardized silver plans for each silver SPD in 2023.8 

For the 2024 plan year, CMS will limit insurers to offering no more than 4 non-standardized plan options for each SPD option they offer in a metal level for a given product/network type. This limit on the number of non-standardized plan offerings will be further reduced to 2 for the 2025 plan year and beyond.  According to CMS estimates, this change will result in a modest reduction in the weighted average number of plan offerings that consumers face next year, from 113.7 in 2023 to 90.5 in 2024.9 

In Appendix Table A, we provide information about silver plan options offered by a single marketplace insurer in one metropolitan area, where the 13 offerings illustrate the considerable complexity of information consumers might need to discern and evaluate as they make plan choices.

Pricing of SPD vs non-standardized plan options

We compared the premiums for SPD options to their non-standardized silver plan counterpart(s) offered by each HealthCare.gov insurer in 2023 by matching the plan service area, the plan type (HMO vs PPO), the provider network ID, and whether the plan covers supplemental adult dental benefits.

For the most part, we observe that insurers tend to charge premiums for SPD options similar to the premium for their lowest-cost non-standardized silver plan counterpart.  The 35-year-old-single-adult premium for the silver SPD plan was within $10 per month (higher or lower) compared to the premium of the lowest-cost non-standardized silver plan counterpart 59% of the time in counties where issuers offer both standardized and non-standardized plan counterparts. However, in some cases, insurers set premiums for their silver SPD options that were substantially higher than what they charged for other non-standardized silver plans. For example, one Chicago-area insurer charges a monthly premium for its SPD HMO option that is $47 to $89 higher than for its two corresponding non-standardized HMO plan.10 

Given that SPD plans and their non-standardized counterparts cover the same benefits, use the same provider networks, and have the same or nearly the same actuarial values, it is not clear why premiums for otherwise very similar plans would differ so much. However, because premium subsidies are tied to the cost of the second-lowest cost silver plan in an area, it can be difficult for most consumers to afford more costly plan options. As a result, when SPD options cost substantially more than their other non-standardized silver plans, consumers can effectively be discouraged from selecting the SPD.

Standardized plan design in state-based marketplaces

Federal regulations do not require standardized plan designs in state-based marketplaces (SBMs), although 10 of the 18 SBMs require standardized plans this year (CA, CO, CT, DC, ME, MA, NJ, NY, VT, WA). In 4 SBMs (CA, DC, NJ, and VT) only standardized plan designs are offered,11  while 5 SBMs limit the number of non-standardized plans that insurers may offer (CT, ME, MA, NY, and WA.) In addition, Oregon – one of three state-based marketplaces that uses the HealthCare.gov platform – also requires insurers to offer SPD plans.

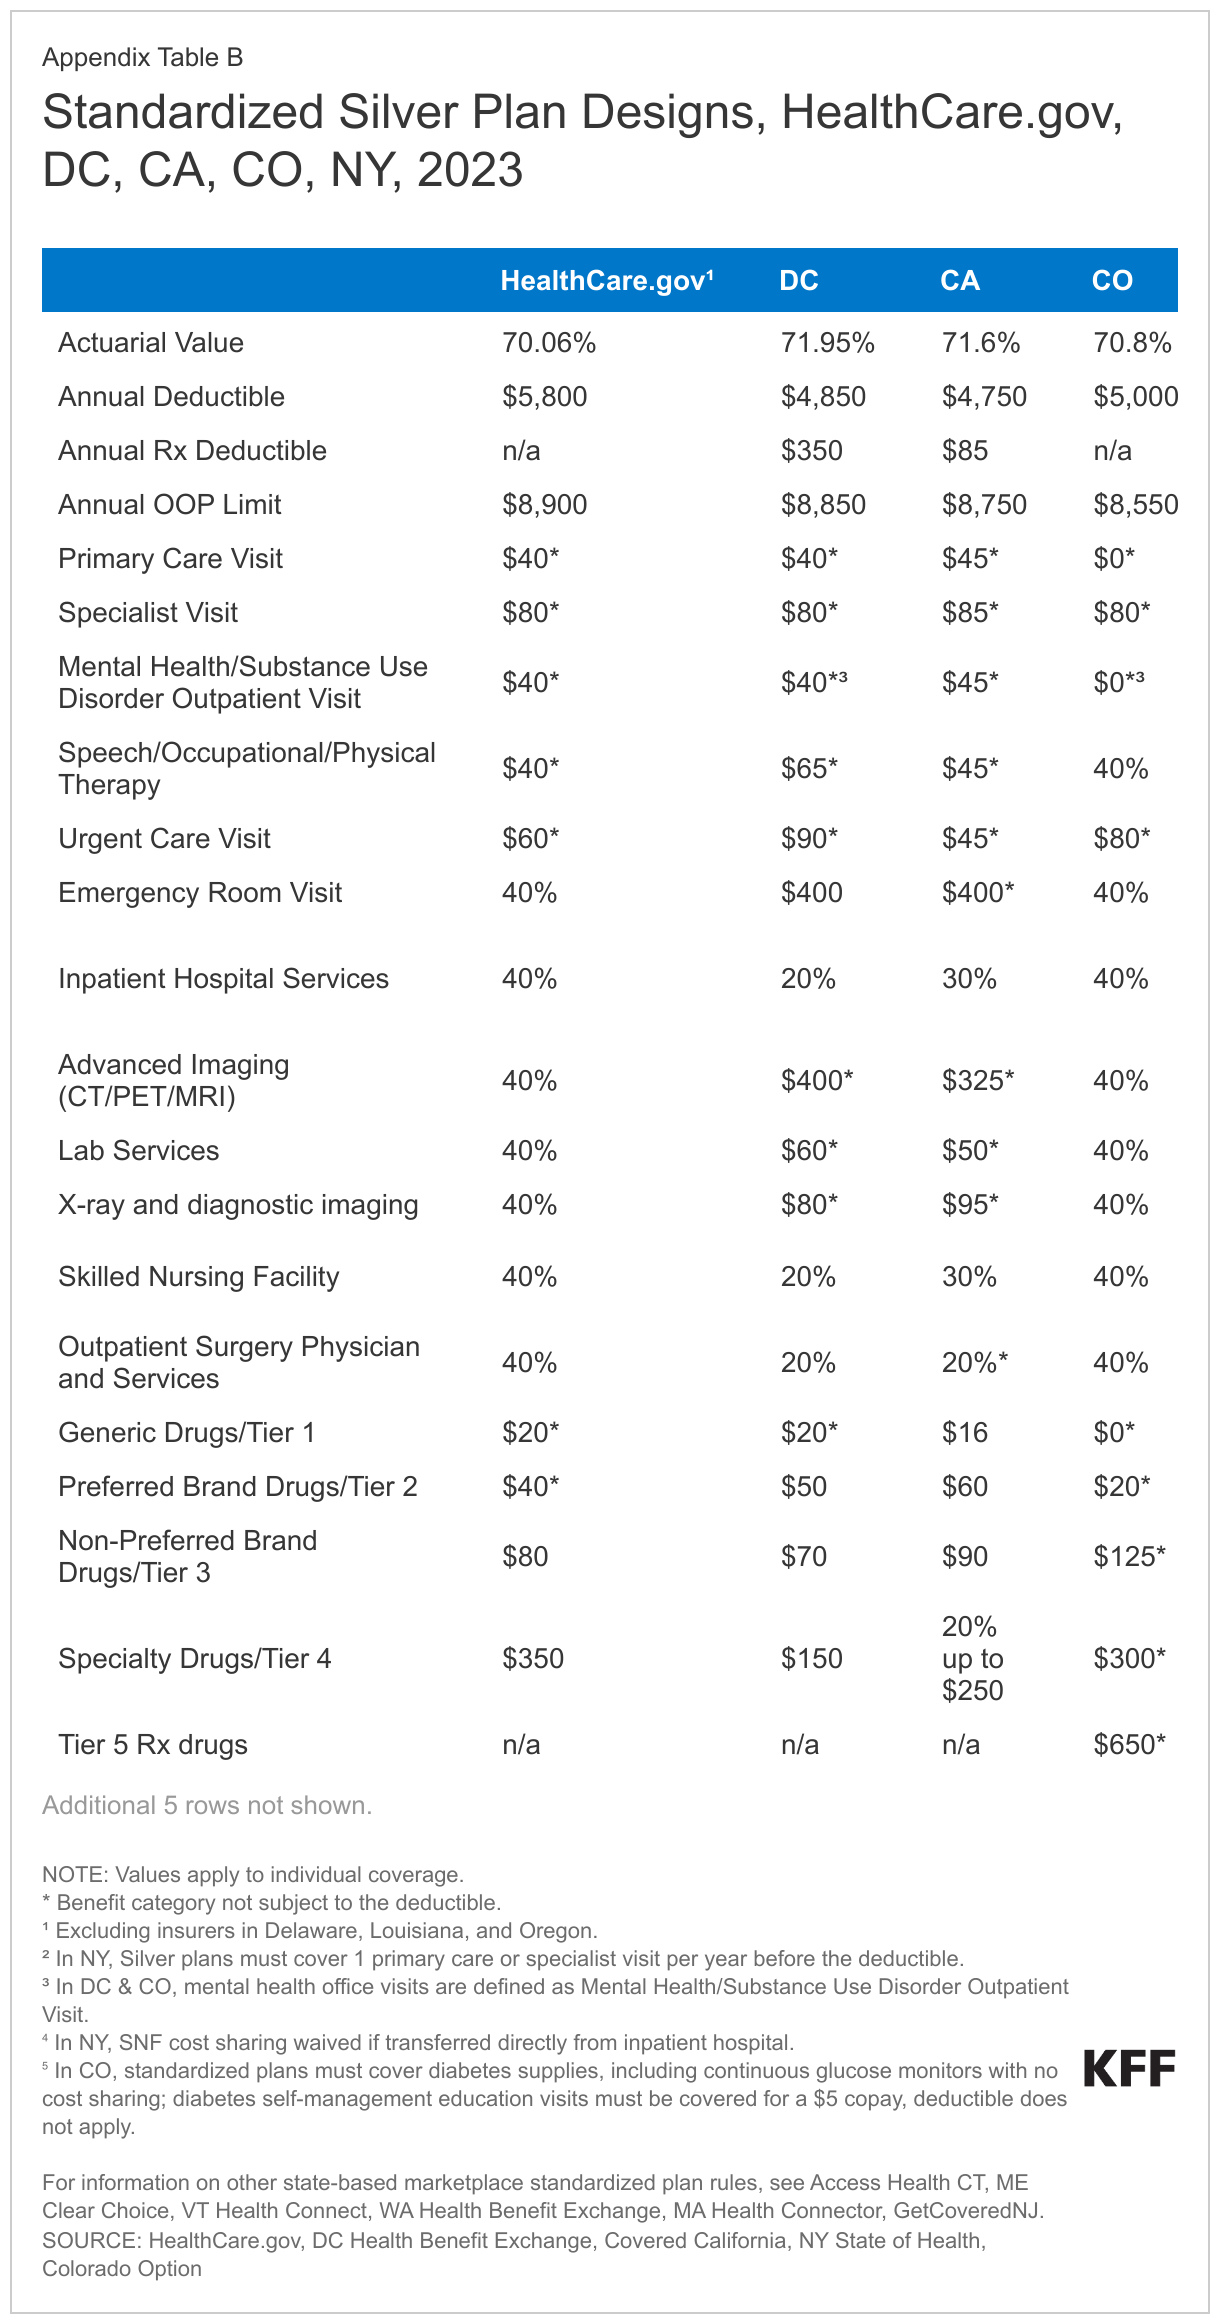
In most of the SBMs, as in HealthCare.gov, the standardized plan design is set to maximize the number and types of services that must be covered pre-deductible. New York takes a different approach, minimizing the annual deductible and applying it to most covered benefits. Under standardized silver plans in NY, for example, the annual deductible is $1,750 – compared to $5,800 in HealthCare.gov SPDs – but it is waived only for one outpatient physician visit annually and for all outpatient prescription medications. Appendix Table B shows SPD cost-sharing features for silver plans in California, New York, Colorado, and the District of Columbia, and links to SPD rules for the other SBMs.

Several SBMs also use the SPD to promote health equity by minimizing cost sharing for services to treat conditions that disproportionately affect racial and ethnic minorities, or to minimize cost sharing for key services for other populations. For example:

  • Diabetes – Health plans offered on the marketplace in the District of Columbia must waive all cost sharing for insulin, other medications, supplies and other health services for the management of type 2 diabetes.12  In Colorado, standardized plans impose no cost sharing on diabetes supplies, including continuous glucose monitors, and limit the copay for diabetes self-management education services to $5. Colorado requires all fully insured health plans, including marketplace plans, to cover insulin with a copay of no more than $50.
  • Mental health and substance use disorder treatment – Standardized plans at all metal levels in Colorado impose no cost sharing on outpatient visits for mental health and substance use disorder. Starting in 2024, standardized plans in the District of Columbia will waive all cost sharing for outpatient pediatric mental health visits.
  • Specialty prescription drugs – At least three SBMs limit cost sharing for other specialty prescription drugs. New York requires standardized silver plans to cover outpatient specialty drugs with a $75 copay and waives the deductible. DC requires SPD plans to have a separate $350 outpatient drug deductible, then limits copays for specialty drugs to $150. California requires a separate $85 outpatient drug deductible, with coinsurance of 20% capped at $250.
  • Pediatric benefits – Several SBMs, including California, Connecticut, and DC, waive the annual deductible and limit other cost sharing for certain pediatric dental and vision benefits.

Some state-based marketplaces also publish data on the share of marketplace participants who enroll in standardized plan options. In Colorado, 13% of marketplace enrollees selected the standardized Colorado Option plan the first year it was offered. In Washington, more than 60% of consumers enrolled in a standardized health plan option.

Discussion

As implemented to date, HealthCare.gov’s requirement to offer SPD plans has increased, not decreased, the number of plan choices consumers face. Limits on the number of non-standardized plan options will begin to phase in next year. Though consumers in most areas will continue to face a very large number of plan choices for the foreseeable future, over time the number of plan choices might become more manageable.

Cost-sharing designs in non-standardized plans vary considerably, complicating the task for consumers who want to try to estimate what their out-of-pocket costs might be, even for care they can anticipate needing.  Other key plan features, including health plan provider networks and prescription drug formularies, also vary considerably across QHPs and can dramatically impact consumers’ access to and cost for care.  Consumers who try to investigate these plan differences face a particularly challenging task as this information can be complex and not very transparent, and their task is made more difficult given the number of plans to investigate.

Beyond trying to simplify plan choices, the SPD can also be a tool to promote other population health goals. For example, last year, Congress considered legislation to limit cost sharing for insulin under Medicare and private health plans to $35 per month. Ultimately the limit was applied only to Medicare; however, states have shown this cost protection could be extended to marketplace enrollees through SPDs.   As another example, in its FY 2024 budget, the Administration proposed a requirement on all health plans to cover 3 behavioral health visits and 3 primary care visits annually with no cost sharing. State marketplaces have demonstrated that SPDs can also be used to extend these kinds of protections to marketplace consumers. It remains to be seen if the federal marketplace will further evolve its SPD requirements to promote such health equity and other public health goals.

Appendix Table A

Comparing Silver Plan Options from One HealthCare.gov Insurer in Houston, Texas

Earlier KFF surveys of marketplace enrollees found the monthly premium is named by most people as a very or extremely important factor influencing their plan selection.  Even among similarly priced plans, however, there are substantial differences that could affect consumers’ out-of-pocket cost for covered benefits and provider access. In this example, we try to illustrate the amount and complexity of information consumers can face in comparing their marketplace health plan choices.

Residents of Houston, Texas who buy private coverage through HealthCare.gov have a choice of 125 Qualified Health Plans (QHPs) in 2023. Seven insurers together offer 38 bronze, 54 silver, and 33 gold QHPs. (These totals do not include CSR plans.) The table below shows summary information displayed on HealthCare.gov for the 13 silver plans offered by just one insurer.  It shows the plan marketing name, unsubsidized monthly premium (for a 35-year-old individual), the type of plan, key cost sharing values, and whether plans include added coverage for adult dental and vision care. Additional details on plan options are also available on HealthCare.gov if consumers click beyond the first plan options screen.

Full-priced Silver Plans Offered in Harris County, Texas

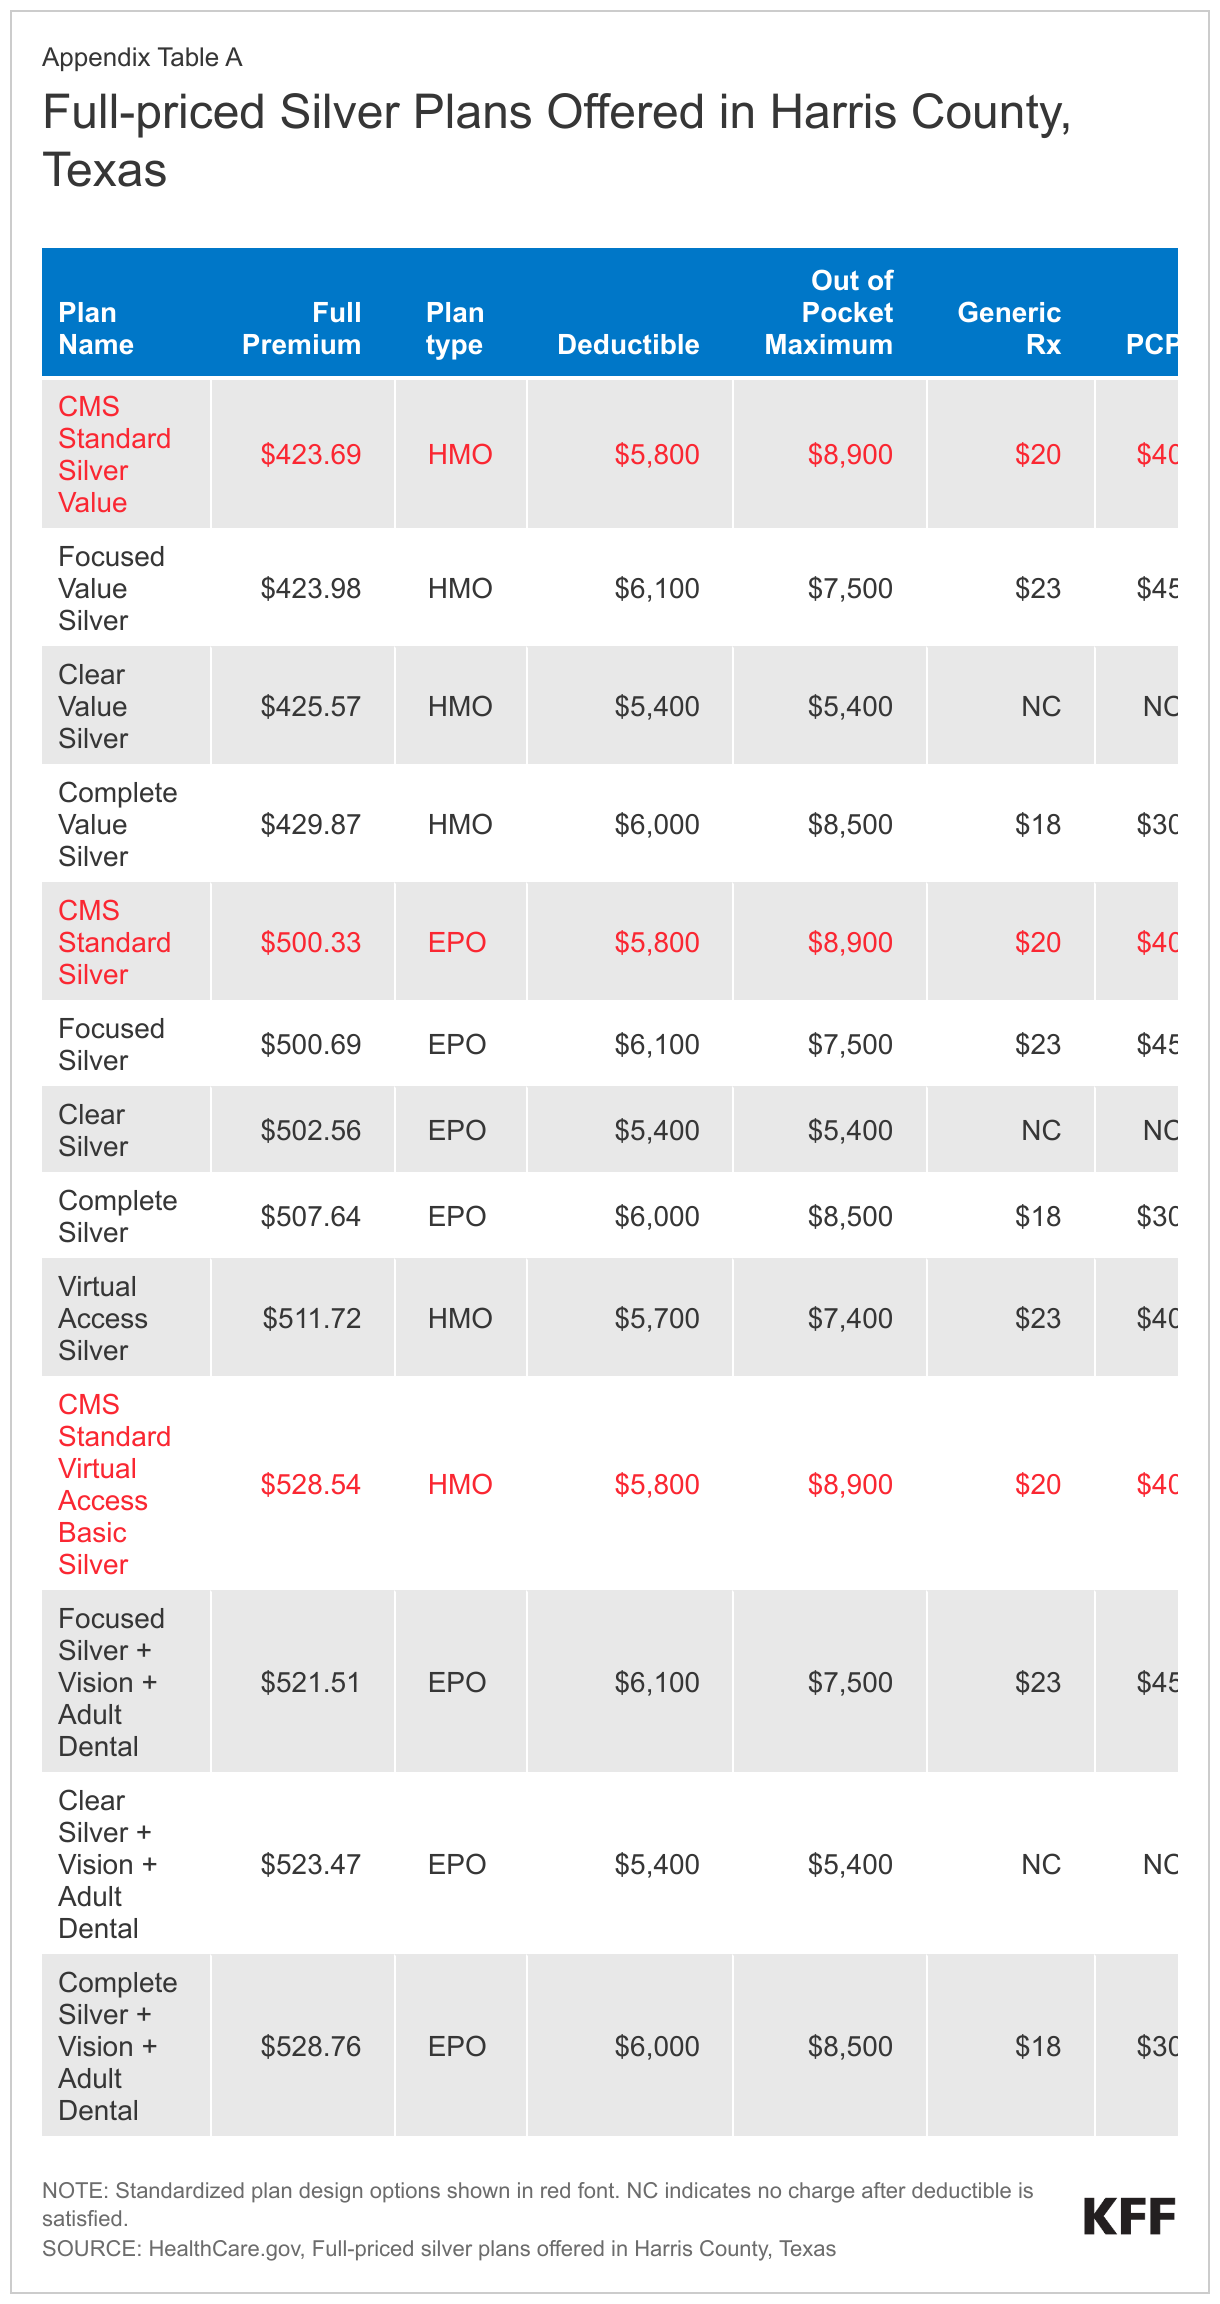
Three of the 13 silver plans offered by this issuer use SPD and 10 use non-standardized cost-sharing designs.  The marketing names of these 13 silver plans (Standard, Standard Value, Focused, Focused Value, etc.) signal that the plan choices may involve some key differences, although other than the 3 plans whose names indicate added coverage for adult dental and vision benefits, it is up to the consumer to discern and evaluate what these differences may be.

Price-sensitive consumers might limit consideration to the 4 least expensive plan choices, with monthly premiums ranging from $423.69 to $429.87.  Premiums for the other silver plans offered by this issuer exceed $500/month. Though premiums are nearly identical for the 4 cheapest plan options, there are substantial differences in how cost sharing applies to covered benefits.

The cost-sharing structure differs most under the Clear plan, which requires enrollees to pay 100% of allowed charges for all non-preventive services until the annual deductible/OOP maximum is satisfied; thereafter, services are covered 100% for the rest of the plan year.

Relative to the SPD, annual deductibles are $200 and $300 higher under the Complete and Focus plans, and $100 lower under the Virtual Access plan. The annual OOP maximum is lower under all of these non-standardized plans compared to the SPD.

Copays for generic drugs and physician office visits vary somewhat across the SPD and non-standardized plans. The Virtual Access plan name signals that telehealth visits to select primary care physicians under this plan have zero cost sharing, although upon further inspection, all of the silver plan options offered by this issuer provide zero-cost virtual primary care visits.

There are other key cost-sharing differences, though consumers interested in finding this information would need to click further into HealthCare.gov to find it. For example:

  • Physical therapy visits are subject to the deductible and 50% coinsurance under all of the non-standardized plans, compared to a $40 copay (pre-deductible) under the SPD.
  • Specialty drugs are subject to coinsurance of 40-50% after the deductible under the non-standardized plans, compared to a $350 copay after the deductible in the SPD.
  • Hospitalization is subject to the deductible and 50% coinsurance under all of the non-standardized plans, compared to deductible plus 40% coinsurance under the SPD.
  • Advanced imaging and durable medical equipment require 50% coinsurance after the deductible under the Focus and Virtual Access plan, vs. 40% after the deductible under the SPD and the Complete plan.

Looking across all plans offered by this issuer, EPO plans generally cost much more than HMO plans. This may be due to differences in the EPO vs HMO provider networks (the CMS plan attribute database shows different network IDs for this issuer’s EPO and HMO plans). However, recognizing and evaluating network differences would be challenging for consumers to explore on their own, and HealthCare.gov offers little help. For QHPs offered in Texas, HealthCare.gov operates a pilot program that provides general descriptive information about the relative breadth of provider networks used by QHPs. However, networks are described only as “smaller than other plans in similar areas” for all plans offered by this issuer, whether HMO or EPO.

Finally, comparing just the 3 SPD silver options offered by this insurer, monthly premiums vary by more than $100 per month. The least expensive (Standard Silver Value) and the most expensive (Standard Virtual Access Basic Silver) are both HMOs, covering the same benefits with the same provider network and cost-sharing structure, making the reason for this 25% price differential unclear. That said, price-sensitive consumers would be unlikely to consider the more expensive SPD based on affordability, alone.

Appendix Table B

Standardized Silver Plan Designs, HealthCare.gov, DC, CA, CO, NY, 2023

For information on other HealthCare.gov and state-based marketplace standardized plan rules, see HealthCare.gov; DC Health Benefit Exchange, Covered California,  NY State of Health,  Colorado OptionAccess Health CT,  ME Clear Choice, VT Health Connect, WA Health Benefit Exchange, MA Health Connector, GetCoveredNJ

  1. Previously, CMS had given HealthCare.gov issuers the option to offer SPDs beginning with the 2017 coverage year.  The Trump Administration ended this option, but a federal court ruled that  it should be restored. ↩︎
  2. The requirement to offer SPDs also does not apply to SHOP plans sold to small employers. ↩︎
  3. See for example, Rose Chu et.al., “Facilitating Consumer Choice: Standardized Plans in Health Insurance Marketplaces, ASPE Office of Health Policy Issue Brief, December 28, 2021. ↩︎
  4. Nearly half (48%) of all consumers who selected a HealthCare.gov plan during the 2023 open enrollment period receive cost sharing reductions.  See https://modern.kff.org/health-reform/state-indicator/marketplace-plan-selections-by-financial-assistance-status-2/?currentTimeframe=0&sortModel=%7B%22colId%22:%22Location%22,%22sort%22:%22asc%22%7D ↩︎
  5. Note, these cost sharing values apply for QHPs offered in all states using HealthCare.gov except Delaware, Louisiana, and Oregon where, pursuant to state law, somewhat modified SPD cost sharing designs apply. ↩︎
  6. Although insurers have flexibility in the tiers they assign particular drugs, plans are not supposed to engage in “adverse tiering” by placing all or most drugs to treat a medical condition on a high-cost tier in order to discourage enrollment by individuals with that condition. ↩︎
  7. For expanded bronze plans, the de minimis range around the target AV of 60% is +5/-2 percentage points. For standard silver (non-CSR) plans, the de minimis range around the target AV of 70% is +2/0 percentage points. For gold and platinum plans, the de minimis range around the target AV of 80% and 90%, respectively, is +2/-2 percentage points. ↩︎
  8. Source: HealthCare.gov 2023 Plan Attribute File, available at https://www.cms.gov/cciio/resources/data-resources/marketplace-puf ↩︎
  9. This estimate does not take into account added flexibility that insurers will be allowed to offer separate SPDs – and so additional non-standardized plan options – for plan options that are otherwise identical except for the inclusion of adult dental or vision benefits. In the regulation, CMS provides an example of an insurer that might offer a gold HMO SPD with no added dental or vision benefits, another with added adult dental benefits, a third with adult vision benefits, and a fourth with added adult vision and dental benefits. This insurer would be allowed to offer up to 4 non-standardized gold HMO plans for each of these benefit packages, for a total of 20 plan offerings. CMS did not provide estimates for the number of plan choices HealthCare.gov consumers might face in 2025. ↩︎
  10. See HealthCare.gov, plan offerings in Cook County Illinois (zip 60614).  The full-priced premium for the Blue Precision Silver HMO 706 (easy pricing) plan is $541.29, compared to its non-standardized counterparts, the Blue Precision Silver HMO 206 plan  ($452.63), and the Blue Precision Silver HMO 704 plan ($494.32).. ↩︎
  11. In California, insurers may apply to offer non-standardized plan designs, though none currently do. In New Jersey, insurers may offer non-standardized plans at the catastrophic level only. ↩︎
  12. In DC, insurers retain some flexibility in their formulary design so that certain brands of insulin, for example, may still be subject to cost sharing. ↩︎
News Release

Proposed Work Requirements Could End Federal Medicaid Coverage for 1.7 Million People

Covering All 1.7 Million Would Require $10.3 Billion in Additional State Funds, Although it Would Be Up to States to Decide 

Published: May 5, 2023

A new KFF analysis finds that an estimated 1.7 million Medicaid enrollees could become ineligible for federal Medicaid under proposed work requirements and presents state-by-state projections, based on estimates of coverage loss from the Congressional Budget Office (CBO).

States could continue to provide Medicaid to those enrollees but would not receive federal matching funds for doing so. It is unclear if any states would choose to do that, though CBO estimated over half of enrollees would continue to be covered at the states’ expense. If states did choose to continue coverage for those individuals, states collectively could face $10.3 billion in new costs in 2024.The work requirements were included in the Republican-backed debt ceiling legislation that passed the House of Representatives on April 26.Five states would pay nearly half of the estimated $10.3 billion in new costs: California (326,000 enrollees at a cost of $1.6 billion), New York (186,000, $1.1 billion), Illinois (116,000, $692 million), Pennsylvania (83,000, $537 million) and Washington (72,000, $578 million).

The CBO cost estimate included national estimates of coverage loss and changes in federal spending but did not include state-specific estimates or details about how individual states would respond or why. Our estimates assume a 10 percent rate of Medicaid eligibility loss across all states, based on the national estimate released from the Congressional Budget Office (CBO); this rate could be higher or lower and not uniform across states.

Our analysis, similar to estimates issued by the Department of Health and Human Services, assumes that under the work requirements passed last month by the GOP-controlled House, all enrollees who become ineligible would be in Medicaid expansion states (40 states plus Washington D.C.). The new cost to the states equals 90 percent of total spending for affected enrollees—reflecting the 90 percent of costs that the federal government pays for expansion enrollees who would remain eligible for Medicaid only through state-funded coverage.

If the federal work requirements were applied more broadly across Medicaid eligibility groups, many more people could potentially be subject to reporting requirements, such as parents and people who cannot work due to a disability. Although most of those people likely would qualify for an exemption, some could lose Medicaid eligibility because they are unable to comply with reporting requirements.

While the mandatory work requirements were included in the debt ceiling legislation that passed the House of Representatives, the bill is not expected to pass in the Senate. It is unclear whether work requirements —or similar policies—could end up being debated as negotiations over the debt ceiling continue, or as part of broader federal spending and policy debates.