Use of ACA preventive services potentially affected by Braidwood v. Becerra

Authors: Krutika Amin, Shameek Rakshit, Cynthia Cox, Gary Claxton, and Allison Carley
Published: May 25, 2023

This analysis uses private insurance claims data to examine the number of people who received preventive services that could be affected by a now-stayed U.S. District Court ruling in Braidwood Management v. Becerra, which found the Affordable Care Act’s (ACA) preventive services mandate partially unconstitutional.

The Affordable Care Act (ACA) requires most private health plans to cover some in-network preventive services without cost-sharing for enrollees. On March 30, 2023, the U.S. District Court in the Northern District of Texas excluded from the requirement all preventive care recommendations issued by the United States Preventive Services Task Force (USPSTF) on or after March 23, 2010, when the ACA was signed into law. The district court also found that preexposure prophylaxis (PrEP), medication recommended for HIV prevention, violates the religious rights of those who have objections to its use.

The analysis finds that about one in 20 privately insured people – about 10 million people in total – received at least one ACA preventive service or drug in 2019 that would no longer have to be covered without any cost sharing if the ruling is allowed to stand. Statins, which are used to treat people at risk of cardiovascular disease, are the most commonly used preventive service potentially affected.

The analysis is available through the Peterson-KFF Health System Tracker, an online information hub that monitors and assesses the performance of the U.S. health system.

The Health Insurance and Financing Landscape for People with and at Risk for HIV

Authors: Lindsey Dawson, Jennifer Kates, and Tatyana Roberts
Published: May 25, 2023

Background

The health care coverage and financing landscape for people with and at risk for HIV in the U.S. is highly fragmented and made up of a patchwork of payers and programs. Each has its own eligibility requirements, services and benefits, cost sharing obligations, and financing structure. Further, program eligibility and benefits vary by state and in some cases, even more locally, leading to uneven access across the country and some people are left out of the system entirely. The Affordable Care Act (ACA), passed in 2010, expanded access to coverage and services for millions of people, including people with and at risk of HIV and as a result, the number of uninsured people has fallen significantly. Most people with HIV do have insurance coverage, particularly through Medicaid and private insurance, and many receive support from the Ryan White HIV/AIDS Program, the nation’s safety net program for people with HIV. This table provides an overview of the major payers and programs that provide coverage and services to people with and at risk of HIV. It builds on and updates earlier work published in the Lancet.

HIV Insurance Coverage and Care Landscape in the United States

Download the full version of this table (.pdf)

News Release

The Title X Network Has Largely Returned Under the Biden Administration 

Published: May 25, 2023

A new KFF brief examines the return of grantees and clinic sites to the Title X network under the Biden Administration, which reversed Trump Administration regulations that prohibited Title X sites from providing abortion referrals and having co-located abortion services. For more than 50 years, the federal Title X program has provided family planning services to nearly four million people a year through a network of clinics. The program is part of the U.S. public health safety net designed to serve people with lower incomes and those without insurance who otherwise cannot afford family planning services.

As a result of the Trump Administration rules, nearly 1,280 sites withdrew from the Title X program. Of the 411 Planned Parenthood sites that left the program under the Trump Administration, 286 (70%) have rejoined. Of the 869 other sites that left the program, 531 (61%) have returned. 

At the same time, 777 new sites that were previously not part of the program have joined, bringing the current Title X network back to 4,108 sites, which is 2% more than the original 4,010 sites before the Trump Administration regulations. All six states (HI, ME, OR, UT, VT, WA) that left the Title X network under the Trump Administration have returned with most of their sites, or they expanded their networks to new ones.Ongoing litigation challenging the Biden Administration Title X regulations continues, and its outcome could result in withdrawals and disqualifications. Current Title X regulations require clinics to provide pregnancy options counseling that includes abortion as an option. In states where abortion is now banned, there are examples of policies that require Title X clinics to exclude counseling on abortion, which is in direct conflict with Title X regulations. These policies may disqualify grantees in these states from participating in the program. 

Read “Rebuilding the Title X Network Under the Biden Administration” to learn more about the Title X program and network.

Rebuilding the Title X Network Under the Biden Administration

Published: May 25, 2023

Issue Brief

Key Takeaways

  • The federal Title X family planning program has undergone substantial changes in the number of participating clinics in response to shifting program priorities and rules that vacillate widely between different administrations, particularly about how counseling and referral to abortion services are handled by grant recipients.
  • The Trump Administration regulations that prohibited grantees from referring clients for abortion services or having co-located family planning and abortion services led to a withdrawal of almost a third of the sites from the Title X network. The reduction of the provider network and limits to in person care during the COVID-19 pandemic translated to a major reduction in the number of people served by the program from 3.9 million people in 2018 to 1.5 million in 2020, a 60% drop.
  • The Biden Administration issued regulations to reverse the Trump Administration policies banning abortion referrals and the participation of family planning providers that also offer abortion services in the program. Today, the Title X network has even more sites than the number participating prior to initiation of the Trump Administration regulations.
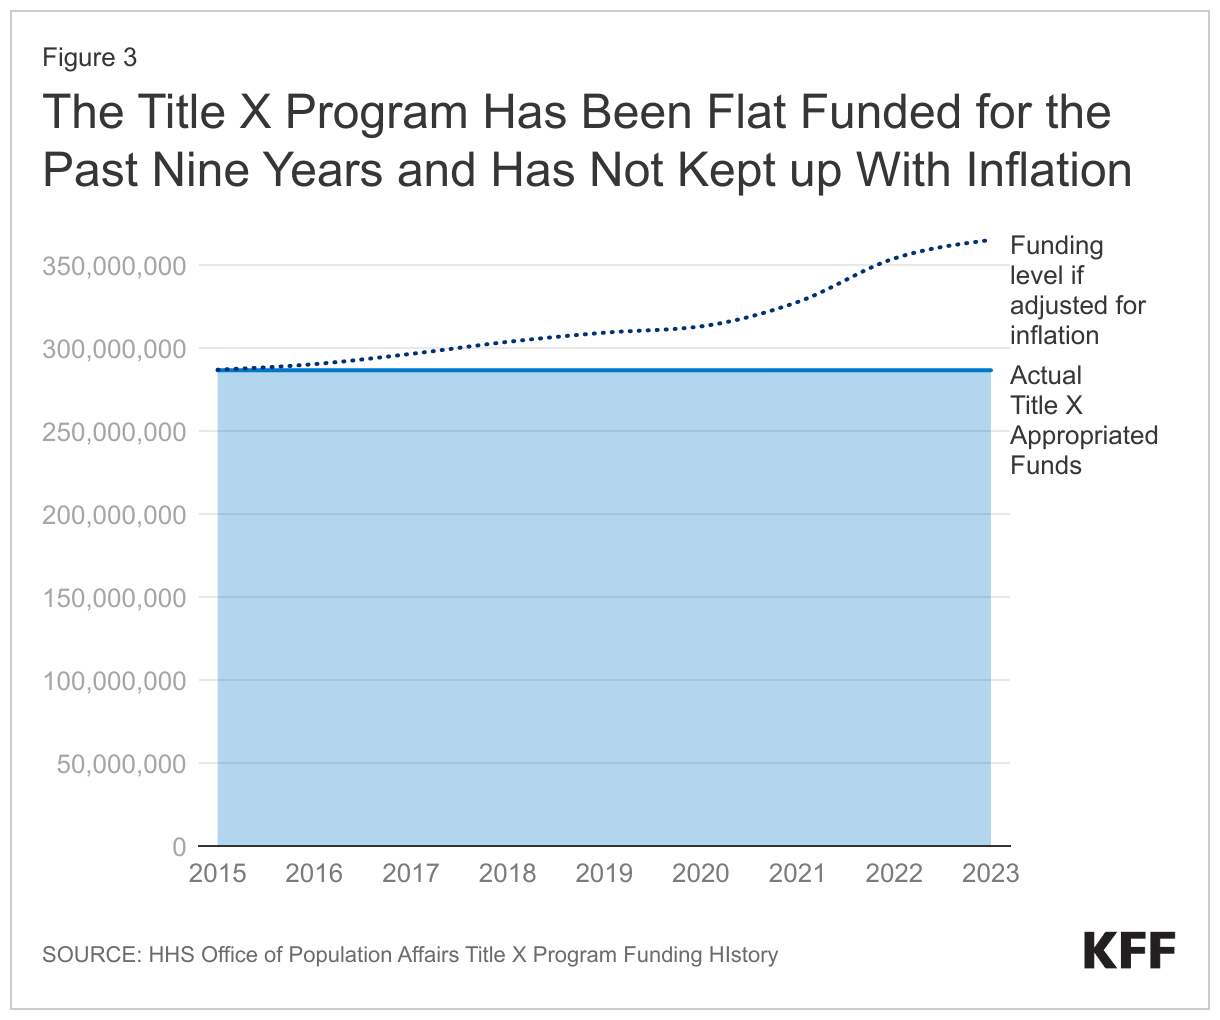
  • The Title X family planning program has been level funded at $286 million for nearly a decade, and as a result, has not been able to keep up with medical price inflation or the growing demand for family planning services.
  • While the size of the family planning network has largely recovered, ongoing litigation challenging the Biden Administration regulations and the program’s provision allowing minors to get contraception without parental consent could result in limits to the availability of federally supported family planning services in some states.
  • In states with abortion bans, continued participation in the Title X program may be impeded by state laws that prohibit pregnancy options counseling that includes abortion and referrals, a current requirement of the Title X program. The state of Tennessee (a Title X grantee) has already been disqualified because of their refusal to provide comprehensive pregnancy options counseling and abortion referral for those who seek it. In six of the states where abortion is banned (AL, AR, LA, OK, WI, and WV), the health department is the only Title X grantee.

Introduction

The federal Title X program, which has been in existence since 1970, has historically provided family planning services to nearly four million individuals a year through a network of approximately 4,000 clinic sites. The program is part of the U.S. public health safety net that is designed to serve individuals with lower incomes and those without insurance who otherwise may not be able to afford family planning services. Over the past number of years, the program has undergone substantial changes in the number of participating clinics and individuals it has been able to serve due to regulation changes and the COVID-19 pandemic.

The Title X program is led by a Deputy Assistant Secretary for Population Affairs who is appointed by the president, with program priorities and rules vacillating widely between different administrations. In particular, a provision of the Title X statute, Section 1008, that specifies that no federal funds appropriated under the program “shall be used in programs where abortion is a method of family planning” has been interpreted differently depending on who is in leadership. Throughout most of the history of the program, the ban has generally been understood to mean that Title X funds cannot be used to pay for or support abortion. However, the Trump and Reagan Administrations interpreted this more expansively as meaning that in addition to not paying for abortions, grantees were not permitted to use federal funds to promote, counsel, or refer clients for abortion or have co-located family planning services and abortion activities.

This interpretation, referred to as the Domestic Gag Rule by its opponents, is similar to the Mexico City Policy that requires foreign nongovernmental organizations to certify that they will not “perform or actively promote abortion as a method of family planning” using funds from any source (including non-U.S. funds) as a condition of receiving U.S. global family planning assistance. This policy has been reinstated and rescinded with the changing administrations for many years, which could be the future of the Title X regulations.

Title X Regulation Changes

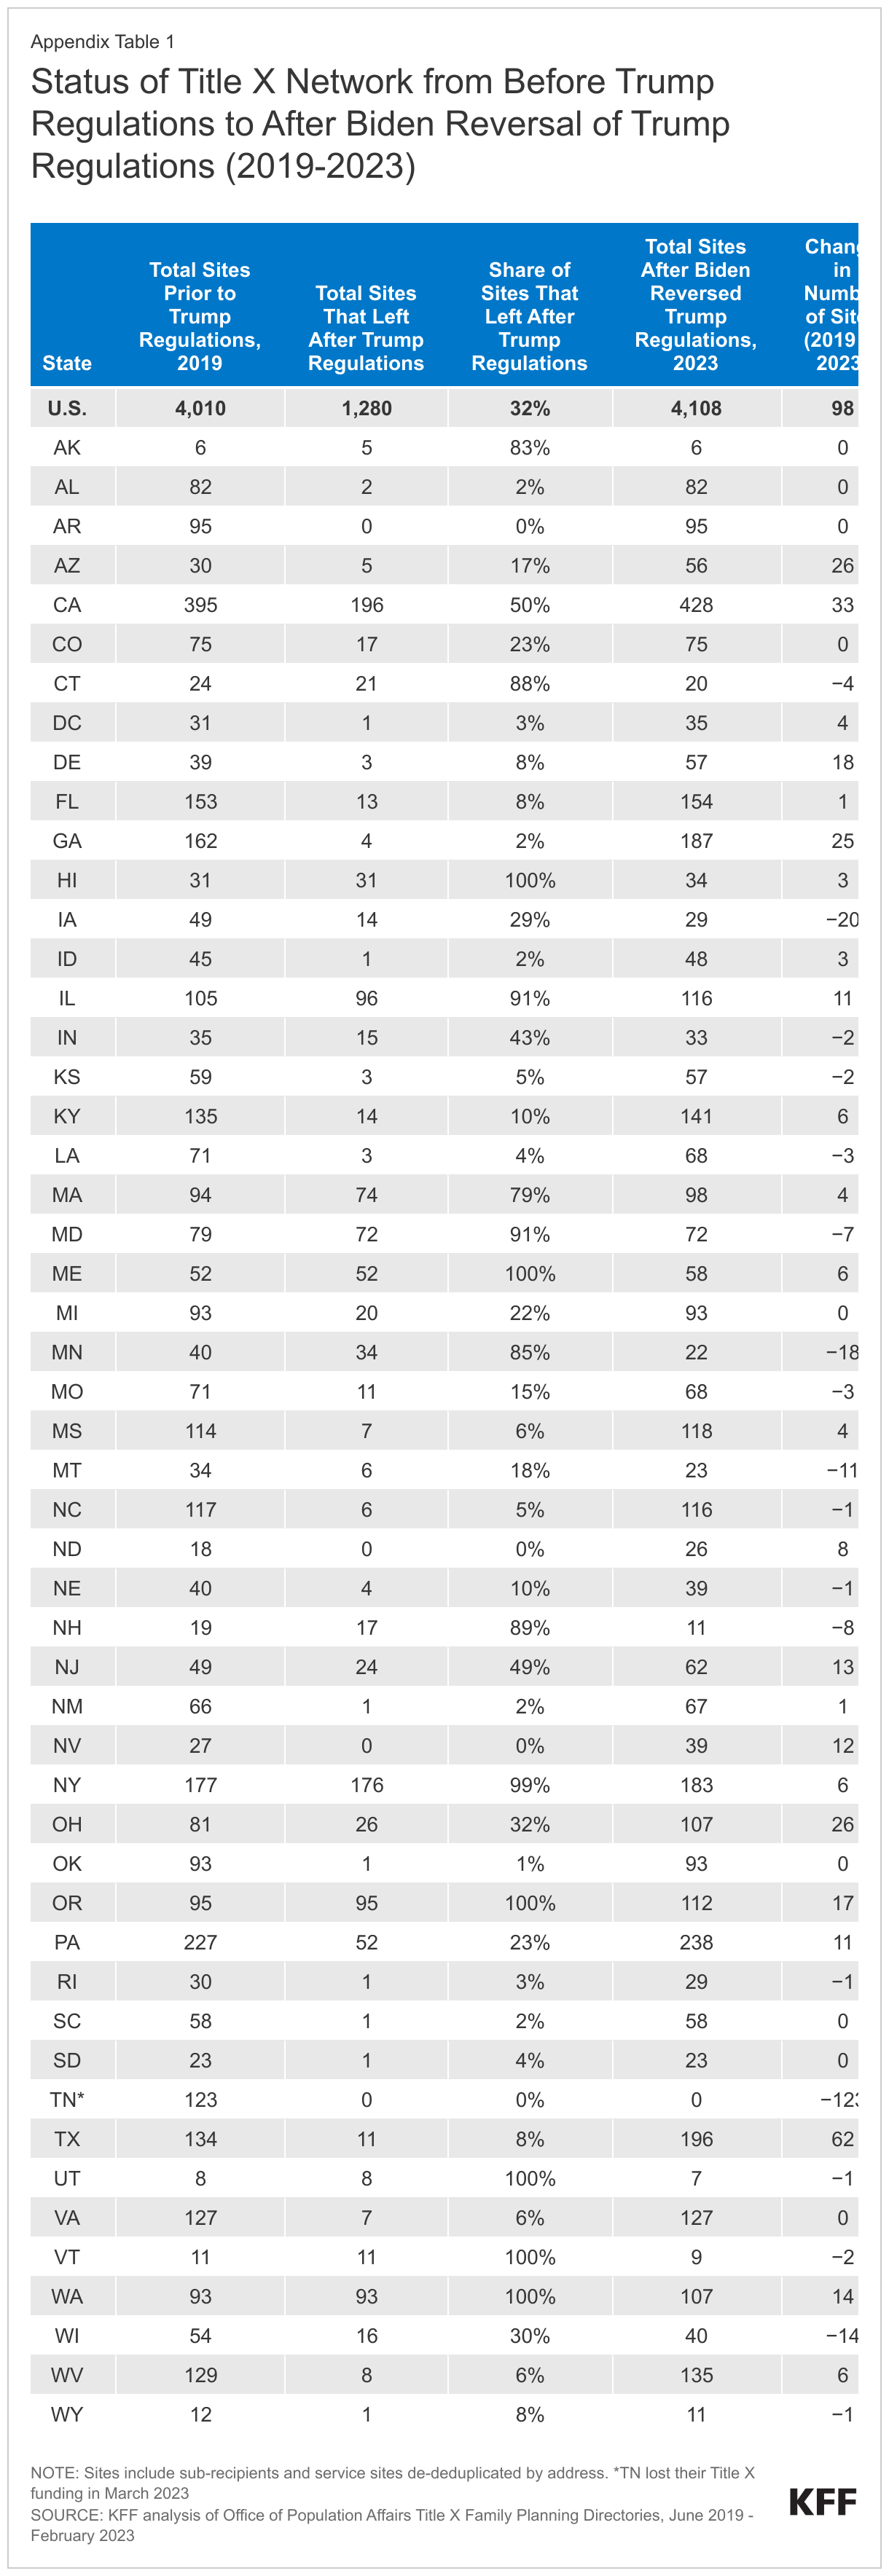
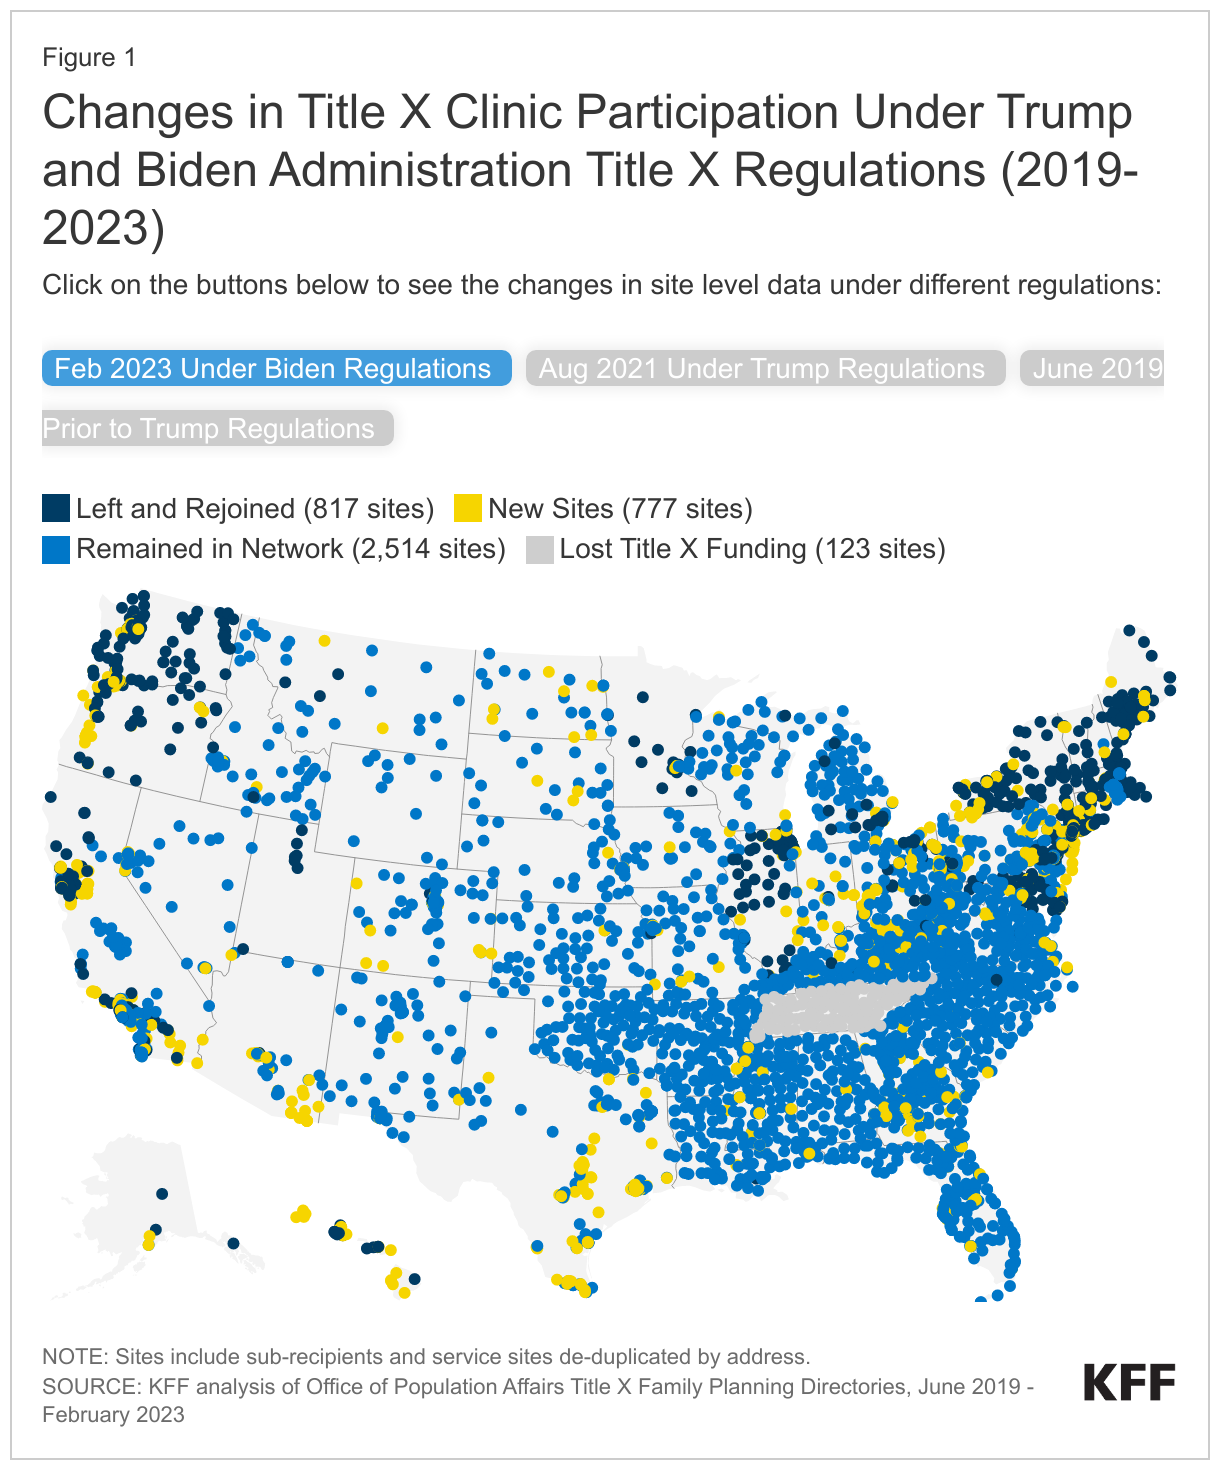
In 2019, the Trump Administration made significant changes to the Title X regulations, which prohibited participating family planning clinics from providing abortion referrals and having co-located abortion services. This allowed grantees that had not previously participated in the program due to the requirement to provide nondirective pregnancy options counseling to begin receiving funding, such as the Obria Group, Inc., a Christian organization based in Southern California. Two other grantees joined the program under the Trump Administration, City of El Paso in Texas and Osceola Community Health Services in Florida. The new program regulations most notably resulted in a mass exodus of clinics from the Title X network, including over 400 Planned Parenthood clinics and almost 900 other Title X sites. From June 2019 to August 2021, almost a third of the Title X sites left the program (Figure 1).

Changes in Title X Clinic Participation Under Trump and Biden Administration Title X Regulations (2019-2023)

Not long after the clinics started leaving the program, the COVID-19 pandemic began, where fewer people were seeking in-person care. In 2018, the Title X program served 3.9 million clients, which decreased to 1.5 million by 2020, over a 60% reduction, due to the decrease in size of the network and the COVID-19 pandemic. After President Biden was elected in November 2020, the Department of Health and Human Services (HHS) issued proposed regulations in April 2021 reversing the Trump Administration’s regulations and again requiring comprehensive pregnancy options counseling and abortion referrals when desired, as well as allowing co-located abortion services. These regulations were finalized and became effective in November 2021 (Figure 2).

History of the Title X Network Under the Trump and Biden Administrations, 2018 to 2022

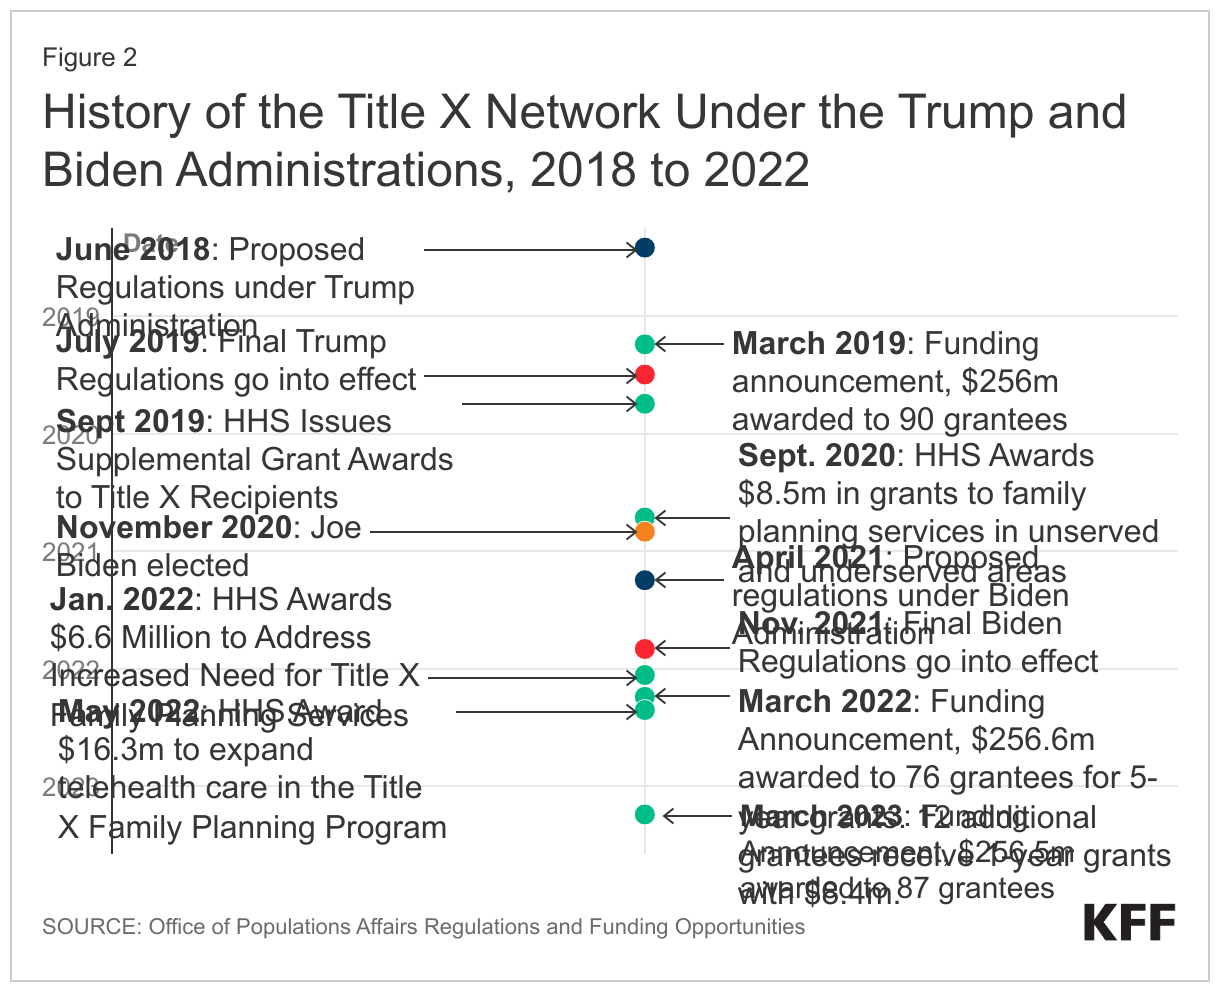
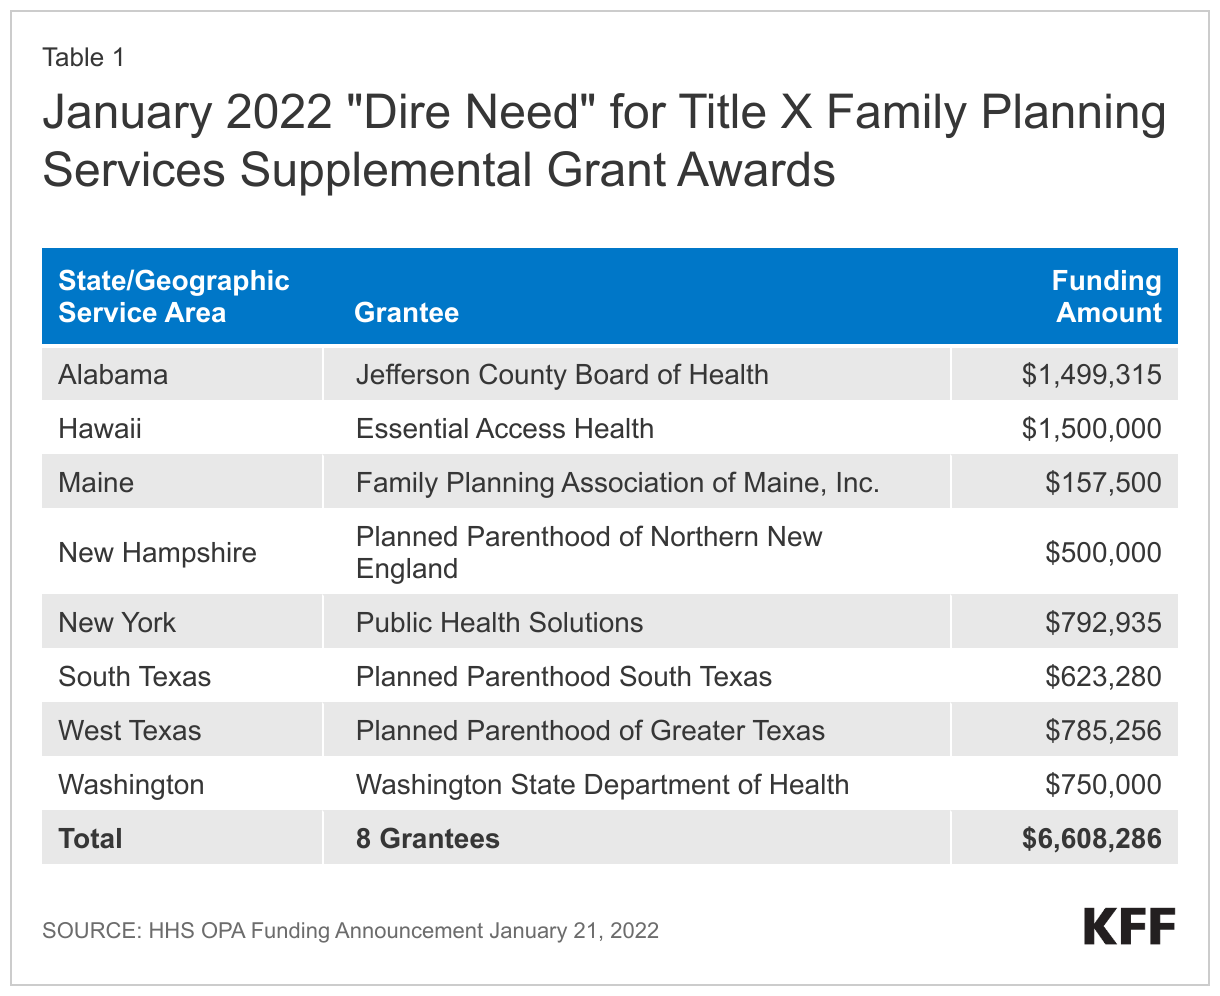
In January 2022 as part of the American Rescue Plan HHS awarded $6.6 million to 8 grantees to address “dire family planning needs” as part of a series of actions HHS took in response to Texas Law SB 8, which banned abortions in Texas after 6 weeks of pregnancy (Table 1).

January 2022 "Dire Need" for Title X Family Planning Services Supplemental Grant Awards

Title X Service Grants

In March 2022, HHS released a new funding announcement under the new regulations, which resulted in funding for 16 of the 18 grantees that had left the program under the Trump regulations. The two grantees that did not return as FY2022 grantees were Planned Parenthood of Illinois and Health Imperatives, Inc. in Massachusetts, although the network of clinics for these grantees stayed in the program, returning as sites under the Illinois Dept. of Public Health Family Planning Program and Massachusetts Department of Public Health grants, respectively. (Individual grantees can encompass multiple sites and clinics.) FY2022 grants were awarded to 76 grantees for a total of $256.6 million. The program has been level funded at $286 million for the past nine years despite inflation (Figure 3).

The Title X Program Has Been Flat Funded for the Past Nine Years and Has Not Kept up With Inflation

While these 76 grantees received 5-year awards to support their family planning networks, 13 grantees only received a one-year grant for FY2022 due to funding constraints. This resulted in 89 grantees funded at $265 million in FY2022 (Table 2). Additionally, in May 2022, HHS awarded supplemental funds totaling $16.3 million to 31 grantees to enhance and expand their telehealth infrastructure and capacity after the increase in the use of telehealth due to the pandemic. These funds were also made available through the American Rescue Plan for a 12-month project period.

Title X Grantees Receiving 1-Year Grants for FY2022 Instead of 5-Year Grants

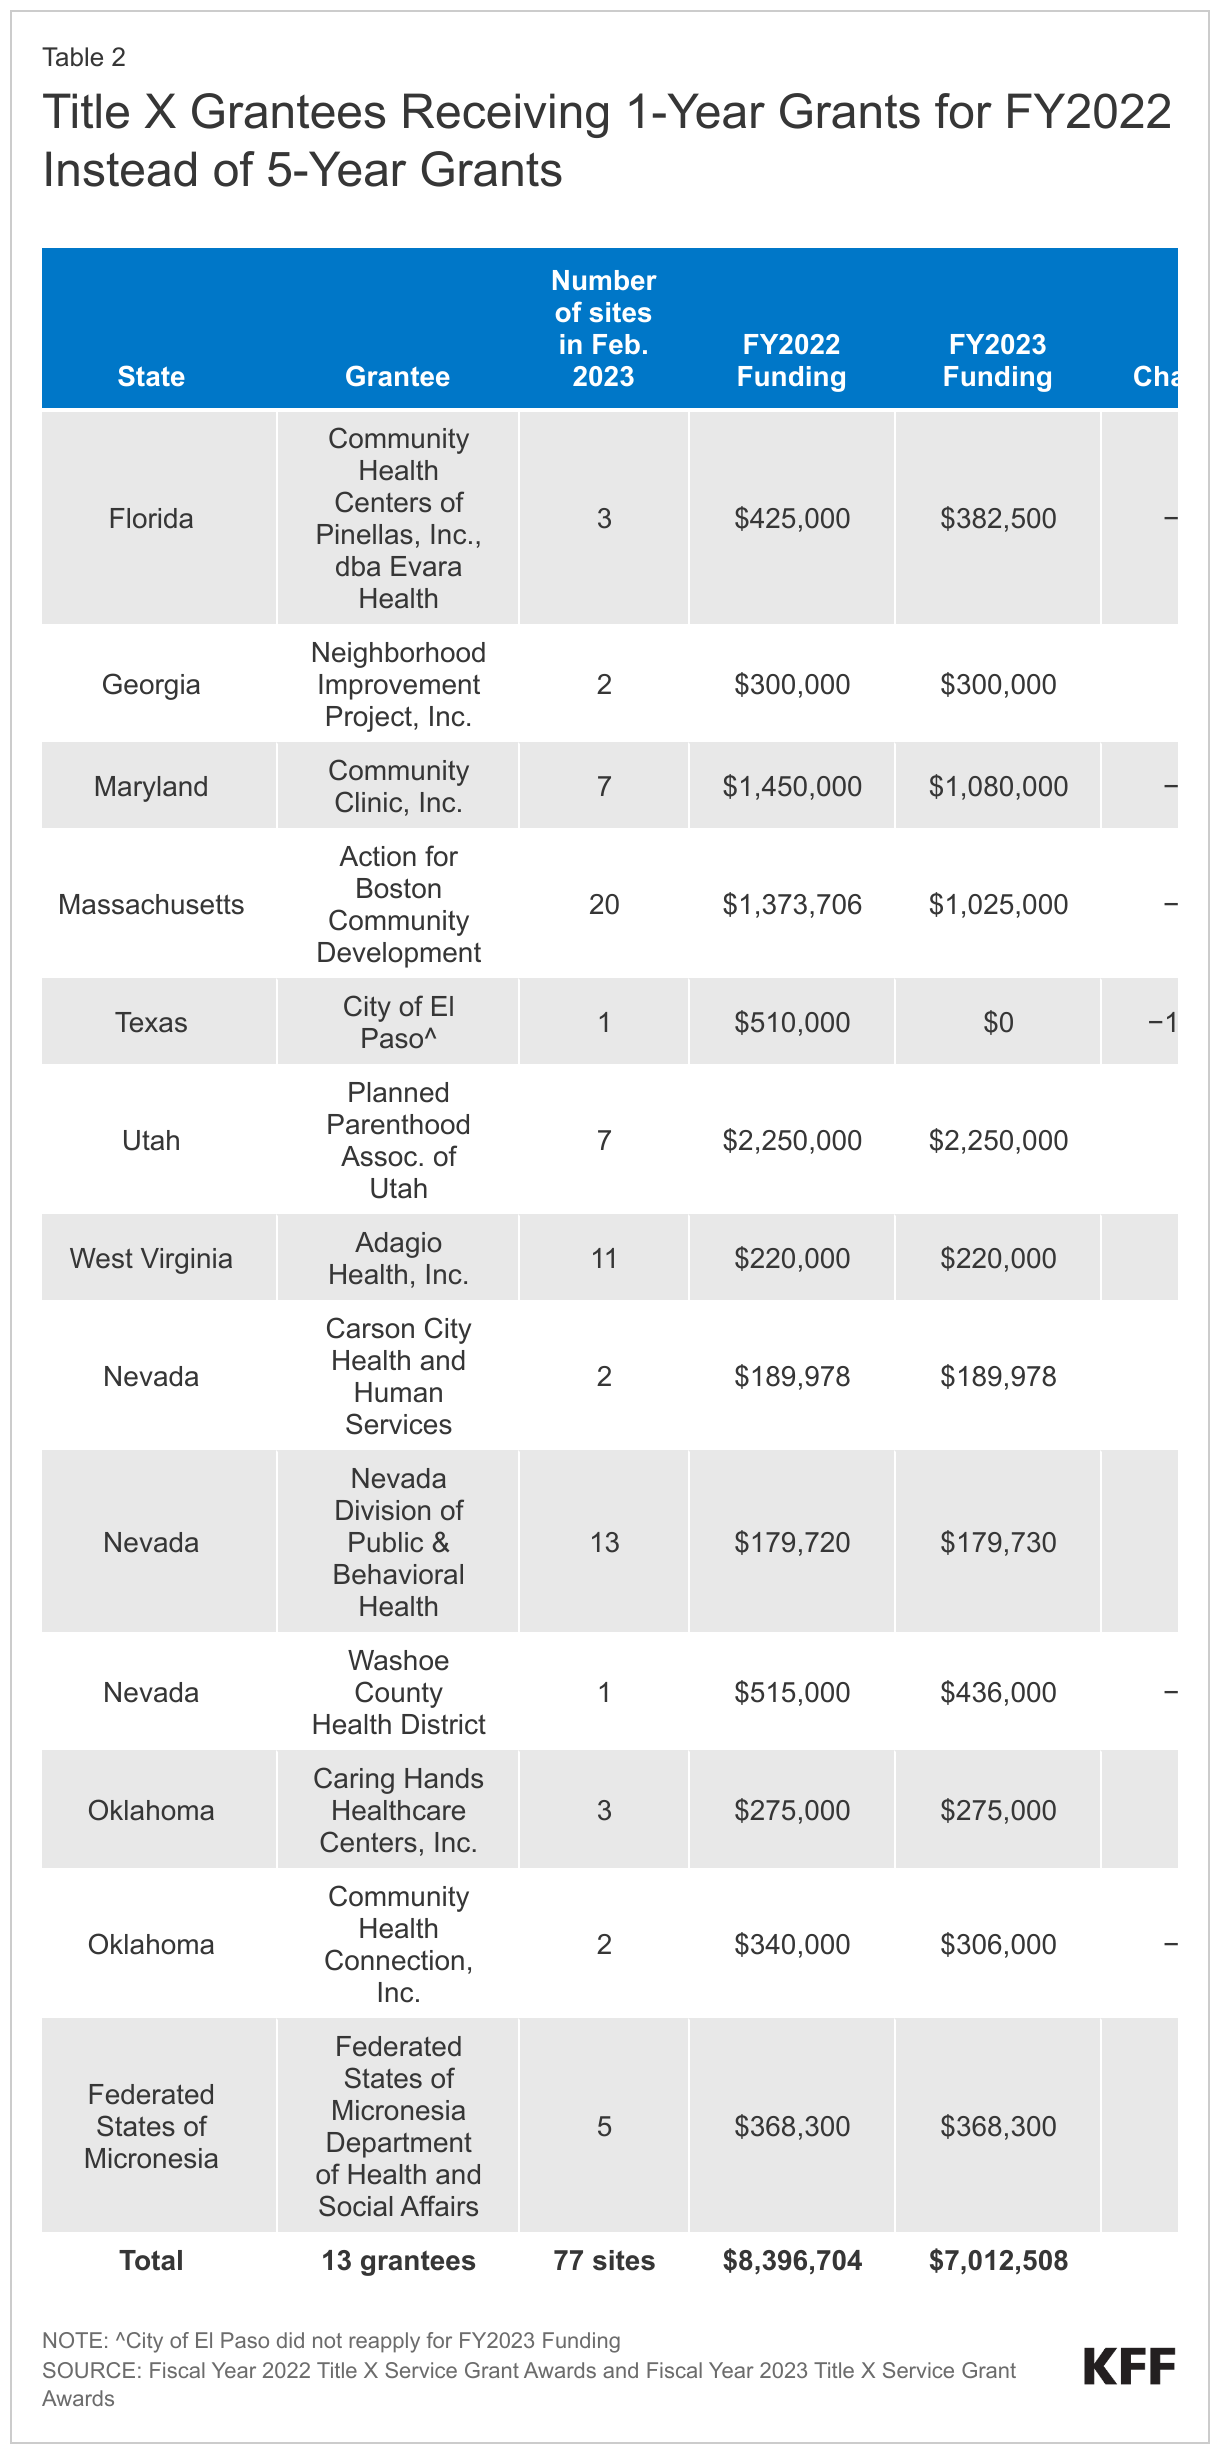
For FY2023, HHS funded 87 grantees with $256 million. Eleven of the grantees that only received a one-year grant for FY2022 were re-funded in FY2023 with six receiving level funding and five receiving a decrease in funding. The City of El Paso did not reapply for FY2023 funding, and the State of Tennessee lost their Title X grant due to non-compliance with Title X regulations by not providing comprehensive pregnancy options counseling that includes referrals for abortion when desired.

Rebuilding the Title X Network

The Title X network has been rebuilding under the new regulations and funding. Of the 411 Planned Parenthood sites that left the program, 286 sites (70%) have rejoined.

Of the 869 other sites that left the program, 531 (61%) have returned. At the same time, there are 777 new sites that were previously not part of the program. This brings the current Title X network back to 4,108 sites, which is 2% more than the original 4,010 sites prior to the Trump regulations.

All six states that left the Title X network (HI, ME, OR, UT, VT, WA) under the Trump Administration’s regulations have returned with most of their sites or they have expanded their networks to new sites.

While most states had small increases in funding amounts from FY2019 to FY2022, California had a 42% decrease in funding from $21 million to $13.2 million. The state still managed to expand the number of Title X sites in their network and the grantee, Essential Access Health, recently received $60 million in state funding to expand reproductive health care for low-income individuals.

Nevada, which has five grantees, lost over a quarter of its funding from FY2019 to FY2022. Two of the grantees received larger grants (Nevada Primary Care Association and Southern Nevada Health District) and three of the grantees received less (Washoe County Health District, State of Nevada Division of Public & Behavioral Health, City of Carson City DBA Carson City Health & Human Services). Iowa has had a slight decrease in funding and the number of Title X clinics in Iowa has decreased by over 40%, largely due to the loss of the Planned Parenthood clinics in their network.

Impact of State Restrictions on Title X Funding

Two new grantees to the program, Bridgercare in Montana and Converge, Inc. in Mississippi, took over the Title X grants in their respective states in March 2022 after the state health departments had been the grantees for decades. Both grantees received slight increases in funding and Converge, Inc has been able to maintain Mississippi’s previous Title X network. However, the size of Montana’s Title X network has decreased slightly in response to a law passed by the Montana Legislature (House Bill 620), which prohibited the state from funding any organization that provides abortions, effectively excluding Planned Parenthood clinics from their Title X program.

In March 2023, Tennessee lost their Title X funding because of a state policy that required Title X clinics to only provide pregnancy options counseling for the options legal in the state, which excluded abortion, which is in violation of the federal requirements to provide comprehensive pregnancy options counseling. While Tennessee’s governor has said that the state will fund the health department for their lost Title X funding with $7.5 million in recurring annual state funding, it is unclear how long the state will maintain this funding. In Idaho, the Attorney General has clarified that the Idaho law banning abortion also prohibits Idaho medical providers from referring a woman across states lines to access abortion services, which would also be in violation of the Title X regulations requiring pregnancy options counseling. Planned Parenthood Great Northwest, Hawai’i, Alaska, Indiana, Kentucky, which is one of two Title X grantees in Idaho, is suing the Attorney General of the State of Idaho over their inability to provide comprehensive pregnancy options counseling to their clients.

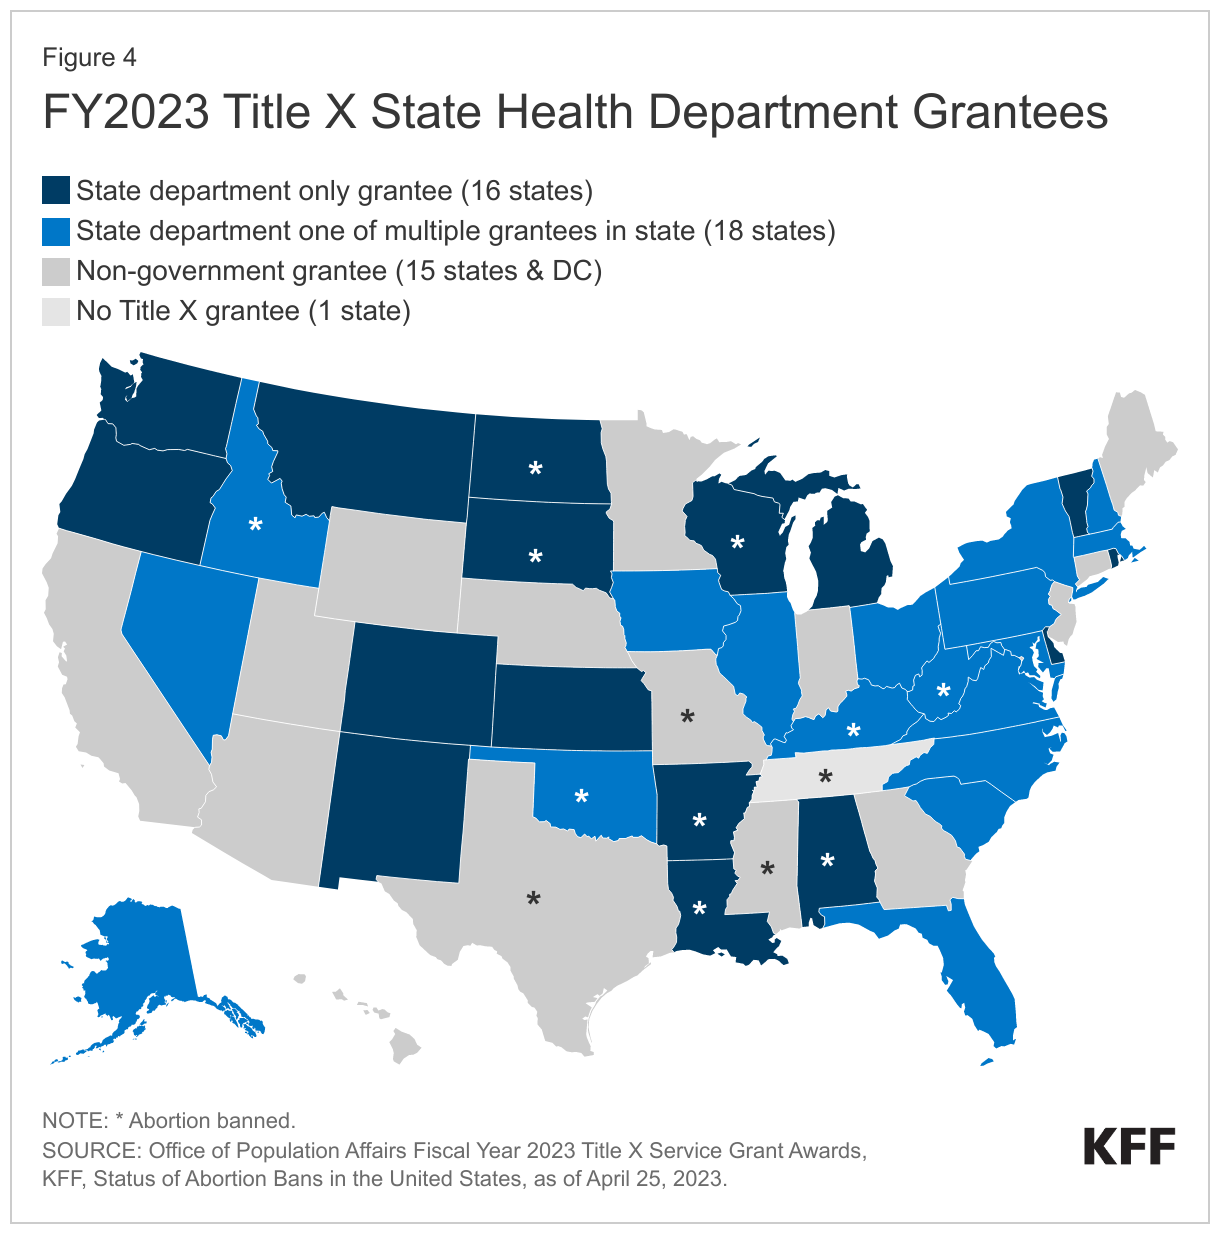
This could become an issue in other states where abortion is banned and state laws or policies may be in direct conflict of Title X federal requirements, disqualifying a state health department from being a Title X grantee. There are currently 34 states with grantees that are state health departments and in 16 states the health department is the only Title X grantee, six of these are states where abortion is banned (AL, AR, LA, ND, SD, WI).

FY2023 Title X State Health Department Grantees

Current Title X Litigation

There are currently two lawsuits filed against HHS challenging aspects of the current Title X regulations. In a case filed in United States District Court for the Northern District of Texas, Amarillo Division in April 2020, Deanda v. Becerra, a father of three minor girls contends that the Title X provisions allowing minors to seek contraception without parental consent violates his rights as a parent under Texas law, and the due process clause of the fourteenth amendment. Judge Matthew Kacsmaryk, the only judge in the Amarillo division (and the same federal judge overseeing a case challenging approval of the abortion medication Mifepristone) ruled in favor of the plaintiff, stating that Title X does not preempt state laws requiring parental consent or notification before distributing contraception to minors, and that the Biden Administration Title X requirement violates the plaintiff’s fundamental right to control and direct the upbringing of his minor children. On December 20, 2022, the Court struck down as unlawful the provision of the regulations requiring Title X projects to provide minors services without requiring consent or notification of their parents or guardians. This ruling is not limited to the plaintiff or to Texas. In states that require parental consent or notification, minors may no longer be able to obtain contraceptive services without consent or notification. In February 2023, the Biden Administration appealed this decision to the Fifth Circuit Court of Appeals. The case is pending at the Fifth Circuit Court of Appeals, and the Biden Administration has requested oral argument.

On October 25, 2021, the state of Ohio, joined by 11 other states (AL, AZ, AK, FL, KS, KY, MO, NE, OK, SC, WV), filed a lawsuit in the US District Court for the Southern District of Ohio against HHS to block the implementation of the Biden Administration’s regulations. These states claim the final regulations violate Section 1008 of the Public Health Service Act that says none of the funds appropriated under Title X can be used in programs where abortion is a method of family planning. The litigants claim that by reinstating the regulations that allow co-located abortion services and require participating providers to offer referrals for abortions to clients who seek them, that HHS is not in compliance with the intent of the law. On December 29, 2021, the district court denied the plaintiffs’ motion for a preliminary injunction to block the Department of Health and Human Services from implementing or enforcing the final rule. The plaintiff states appealed this ruling to the Sixth Circuit Court of Appeals and the court heard oral arguments on October 27, 2022. In April 2023, the state of Arizona dropped out of the case (as the new governor and attorney general shifted to a Democratic administration). While this case is pending, the Biden Administration regulations, except for the parental consent provisions affected by the Deanda case discussed below, are in effect.

Looking Forward

The Biden Administration’s reversal of the Trump Administration’s Title X regulations has enabled grantees that left the program under the Trump regulations to rejoin. Many states have been able to rebuild their networks to where they were in 2019, and in some cases, have been able to increase the number of clinics in their networks. However, funding for Title X has not increased for the past nine years and some states are operating larger Title X networks with significantly less federal funding (e.g., California and Nevada).

With abortion banned or restricted in many states, access to Title X sexual and reproductive health services becomes even more important. While Tennessee is the first state to lose their Title X funding due to non-compliance around pregnancy options counseling after abortion has been banned in their state, other states may have similar conflicts. States with abortion bans may refuse to comply with the Title X regulations that require offering pregnancy options counseling that includes prenatal care and delivery; infant care, foster care, or adoption; and pregnancy termination, as well as abortion referrals upon request. In states where abortion is banned or restricted, this would require out-of-state referrals for those desiring abortion services.

HHS has released a grant opportunity forecast for $1.5 million designed to fund a currently funded Title X grantee to establish the Title X Nondirective Options Information, Counseling, and Referrals Hotline that will provide pregnant people with neutral and factual information, as well as nondirective counseling and referrals for those seeking this information. This hotline could help give people access to comprehensive information about pregnancy options regardless of where they live.

While there may be gaps in some states, HHS anticipated that the number of clients served by the program would return to around 4 million nationally by 2023, and with the Title X networks back to capacity in many states, it seems on track to reach that projection.

Appendix

Status of Title X Network from Before Trump Regulations to After Biden Reversal of Trump Regulations (2019-2023)
Title X FY2019, 2022, and 2023 Grantees and Awards

Health Care Disparities Among Asian, Native Hawaiian, and Other Pacific Islander (NHOPI) People

Published: May 24, 2023

Asian, Native Hawaiian, and Other Pacific Islander (NHOPI) people are a diverse and growing population in the U.S. (Figure 1). Asian people are the fastest-growing racial or ethnic group in the United States, almost doubling from 10.5 million to almost 20 million between 2000 and 2020. In addition, there are nearly 700,000 people in the country who identify as NHOPI. In this data note, we use 2021 American Community Survey (ACS) data to examine how demographic characteristics as well as measures of health coverage and other social and economic factors that drive health and health care vary for Asian and NHOPI people overall and by subgroups. We include data for smaller subgroups wherever available. Instances in which the unweighted sample size for a subgroup is less than 50 – which are smaller than what we would typically include in analysis like this — are noted in the figures, and confidence intervals for those measures are included in the Appendix. Although these small sample sizes may impact the reliability, validity, and reproducibility of data, they are important to include because they point to potential underlying disparities that are hidden without disaggregated data, further exacerbating health inequities.

Examining experiences among Asian and NHOPI people is important since broad data for Asian people often mask underlying disparities among subgroups of the population and disaggregated data are often not available or reported for NHOPI people. Understanding the experiences of Asian and NHOPI people is particularly important at this time given growing concerns about mental health and well-being amid a significant uptick in anti-Asian hate incidents since the pandemic, an increased focus on advancing health equity and addressing racism, and ongoing efforts to improve data collection and reporting, particularly for smaller population groups and subgroups of the broader racial and ethnic categories.

Figure 1: Asian and Native Hawaiian and Other Pacific Islander People (NHOPI) in the U.S., 2021

Demographics

The majority of Asian and NHOPI people in the U.S. are citizens, adults, and many are parents or living in multigenerational households (Figure 2). Asian and NHOPI people included larger shares of noncitizens relative to White people (25% and 14% vs. 1%). One in five Asian (20%) and 19% White people were children, while more than one in four (26%) NHOPI people were children. Larger shares of Asian people lived in households comprised of parents with children or multigenerational households as compared to White people (42% vs. 33%).

Citizenship and household status varied among Asian and NHOPI subgroups: For example, the share of Asian people who are noncitizens ranged from 5% among Hmong people to 55% among Mongolian people. Among NHOPI people, Native Hawaiian and Chamorro people were significantly less likely than NHOPI people overall to be noncitizens (at less than 1%). In contrast, Marshallese people were more likely to be noncitizens (54%). This variation reflects differences in birth citizenship rights across locations to which NHOPI people trace their origins. Specifically, people born in Hawaii and Guam (Chamorro people) are U.S. citizens by birth, while other Pacific Islander people, including those born in in the Marshall Islands, which is part of the Compact of Free Association (COFA) with the U.S are not conferred U.S. citizenship at birth. The share of these groups who are children also ranged widely, from 9% of Japanese people to 36% of Hmong people among Asian subgroups and from 17% of Fijian people to 43% of Marshallese people among NHOPI subgroups. Household composition also varied by subgroup. Among Asian subgroups, the share who were parents or living in multigenerational households ranged from 27% for Japanese people to 68% for Bhutanese people. Among NHOPI subgroups, Native Hawaiian people (27%) were less likely than the group overall to be in a multigenerational household, while Marshallese people were more likely (48%).

Citizenship, Age, and Household Type Among Asian and NHOPI People, 2021

Health Coverage

As of 2021, among the nonelderly population, 6% of Asian people and 11% of NHOPI people were uninsured (Figure 3). The uninsured rate for Asian people was slightly lower than the rate for White people (7%), while the rate for NHOPI people was higher. Across both groups, uninsured rates were lower for children compared to nonelderly adults. The shares of Asian people covered by private coverage were higher than the shares for White people and the shares covered by Medicaid were lower. In contrast, NHOPI people were less likely to have private coverage and more likely to be covered by Medicaid, with over half (52%) of NHOPI children being covered by Medicaid or the Children’s Health Insurance Program (CHIP).

Insurance Coverage among Nonelderly Asian and NHOPI People, 2021

There are wide variations in uninsured rates among Asian and NHOPI subgroups (Figure 4). As of 2021, among nonelderly Asian people, uninsured rates ranged from 4% for Asian Indian and Taiwanese people to 28% for Mongolian people. Among NHOPI people, uninsured rates ranged from 5% for Chamorro people to 24% for Marshallese people, although uninsured rates for other NHOPI subgroups were not statistically significantly different from nonelderly NHOPI people overall. Uninsured rates further varied by citizenship status, with higher uninsured rates for noncitizens across most groups. Among nonelderly Asian noncitizens, uninsured rates varied from 5% for Japanese people to 38% for Mongolian people. There were no statistically significant differences in uninsured rates among nonelderly NHOPI noncitizens. Of note, the sample sizes for some noncitizen subgroups were small (<50), which can lead to a higher degree of uncertainty, i.e., larger confidence intervals for their measures. Confidence intervals for each subgroup measure in Figure 4 can be found in the Appendix.

Uninsured Rates among Nonelderly Asian and NHOPI People Overall and by Citizenship Status, 2021

Socioeconomic Differences

A variety of social and economic factors influence individuals’ access to health coverage, their ability to access health care, and their overall well-being. While as a broad group Asian people often fare similar to or better than White people across many of these measures, some subgroups fare worse. On the other hand, NHOPI people generally fare worse than their White counterparts across a range of social and economic measures.

Data show variations in socioeconomic measures among nonelderly Asian and NHOPI subgroups, which may contribute to the differences in health coverage (Figure 5). Among Asian subgroups, there was an almost five-fold difference in the share of people who have received a bachelor’s degree or higher, with 18% of Laotian people having a bachelor’s degree or higher as compared to 87% of Taiwanese people. Overall educational attainment is lower among NHOPI people, with a lower share of Marshallese people (6%) having a bachelor’s degree or higher compared to nonelderly NHOPI overall, and a higher of Chamorro people (28%) having at least a college degree. The share of Asian households with at least one full-time worker also varied by subgroup, ranging from 66% among nonelderly Mongolian people to 91% among nonelderly Asian Indian people. Among NHOPI people, Fijian and Samoan people were slightly more likely than the overall group to have at least one full-time worker. Similarly, household income among Asian subgroups varied widely with the share of nonelderly people who lived in a low-income household (below 200% of the federal poverty level or $43,920 for a family of 3 in 2021) ranging from 12% among Asian Indian people to 55% among Mongolian people and 52% among Burmese people. Some of these differences are likely driven by differences in citizenship and visa status. For example, those entering the U.S. with work visas likely have higher median household incomes compared to those that entered as asylees and/or refugees. Many Burmese people immigrate to the U.S. as refugees fleeing war in their home country, which could contribute towards their lower household incomes. On the other hand, higher earning groups such as Taiwanese people and Asian Indian people usually immigrate through work visas. Despite eight in ten nonelderly Marshallese people living in a household with at least one full-time worker, 63% lived in a low-income household, while only 27% of Chamorro and Fijian people were low-income. Lower educational attainment as well as higher shares of noncitizens may in part explain the higher shares of Marshallese people living in low-income households.

Educational Attainment, Employment, and Household Income Among Nonelderly Asian and NHOPI People, 2021

Key Issues Looking Ahead

Understanding the experiences of Asian and NHOPI people is of particular importance at this time given growing concerns about mental health and well-being amid a significant uptick in anti-Asian hate incidents. The COVID-19 pandemic and underlying racism and discrimination have contributed to a significant rise in hate crimes against Asian people in the United States, which have contributed to deteriorating mental health among Asian people. In a 2021 survey, a majority of Asian Americans cited COVID cases being first reported in China and President Trump as major reasons for discrimination against the Asian and Pacific Islander community. Against the backdrop of these anti-Asian sentiments and actions, two tragic mass shootings occurred around this past Lunar New Year, of whom many of the victims were Asian. These tragic events and their devasting impacts on the community have highlighted the importance of understanding and addressing mental health needs among Asian and NHOPI people. Although overall rates of mental illness are generally lower among Asian people compared to White people, this finding may reflect underdiagnosis and underreporting. It also may mask variations in mental health among subgroups of the population. Among people with mental illness, Asian people are less likely to utilize mental health services compared to other racial and ethnic groups. In 2021, among adults with any mental illness in the past year, only 25% of Asian adults reported receiving mental health services compared to 52% of White adults (Figure 6). Data on utilization were not available for NHOPI people. Moreover, data show rising rates of suicide death among Asian and Pacific Islander adolescents (ages 12-17). Although they have lower rates of suicide deaths compared to their White peers, suicides were the leading cause of death among Asian and Pacific Islander children ages 10-14 and the second leading cause among those between the ages of 15 and 35 in 2020, and suicide death rates more than doubled among this population from 2010 (2.2 per 100,000) to 2020 (5.0 per 100,000).

Share of Adults (Ages 18 and up) with Any Mental Illness Who Received Mental Health Services in the Past Year, 2021

In the wake of the COVID-19 pandemic, there has been a heightened awareness and focus on addressing health disparities, including recognizing the ongoing impacts of historic actions and policies on health disparities today. Anti-Asian racism is not new within the United States. Anti-Asian sentiments and related Sinophobia are embedded in U.S. history, as evidenced by the implementation of the Chinese Exclusion Acts in the late 1800s and the incarceration of Japanese Americans in the twentieth century. Historical actions have also contributed to ongoing trauma and negative health outcomes for NHOPI people. In the 19th century, the U.S. began substantial expansion across the Pacific Ocean which included the colonization of many of the Pacific Islands, and the overthrow of the Hawaiian monarchy. Since occupation, the United States’ colonial, post-colonial, and military actions in the region have resulted in adverse socioeconomic, health, and environmental pollution-related legacies among local and Indigenous populations. In addition to these historic actions and their aftermath, Asian and NHOPI people have faced ongoing stresses associated with the perpetual foreigner and model minority stereotypes, and acculturation.

The federal government has taken several actions focused on advancing health equity broadly and in response to the rise in Asian hate and anti-Asian violence, specifically. Early in his presidency, President Biden issued a series of executive orders focused on advancing health equity, including orders that outlined equity as a priority for the federal government broadly and as part of the pandemic response and recovery efforts. Federal agencies were directed with developing Equity Action Plans that outlined concrete strategies and commitments to addressing systemic barriers across the federal government. In 2021, Congress enacted the COVID-19 Hate Crimes Act in response to the increase in anti-Asian violence during the pandemic. During that time, the Biden Administration also released Executive Order 14031 “Advancing Equity, Justice, and Opportunity for Asian Americans, Native Hawaiians, and Pacific Islanders,” which established the White House Initiative on Asian Americans, Native Hawaiians, and Pacific Islanders (WHIAANHPI). The WHIAANHPI is committed to advancing equity for Asian Americans, Native Hawaiians, and Pacific Islanders (AANHPI) by investing in AANHPI communities and responding to the spikes in anti-Asian violence. In January 2023, the White House announced its National Strategy to Advance Equity, Justice, and Opportunity for Asian American, Native Hawaiian, and Pacific Islander (AA and NHPI) Communities.

As part of efforts to address disparities and advance health equity, there are efforts underway to expand and improve availability of disaggregated data, including for Asian and NHOPI people. As shown in this analysis, Asian and NHOPI people have diverse characteristics and experiences that influence their health and health care. These differences point to the importance of having disaggregated data for Asian and NHOPI groups to identify disparities and direct efforts to address them. The Biden Administration has charged the government with addressing the systemic lack of disaggregated AANHPI data in federal statistical systems. The Interagency Working Group on Equitable Data in collaboration with the WHIANHPI is also working to improve research on policy and program outcomes for AANHPI communities. In April 2022, the working group released its Equitable Data Working Group Report, which highlighted the need to generate disaggregated data, increase access to disaggregated data, conduct equity assessments of federal programs, and emphasize accountability to communities in the United States. The Office of Management and Budget released proposals in January 2023 to update the minimum standards for collecting and presenting data on race and ethnicity for all federal reporting, including providing a separate racial category for people who identify as Middle Eastern or North African and moving to collect race and ethnicity through a combined single question instead of asking about Hispanic or Latino ethnicity in a separate question from race.

Appendix

Figure 4a: Share of All Nonelderly Uninsured Asian People, 2021

Figure 4a: Share of All Nonelderly Uninsured Asian People, 2021

Figure 4b: Share of Nonelderly Uninsured Asian Citizens, 2021

Figure 4b: Share of Nonelderly Uninsured Asian Citizens, 2021

Figure 4c: Share of Nonelderly Uninsured Asian Noncitizens, 2021

Figure 4c: Share of Nonelderly Uninsured Asian Noncitizens, 2021

Figure 4d: Share of All Nonelderly Uninsured NHOPI People, 2021

Figure 4d: Share of All Nonelderly Uninsured NHOPI People, 2021

Figure 4e: Share of Nonelderly Uninsured NHOPI Citizens, 2021

Figure 4e: Share of Nonelderly Uninsured NHOPI Citizens, 2021

Figure 4f: Share of Nonelderly Uninsured NHOPI Noncitizens, 2021

Figure 4f: Share of Nonelderly Uninsured NHOPI Noncitizens, 2021

(Back to top)

News Release

Survey Finds Many Medicaid Enrollees Unprepared for Eligibility Renewal Process, and Some Believe They Could Struggle to Find Coverage or End Up Uninsured if They Lose Medicaid

Published: May 24, 2023

A KFF survey of Medicaid enrollees largely fielded prior to states resuming their efforts to redetermine Medicaid enrollees’ eligibility reveals many enrollees are unprepared for the renewal process that could result in some losing their coverage either due to eligibility changes or paperwork issues.

During the COVID-19 pandemic, states suspended their Medicaid eligibility renewals in exchange for additional federal funding, ensuring continuous health coverage for enrollees. States recently have resumed eligibility renewals and as of April 1 could start to disenroll people who either no longer qualify or who do not complete the renewal process.

The survey found that nearly two-thirds (65%) of Medicaid enrollees were unsure whether states could remove people from the program if they no longer meet the eligibility requirements or don’t complete the renewal process. An additional small share (7%) incorrectly believe that states couldn’t do this.

More than four in 10 enrollees whose sole coverage is Medicaid say that if the state told them they were no longer eligible for Medicaid coverage, they would not know where to look for other coverage (27%) or end up uninsured (15%).

Other findings include:

  • Nearly half (47%) of Medicaid enrollees say they have not previously been through the Medicaid renewal process, including two-thirds (68%) of Medicaid enrollees who are 65 and older. This group may be less likely to understand the importance of completing the renewal paperwork to maintain their coverage.
  • A third (33%) of enrollees say they have not provided updated contact information to their state Medicaid agency in the past year. Some in this group may miss critical eligibility renewal notices that would require action on their part to maintain coverage.
  • About half (52%) of enrollees say they prefer to get Medicaid information via the U.S. mail, which is the primary way most states contact enrollees, though nearly half of enrollees say they would prefer to get Medicaid information another way – through email (29%), an online portal (11%), or text messages (8%).
  • About a third of Medicaid enrollees say they have had a change in income or other change that could now make them ineligible for Medicaid or are unsure if they have had such a change, but most enrollees (65%) say their circumstances have not changed, suggesting they are still eligible. Those who are still eligible could lose coverage if they don’t complete the renewal process.
  • The vast majority (85%) say that it would be useful if they had a navigator to help with the renewal process and look for other coverage if needed.

Designed and analyzed by public opinion researchers at KFF, the survey was conducted February 21-March 14, 2023, online and by telephone among a representative sample of 3,605 adults in the U.S. with health insurance coverage, including 1,212 individuals with Medicaid coverage. Interviews were conducted in English and in Spanish. The margin of sampling error is plus or minus 4 percentage points for those with Medicaid coverage. For results based on other subgroups, the margin of sampling error may be higher.

Poll Finding

The Unwinding of Medicaid Continuous Enrollment: Knowledge and Experiences of Enrollees

Published: May 24, 2023

Findings

During the COVID-19 pandemic, states kept people continuously enrolled in Medicaid in exchange for enhanced federal funding. Continuous enrollment in Medicaid ended on March 31, 2023, and over the coming months, states will redetermine eligibility for people enrolled in Medicaid and will disenroll those who are either no longer eligible or who are unable to complete the renewal process. This brief gauges Medicaid enrollees’ knowledge of and preparedness for the Medicaid renewal process and possible disenrollment from the program, based on early findings from KFF’s new Survey of Health Insurance Consumers, fielded February 21 through March 14, 2023.

Key Findings

Most Medicaid enrollees were not aware that states are now permitted to resume disenrolling people from the Medicaid program. Roughly two-thirds (65%) of all Medicaid enrollees say they are “not sure” if states are now allowed to remove people from Medicaid if they no longer meet the eligibility requirements or don’t complete the renewal process, with an additional 7% incorrectly saying states will not be allowed to do this. Three in four adults 65 and older say they are unsure if states are allowed to remove people from Medicaid, and Black adults are more likely than White adults to incorrectly say that states will not be allowed to do this. Just under three in ten (28%) overall are aware states are now allowed to remove people from Medicaid.

Large Majorities Across Demographic Groups Are Not Aware States Are Allowed To Remove People From Medicaid

Nearly half of Medicaid enrollees say they have not previously been through the Medicaid renewal process. This includes two-thirds (68%) of Medicaid enrollees who are 65 and older and more than half of Medicaid enrollees who are between the ages of 18 and 29 (53%). Prior to the pandemic, Medicaid enrollees had their Medicaid coverage redetermined at least annually, and many lost coverage at renewal even though they remained eligible because they faced administrative barriers to completing the process. Some Medicaid enrollees may not be aware that their Medicaid coverage was renewed because the state was able to complete the process using available data sources, and therefore did not require the enrollee to take any action to maintain coverage. Having past experience with actively renewing Medicaid coverage can help enrollees prepare for what to expect when their eligibility is redetermined in the coming months and improve their ability to navigate and complete the renewal process.

Nearly Half Of Medicaid Enrollees Have Not Been Through Renewal Process, Including Two-Thirds Of Older Adults

One-third of Medicaid enrollees say they have not provided updated contact information to their state Medicaid agency in the past year. States have taken several steps in the past year to encourage Medicaid enrollees to update their contact information to increase the likelihood that they receive renewal and other notices sent by the state. Two-thirds of Medicaid enrollees overall say they provided updated contact information to their state. Older adults are more likely than younger age groups to say they have not provided updated contact information to their state with about half (48%) of those 65 and older saying they have not done this, although older adults may have more stable contact information and consequently less need to report a change than other Medicaid enrollees. Older adults with Medicaid are also less likely to have either actively participated in a renewal process previously or provided updated contact information to their state Medicaid agencies. While one in five Medicaid enrollees overall haven’t done either of these things, the share increases to more than one-third (39%) of those 65 and older.

Fewer Older Adults With Medicaid Say They Have Provided Updated Contact Information To Their State Medicaid AgencyE

About half of Medicaid enrollees prefer to receive renewal information through  modes other than the U.S. mail, such as email or via an online portal. While most state Medicaid agencies use the U.S. mail service as their primary method of communicating with Medicaid enrollees, many have taken steps to expand the ways in which they communicate with enrollees to include email and through online accounts. The survey finds that providing information to Medicaid enrollees through multiple methods can increase the chances that they receive the information. The U.S. mail is how about half (52%) of Medicaid enrollees say they would prefer to receive information about renewing Medicaid coverage, while three in ten (29%) say they prefer to receive information via email, and about one in ten say they prefer to get information through an online portal (11%) or via text message (8%). Three-fourths of older adults say they prefer to receive renewal information through the mail, but younger adults are equally likely to prefer receiving information through the U.S. mail (39%) as through email (37%). Even among younger enrollees, text is not a preferred communication method.

While Older Medicaid Enrollees Prefer Receiving Renewal Information Via Mail, Younger Adults Are Equally Inclined To Prefer Email

About one-third of Medicaid enrollees (35%) say they have had a change in income or other change that could now make them ineligible for Medicaid or are unsure if they have had such a change, but most enrollees say their circumstances have not changed, suggesting they are still eligible. Increases in income or another change in circumstance, such as a pregnant woman who completes her postpartum coverage period and no longer qualifies on the basis of pregnancy, can make people ineligible for Medicaid. If these types of changes occurred while Medicaid coverage was protected, individuals may no longer qualify when the state redetermines their eligibility in the coming months. One in ten Medicaid enrollees say they may have had such a change, and another 25% are not sure. However, enrollees who have not experienced a change that would make them ineligible may still be at risk of losing coverage if they are unable to complete the renewal process. Younger adults are more likely than their older counterparts to say they think they have had a change that would make them ineligible. About one in eight of 18–29-year-olds (12%) and 30-49-year-olds (13%) say they think they have had such a change, compared to very small shares of older adults (4% of those ages 50-64 and 2% of those ages 65 and older).

Some Young Adults Say They Have Had A Change That Could Make Them Ineligible For Medicaid Coverage, One In Four Are Unsure

While about six in ten of those with Medicaid as their only source of coverage would look for coverage from other sources if they were told they were no longer eligible, over four in ten say they wouldn’t know where to look for other coverage or would be uninsured. Asked what they would do if informed by their state that they are no longer are eligible for Medicaid, about six in ten of those with Medicaid as their only source of coverage say they would look for coverage somewhere else including one-third (32%) who say they would look for coverage on the marketplaces, and one in eight who say they would look for coverage through their employer (13%), Medicare (12%), or directly from an insurance company (12%). About one in four adults (27%) with Medicaid as their only source of coverage say they wouldn’t know where to look for coverage if they were no longer eligible for Medicaid and an additional 15% say they would be uninsured.

One In Four Medicaid Enrollees Say They Don't Know Where Else To Look For Health Insurance, One In Seven Say They Will Be Uninsured If No Longer Eligible

The large majority of Medicaid enrollees say having an expert help with the renewal process would be useful. As Medicaid enrollees begin the renewal process, nearly nine in ten say having a state expert to help them navigate the process of renewing their Medicaid coverage and looking for other coverage, if needed, would be at least “somewhat useful.” About four in ten (44%) Medicaid enrollees say having a navigator would be “very useful” in helping them with the renewal process with an additional four in ten (41%) saying it would be “somewhat useful.” About one in six either say it would be “not too useful” (11%) or “not at all useful” (3%).

Large Majorities Of Medicaid Enrollees Say Navigators Could Be Helpful To Them During Renewal Process

Implications

As states resume disenrollments following the end of the Medicaid continuous enrollment provision, many Medicaid enrollees have been unaware of and may not be prepared for the coming changes, particularly older enrollees and enrollees ages 18-29. About half of enrollees say they have not completed a renewal process previously, so may not be on the lookout for renewal notices and may not be familiar with the steps they need to take to complete the process and maintain coverage if they remain eligible. While about half of Medicaid enrollees prefer to receive communications through modes other than the U.S. mail, some states continue to use the U.S. mail as the only method for sending notices. And, while only one in ten Medicaid enrollees say they have had a change that would likely make them ineligible for Medicaid, some are unsure, and many people are expected to fall through the cracks and lose coverage during the unwinding period even though they are still eligible. Engaging key stakeholders, including Medicaid managed care organizations (MCOs), Medicaid providers, and community-based organizations, in providing outreach to Medicaid enrollees, including targeted outreach to older adults, can raise awareness about the need to complete the renewal process. In addition, connecting people on Medicaid with Navigators and other organizations who can assist them with the renewal process can help increase the number of people who complete their renewals and retain coverage if they remain eligible or know where to look for and enroll in other coverage if they are determined to no longer be eligible. 

Methodology

This KFF Survey of Health Insurance Consumers was designed and analyzed by public opinion researchers at KFF. The survey was designed to reach a representative sample of insured adults in the U.S. The survey was conducted February 21 – March 14, 2023, online and by telephone among a nationally representative sample of 3,605 U.S. adults who have employer sponsored insurance plans (978), Medicaid (815), Medicare (885), Marketplace plans (880), or a Military plan (47).

The sample includes 2,595 insured adults reached through the SSRS Opinion Panel either online or over the phone (n=75 in Spanish). The SSRS Opinion Panel is a nationally representative probability-based panel where panel members are recruited randomly in one of two ways: (a) Through invitations mailed to respondents randomly sampled from an Address-Based Sample (ABS) provided by Marketing Systems Groups (MSG) through the U.S. Postal Service’s Computerized Delivery Sequence (CDS); (b) from a dual-frame random digit dial (RDD) sample provided by MSG. For the online panel component, invitations were sent to panel members by email followed by up to three reminder emails. 2,500 panel members completed the survey online and panel members who do not use the internet were reached by phone (95). Another 504 respondents were reached online through the Ipsos Knowledge Panel This panel is recruited using ABS, based on a stratified sample from the CDS.

Another 289 (n=10 in Spanish) interviews were conducted from a random digit dial (RDD) of prepaid cell phone numbers (n=190) and landline telephone numbers (n=99). Phone numbers used for the prepaid cell phone component were randomly generated from a cell phone sampling frame with disproportionate stratification aimed at reaching Hispanic and non-Hispanic Black respondents. Stratification for the prepaid cell phone sample was based on incidence of the race/ethnicity groups within each frame. Phone numbers for the landline component were randomly generated from a landline sampling frame utilizing MSG’s listed household sampling frame to identify households with an adult age 65 or older and therefore more likely to have Medicare. This landline sample was also disproportionately stratified to reach African American and Hispanic respondents. An additional 217 respondents were reached by calling back respondents who said they were insured in previous KFF probability-based polls. Respondents in the phone samples received a $10 incentive via a check received by mail. SSRS web respondents received a $5 electronic gift card incentive (some harder-to-reach groups received a $10 electronic gift card). Ipsos Knowledge Panel respondents were included in raffles and sweepstakes for cash prizes as appreciation for their participation.

Respondents with Employer-sponsored plans, Medicaid, Medicare, and Marketplace plans from the combined phone and panel samples were weighted separately to match each group’s demographics using data from the 2021 American Community Survey (ACS). Weighting parameters included gender, age, education, race/ethnicity, and region. The weights take into account differences in the probability of selection for each sample type (cellphone sample, landline sample, callback phone sample, and panel). This includes adjustment for the sample design, within household probability of selection, and the design of the panel-recruitment procedure. The total sample of insured adults was also weighted to match demographics of insured adults using data from the 2021 American Community Survey (ACS).

The margin of sampling error including the design effect for the full sample is plus or minus 2 percentage points. Numbers of respondents and margins of sampling error for key subgroups are shown in the table below. For results based on other subgroups, the margin of sampling error may be higher. Sample sizes and margins of sampling error for other subgroups are available by request. Sampling error is only one of many potential sources of error and there may be other unmeasured error in this or any other public opinion poll. KFF public opinion and survey research is a charter member of the Transparency Initiative of the American Association for Public Opinion Research.

This work was supported in part by the Robert Wood Johnson Foundation. We value our funders. KFF maintains full editorial control over all of its policy analysis, polling, and journalism activities.

GroupN (unweighted)M.O.S.E.
Total insured adults3,605± 2 percentage points
Insured adults with Medicaid coverage1,212± 4 percentage points
News Release

Recent Widening of Racial Disparities in U.S. Life Expectancy Was Largely Driven by COVID-19 Mortality

Published: May 23, 2023

During the COVID-19 pandemic, the U.S. population experienced the most significant two-year decline in life expectancy in roughly a century, according to new research by KFF, with data showing that COVID-19 deaths disproportionately impacted people of color and exacerbating longstanding racial disparities in life expectancy. While overall U.S. life expectancy declined by 2.7 years between 2019 and 2021, American Indian and Alaskan Native (AIAN) people experienced a decline of 6.6 years, Hispanic people and Black people dropped 4.2 and 4 years, respectively, compared to a decline of 2.4 years for White people and 2.1 years for Asian people

Cancer and heart disease continue to be the leading causes of death for the U.S. population and in 2020 COVID-19 joined them in the ranks, but the pandemic has coincided with other increases in causes of death. Liver disease rose to the ninth leading cause of death in 2021, reflecting a rise in alcohol-related deaths, with AIAN people experiencing the most significant increase in this cause of death.Increases in drug overdose deaths were a major factor in the rise of unintentional injury deaths from 2019 to 2021, although its ranking did not fluctuate much within racial groups.

While suicide’s ranking among the leading causes of death fell from 2019 to 2021, there was a significant increase in suicides among Black and White people and AIAN men.Provisional 2022 data indicate a decrease in overall mortality from 2021, reflecting declines in COVID-19 deaths overall. However, AIAN and Black people continue to have higher COVID-19 death rates than White people.Read the brief for a discussion about addressing underlying drivers of U.S. life expectancy racial disparities, including inequities in health insurance coverage, access to care, and social and economic factors that drive health.

What is Driving Widening Racial Disparities in Life Expectancy?

Published: May 23, 2023

Introduction

Amid the COVID-19 pandemic, life expectancy in the U.S. declined 2.7 years between 2019 and 2021, from 78.8 years to 76.1 years, marking the largest two-year decline in life expectancy since the 1920’s. This decline further widened the existing gap in life expectancy between the U.S. and other comparably large and wealthy countries. It also exacerbated longstanding racial disparities in life expectancy and mortality within the U.S., contributing to excess deaths and increased costs. This analysis examines trends in life expectancy and leading causes of death by race and ethnicity and discusses the factors that contribute to racial disparities in life expectancy. In sum, it finds:

  • There was a sharp drop-off in life expectancy between 2019 and 2021, with particularly large declines among some groups. American Indian and Alaska Native (AIAN) people experienced the largest decline in life expectancy of 6.6 years during this time, followed by Hispanic and Black people (4.2 and 4.0 years, respectively).
  • Reflecting these declines, provisional data for 2021 show that life expectancy was lowest for AIAN people at 65.2 years, followed by Black people, whose expectancy was 70.8 years, compared with 76.4 years for White people and 77.7 years for Hispanic people. It was highest for Asian people at 83.5 years. Data were not reported for Native Hawaiian and Other Pacific Islander (NHOPI) people.
  • These declines were largely due to COVID-19 deaths and reflect the disproportionate burden of excess deaths, including premature excess deaths (before age 75), among people of color during the pandemic. Although COVID-19 mortality was a primary contributor to the recent decrease in life expectancy across groups, leading causes of death vary by race and ethnicity.

These recent stark declines and widening racial disparities in life expectancy amplify the importance of addressing underlying drivers of these disparities, including inequities in health insurance coverage and access to care and social and economic factors that drive health.

Life expectancy at birth represents the average number of years a group of infants would live if they were to experience throughout life the age-specific death rates prevailing during a specified period. Life expectancy is one of the most used measures of population health, enabling comparisons in health status between countries, states, local communities, and demographic groups. Differences in life expectancy occur across a broad range of dimensions which often intersect with each other, including race, socioeconomic status, gender, geography, and other characteristics. For example, In the U.S. and all other comparable countries, men tend to have shorter life expectancy at birth than women. In 2021, life expectancy for women in the U.S. was 5.9 years higher than for men (79.1 years vs. 73.2 year, respectively), and similar gender disparities persisted within racial and ethnic groups. This analysis focuses on differences in life expectancy by race and ethnicity overall, but within racial and ethnic groups there is variation by these other factors, such as gender.

Prior to 2015, there were relatively steady increases in life expectancy in the U.S., but racial disparities persisted. Before 2015, life expectancy in the U.S. steadily increased with an overall gain of about 10 years between 1960 and 2015 from 69.7 years to 79.4 years. While there have been large gains in life expectancy across racial and ethnic groups, racial disparities have been longstanding and persisted over time. Black people have consistently had lower life expectancy than White people, while, conversely, Hispanic people have consistently had longer life expectancy compared to White people. When life expectancy reached its peak in 2014, life expectancy for Black people was more than three years shorter than White people (75.3 vs. 78.8 years), and Hispanic people had a longer life expectancy at 82.1 years (Figure 1 and Appendix Table 1). (Data were not available for other groups.)

Following this peak in 2014, life expectancy declined for the first time in over two decades. Between 2014 and 2017, overall life expectancy declined by 0.3 years with a slightly larger decline for Black people (0.4 years) compared with Hispanic and White people (0.3 years for both) (Figure 1 and Appendix Table 1). Separate data were not reported for Asian, AIAN and NHOPI people for this period. Research suggests that increases in mortality due to suicide, drug overdose and alcohol abuse were drivers of the decreasing life expectancy during this time. In 2018 and 2019, life expectancy remained relatively stable overall and across groups.

Life Expectancy at Birth in Years, by Race/Ethnicity, 2006-2018

Life expectancy sharply declined by 2.7 years between 2019 and 2021, and disparities widened amid the COVID-19 pandemic (Figure 2). In 2019, prior to the onset of the pandemic, overall life expectancy was 78.8 years. AIAN people had the lowest life expectancy at 71.8 years, followed by Black people at 74.8. These groups both had lower life expectancies than White people, whose life expectancy was 78.8 years. Hispanic and Asian people had longer life expectancies of 81.9 and 85.6 years, respectively. The onset of the COVID-19 pandemic in 2020 resulted in higher mortality rates. Because life expectancy is based on death rates for a given period, these increased mortality rates drove declines in life expectancy in 2020 and 2021. Overall life expectancy declined by 2.7 years between 2019 and 2021, with AIAN people experiencing the largest life expectancy decline of 6.6 years, followed by Hispanic and Black people (4.2 and 4.0 years, respectively), and a smaller decline of 2.4 years for White people. Asian people had the smallest decline in life expectancy of 2.1 years between 2019 and 2021. These declines further widened gaps in life expectancy for AIAN and Black people compared to White people and reduced the advantage in life expectancy for Hispanic people relative to White people. As of 2021, provisional data show that life expectancy was lowest for AIAN and Black people at 65.2 years and 70.8 years, respectively, compared to 76.4 years for White people and 77.7 years for Hispanic people. It was highest for Asian people at 83.5 years. Data were not available for NHOPI people. Given that life expectancy reflects death rates from a specified year and provisional data from 2022 show that overall mortality declined 5.3% between 2021 and 2022, reflecting a fall-off in COVID-19 deaths, there may be small increases in life expectancy in upcoming years.

Life Expectancy in Years by Race/Ethnicity, 2019-2021

Causes of Recent Life Expectancy Declines

The declines in life expectancy between 2019 and 2021 largely reflect an increase in excess deaths amid the COVID-19 pandemic, which disproportionately impacted Black, Hispanic, and AIAN people. KFF analysis finds the pandemic was associated with faster rises in premature mortality rates and resulted in more excess years of life lost for people of color compared to their White counterparts, with people of color accounting for 59% of excess years of life lost while making up 40% of the population. Other analysis further finds that COVID-19 mortality had the largest contribution to the decline in life expectancy between 2020 and 2021 among AIAN, Black and White people, accounting for 21.4%, 35.0%, and 54.1% of their declines, respectively. Among Hispanic and Asian people, COVID-19 had the second largest contribution to the decline in life expectancy, accounting for 25.5% and 16.6% of their declines, respectively. The largest contributor to the decline for Hispanic people was an increase in mortality due to unintentional injuries, while growth in cancer deaths was the primary contributor to the decline for Asian people between 2020 and 2021.

Although COVID-19 mortality was a primary contributor to the recent decrease in life expectancy across groups, leading causes of death varied by race and ethnicity. Overall, COVID-19 was the third leading cause of death in 2021, after heart disease and cancer. However, COVID-19 was the top leading cause of death for Hispanic and AIAN people, followed by heart disease and cancer (Figure 3). Among Black, Asian, and White people, COVID-19 was the third leading cause of death, outranked by heart disease and cancer.

Beyond COVID-19 becoming a leading cause of death, there were other changes in leading causes of death that occurred during the pandemic (Figure 3). For example, flu activity has been lower since the beginning of the pandemic, leading to flu and pneumonia falling out of the ten leading causes of death in 2021. In contrast, liver disease rose to the ninth leading cause of death, reflecting sharp increases in alcohol-related deaths during the pandemic, with AIAN people experiencing the largest increase from 44.7 per 100,00 in 2019 to 77.8 per 100,000 in 2021. Deaths related to unintentional injuries also increased between 2019 and 2021, largely driven by increases in drug overdose deaths. Although suicide rates dropped out of the top ten leading causes of death overall during the pandemic (10th leading cause of death in 2019 vs. 11th in 2021), there was a significant increase in suicide deaths between 2020 and 2021 among Black and White men and women and AIAN men, and suicide remained the ninth leading cause of death for AIAN people and the tenth leading cause for White people in 2021. Although homicide deaths increased between 2020 and 2021, Black people are the only racial group for which homicide was a top ten cause of death in 2021, reflecting high rates of homicide among young Black men. For example, homicide was the leading cause of death in 2021 among Black males ages 15-34, and the death rate was 20 times higher than their White counterparts (126.1 per 1000,000 vs. 6.1 per 100,000), continuing a disparity in homicides that has existed for decades.

Top 10 Leading Causes of Death in the U.S. (Age-Adjusted Death Rates), by Race/Ethnicity, 2019 and 2021

Provisional data from 2022 show that overall mortality declined 5.3% between 2021 and 2022, and that, in 2022, the three leading causes of death were heart disease, cancer, and unintentional injuries. During this time, COVID-19 deaths declined almost 50% overall and across all racial and ethnic groups, dropping to the fourth leading cause of death. Despite these declines in COVID-19 deaths, AIAN and Black people continued to have higher COVID-19 death rates compared to White people. Declining death rates from COVID-19 may improve life expectancy overall, however racial gaps will likely persist given the continued disparities in COVID-19 and other leading causes of death.

Factors Contributing to Racial Life Expectancy Disparities

Research suggests that the factors driving disparities in life expectancy are complex and multifactorial. They include differences in health insurance coverage and access to care, social and economic factors, and health behaviors that are rooted in structural and systemic racism and discrimination (Figure 4).

Figure 4: Health Disparities are Driven by Social and Economic Inequities​

People of color are more likely than their White counterparts to be uninsured and to face other barriers to accessing health care that may contribute to shorter life expectancy. Data show that people of color are less likely to have health insurance and more likely to face barriers to accessing care, such as not having a usual source of care. Among AIAN people, chronic underfunding of the Indian Health Service further contributes to barriers to health care. Research shows that, overall, uninsured people are more likely than those with insurance to go without needed medical care due to cost and less likely to receive preventive care and services. Research further shows that uninsured people have higher mortality rates and lower survival rates than people with insurance.

Underlying social and economic inequities also drive disparities in mortality and life expectancy. Hispanic, AIAN, and Black people are more likely to have lower incomes and educational attainment levels compared to White people, and studies find that people with higher incomes and more education live longer lives. Other social and economic factors may also affect life expectancy. For example, historic housing policies, including redlining, and ongoing economic inequities have resulted in residential segregation that pushed many low-income people and people of color into segregated urban neighborhoods. Research finds that living in racially segregated neighborhoods is associated with shorter life expectancy and higher mortality rates for Black people.

Social and economic factors can also shape health behaviors and exposure to health risks that influence life expectancy,  For example, Black and AIAN people  have higher rates of smoking, substance and alcohol use disorders, and obesity compared to White people. Research suggests that eliminating smoking and obesity would greatly narrow disparities in life expectancy between Black and White people. People of color are also disproportionately affected by violence, including police and gun-related violence. Research shows African American and AIAN men and women and Latino men are at increased risk of being killed by police compared to their White peers. Black and Hispanic adults also are more likely than White adults to worry about gun violence according to 2023 KFF survey data. Other KFF analysis shows that firearm death rates increased sharply among Black and Hispanic youth during the pandemic driven primarily by gun assaults and suicide by firearm.

Research also highlights the role of racism and discrimination in driving racial disparities in mortality. Many of the inequities described above are rooted in racism and discrimination. Racism also contributes to lower quality of care among people of color. For example, a KFF/The Undefeated survey found that most Black adults believe the health care system treats people unfairly based on their race, and one in five Black and Hispanic adults report they were personally treated unfairly because of their race or ethnicity while getting health care in the past year. Beyond driving structural inequities and differences in experiences obtaining health care, research also demonstrates that racism and discrimination have direct negative impacts on health. For example, research finds that the cumulative effects of exposure to racism and chronic stress, referred to as allostatic load, may contribute to a more rapid decline in health and higher mortality among Black people. The health of AIAN people has also been negatively affected by ongoing racism and discrimination, and intergenerational trauma stemming from historical actions and policies, including genocide, removal from native lands, and assimilation efforts, including Indian boarding schools.

Some life expectancy patterns are not fully understood or observable in the data presented. Notably, Hispanic people have longer life expectancy than their White counterparts despite experiencing increased barriers to accessing health care and social and economic challenges typically associated with poorer health outcomes. Researchers have hypothesized that this finding, sometimes referred to as the Hispanic or Latino health paradox, in part, may stem from variation in outcomes among subgroups of Hispanic people by origin, nativity, and race, with better outcomes for some groups, particularly recent immigrants to the U.S. However, the findings still are not fully understood. Measures of life expectancy for Asian people as a broad group may mask underlying differences among subgroups of the population who vary across health access and social and economic factors. Research has shown variation in life expectancy among Asian subgroups, with Chinese people having the longest life expectancy and Vietnamese people having the shortest life expectancy, which may in part reflect differences in socioeconomic status. Additionally, data limitations for NHOPI people prevented the ability to include them in this analysis. Efforts to expand and improve data collection for NHOPI people will be important to gain a better understanding of their experiences, particularly since they suffered disproportionate impacts on mortality from COVID-19.

Conclusion

Overall, the data suggest that the COVID-19 pandemic exacerbated longstanding racial disparities in life expectancy. The recent declines and widening of disparities in life expectancy highlight the urgency and importance of addressing disparities in health broadly and increased attention to disparities in mortality and life expectancy specifically. Continued efforts within and beyond the health care system will be important to reduce ongoing racial disparities in life expectancy, many of which are rooted in systemic racism. Within the health care system, these may include ongoing efforts to reduce gaps in health insurance, increase access to care, and eliminate discrimination and bias. Beyond the health care system, addressing broader social and economic factors, including those that drive disparities in behavioral risks, will also be important.

Appendix

Life Expectancy at Birth in Years, by Race/Ethnicity, 2006-2021

(Back to top)

News Release

What Are the Exceptions to State Abortion Bans?

KFF Reviews Exceptions to State Abortion Bans and Key Issues for Access and Health

Published: May 18, 2023

A new KFF analysis reviews exceptions to abortion bans and describes how the stated aim to provide life-saving and health-preserving abortion care may not be achieved in practice. Abortion is currently banned in 14 states and many other states have attempted to ban or severely restrict abortion access. Exceptions to state abortion bans generally fall into four general categories: to prevent the death of the pregnant person, when there is risk to the health of the pregnant person, when the pregnancy is the result of rape or incest, and when there is a lethal fetal anomaly.

  • While the state bans and restrictions include life or health exceptions, the vagueness of the language describing them can effectively restrict the ability of clinicians to exercise their own medical judgement based on their expertise and accepted standards of care.
  • Abortion bans and restrictions have led physicians to delay providing miscarriage management care. 
  • Mental health exceptions are rare even though 20% of pregnancy-related deaths are attributable to mental health conditions. 
  • Few state abortion bans contain exceptions for pregnancies resulting from rape or incest and law enforcement involvement is often required to document the sexual assault. 
  • In states where there is more than one abortion ban, the exceptions can be at odds with each other, creating confusion among patients and providers.  

Read the brief, “A Review of Exceptions in State Abortions Bans: Implications for the Provision of Abortion Services” to learn more about how exceptions to abortion bans impact access to abortion care for people across the United States.