KFF designs, conducts and analyzes original public opinion and survey research on Americans’ attitudes, knowledge, and experiences with the health care system to help amplify the public’s voice in major national debates.
Senate Committee on Appropriations Approves FY 2025 Labor, Health and Human Services, Education, and Related Agencies (Labor HHS) Appropriations Bill & Accompanying Report
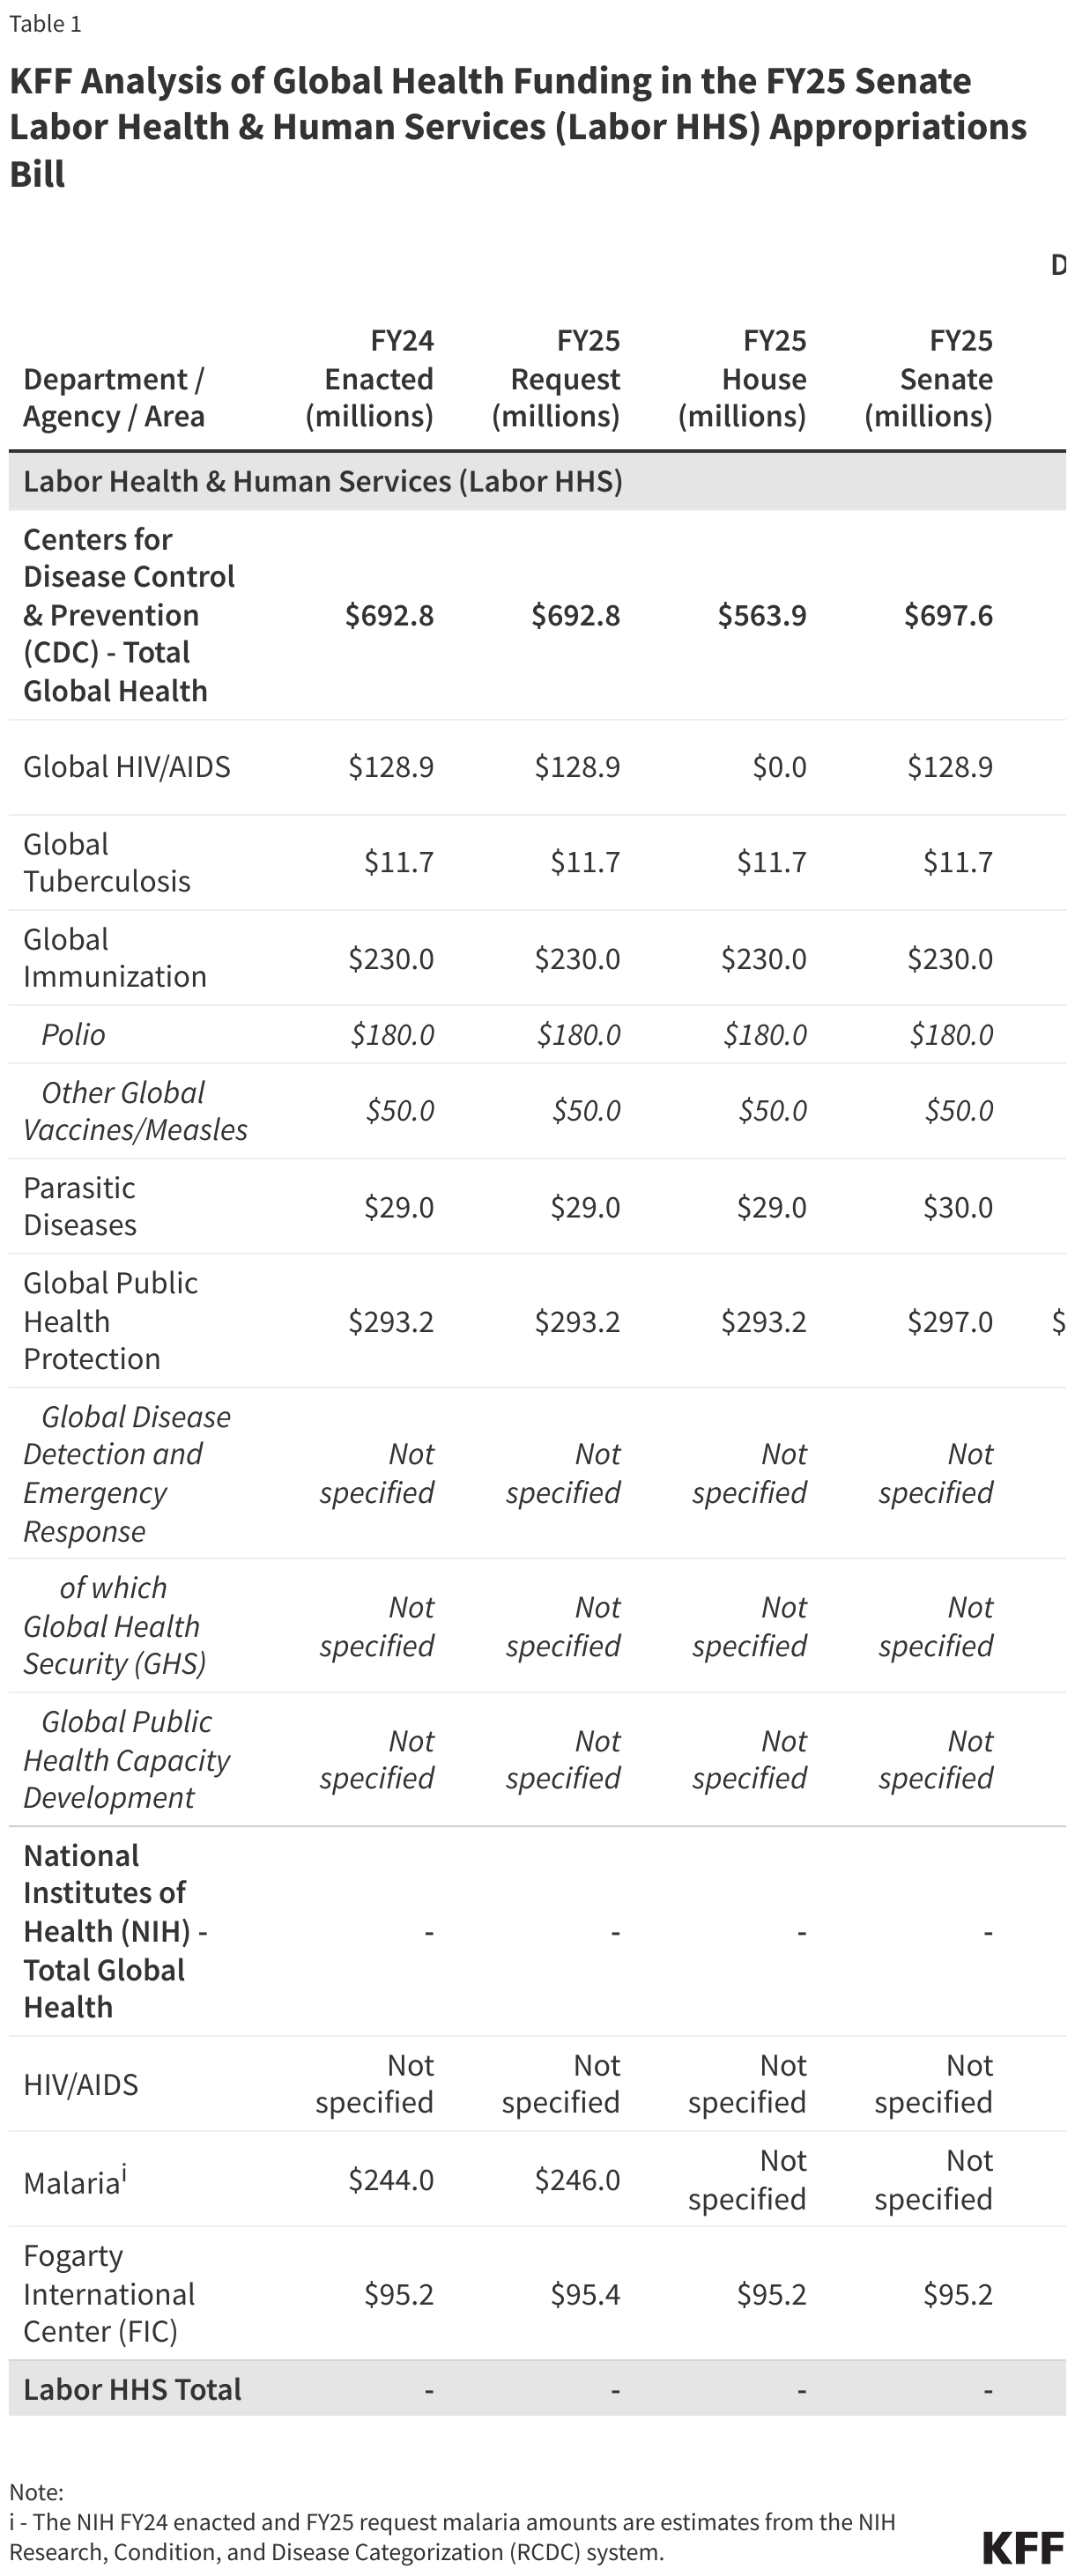
The Senate Committee on Appropriations approved its FY 2025 Labor, Health and Human Services, Education, and Related Agencies (Labor HHS) appropriations bill, accompanying report, and amendments on August 1, 2024. The Labor HHS appropriations bill includes funding for U.S. global health programs provided to the Centers for Disease Control and Prevention (CDC) and funding for global health research activities provided to the National Institutes of Health (NIH). Total global health funding at CDC and NIH through the Labor HHS bill is not yet known, as funding for some programs at NIH is determined at the agency level rather than specified by Congress in annual appropriations bills. Funding for global health programs at CDC totals $698 million, which is $4.8 million (1%) above the FY24 enacted and President’s FY25 request level ($693 million) and $134 million (24%) above the House level ($564 million). Funding for parasitic diseases and global public health protection at CDC increased while all other program areas, including the Fogarty International Center at NIH, remained flat compared to the FY24 enacted amounts. See the table below for additional detail on global health funding. See other budget summaries and the KFF budget tracker for details on historical annual appropriations for global health programs.
KFF Analysis of Global Health Funding in the FY25 Senate Labor Health & Human Services (Labor HHS) Appropriations Bill
<br>i - The NIH FY24 enacted and FY25 request malaria amounts are estimates from the NIH Research, Condition, and Disease Categorization (RCDC) system.
The Senate Committee on Appropriations approved the FY 2025 State, Foreign Operations, and Related Programs (SFOPs) appropriations bill, accompanying report, and amendments on July 25, 2024. The SFOPs bill includes funding for U.S. global health programs at the State Department and the U.S. Agency for International Development (USAID). The SFOPs bill includes funding for U.S. global health programs at the State Department and the U.S. Agency for International Development (USAID). Funding for these programs, through the Global Health Programs (GHP) account, which represents the bulk of global health assistance, totaled $9.7 billion, a decrease of $886 million (-8%) below the FY 2024 enacted level. All of the decrease is due to reduced funding in the bill for the Global Fund to Fight AIDS, Tuberculosis and Malaria (Global Fund), though the accompanying report notes that the decline is “a result of the statutory cap on U.S. contributions related to other donor funds.” Funding for maternal and child health, UNICEF, nutrition, family planning and reproductive health (FP/RH), global health security, the Health Reserve Fund, and Global Health Worker Initiative increased compared to FY 2024 enacted levels; all other global health areas remained flat. The bill also included an extension of PEPFAR from March 25, 2025 to September 30, 2026. See the table below for additional detail on FY 2025 Senate levels compared to the FY 2024 Omnibus as well as the FY 2025 President’s Request and FY 2025 House levels. See other budget summaries and the KFF budget tracker for details on historical annual appropriations for global health programs.
KFF Analysis of Global Health Funding in the FY25 Senate State, Foreign Operations, and Related Programs (SFOPs) Appropriations Bill
<details>
<summary>Click to expand table notes</summary>
i - Unless otherwise specified, funding amounts listed under the "State, Foreign Operations, and Related Programs (SFOPs) - Global Health" heading are provided through the Global Health Programs (GHP) account.<br>
ii - Some HIV, tuberculosis, MCH, nutrition, and global health security funding is provided under the ESF or AEECA accounts, which is not earmarked by Congress in the annual appropriations bills and is determined at the agency level.<br>
iii - The FY25 International Affairs Budget CBJ states that the Global Fund request is “expected to support a third tranche towards the Seventh Replenishment, with the three-year U.S. contribution totaling $4.8 billion to match $1 for every $2 contributed by other donors.” The FY25 House report states that this funding is “for the third installment of the seventh replenishment of the Global Fund.” The explanatory statement accompanying the FY25 Senate bill states that this funding is “for the third installment of the seventh replenishment of the Global Fund to Fight AIDS, Tuberculosis and Malaria, which is a reduction compared to the prior fiscal year level as a result of the statutory cap on U.S. contributions related to other donor funds.”<br>
iv - The FY25 International Affairs Budget CBJ states that the Gavi request “will be included as the first year of a four-year pledge towards Gavi’s next strategic cycle.” The explanatory statement accompanying the FY25 Senate bill states that this amount is for a contribution to Gavi “as a first installment of a five-year U.S. pledge of not less than $1,580,000,000 to support Gavi’s sixth strategy period.”<br>
v - The FY25 House bill eliminates funding for the International Organizations and Programs (IO&P) account, which has historically been the source of contributions to United Nations entities such as UNICEF. It is possible that funding for UNICEF may be provided through another account.<br>
vi - The FY24 final bill states that "not less than $575,000,000 should be made available for family planning/reproductive health." The explanatory statement accompanying the House FY25 SFOPs appropriations bill does not provide specific funding amounts for FPRH or GHS under the GHP account. After the funding amounts specified for all other areas (e.g., HIV, TB, MCH, etc.) are removed, $864.71 million remains under the GHP account at USAID, which is funding that could be used for FPRH and GHS (or other areas as determined by the Administration). Since the House FY25 bill text states that “of the funds appropriated by this Act, not more than $461,000,000 may be made available for family planning/reproductive health” without specifying an account, it is possible the Administration could fund all or a portion of this amount through the GHP account with the remainder directed to GHS (or other areas as determined by the Administration). The FY25 Senate bill states that “not less than $600,000,000 should be made available for family planning/reproductive health.”<br>
vii - The FY24 final and FY25 Senate bills state that if this funding is not provided to UNFPA it “shall be transferred to the ‘Global Health Programs’ account and shall be made available for family planning, maternal, and reproductive health activities.”<br>
viii - The explanatory statement accompanying the FY24 final bill states that the agreement "includes funding for a contribution to the Pandemic Fund."<br>
ix - The explanatory statement accompanying the FY24 final bill states that the agreement includes “up to $100,000,000 for a contribution to the Coalition for Epidemic Preparedness Innovations (CEPI).” The FY25 request specified that $100 million was for multilateral initiatives “such as” CEPI. The explanatory statement accompanying the FY25 House states that the Committee supports CEPI funding “at not less than the fiscal year 2024 enacted level,” which is $100 million. The explanatory statement accompanying the FY25 Senate bill states that the Committee “recommends funding for a U.S. contribution to the Coalition for Epidemic Preparedness Innovations” but does not specify an amount.<br>
x - The FY24 final bill states that “up to $70,000,000 of the funds made available under the heading ‘Global Health Programs’ may be made available for the Emergency Reserve Fund” without specifying whether this funding would come from GHS amounts or potentially other areas. The FY25 Request includes funding for the Emergency Reserve Fund under Global Health Security. The FY25 House bill states that “up to $50,000,000 of the funds made available under the heading ‘Global Health Programs’ may be made available for the Emergency Reserve Fund” without specifying whether this funding would come from GHS amounts or potentially other areas. The FY25 Senate bill states that “up to $70,000,000 of the funds made available under the heading ‘Global Health Programs’ may be made available for the Emergency Reserve Fund” without specifying whether this funding would come from GHS amounts or potentially other areas.<br>
xi - The explanatory statement accompanying the FY24 final bill states that “of the funds made available for ‘Other Public Health Threats’ … the agreement includes up to $6,000,000 for the Health Reserve Fund.” The explanatory statement accompanying the FY25 Senate bill states that “up to $10,000,000 of the funds made available for ‘Other Public Health Threats’ … be made available for the Health Reserve Fund.”<br>
xii - The explanatory statement accompanying the FY24 final bill states that “of the funds made available for ‘Other Public Health Threats’… the agreement includes not less than $10,000,000 to support the global health workforce.” The explanatory statement accompanying the FY25 Senate bill states that “not less than $20,000,000 of the funds made available for ‘Other Public Health Threats’ … be made available to support the global health workforce, which are in addition to funds made available from other program lines in the table for such purpose.”<br>
</details>
ACA Marketplace insurers are proposing a median premium increase of 7% for 2025, similar to the 6% premium increase filed for 2024, according to a new KFF analysis of the preliminary rate filings. Insurers’ proposed rate changes – most of which fall between 2% and 10% – may change during the review process.
Although the vast majority of Marketplace enrollees receive subsidies and are not expected to face these added costs, premium increases generally result in higher federal spending on subsidies. The justifications insurers provide for these premium changes also shed light on what is driving health spending more broadly.
Insurers cite growing health care prices – particularly for hospital care – as a key driver of premium growth in 2025, as well as growing use of weight loss and other specialty drugs, according to KFF’s examination of publicly-available documents.
This year, increases in the prices insurers are paying for medical care tend to affect premiums more than growth in the utilization of care. Insurers say workforce shortages and hospital market consolidation, which can put upward pressure on health care costs and prices, are increasing 2025 health insurance premiums.
Meanwhile, growing demand for Ozempic, Wegovy, and other costly GLP-1 drugs, which are used to treat diabetes and obesity, is increasing prescription drug spending.
The full analysis and other data on health costs are available on the Peterson-KFF Health System Tracker, an online information hub dedicated to monitoring and assessing the performance of the U.S. health system.
This updated analysis of insurers’ preliminary rate filings shows that ACA Marketplace insurers are requesting a median premium increase of 7% for 2025, similar to the 6% premium increase filed for 2024. Insurers cite growing health care prices – particularly for hospital care – as a key driver of premium growth in 2025, as well as growing use of weight loss and other specialty drugs, according to KFF’s examination of publicly-available documents.
Insurers’ proposed rate changes – most of which fall between 2% and 10% – may change during the review process. Although the vast majority of Marketplace enrollees receive subsidies and are not expected to face these added costs, premium increases generally result in higher federal spending on subsidies.
The analysis can be found on the Peterson-KFF Health System Tracker, an information hub dedicated to monitoring and assessing the performance of the U.S. health system.
An updated issue brief looks at the drivers of health spending in the U.S. and key differences between the U.S. and other large, wealthy nations. The analysis finds that people in the U.S. spent $5,683 more per person on health care compared to those in similarly large and wealthy countries. Almost 80% of the difference in spending came from inpatient and outpatient care costs. Many retail prescription drugs also cost more in the U.S. In 2021, the U.S. spent $1,635 per capita on prescription drugs, including over-the counter drugs, while comparable countries spent $944 on average
The analysis is available on the Peterson-KFF Health System Tracker, an online information hub dedicated to monitoring and assessing the performance of the U.S. health system.
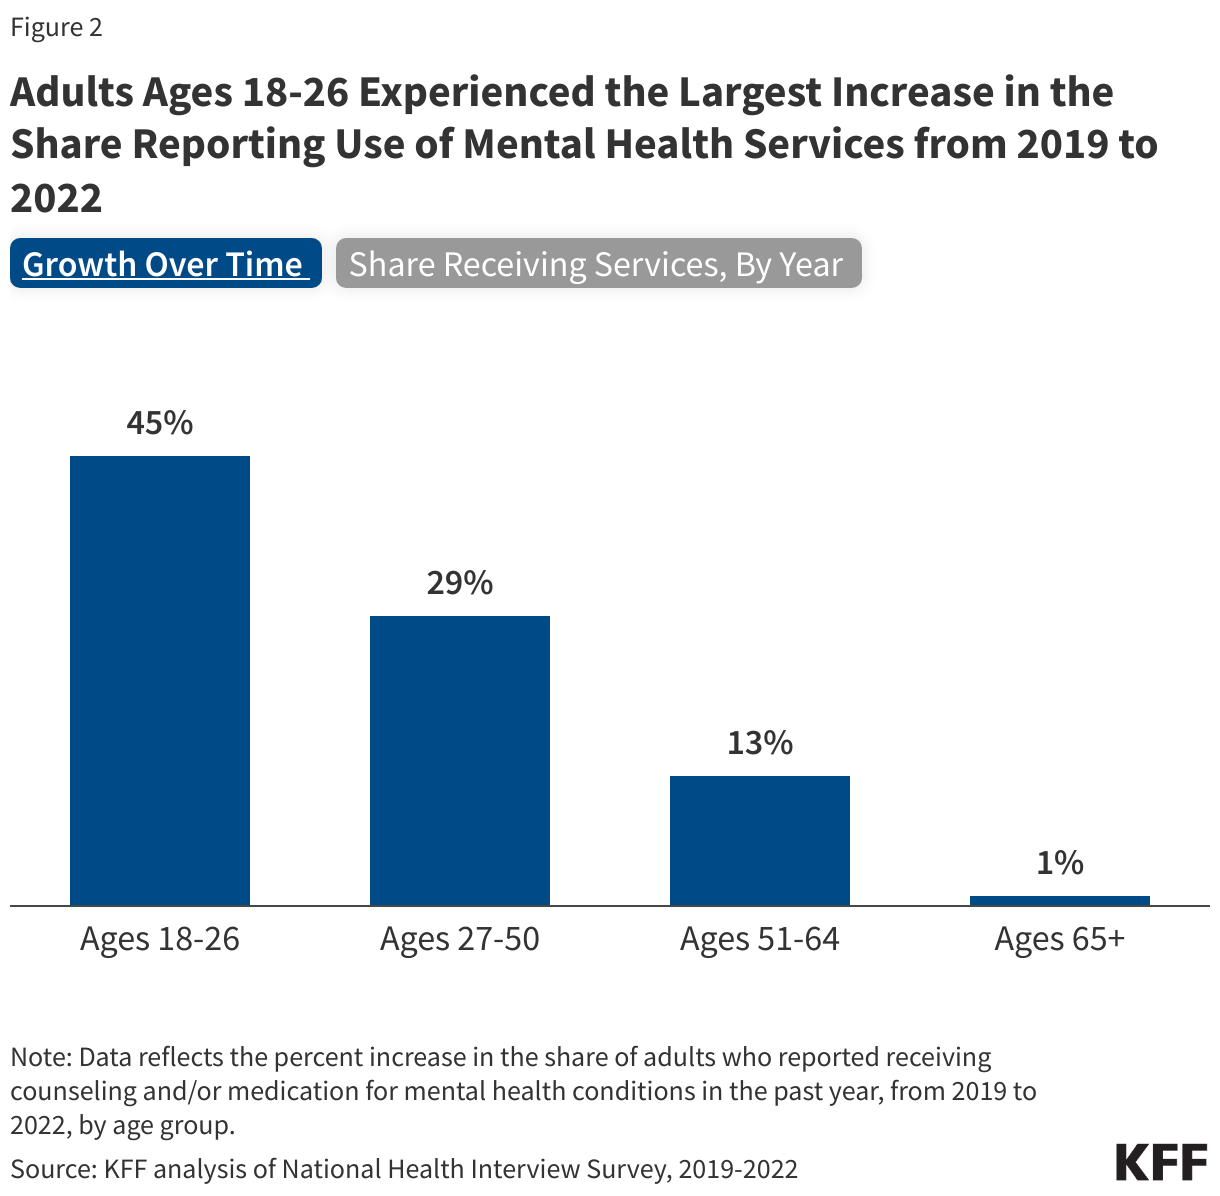
A new KFF analysis shows that the share of young adults (ages 18 to 26) receiving mental health treatment rose by 45% between 2019 and 2022 – a steeper increase than in any other age group.
More than 1 in 4 young adults (26%) received counseling and/or medication for mental health concerns in 2022, up from 18% three years earlier, according to the analysis of the most up-to-date National Health Interview Survey (NHIS) data available. That was a higher share than among adults in any other age group in 2022.
While other age groups experienced an increase in the share receiving treatment over the period as well, the increase was smaller: 29% for adults ages 27-50, 13% for adults ages 51-64, and 1% for adults 65 and above.
The spike in utilization among young adults roughly coincided with the onset and most challenging years of the COVID-19 pandemic – when school and work were significantly disrupted – although utilization of mental health services had been increasing even before the pandemic. Even so, research shows that among young adults with mental health conditions, many still report not receiving treatment.
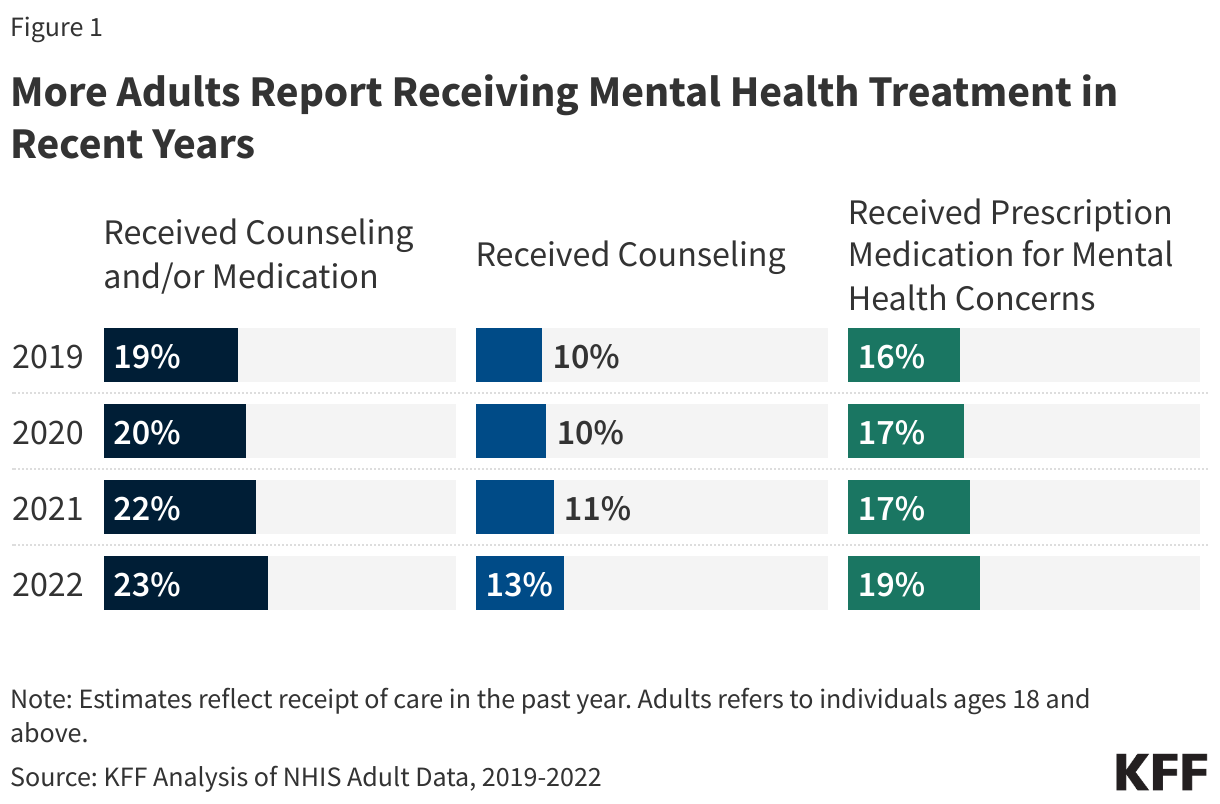
Overall, 23% of adults received mental health treatment in 2022, up from 19% in 2019, the analysis showed. Specifically, the share of all adults saying they received mental health counseling rose from 10% in 2019 to 13% in 2022. At the same time, the share of adults reporting they took prescription medication for mental health conditions increased from 16% to 19%.
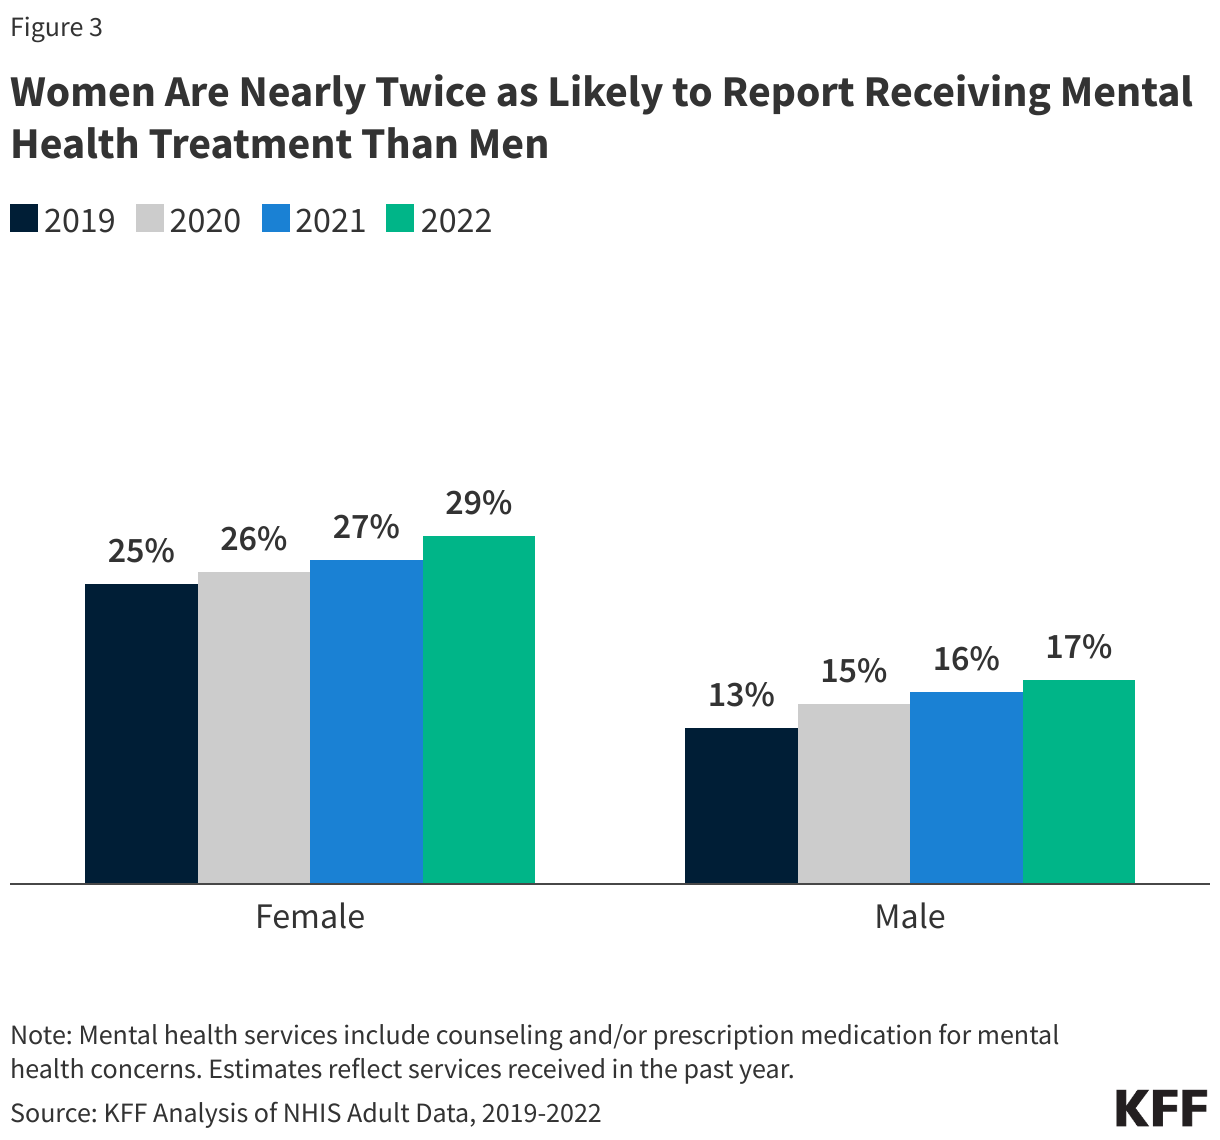
The analysis shows that women were nearly twice as likely as men to report receiving mental health treatment in the past year (29% vs. 17% in 2022). Other research suggests that men may be less likely to seek mental health care than women, and they are more likely to be uninsured and less likely to report a usual source of health care.
Other key takeaways include:
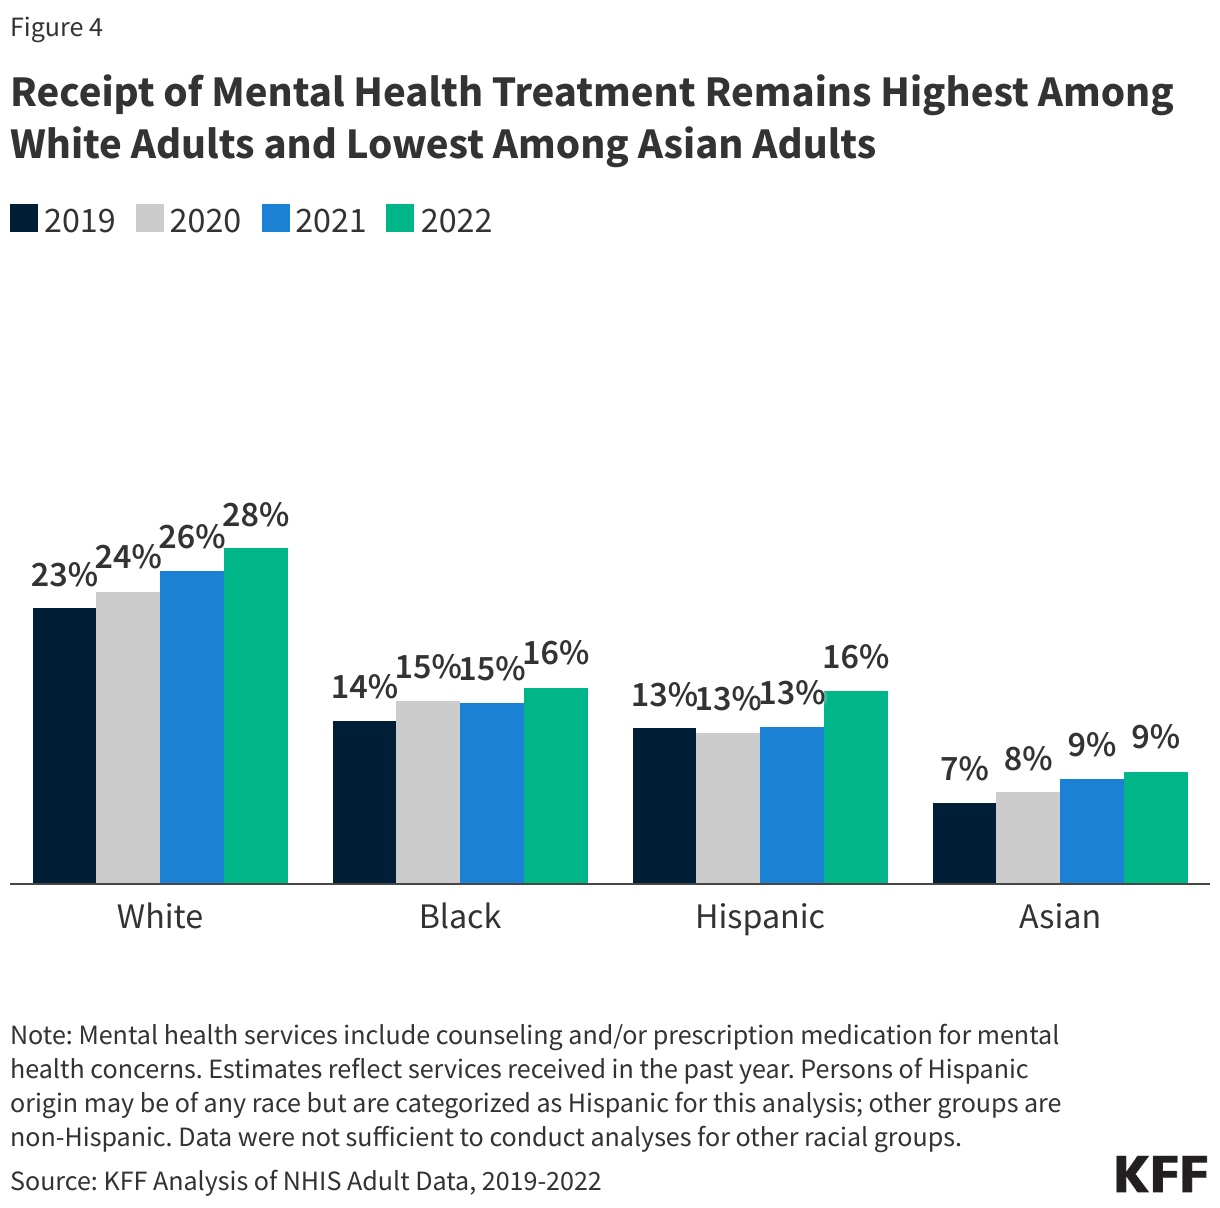
Across racial and ethnic groups, the share of people who said they received mental health treatment in 2022 was highest among White adults (28%) and lowest among Asian adults (9%). That compared to 16% each among Hispanic adults and Black adults.
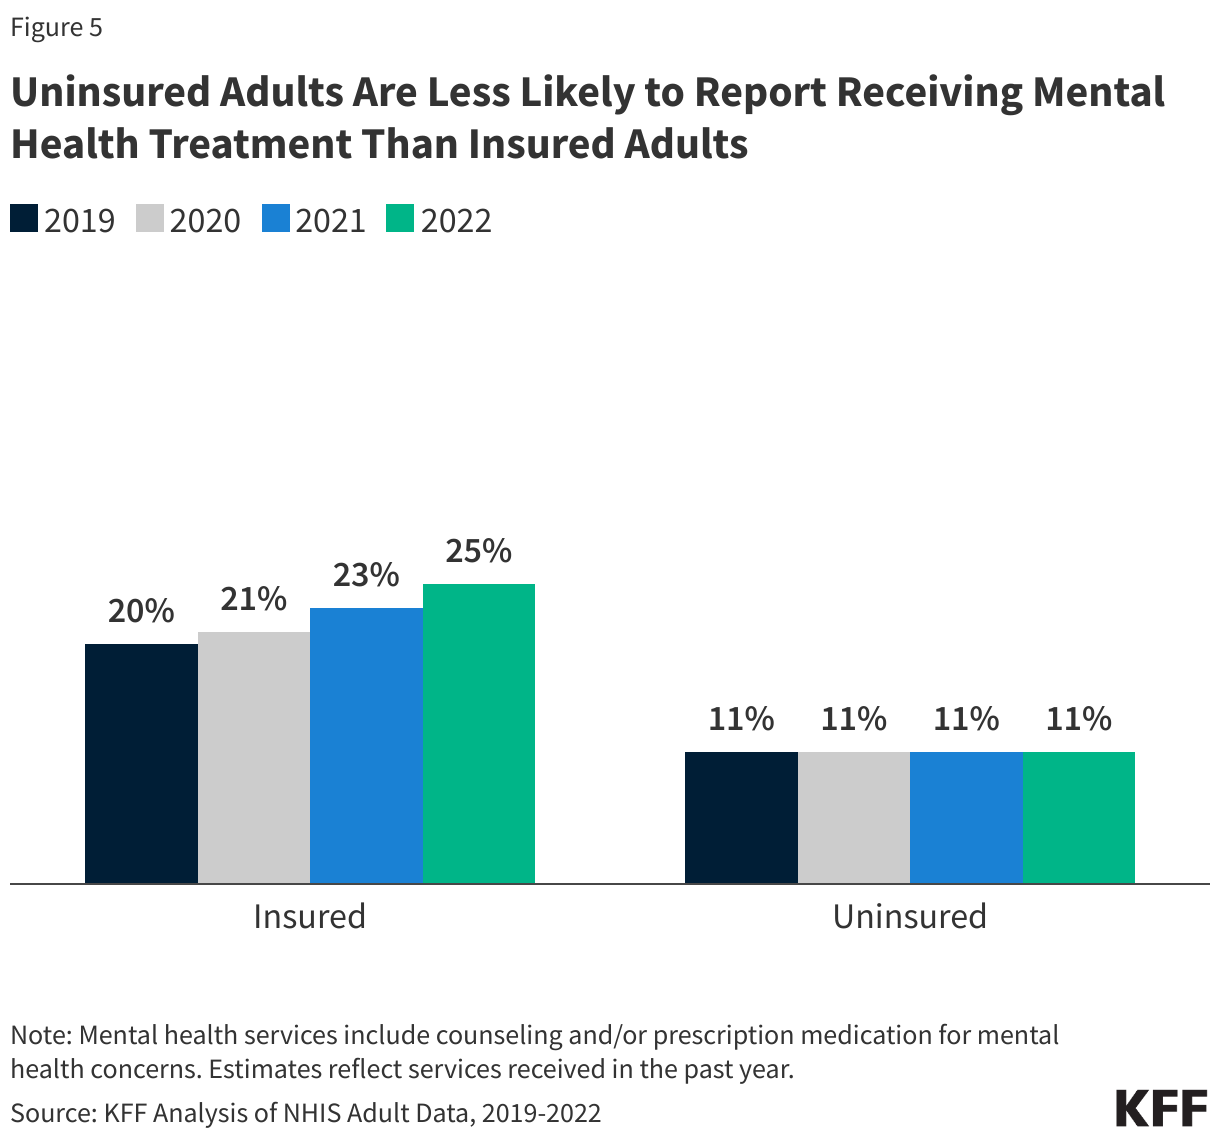
Adults with insurance coverage are more likely to report receiving mental health care in the past year than adults without insurance coverage (25% vs. 11% in 2022).
Many people in the United States experience mental health conditions, which raises questions about mental health service utilization patterns and what barriers exist with connecting people to services. Prior research suggests that mental health service utilization increased over time. This analysis explores more recent data, from 2019 to 2022, to understand the latest trends in utilization of mental health services and how it differs by demographics and insured status. In this analysis, receipt of mental health care is measured as the share of people who say they received mental health counseling and/or prescription medication for mental health concerns in the last year. Estimates shown are KFF analyses of National Health Interview Survey (NHIS) data among adults in the U.S. from 2019 to 2022.
In 2022, 23% of adults received mental health treatment, up from 19% in 2019 (Figure 1). Specifically, the share of adults saying they received mental health counseling in the past year increased from 10% in 2019 to 13% in 2022. Similarly, the share of adults reporting they took prescription medication for mental health conditions increased from 16% to 19% during the same period. Receipt of prescription medication remained consistently higher than counseling (19% vs. 13%, respectively, in 2022).
<span dir="ltr" class="ui-provider a b c d e f g h i j k l m n o p q r s t u v w x y z ab ac ae af ag ah ai aj ak">More Adults Report Receiving Mental Health Treatment in Recent Years</span>
Estimates reflect receipt of care in the past year. Adults refers to individuals ages 18 and above.
KFF Analysis of NHIS Adult Data, 2019-2022
Compared to older adults, young adults (ages 18-26) were more likely to receive mental health treatment and experienced the highest increase in receipt of treatment over time. In 2022, 26% of young adults reported receiving counseling and/or prescription medications for mental health conditions in the past year, representing a significantly higher share compared to all other adults (ages 27 and above) (Figure 2).
Young adults also experienced the largest percent increase in the share of adults receiving mental health treatment from 2019 to 2022 (45%), followed by adults ages 27-50 (29%), 51-64 (13%), and 65 and above (1%) (Figure 2). Although receipt of mental health services has increased among young adults in recent years, other KFFanalyses found that leading up to the pandemic, many young adults with mental health conditions did not receive treatment. The lack of treatment among this population may be linked to costs, transitioning from pediatric to adult health care, and difficulties accessing mental health services in college settings.
Adults Ages 18-26 Experienced the Largest Increase in the Share Reporting Use of Mental Health Services from 2019 to 2022
Growth Over Time
Share Receiving Services, By Year
Data reflects the percent increase in the share of adults who reported receiving counseling and/or medication for mental health conditions in the past year, from 2019 to 2022, by age group.
KFF analysis of National Health Interview Survey, 2019-2022
The Share of Adults Reporting Use of Mental Health Services From 2019-2022, by Age Group
Growth Over Time
Share Receiving Services, By Year
Mental Health Services refers to mental health counseling and/or prescription medical for mental health concerns in the past year.
KFF Analysis of NHIS Adult Data, 2019-2022
Women are nearly twice as likely to report receiving mental health treatment in the past year compared to men. In 2022, 29% of women reported receiving mental health services, compared to 17% of men (Figure 3). Researchsuggests men may be less likely to seek mental health care than women. Men are also more likely to be uninsured and less likely to report a usual source of health care. Separately, women are more likely than men to report experiencing mental health disorders, including serious mental illness.
Women Are Nearly Twice as Likely to Report Receiving Mental Health Treatment Than Men
Mental health services include counseling and/or prescription medication for mental health concerns. Estimates reflect services received in the past year.
KFF Analysis of NHIS Adult Data, 2019-2022
Across racial and ethnic groups, past year receipt of mental health treatment was highest among White adults and lowest among Asian adults. In 2022, 28% of White adults reported receiving counseling and/or prescription medication for mental health conditions in the past year, compared to 16% of Hispanic and Black adults and 9% of Asian adults. A recent KFF poll found that, compared to their White peers, Hispanic, Black, and Asian adults disproportionately report challenges with mental health care utilization, including finding a provider who can understand their background and experiences, lack of information, and stigma or embarrassment. Additionally, the lack of a diverse mental health care workforce, absence of culturally informed treatment options, and stereotypes and discrimination associated with poor mental health may also contribute to limited mental health treatment among Black and Asian adults. Specifically among Asian people, cultural attitudes towards mental health are a factor that may lead to both lower reporting of mental health concerns and lower service utilization.
Receipt of Mental Health Treatment Remains Highest Among White Adults and Lowest Among Asian Adults
Mental health services include counseling and/or prescription medication for mental health concerns. Estimates reflect services received in the past year. Persons of Hispanic origin may be of any race but are categorized as Hispanic for this analysis; other groups are non-Hispanic. Data were not sufficient to conduct analyses for other racial groups.
KFF Analysis of NHIS Adult Data, 2019-2022
Adults with insurance coverage are more likely to report past year receipt of mental health care than adults without insurance coverage (25% vs. 11% in 2022, Figure 5). Despite higher utilization of mental health care over time – driven by insured adults – challenges remain with accessing services. For instance, KFF’s 2023 Consumer Survey found that 43% of insured adults with mental health concerns said there was a time in the past year when they did not get the mental health treatment they thought they needed, and 45% gave their insurance a negative rating for the availability of mental health providers. Further, KFF’s 2023 Employer Health Benefits Survey found that among employers offering health benefits, a higher share reported having a sufficient number of primary care providers in their plan’s networks (91%) compared to those who reported having a sufficient number of behavioral health care providers (67%).
Uninsured Adults Are Less Likely to Report Receiving Mental Health Treatment Than Insured Adults
Mental health services include counseling and/or prescription medication for mental health concerns. Estimates reflect services received in the past year.
KFF Analysis of NHIS Adult Data, 2019-2022
This work was supported in part by the Well Being Trust. KFF maintains full editorial control over all of its policy analysis, polling, and journalism activities.
The Inflation Reduction Act of 2022 includes several provisions to lower prescription drug costs for people with Medicare and reduce drug spending by the federal government, including several changes to the Part D benefit. These changes, including a new $2,000 cap on out-of-pocket drug spending, will help to lower out-of-pocket costs for Part D enrollees but could also make it harder for some Part D plan sponsors to offer low-priced coverage, particularly sponsors of stand-alone prescription drug plans (PDPs).
In anticipation of potential premium increases by Part D sponsors to cover higher costs associated with a more generous Part D drug benefit, the Inflation Reduction Act included a provision designed to help limit annual premium increases. Specifically, the law caps growth in the base beneficiary premium to no more than 6% above the prior year’s amount, though it is important to note that the base premium is not the same as the individual plan-level premiums charged by Part D sponsors and paid by Part D enrollees. In addition, the Centers for Medicare & Medicaid Services (CMS) made changes to the Part D payment methodology for 2025 to better reflect expected increases in plan liability for the redesigned Part D benefit, with the goal of enhancing market stability. CMS has also announced a new voluntary demonstration to provide additional premium stabilization and enhanced protection against the risk of losses to stand-alone PDPs (see details below).
These FAQs provide context for understanding Medicare Part D premiums in 2025 and changes in recent years. While the impact of the Part D benefit redesign changes on the 2025 Part D market is unknown at this time, premiums for individual Part D plans are likely to continue to vary and annual plan-level premium increases may be higher or lower than 6% for 2025, as they were for 2024. The fall open enrollment period will present all Part D enrollees with the opportunity to evaluate their coverage and determine whether there are lower-cost plan options that meet their needs.
Key Takeaways
Changes to the Part D benefit in the Inflation Reduction Act will mean lower out-of-pocket costs for Part D enrollees but higher costs for Part D plans overall, leading to concerns about possible premium increases.
CMS is taking steps to mitigate potential premium increases through a new demonstration program for stand-alone drug plans, as well as payment changes designed to bring greater stability to the Part D market in 2025.
The Inflation Reduction Act includes a provision to cap growth in the base beneficiary premium to 6%. For 2025, the base premium is $36.78, an increase of $2.08 or 6% over the 2024 base premium. Although this 6% cap doesn’t apply to the individual premiums that plans charge, it does help to limit premium increases.
Actual Part D plan premiums for 2025 are not yet known and will be announced in September, but premiums are expected to vary, with lower monthly premiums for Medicare Advantage drug plans than stand-alone drug plans, on average, as in 2024. The annual open enrollment period, which runs from October 15 to December 7, presents an opportunity for Part D enrollees to compare plans and shop for lower-priced coverage that meets their needs.
How is the Part D benefit changing for 2025?
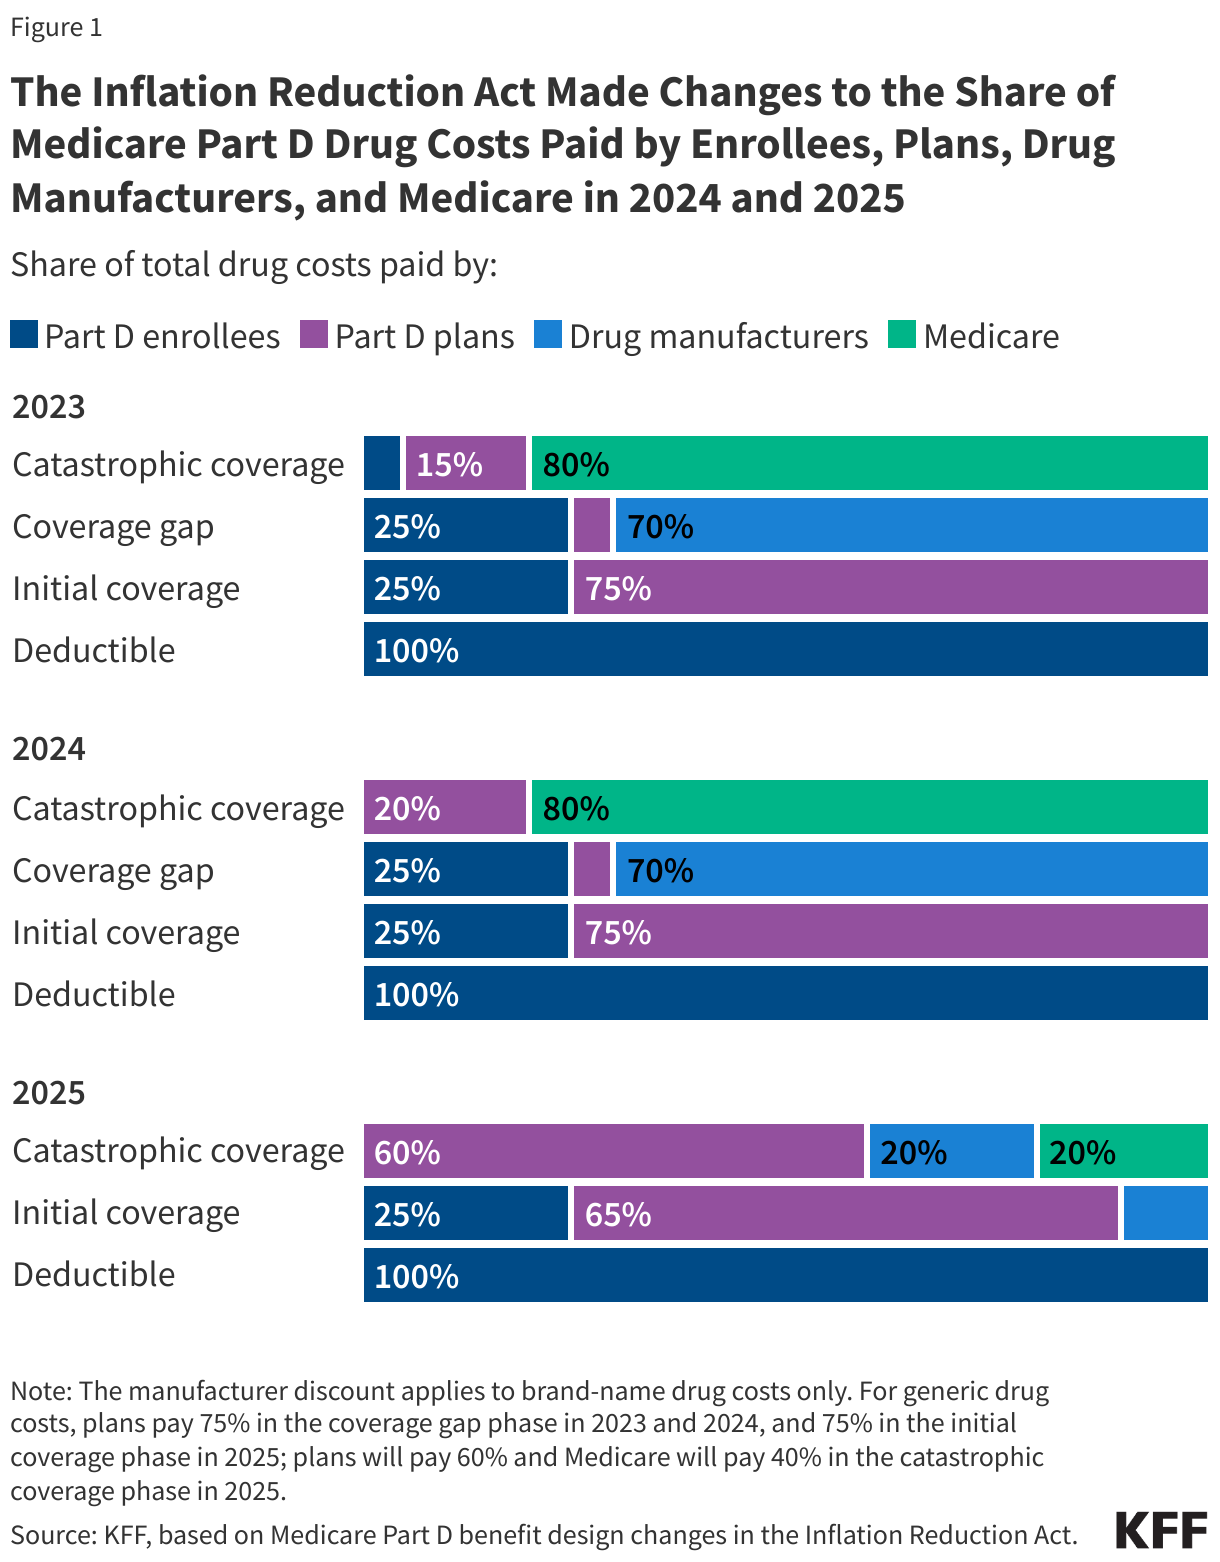
The Inflation Reduction Act includes a number of changes to the Medicare Part D drug benefit, including a new $2,000 cap on out-of-pocket drug spending in 2025 for enrollees in Medicare Part D plans. It also requires Part D plans and drug manufacturers to pay a greater share of costs for Part D enrollees with drug costs in the catastrophic coverage phase (above the $2,000 spending cap) and reduces Medicare’s reinsurance liability. The law also eliminates the coverage gap phase as of 2025, where enrollees are currently responsible for paying 25% of their drug costs, drug manufacturers provide a 70% price discount on brand-name drugs, and plans pay 5% of costs.
As of 2025, once enrollees have met their deductible (if their plan includes one), they will enter the initial coverage phase, where they will face cost sharing of 25% under the standard benefit (as in 2024), manufacturers will provide a 10% price discount, and Part D plans will pay 65% (Figure 1). Once enrollees reach the out-of-pocket spending cap and enter the catastrophic coverage phase, plans will be required to pay 60% of drug costs, up from 20% in 2024, and drug manufacturers will be required to provide a 20% price discount on brand-name drugs. Medicare’s share of total costs in the catastrophic phase will decrease from 80% to 20% for brand-name drugs and from 80% to 40% for generic drugs.
Although Part D plans will be taking on additional liability for high drug costs in 2025, Medicare will continue to limit their liability for higher-than-expected drug costs through risk corridors, a risk sharing mechanism that has been in place since the Part D program started in 2006. In addition, CMS is launching a new voluntary demonstration to provide enhanced risk-corridor protection against overall losses for participating stand-alone PDPs to help stabilize the market (see details below).
The Inflation Reduction Act Made Changes to the Share of Medicare Part D Drug Costs Paid by Enrollees, Plans, Drug Manufacturers, and Medicare in 2024 and 2025
Share of total drug costs paid by:
The manufacturer discount applies to brand-name drug costs only. For generic drug costs, plans pay 75% in the coverage gap phase in 2023 and 2024, and 75% in the initial coverage phase in 2025; plans will pay 60% and Medicare will pay 40% in the catastrophic coverage phase in 2025.
KFF, based on Medicare Part D benefit design changes in the Inflation Reduction Act.
What is known about Part D premiums for 2025?
CMS announced the Part D base beneficiary premium for 2025 on July 29, 2024 (this announcement typically occurs at the end of July each year). For 2025, the base beneficiary premium is $36.78, an increase of $2.08, or 6%, over the 2024 base premium of $34.70. A provision in the Inflation Reduction Act capped annual growth in the base beneficiary premium to 6% over the prior year’s amount (see details below).
The base premium is calculated as a share of average plan bids for basic Part D benefits submitted by both stand-alone PDPs and Medicare Advantage drug plans (MA-PDs). All Part D plans submit a bid for basic benefits, while plans that offer enhanced benefits, such as a lower Part D deductible, also report the portion of their bid that is for basic versus enhanced benefits. (In 2024, most Part D enrollees were in enhanced plans: 72% of all Part D enrollees, including 79% of MA-PD enrollees and 62% of PDP enrollees). Each year, CMS averages standardized bids submitted by PDPs and MA-PDs to cover basic Part D benefits and calculates the National Average Monthly Bid Amount, or NAMBA. The calculation of the base beneficiary premium is based on the national average bid adjusted for individual reinsurance subsidies. Because the base premium is an average across both types of plans and reflects the cost of basic benefits only, this amount does not equal what a Part D enrollee will pay for coverage in any given Part D plan.
Actual premiums for Part D plans available in 2025 will be released in September, as they are every year, just prior to the October 1 start date of marketing for the coming plan year and the open enrollment period that runs from October 15 to December 7.
How will the new CMS demonstration help to stabilize the Part D market for 2025?
CMS has announced new premium stabilization measures for stand-alone PDPs as part of a voluntary Section 402 demonstration program that will be in effect for 2025 and two additional years (though the exact parameters may vary beyond 2025). Because CMS observed more variation in plan bids for 2025 among PDPs than MA-PDs, the new Part D Premium Stabilization Demonstration is targeted exclusively to PDPs. CMS’s rationale for this demonstration is to stabilize the PDP market in the initial transition years of the Inflation Reduction Act’s Part D benefit improvements, and to test whether the premium changes and revised risk corridors “increase the efficiency and economy” of services as the law’s Part D benefit changes are fully implemented. Similar Section 402 demonstrations were conducted under the George W. Bush Administration in the early years of Part D as the program was being rolled out.
The Part D Premium Stabilization Demonstration has three components for PDPs that choose to participate:
Lowers the base beneficiary premium by $15 (or less if a $15 reduction would result in a plan premium of less than $0).
Limits total Part D premium increases to $35 between 2024 and 2025 (applied after taking into account the $15 reduction in the base beneficiary premium).
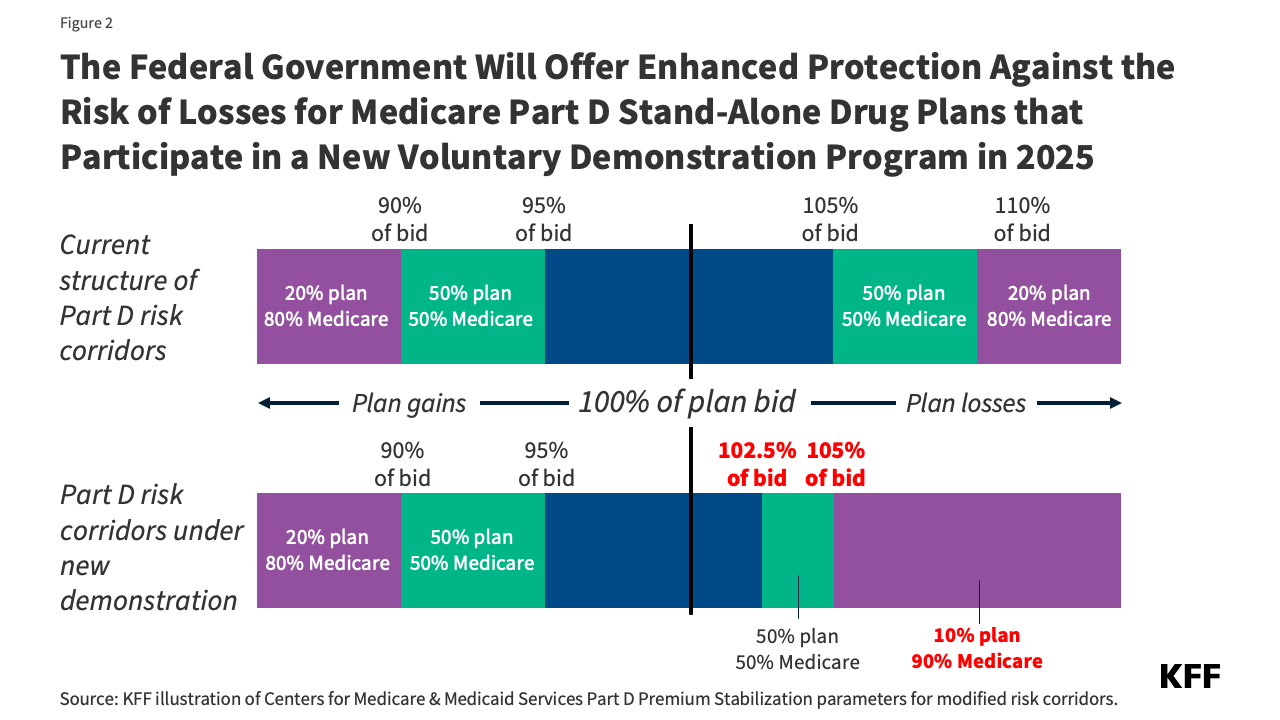
Narrows the upper thresholds of the risk corridors to reduce the range of spending where PDPs bear full risk for actual costs higher than their bids and increases the government’s risk sharing for a portion of plan losses from 80% to 90% (Figure 2).
What is the Inflation Reduction Act’s Part D premium stabilization provision and what impact has it had to date?
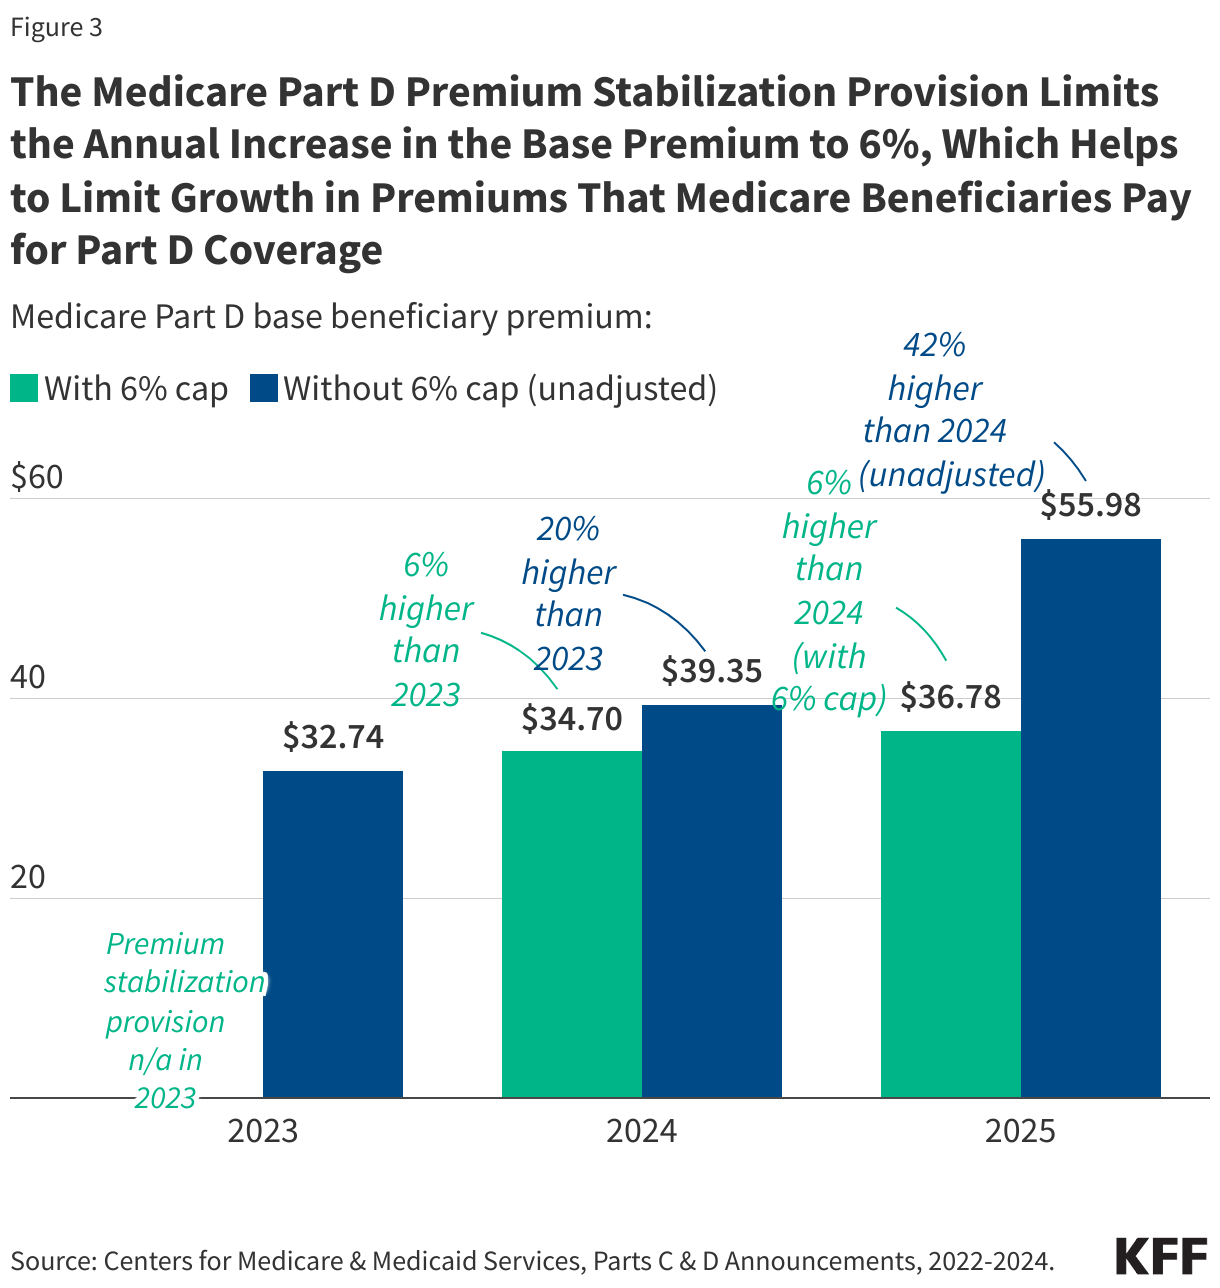
Beginning in 2024, the premium stabilization provision of the Inflation Reduction Act caps annual growth in the Part D base beneficiary premium at 6%. For 2024, the first year the premium stabilization provision was in effect, the Part D base beneficiary premium was $34.70, a 6% increase over the 2023 amount of $32.74 (Figure 3). Without the premium stabilization provision, the 2024 base beneficiary premium would have been $39.35, an increase of 20%, reflecting a higher average monthly bid amount for basic Part D coverage in 2024 ($68.28) than in 2023 ($34.71).
For 2025, the Part D base beneficiary premium is $36.78, capped at a 6% increase over the 2024 amount. Without premium stabilization, the 2025 base premium would have been $55.98, 42% higher than the 2024 unadjusted base premium (61% higher than the base premium with the 6% cap in 2024). Between 2024 and 2025, the average monthly bid amount for basic benefits increased from $64.28 to $179.45. (See below for examples of how the 6% cap on the base premium helps to limit growth in premiums paid by enrollees for two hypothetical plans.)
The Medicare Part D Premium Stabilization Provision Limits the Annual Increase in the Base Premium to 6%, Which Helps to Limit Growth in Premiums That Medicare Beneficiaries Pay for Part D Coverage
Medicare Part D base beneficiary premium:
Centers for Medicare & Medicaid Services, Parts C & D Announcements, 2022-2024.
What other changes has CMS adopted to help to limit Part D premium increases for 2025?
In addition to the premium stabilization measures described above, CMS has also made changes to its plan payment methodologies for the 2025 plan year. While technical in nature, these changes are designed to enhance market stability through an improved payment methodology that accounts for the substantial changes to the Part D benefit for 2025.
Updates to the Part D risk adjustment model: The Part D risk adjustment model predicts plan liability for prescription drugs. The model is used to determine the amount of “direct subsidy” prospective payments that Part D plans receive from the federal government, which are adjusted for the health status of a plan’s enrollees. Enrollees with higher risk scores (which vary above and below an average of 1.0) translate to higher expected plan costs and higher subsidy payments. For 2025, CMS took steps to improve the predictive ability of the Part D risk adjustment model, including by recalibrating the model based on more current diagnosis and spending data than used in previous years.
Using different normalization factors for MA-PDs and PDPs: For individual Part D enrollees, risk scores are calculated based on individual demographic and disease factors, and then adjustments are applied, including a “normalization factor.” New for 2025, CMS is applying different normalization factors for MA-PDs and PDPs, which will have the effect of increasing PDP risk scores relative to what they would have been otherwise. Historically, due to differences in coding and utilization patterns across both types of plans, the Part D risk adjustment model has underpredicted costs for PDP plans and overpredicted costs for MA-PD plans, which has had the effect of increasing standardized plan bids (and premiums) for PDPs relative to MA-PDs. Using separate normalization factors is expected to increase PDP risk scores, which would lead to higher direct subsidy payments, which could mitigate potential premium increases to help stabilize the PDP market. Because MA-PD sponsors can use rebate dollars from Medicare payments to lower or eliminate their Part D premiums, most MA-PD enrollees pay no premium for their Part D drug coverage (see details below).
What factors contributed to the increase in plan bids for basic benefits since 2023?
For 2025, the new $2,000 out-of-pocket spending cap and the increase in Part D plan liability for drug costs incurred by enrollees above the cap, combined with the reduction in Medicare reinsurance, as explained above, are factors in the higher national average monthly plan bid. CMS has emphasized that while the NAMBA increased substantially for 2025, this will be accompanied by substantially higher upfront payments from the government to plans in the form of direct subsidies for basic benefits covered by the plan – a shift from previous years when reinsurance payments accounted for a much larger share of Part D spending than direct subsidy payments. CMS estimates that the average direct subsidy payment will be $142.67, or 80% of the national average bid amount of $179.45.
For 2024, part of the explanation for the higher national average bid for basic benefits was the elimination of Part D enrollees’ 5% coinsurance requirement for drug costs in the catastrophic coverage phase and the increase in plans’ share of these costs from 15% to 20%. Another factor was a revision to the definition of Part D’s “negotiated price” that took effect in 2024 (not to be confused with the new drug price negotiation program established by the Inflation Reduction Act). The definition of negotiated price has been in place since the start of Part D, and it matters because this is the price upon which beneficiary cost sharing is based at the point of sale, which is particularly relevant when enrollees face a coinsurance requirement. Under the change, plans are now required to pass along all price concessions they receive from pharmacies, which help to lower the plan’s total costs, to enrollees at the point of sale. Enrollees will benefit from this change in the form of lower out-of-pocket drug costs, but plans were expected to face higher costs and lower revenues.
What do Part D premiums look like in 2024?
While the impact of the Part D benefit redesign changes on the 2025 Part D market is currently unknown, premiums for individual Part D plans are likely to continue to vary in 2025, as they do in 2024 – ranging from $0 to $100 per month or more. This is in part why Part D enrollees are encouraged to shop for plans during the annual open enrollment period in the fall.
The lower MA-PD average premium is heavily weighted by the predominance of zero-premium plans in the MA-PD market, because, as noted above, MA-PD sponsors can use rebate dollars from Medicare payments to lower or eliminate their Part D premiums. For 2024, all Medicare beneficiaries had access to zero-premium MA-PD plans – 27 on average – whereas only 1 PDP was available for zero premium for non-LIS enrollees in only 14 out of 34 PDP regions.
Even with changes to the Part D benefit between 2023 and 2024 that increased plan liability, the average monthly premium for Part D coverage across both plan types combined was the same in both years ($25) (Figure 4). The average MA-PD premium decreased by $1 (from $10 to $9), while the average PDP premium increased by $3 (from $40 to $43).
The $43 average PDP premium is based on enrollment in March 2024 after the end of open enrollment. This amount is lower than the estimated $48 premium for 2024, which was calculated in the fall of 2023 before open enrollment for 2024 and did not account for plan switching by current enrollees or plan choices by new enrollees during the open enrollment period. The fact that the actual average PDP premium for 2024 is lower than the estimated premium indicates that some PDP enrollees opted for lower-premium plans during open enrollment.
What share of Part D enrollees pay no premium for drug coverage?
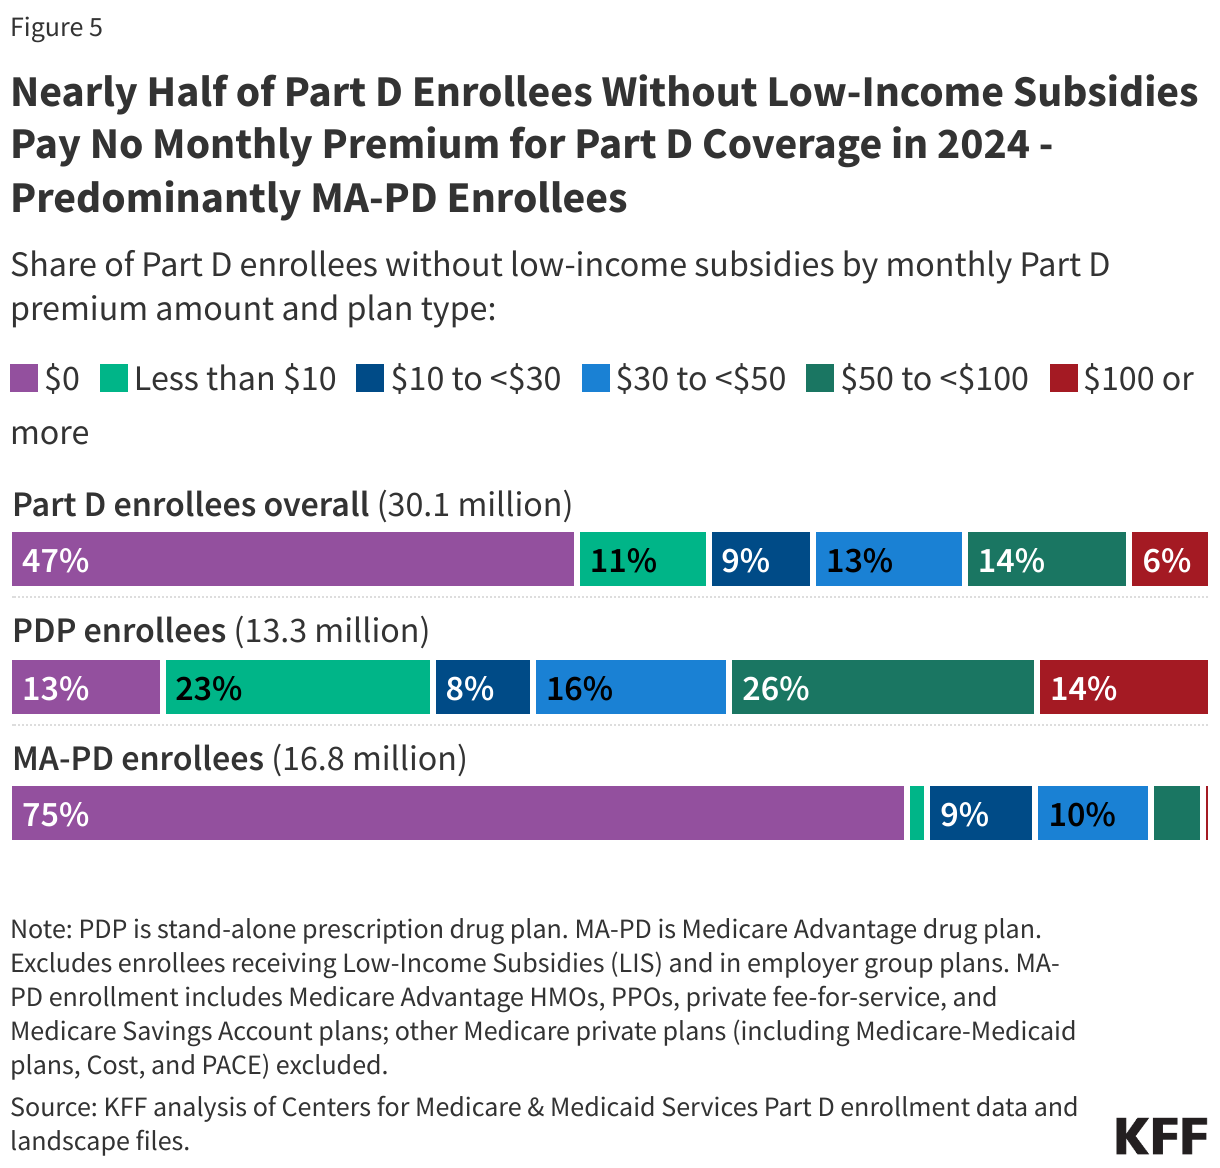
Overall, nearly half of the 30.1 million Part D enrollees who are not receiving Part D low-income subsidies (LIS), or 14.3 million enrollees, pay no premium for their drug coverage in 2024 (Figure 5). The share of Part D enrollees paying no premium is heavily weighted by MA-PD enrollees. In 2024, three-quarters of MA-PD enrollees without LIS pay no premium for their drug coverage compared to 13% of PDP enrollees.
Nearly Half of Part D Enrollees Without Low-Income Subsidies Pay No Monthly Premium for Part D Coverage in 2024 - Predominantly MA-PD Enrollees
Share of Part D enrollees without low-income subsidies by monthly Part D premium amount and plan type:
PDP is stand-alone prescription drug plan. MA-PD is Medicare Advantage drug plan. Excludes enrollees receiving Low-Income Subsidies (LIS) and in employer group plans. MA-PD enrollment includes Medicare Advantage HMOs, PPOs, private fee-for-service, and Medicare Savings Account plans; other Medicare private plans (including Medicare-Medicaid plans, Cost, and PACE) excluded.
KFF analysis of Centers for Medicare & Medicaid Services Part D enrollment data and landscape files.
How does the Inflation Reduction Act premium stabilization provision help to limit growth in Part D premiums?
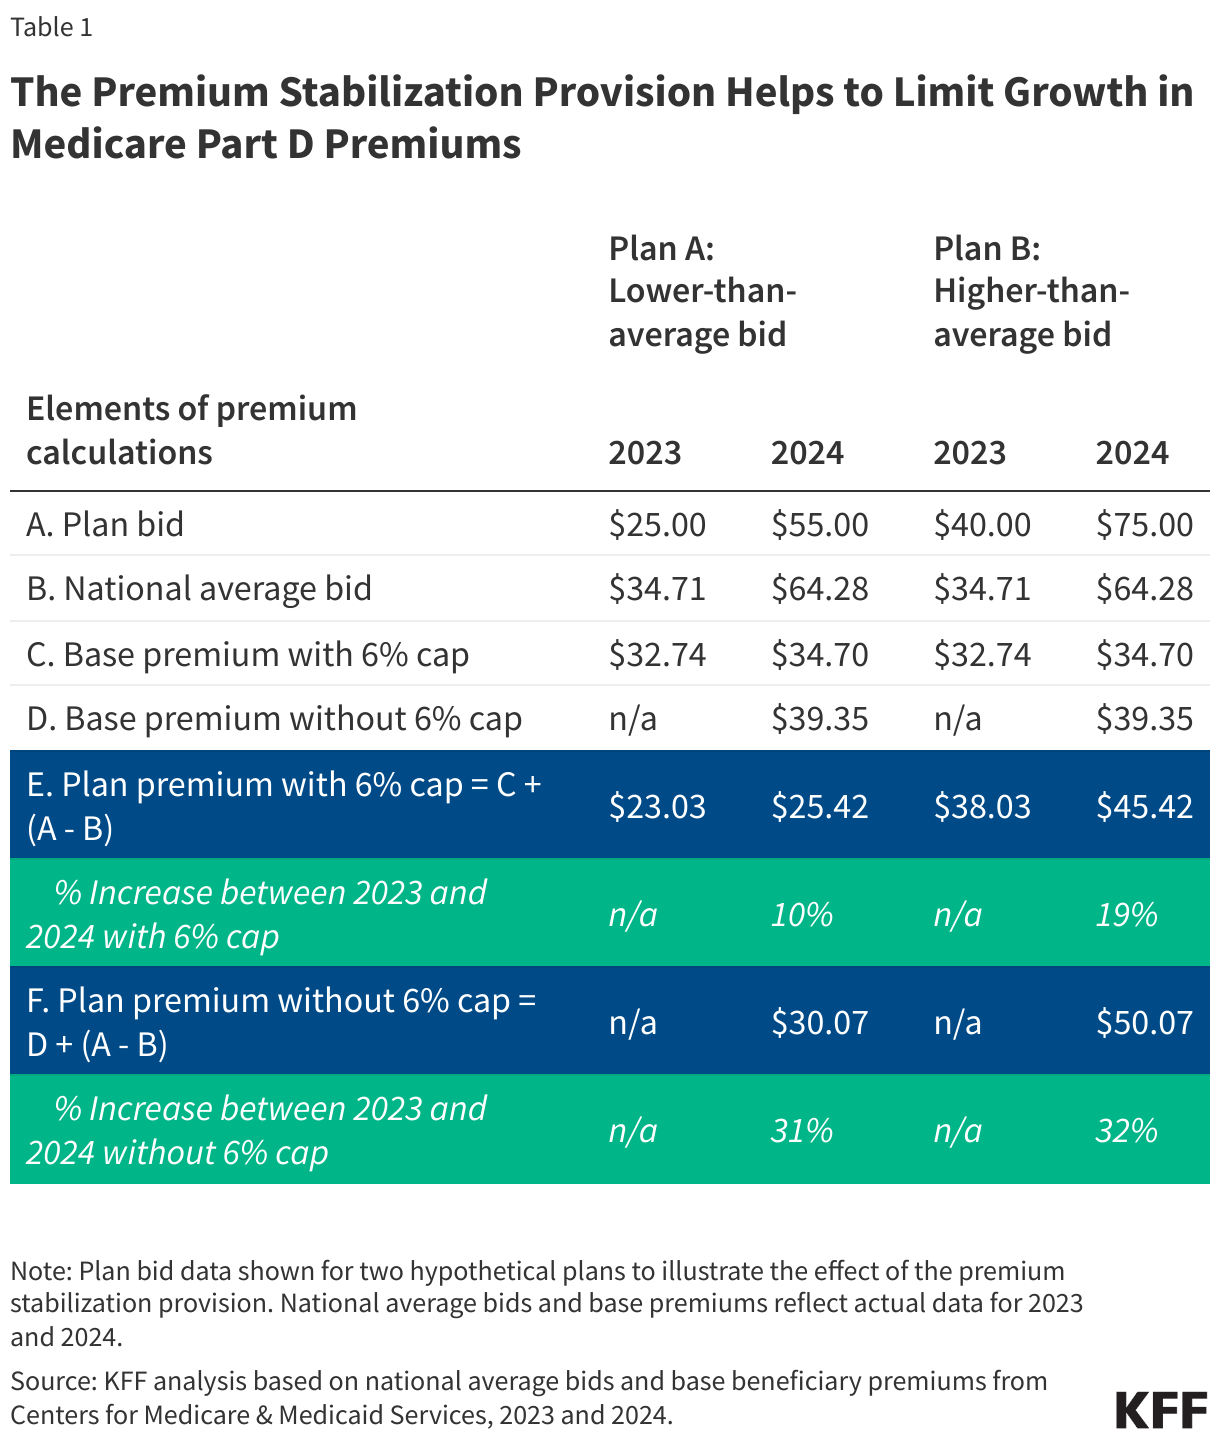
The premium for an individual plan is calculated as the base premium plus the difference between the plan’s bid and the national average bid (the NAMBA). Examples with two hypothetical plans illustrate how the 6% cap on growth in the base premium limits premium growth for an individual plan (Table 1).
For both plans, the 6% premium stabilization cap mitigates the increase in plan premiums between 2023 and 2024. For Plan A, with the 6% cap in effect, the premium increased by 10%, but without the 6% stabilization cap, the premium would have increased by 31%. Similarly, for Plan B, the 6% cap limits premium growth to 19%, compared to a 32% increase without the cap.
The Premium Stabilization Provision Helps to Limit Growth in Medicare Part D Premiums
Plan bid data shown for two hypothetical plans to illustrate the effect of the premium stabilization provision. National average bids and base premiums reflect actual data for 2023 and 2024.
KFF analysis based on national average bids and base beneficiary premiums from Centers for Medicare & Medicaid Services, 2023 and 2024.
This work was supported in part by Arnold Ventures. KFF maintains full editorial control over all of its policy analysis, polling, and journalism activities.
In recent years, there have been growing concerns about children’s mental health and well-being, particularly since the COVID-19 pandemic and with a rise in awareness and exposure to racism and discrimination amid instances of racial injustice, including the killings of George Floyd and Breonna Taylor, and growth in anti-Asian sentiment. Previous reporting from KFF’s Racism, Discrimination, and Health Survey examined experiences with and impacts of unfair treatment and discrimination, access to and use of mental health care, and loneliness and social support networks among adults. Based on responses from parents, this analysis examines parents’ assessments of their children’s mental health and well-being, children’s use of mental health care, children’s experiences with unfair treatment, and parents’ worries about their children as well as their hopes for their future.
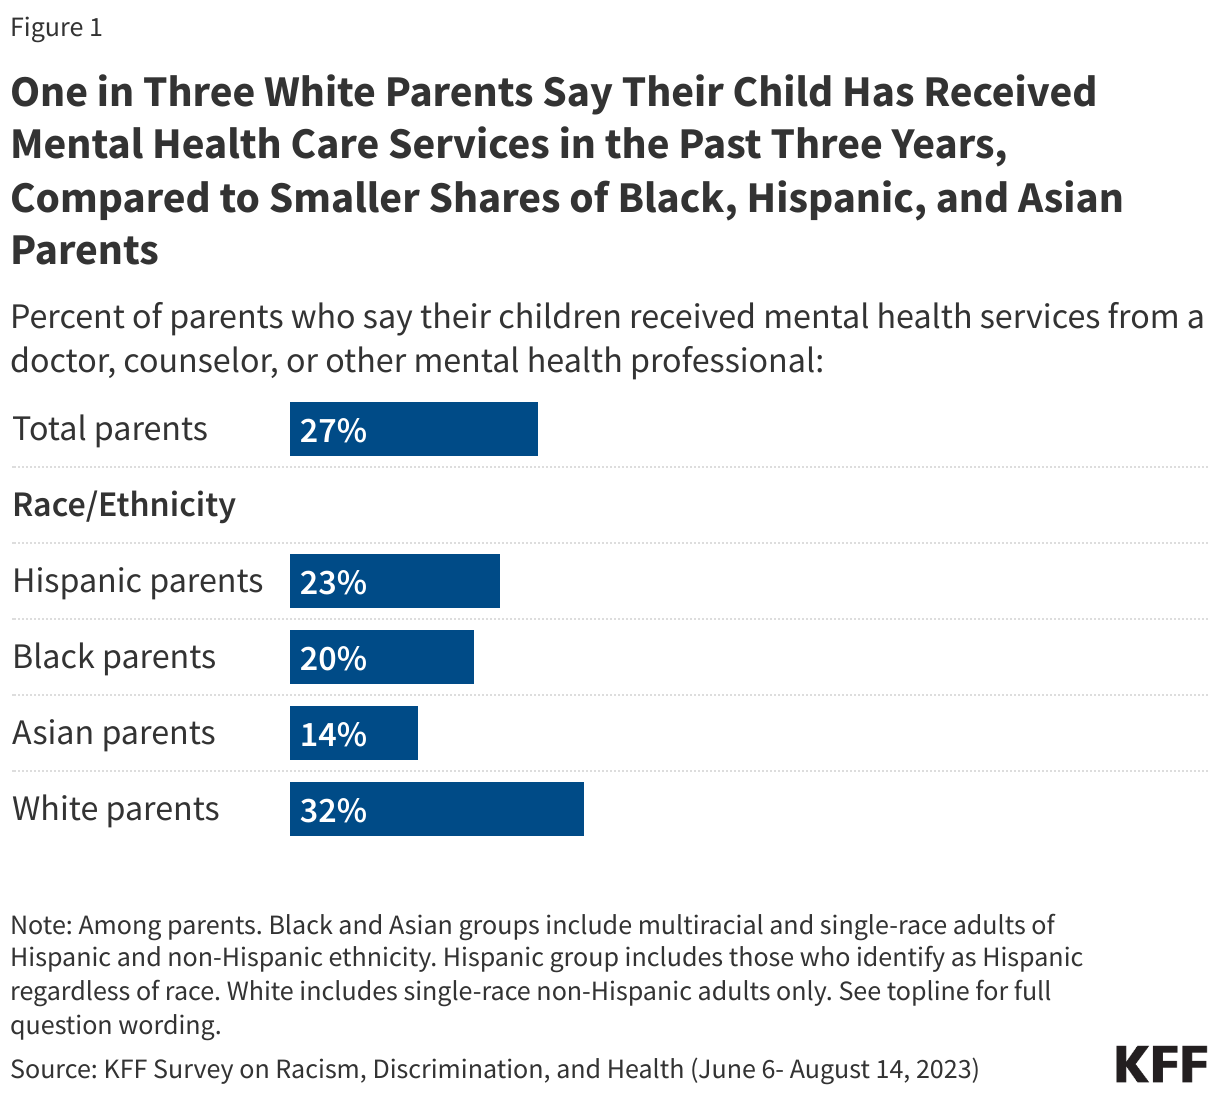
The analysis reveals some areas of shared challenges across parents, as well as several areas where experiences differ across race and ethnicity. For example, while similar shares of parents across racial and ethnic groups say their children’s mental health is fair or poor, a larger share of White parents (32%) compared to Black (20%), Hispanic (23%), and Asian (14%) parents report that their children have received mental health care services in the past three years. Moreover, while about half of parents of school-aged children overall say any of their children have ever been treated differently or unfairly in one of several ways, larger shares of Black (40%), Hispanic (23%), and Asian parents (26%) say such treatment occurred specifically because of their child’s race or ethnicity compared to White parents (16%). The survey further shows a strong association between these negative experiences, and parent’s reported mental health status of their children. More broadly, Black, Hispanic, and Asian parents are more worried about their children and families compared to White parents, including worries about violence and experiences with racism and discrimination. At the same time, they remain more confident that life will be better for the next generation.
The findings highlight the importance of efforts to address racial disparities in mental health care use among children, as well as the importance of addressing other factors that influence children’s health and well-being, including unfair treatment and underlying structural inequities in social and economic factors.
Who are Parents?
For purposes of this brief, parents are defined as adults who say they are the parent or guardian of a child under age 18 living in their home. Parents as a group are somewhat more racially and ethnically diverse than the overall U.S. adult population, in part a reflection of the aging White population. Among adults who have a child under age 18 living with them, more than one in five (22%) are Hispanic, 15% identify as Black, and 8% are Asian. 1 Parents face more financial challenges relative to those without a child in the home, including being more likely to say they are just able to afford their bills (37% vs. 30%) or have difficulty affording their bills each month (16% vs. 13%).
Parents’ Perceptions of Children’s Mental Health and Use of Mental Health Care
Black, Hispanic, and Asian parents are less likely than White parents to say their children received mental health services in the past three years. About nine in ten (88%) parents overall say their children’s mental health is excellent, very good, or good, while about one in ten (12%) report their children’s mental health as fair or poor, shares that do not differ significantly across racial and ethnic groups. White parents (32%) are more likely to say that any of their children have received mental health services in the past three years than are Hispanic (23%), Black (20%), and Asian parents (14%). Among parents overall, three-quarters (75%) of those who describe their children’s mental health as fair or poor say at least one of their children received mental health services compared to about one in five (21%) of those who say their children’s mental health is excellent, very good, or good.
One in Three White Parents Say Their Child Has Received Mental Health Care Services in the Past Three Years, Compared to Smaller Shares of Black, Hispanic, and Asian Parents
Percent of parents who say their children received mental health services from a doctor, counselor, or other mental health professional:
Among parents. Black and Asian groups include multiracial and single-race adults of Hispanic and non-Hispanic ethnicity. Hispanic group includes those who identify as Hispanic regardless of race. White includes single-race non-Hispanic adults only.
See topline for full question wording.
KFF Survey on Racism, Discrimination, and Health (June 6- August 14, 2023)
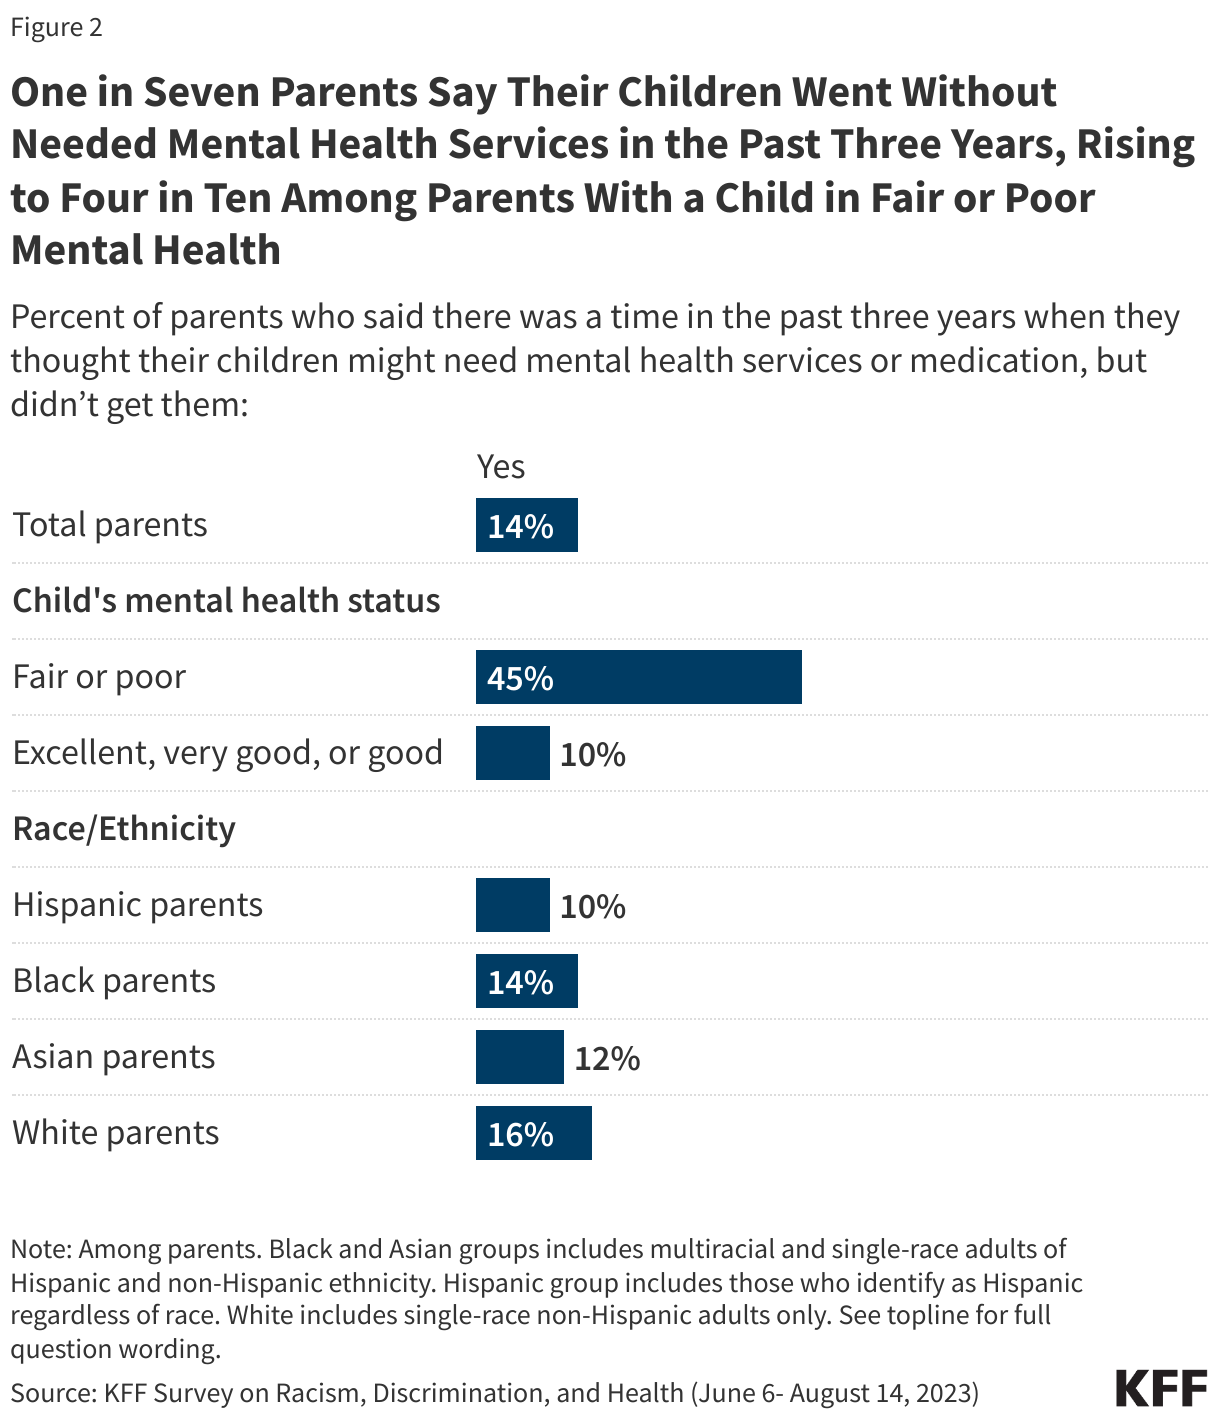
About one in seven parents (14%) say there was a time in the past three years when they thought their children might need mental health services or medication but did not receive them, a share that rises to more than four in ten (45%) among parents who say their children’s mental health is fair or poor. Similar shares of Hispanic, Black, Asian, and White parents say there was a time in the past three years when their children went without needed mental health services or medication. Among all parents who say their child went without needed care, seven in ten (70%) say they tried to find a provider for their children, while three in ten (30%) did not. Overall, adults identify scheduling delays, cost concerns, difficulty finding a provider who could understand their background and experiences, lack of information, and fear and embarrassment as challenges to getting mental health care for themselves or their children.2
One in Seven Parents Say Their Children Went Without Needed Mental Health Services in the Past Three Years, Rising to Four in Ten Among Parents With a Child in Fair or Poor Mental Health
Percent of parents who said there was a time in the past three years when they thought their children might need mental health services or medication, but didn’t get them:
Among parents. Black and Asian groups includes multiracial and single-race adults of Hispanic and non-Hispanic ethnicity. Hispanic group includes those who identify as Hispanic regardless of race. White includes single-race non-Hispanic adults only.
See topline for full question wording.
KFF Survey on Racism, Discrimination, and Health (June 6- August 14, 2023)
Children’s Experiences with Unfair and Negative Treatment
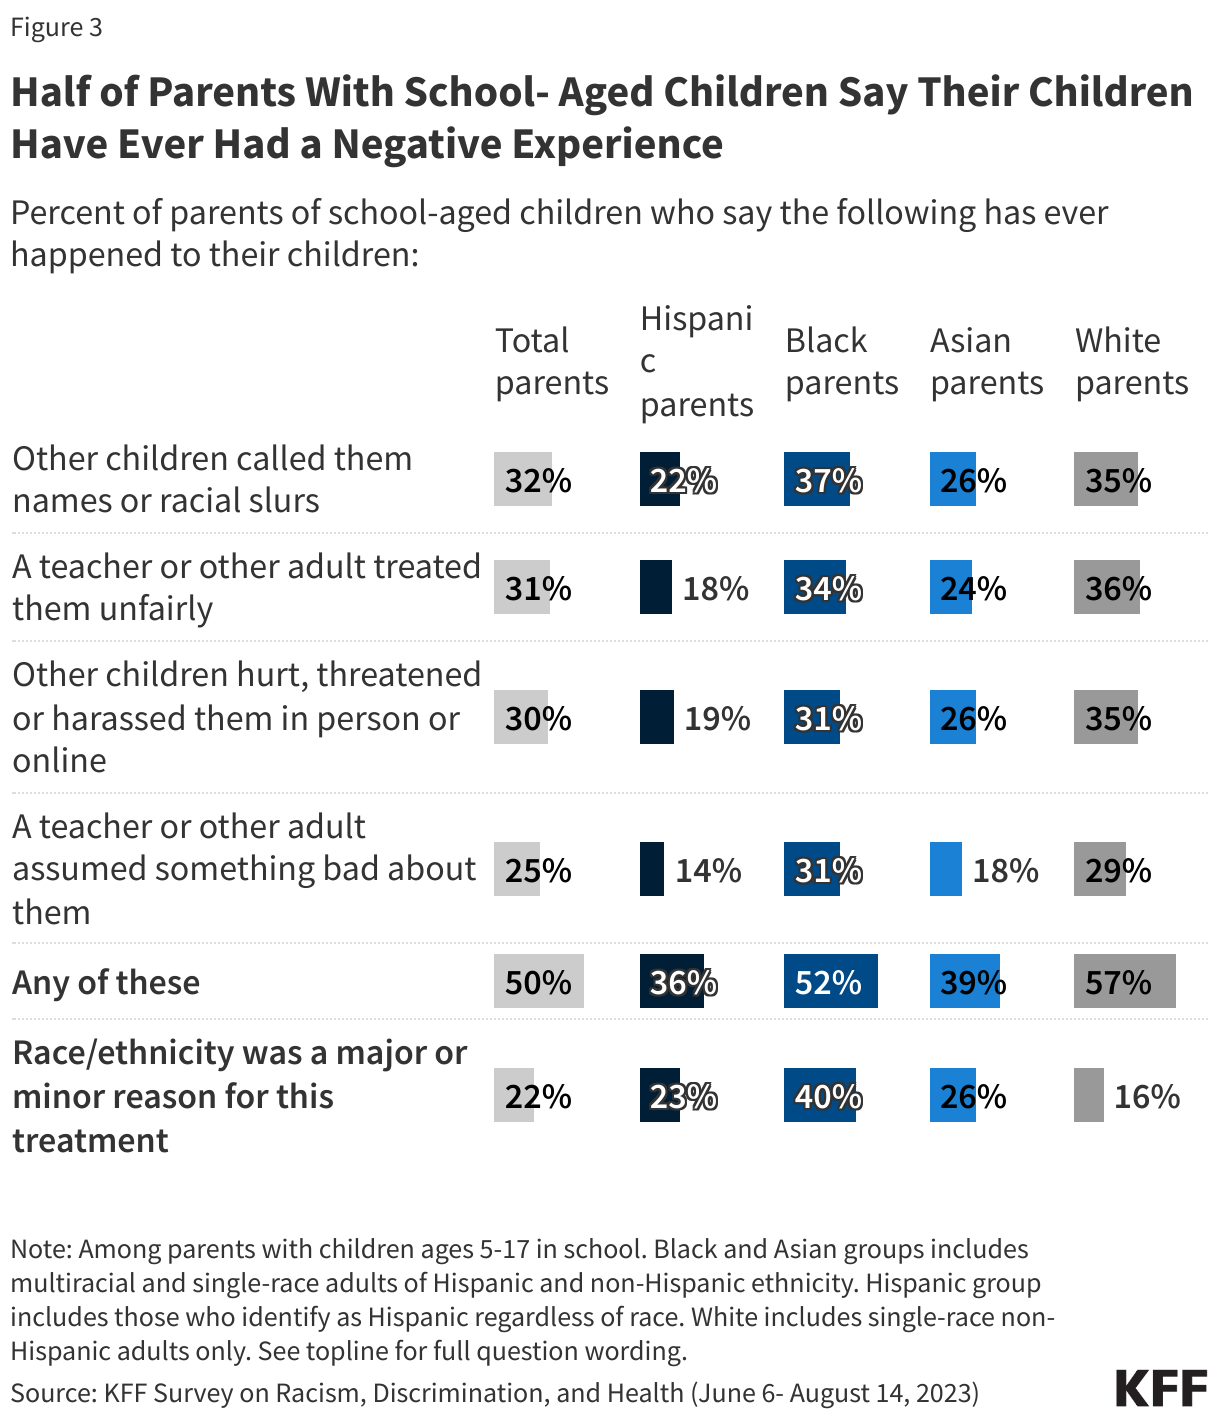
About half of parents of school-aged children3 say any of their children have ever been treated unfairly or negatively, with larger shares of Black, Hispanic, and Asian parents than White parents attributing this treatment to their child’s race or ethnicity. The types of treatment asked about in the survey include being called names or racial slurs (32%), being treated unfairly by a teacher or other adult (31%), being hurt, threatened, or harassed in person or online (30%), or having a teacher or other adult assume something bad about them (25%). Over half of White (57%) and Black (52%) parents and nearly four in ten Asian (39%) and Hispanic (36%) parents say their children have ever had at least one of these negative experiences. Notably, four in ten Black parents (40%) and about a quarter of Asian (26%) and Hispanic (23%) parents say their child had at least one of these negative experiences and that their race or ethnicity was a major or minor reason for this treatment, compared to a smaller share of White parents (16%).
Half of Parents With School- Aged Children Say Their Children Have Ever Had a Negative Experience
Percent of parents of school-aged children who say the following has ever happened to their children:
Among parents with children ages 5-17 in school. Black and Asian groups includes multiracial and single-race adults of Hispanic and non-Hispanic ethnicity. Hispanic group includes those who identify as Hispanic regardless of race. White includes single-race non-Hispanic adults only.
See topline for full question wording.
KFF Survey on Racism, Discrimination, and Health (June 6- August 14, 2023)
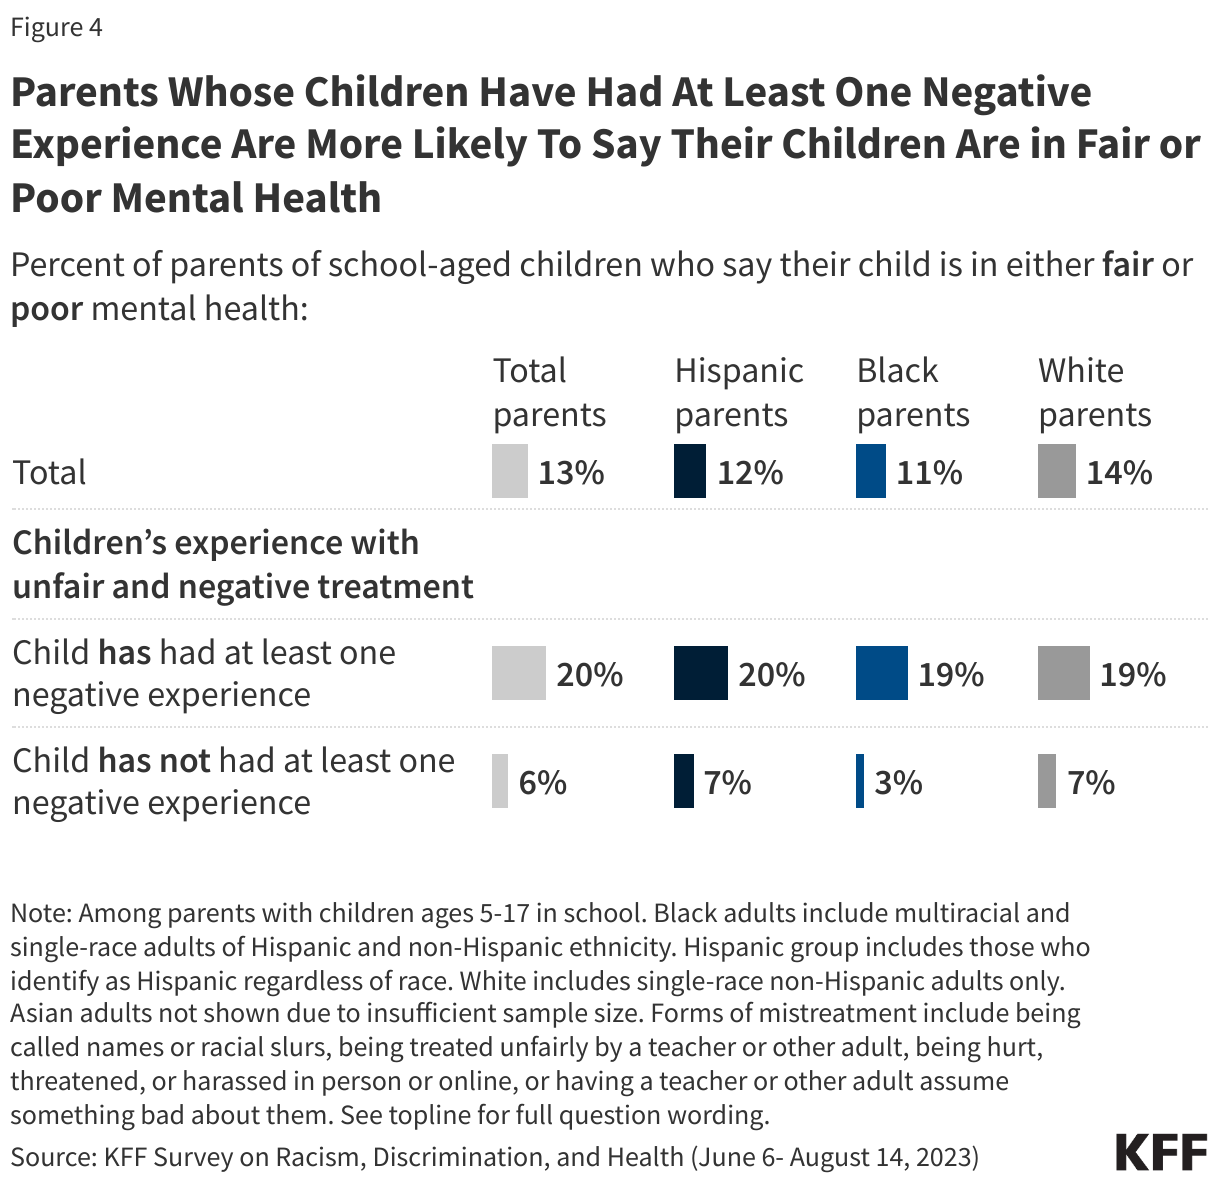
There is a strong association between reported negative experiences among children and parents’ perceptions of their children’s mental health and well-being. Parents who say their child had at least one of the negative experiences asked about in the survey are more likely to say their children’s mental health is fair or poor compared with those who say their child did not have one of these experiences (20% vs. 6%), a pattern that is consistent across racial and ethnic groups.
Parents Whose Children Have Had At Least One Negative Experience Are More Likely To Say Their Children Are in Fair or Poor Mental Health
Percent of parents of school-aged children who say their child is in either fair or poor mental health:
Among parents with children ages 5-17 in school. Black adults include multiracial and single-race adults of Hispanic and non-Hispanic ethnicity. Hispanic group includes those who identify as Hispanic regardless of race. White includes single-race non-Hispanic adults only. Asian adults not shown due to insufficient sample size. Forms of mistreatment include being called names or racial slurs, being treated unfairly by a teacher or other adult, being hurt, threatened, or harassed in person or online, or having a teacher or other adult assume something bad about them.
See topline for full question wording.
KFF Survey on Racism, Discrimination, and Health (June 6- August 14, 2023)
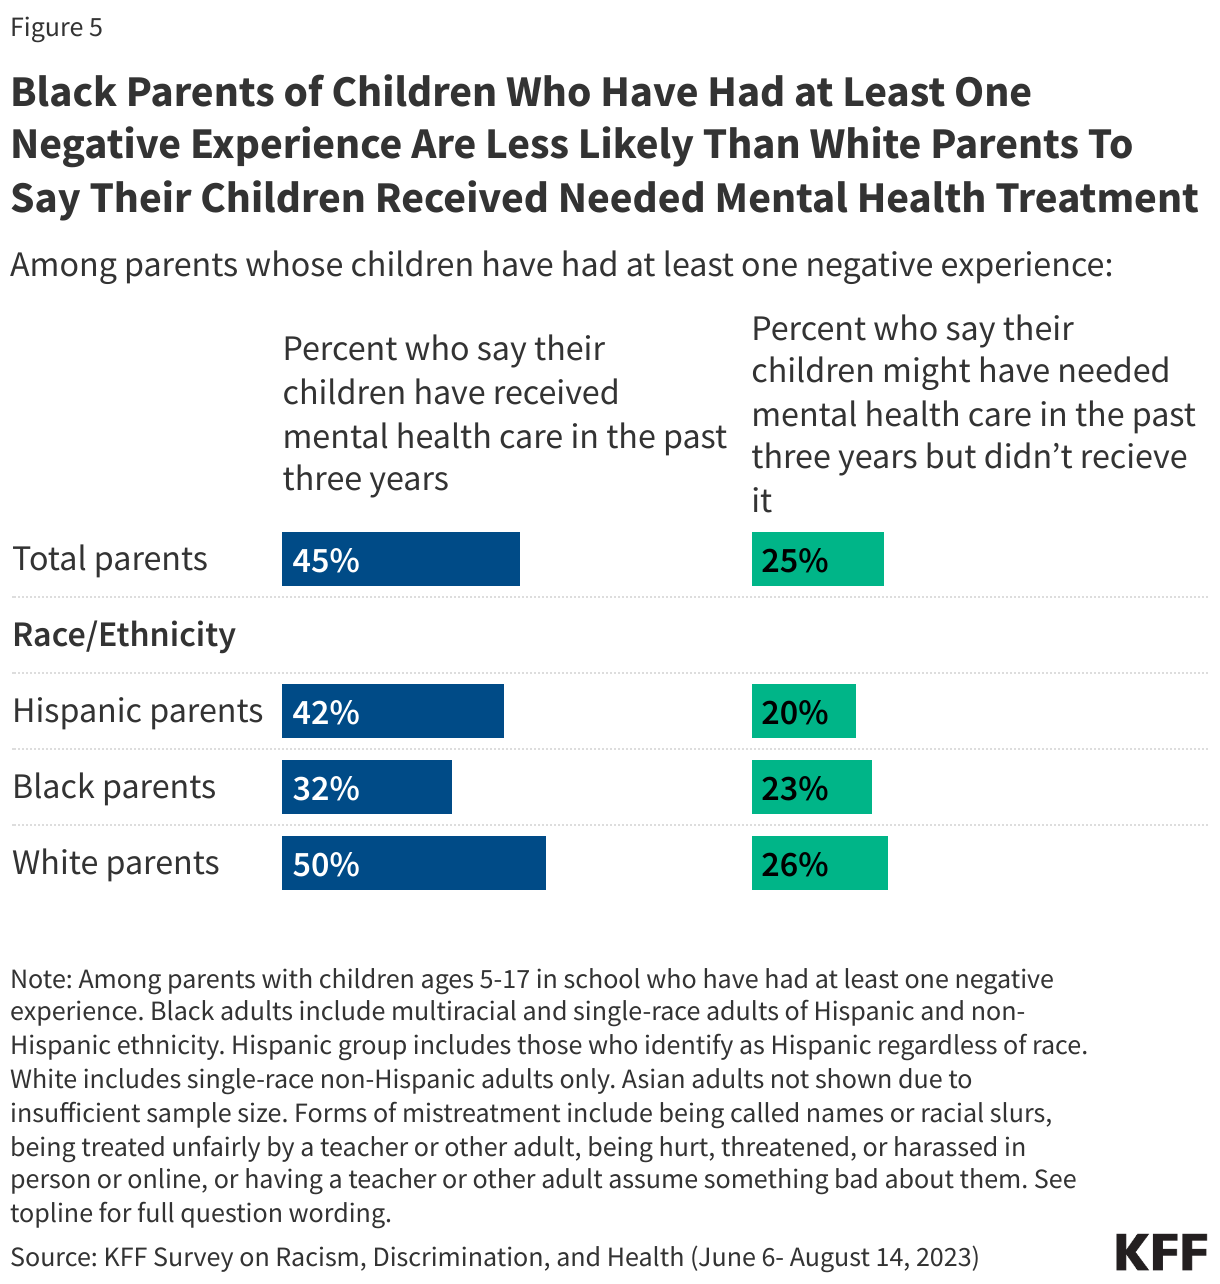
Many (45%) parents of school-aged children who had a negative experience say their child received mental health care in the past three years, but among these parents, Black parents are less likely than White parents to say their child received care. Perhaps reflecting greater health care access, White parents whose children who had at least one negative experience are more likely to report that their children have received mental health care services in the past three years compared to their Black counterparts (50% vs. 32%). While about four in ten (45%) parents of children who had a negative experience say their child saw a mental health care provider in the past three years, some also report unmet mental health care needs among their children. One-quarter (25%) of these parents say there was a time in the past three years when they thought their child might need mental health services or medication but didn’t get them, a share that is similar across racial and ethnic groups.
Black Parents of Children Who Have Had at Least One Negative Experience Are Less Likely Than White Parents To Say Their Children Received Needed Mental Health Treatment
Among parents whose children have had at least one negative experience:
Among parents with children ages 5-17 in school who have had at least one negative experience. Black adults include multiracial and single-race adults of Hispanic and non-Hispanic ethnicity. Hispanic group includes those who identify as Hispanic regardless of race. White includes single-race non-Hispanic adults only. Asian adults not shown due to insufficient sample size. Forms of mistreatment include being called names or racial slurs, being treated unfairly by a teacher or other adult, being hurt, threatened, or harassed in person or online, or having a teacher or other adult assume something bad about them.
See topline for full question wording.
KFF Survey on Racism, Discrimination, and Health (June 6- August 14, 2023)
Parents’ Worries, Challenges, and Optimism
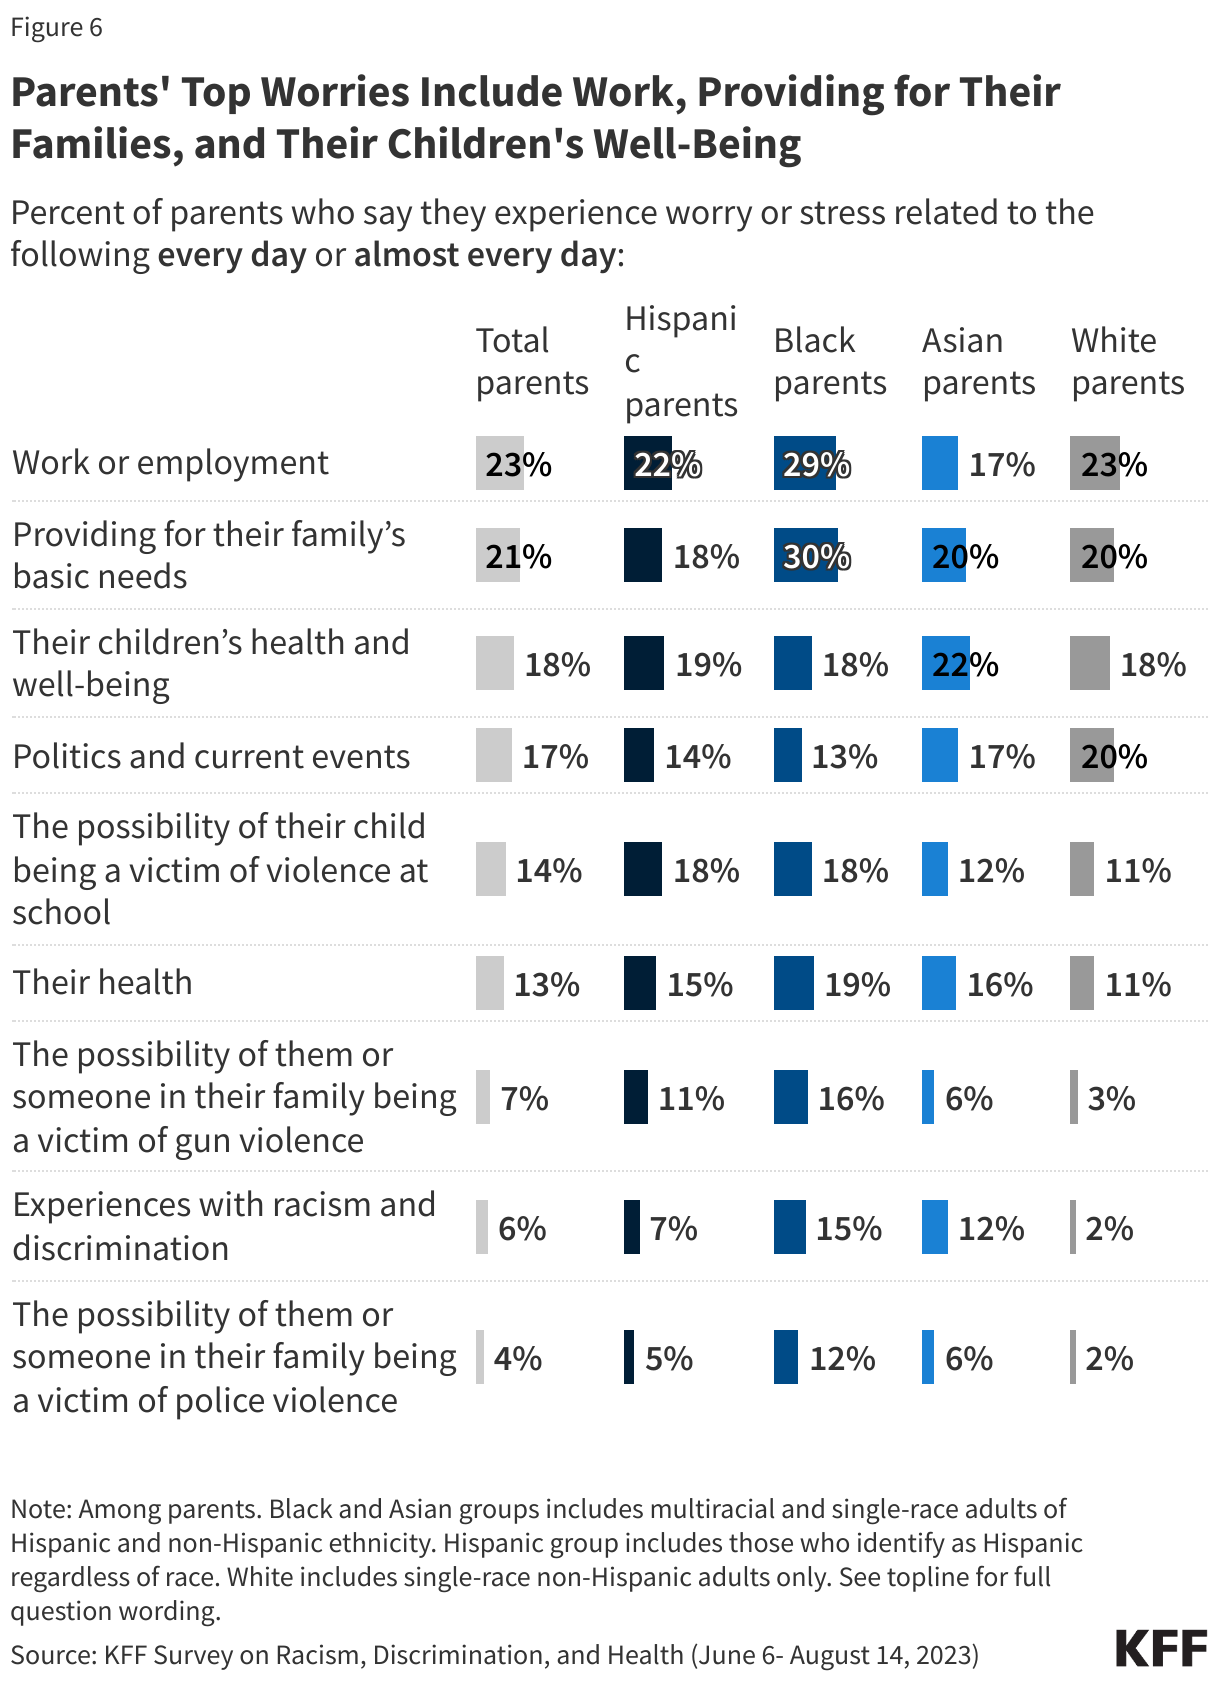
While one in five parents across racial and ethnic backgrounds say they worry about their children’s health and well-being daily or almost daily, Black and Hispanic parents are more likely than White parents to say they worry about a range of other issues affecting their families. Black (18%) and Hispanic (18%) parents are more likely to say they experience worry or stress “every day” or “almost every day” about their child being the victim of violence at their school compared to White parents (11%). Similarly, Black (16%) and Hispanic (11%) parents are more likely to say they frequently worry about the possibility of them or someone in their family being the victim of gun violence than are White (3%) parents. In addition, larger shares of Black (15%), Asian (12%), and Hispanic (7%) parents worry about experiences with racism and discrimination than do White parents (2%).
Beyond these worries, parents also express financial concerns. Overall, parents’ top worries are about work and employment (23% worry daily or almost daily), followed by providing for their family’s basic needs (21%). Likely reflecting lower household incomes, three in ten (30%) Black parents say they frequently worry about providing for their family’s basic needs, higher than the shares of Asian (20%), White (20%), and Hispanic (18%) parents who say the same.
Parents' Top Worries Include Work, Providing for Their Families, and Their Children's Well-Being
Percent of parents who say they experience worry or stress related to the following every day or almost every day:
Among parents. Black and Asian groups includes multiracial and single-race adults of Hispanic and non-Hispanic ethnicity. Hispanic group includes those who identify as Hispanic regardless of race. White includes single-race non-Hispanic adults only.
See topline for full question wording.
KFF Survey on Racism, Discrimination, and Health (June 6- August 14, 2023)
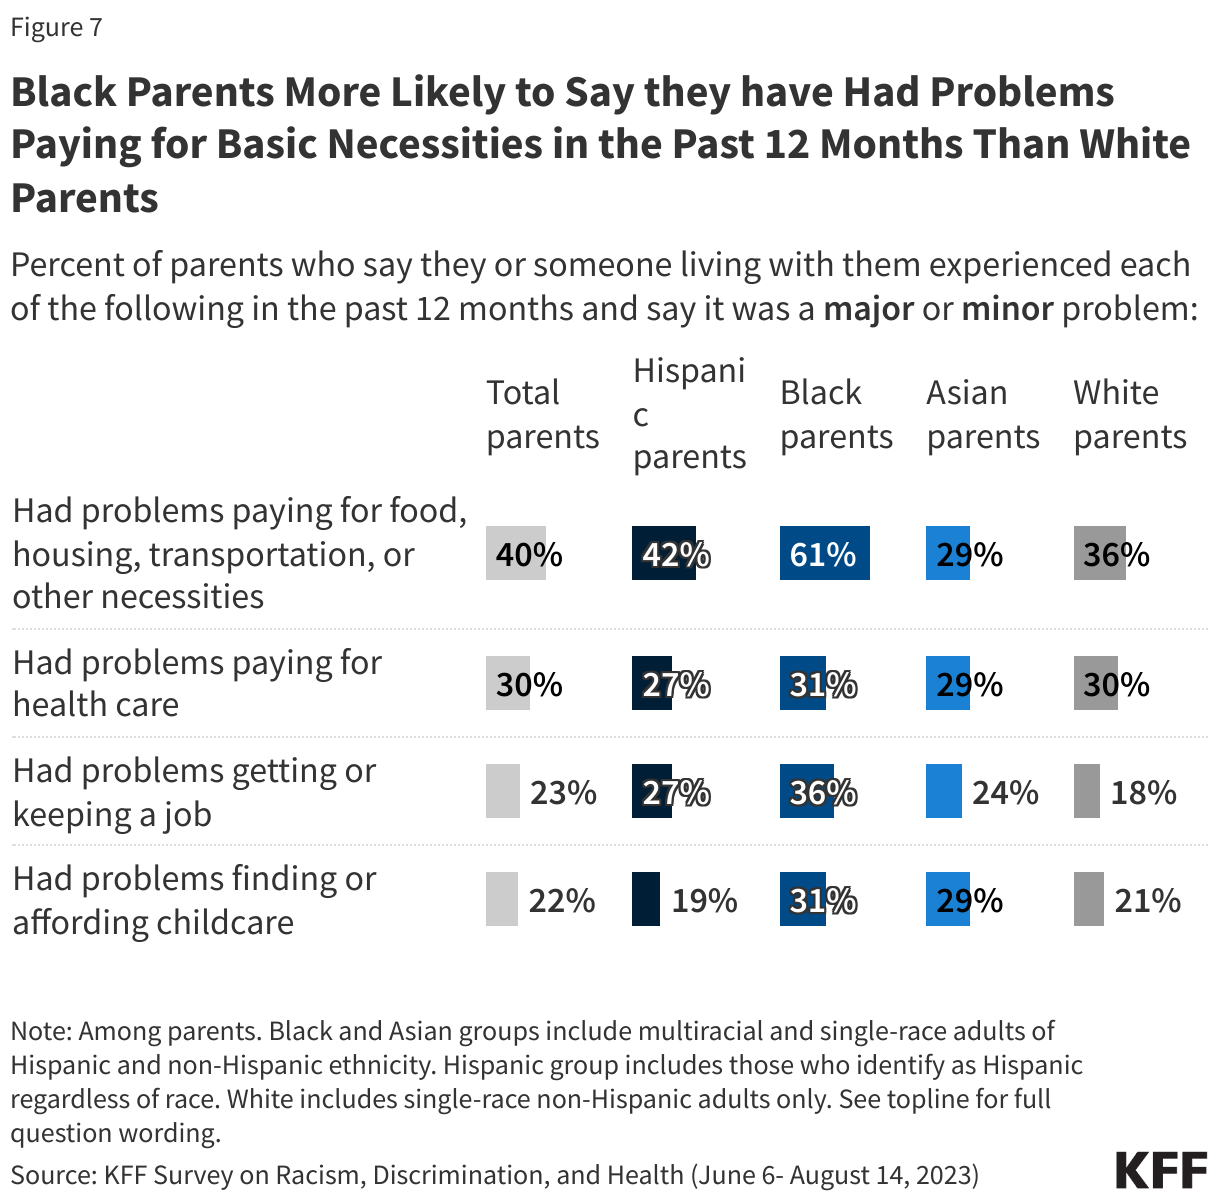
Many parents report financial challenges that can have implications for their children’s well-being, including higher shares of Black parents. Overall, at least one in five parents across racial and ethnic backgrounds say they have had problems paying for necessities, health care, and childcare in the past year. Reflecting lower incomes and an array of underlying structural inequities, Black parents are more likely than White parents to report these challenges. For example, larger shares of Black parents (61%) say they had problems paying for food, housing, transportation, or other necessities in the past year compared to White parents (36%). Paying for health care also is a concern among parents, with at least one in four parents across racial and ethnic groups saying this has been a problem in the past year for them and their families. Moreover, at least one in five parents say they had problems finding or affording childcare, including larger shares of Black (31%) and Asian parents (29%) relative to White (21%) parents, and about one in five parents say they have had problems getting or keeping a job, with higher shares of Black (36%) and Hispanic (27%) parents reporting this than White parents (18%).
Black Parents More Likely to Say they have Had Problems Paying for Basic Necessities in the Past 12 Months Than White Parents
Percent of parents who say they or someone living with them experienced each of the following in the past 12 months and say it was a major or minor problem:
Among parents. Black and Asian groups include multiracial and single-race adults of Hispanic and non-Hispanic ethnicity. Hispanic group includes those who identify as Hispanic regardless of race. White includes single-race non-Hispanic adults only.
See topline for full question wording.
KFF Survey on Racism, Discrimination, and Health (June 6- August 14, 2023)
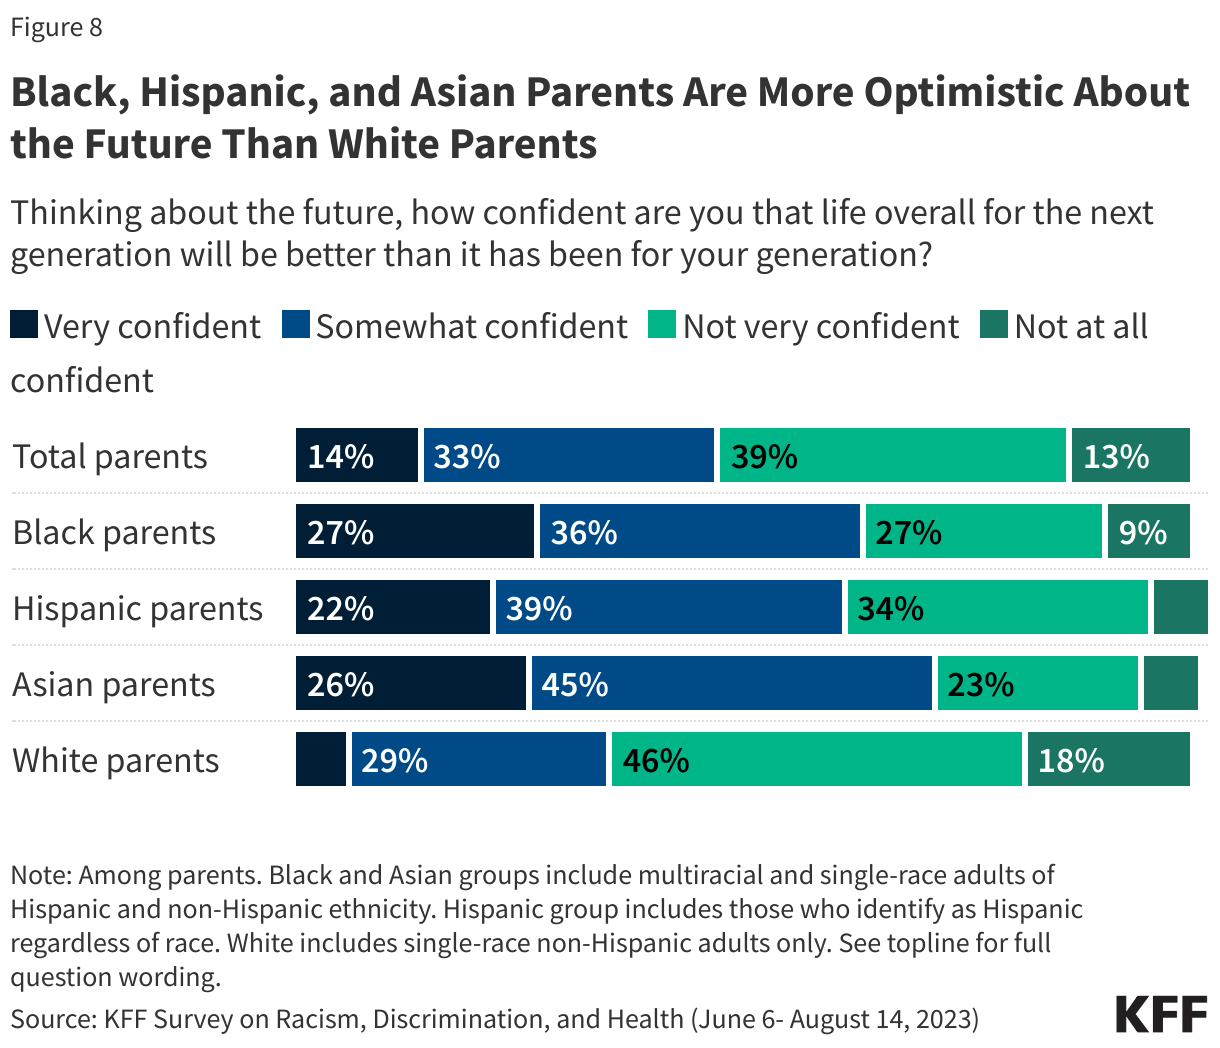
Black, Hispanic, and Asian parents are more confident than White parents that life for the next generation will be better. Six in ten or more Asian (71%), Black (64%), and Hispanic (60%) parents say they are either “very confident” or “somewhat confident” that life overall for the next generation will be better than it has been for their generation, compared to about one in three (34%) White parents who say the same. The differences in the shares of parents who say they are “very” confident are especially stark, with only 6% of White parents saying this, compared to about one in five Black (27%), Asian (26%) and Hispanic (22%) parents.
Black, Hispanic, and Asian Parents Are More Optimistic About the Future Than White Parents
Thinking about the future, how confident are you that life overall for the next generation will be better than it has been for your generation?
Among parents. Black and Asian groups include multiracial and single-race adults of Hispanic and non-Hispanic ethnicity. Hispanic group includes those who identify as Hispanic regardless of race. White includes single-race non-Hispanic adults only.
See topline for full question wording.
KFF Survey on Racism, Discrimination, and Health (June 6- August 14, 2023)
The Survey on Racism, Discrimination, and Health was designed and analyzed by researchers at KFF. The survey was conducted June 6 – August 14, 2023, online and by telephone among a nationally representative sample of 6,292 U.S. adults in English (5,706), Spanish (520), Chinese (37), Korean (16), and Vietnamese (13).
The sample includes 5,073 adults who were reached through an address-based sample (ABS) and completed the survey online (4,529) or over the phone (544). An additional 1,219 adults were reached through a random digit dial telephone (RDD) sample of prepaid (pay-as-you-go) cell phone numbers. Marketing Systems Groups (MSG) provided both the ABS and RDD sample. All fieldwork was managed by SSRS of Glen Mills, PA; sampling design and weighting was done in collaboration with KFF.
Sampling strategy:The project was designed to reach a large sample of Black adults, Hispanic adults, and Asian adults. To accomplish this, the sampling strategy included increased efforts to reach geographic areas with larger shares of the population having less than a college education and larger shares of households with a Hispanic, Black, and/or Asian resident within the ABS sample, and geographic areas with larger shares of Hispanic and non-Hispanic Black adults within the RDD sample.
The ABS was divided into areas (strata) based on the share of households with a Hispanic, Black, and/or Asian resident, as well as the share of the population with a college degree within each Census block group. To increase the likelihood of reaching the populations of interest, strata with higher incidence of Hispanic, Black, and Asian households, and with lower educational attainment, were oversampled in the ABS design. The RDD sample of prepaid (pay-as-you-go) cell phone numbers was disproportionately stratified to reach Hispanic and non-Hispanic Black respondents based on incidence of these populations at the county level.
Incentives:Respondents received a $10 incentive for their participation, with interviews completed by phone receiving a mailed check and web respondents receiving a $10 electronic gift card incentive to their choice of six companies, a Visa gift card, or a CharityChoice donation.
Community and expert input:Input from organizations and individuals that directly serve or have expertise in issues facing historically underserved or marginalized populations helped shape the questionnaire and reporting. These community representatives were offered a modest honorarium for their time and effort to provide input, attend meetings, and offer their expertise on dissemination of findings.
Translation:After the content of the questionnaire was largely finalized, SSRS conducted a telephone pretest in English and adjustments were made to the questionnaire. Following the English pretest, Cetra Language Solutions translated the survey instrument from English into the four languages outlined above and checked the CATI and web programming to ensure translations were properly overlayed. Additionally, phone interviewing supervisors fluent in each language reviewed the final programmed survey to ensure all translations were accurate and reflected the same meaning as the English version of the survey.
Data quality check:A series of data quality checks were run on the final data. The online questionnaire included two questions designed to establish that respondents were paying attention and cases were monitored for data quality including item non-response, mean length, and straight lining. Cases were removed from the data if they failed two or more of these quality checks. Based on this criterion, 4 cases were removed.
Weighting:The combined cell phone and ABS samples were weighted to match the sample’s demographics to the national U.S. adult population using data from the Census Bureau’s 2021 Current Population Survey (CPS). The combined sample was divided into five groups based on race or ethnicity (White alone, non-Hispanic; Hispanic; Black alone, non-Hispanic; Asian alone, non-Hispanic; and other race or multi-racial, non-Hispanic) and each group was weighted separately. Within each group, the weighting parameters included sex, age, education, nativity, citizenship, census region, urbanicity, and household tenure. For the Hispanic and Asian groups, English language proficiency and country of origin were also included in the weighting adjustment. The general population weight combines the five groups and weights them proportionally to their population size.
A separate weight was created for the American Indian and Alaska Native (AIAN) sample using data from the Census Bureau’s 2022 American Community Survey (ACS). The weighting parameters for this group included sex, education, race and ethnicity, region, nativity, and citizenship. For more information on the AIAN sample including some limitations, adjustments made to make the sample more representative, and considerations for data interpretation, see Appendix 2.
All weights also take into account differences in the probability of selection for each sample type (ABS and prepaid cell phone). This includes adjustment for the sample design and geographic stratification of the samples, and within household probability of selection.
The margin of sampling error including the design effect for the full sample is plus or minus 2 percentage points. Numbers of respondents and margins of sampling error for key subgroups are shown in the table below. Appendix 1 provides more detail on how race and ethnicity was measured in this survey and the coding of the analysis groups. For results based on other subgroups, the margin of sampling error may be higher. All tests of statistical significance account for the design effect due to weighting. Dependent t-tests were used to test for statistical significance across the overlapping groups.
Sample sizes and margins of sampling error for other subgroups are available by request. Sampling error is only one of many potential sources of error and there may be other unmeasured error in this or any other public opinion poll. KFF public opinion and survey research is a charter member of the Transparency Initiative of the American Association for Public Opinion Research.
Group
N (unweighted)
M.O.S.E.
Total
6,292
± 2 percentage points
Race/Ethnicity
White, non-Hispanic (alone)
1,725
± 3 percentage points
Black (alone or in combination)
1,991
± 3 percentage points
Hispanic
1,775
± 3 percentage points
Asian (alone or in combination)
693
± 5 percentage points
American Indian and Alaska Native (alone or in combination)
Many surveys and data analyses classify individuals into non-overlapping racial and ethnic categories using single-race and Hispanic ethnicity categories and grouping those who identify as more than one race into a “multiracial” or “other” category. To allow for better representation of experiences of the growing shares of people who identify as multiracial, this report uses an “alone or in combination” approach for classifying individuals so that they are represented within each racial and ethnic group with which they identify, resulting in overlapping racial and ethnic categories. For example, responses from someone who identifies as both Black and Asian are included in the results for both Black adults and Asian adults. The exception is reporting on White adults, who in this report are defined as those who identify as non-Hispanic and select White as their only race. ↩︎
This question was asked among those who thought they or their child needed mental health care services but did not try to find a mental health care provider. See topline for full question wording. ↩︎
Parents of school-aged children refers to adults who said they are the parent or guardian of any child under age 18 living with them and said that at least one of their children is between the ages of 5 and 17 and currently enrolled in school. See topline for full question wording. ↩︎
Approximately 1 in 5 teens in the United States experience symptoms of anxiety or depression and many youth experience bullying and violence, which can have adverse effects on their mental health. Schools can play a role in promoting mental health and connecting youth to treatment. One approach that many schools have implemented is social and emotional learning, which teaches skills such as emotional management, resilience, and relationship building. Social and emotional learning in schools has received more attention in recent years. For instance, the Surgeon General’s2021 Youth Mental Health Advisory recommended the expansion of social and emotional programs. Meanwhile, critics argue that these programs should be banned from schools, suggesting that they take away from academic instruction time and incorporate critical race theory.
Social and emotional learning programs focus on developing intrapersonal and interpersonal skills; however, specific program content and integration strategies can vary widely across schools. Goals, benchmarks, and guidelines for social and emotional learning programs in schools are typically developed at the state level. Individual schools may then implementsocial and emotional learning in a number of ways, including through academic instruction (e.g. group projects to encourage collaboration, or complex problem-solving to encourage persistence); through separate, dedicated time for social and emotional learning instruction; or through schoolwide measures (e.g. disciplinary methods that incorporate social and emotional learning competencies). Regardless of how social and emotional learning is integrated, the content typically focuses on intrapersonal and interpersonal skill building, including self-awareness, self-management, responsible decision making, social awareness, and relationship skills.
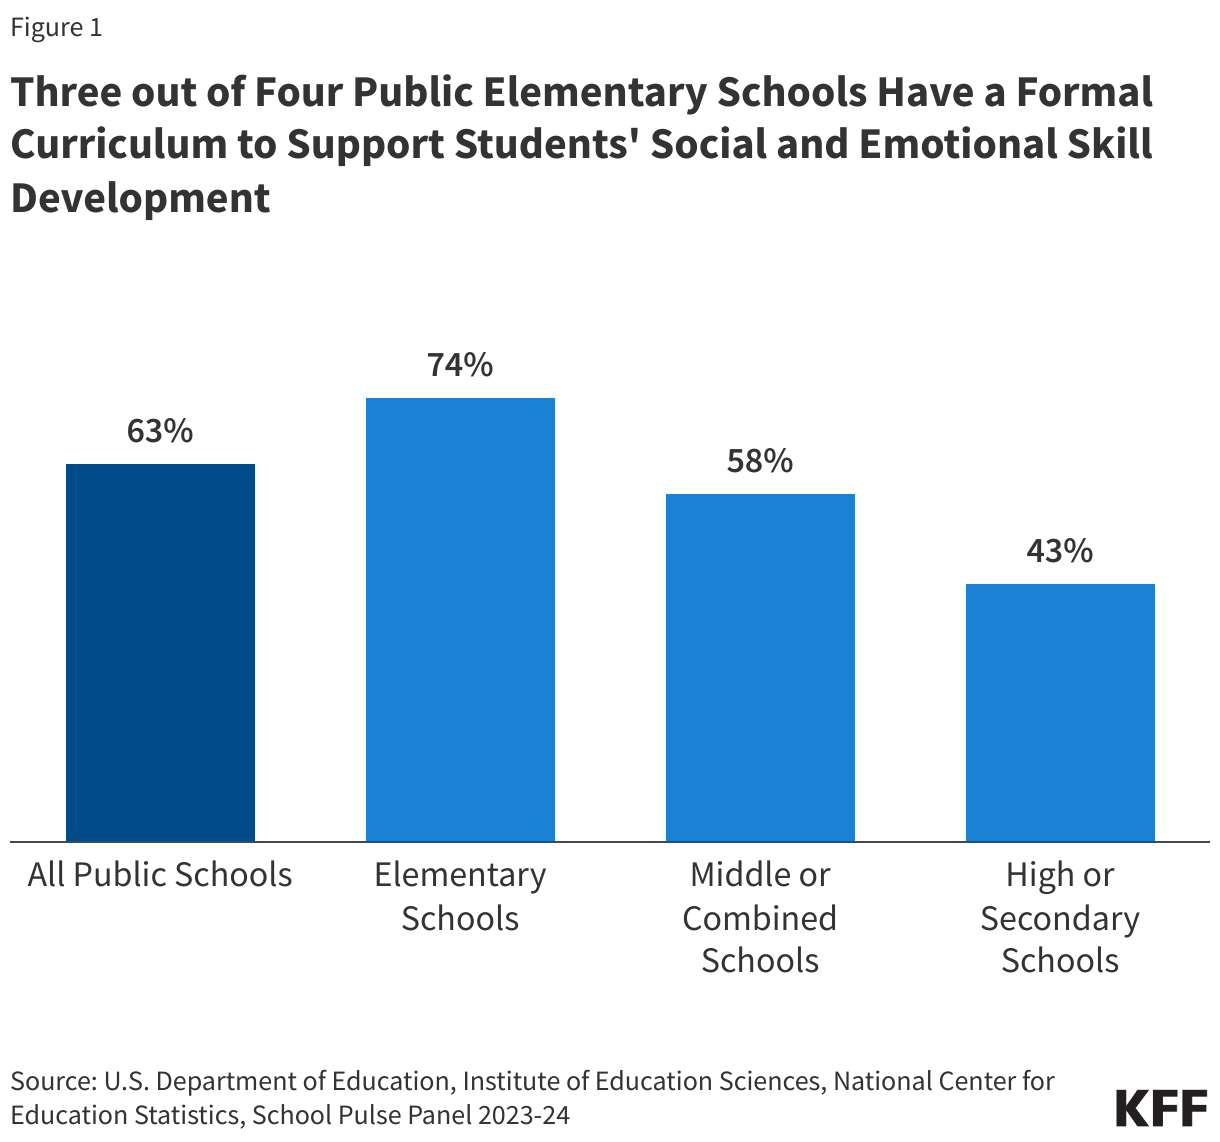
Sixty-three percent of public schools in the U.S. had a formal curriculum to support their students’ social and emotional skill development in the 2023-2024 school year (Figure 1). These curricula are more common in elementary schools (74%) compared to middle (58%) and high schools (43%). Additionally, among schools with a formal curriculum, 81% of teachers and 51% of non-teaching staff received training or professional development to implement their school’s curriculum.
Three out of Four Public Elementary Schools Have a Formal Curriculum to Support Students' Social and Emotional Skill Development
U.S. Department of Education, Institute of Education Sciences, National Center for Education Statistics, School Pulse Panel 2023-24
Among schools with a social and emotional learning curriculum in the 2023-2024 school year, 72% found that the curriculum was moderately, very, or extremely effective in improving student outcomes. Social and emotional learning has been linked to positiveoutcomes for students, including fostering emotional intelligence, reducing emotional distress, fostering empathy, developing and maintaining peer relationships, and academicimprovement. However, measuringoutcomes of social and emotional learning programs can be difficult as implementation strategies and content may vary between programs.
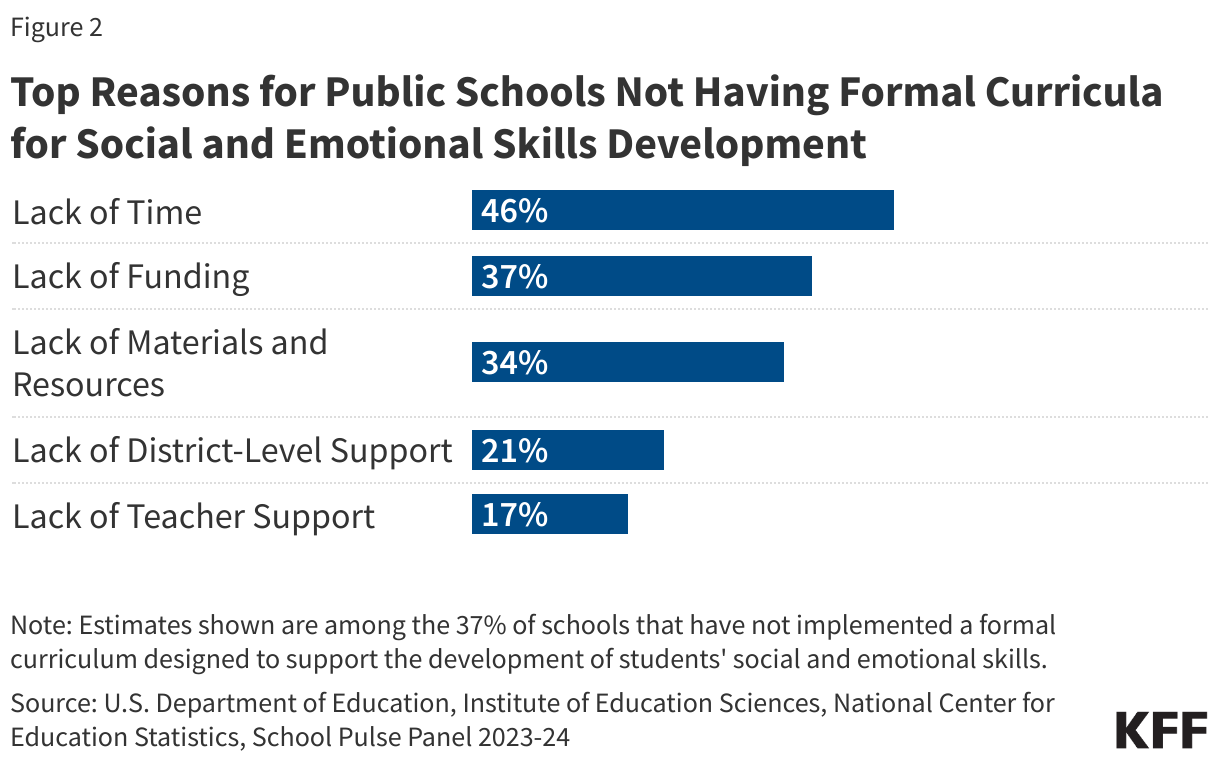
Common barriers to implementing social and emotional learning curricula in schools include lack of funding and materials. Thirty-seven percent of public schools reported not having a formal curriculum for social and emotional skill development in the 2023-24 school year. Among these schools, a lack of time (46%), funding (37%), and materials and resources (34%) were the main reasons for not having a formal curriculum (Figure 2). Several funding opportunities to support social and emotional learning have opened in the last decade, including the Every Student Succeeds Act in 2015, and more recently, the American Rescue Plan Act (ARPA) in 2021, which required school districts to use a portion of funds to support students’ mental health needs. Analyses of how schooldistricts planned to spend ARPA funds found that student social-emotional development was a priority, with many districts allocating some funds to social and emotional instruction materials and training. However, schools often have many competing budget priorities, such as providing funds to address staffing shortages and academic recovery in light of the pandemic, which may limit the amount of funds they have available for social and emotional learning.
Top Reasons for Public Schools Not Having Formal Curricula for Social and Emotional Skills Development
Estimates shown are among the 37% of schools that have not implemented a formal curriculum designed to support the development of students' social and emotional skills.
U.S. Department of Education, Institute of Education Sciences, National Center for Education Statistics, School Pulse Panel 2023-24
As support for social and emotional learning in schools has grown in recent years, so has opposition. Opponents argue that social and emotional learning in schools can take away from academic instruction time; and, more recently, that it incorporatescritical race theory and gender identity lessons. This has led to the introduction of several state bills – including Indiana, Iowa, Montana, North Dakota, Oklahoma, Maine, and New Hampshire – banning or limiting social and emotional learning in schools. Supporters, however, argue that social and emotional learning is an evidence-based approach that allows schools to focus on the “whole child”, leading to a wide array of positive outcomes, such as academic achievements, emotional intelligence, and growth opportunities for all students regardless of their backgrounds. This support was recently reflected in a bipartisan resolution designating a “National Social and Emotional Learning Week” which also received recognition from President Biden.
This work was supported in part by the Well Being Trust. KFF maintains full editorial control over all of its policy analysis, polling, and journalism activities.