KFF designs, conducts and analyzes original public opinion and survey research on Americans’ attitudes, knowledge, and experiences with the health care system to help amplify the public’s voice in major national debates.
The House Committee on Appropriations approved the FY 2015 State and Foreign Operations Appropriations bill (also see the associated report), which includes funding for U.S. global health programs at the U.S. Agency for International Development (USAID) and the State Department (see table below) comprising a significant portion of U.S. funding for global health (total funding for global health is not currently available as some funding provided through USAID, HHS, and DoD is not yet available).
Funding through the House appropriations bill for global health at USAID and the State Department would be $257 million (3%) above the President’s request, but $132 million (2%) below the FY 2014 enacted level. Bilateral HIV funding provided through the President’s Emergency Plan for AIDS Relief (PEPFAR) at the State Department is $300 million above both the President’s request and the FY 2014 levels; the Global Fund to Fight AIDS, Tuberculosis and Malaria (Global Fund) is funded at the same level as the request. Funding in the bill for tuberculosis, maternal and child health (MCH), polio, nutrition, and vulnerable children is above the President’s request while funding for malaria is equal to the President’s request. Funding for neglected tropical diseases (NTDs) and pandemic influenza was not specified in the bill or the associated report.
Among the known amounts, funding for family planning and reproductive health (FP/RH) is the only area that declined. The bill caps FP/RH funding at $461 million, $183 million below the President’s request and $149 million below the FY 2014 levels. The bill also included the following policy provisions:
• Reinstates the Mexico City Policy (also known as the “Global Gag Rule”)• Prohibits funding for the United Nations Population Fund (UNFPA)
Department / Agency / Area
FY14 Omnibus(millions)
FY15 Request(millions)
FY15 House Bill (millions)
Difference (millions)
House – FY14
House – Request
USAID – Global Health Programs Account (GHP)
HIV/AIDS
$330.0
$330.0
$330.0
$0(0%)
$0(0%)
Tuberculosis
$236.0
$191.0
$236.0
$0(0%)
$45(23.6%)
Malaria
$665.0
$674.0
$674.0
$9(1.4%)
$0(0%)
Neglected Tropical Diseases (NTDS)
$100.0
$86.5
Not Yet Known
–
–
Maternal & Child Health (MCH)
$705.0
$695.0
$732.0
$27(3.8%)
$37(5.3%)
of which GAVI
$175.0
$200.0
$200.0
$25 (14.3%)
$0 (0%)
of which Polio
$51.0
$44.5
$51.0
$0 (0%)
$6.5 (14.6%)
Nutrition
$115.0
$101.0
$115.0
$0(0%)
$14(13.9%)
Vulnerable Children
$22.0
$14.5
$22.0
$0(0%)
$7.5(51.7%)
Family Planning & Reproductive Health (FPRH)*
$524.0
$538.0
See Below
–
–
Pandemic Influenza
$72.5
$50.0
Not Yet Known
–
–
Total USAID:
$2,769.5
$2,680.0
$2,637.0
$-132.5 (-4.8%)
$-43 (-1.6%)
State Department – Global Health Programs Account (GHP)
HIV
$4,020.0
$4,020.0
$4,320.0
$300(7.5%)
$300(7.5%)
Global Fund
$1,650.0
$1,350.0
$1,350.0
$-300(-18.2%)
$0(0%)
Total State:
$5,670.0
$5,370.0
$5,670.0
$0 (0%)
$300 (5.6%)
Total GHP – State & USAID
Total USAID & State GHP:**
$8,439.5
$8,050.0
$8,307.0
$-132.5 (-1.6%)
$257 (3.2%)
International Organizations & Programs (IO&P) – State & Foreign Operations
United Nations Children’s Fund (UNICEF)
$132.0
$116.6
$132.0
$0(0%)
$15.4(13.2%)
United Nations Population Fund (UNFPA)
$35.0
$35.3
$0.0
$-35(-100%)
$-35.3(-100%)
Family Planning & Reproductive Health (FP/RH) – State & Foreign Operations (All Accounts)*
FP/RH
$610.0
$644.3
$461.0
$-149(-24.4%)
$-183.3(-28.4%)
of which GHP account
$524.0
$538.0
Not Yet Known
–
–
of which ESF account
$51.0
$71.0
Not Yet Known
–
–
of which UNFPA
$35.0
$35.3
$0.0
$-35 (-100%)
$-35.3 (-100%)
Polio
Polio
$59.0
$50.0
$59.0
$0(0%)
$9(18%)
of which GHP account
$51.0
$44.5
$51.0
$0 (0%)
$6.5 (14.6%)
of which ESF account
$8.0
$5.5
$8.0
$0 (0%)
$2.5 (45.5%)
*The House State & Foreign Operations (SFOPs) appropriations bill specified a total funding level for family planning and reproductive health (FP/RH) activities, but did not delineate this funding by account beyond stipulating that no funding would be provided to UNFPA.**Represents combined PEPFAR funding (HIV bilateral and Global Fund) at the State Department.
Additional Resources:
House Appropriations Committee press release summarizing the bill.
This Visualizing Health Policy infographic examines the effect of decisions by states in the South to implement or forgo the Affordable Care Act Medicaid expansion. It shows that Southerners are more likely than people living in other parts of the United States to be uninsured; that most Southern states have poverty rates above the national average; that without the Medicaid expansion (which most Southern states are not implementing), Medicaid eligibility levels for adults in the South remain low; that nearly 80% of the 4.8 million uninsured US adults who fall into the coverage gap live in the South; and that the coverage gap in the South disproportionately affects people of color.
Visualizing Health Policy is a monthly infographic series produced in partnership with the Journal of the American Medical Association (JAMA). The full-size infographic is freely available on JAMA’s website and is published in the print edition of the journal.
One of the most politically polarizing elements of the Affordable Care Act (ACA) is the law’s requirement that new private health insurance plans cover prescription contraceptives and services, including all methods approved by the Food and Drug Administration. The rule currently provides an exemption for houses of worship and an “accommodation” for religiously affiliated non-profit employers who object to providing contraceptive coverage; however all for-profit employers that provide health insurance must include this benefit. Over forty for-profit corporations have filed lawsuits claiming that the requirement violates their religious rights, and the cases of two corporations, Hobby Lobby and Conestoga Wood Specialties, have reached the Supreme Court. The oral arguments for these cases was heard at the end of March 2014, and in April, over four in ten (44 percent) of the public reported following the news coverage of the oral arguments “very” or “fairly closely.”1 The Supreme Court is expected to announce a decision on these cases in late June. This data note takes a closer look at what the public thinks about this issue.
A majority of the public (58 percent) supports the law’s requirement that private health insurance plans cover the full cost of birth control. On the issue facing the Supreme Court, a somewhat smaller majority (53 percent) believes the contraceptive coverage rule should apply to for-profit companies, even if it violates their owners’ personal religious beliefs, while four in ten (41 percent) say employers that object on religious grounds should not be subject to the requirement, even if it means their female employees will have to pay the cost of birth control themselves. As illustrated in Figure 1, gender and party differences exist on both of these questions, with women more likely to support the requirement than men, and those who identify as Democrats and independents more likely to support it than Republicans.
Figure 1: Support For Contraceptive Requirement By Gender and Political Party
TOTAL
GENDER
PARTY ID
Men
Women
Republican
Independent
Democrat
In general, do you support or oppose the health care law’s requirement that private health insurance plans cover the full cost of birth control?
Support
58%
48%
67%
35%
60%
78%
Oppose
32
41
24
56
31
17
With the exception of certain religious organizations, employers are now required to cover the cost of preventive services including prescription birth control in their health plans. Which comes closer to your view about how this law should apply to for-profit companies whose owners object to birth control on religious grounds?
For-profit companies SHOULD be required to cover birth control in their workers’ health plans, even if it violates their owners’ personal religious beliefs
53%
46%
59%
32%
50%
74%
For-profit companies should NOT be required to cover birth control in their workers’ health plans, even if it means their female employees will have to pay the cost of birth control themselves
41
48
35
66
43
22
NOTE: Don’t Know/ Refused and Neither/ Other (VOL.) responses not shown
Religious identification also plays a role, with support among white Evangelical Protestants much lower than among other groups. Half (50 percent) of white Evangelical Protestants are opposed to the requirement in general, and about two-thirds of this group (68 percent) believe the requirement should not apply to for-profit companies whose owners have religious objections. By contrast, majorities of Catholics, white Mainline Protestants, Protestants who are members of racial and ethnic minority groups, and those who identify with other religions (or no religion) both support the requirement believe it should apply to for-profit companies regardless of their owners objections (Figure 2). Even when controlling for demographic factors, gender, party identification and religious affiliation remain significant predictors of whether an individual supports or opposes the requirement and whether they say it should apply to for-profit companies.
Figure 2: Support For Contraceptive Requirement By Religious Identification
TOTAL
RELIGIOUS IDENTIFICATION
White Evangelical
White Mainline Protestant
Non-White Protestant
Catholic
Other/None
In general, do you support or oppose the health care law’s requirement that private health insurance plans cover the full cost of birth control?
Support
58%
42%
60%
60%
58%
65%
Oppose
32
50
28
30
33
25
With the exception of certain religious organizations, employers are now required to cover the cost of preventive services including prescription birth control in their health plans. Which comes closer to your view about how this law should apply to for-profit companies whose owners object to birth control on religious grounds?
For-profit companies SHOULD be required to cover birth control in their workers’ health plans, even if it violates their owners’ personal religious beliefs
53%
28%
55%
56%
58%
62%
For-profit companies should NOT be required to cover birth control in their workers’ health plans, even if it means their female employees will have to pay the cost of birth control themselves
41
68
36
39
38
31
NOTE: Don’t Know/ Refused and Neither/ Other (VOL.) responses not shown
Support for the contraceptive coverage requirement also varies by age, and looking at age and gender together illuminates an interesting pattern. Across all age groups, women are consistently more likely than men to support the contraceptive coverage requirement and its application to for-profit companies whose owners have religious objections (Figure 3). While support decreases with age for both men and women, majorities of women in all age groups are supportive of the requirement and believe for-profit companies should abide by it even if their owners have religious objections, while among men, support only reaches above 50 percent for the youngest group (those ages 18-34).
Figure 3
White Evangelical Protestants, who account for 18 percent of all adults, have some of the highest levels of opposition to the contraceptive coverage requirement; half say they oppose the law’s requirement and nearly seven in ten (68 percent) say that for-profit companies whose owners have religious objections should be exempt. However, white Evangelical Protestant men and women vary in their levels of support. A majority of white Evangelical men (58 percent) say they oppose the requirement, while a slim majority of white Evangelical women (52 percent) say they support it (Figure 4). However, support among white Evangelical women decreases significantly when asked their view about whether the requirement should apply to for-profit companies whose owners have religious objections. On this question, one-third of white Evangelical women (34 percent) believe that for-profit companies should be required to cover birth control, while over six in ten (63 percent) say they should not be required to cover birth control if their owners object on religious grounds.
Figure 4: Support For Contraceptive Requirement By Gender Among White Evangelical Protestants
AMONG WHITE EVANGELICAL PROTESTANTS
Total
Men
Women
In general, do you support or oppose the health care law’s requirement that private health insurance plans cover the full cost of birth control?
Support
42%
30%
52%
Oppose
50
58
44
With the exception of certain religious organizations, employers are now required to cover the cost of preventive services including prescription birth control in their health plans. Which comes closer to your view about how this law should apply to for-profit companies whose owners object to birth control on religious grounds?
For-profit companies SHOULD be required to cover birth control in their workers’ health plans, even if it violates their owners’ personal religious beliefs
28%
21%
34%
For-profit companies should NOT be required to cover birth control in their workers’ health plans, even if it means their female employees will have to pay the cost of birth control themselves
68
76
63
NOTE: Don’t Know/ Refused and Neither/ Other (VOL.) responses not shown
Among Catholics, who make up about one in five adults, a majority supports both the contraceptive coverage requirement and its application to for-profit companies whose owners have religious objections. Gender differences within Catholics are again apparent on both questions, with Catholic men being nearly evenly divided on both questions, and about two-thirds of Catholic women in support (Figure 5).
Figure 5: Support For Contraceptive Requirement By Gender Among Catholics
AMONG CATHOLICS
Total
Men
Women
In general, do you support or oppose the health care law’s requirement that private health insurance plans cover the full cost of birth control?
Support
58%
46%
67%
Oppose
33
46
23
With the exception of certain religious organizations, employers are now required to cover the cost of preventive services including prescription birth control in their health plans. Which comes closer to your view about how this law should apply to for-profit companies whose owners object to birth control on religious grounds?
For-profit companies SHOULD be required to cover birth control in their workers’ health plans, even if it violates their owners’ personal religious beliefs
58%
49%
66%
For-profit companies should NOT be required to cover birth control in their workers’ health plans, even if it means their female employees will have to pay the cost of birth control themselves
38
51
28
NOTE: Don’t Know/ Refused and Neither/ Other (VOL.) responses not shown
Similar to public opinion of the health care law as a whole, opinion about the contraceptive coverage requirement is divided along party affiliation. Republicans are more likely to oppose the requirement (56 percent), Democrats are more likely to support it (78 percent), and independents fall in between (though a solid majority – 60 percent – of independents support it). Across all political identifications, women are more likely than men to support the requirement and more likely to think it should apply to for-profit companies (Figure 6).
Figure 6: Support For Contraceptive Requirement By Party Identification Among Men and Women
TOTAL
MEN
WOMEN
Rep
Ind
Dem
Rep
Ind
Dem
Rep
Ind
Dem
In general, do you support or oppose the health care law’s requirement that private health insurance plans cover the full cost of birth control?
Support
35%
60%
78%
24%
50%
72%
46%
70%
83%
Oppose
56
31
17
65
39
24
45
22
10
With the exception of certain religious organizations, employers are now required to cover the cost of preventive services including prescription birth control in their health plans. Which comes closer to your view about how this law should apply to for-profit companies whose owners object to birth control on religious grounds?
For-profit companies SHOULD be required to cover birth control in their workers’ health plans
32%
50%
74%
25%
44%
71%
39%
57%
76%
For-profit companies should NOT be required to cover birth control in their workers’ health plans
66
43
22
72
49
26
59
36
18
NOTE: Don’t Know/ Refused and Neither/ Other (VOL.) responses not shown
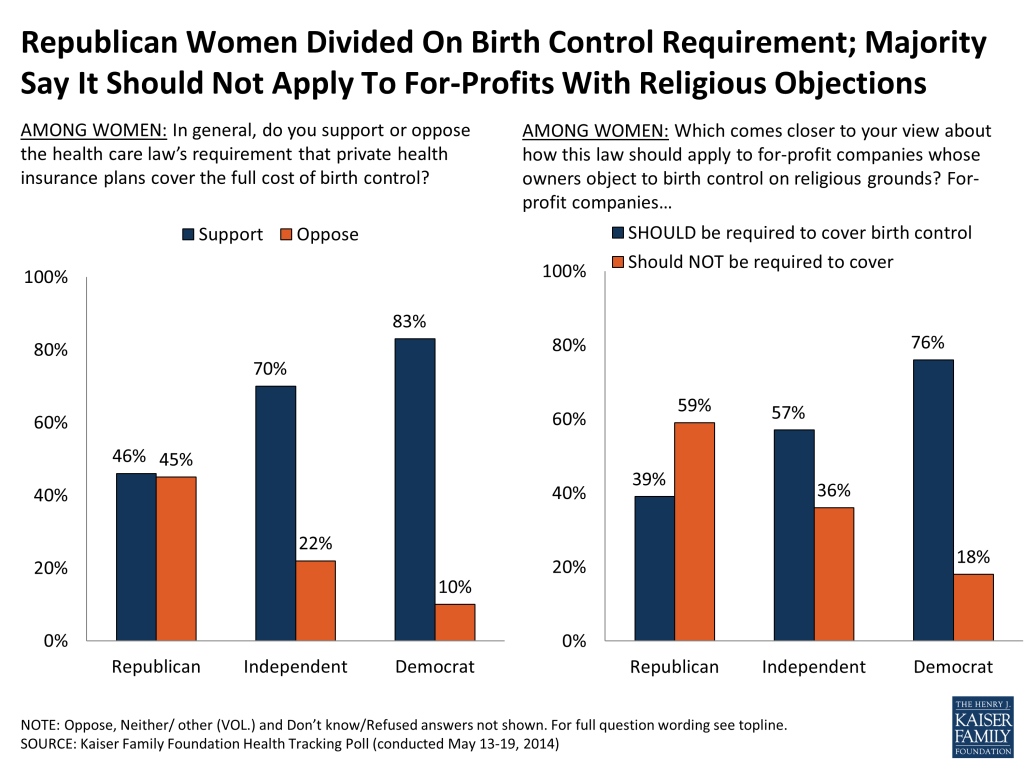
Although Republican women are more likely to support the requirement than Republican men, they are still much less likely to support it than independent and Democratic women. In fact, Republican women are one of the only subgroups of women in which support for the contraceptive requirement drops below 50 percent (46 percent support, 45 percent oppose). When asked whether for-profit companies should be required to cover contraception even if their owners object, a smaller share of Republican women (39 percent) say for-profit companies whose owners have religious objections should be required to cover birth control, while 59 percent say these companies should not be subject to the requirement (Figure 7).
Figure 7
While the majority of adults support the ACA’s contraceptive coverage requirement in private health plans and most feel that it should apply to for-profit employers regardless of owners’ religious views (the question currently being considered by the Supreme Court), there are significant differences between women and men. Support is stronger among women than men, and women’s support holds across age groups, religious beliefs, and political party affiliations, with majorities of most subgroups of women supporting the contraceptive coverage policy and believing the requirement should apply to for-profit companies whose owners have religious objections. Support among men is lower than among women and does not rise above 50 percent for most subgroups of men. However, the importance of party affiliation is evident, as Republican women and Democratic men are notable exceptions to these overall patterns. With public opinion on this topic deeply divided by party, the Supreme Court’s ruling is likely to reignite debate across the political spectrum.
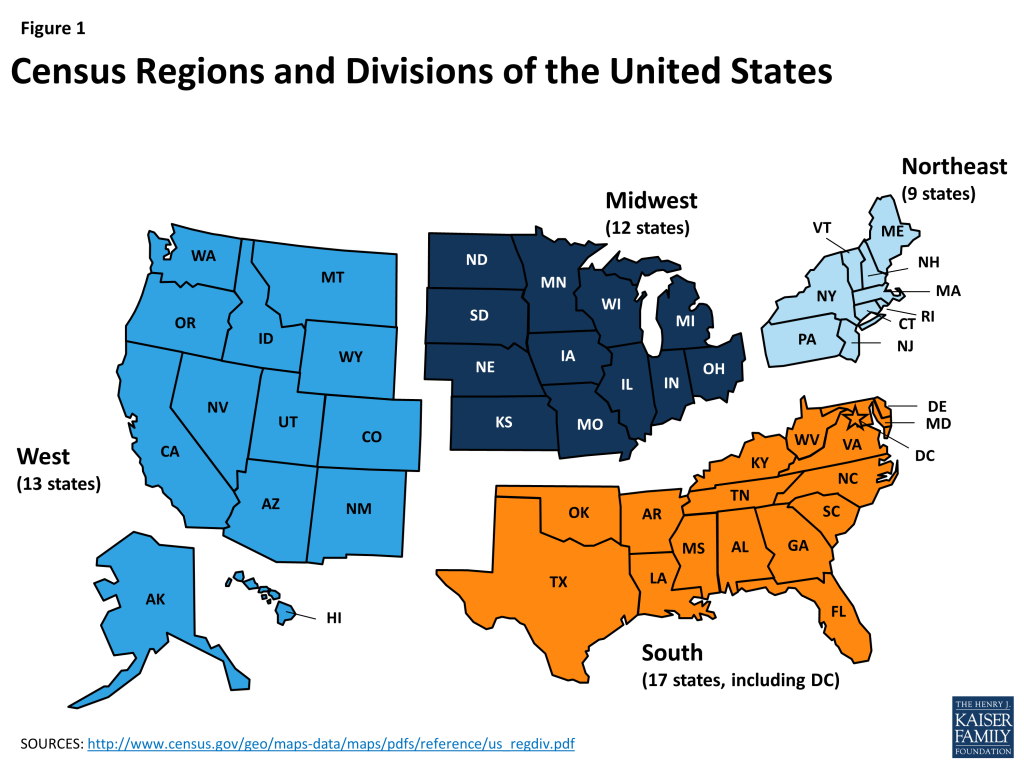
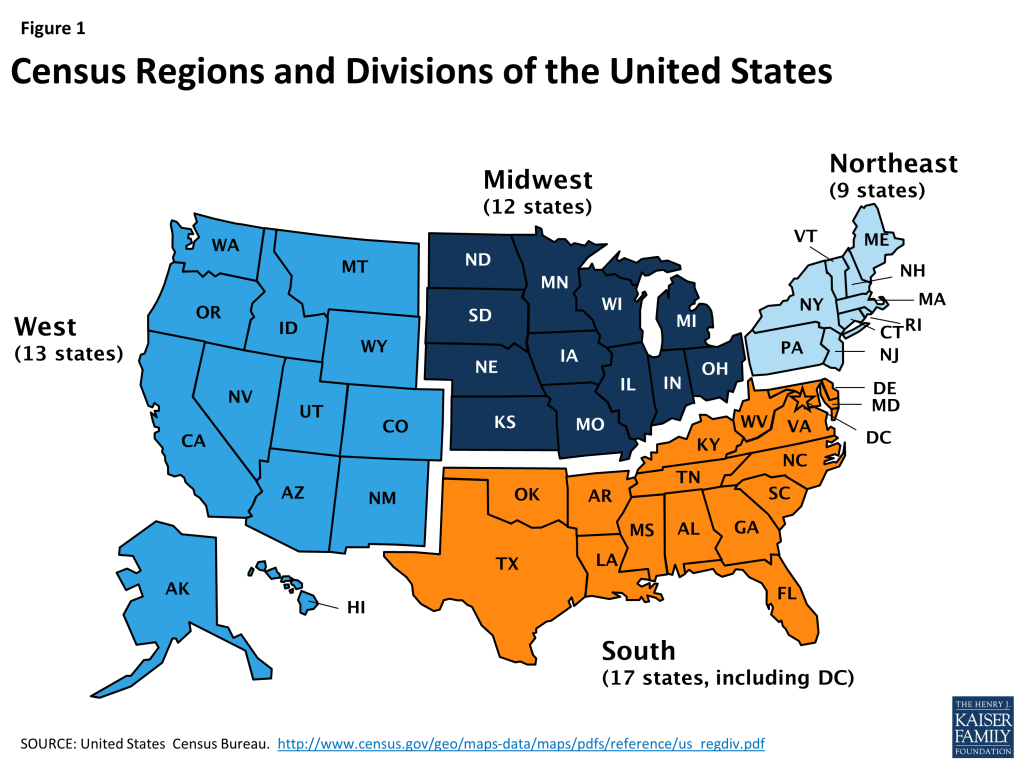
Over 115 million individuals live in the American South today, and together, they make up over a third of the U.S. population. The South, as defined by the U.S. Census Bureau, includes 17 states, stretching from Oklahoma, Texas, and Arkansas on the West to the Atlantic Ocean on the East, and northward to Delaware, Maryland, Kentucky, and West Virginia (Figure 1). This brief provides an overview of health coverage and care in the South today and the potential impact of the Affordable Care Act (ACA) health coverage expansions. It includes key findings in several areas including the following:
Figure 1: Census Regions and Divisions of the United States
Demographics. The southern population is large and growing rapidly. The region’s population is racially and ethnically diverse and also diverse across a number of factors including citizenship status, age, urban-rural composition, and income. Southerners are significantly more likely than those in the Northeast and Midwest to be poor, and the South includes states with some of the highest poverty rates.
Health Coverage and Care Today. The South has faced longstanding disparities in health coverage, health status, and health care relative to the rest of the United States. Compared to those in other regions, Southerners are more likely to be uninsured, less likely to have access to needed health services, and more likely to experience a number of chronic health conditions such as diabetes and heart disease.
The Impact of the ACA Coverage Expansions. The ACA has the potential to extend health coverage to many uninsured Southerners through an expansion of Medicaid and the creation of new Health Insurance Marketplaces with tax credit subsidies. However, most southern states are not moving forward with the Medicaid expansion, and many poor uninsured Southerners will not gain a new coverage option and may remain uninsured. Even with these gaps in coverage, millions of uninsured Southerners are now eligible for coverage, and effective outreach and enrollment efforts are key for ensuring that they are enrolled.
Translating Coverage to Care: Delivery Systems and the Safety Net. Improving health outcomes in the long-term will take more than expanding coverage. It will be important to ensure that insured individuals as well as Southerners who remain uninsured are connected to care. Ongoing development of provider capacity and delivery system innovation in the South will be important for addressing health care needs and challenges.
Issue Brief: Profile Of The Southern Population Today
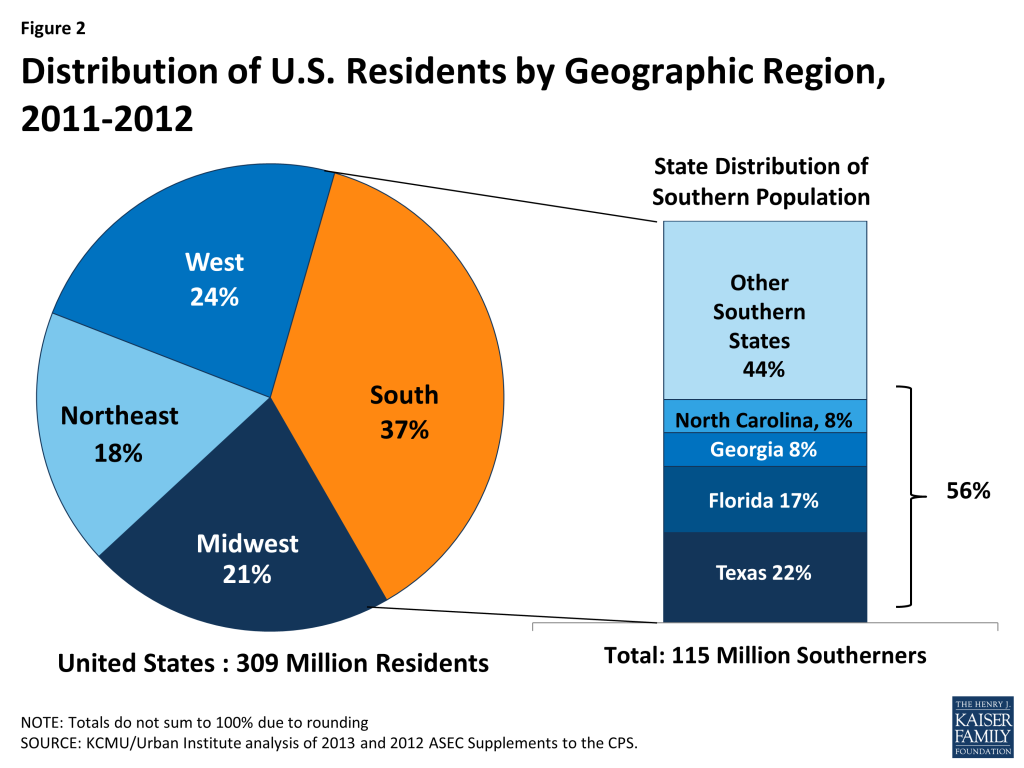
As of 2012, 115 million individuals lived in the 17 southern states, accounting for over a third (37%) of US residents nationally (Figure 2). Over half (56%) of the southern population resides in just four states – Texas, Florida, Georgia, and North Carolina. These four most populous southern states also include more than a fifth (21%) of the total US population.1 The southern population is growing rapidly, largely due to high domestic and international migration to the South. The Census Bureau estimates that over half (52%) of the increase in the U.S. population by 2030 will be a result of population growth in the South.2
Figure 2: Distribution of U.S. Residents by Geographic Region, 2011-2012
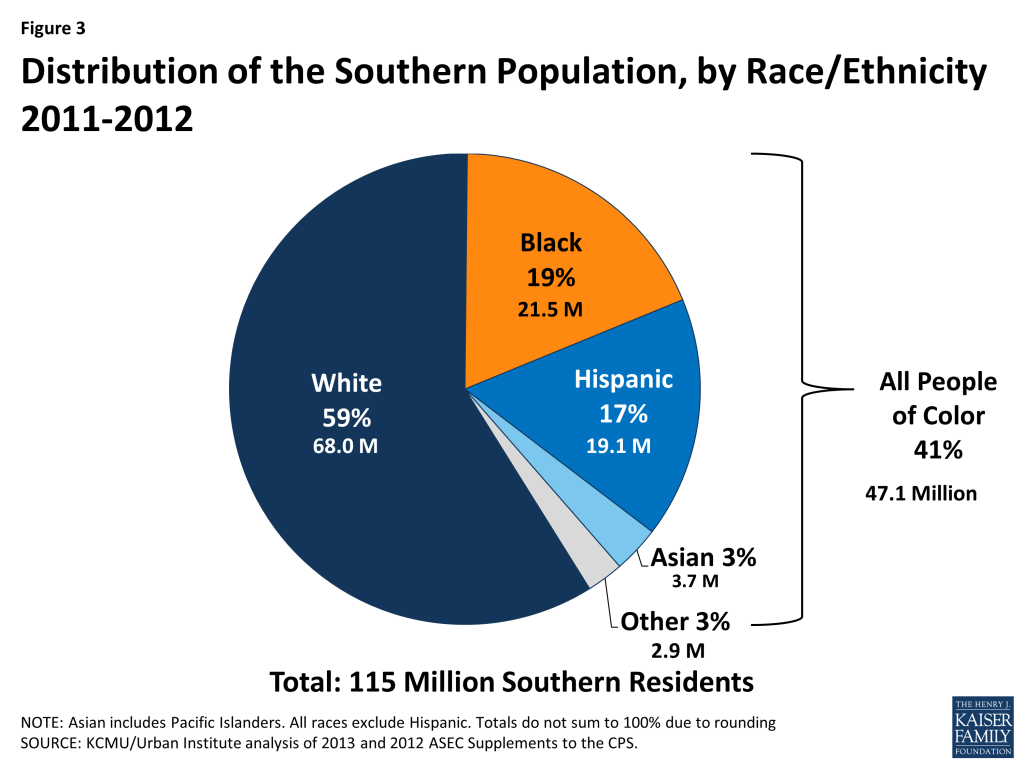
The southern population is racially and ethnically diverse. People of color make up 41% of the total southern population (Figure 3). However, the share of the population who are people of color varies across southern states from less than 15% in Arkansas and West Virginia to over half of residents in the District of Columbia and Texas (see Appendix Table 1).
Figure 3: Distribution of the Southern Population, by Race/Ethnicity 2011-2012
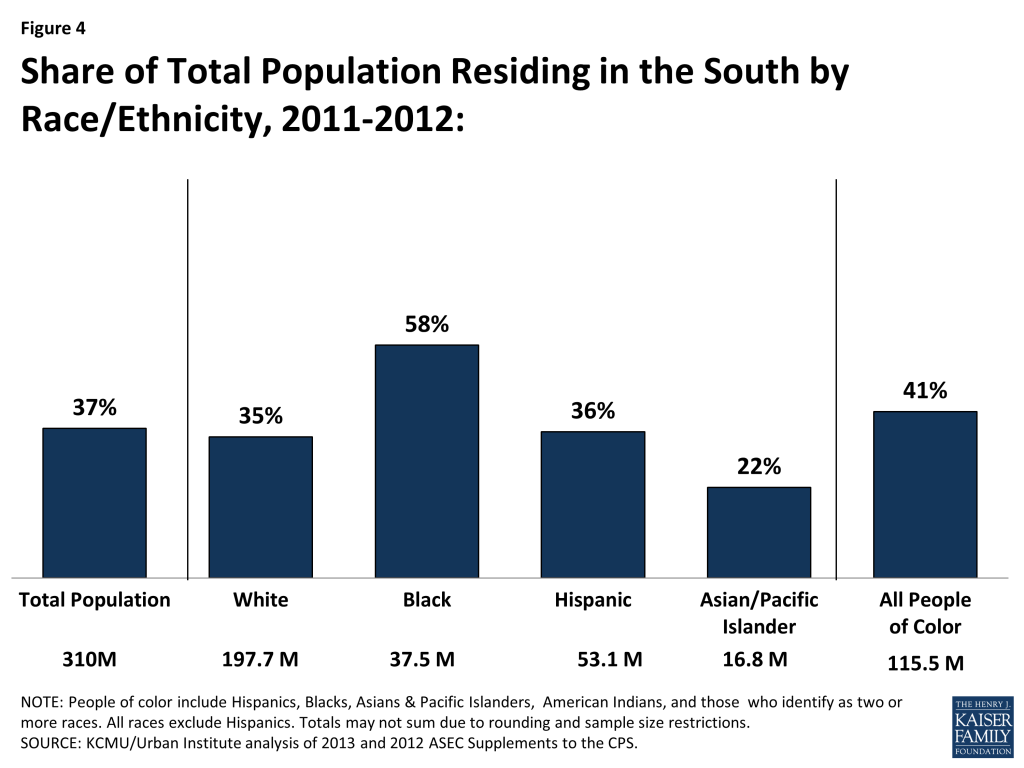
Moreover, more than four in ten (41%) of all people of color reside in the South. However, the share of people residing in the South varies across racial and ethnic groups, with nearly six in ten Blacks residing in the South (58%) compared to about one in five Asians and Pacific Islanders (22%) (Figure 4).
Figure 4: Share of Total Population Residing in the South by Race/Ethnicity, 2011-2012
The southern population is also diverse across a number of other characteristics, including citizenship status, age, educational attainment, and urban-rural composition. Similar to other regions, the large majority (89%) of Southerners are U.S.-born citizens, while about one in ten (11%) are immigrants, who include both naturalized citizens and non-citizens. The age distribution of the southern population is similar to that of other regions as well. About one-quarter (26%) of the region’s residents are children and 14% are elderly individuals. Young adults aged 19-34 account for 21% of the population. While the large majority (89%) of Southerners live in metropolitan settings, Southerners are more likely than those in the Northeast and West to live in a rural area (see Appendix Table 2).
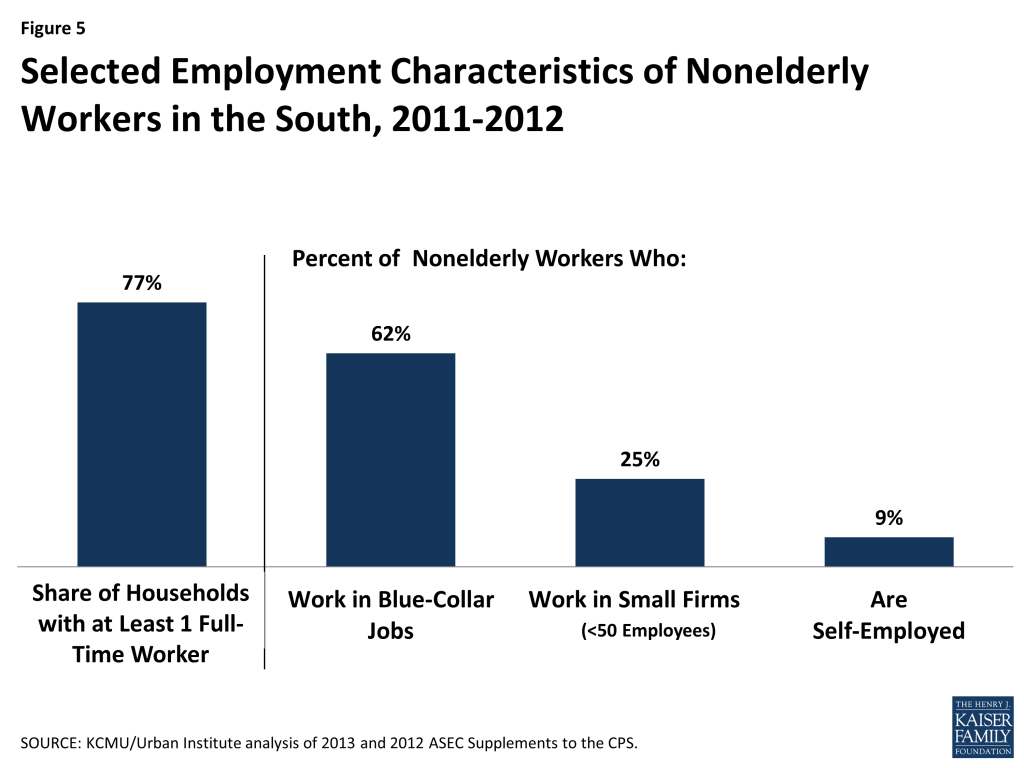
Overall, three-quarters (77%) of nonelderly individuals in the South live in a household with at least one full-time worker. The majority of southern workers (62%) are in blue-collar jobs, most commonly in the service, trade, health services, and manufacturing industries.3 More than 15% of all workers have jobs in services, arts, or entertainment, and almost 14% of workers are in wholesale or retail trade.4 One in four workers in the South (25%) are employed by small firms or businesses with fewer than 50 employees, and 9% of Southern workers are self-employed (Figure 5). These work patterns in the South are similar to those of the general US population and other regions. 5
Figure 5: Selected Employment Characteristics of Nonelderly Workers in the South, 2011-2012
The South includes states with some of the nation’s highest poverty rates. Overall, the poverty rate for the South is not significantly different from the nation’s poverty rate, with just over one in five nonelderly southern residents (22%) living in a poor household.6 However, Southerners are significantly more likely than those in the Northeast and Midwest to be poor.7 Further, poverty rates vary widely across the southern states, and the region includes several states, including Louisiana, Mississippi, Arkansas, and the District of Columbia, that have among the highest rates of poverty in the nation (Table 2).
Table 2: Number and Share of Nonelderly Southern Population Living in a Poor Household by State, 2011-2012
State
Number Below Poverty
Percent Below Poverty
United States
56,626,000
21%
South
22,293,000
22%
Louisiana
1,086,000
28%
Mississippi
698,000
28%
Arkansas
646,000
26%
District of Columbia
137,000
25%
South Carolina
952,000
24%
Alabama
985,000
24%
Georgia
2,028,000
24%
Kentucky
879,000
24%
Tennessee
1,262,000
23%
Texas
5,363,000
23%
West Virginia
345,000
22%
Florida
3,431,000
22%
North Carolina
1,772,000
22%
Oklahoma
682,000
21%
Delaware
155,000
20%
Virginia
1,097,000
16%
Maryland
776,000
15%
SOURCE: KCMU/Urban Institute analysis of 2013 and 2012 ASEC Supplements to the CPS.
Issue Brief: Health Coverage And Care In The South Today
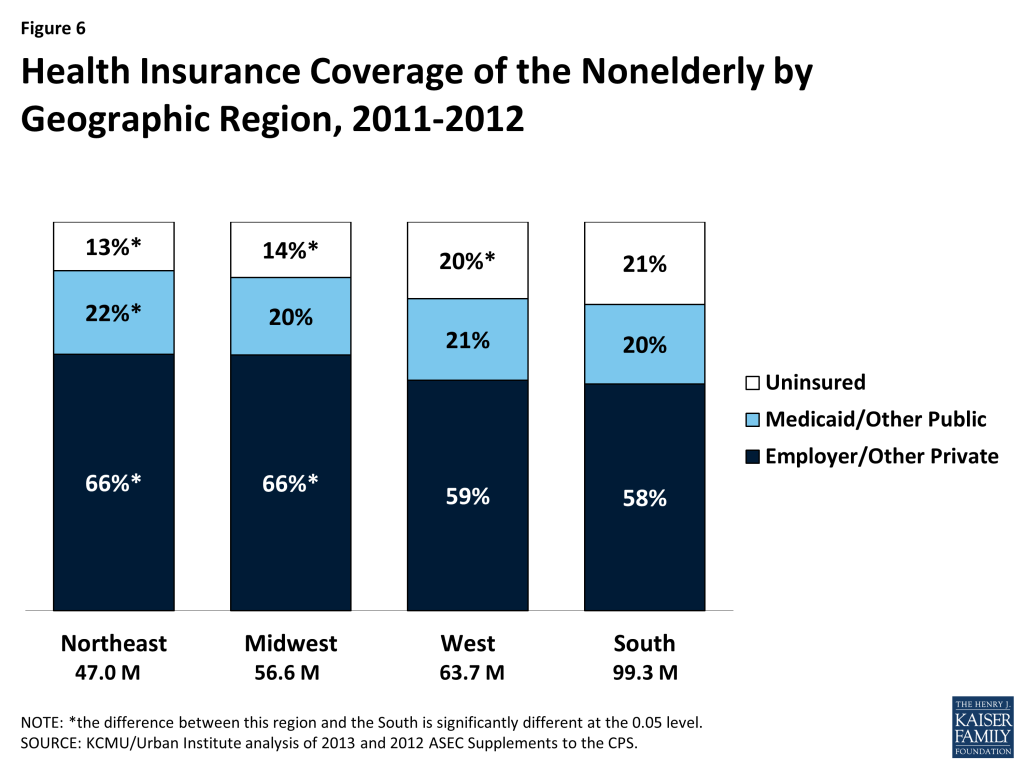
Southerners are less likely to have private coverage and more likely to be uninsured compared to individuals in the Northeast and Midwest. The low rate of private coverage among nonelderly Southerners likely reflects the fact that a large share of southern adults work in low-wage, blue collar jobs or small firms that often do not offer health coverage, and private coverage on the individual market has historically been unaffordable for many families. As a result of their lower rate of private coverage, nonelderly Southerners are more likely than those in the Northeast and Midwest to be uninsured, with more than one in five (21%) lacking coverage (Figure 6). In particular, Texas and Florida have some of the highest uninsured rates in the country at 27% and 25%, respectively (see Appendix Tables 3 and 4). Moreover, the majority of uninsured individuals in the South live in Texas, Florida, and Georgia, which together account for two-thirds (65%) of all nonelderly uninsured Southerners and 44% of the uninsured nationwide.8
Figure 6: Health Insurance Coverage of the Nonelderly by Geographic Region, 2011-2012
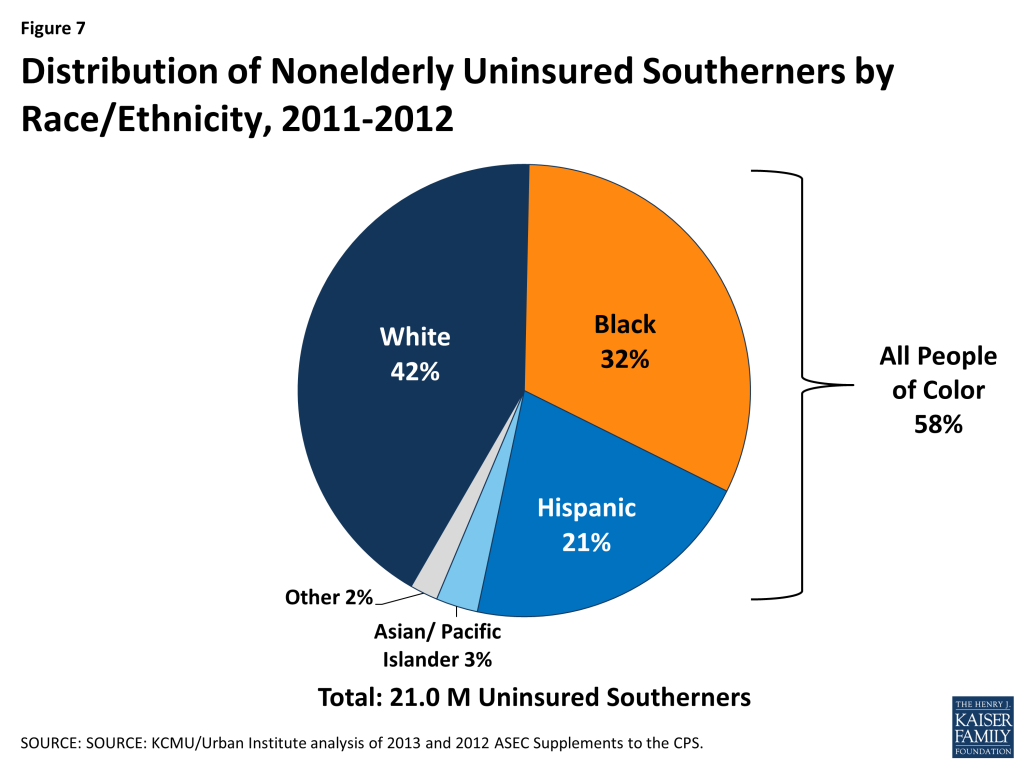
People of color make up the majority of uninsured people in the South (58%), although more than four in ten uninsured Southerners (42%) are White (Figure 7). Nearly one-third of uninsured Southerners are Black, and about one in five are Hispanic.
Figure 7: Distribution of Nonelderly Uninsured Southerners by Race/Ethnicity, 2011-2012
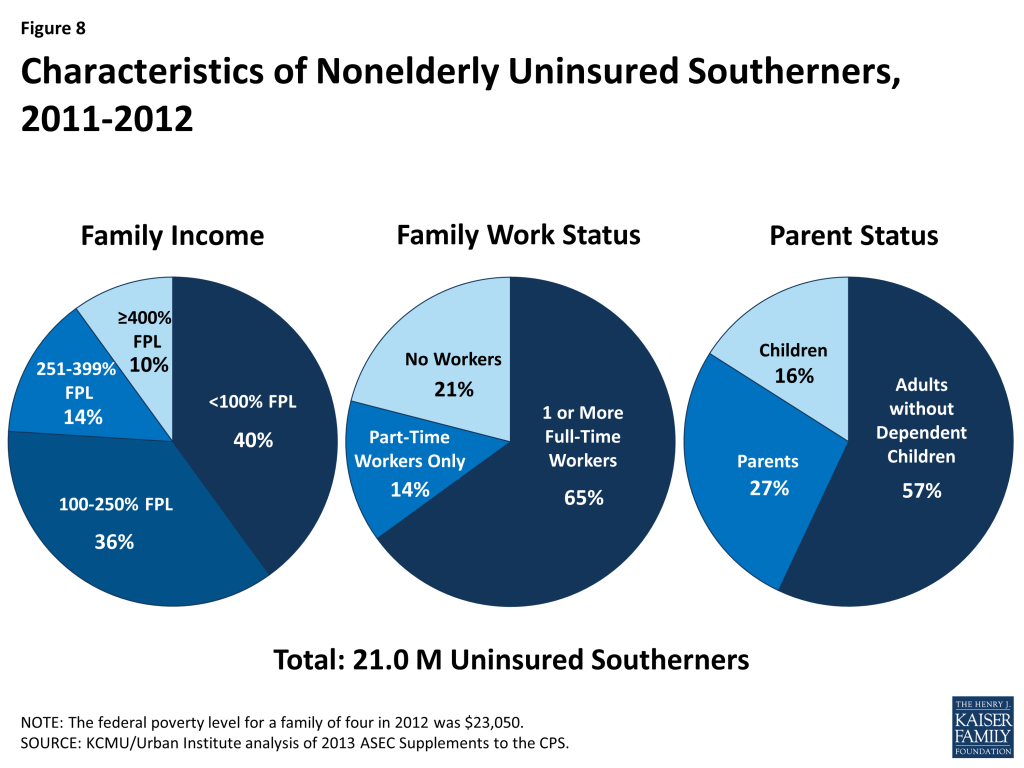
As in other regions, most uninsured Southerners are low-income working adults (Figure 8). Four in ten uninsured Southerners have income below the poverty limit ($11,670 for an individual in 2014), and nine in ten have income below 400% of poverty ($46,680 for an individual). Most uninsured Southerners are also in working families. Nearly two-thirds (65%) are in households with at least one full-time worker. Moreover, a large majority (84%) of nonelderly uninsured individuals in the South are adults. Over half (57%) are adults without dependent children, and about a quarter (27%) are parents. Children account for 16% of the uninsured in the region. These coverage patterns reflect the fact that states have significantly expanded Medicaid and CHIP eligibility for children, helping to fill their gap in private coverage, while Medicaid eligibility for adults has historically been very limited in most states.
Figure 8: Characteristics of Nonelderly Uninsured Southerners, 2011-2012
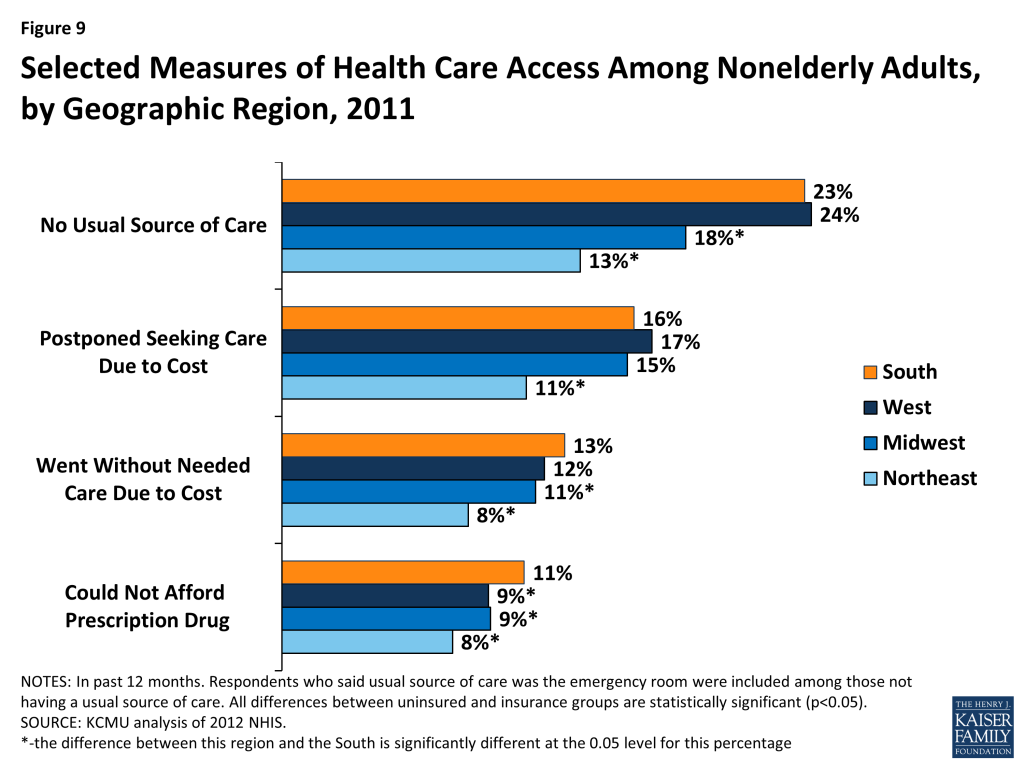
Reflecting their limited coverage rates, adults in the South are more likely than those in other regions to report difficulty accessing needed health care services. Nearly one-quarter of Southerners report that they do not have a usual source of care, which is significantly higher than the share of adults without a usual source of care in the Midwest and Northeast. Compared to adults in other regions, particularly the Northeast, Southerners are also more likely to report having postponed seeking care or gone without needed care or drugs due to cost (Figure 9).
Figure 9: Characteristics of Nonelderly Uninsured Southerners, 2011-2012
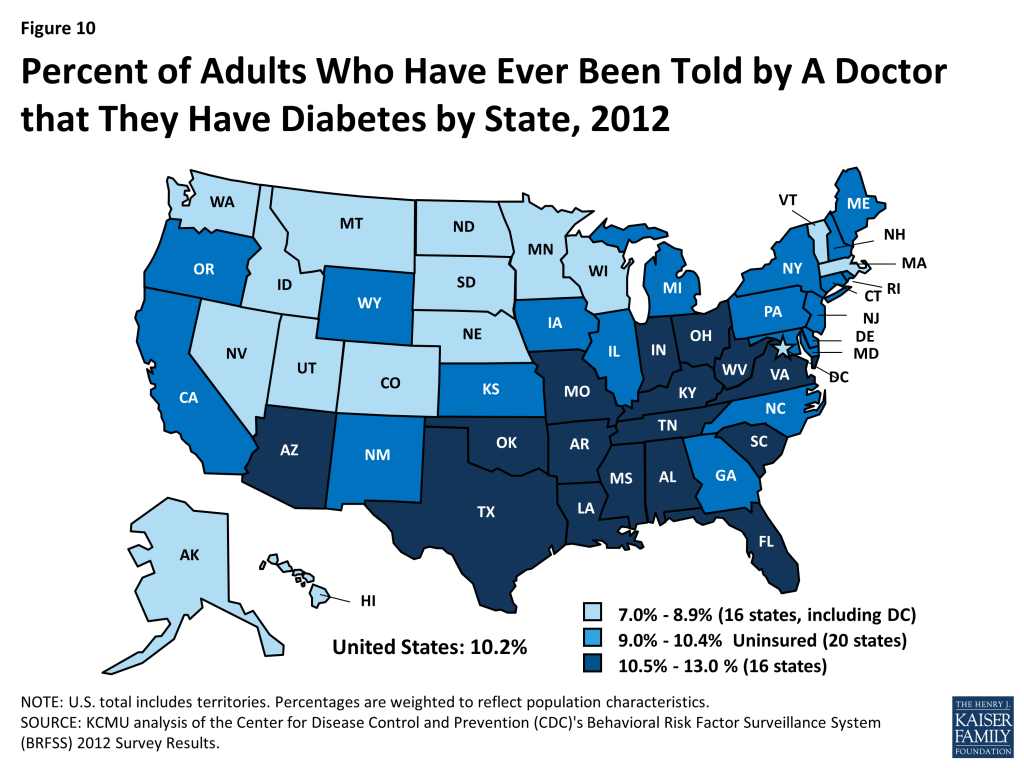
Access to health coverage and care is important for Southerners, especially given the high prevalence of chronic health conditions in the South. Most of the states with the highest rates of diabetes are in the South (Figure 10). Similarly, the South includes states with the highest heart disease death rates, infant mortality rates, and cancer death rates in the country.9 Adults in the South are also significantly more likely than those in the Northeast and West to be overweight or obese.10 While a broad array of factors contributes to the relatively high chronic disease rates and poor health outcomes in the South, a key step in addressing these disparities is to ensure that individuals have health coverage that enables them to access preventive and primary care and ongoing treatment and services to meet their health needs.
Figure 10: Percent of Adults Who Have Ever Been Told by A Doctor that They Have Diabetes by State, 2012
Issue Brief: Health Coverage In The South In 2014
The Impact of the Affordable Care Act Coverage Expansions
A key goal of the ACA is to reduce the number of uninsured individuals through the creation of new coverage options that will allow individuals to access needed health care services. The ACA established a continuum of new coverage options including an expansion of Medicaid eligibility to nearly all adults with incomes at or below 138% FPL ($16,105 for an individual or $27,310 for a family of three in 2014) and the creation of Health Insurance Marketplaces with premium tax credit subsidies to help individuals with incomes up to 400% FPL ($46,680 for an individual or $79,160 for a family of three in 2014) purchase coverage. The ACA also includes provisions designed to provide consumers a streamlined, coordinated enrollment experience across health coverage programs. The combined effects of the coverage expansions, streamlined enrollment system, and broad outreach and enrollment efforts are expected to bring many uninsured individuals into coverage.
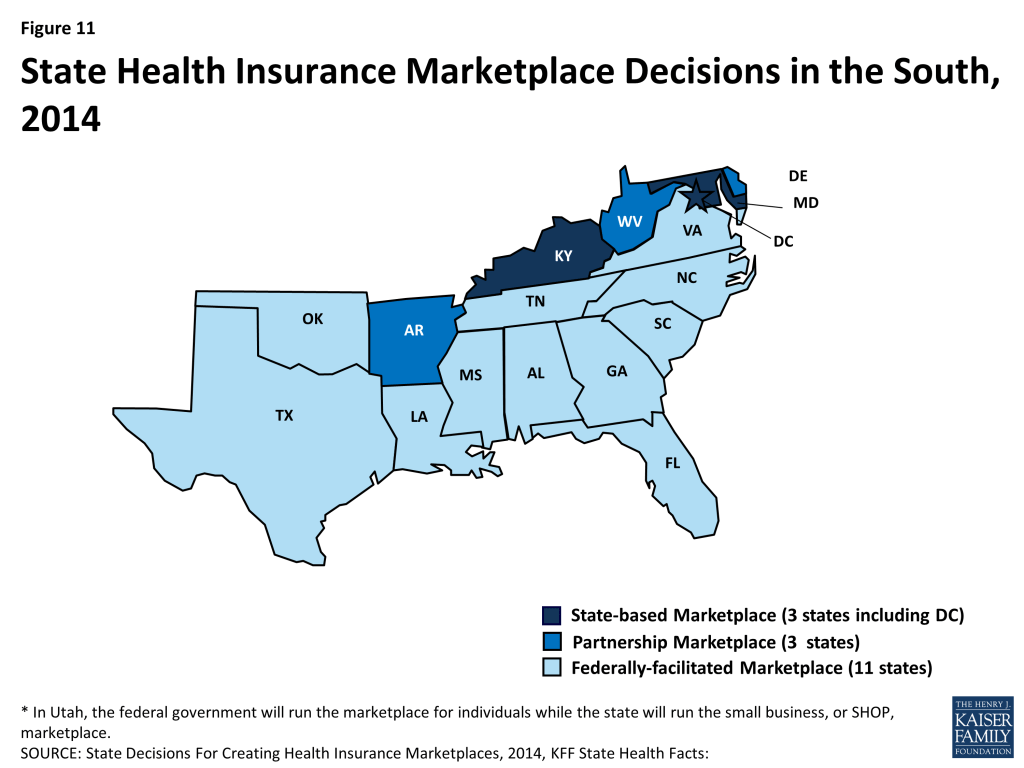
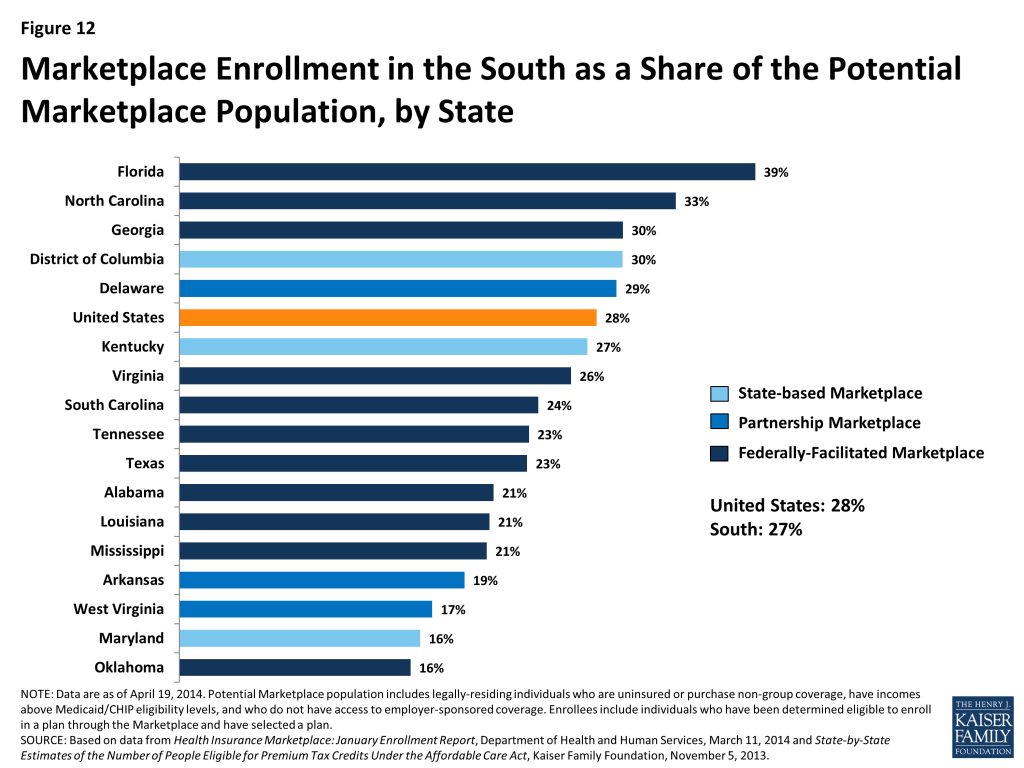
The majority of southern states (11 of 17) are relying on the Federally-facilitated Marketplace in 2014, although three (DC, KY, and MD) elected to establish their own State-based Marketplaces. Three additional southern states (AR, DE, and WV) are operating a Marketplace in partnership with the federal government (Figure 11). Marketplace enrollment varies across the southern states. As of April 19, 2014, after the initial annual open enrollment period, nearly 3.5 million Southerners had enrolled health coverage through a Marketplace– about 27% of the potential Marketplace population in the region.11 However, enrollment varied significantly by state, from 16% of the eligible population in Oklahoma to 39% of potential enrollees in Florida (Figure 12).
Figure 11: State Health Insurance Marketplace Decisions in the South, 2014Figure 12: Marketplace Enrollment in the South as a Share of the Potential Marketplace Population, by State
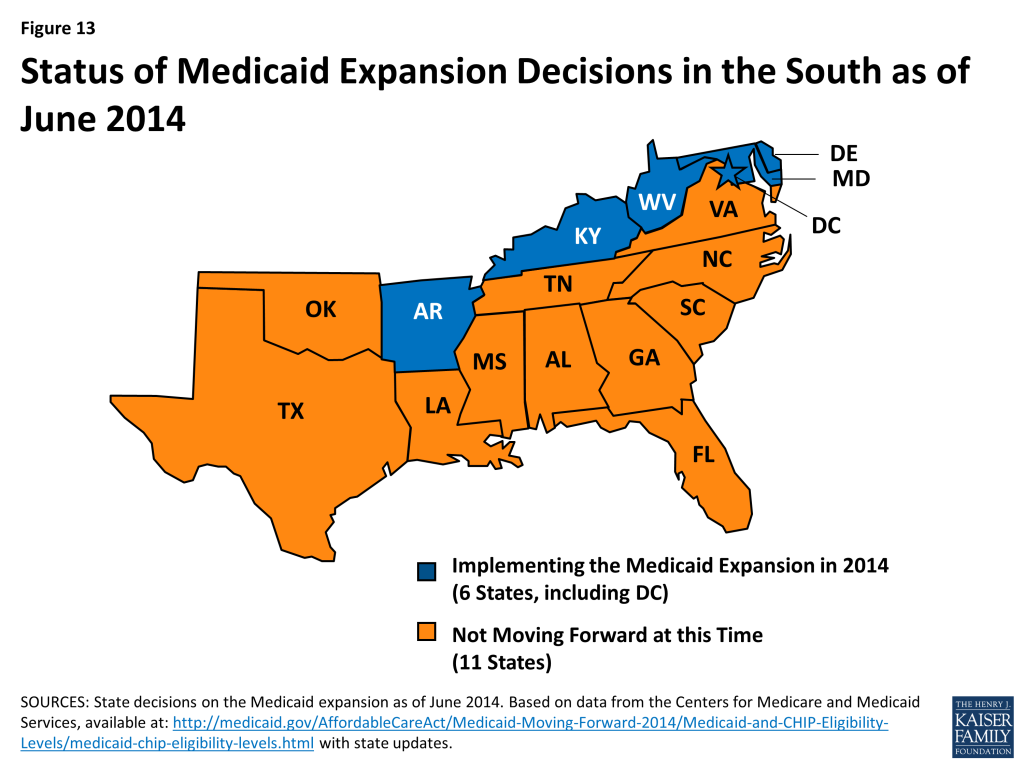
The ACA offers the potential to significantly increase coverage in the South, especially for low-income adults, but gaps in coverage will remain, as many southern states are not implementing the Medicaid expansion. As enacted, the Medicaid expansion was to apply to all states, setting a national income floor of 138% FPL for all adults, but the Supreme Court ruling on the ACA effectively made the expansion a state option. Just over half of the states (27 states, including DC), including 6 of the 17 Southern states, are implementing the expansion in 2014 (Figure 13).12 There is no deadline by which states must implement the Medicaid expansion, so additional states may choose to expand in the future.
Figure 13: Status of Medicaid Expansion Decisions in the South as of June 2014
Overall, southern states experienced a 7% increase in Medicaid enrollment in April 2014, compared to the monthly average in the states during the three months prior to open enrollment. This was similar to enrollment growth in the Northeast (7%) and Midwest (8%), but much lower than the Medicaid enrollment growth rate in the West during the same period (19%). The six southern states that are implementing the Medicaid expansion experienced much higher enrollment growth compared to states that are not expanding (26% vs. 4%). However, some southern non-expansion states experienced notable growth, including South Carolina, where Medicaid enrollment increased by 14% between Summer 2013 and April 2014.[endnote 109111-11]
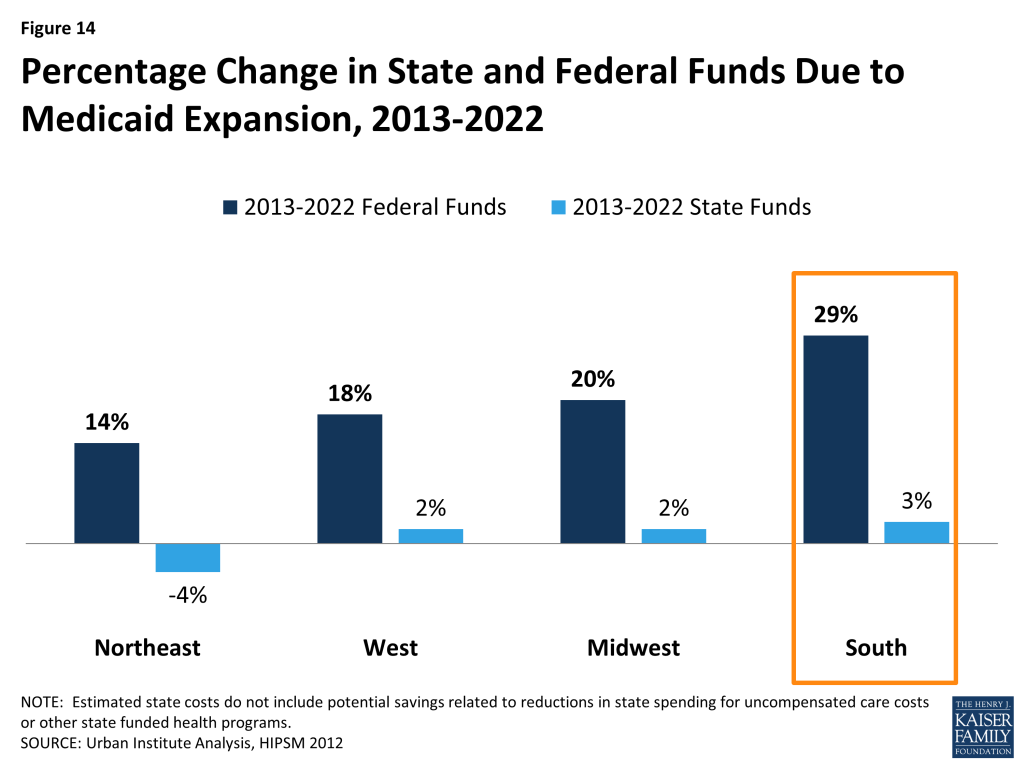
State Medicaid expansion decisions have significant fiscal implications for state spending on uncompensated care costs and indigent care programs, state economies, and for providers.13 If all states expanded Medicaid, southern states could experience the largest percentage increase in federal funds with the Medicaid expansion, compared to states in other regions (Figure 14).
Figure 14: Percentage Change in State and Federal Funds Due to Medicaid Expansion, 2013-2022
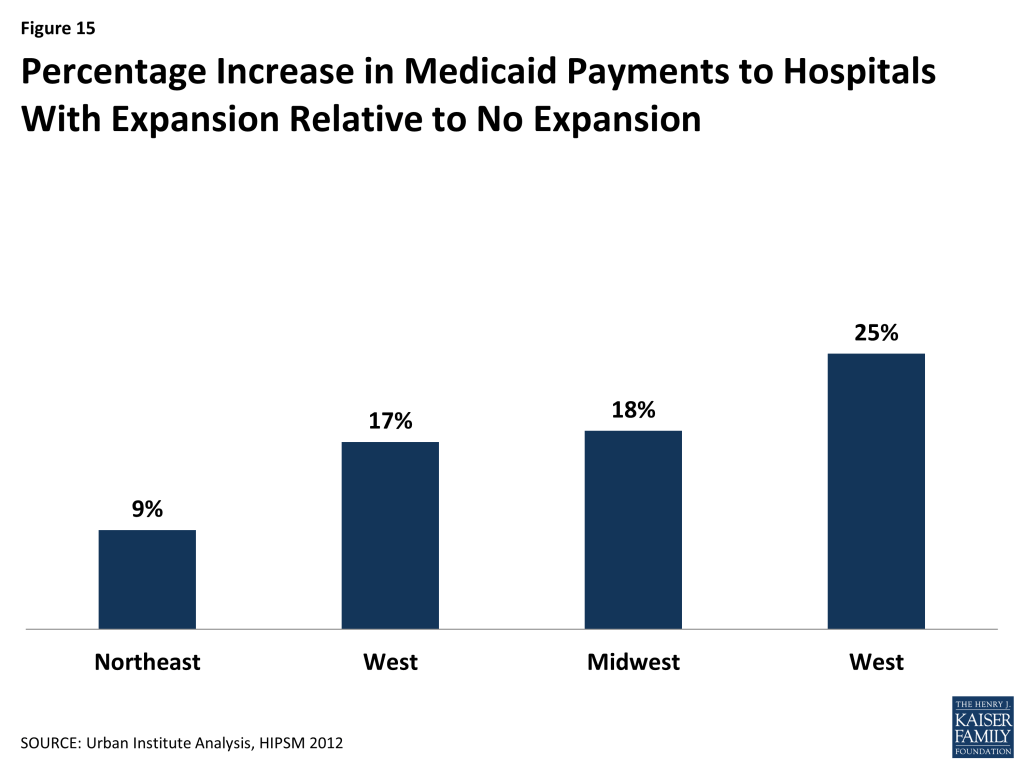
If all states expanded Medicaid, southern states could also experience a 25 percent increase in Medicaid payments to hospitals relative to no expansion – the highest percentage increase of any region (Figure 15).
Figure 15: Percentage Increase in Medicaid Payments to Hospitals With Expansion Relative to No Expansion
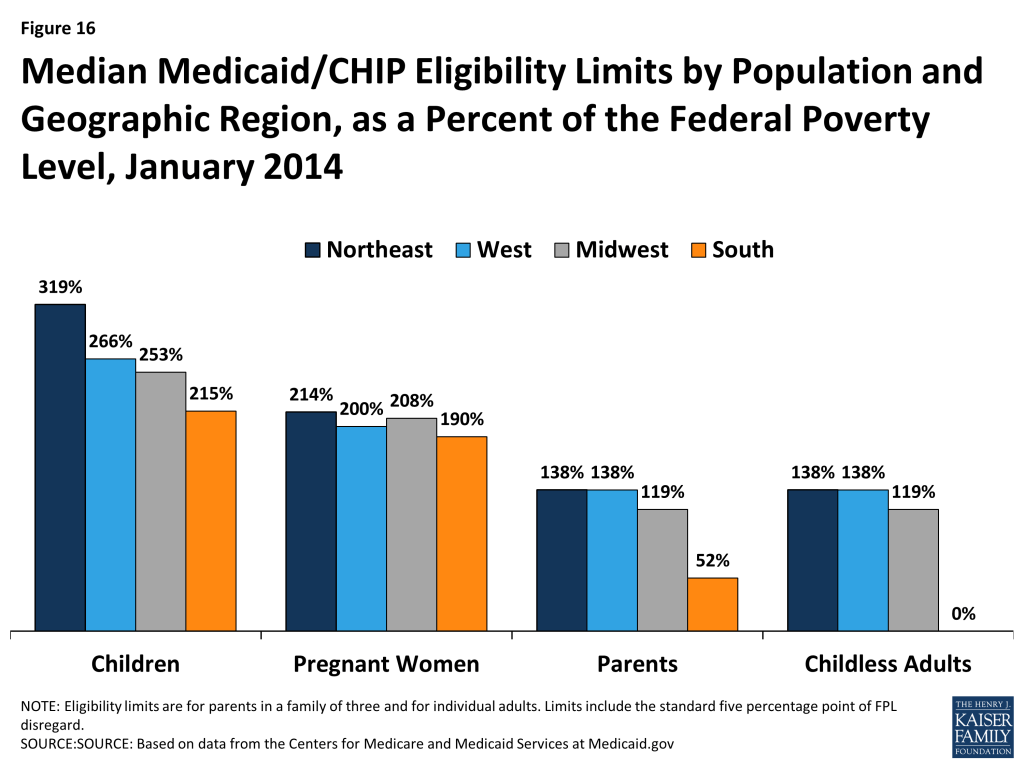
Without the Medicaid expansion, Medicaid eligibility for adults remains very limited in the South. The ACA Medicaid expansion was designed to fill longstanding gaps in Medicaid eligibility for parents and other non-disabled adults. In the absence of the expansion, adults without dependent children in 11 of the 17 southern states remain ineligible for Medicaid regardless of how low their incomes are. Moreover, eligibility limits for parents remain below 50% FPL ($9,895 per year for a family of three) in eight southern states (see Appendix Table 5). Overall, the median Medicaid eligibility limits for parents (52% FPL) and childless adults (0% FPL) in the South are far lower than the median limits for other regions (Figure 16). In addition, even though Medicaid and CHIP eligibility limits for children and pregnant women in the South remain higher than those for adults, they are still low compared to other regions.
Figure 16: Median Medicaid/CHIP Eligibility Limits by Population and Geographic Region, as a Percent of the Federal Poverty Level, January 2014
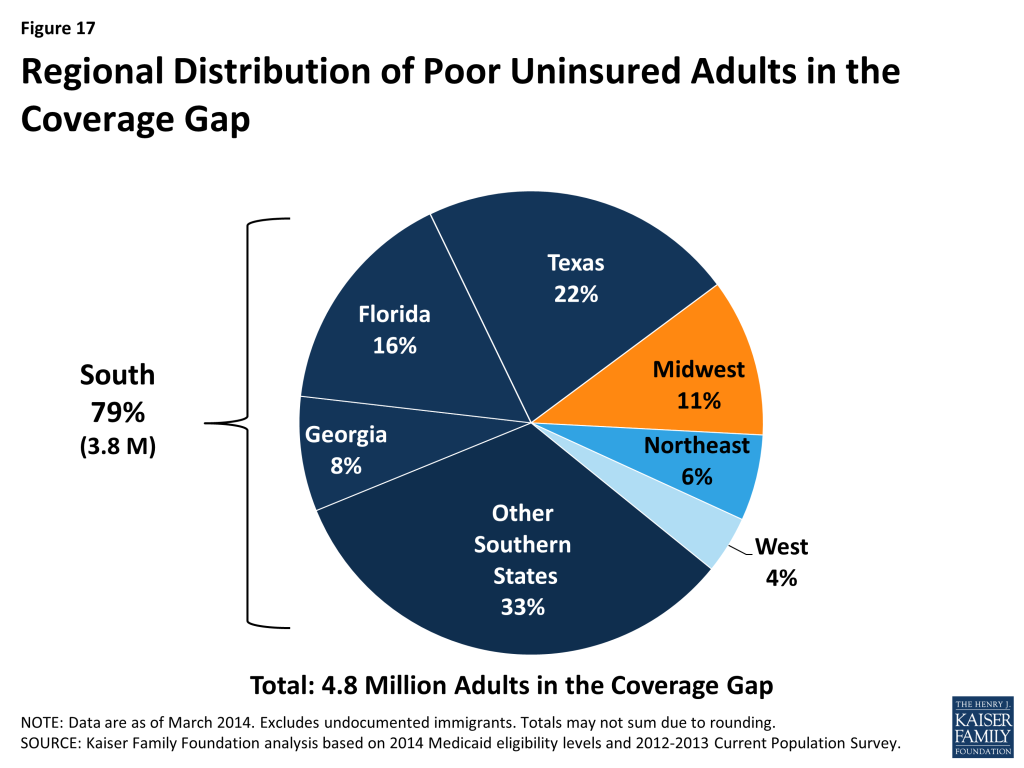
Nearly 4 million poor uninsured Southerners fall into a coverage gap because they remain ineligible for Medicaid but do not earn enough to qualify for the premium tax credits for Marketplace coverage. Because the ACA envisioned that low-income people would receive coverage through Medicaid, the tax credit subsidies to help people purchase private coverage through the Marketplace are only available to people with incomes at or above the poverty level ($11,670 for and individual and $19,790 for a family of three in 2014). Consequently, in states that do not expand Medicaid, uninsured adults with incomes above Medicaid eligibility limits but below poverty fall into a “coverage gap.” These individuals earn too much to qualify for Medicaid but not enough to qualify for the premium tax credits. Over half (51%) of uninsured adults in the South who would be eligible for Medicaid if their states implemented the expansion fall into this coverage gap (Table 3). These 3.8 million poor uninsured adults in the South, nearly half of whom (46%) reside in Texas, Florida, and Georgia, make up nearly eight in ten of the 4.8 million poor uninsured adults who fall into the coverage gap nationwide (Figure 17).
Figure 17: Regional Distribution of Poor Uninsured Adults in the Coverage Gap
Table 3: Number of Uninsured Nonelderly Adults in the ACA Coverage Gap, by State
State
Number in Coverage Gap
As a Share of All Uninsured Nonelderly Adults in State
As a Share of Uninsured Nonelderly Adults Who Would Be Eligible for the Medicaid Expansion (<138% FPL)
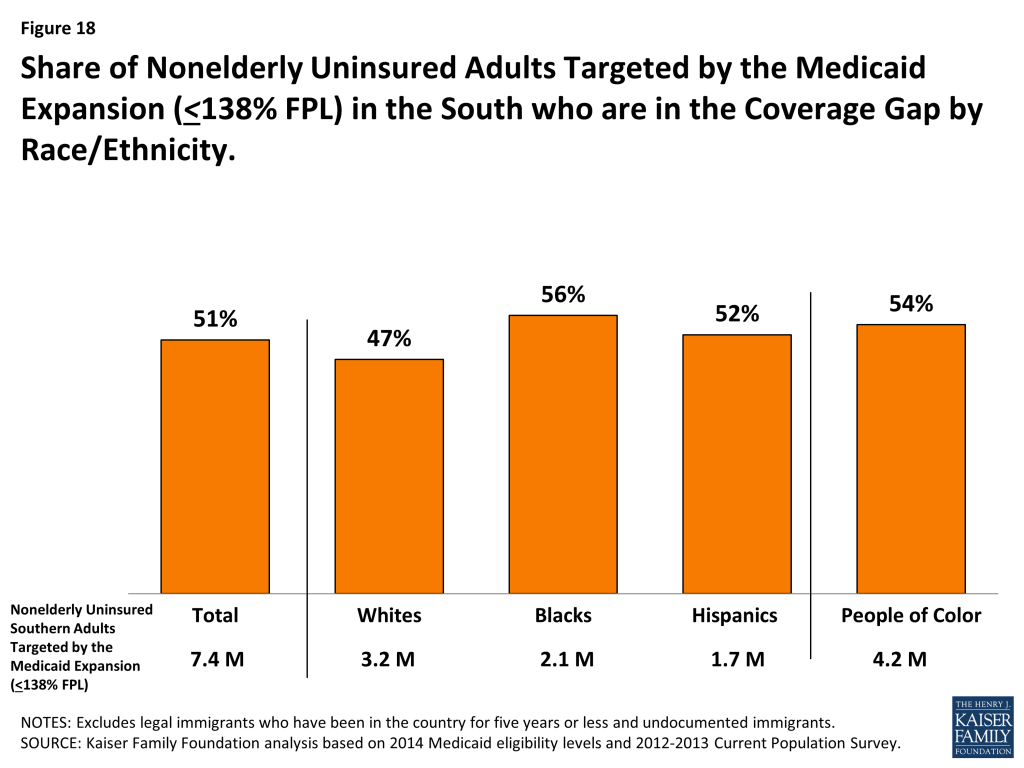
People of color are disproportionately affected by the coverage gap. Within the South, the impact of the coverage gap varies across racial and ethnic groups, reflecting the fact that Blacks are more likely than Hispanics to live in the South and to be uninsured. Overall, among uninsured adults in the South who would be eligible for Medicaid under the ACA expansion, 54% of adults of color and 56% of Blacks fall into the coverage gap, compared to less than half (47%) of Whites (Figure 18).
Figure 18: Share of Nonelderly Uninsured Adults Targeted by the Medicaid Expansion (<138% FPL) in the South who are in the Coverage Gap by Race/Ethnicity
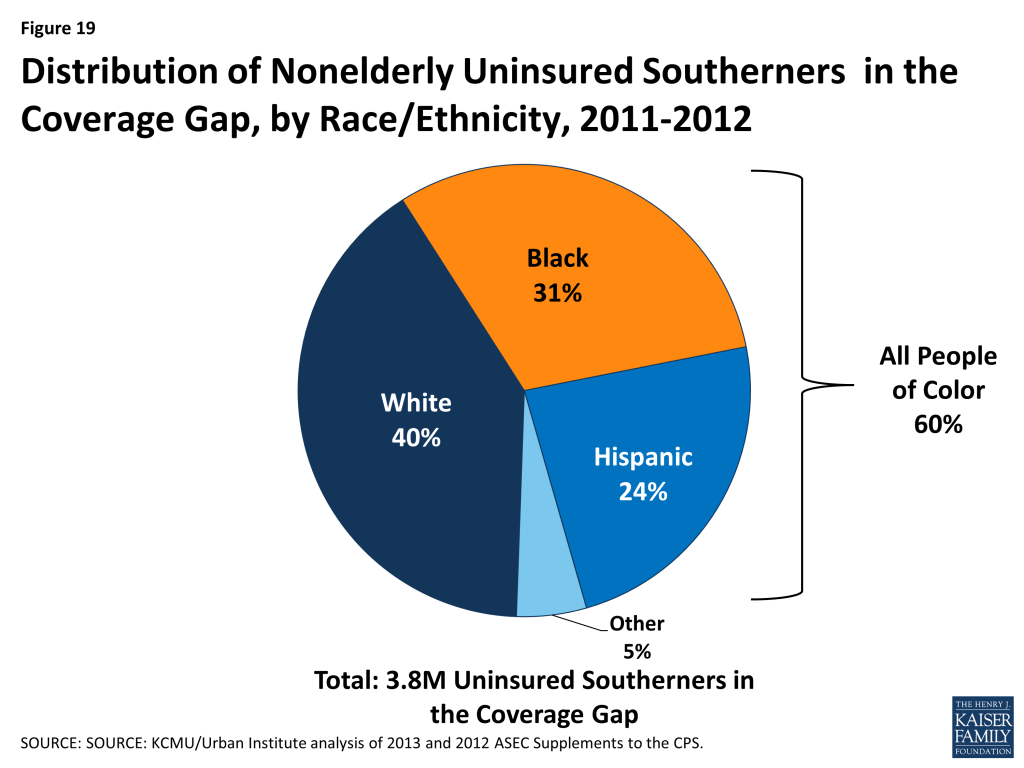
However, White adults are the largest racial or ethnic group in the coverage gap in the South. Four in ten poor adults in the South who fall into the coverage gap are White, compared to 31% who are Black, and about one quarter (24%), who are Hispanic (Figure 19). In total, 1.5 million poor, White adults and 2.3 million people of color in the South fall into the coverage gap.
Figure 19: Distribution of Nonelderly Uninsured Southerners in the Coverage Gap, by Race/Ethnicity, 2011-2012
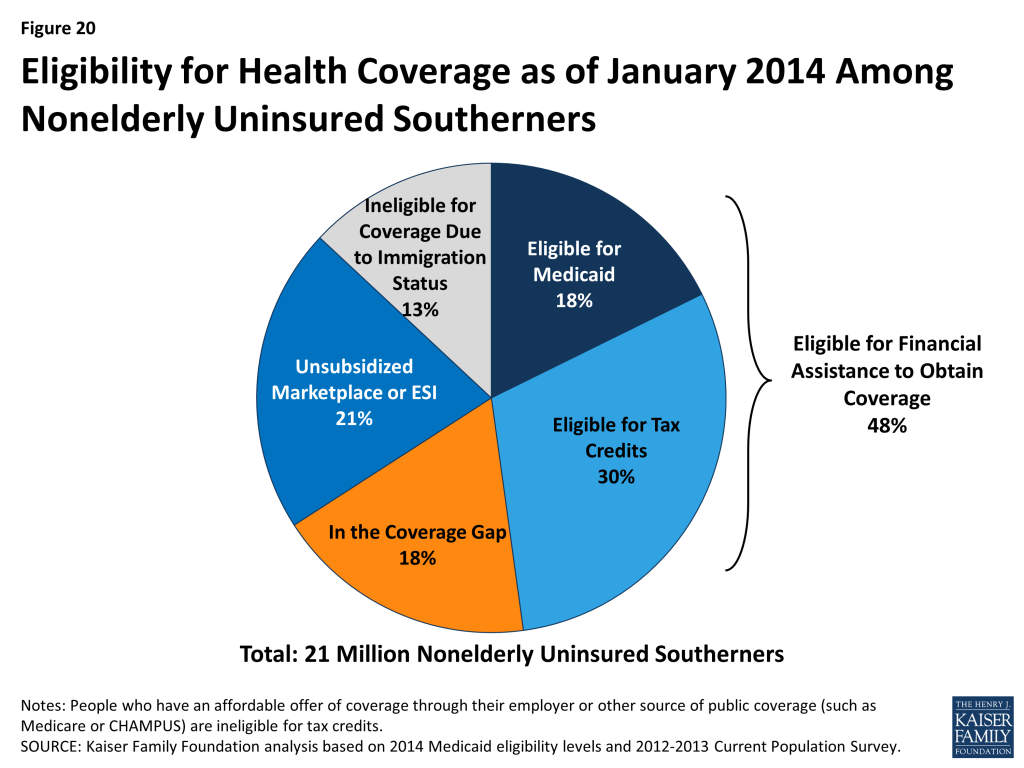
Even with these gaps in coverage, nearly half (48%) of the 21 million uninsured Southerners are eligible for financial assistance for health coverage in 2014 (Figure 20). About 30% of uninsured Southerners are eligible for premium tax credits to purchase Marketplace coverage and 18% are eligible for Medicaid or CHIP, including those newly eligible in the states implementing the Medicaid expansion as well as individuals who were already eligible but not yet enrolled, who are mostly children. Nearly one in five uninsured Southerners (18%) fall into the coverage gap because they reside in a state that is not implementing the Medicaid expansion. The remaining third (34%) of uninsured Southerners are not eligible for assistance for health coverage. About one in five (21%) do not qualify for the premium tax credits because they have incomes above 400% FPL or have access to affordable coverage through their employer. These individuals can still purchase unsubsidized coverage through the Marketplaces. The other 13% are not eligible to enroll in Medicaid and are barred from purchasing coverage through the Marketplaces due to their immigration status; they will likely remain uninsured.14
Figure 20: Eligibility for Health Coverage as of January 2014 Among Nonelderly Uninsured Southerners
Connecting Individuals to Coverage Through Outreach and Enrollment
Effective outreach and enrollment efforts are key to ensuring that the millions of uninsured Southerners who are eligible for coverage are enrolled. Even with remaining coverage gaps, millions of uninsured individuals in the South have gained access to new coverage options under the ACA. Effective outreach and enrollment efforts will be important for successfully enrolling these individuals, including targeted efforts to reach people of color, immigrant families, rural populations, low- and moderate-income families, and people with serious health needs. Regardless of state decisions to expand Medicaid, the ACA requires all states to adopt new approaches to simplify enrollment and renewal that make it easier for individuals to apply for and retain coverage. These include providing multiple application avenues for families (including online, by phone, and in person) and moving to technology-driven eligibility verification processes.15 Through previous experience with Medicaid and CHIP, a number of southern states have demonstrated that these and other strategies can be effective ways to enroll eligible populations into coverage while improving efficiency and minimizing burdens on state agencies (see Box 1). Looking forward, these state experiences provide key lessons for improving access to coverage in the South.
Box 1: Examples of Innovative Outreach and Enrollment Policies in the South
Oklahoma: Streamlining the Application and Renewal Process with the Use of Technology. In September 2010, Oklahoma became the first state to launch a real-time Medicaid and CHIP eligibility system to allow individuals to apply for coverage over the internet. The state verified applicants’ self-attested income electronically after making an initial eligibility determination, reducing the need for paper documentation. With the electronic verification system, enrollees were also able to review, update, and renew their coverage at any time. The new processes developed by the state reduced manual processes required by eligibility workers, and one year after implementing the enrollment system, the state estimated that it was able to process more than a thousand applications per day, and 90 percent received on-the-spot eligibility determinations, even when state offices were closed.16.South Carolina: Simplifying Renewals through Express Lane Eligibility. In 2011, South Carolina initiated a data-driven decision-making process to identify potential simplifications to its Medicaid enrollment process. Using data analysis, the state identified significant churn in its Medicaid program that was creating burdens for families, administrative staff, and providers. The state moved quickly to begin using eligibility findings from its Supplemental Nutrition Assistance Program (SNAP) and Temporary Assistance for Needy Families (TANF) program to conduct express lane renewals, resulting in coverage renewals for about 80,000 children in just nine months. The state estimated direct administrative cost savings of $1 million and 50,000 hours in staff time per year from implementing express lane eligibility at renewal.17,18.Louisiana: Improving Retention through Over Time through Incremental Policy Changes. In the years leading up to ACA implementation, Louisiana implemented several policy changes to improve retention for families enrolled in Medicaid and CHIP. In 2000, the state implemented an ex parte renewal process in which the state reviewed eligibility information available through the SNAP and TANF programs before closing a case. In 2003, the state implemented telephone renewals, and in 2005, began an administrative renewal process in which the state auto-renewed cases that had a very low likelihood of ineligibility at renewal. Following implementation of this policy, the proportion of children in CHIP who lost coverage at renewal due to procedural or administrative reasons fell from 17 percent to less than 1 percent. As of May 2013, only 4 percent of Medicaid renewals occurred through the use of a paper form, and most (69%) renewed though express lane eligibility or administrative renewals. Coupled with organizational changes, Louisiana found that these efforts helped to reduce burdens on eligibility staff while maintaining low error rates.19.Arkansas and West Virginia: Using Targeted Enrollment Strategies to “Fast Track” Medicaid-Eligible Individuals Into Coverage. In late 2013, Arkansas and West Virginia took advantage of a new option to facilitate the enrollment of eligible individuals into Medicaid using data already available to the state. Both states received approval to use data from the Supplemental Nutrition Assistance Program (SNAP) to identify Medicaid-eligible adults, and West Virginia also implemented the option to use Medicaid and CHIP enrollment data for children to reach eligible parents. In less than two months, over 63,400 people had been verified eligible and enrolled into Medicaid in Arkansas, and 54,100 people had been verified as eligible and enrolled into Medicaid in West Virginia. Both states found the fast track approach to be an effective way to jump-start enrollment into their Medicaid expansions while minimizing burdens on individuals, staff, and enrollment systems.20
Issue Brief: Translating Coverage To Care: Delivery Systems And The Safety Net
To improve health outcomes in the long term, it will also be important to ensure that newly-insured individuals are able to obtain needed primary and specialty care services. As uninsured individuals in the South gradually gain coverage and seek care, health resources in these communities may be further stretched. The ACA includes a number of provisions to help states improve health system capacity, including increased funding to expand community health centers and a temporary increase in Medicaid payment rates for primary care physicians.21 Increases in physician capacity will be especially important in areas with historically limited health resources.
Provider Capacity in the South
Many Southerners live in a primary care Health Professional Shortage Area (HPSA), meaning that they reside in a region with a documented shortage of primary care providers. As of 2012, nearly one-quarter (22%) of southern residents were residing in a primary care HPSA. In four southern states (AL, DC, LA, and MS), more than one in three residents lived in a primary care HPSA, and in Mississippi, over half of the state population lived in a primary care HPSA—the highest share in the country (Table 4). As coverage expands and the demand for care increases, expanding provider capacity will be key to ensuring that coverage translates into access to care.
Table 4: Share of Population Living in a Primary Care Health Professional Shortage Area (HPSA), by State, 2014
State
Number of Residents Living in Primary Care HPSA
Share of Population in HPSA
United States
57,742,576
18%
South
25,759,887
22%
Mississippi
1,676,661
56%
Louisiana
2,001,796
43%
Alabama
1,802,365
37%
District of Columbia
241,638
37%
Oklahoma
1,113,275
29%
South Carolina
1,286,623
27%
Florida
4,613,535
24%
Delaware
203,525
22%
Georgia
1,984,945
20%
Texas
5,229,179
20%
Kentucky
763,738
17%
Maryland
931,622
16%
Tennessee
965,306
15%
West Virginia
284,335
15%
Virginia
1,144,027
14%
Arkansas
364,909
12%
North Carolina
1,152,408
12%
SOURCE: Bureau of Clinician Recruitment and Service. Health Resources and Services Administration. “Designated Health Professional Shortage Areas.” January 1, 2014
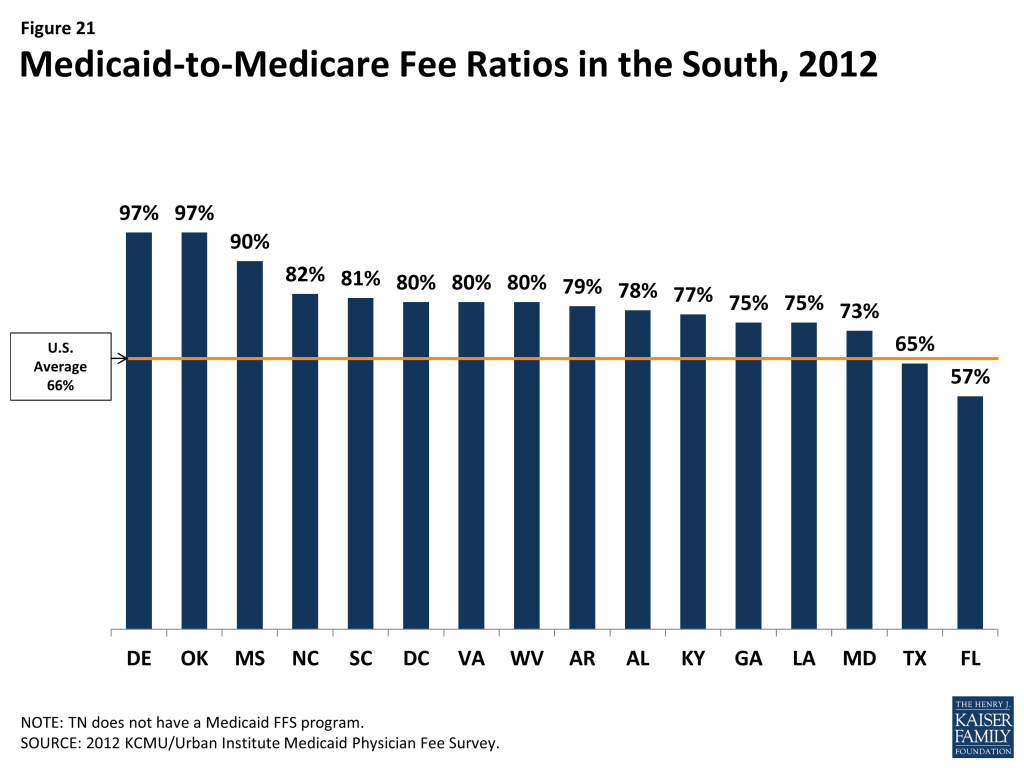
Medicaid payment rates are one lever for increasing provider supply and access in the program, but additional measures are needed to overcome provider shortages. In 2012, state Medicaid programs overall paid physicians just 66% of Medicare fee levels. Notably, though, 13 of the 17 Southern states paid Medicaid rates equal to at least 75% of Medicare rates, including eight southern states that paid 80% or more of Medicare fee levels (Figure 21). Under the ACA, Medicaid payment rates to primary care physicians (PCP) for most of their services must be at least equal to Medicare rates in 2013 and 2014 (the difference is fully funded by the federal government); in 2013, this provision increased PCP fees by at least 40% in half of the southern states, including Florida, where they more than doubled.
Figure 21: Medicaid-to-Medicare Fee Ratios in the South, 2012
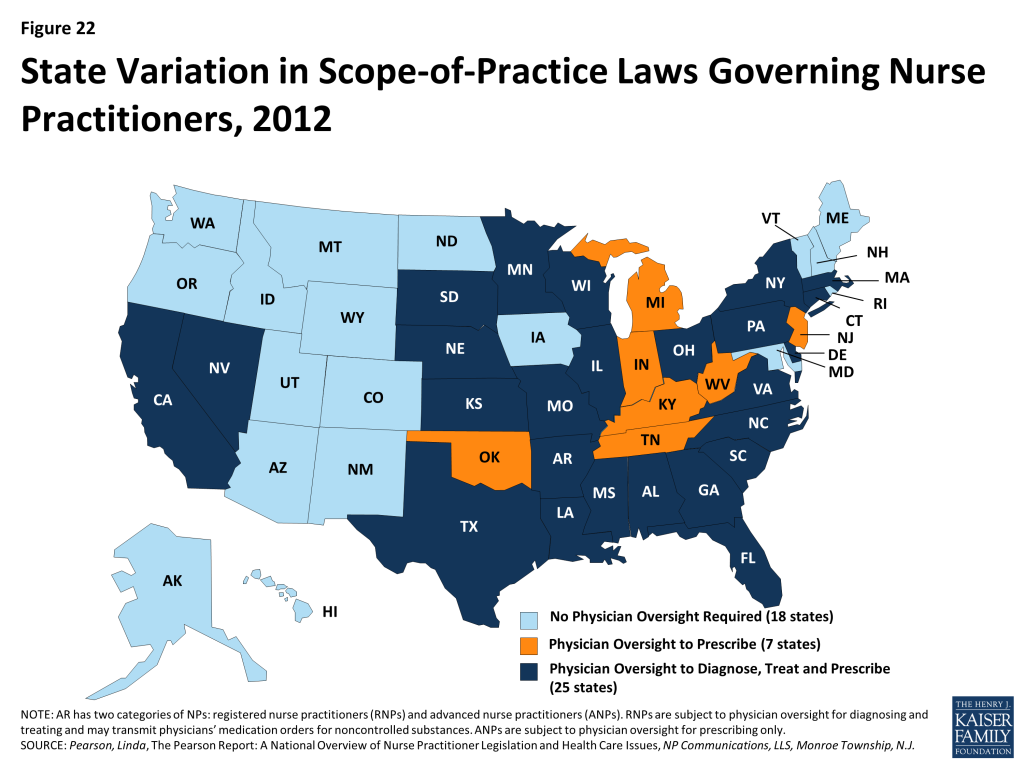
Although paying providers fee-for-service rates closer to Medicare and private insurance rates may attract more provider participation in Medicaid, absolute shortages in the supply of physicians, particularly in rural and low-income communities, are system-level capacity constraints that Medicaid payment rates cannot correct. Broader strategies and investments to develop a more adequate health care workforce are called for. The ACA includes numerous provisions along those lines, but they will take time to bear fruit. A more immediate strategy for expanding access (especially access to primary care) is to expand the role of nurse practitioners (NP), physician assistants (PA), and other health professionals in delivering care. A large body of evidence on NPs shows that the care they provide is of equal or, in some cases, better quality than physician-provided care for the same conditions. In many states, including 11 states in the South, state regulations that restrict NP scope of practice are a major obstacle to this strategy. These restrictions prevent NPs from diagnosing and treating illness and prescribing drugs without physician supervision.22 Of the southern states, only DC, Maryland, and Delaware extend full autonomy to NPs to practice independently at the “top of their license” (Figure 22).
Figure 22: State Variation in Scope-of-Practice Laws Governing Nurse Practitioners, 2012
Medicaid managed care programs can also expand the role of NPs by including them in their primary care provider panels. A 2009 RAND study that estimated potential health care savings associated with expanding the role of NPs and PAs in Massachusetts assumed in its model that NPs and PAs could provide care for six simple acute conditions (e.g., cough, fever, earache) that are among those commonly treated at retail clinics staffed by these providers. Care for these six conditions, plus well-baby visits and general medical examinations, which the model also assumed NPs and PAs could provide, represent nearly one in five of all office-visits nationally.23 This analysis suggests that expanding the use of NPs and PAs in the South – in effect, increasing the supply could increase the availability of routine primary care.
Medicaid managed care
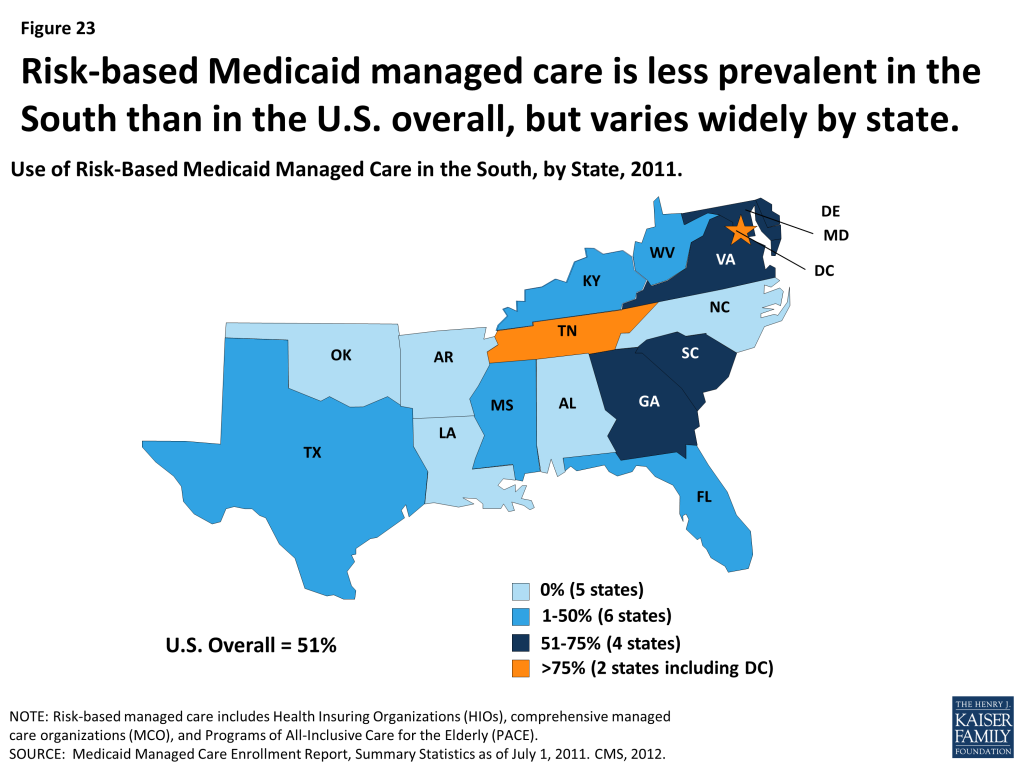
Nationwide, a large and growing share of Medicaid beneficiaries receive their care in capitated managed care plans. Increasingly, state Medicaid programs across the country are contracting with private managed care plans to deliver Medicaid benefits to Medicaid enrollees. Under these contracts, states pay a fixed “capitation” rate to plans for each person enrolled, and the plans are at financial risk for all the services specified in their Medicaid contracts. Enrolled beneficiaries receive all or most of their care from their plan’s network of providers. Under the other major (though much smaller) model of Medicaid managed care, known as primary care case management (PCCM), states retain fee-for-service payment, but provide a small monthly fee to primary care providers to coordinate primary care for their Medicaid patients. Some states’ PCCM programs involve partial capitation payment.As of July 2011, over half of all Medicaid beneficiaries nationally were enrolled in risk-based managed care, but the proportion varied considerably across the country. A number of factors may contribute to the variation. Some states or areas lack sufficient population to attract risk-based plans. Organized medicine and managed care interests may influence Medicaid policy choices. Some states have abandoned risk-based contracting because of plan exits from the market, budget pressures, or a preference for managing their Medicaid programs themselves by contracting directly with providers, rather than shifting responsibility and financing for services to insurers.
Most states in the South have some share of their Medicaid population enrolled in risk-based managed care. In 2011, 5 of the 17 states in the South had no risk-based Medicaid managed care (Alabama, Arkansas, Louisiana, North Carolina, and Oklahoma). However, the other 12 had risk-based programs that, with a few exceptions, covered at least half their Medicaid population, and substantially more in the District of Columbia (77%), Maryland (75%) and Tennessee (97%) (Figure 23). Notably, Louisiana more recently adopted risk-based managed care statewide, Alabama is slated to do so later this year, and under Arkansas’ proposed “private option” for implementing the ACA Medicaid expansion, adults newly eligible for Medicaid are to be enrolled in the same managed care plans offered in the new insurance Marketplaces.
Figure 23: Risk-based Medicaid managed care is less prevalent in the South than in the U.S. overall, but varies widely by state
PCCM programs are prevalent in the South as well, operating in 12 of the 17 states in the region. In four states – Arkansas, Louisiana, North Carolina, and Oklahoma – over 60% of Medicaid beneficiaries were enrolled in these arrangements as of 2011. Interestingly, while the Medicaid trend nationally is for states to move away from the fee-for-service toward risk-based managed care, in the mid-2000s, both North Carolina and Oklahoma terminated their risk-contracting programs and implemented PCCM statewide.
Trends suggest a continued movement toward managed care within the South going forward. In a recent 50-state survey, nearly all states in the South reported that they undertook Medicaid managed care initiatives in 2013 or planned to in 2014, including expansions of managed care to new geographic areas or groups, mandatory managed care enrollment, implementation or expansion of managed long-term care, and measures to improve quality.
Delivery system innovation
State Medicaid programs, including many in the South, are in a period of dynamic innovation in health care delivery and payment. Medicaid programs have historically been a source of new approaches to improving care for some of the nation’s most medically complex and low-income populations. Now, new options, demonstration programs, and funding opportunities provided by the ACA are catalyzing increased activity, including Medicaid participation in multi-payer initiatives designed to leverage broader systemic change, as well as reforms within Medicaid programs themselves.
Consistent with a broader trend nationally, most states in the South have undertaken medical home initiatives designed to provide comprehensive and continuous patient-centered care to Medicaid beneficiaries. In addition, both Alabama and North Carolina have taken up a new Medicaid option under the ACA to establish health homes to provide comprehensive care coordination for Medicaid beneficiaries with chronic conditions, and Arkansas, Delaware, the District of Columbia, Maryland, Oklahoma, and West Virginia are planning such programs. Alabama and North Carolina have also taken steps to establish accountable care organizations (ACO) in Medicaid. In ACOs, participating providers, plans, and hospitals are collectively responsible for the care of a defined population, encompassing the continuum of care across different settings. The participating providers agree to achieve specified financial and quality outcomes and may share in savings associated with their performance. The following selected initiatives in Arkansas, North Carolina, South Carolina, and Texas illustrate the diversity of service delivery and payment innovation underway in Medicaid:
Box 2: Examples of Innovative Delivery System and Payment Models in the South
Arkansas. The State Innovation Models (SIM) initiative, sponsored by CMS’ Center for Medicare and Medicaid Innovation, provides support to states for the development and testing of state-based models for multi-payer payment and health care delivery system transformation, with the goal of improving health system performance. Arkansas was one of six states to receive a Model Testing award under the initiative, and will receive up to $42 million over 42 months to implement its plan..Arkansas’ innovation plan is aimed at moving from an encounter-based, fee-for-service system to a more patient-centered, comprehensive, and coordinated care system. Within three to five years, most Arkansans will have access to medical homes, and those with more complex needs (e.g., individuals with developmental disabilities and behavioral health conditions) will have access to health homes. Both medical and health homes will receive episode-based payments for certain procedures, acute care, and chronic care for selected conditions. Medical homes will extra fees for care coordination, and may share in savings based on their performance. Health homes will also receive such fees, with shared savings possible in the future. The plan calls for Medicaid, CHIP, Medicare, and private payers to participate in the initiative. Arkansas has already established common payment mechanisms for Medicaid and private payers, consistent quality metrics, and a multi-payer provider web portal. The plan also includes strategies to strengthen the health care workforce, use team-based care, increase consumer engagement, and adopt electronic medical records and a health information exchange. The state projects savings of $1.1 billion over the three-year Model Testing period, and $8.9 billion through 2020..North Carolina. Community Care of North Carolina (CCNC), North Carolina’s widely recognized statewide Medicaid medical home and care management program, serves the vast majority of Medicaid beneficiaries in the state. Beneficiaries are enrolled in participating primary care or group practices that serve as medical homes in their local communities. The state funds and provides training, data, and tools to 14 regional Community Care networks that support the practices and work with them to improve care..North Carolina has built on the CCNC infrastructure over time to enhance the delivery system in the state. In 2008, for example, North Carolina initiated the Transitional Care Program (TCP) after it expanded CCNC to include aged and disabled Medicaid beneficiaries. These beneficiaries have high rates of multiple chronic conditions and are thus at high risk for fragmented care that can lead to multiple hospitalizations. The TCP identifies high-risk CCNC members when they are admitted to the hospital and plans for, coordinates, and arranges their transition from the hospital back to the community. The concept is that robust discharge and transition planning can reduce the risk of emergency department use and hospital readmission for complex Medicaid patients, improve health outcomes, and reduce costs. A recent evaluation of the TCP showed that readmission rates among Medicaid beneficiaries who received TCP support were 20% lower than the rates for clinically similar patients who received usual care. TCP participants were also less likely to experience multiple readmissions..South Carolina. Medicaid pays for 50% of all births in South Carolina. The South Carolina Birth Outcomes Initiative (BOI), a multi-stakeholder effort that includes the South Carolina Department of Health and Human Services, the state hospital association, the state chapter of the March of Dimes, and BlueCross Blue Shield of South Carolina (the other major payer of births in the state), has three major goals: to improve health outcomes for newborns in the Medicaid program and throughout the state, decrease the number of days babies spend in neonatal intensive care units (NICU), and reduce racial disparities in birth outcomes..The BOI comprises several components. One is Medicaid reimbursement for Screening, Brief Intervention, and Referral to Treatment (SBIRT) services, to help identify and treat pregnant and postpartum Medicaid beneficiaries who may smoke, have alcohol or other substance dependencies, experience depression, or face domestic violence. The BOI also involves efforts to encourage breastfeeding, including incentives to hospitals to improve their support for breastfeeding and achieve “Baby Friendly Hospital” status. Reducing early elective deliveries in the state is another major thrust of the BOI. An initial voluntary effort by the state’s birthing hospitals led to a 50% reduction in early elective deliveries. To gain more ground, the Medicaid program and BlueCross BlueShield jointly pursued a policy of non-payment for early elective inductions. Data from the first eight quarters show large declines in the early elective rate in Medicaid and across all payers and declines in NICU admissions also occurred. A report prepared for the state showed savings of $6 million in the first quarter of 2013..Texas. Faced with rising health care costs and disparities in health outcomes, policymakers have increasingly focused on the benefits of investing in preventive care. In particular, states are expanding efforts to promote personal responsibility and support individuals in changing their lifestyle habits to achieve better health. To build on these efforts, the ACA established the Medicaid Incentives for Prevention of Chronic Diseases (MIPCD) program, which provides a total of $85 million in grants over five years to states that provide incentives to Medicaid beneficiaries who participate in prevention programs and change their health risks and outcomes by adopting healthy behaviors. Each program must address at least one of the following prevention goals: tobacco cessation, weight loss, lowered cholesterol, lowered blood pressure, and prevention or management of diabetes..Texas, one of ten states to receive an award, began implementing its Wellness Incentives and Navigation (WIN) Project in April 2012. The project targets 1,250 nonelderly adults in Harris County with both a behavioral health condition (including mental health and substance abuse disorders, as well as severe mental illness) and a physical chronic health diagnosis. Structured as a randomized control trial, the project randomly assigns volunteer participants to either an intervention or a control group. Individuals in the intervention group develop individual wellness plans and have access to flexible wellness accounts of $1,150/year to help pay for services and activities that advance their specific health goals. They also receive support from trained health system navigators to manage their health and wellness plans more effectively. The program is available for a maximum of three years for each participant, with the last participants completing the study in December 2015. The most popular goals for participants thus far have been weight loss, increased physical activity, and healthy eating habits.
The Safety Net
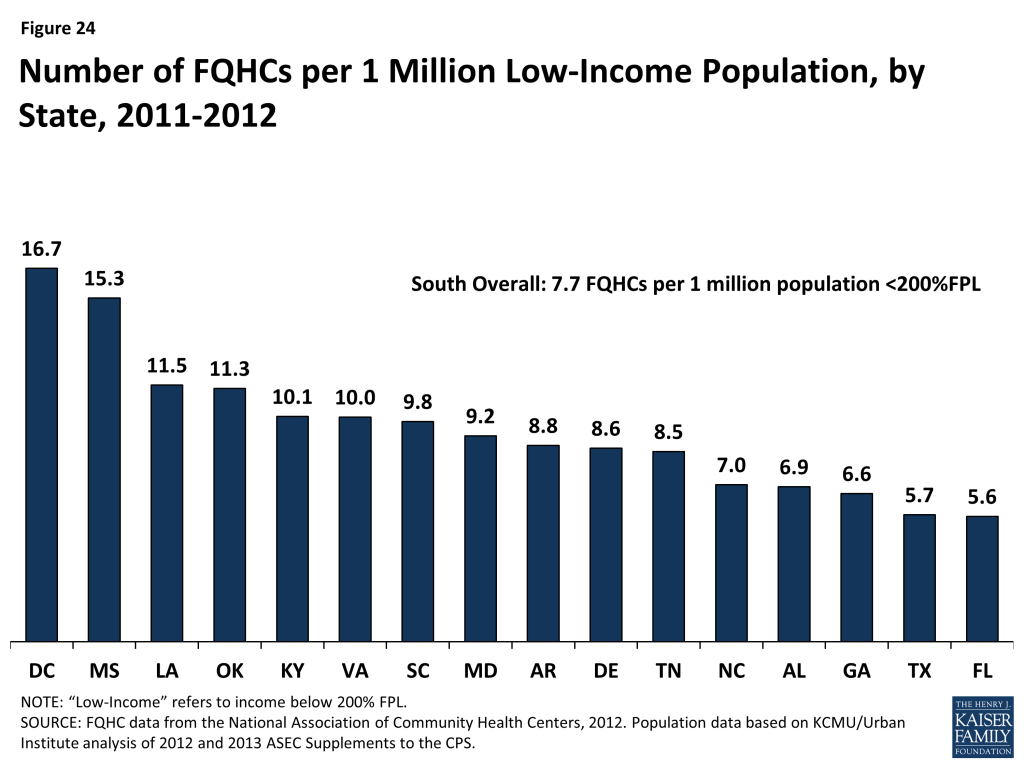
Safety net providers will continue to be an important part of the health care system in the South. Historically, uninsured and low-income individuals have relied on safety net providers such as community health centers and clinics when seeking care, and even with broad-scale efforts to expand physician capacity and improve the delivery of services to low-income populations, these providers will likely remain a primary source of care for millions of newly-insured Southerners and many low-income individuals who will likely remain uninsured. As of 2011, there were 388 federally-funded federally qualified health centers (FQHCs) in the South that served over six million patients.24 The number of FQHCs available to serve the low-income population in the South varies by state from 5.6 per million low-income people in Florida to nearly 17 FQHCs per million people with low incomes residing in Mississippi (Figure 24). In addition, as of 2011, there were over 1,500 Medicare-certified rural clinics in the South serving the 20 million Southerners residing in rural areas25 and 448 public hospitals, which saw nearly 2.5 million patient visits in the year.26
Figure 24: Number of FQHCs per 1 Million Low-Income Population, by State, 2011-2012
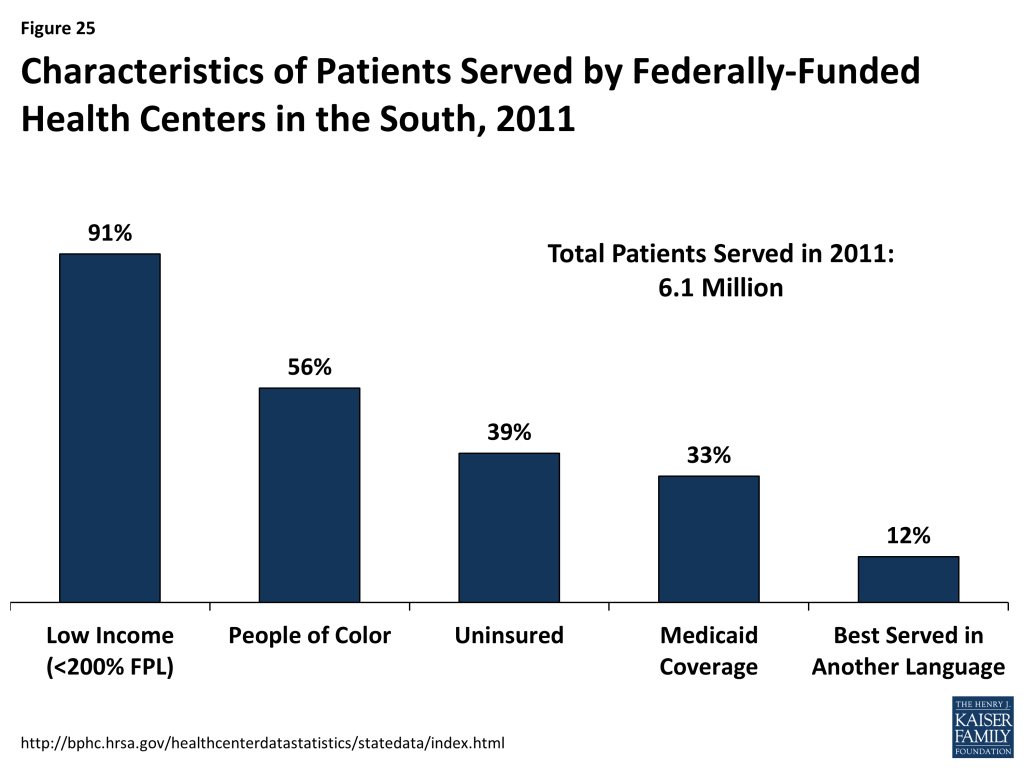
Community health centers and other safety net providers serve many vulnerable populations in the South. In addition to providing free or low-cost services to those with low incomes, community health centers are often seen as a trusted source for care within the community and are able to offer culturally and linguistically appropriate services that meet the needs of the diverse populations they serve. In the South, over 90% of patients in federally-funded community health centers are low-income. Over half (56%) are people of color, nearly four in ten are uninsured, 12% are better served in a language other than English, and 5% are homeless (Figure 25). Health centers provide an array of services to their patients, including primary and preventive care, professional services such as dental and mental health care, and enabling services such as case management, health education, and interpretation and translation services.27 As coverage expands, some of these health centers may experience revenue gains as more patients obtain coverage. However, they will continue to serve as a key source of care for individuals who remain uninsured or who have historically relied on their services, requiring adequate resources to support this role.
Figure 25: Characteristics of Patients Served by Federally-Funded Health Centers in the South, 2011
Conclusion
Historically, the South has faced longstanding disparities in coverage and care. Yet, access to health coverage and care is particularly important for Southerners given a high prevalence of chronic health conditions and poor health outcomes in the region. The ACA offers the potential to connect many currently uninsured Southerners to coverage, serving as a key first step in enabling individuals in the region to access needed care and manage their health conditions.
To date, the ACA has expanded coverage options for many Southerners, particularly through the new Marketplaces. However, millions of poor Southerners who could gain access to coverage through the ACA Medicaid expansion fall into a coverage gap and are left without a new coverage option in states that are not implementing the Medicaid expansion at this time. If additional states in the South opt to expand in the future there will be even greater coverage gains within the region.
Looking ahead, helping uninsured Southerners who have gained access to new coverage options to enroll successfully will help boost coverage. Regardless of state decisions to expand Medicaid, all states must implement new simplified enrollment processes, which will help connect eligible individuals to coverage. Even with simpler processes in place, effective outreach and enrollment efforts will be key. Across the South, in communities that have historically faced restrictions in coverage and barriers to enrollment, using targeted strategies and one-on-one assistance are available to help eligible individuals enroll and access the health care services they need will be required.
Furthermore, to improve health outcomes in the South, newly-insured individuals need to be able to access health services. The ACA includes a number of provisions to help expand the availability of primary and specialty services in underserved communities, including an increase in Medicaid fees to primary care physicians. Separately, many southern states are adopting a number of innovative approaches to provide comprehensive and patient-centered care to Medicaid beneficiaries including an expansion of managed care and reform of delivery systems to improve care coordination for medically-complex low-income populations. Even with these efforts, safety net providers will likely remain a primary source of care for millions of newly-insured Southerners and for many low-income individuals in the South who remain uninsured.
Given the growing and diverse population in the South, changing patterns of health coverage and care in the region have important implications nationally and for people of color. As such, continued attention to health coverage and care in the South for those gaining coverage and those remaining uninsured will be important for understanding the impact of the ACA and implications for longstanding efforts to reduce disparities in coverage, care, and health outcomes.
This brief was prepared to help inform a collaborative effort with the Satcher Health Leadership Institute at the Morehouse School of Medicine, which focuses on advancing opportunities and assessing challenges in health care and health equity.
Appendix Tables
Appendix Table 1: Population and Distribution by Region and State
Total
White
Black
Hispanic
Asian/Pacific Islander
Other Race/ Ethnicity
All People of Color
UNITED STATES
309,044,000
63%
12%
17%
5%
3%
37%
NORTHEAST
55,014,000
68%
11%
13%
6%
1%
32%
Connecticut
3,515,000
72%
9%
12%
5%
1%
28%
Maine
1,328,000
95%
1%
1%
1%
3%
5%
Massachusetts
6,542,000
75%
6%
11%
7%
1%
25%
New Hampshire
1,304,000
93%
1%
3%
2%
1%
7%
New Jersey
8,676,000
59%
12%
20%
8%
1%
41%
New York
19,308,000
57%
14%
18%
9%
2%
43%
Pennsylvania
12,693,000
80%
11%
6%
2%
2%
20%
Rhode Island
1,033,000
76%
6%
13%
3%
2%
24%
Vermont
615,000
94%
1%
1%
1%
2%
6%
MIDWEST
66,147,000
77%
10%
7%
3%
2%
32%
Illinois
12,704,000
63%
14%
16%
5%
2%
37%
Indiana
6,340,000
82%
9%
5%
1%
2%
18%
Iowa
3,017,000
86%
3%
6%
2%
2%
14%
Kansas
2,796,000
78%
6%
10%
3%
4%
22%
Michigan
9,714,000
77%
14%
4%
3%
2%
23%
Minnesota
5,314,000
83%
5%
5%
5%
2%
17%
Missouri
5,924,000
81%
11%
3%
2%
4%
19%
Nebraska
1,834,000
79%
4%
11%
3%
3%
21%
North Dakota
679,000
84%
1%
3%
1%
11%
16%
Ohio
11,349,000
81%
12%
4%
2%
2%
19%
South Dakota
815,000
84%
1%
4%
—
10%
16%
Wisconsin
5,661,000
83%
5%
7%
2%
3%
17%
WEST
72,769,000
52%
4%
30%
10%
4%
48%
Alaska
697,000
67%
2%
8%
9%
15%
33%
Arizona
6,579,000
54%
4%
34%
3%
4%
46%
California
37,722,000
40%
6%
39%
13%
2%
60%
Colorado
5,076,000
71%
4%
20%
3%
2%
29%
Hawaii
1,327,000
18%
1%
11%
52%
18%
82%
Idaho
1,580,000
82%
—
13%
2%
2%
18%
Montana
990,000
89%
—
3%
—
7%
11%
Nevada
2,703,000
51%
8%
27%
9%
4%
49%
New Mexico
2,048,000
42%
1%
45%
3%
9%
58%
Oregon
3,863,000
78%
2%
11%
5%
4%
22%
Utah
2,822,000
81%
1%
12%
3%
2%
19%
Washington
6,794,000
71%
3%
11%
10%
6%
29%
Wyoming
568,000
86%
—
9%
—
4%
14%
SOUTH
115,113,000
59%
19%
17%
3%
3%
41%
Alabama
4,776,000
67%
26%
4%
1%
2%
33%
Arkansas
2,906,000
75%
15%
5%
3%
2%
25%
Delaware
899,000
65%
20%
10%
4%
2%
35%
District of Columbia
625,000
36%
48%
10%
4%
1%
64%
Florida
19,045,000
58%
15%
22%
3%
2%
42%
Georgia
9,620,000
56%
30%
8%
4%
2%
44%
Kentucky
4,315,000
85%
7%
4%
1%
2%
15%
Louisiana
4,478,000
62%
31%
4%
—
—
38%
Maryland
5,832,000
53%
28%
9%
7%
2%
47%
Mississippi
2,907,000
58%
37%
2%
—
—
42%
North Carolina
9,523,000
63%
21%
8%
3%
4%
37%
Oklahoma
3,727,000
65%
7%
8%
1%
19%
35%
South Carolina
4,629,000
66%
28%
4%
1%
2%
34%
Tennessee
6,337,000
75%
16%
5%
2%
2%
25%
Texas
25,774,000
42%
11%
41%
4%
1%
58%
Virginia
7,908,000
65%
19%
7%
6%
3%
35%
West Virginia
1,812,000
93%
3%
1%
—
2%
7%
NOTE: Data may not sum to 100% due to rounding and data restrictions.SOURCE: KCMU/Urban Institute analysis of 2013 and 2012 ASEC Supplements to the CPS.
Appendix Table 2: Selected Demographic Characteristics by Geographic Region, 2011-2012
Total
Northeast
Midwest
West
South
Residence
Metropolitan
84%
90%
78%
90%
82%
Rural
15%
10%
22%
8%
17%
Not Identifiable
1%
NA
NA
2%
1%
Age
0-18
25%
23%
25%
26%
26%
19-34
22%
22%
21%
23%
21%
35-54
27%
28%
27%
27%
27%
55-64
12%
13%
12%
12%
12%
65+
14%
15%
14%
12%
14%
Citizenship Status
U.S-Born Citizen
87%
84%
93%
81%
89%
Naturalized Citizen
6%
8%
3%
9%
5%
Non-Citizen
7%
8%
4%
10%
7%
Parent Status of Nonelderly Adults (19-64)
Parent
34%
32%
34%
35%
34%
Not a Parent
66%
68%
66%
65%
66%
Educational Attainment of Adults (19-64)
Less than High School
11%
11%
9%
13%
13%
High School Graduate
29%
29%
32%
25%
31%
Some College/Assoc. Degree
31%
31%
31%
31%
28%
College Grad or Greater
30%
30%
28%
30%
27%
Employment Characteristics of Nonelderly
Households with at Least 1 Full-time Worker
76%
77%
77%
75%
77%
Share of Workers in Blue-Collar Job
61%
60%
61%
61%
62%
Work in Small Firms (< 50 Workers)
25%
26%
24%
26%
25%
Self-Employed
8%
8%
8%
10%
8%
Public Sector Job
14%
14%
13%
14%
15%
NOTE: Data may not sum to 100% due to rounding and data restrictions.SOURCE: KCMU/Urban Institute analysis of 2013 and 2012 ASEC Supplements to the CPS.
Appendix 3: Nonelderly Uninsured by Race/Ethnicity and State, 2011-2012
Total
White
Black
Hispanic
Other
All People of Color
UNITED STATES
47,616,500
21,350,500
6,983,700
15,431,700
3,850,700
26,266,100
NORTHEAST
5,887,700
3,009,400
919,100
1,471,900
487,300
2,878,300
Connecticut
285,800
157,400
41,600
71,600
—
128,000
Maine
129,300
121,500
—
—
—
—
Massachusetts
242,900
160,300
—
—
—
83,000
New Hampshire
158,500
138,500
—
—
9,000
20,000
New Jersey
1,250,800
445,800
196,000
479,300
129,600
805,000
New York
2,220,900
913,600
406,000
655,400
245,900
1,307,000
Pennsylvania
1,426,900
956,700
234,900
179,400
55,800
470,000
Rhode Island
125,000
72,200
11,600
32,900
8,300
53,000
Vermont
47,800
43,400
—
—
—
—
MIDWEST
8,092,900
5,136,000
1,153,000
1,225,200
578,700
2,956,900
Illinois
1,772,400
783,600
345,400
534,300
109,100
989,000
Indiana
801,600
578,900
102,500
65,700
54,500
223,000
Iowa
301,500
230,400
—
41,400
—
71,000
Kansas
368,400
231,000
25,300
85,300
26,900
137,000
Michigan
1,110,500
773,300
181,500
106,600
—
337,000
Minnesota
462,500
297,900
44,800
63,200
56,600
165,000
Missouri
834,100
590,300
153,800
—
54,600
244,000
Nebraska
233,300
138,500
—
60,900
20,200
95,000
North Dakota
70,000
39,900
—
—
24,800
30,000
Ohio
1,460,800
1,029,500
217,000
128,800
85,500
431,000
South Dakota
111,300
71,300
—
12,400
25,300
40,000
Wisconsin
566,500
371,600
51,600
87,400
55,900
195,000
WEST
12,588,100
4,411,100
564,800
5,998,700
1,613,600
8,177,000
Alaska
129,400
71,500
—
11,800
43,800
58,000
Arizona
1,140,200
362,000
—
651,000
82,200
778,000
California
6,992,400
1,674,800
342,500
4,050,200
924,900
5,318,000
Colorado
736,900
391,400
48,000
260,100
37,400
345,000
Hawaii
102,200
20,900
—
13,900
66,000
81,000
Idaho
257,900
157,500
—
84,700
—
100,000
Montana
178,900
145,000
—
—
26,100
34,000
Nevada
620,800
235,400
61,800
247,800
75,800
385,000
New Mexico
421,700
112,000
—
216,500
88,400
310,000
Oregon
559,400
379,500
—
127,100
45,800
180,000
Utah
406,800
252,400
—
110,900
38,900
154,000
Washington
947,700
537,900
43,100
205,200
161,500
410,000
Wyoming
93,800
70,700
—
12,600
8,500
23,000
SOUTH
21,047,800
8,794,000
4,346,800
6,735,900
1,171,200
12,253,800
Alabama
660,700
365,100
208,500
73,100
—
296,000
Arkansas
510,400
340,000
88,400
53,200
—
170,000
Delaware
92,600
43,500
18,700
25,500
—
49,000
District of Columbia
49,800
10,100
27,300
9,400
—
40,000
Florida
3,866,700
1,657,200
752,800
1,280,400
176,200
2,209,000
Georgia
1,849,700
747,300
639,700
334,000
128,700
1,102,000
Kentucky
647,100
496,000
64,000
62,500
—
151,000
Louisiana
866,300
382,900
384,300
77,100
—
483,000
Maryland
755,900
277,700
226,900
181,300
70,100
478,000
Mississippi
453,600
197,900
227,700
—
—
256,000
North Carolina
1,593,300
740,700
384,100
346,600
121,900
853,000
Oklahoma
633,100
346,000
44,000
94,000
149,100
287,000
South Carolina
765,300
436,800
245,600
68,500
—
328,000
Tennessee
849,600
532,600
166,400
126,700
—
317,000
Texas
6,166,600
1,509,300
588,200
3,794,000
275,200
4,657,000
Virginia
1,020,500
471,400
266,800
191,200
91,200
549,000
West Virginia
266,700
239,400
—
—
—
27,000
NOTE: Data may not sum to 100% due to rounding and data restrictions.SOURCE: KCMU/Urban Institute analysis of 2013 and 2012 ASEC Supplements to the CPS.
Appendix Table 4: Nonelderly Uninsured Rate by Race/Ethnicity and State, 2011-2012
Total
White
Black
Hispanic
Other
All People of Color
UNITED STATES
18%
13%
21%
31%
17%
25%
NORTHEAST
13%
10%
17%
21%
13%
18%
Connecticut
10%
8%
14%
18%
—
14%
Maine
12%
12%
—
—
—
—
Massachusetts
4%
4%
—
—
—
5%
New Hampshire
14%
13%
—
—
20%
22%
New Jersey
17%
11%
21%
29%
18%
24%
New York
13%
10%
17%
20%
14%
18%
Pennsylvania
13%
11%
19%
26%
12%
20%
Rhode Island
14%
11%
21%
25%
17%
23%
Vermont
9%
9%
—
—
—
—
MIDWEST
14%
12%
19%
27%
17%
21%
Illinois
16%
12%
22%
27%
14%
23%
Indiana
15%
13%
20%
20%
27%
21%
Iowa
12%
10%
—
23%
—
18%
Kansas
15%
13%
17%
33%
15%
23%
Michigan
13%
12%
16%
27%
—
17%
Minnesota
10%
8%
16%
26%
15%
19%
Missouri
16%
15%
25%
—
19%
23%
Nebraska
15%
11%
—
30%
20%
25%
North Dakota
12%
8%
—
—
30%
28%
Ohio
15%
13%
18%
33%
23%
22%
South Dakota
16%
12%
—
37%
31%
32%
Wisconsin
12%
9%
19%
24%
19%
21%
WEST
20%
14%
20%
30%
18%
25%
Alaska
20%
17%
—
23%
29%
26%
Arizona
20%
13%
—
31%
18%
28%
California
21%
14%
19%
29%
17%
25%
Colorado
17%
13%
26%
28%
15%
25%
Hawaii
9%
11%
—
10%
9%
9%
Idaho
19%
15%
—
42%
—
37%
Montana
22%
20%
—
—
38%
33%
Nevada
27%
21%
31%
35%
23%
31%
New Mexico
24%
17%
—
26%
39%
29%
Oregon
17%
15%
—
31%
14%
23%
Utah
16%
12%
—
34%
25%
31%
Washington
16%
13%
21%
28%
17%
22%
Wyoming
19%
17%
—
26%
38%
30%
SOUTH
21%
16%
22%
38%
19%
28%
Alabama
16%
14%
18%
42%
—
20%
Arkansas
21%
19%
23%
34%
—
26%
Delaware
12%
9%
12%
29%
—
17%
District of Columbia
9%
5%
11%
15%
—
11%
Florida
25%
19%
29%
34%
23%
31%
Georgia
22%
16%
24%
43%
23%
28%
Kentucky
17%
16%
22%
38%
—
25%
Louisiana
22%
17%
30%
41%
—
31%
Maryland
15%
11%
15%
37%
14%
19%
Mississippi
18%
14%
23%
—
—
23%
North Carolina
20%
15%
21%
44%
19%
26%
Oklahoma
20%
18%
18%
31%
22%
23%
South Carolina
19%
17%
21%
39%
—
22%
Tennessee
16%
13%
17%
45%
—
22%
Texas
27%
17%
22%
39%
20%
33%
Virginia
15%
11%
20%
36%
15%
22%
West Virginia
17%
17%
—
—
—
24%
NOTE: ” –” Not sufficient data for a reliable estimate. Data may not sum to 100% due to rounding and data restrictions.SOURCE: KCMU/Urban Institute analysis of 2013 and 2012 ASEC Supplements to the CPS.
Appendix Table 5: Medicaid/CHIP Income Eligibility Limits as a Percent of the Federal Poverty Level,by Region and State as of January 2014
Children
Pregnant Women
Parents(in a family of three)
Childless Adults(for an individual)
NORTHEAST
Connecticut
323%
263%
201%
138%
Maine
213%
214%
105%
0%
Massachusetts
305%
205%
138%
138%
New Hampshire
323%
201%
75%
0%
New Jersey
355%
199%/205%
138%
138%
New York
405%
223%
138%
138%
Pennsylvania
319%
220%
38%
0%
Rhode Island
266%
195%/258%
138%
138%
Vermont
318%
213%
138%
138%
Median
319%
214%
138%
138%
MIDWEST
Illinois
318%
213%
138%
138%
Indiana
255%
213%
24%
0%
Iowa
380%
380%
138%
138%
Kansas
250%
171%
38%
0%
Michigan
217%
200%
138%
138%
Minnesota
288%
283%
205%
205%
Missouri
305%
210%
24%
0%
Nebraska
218%
199%
55%
0%
North Dakota
175%
152%
138%
138%
Ohio
211%
205%
138%
138%
South Dakota
209%
138%
54%
0%
Wisconsin
306%
306%
100%
100%
Median
253%
208%
119%
119%
WEST
Alaska
208%
205%
128%
0%
Arizona
205% (closed)
161%
138%
138%
California
266%
213%
138%
138%
Colorado
265%
200%/265%
138%
138%
Hawaii
313%
196%
138%
138%
Idaho
190%
138%
27%
0%
Montana
266%
164%
52%
0%
Nevada
205%
164%
138%
138%
New Mexico
305%
255%
138%
138%
Oregon
305%
190%
138%
138%
Utah
205%
144%
47%
0%
Washington
305%
198%
138%
138%
Wyoming
205%
159%
59%
0%
Median
265%
177%
138%
138%
SOUTH
Alabama
317%
146%
16%
0%
Arkansas
216%
214%
138%
138%
Delaware
217%
214%
138%
138%
District of Columbia
324%
324%
221%
215%
Florida
215%
196%
35%
0%
Georgia
252%
225%
39%
0%
Kentucky
218%
200%
138%
138%
Louisiana
255%
214%
24%
0%
Maryland
322%
264%
138%
138%
Mississippi
214%
199%
29%
0%
North Carolina
216%
201%
45%
0%
Oklahoma
210%
138%
48%
0%
South Carolina
213%
199%
67%
0%
Tennessee
255%
200%
111%
0%
Texas
206%
203%
19%
0%
Virginia
205%
148%
52%
0%
West Virginia
305%
163%
138%
138%
Median
217%
200%
52%
0%
Eligibility thresholds include the standard five percentage point of the federal poverty level disregard. For states with two levels listed, the value before the slash is the eligibility limit for pregnant women in Medicaid.SOURCE: Based on data from the Centers for Medicare and Medicaid Services available on Medicaid.gov as of January 2014
Endnotes
KCMU/Urban Institute analysis of 2013 and 2012 ASEC Supplements to the CPS. ↩︎
Based on data from Health Insurance Marketplace: March Enrollment Report, October 1, 2013 – March 1, 2014, Office of the Assistant Secretary for Planning and Evaluation (ASPE), Department of Health and Human Services (HHS); March 11, 2014 and State-by-State Estimates of the Number of People Eligible for Premium Tax Credits Under the Affordable Care Act, Kaiser Family Foundation, November 5, 2013. https://modern.kff.org/health-reform/state-indicator/marketplace-enrollment-as-a-share-of-the-potential-marketplace-population/#↩︎
Guyer, J. et al, “Fast Track to Coverage: Facilitating Enrollment of Eligible People into the Medicaid Expansion,” Kaiser Commission on Medicaid and the Uninsured, November 2013. ↩︎
National Association of Community Health Centers, 2012. Population data based KCMU/Urban Institute analysis of 2013 and 2012 ASEC Supplements to the CPS. ↩︎
Centers for Medicare and Medicaid Services, Rural Health Center, Medicare Certified Rural Health Clinics as of 1/9/201 ↩︎
HCUP Nationwide Inpatient Sample (NIS), 2011, Agency for Healthcare Research and Quality (AHRQ), based on data collected by individual States and provided to AHRQ by the States. ↩︎
National Association of Community Health Centers, 2012. Population data based KCMU/Urban Institute analysis of 2013 and 2012 ASEC Supplements to the CPS.
↩︎
The Senate Committee on Appropriations, approved the FY 2015 State and Foreign Operations Appropriations bill, which includes funding for U.S. global health programs at the U.S. Agency for International Development (USAID) and the State Department (see table below) comprising a significant portion of U.S. funding for global health (total funding for global health is not currently available as some funding provided through USAID, HHS, and DoD is not yet available).
According to the committee report, bilateral HIV programs through the President’s Emergency Plan for AIDS Relief (PEPFAR) at the State Department are funded at the same level as the President’s request, but $300 million below the related House appropriations bill. Funding for the Global Fund to Fight AIDS, Tuberculosis and Malaria (Global Fund) matches both the President’s request and the House bill.
Funding for tuberculosis, neglected tropical diseases (NTDs), maternal and child health (MCH), nutrition, pandemic influenza, and polio is above the President’s request while funding for malaria is slightly below the President’s request; all of these areas are below the levels provided in the House bill.
Total funding for family planning and reproductive health (FP/RH) programs in the bill matches the President’s request and is $183m (40%) above the House appropriations bill.
Department / Agency / Area
FY14Enacted(millions)
FY15 Request(millions)
FY15 House Bill (millions)
FY15 Senate Bill (millions)
Difference (millions)
Senate – FY14
Senate – Request
Senate – House
USAID – Global Health Programs Account (GHP)
HIV/AIDS
$330.0
$330.0
$330.0
$330.0
$0(0%)
$0(0%)
$0(0%)
Tuberculosis
$236.0
$191.0
$236.0
$225.0
$-11(-4.7%)
$34(17.8%)
$-11(-4.7%)
Malaria
$665.0
$674.0
$674.0
$669.5
$4.5(0.7%)
$-4.5(-0.7%)
$-4.5(-0.7%)
Neglected Tropical Diseases (NTDS)
$100.0
$86.5
Not Yet Known
$100.0
$0(0%)
$13.5(15.6%)
–
Maternal & Child Health (MCH)
$705.0
$695.0
$732.0
$700.0
$-5(-0.7%)
$5(0.7%)
$-32(-4.4%)
of which GAVI
$175.0
$200.0
$200.0
$200.0
$25 (14.3%)
$0 (0%)
$0(0%)
of which Polio
$51.0
$44.5
$51.0
$51.5
$0.5 (1%)
$7 (15.7%)
$0.5(1%)
Nutrition
$115.0
$101.0
$115.0
$111.0
$-4(-3.5%)
$10(9.9%)
$-4(-3.5%)
Vulnerable Children
$22.0
$14.5
$22.0
$22.0
$0(0%)
$7.5(51.7%)
$0(0%)
Family Planning & Reproductive Health (FPRH)*
$524.0
$538.0
See Below
$539.0
$15(2.9%)
$1(0.2%)
–
Pandemic Influenza
$72.5
$50.0
Not Yet Known
$72.5
$0(0%)
$22.5(45%)
–
Total USAID:
$2,769.5
$2,680.0
$2,637.0
$2,769.0
$-0.5(0%)
$89(3.3%)
$123(5%)
State Department – Global Health Programs Account (GHP)
HIV
$4,020.0
$4,020.0
$4,320.0
$4,020.0
$0(0%)
$0(0%)
$-300(-6.9%)
of which UNAIDS
$45.0
$45.0
Not Yet Known
$45.0
$0(0%)
$0(0%)
–
Global Fund
$1,650.0
$1,350.0
$1,350.0
$1,350.0
$-300(-18.2%)
$0(0%)
$0(0%)
Total State:**
$5,670.0
$5,370.0
$5,670.0
$5,370.0
$-300 (-5.3%)
$0 (0%)
$-300 (-5.3%)
Total GHP – State & USAID
Total State & USAID GHP:
$8,439.5
$8,050.0
$8,307.0
$8,139.0
$-300.5(-3.6%)
$89(1.1%)
$-168(-2%)
International Organizations & Programs (IO&P) – State & Foreign Operations
United Nations Children’s Fund (UNICEF)
$132.0
$116.6
$132.0
$132.0
$0(0%)
$15.4(13.2%)
$0(0%)
United Nations Population Fund (UNFPA)
$35.0
$35.3
$0.0
$37.5
$2.5(7.1%)
$2.2(6.2%)
$37.5(NA)
Family Planning & Reproductive Health (FP/RH) – State & Foreign Operations (All Accounts)*
FP/RH
$610.0
$644.3
$461.0
$644.0
$34.3(5.6%)
$0(0%)
$183.3(39.8%)
of which GHP account
$524.0
$538.0
Not Yet Known
$539.0
$15(2.9%)
$1(0.2%)
–
of which ESF account
$51.0
$71.0
Not Yet Known
$67.8
$16.8(32.9%)
$-3.2(-4.5%)
–
of which UNFPA
$35.0
$35.3
$0.0
$37.5
$2.5 (7.1%)
$2.2 (6.2%)
$37.5 (NA)
Polio – State & Foreign Operations (All Accounts)
Polio
$59.0
$50.0
$59.0
$59.0
$0(0%)
$9(18%)
$0(0%)
of which GHP account
$51.0
$44.5
$51.0
$51.5
$0.5 (1%)
$7 (15.7%)
$0.5(1%)
of which ESF account
$8.0
$5.5
$8.0
$7.5
$-0.5 (-6.3%)
$2 (36.4%)
$-0.5(-6.3%)
*The House specified total funding levels for family planning and reproductive health (FP/RH) activities, but did not delineate this funding by account beyond stipulating the U.S. contribution to UNFPA.**Represents combined PEPFAR funding (HIV bilateral and Global Fund) at the State Department.
Additional Information:
Learn more about the House SFOPs appropriations bill here.
In late March 2014, the Kaiser Family Foundation’s Commission on Medicaid and the Uninsured and the Satcher Health Leadership Institute gathered a broad range of stakeholders at Morehouse School of Medicine in Atlanta, Georgia for a roundtable discussion of current and future opportunities and challenges for advancing health care and health equity in the South. Roundtable participants represented nearly every state within the South and a broad range of perspectives, including health policy researchers, providers and hospitals, state officials, and consumer advocates. This brief summarizes the primary themes expressed by participants as well as next steps to consider. Many of the themes that arose as part of this discussion apply to the nation more broadly but have particular resonance and importance for the South given the region’s longstanding disparities in health and health care. Companion materials, including Health Coverage and Care in the South in 2014 and Beyondand Health Coverage and Care in the South: A Chartbook, provide information on health coverage and care today in the South and changes under the Affordable Care Act (ACA).
Background
Figure 1: Census Regions and Divisions of the United States
The American South comprises a significant share of the nation’s population and some of the nation’s poorest states. As defined by the U.S. Census Bureau, the American South encompasses 17 states (Figure 1). The region is home to 115 million individuals, who account for over a third (37%) of all U.S. residents, and is growing rapidly. The South is racially and ethnically diverse, with people of color making up 41% of the total southern population. Although the region’s poverty rate is not significantly different from the national rate, with about one in five non-elderly Southerners living in a poor household, the South includes states with some of the highest poverty rates in the nation, such as Louisiana (28%), Mississippi (28%), Arkansas (26%), and the District of Columbia (25%).
The South is undergoing demographic shifts that will shape health care and health equity moving forward. Specifically, the population is growing rapidly within urban areas, while rural areas are experiencing declining or slow population growth. In addition, the region is becoming increasingly diverse, with a steadily increasing Black population and a rapidly growing Hispanic population. These changes are occurring together with growing educational disparities compared to the rest of the country and an increasingly aging population.
Southerners face longstanding disparities in health and health care. While measures of health status vary by state, Southerners as a group generally are more likely than those in other regions to have a number of chronic illnesses and experience worse health outcomes. As in other regions, health status within the South also varies by race and ethnicity and Blacks, in particular, are more likely than Whites to report fair or poor health. While a broad array of factors contributes to these disparities in health, they, in part, reflect the fact that Southerners are more likely to be uninsured and less likely to have access to needed health care services than those in other regions.
The ACA offers new opportunities to advance health and health equity in the South. The ACA provides new coverage options for millions of uninsured Southerners, particularly in states that are implementing the ACA Medicaid expansion. Moreover, the ACA includes a wide array of provisions designed to improve health care delivery systems, increase access to care, enhance prevention and wellness efforts, and reduce disparities, which together offer the potential to advance health and health equity in the South over the long-term.
Key Themes from Roundtable Discussion
Health Insurance Coverage of the Low-Income Population
As in all regions, the ACA offers southern states the opportunity to increase coverage for the low-income population by expanding Medicaid to low-income adults and establishing Marketplaces for moderate-income individuals to obtain financial assistance for private coverage. States have options for implementing these coverage expansions. Specifically, as a result of the Supreme Court ruling on the ACA, the ACA Medicaid expansion to low-income adults was effectively made a state option. Regarding the Marketplaces, states may elect to create a state-based Marketplace, to use the federally-facilitated Marketplace, or to utilize a partnership model in which the state and federal government share roles and responsibilities. State implementation choices as well as outreach and enrollment efforts to connect eligible people to coverage will have important implications for health coverage in the region looking ahead.
New Coverage Options
Southern states have made varied implementation choices for the ACA coverage expansions. Some states in the region have fully embraced the coverage expansion opportunities under the ACA, expanding Medicaid and creating their own state-based Marketplaces. However, most southern states are using the federally-facilitated Marketplace and are not currently implementing the Medicaid expansion. Regardless of state implementation choices, the ACA provides opportunities to increase coverage by enrolling people in Marketplace coverage and enrolling those who were eligible under states’ previous Medicaid eligibility rules but not enrolled. Further, in states that expanded Medicaid, many low-income parents and other adults became newly eligible for the program. However, in states that have not implemented the Medicaid expansion, there is a gap in coverage for poor adults who remain ineligible for Medicaid but do not earn enough to qualify for the tax credits for Marketplace coverage, which begin at 100% of the federal poverty level.
Some southern states, such as Kentucky and Arkansas, pursued state-specific approaches to the ACA coverage expansions. Kentucky implemented the Medicaid expansion via executive order and built a state-based Marketplace. Employing lessons learned from implementation of the Children’s Health Insurance Program (CHIP), Kentucky used state-specific branding and marketing for its Medicaid and Marketplace coverage expansions. In Kentucky, all residents are directed to “Kynect, Kentucky’s Health Care Connection” for health coverage, and consumers generally do not view the new options for coverage as connected to the ACA or “Obamacare.” Participants indicate that the successful coverage expansion efforts in Kentucky have enabled the state to begin to focus on broader health goals, including improving access, meeting health care workforce needs, and advancing public health, for example, through reduced tobacco use. Arkansas pursued a state-federal partnership model for its Marketplace and obtained a waiver from the federal government to pursue a “private option” model for its Medicaid expansion so that individuals in the expansion receive subsidized coverage through the Marketplace. The state legislature must vote each year under budget rules to continue funding for the Medicaid expansion in Arkansas. As a result of continued political and ideological tensions over the expansion, the legislature recently passed new requirements for program changes in order for the Medicaid expansion to continue and imposed restrictions on assisters who help people enroll in coverage in the Marketplace.
For states that are not expanding Medicaid, the ACA still provides opportunities to improve coverage. Regardless of state decisions to expand Medicaid, people can still gain coverage through the new Marketplaces and under states’ existing eligibility rules. While experiences vary across states, recent data show that some southern states that have not expanded Medicaid have experienced significant enrollment increases since open enrollment for the new Marketplaces began, likely reflecting increased enrollment of people who were already eligible for the program due to outreach and enrollment efforts associated with the ACA and streamlined enrollment processes. However, participants noted that, in some southern states, advancing coverage has been challenging. Some states have reduced funding for outreach and enrollment efforts, threatening previous progress in expanding coverage, particularly for children, and some have imposed additional training requirements and limitations on enrollment assisters. However, stakeholders have been able to continue work quietly and achieve enrollment successes. In some cases, philanthropic organizations have provided funding to help assisters meet additional training requirements. Participants also indicated that, within states that are not politically supportive of the expansions, there still are opportunities to garner support for improved enrollment and retention policies under goals of good government and increased efficiency. Moreover, some states that have not adopted the Medicaid expansion are actively implementing other health care and health system improvements under the ACA and/or exploring alternative approaches to care for their low-income populations.
Outreach and Enrollment Efforts
Targeted and coordinated outreach and enrollment strategies have been key to reaching and enrolling eligible people in coverage. Many outreach and enrollment efforts associated with ACA implementation build upon lessons learned from the implementation of CHIP. Participants highlighted a wide range of outreach and enrollment strategies that have been utilized across the region, including conducting outreach through large community events such as the state fair and local sporting events, like football games; leveraging data from other programs, such as the Supplemental Nutrition Assistance Program (SNAP or food stamps), to facilitate enrollment; and drawing on resources from other policy areas—for example, using an incident command system for emergency preparedness to identify eligible populations. It was noted that provider visits also can provide a valuable opportunity to engage and enroll people in coverage, and certified enrollment assisters in hospitals and community clinics have achieved enrollment success. Providers’ role in enrollment varies though, as they are not all well-informed or well-positioned to enroll people in coverage. Overall, participants emphasized that coalition-building and coordination across entities have been central components of successful coverage efforts. However, sustaining enrollment networks as federal funding declines will be a primary challenge moving forward.
For hard-to-reach populations, including communities of color, it is important for outreach and enrollment efforts to come through trusted individuals within the community. There are a number of challenges to reaching these groups, including lack of knowledge and distrust and misperceptions about coverage options. In particular, fear and distrust stemming from restrictive immigration policies can hamper enrollment, particularly within the Latino community. Participants stressed that having champions within the community conduct outreach and enrollment and utilizing promotoras and other community health workers to reach out to eligible families can help reduce these enrollment barriers.
Addressing the needs of individuals who are left out of coverage because their state has not expanded Medicaid has been challenging for outreach and enrollment workers. Because many states in the South have not expanded Medicaid, a large share of people coming to enrollment events and completing applications with enrollment assisters fall into a coverage gap. These individuals have income too high to qualify for Medicaid but do not earn enough to qualify for premium subsidies for Marketplace coverage. Participants indicated that it has been difficult for assisters and individuals to invest time and effort in completing applications for individuals who are found ineligible for coverage because they fall into the gap. Enrollment assisters have found it helpful to connect individuals who fall into the gap to existing resources to address their current health care needs, and some assisters have developed lists of resources to provide to individuals in this situation.
Looking ahead
Achieving greater progress in expanding coverage within the region will require recognizing and working within the unique political dynamics of each state. Although there is wide variation in legislative structures and cultures across southern states, within all states in the region, politics are local and driven by a small group of primary influencers. Participants agreed that it will be necessary to understand and work within these state-specific dynamics and engage these primary influencers to achieve more progress in expanding coverage within the region. Some participants suggested it is valuable to encourage state legislators to “own” a problem and want to solve it, even if there is not agreement on a particular solution. Overall, documenting and sharing the lessons learned from southern states that are moving forward with the ACA coverage expansions will help inform and shape future coverage efforts in the region, recognizing that there is no deadline by which states must choose to expand Medicaid.
Health Care and the Safety-Net
To improve health outcomes in the long term, it also will be important to ensure that individuals are able to access needed primary and specialty care services. The ACA includes a number of provisions to help states improve health system capacity, including increased funding to expand community health centers and a temporary increase in Medicaid payment rates for primary care physicians. Increases in physician capacity will be especially important in areas with historically limited health resources, which include many areas in the South. Community health centers and other safety net providers will likely continue to serve an important role in providing care, especially for low-income and uninsured as well as rural populations. The continued and increased stress on safety-net providers may be particularly pronounced in the South, given that Medicaid eligibility for adults remains limited and the immigrant population is increasing. Overall, states in the South face a variety of challenges to improving access to care, and it will be important to build on successful initiatives and utilize existing resources and opportunities to address these challenges.
Increases in the availability of providers will be necessary to expand access to care. Participants stressed that broad workforce development efforts will be needed to establish sufficient provider capacity over the long term, particularly for primary care providers and within rural areas. In the shorter term, one potential opportunity to increase access to care in the region is to allow advanced practice nurses to practice at the top of their license. Southern states currently have some of the most restrictive practice limitations in the nation for nurse practitioners. Moreover, requirements for physician oversight of nurse practitioners can be problematic in rural areas in the region, as the nearest physician may be many miles away.
Hospitals may face increased strains on care capacity due to scheduled funding reductions and the absence of the Medicaid expansion in many states in the region. Disproportionate Share Hospital (DSH) payments, which help cover costs for hospitals that serve a large number of uninsured and Medicaid patients, are scheduled to be reduced under the ACA because it was anticipated that hospitals would serve fewer uninsured individuals as people gained coverage under the Medicaid expansion. These reductions were originally scheduled to go into effect on October 1, 2013, but were delayed until the beginning of fiscal year 2016, with double the reduction that would otherwise have applied that year. Allocations for the reductions have yet to be determined, but are legislatively required to take into account five factors, including a state’s uninsured rate. The scheduled DSH reductions would likely have a significant impact in the South, since many states in the region have not expanded Medicaid. Safety-net hospitals will continue to serve a large share of uninsured, low-income patients, especially in states with limited Medicaid coverage. Participants believe the reductions would likely lead to reductions in hospital clinical services and hospital closures, particularly among smaller rural hospitals that are already struggling to maintain their services and viability. To alleviate these impacts, some participants suggested that hospitals could explore options to redirect money flowing through other avenues and generate revenues by increasing enrollment of patients who are eligible for Medicaid under existing rules but not enrolled. However, even with mitigating efforts, the planned DSH reductions would likely have a significant negative impact on care capacity in the region. Although hospitals could be influential in encouraging states to expand Medicaid to minimize these consequences, some participants felt that engaging in the debate might put hospitals at risk for politically-driven cuts to other sources of state funding.
There is increased need for culturally and linguistically appropriate services given the growing diversity of the region. Participants indicated that strong beliefs in self-reliance and independence among some people in the rural community impede them from seeking care. As such, greater education about the value of obtaining regular care is necessary to ensure they access care appropriately. Participants suggested that establishing a diverse health care workforce to reflect the changing demographics of the population within the South will be an essential component of providing linguistically and culturally appropriate care and that achieving greater diversity among health professional leadership and faculty will be important for establishing a more diverse workforce over time.
There is a growing recognition of the importance of providing integrated physical and behavioral health care, and there are a number of promising initiatives underway to support integration. Participants emphasized that it will be necessary to promote integration at both the organizational level and the individual patient level. In particular, team-based care and provider training curricula that support team-based care (e.g., training interdisciplinary teams of doctors, nurses, social workers, etc.) were highlighted as potential strategies to support greater integration. Several successful integration initiatives are underway in the region, including collaborations between federally qualified health centers (FQHCs) and county mental health boards and care management and coordination initiatives for high-utilizers of the emergency room. Moving forward, participants suggested that striving to make integrated care the standard of care among safety-net providers will improve their ability to meet the high needs of the population they serve.
Aligning financial incentives will promote integration and coordination of care. Most current payment arrangements are tied to encounters and visits, rather than coordination or outcomes. Participants noted that tying payments to coordination and outcomes will facilitate greater integration and coordination of care and indicated that there has been greater movement toward pay-for-performance models within the region. However, it was recognized that some practices might not want to care for underserved populations that are sicker and more complex under these models, as they might negatively affect measures on which performance is assessed.
Health Equity and Public Health Outcomes
As noted, the South faces longstanding disparities in health, including greater prevalence of chronic conditions and worse health outcomes compared to other regions. Moreover, within the region, there are significant disparities by race and ethnicity. Moving the health care system away from a focus on treating sickness and disease to promoting wellness and prevention will facilitate greater equity and improvements in public health. There are a number of efforts in place at the federal level to reduce disparities, including new provisions under the ACA, as well as state and local level efforts. Overall, broad initiatives that extend beyond health care to address social determinants of health will be key for achieving progress in addressing the remaining challenges and gaps in health outcomes and equity within the region.
Southern states have improved some health outcomes over time, but significant challenges remain in achieving greater health equity. Participants recognized that the South has achieved some progress in improving health outcomes, and there has been notable improvement in the quality of care over the past decade. However, improvements in quality have not necessarily translated into increased health equity, and significant disparities remain. For example, although infant mortality rates in the region have fallen, rates still remain higher compared to other regions and marked racial and ethnic disparities persist, particularly between Whites and Blacks. Participants also noted that while there are fewer racial and ethnic disparities related to mental health, there are notable disparities between rural and urban populations. Moreover, mental health and substance use disorders are widespread and costly and can have spillover effects on the broader community. It was noted that serious substance use problems in one southern community impeded a company’s plans to expand jobs and operations in that area.
To advance health equity, efforts need to move beyond clinical services to address social determinants of health. Participants agreed that improving health and reducing disparities will require looking beyond medical care to address broader needs and challenges such as housing, transportation, food insecurity, and domestic violence. Some initiatives that seek to address broader needs are already underway in the region. For example, a new program in South Carolina performs a risk assessment of high need individuals, develops a plan to address their health and social needs, and then manages and coordinates their care. Yet, it remains challenging to implement approaches that integrate medical and social services, particularly given their different funding streams and bureaucracies. Looking ahead, participants suggested that it will be important to incorporate greater awareness of social determinants of health and community interventions into provider training and standards of care. It was noted that community health training components of nursing programs, which support more holistic care, offer valuable resources and opportunities that could help facilitate such efforts.
Increased data, broad and positive framing of issues, and identification of lessons learned from successful initiatives can help support reductions in disparities. Participants emphasized that the lack of adequate data currently available by race and ethnicity makes it challenging to measure progress in reducing disparities. Improvements in data collection and analytic capabilities are necessary to assess whether initiatives and activities are moving outcomes in the right direction and achieving greater equity. Participants also suggested that it is important to consider a broad range of potential interventions when seeking to reduce disparities, since the most effective solution to a problem may not be the direct inverse of its cause. Moreover, adopting positive framing for an issue rather than focusing on a problem can help garner increased support for improvement efforts—for example, focusing on the goal of saving babies’ lives rather than the problem of infant mortality. Lastly, participants suggested paths to success and lessons learned from successful initiatives can be applied to future efforts.
Health Care and the Economy
Overall, the ACA is anticipated to have broad economic impacts that will affect health care costs, state economies, jobs, and family budgets and spending. In particular, the Medicaid expansion is projected to increase state economic activity and have a positive effect on jobs and earnings. However, despite the economic arguments for expansion, many southern governors and legislators do not support the expansion due to concerns over state funding responsibilities for the program, competing economic demands, and political and ideological views.
Medicaid is an economic driver in state economies by bringing in federal matching dollars and supporting jobs. Medicaid is both an expenditure and a source of federal revenue in state budgets. The program is funded jointly by states and the federal government through a matching formula based on a state’s personal income and, in many southern states, where per capita personal income is less than the national average, the federal government pays at least two dollars for every dollar states spend on their programs. In all states that implement the Medicaid expansion, the federal government will pay an enhanced matching rate of 100% of the cost of coverage for newly eligible adults from 2014-2016, phasing down to 90% over time. Medicaid spending flows through a state’s economy, and the influx of federal funds magnifies the impact of state Medicaid spending. Medicaid funds directly support health care providers, including hospitals, community health centers, nursing facilities, group homes, and managed care plans. The funds also indirectly support other businesses and affect jobs, household spending, and state and local tax collections.
Several analyses of the potential impact of the Medicaid expansion in southern states have found that it would result in a net fiscal gain for states and increases in jobs, overall economic activity, and tax revenues. In Arkansas, projected revenue gains from the expansion led the state to implement tax cuts. Some participants suggested that that analyses of the potential impact of the Medicaid expansion fail to account for opportunity costs associated with the expansion, since spending in other areas (such as transportation) could increase federal funding and more directly increase jobs. Other participants felt that this argument does not apply to the Medicaid expansion because the federal funds are tied specifically to the expansion and 100% federal match in the early years.
Despite analyses projecting positive economic impacts, many southern governors and legislators do not support expanding Medicaid. Participants noted that those opposed to the expansion remain concerned about the state share of funding for the program over the long term and competing demands for state funds. Participants also indicated that political and ideological views continue to shape Medicaid expansion decisions in the region. It was noted that one of the main arguments some leaders in southern states have made against expanding Medicaid is that they do not want to direct more money into a broken system. Yet, some participants pointed out that many of these states are not fully utilizing options available to support improvement and innovation in the Medicaid program.
Challenges facing Medicaid are representative of challenges facing the larger health system. Participants had disparate views of the primary challenges facing Medicaid today. For example, while some believe Medicaid underpays providers, others view the program as more efficient than other types of coverage. However, there was general agreement among participants that many of the challenges facing Medicaid today are the same challenges facing the larger health care system, including demographic pressures (i.e., aging and disability), gaps in the supply and distribution of the health care workforce, and medical cost inflation. Given the significant role Medicaid plays in state health care systems, participants suggested that there are opportunities to leverage Medicaid at the state level to support broader health system transformation to address these system-wide issues.
Looking Ahead
In sum, the South is growing rapidly and experiencing demographic changes that have significant implications for health and health equity moving forward. The region’s health care system is in a transformational period as the ACA is implemented, and there is wide variation in how states in the region are addressing challenges and responding to opportunities to expand coverage and improve care that is framed in large part by the political and ideological context within each state.
The variation in state-level implementation of the ACA provides for natural experiments in the South as well as across the country. Participants noted that examining and tracking experiences in southern states such as Kentucky and Arkansas that are moving forward with Medicaid expansion, but in very different ways, will provide lessons for other states in the region and nationally. In both states, the ACA is being leveraged to support increases in health coverage as well as health care delivery system redesign and broader population health goals. Participants also suggested that it will be important to continue to track experiences in states that are not expanding Medicaid, and the degree to which they pursue alternative strategies to improve health care access and outcomes. Coverage options in the region may continue to evolve over time as there is no deadline by which states must decide to implement the Medicaid expansion. Moreover, states have the option to explore other state-specific coverage approaches when new state innovation waiver authority becomes available in 2017 that will allow states to waive Marketplace coverage provisions and combine those waivers with Medicaid, CHIP and other waivers. Regardless of state Medicaid expansion decisions, all states in the region are experiencing important changes in their health care systems under the ACA with new coverage opportunities available through the Marketplaces and modernized enrollment processes for Marketplaces and Medicaid. Moreover, many states are pursuing improvements in health care access and delivery systems.
As state actions and experiences in the region unfold, understanding their implications for racial and ethnic as well as geographic disparities in the region will be key. Participants emphasized that to improve health and health equity in the region, it will be important to identify clear goals and measure progress, particularly given its unique geography, demographics, and challenges. They noted that advancing these goals will require a long-term strategy that looks beyond traditional leadership models and health care-focused approaches. Building partnerships that tap into community assets and leverage trusted community leaders and coalitions will be essential for engaging populations and establishing the community infrastructure necessary to provide everyone with opportunities to lead healthy lives. In addition, participants suggested that aligning policies aimed at improving health with efforts to address the social determinants of health, such as housing, education, food security, and employment, will facilitate broad improvements over time.
This brief was prepared by Samantha Artiga, Jessica Stephens, and Barbara Lyons from the Kaiser Family Foundation and Harry Heiman from the Satcher Health Leadership Institute at Morehouse School of Medicine.
Over 115 million individuals live in the American South today, and together, they account for over one-third (37%) of the total U.S. population. The South is racially and ethnically diverse and home to a large share of the nation’s people of color. As such, efforts to improve health in the South have significant implications for the advancement of health and health equity nationwide.
The South has faced longstanding disparities in health and health care, although significant variation exists between southern states. As a group, compared to those in other regions, Southerners are more likely to be uninsured, less likely to have access to needed health services, and more likely to experience a number of chronic health conditions. Yet, many southern states have also adopted innovative approaches to improve their health systems, particularly in the delivery of care, that provide key lessons for improving access to health coverage in the South more broadly.
Health Coverage and Care in the South: A Chartbook provides key data on the demographic and economic characteristics of the southern population as well as their health status, health insurance coverage, and access to care today.
Together, these data offer a snapshot of health care in the South, highlighting both opportunities for advancement and challenges relating to improving health care and health equity looking forward.
Over one third of the total U.S. population resides in the 17 southern states, and the population has been growing over time. The southern population is racially and ethnically diverse, although the racial and ethnic composition varies by state. Overall, over four in ten of all people of color in the U.S. reside in the South, including over half of Blacks in the United States. The region is also diverse across a number of factors including citizenship status, age, urban-rural composition, and income.
Report: Section 2: The Southern Economy
The southern states play an important role in the national economy, contributing 35 percent of the total U.S. gross domestic product. Work patterns in the South are similar to those in other regions, although Southerners are less likely than those in other regions to be unemployed. Overall, Southerners earn less per capita than individuals in other regions of the U.S. However, income varies significantly by state, and, in four states, per capita earnings are higher than the national average. Earnings also vary widely within states, and several southern states have among the highest levels of income inequality in the country.
Report: Section 3: Health Status
While measures of health status vary by state, Southerners as a group are generally more likely than those in other regions to have a number of chronic illnesses and experience worse health outcomes. For example, most of the states with the highest rates of obesity and diabetes are in the South, and many southern states are among those with the highest infant mortality rates and cancer death rates in the country. As in other regions, health status within the South also varies by race and ethnicity, and Blacks in particular, are more likely than Whites to report having fair or poor health.
Report: Section 4: Health Insurance Coverage
While a broad array of factors contribute to the relatively high chronic disease rates and poor health outcomes in the South, a first step in addressing these disparities is ensuring that individuals have health coverage that enables them to access preventive and primary care and ongoing treatment to meet their health needs. Health insurance coverage facilitates timely access to health services, and being uninsured affects people’s ability to obtain needed medical care as well as their financial security. Compared to individuals in other regions, Southerners are more likely to be uninsured. Further, within the South, people of color are more likely than Whites to be uninsured. Coverage rates in the South vary by state, however, reflecting variation in demographics and the availability of health coverage options.The Affordable Care Act has the potential to extend health coverage to many currently uninsured Southerners through an expansion of Medicaid to low-income individuals and the creation of new health insurance Marketplaces with financial assistance to help moderate-income individuals purchase private coverage. Because many southern states are not implementing the Medicaid expansion, many uninsured adults in the South will not gain a new coverage option. However, nearly half of uninsured individuals are eligible for some financial assistance to obtain coverage in 2014, largely through the Marketplace, and millions of eligible individuals have already enrolled.
Report: Section 5: Access To Care, Delivery Systems, And The Safety Net
To improve health outcomes in the long term, it will be important to ensure that all individuals are able to obtain needed primary and specialty health care services. Southerners have historically been more likely than those in other regions to report difficulty accessing and paying for needed care.
States are increasingly relying on a number of tools to improve provider capacity and reform the delivery of care including expanding the use of Medicaid managed care, increasing payment to providers, and revising scope of practice laws to allow nurse practitioners to treat patients with fewer restrictions. Even with improvements to the delivery and coordination of care, however, community health centers and other safety net providers in the South will likely continue to serve an important role in providing care to some of the region’s most vulnerable low-income populations including the uninsured, people of color, homeless individuals, and those with limited English proficiency.
Report: Section 6: Medicaid’s Broader Role
Medicaid is both an expenditure and a source of federal revenue in state budgets. The program is funded jointly by states and the federal government through a matching formula based on a state’s personal income, and in many southern states, where per capita personal income is less than the national average, the federal government pays at least two dollars for every dollar states spend on their programs. Overall, the federal government funds the majority of Medicaid costs in the South, although the way in which states finance their share of spending on Medicaid and its impact on their budgets varies by state.
As in other regions and in the United States generally, Medicaid spending in the South is concentrated among a small number of high-need enrollees. Children and adults in the South account for a large majority of Medicaid enrollees but less than 40 percent of expenditures. The elderly and disabled, who make up only about one quarter of Medicaid enrollees, account for nearly two-thirds of spending. Looking forward, efforts to improve care and control costs in Medicaid will likely focus on these high-need, high-cost beneficiaries.
Conclusion
Given the growing and diverse population in the South, changing patterns of health coverage and care in the region have important implications nationally and for people of color. As such, continued attention to health coverage and care in the South for those gaining coverage and those remaining uninsured will be important for understanding the impact of the ACA and implications for longstanding efforts to reduce disparities in coverage, care, and health outcomes.
People in ACA-Compliant Plans Are Somewhat More Likely To Say They Are in Fair or Poor Health Than Those in Non-Compliant Plans
People Who Switched Plans Due to Cancellation Notices or Other Reasons Are As Likely To Say Their Premiums Went Down As Went Up Overall About As Many People in This Market Feel They Benefited From the ACA As Feel Negatively Impacted, With Variations By Sub-Group
The first in a series of new surveys from the Kaiser Family Foundation of people who buy their own health insurance provides new data about the experiences and perceptions of a group that has been the subject of much conjecture and political debate. The survey finds nearly six in 10 people (57%) who purchased health insurance through the Affordable Care Act’s new marketplaces (also known as “exchanges”) had been uninsured just prior to obtaining coverage. Most of this group say they had been without coverage for at least two years, and seven in ten (72%) say they decided to buy their own health insurance because of the ACA. The law provides income-based premium subsidies to people who buy coverage through the marketplaces.
The survey reports the views and experiences of people with non-group coverage, including those in ACA-compliant plans sold both inside and outside the state marketplaces, as well as those in non-compliant plans, which are policies that took effect prior to Jan. 1 and in many cases would not comply with all the law’s requirements.
“There has been considerable debate about how many people signing up for coverage in the new exchanges were uninsured. Our survey reveals that the majority of people who enrolled in the new exchanges were previously uninsured,” Foundation President and CEO Drew Altman said.
Perceptions of the Law’s Impact for Different Categories of Non-Group Enrollees
People with non-group insurance coverage overall are more likely to have a favorable view of the ACA than the public at large. Non-group enrollees are roughly evenly split between favorable (47%) and unfavorable (43%) views, while among adults nationwide in the same age range, more have an unfavorable view of the law (46%) than a favorable one (38%). When asked about the overall impact on their own families, similar shares of non-group enrollees say that they’ve benefited (34%) and been negatively affected (29%) by the law. Among those who say they benefited, the most commonly cited ways are through lower costs and expanded access to care and insurance. Those who feel negatively affected are most likely to cite increased costs, with much smaller shares citing other concerns such as the law’s individual mandate, cuts to benefits or choices, and policy cancellations. There is significant variation in these perceptions by individual characteristics, with those who report getting financial assistance in the marketplaces most likely to feel they benefited, and those who say they’ve had a plan cancelled most likely to say they were affected negatively.
Demographics of Those Enrolled in Non-Group Coverage
The survey provides a first look at the national demographic and health profile of people who enrolled in ACA-compliant plans, including those who bought such coverage outside the marketplaces. About two thirds of the non-group market is now in ACA-compliant plans.
The survey reveals some differences in the self-reported health status of people in compliant plans and non-compliant plans that may have implications for future insurance rates. Enrollment in compliant plans, whether sold inside or outside the state marketplaces, is especially important as insurers will set rates for next year based on this group’s experiences in each state.
While a large majority (82%) of those in compliant plans says they are in excellent, very good or good health, an even larger majority of those who remain in non-compliant plans say the same about their health (93%). This means that people in compliant plans are somewhat more likely than those in non-compliant plans to report being in fair or poor health (17% vs. 6%), which was expected as the law required insurers to accept all enrollees, regardless of their health. The effect of this on premiums is still uncertain, however, since many insurers anticipated a sicker-than-average mix of enrollees when they set their premiums for this year.
Most people (71%) in compliant plans overall rate their coverage as excellent or good overall, and more than half (55%) say it is an excellent or good value for what they pay for it, though roughly four in ten (39%) rate the value as “only fair” or “poor,” and about the same share say it is difficult to afford their monthly premiums (43%).
“This is a market very much in flux, and we will track experiences and perceptions over time as new people enroll and those already in the market gain more experience using their new plans,” said Liz Hamel, director of the Foundation’s Public Opinion and Survey Research. “While the share of the overall population enrolled in the non-group market is small, their views and experiences will have outsized significance in terms of whether the ACA is viewed as a success or not.”
Profile of Plan Switchers: How Their New Coverage Compares to Their Old Insurance
The survey also provides new insights into the experiences of “plan switchers,” people who previously had individual-market coverage and switched to new coverage after Jan. 1 either by buying coverage through the state marketplaces or directly from insurers. This group includes people who had their old policies cancelled as the ACA’s requirements kicked in, as well as people who switched for other reasons, including the availability of premium subsidies. In spite of reports last year about some people having plans cancelled and facing higher premiums, the survey finds that plan switchers are about as likely to report that they are paying less for their new plan than their old one (46%) as they are to say they are paying more (39%). This is likely due in part to the availability of tax credits for low- and moderate-income families who buy marketplace coverage.
“While there was much controversy last fall over ârate shock’ for people who had their policies cancelled, it’s now apparent that just as many people got financial relief under the Affordable Care Act,” Kaiser Senior Vice President Larry Levitt said.
Survey responses for plan switchers also indicate that their deductibles and level of coverage are similar to what they had in their previous plans. They are as likely to say their new plan’s deductible is lower than their old one as they are to say it is higher (31% in each case). Similarly, about the same shares say their new plan covers more (31%) as less (25%) services, and that their new plan offers more (29%) rather than less (26%) financial protections.
While more than half of plan switchers say their choice of providers is “about the same” under their new plan as under their old plan, more say they have less choice than more choice when it comes to primary care doctors (32% vs. 10%) and specialists (24% vs. 11%).
Compared to those in compliant plans who were previously uninsured, plan switchers report lower levels of satisfaction with the costs of their plan, and are less likely to believe their coverage is a good value for what they pay for it.
The survey also includes people’s assessments of their experiences shopping for a plan, including the ease of comparing plan features and enrolling in a plan, whether online or in person. Overall, half of those in ACA-compliant plans say they got outside help with the enrollment process, while the other half say they completed the process on their own.
Full survey results, including the detailed methodology and question wording, are available online.
METHODOLOGY SUMMARY
The survey was designed and analyzed by researchers at the Foundation. Telephone interviews were conducted from April 3 through May 11, 2014 among a nationally representative random sample of 742 adults ages 18-64 who purchase their own insurance, including 333 via landline and 409 via cell phone. Fieldwork was carried out in English and Spanish by SSRS, an independent research company. The margin of sampling error is plus or minus 4 percentage points for results based on the full sample, 5 percentage points for those in ACA-compliant plans, and 6 percentage points for those in plans purchased through the marketplace. For other subgroups, the margin of sampling error may be higher.
January 1, 2014 marked the beginning of several provisions of the Affordable Care Act (ACA) making significant changes to the non-group insurance market, including new rules for insurers regarding who they must cover and what they can charge, along with the opening of new Health Insurance Marketplaces (also known as “Exchanges”) and the availability of premium and cost-sharing subsidies for individuals with low to moderate incomes. Data from the Department of Health and Human Services and others provide some insight into how many people purchased insurance using the new Marketplaces and the types of plans they picked, but much remains unknown about changes to the non-group market as a whole. The Kaiser Family Foundation Survey of Non-Group Health Insurance Enrollees is the first in a series of surveys taking a closer look at the entire non-group market. This first survey was conducted from early April to early May 2014, after the close of the first ACA open enrollment period. It reports the views and experience of all non-group enrollees, including those with coverage obtained both inside and outside the Exchanges, and those who were uninsured prior to the ACA as well as those who had a previous source of coverage (non-group or otherwise).
The ACA motivated many non-group enrollees to get coverage, and nearly six in ten Exchange enrollees were previously uninsured
The survey finds that roughly two-thirds of those with non-group coverage are now in ACA-compliant plans, while three in ten have coverage they purchased before the ACA rules went into effect (referred to as “non-compliant plans” throughout this report). About half of all non-group enrollees now have coverage purchased from a Health Insurance Exchange, and nearly six in ten (57 percent) of those with Exchange coverage were uninsured prior to purchasing their current plan. Most of this previously uninsured group reports having gone without coverage for two years or more, and for many the ACA was a motivator in seeking coverage; seven in ten of those who were uninsured prior to purchasing a Marketplace plan say they decided to buy insurance because of the law, while just over a quarter say they would have gotten it anyway.
Enrollees in ACA-compliant plans report somewhat worse health than those in pre-ACA plans
While government data have provided some basic demographic information about Exchange plan enrollees, there has been no reliable information to date about the demographics of those enrolling in non-Exchange plans, or about the health status of either of these groups. The survey finds that the age and gender distribution is similar for those in ACA-compliant plans purchased inside and outside the Marketplace; overall, a third (34 percent) of adults with compliant plans are under age 35 and half (47 percent) are male. The survey does, however, find a difference in self-reported health status that may have implications for insurance market risk pools: those in compliant plans are more likely than those in non-compliant plans to report being in fair or poor health (17 percent versus 6 percent). This difference is largely driven by those with Exchange coverage, among whom 20 percent rate their health as fair or poor.
Majority gives positive ratings to their new insurance plans and says they are a good value, though four in ten find it difficult to afford their monthly premium
Overall, the majority of non-group enrollees rate their coverage as excellent or good, believe it is a good value for what they pay for it, and say they are satisfied with various aspects of their plans. Satisfaction is highest for choice of providers but somewhat lower for plan costs, and among those in compliant plans, about a third say they are not satisfied with their premiums and deductibles. Most feel well-protected by their plans and express confidence in their ability to pay for their usual medical costs, but some evidence of financial strain remains. Nearly half of those in ACA-compliant plans say they’re not confident they would be able to afford to pay for a major illness or injury, over four in ten say it is difficult to afford their monthly premiums, and over six in ten say they are worried that their premiums will become unaffordable in the future.
Among plan switchers, as many report paying less as paying more for their new plans, but survey shows some signs of a trend toward narrower provider networks
Among those who previously bought non-group insurance and have switched to a new, ACA-compliant plan (referred to as “plan switchers” throughout this report), nearly half (46 percent) say their current premium – taking into account government subsidies – is lower than it was under their previous plan, while four in ten (39 percent) say it is higher. This group’s responses to other survey questions suggest that the coverage they are getting is, on average, similar to what they had before. There is, however, some evidence of a trend toward plans with narrower provider networks. While over half of plan switchers say their choice of providers is “about the same” under their new plan as under their old plan, those who report a change in the amount of choice available are more likely to say they have less choice than more choice when it comes to primary care doctors (32 percent versus 10 percent) and specialists (24 percent versus 11 percent).
Plan switchers are less likely to be satisfied with plan costs, maybe because half of them report having their previous plan cancelled
Despite the fact that plan switchers are just as likely to say their premiums went down as went up under their new plan, this group stands out as being less satisfied with their plan costs and less likely to perceive their coverage as a good value compared to those in compliant plans who were previously uninsured. This may be related to the fact that about half of plan switchers report having received a cancellation notice from their previous insurer.
Half got help with enrollment; most say the shopping process was easy, but a third say it was difficult to set up a Marketplace account
Early problems with Healthcare.gov and many Exchange websites were widely reported in the media, and the survey finds that the Internet was the most commonly reported method of shopping and enrollment. However, it was not the only method; about a third of those with Exchange coverage and over half of those with compliant coverage purchased off-Exchange say they spent no part of the shopping and enrollment process on the Internet, and substantial shares report completing at least part of the enrollment process on the telephone or in person with someone helping them out. Overall, half of those in ACA-compliant plans say they got help with the enrollment process. Despite media reports of website and enrollment problems, most people in ACA-compliant plans purchased both on and off the Exchanges say it was at least somewhat easy to compare costs and coverage when shopping for plans. Still, 35 percent of Exchange enrollees in states using Healthcare.gov and 30 percent of those in states with their own Exchange websites say it was at least somewhat difficult to set up an account with the marketplace.
In the non-group market, those most likely to feel they have benefited from the ACA are people getting subsidies, those most likely to feel negatively impacted are those who had their plans cancelled
As a whole, non-group enrollees are more likely than the public overall to have a favorable view of the ACA – they are roughly evenly split between positive and negative views (47 percent favorable, 43 percent unfavorable), while views among 18-64 year-olds nationally are more negative than positive (38 percent favorable, 46 percent unfavorable1. Like it is nationally, opinion of the ACA among non-group enrollees is strongly divided along party lines. About equal shares of non-group enrollees feel their families have benefited (34 percent) and been negatively affected (29 percent) by the ACA. However, these averages mask substantial differences within the non-group market. Those who are most likely to feel they have benefited from the law are people receiving government financial assistance for Exchange plan premiums (60 percent benefited), while those most likely to feel they have been negatively affected by the law are people who experienced a plan cancellation in the past year (57 percent negatively affected). Read more here.
January 1, 2014 marked the beginning of several provisions of the Affordable Care Act (ACA) making significant changes to the non-group insurance market, including new rules for insurers regarding who they must cover and what they can charge, along with the opening of new Health Insurance Marketplaces (also known as “Exchanges”) and the availability of premium and cost-sharing subsidies for individuals with low to moderate incomes. Data from the Department of Health and Human Services and others provide some insight into how many people purchased insurance using the new Marketplaces and the types of plans they picked, but much remains unknown about changes to the non-group market as a whole.
The Kaiser Family Foundation Survey of Non-Group Health Insurance Enrollees is the first in a series of surveys taking a closer look at the entire non-group market. This first survey was conducted from early April to early May 2014, after the close of the first ACA open enrollment period. It reports the views and experience of all non-group enrollees, including those with coverage obtained both inside and outside the Exchanges, and those who were uninsured prior to the ACA as well as those who had a previous source of coverage (non-group or otherwise).
The ACA motivated many non-group enrollees to get coverage, and nearly six in ten Exchange enrollees were previously uninsured
The survey finds that roughly two-thirds of those with non-group coverage are now in ACA-compliant plans, while three in ten have coverage they purchased before the ACA rules went into effect (referred to as “non-compliant plans” throughout this report). About half of all non-group enrollees now have coverage purchased from a Health Insurance Exchange, and nearly six in ten (57 percent) of those with Exchange coverage were uninsured prior to purchasing their current plan. Most of this previously uninsured group reports having gone without coverage for two years or more, and for many the ACA was a motivator in seeking coverage; seven in ten of those who were uninsured prior to purchasing a Marketplace plan say they decided to buy insurance because of the law, while just over a quarter say they would have gotten it anyway.
Enrollees in ACA-compliant plans report somewhat worse health than those in pre-ACA plans
While government data have provided some basic demographic information about Exchange plan enrollees, there has been no reliable information to date about the demographics of those enrolling in non-Exchange plans, or about the health status of either of these groups. The survey finds that the age and gender distribution is similar for those in ACA-compliant plans purchased inside and outside the Marketplace; overall, a third (34 percent) of adults with compliant plans are under age 35 and half (47 percent) are male. The survey does, however, find a difference in self-reported health status that may have implications for insurance market risk pools: those in compliant plans are more likely than those in non-compliant plans to report being in fair or poor health (17 percent versus 6 percent). This difference is largely driven by those with Exchange coverage, among whom 20 percent rate their health as fair or poor.
Majority gives positive ratings to their new insurance plans and says they are a good value, though four in ten find it difficult to afford their monthly premium
Overall, the majority of non-group enrollees rate their coverage as excellent or good, believe it is a good value for what they pay for it, and say they are satisfied with various aspects of their plans. Satisfaction is highest for choice of providers but somewhat lower for plan costs, and among those in compliant plans, about a third say they are not satisfied with their premiums and deductibles. Most feel well-protected by their plans and express confidence in their ability to pay for their usual medical costs, but some evidence of financial strain remains. Nearly half of those in ACA-compliant plans say they’re not confident they would be able to afford to pay for a major illness or injury, over four in ten say it is difficult to afford their monthly premiums, and over six in ten say they are worried that their premiums will become unaffordable in the future.
Among plan switchers, as many report paying less as paying more for their new plans, but survey shows some signs of a trend toward narrower provider networks
Among those who previously bought non-group insurance and have switched to a new, ACA-compliant plan (referred to as “plan switchers” throughout this report), nearly half (46 percent) say their current premium – taking into account government subsidies – is lower than it was under their previous plan, while four in ten (39 percent) say it is higher. This group’s responses to other survey questions suggest that the coverage they are getting is, on average, similar to what they had before. There is, however, some evidence of a trend toward plans with narrower provider networks. While over half of plan switchers say their choice of providers is “about the same” under their new plan as under their old plan, those who report a change in the amount of choice available are more likely to say they have less choice than more choice when it comes to primary care doctors (32 percent versus 10 percent) and specialists (24 percent versus 11 percent).
Plan switchers are less likely to be satisfied with plan costs, maybe because half of them report having their previous plan cancelled
Despite the fact that plan switchers are just as likely to say their premiums went down as went up under their new plan, this group stands out as being less satisfied with their plan costs and less likely to perceive their coverage as a good value compared to those in compliant plans who were previously uninsured. This may be related to the fact that about half of plan switchers report having received a cancellation notice from their previous insurer.
Half got help with enrollment; most say the shopping process was easy, but a third say it was difficult to set up a Marketplace account
Early problems with Healthcare.gov and many Exchange websites were widely reported in the media, and the survey finds that the Internet was the most commonly reported method of shopping and enrollment. However, it was not the only method; about a third of those with Exchange coverage and over half of those with compliant coverage purchased off-Exchange say they spent no part of the shopping and enrollment process on the Internet, and substantial shares report completing at least part of the enrollment process on the telephone or in person with someone helping them out. Overall, half of those in ACA-compliant plans say they got help with the enrollment process. Despite media reports of website and enrollment problems, most people in ACA-compliant plans purchased both on and off the Exchanges say it was at least somewhat easy to compare costs and coverage when shopping for plans. Still, 35 percent of Exchange enrollees in states using Healthcare.gov and 30 percent of those in states with their own Exchange websites say it was at least somewhat difficult to set up an account with the marketplace.
In the non-group market, those most likely to feel they have benefited from the ACA are people getting subsidies, those most likely to feel negatively impacted are those who had their plans cancelled
As a whole, non-group enrollees are more likely than the public overall to have a favorable view of the ACA – they are roughly evenly split between positive and negative views (47 percent favorable, 43 percent unfavorable), while views among 18-64 year-olds nationally are more negative than positive (38 percent favorable, 46 percent unfavorable1 ). Like it is nationally, opinion of the ACA among non-group enrollees is strongly divided along party lines. About equal shares of non-group enrollees feel their families have benefited (34 percent) and been negatively affected (29 percent) by the ACA. However, these averages mask substantial differences within the non-group market. Those who are most likely to feel they have benefited from the law are people receiving government financial assistance for Exchange plan premiums (60 percent benefited), while those most likely to feel they have been negatively affected by the law are people who experienced a plan cancellation in the past year (57 percent negatively affected).
Key Findings:
About The Groups Described In This Report
This survey reports on the views and experiences of all people purchasing health insurance coverage in the non-group market. However, because of the complexities of the market and the changes brought about by the ACA, much of this report breaks out responses by different subgroups based on how they obtained their coverage and their previous insurance status. The ACA made major changes to the non-group insurance market, including new rules that standardize coverage, guarantee access to those with pre-existing conditions, and provide subsidies based on income for those buying coverage through new Health Insurance Exchanges (also known as Marketplaces; these terms are used interchangeably throughout this report).
Those rules took effect for coverage beginning on or after January 1, 2014. People were able to purchase this “ACA-compliant” coverage either through an Exchange or directly from an insurance company during an open enrollment period that began October 1, 2013 and ended March 31, 2014 (with some opportunities for special enrollment periods after that). This survey includes individuals who purchased these new ACA-compliant plans, as well as people who are currently enrolled in “non-compliant” plans, including those who were grandfathered under the ACA because they were purchased before the law went into effect, those who renewed policies last year or bought coverage that began before January 1, and those who have been able to keep their old policies for a period of time under a federal transition policy at the discretion of states.
A more detailed breakdown of the main groups described in this report is provided below.
Total non-group market: All individuals ages 18-64 whose primary source of health insurance coverage is a plan they purchased themselves, either directly from an insurance company or through a state or federal Health Insurance Marketplace, regardless of plan start date (see Survey Methodology for more details on inclusion criteria).
ACA-compliant plans (68% of total non-group market2): Allplans that took effect on or after January 1, 2014, including those purchased through a state or federal Marketplace and those purchased directly from an insurance company.
Exchange plans (48% of total non-group market): Plans that were purchased from a state or federal Health Insurance Exchange, including Exchange plans purchased through a health insurance agent or broker.
Compliant, non-Exchange plans (16% of total non-group market): Plans that took effect on or after January 1, 2014 that were purchased directly from an insurance company, including non-Exchange plans purchased through a health insurance agent or broker.
Previously uninsured, now in ACA-compliant plan (34% of total non-group market): Those with ACA-compliant plans who say they were uninsured immediately prior to purchasing their current plan.
Plan switchers (those who switched from a non-compliant to a compliant plan, 13% of total non-group market): Those with ACA-compliant plans who say they were covered by a different non-group plan (presumably, a non-compliant plan) immediately prior to purchasing their current plan, including those who chose to switch and those who had their prior plans cancelled.
Previously employer-sponsored insurance/COBRA (12% of total non-group market): Those with ACA-compliant plans who say they were covered by an employer-sponsored plan or COBRA immediately prior to purchasing their current plan.
Non-compliant plans (31% of total non-group market): Plans purchased outside the Health Insurance Exchange that took effect before January 1, 2014.
Key Findings:
Section 1: Basic Demographics Of The Non-Group Market
Among the entire non-group market, about half of individuals (48 percent) report having coverage obtained from a state or federal Health Insurance Exchange, 16 percent have ACA-compliant coverage purchased outside of the Exchanges, and three in ten (31 percent) have non-ACA-compliant plans (those that have been in effect since before January 1, 2014).
Figure 1: Share Of Non-Group Market By Plan Type
Plan type
Share of non-group market
ACA-Compliant (Net)
68%
Exchange
48
Non-Exchange
16
Unknown (purchased through broker)
3
Non-ACA-Compliant
31
Unknown if ACA-Compliant
1
One of the questions that has yet to be answered by state and federal data is what share of enrollees in ACA-compliant plans were previously uninsured. The survey finds that half of all those with compliant plans report being uninsured just prior to purchasing their current plan, while about one in five each say they were previously covered by another non-group plan (19 percent) or had employer coverage or COBRA (18 percent), and 9 percent previously had Medicaid or other public coverage. Exchange enrollees are more likely to say they were previously uninsured (57 percent), while those buying ACA-compliant plans outside the government marketplace are more likely to report having previous employer coverage (30 percent) or other non-group coverage (27 percent).
Figure 2
Among those who were previously uninsured and enrolled in a Marketplace plan, most say the reason they previously lacked coverage was because they couldn’t afford it or had no access to employer-sponsored insurance. Most of this group had been uninsured for a long time – seven in ten (71 percent) say that before buying their current plan they had been uninsured for two years or more, including 45 percent who say they were uninsured for at least five years. Seven in ten (72 percent) of the previously uninsured in Exchange plans say they decided to buy their own health insurance because of the ACA, while just over a quarter (26 percent) say they would have gotten insurance anyway, even without the law. These shares are similar when based on all those in ACA-compliant who were uninsured prior to purchasing their current plan.
Figure 3
Data from the Department of Health and Human Services provide some basic demographics, including the age and gender distribution, for individuals who signed up for Exchange plans.4 However, so far there has been no reliable information about the demographics of those enrolling in non-Exchange plans as well, or about the health status of either of these groups. The survey finds that the age and gender distribution is similar for those in ACA-compliant plans purchased inside and outside the Marketplace; overall, a third (34 percent) of adults with compliant plans are under age 35 and slightly fewer than half (47 percent) are male. By comparison, those with non-compliant plans are somewhat younger (44 percent under age 35) and more likely to be male (56 percent). Nearly two-thirds (64 percent) of those with ACA-compliant plans report having individual coverage, while those with non-compliant plans are more evenly split between individual (47 percent) and family coverage (53 percent). (See Appendix Table 1 for more details.)
The health status of enrollees has particular significance because it has implications for whether premiums this year will be adequate to cover the health expenses of enrollees and how much insurers may increase premiums for next year. Since people are now guaranteed coverage regardless of their health, there has been an expectation that some people with pre-existing conditions who were previously denied access to insurance will enroll. However, there has been substantial uncertainty about whether healthier people will enroll as well, motivated by premium subsidies and the ACA’s requirement that people have coverage or pay a penalty.
While the majority of individuals in non-group plans report being in good health, the survey finds that those with ACA-compliant plans – which insurers rate as a single risk pool – are more likely than those with non-compliant plans to report their health as “only fair” or “poor” (17 percent versus 6 percent). This suggests that people in new, ACA-compliant plans are somewhat sicker than those in the non-group market previously, some of whom have been able to retain their non-compliant coverage under transition policies. What this might mean for premiums in the non-group market is still uncertain, however, since many insurers anticipated a sicker-than-average mix of enrollees when they set their premiums for this year.
Figure 4: Self-Reported Health Status Of Those In Non-Group Market
Percent who say in general, their health is…
Total in ACA-compliant plans
Exchange plans
Compliant planspurchased off-Exchange
Non-compliantplans
Excellent
22%
21%
28%
28%
Very good
29
27
37
37
Good
31
31
26
28
Fair
13
16
7
6
Poor
4
4
2
<1
Key Findings:
Section 2: How Do People In Different Groups Feel About Their Coverage?
The large majority of those with ACA-compliant plans purchased both inside and outside the Exchanges rate their coverage as excellent or good (72 percent of those with Exchange plans and 70 percent of those with non-Exchange plans). Those in non-compliant plans are even more likely to give high marks to their plans (85 percent), though this is offset by a larger share of those in compliant plans saying they don’t know how to rate their plans rather than a larger share giving their coverage poor marks, likely a reflection of the fact that most of those in compliant plans had only recently purchased coverage when the survey was conducted. Responses to this question are also similar to those given by people with employer-sponsored insurance in a separate national survey conducted in May.5 (See Appendix Table 2 for more details.)
Figure 5
More than half of those in compliant plans say their insurance is an excellent or good value for what they pay for it, though roughly four in ten rate the value as “only fair” or “poor,” similar to the shares among those with non-compliant plans. By comparison, those with employer-sponsored coverage interviewed in a separate national survey were more likely to rate their plan as an excellent or good value, likely reflecting the fact that for most of them, the employer pays a large portion of the premium.6
Figure 6
Majorities of those with ACA-compliant coverage report being satisfied with various aspects of their plans, including their choice of providers and plan costs such as premiums, deductibles, and copays. Satisfaction with choice of doctors and hospitals is higher than with plan costs, and among those in compliant plans, about a third report being unsatisfied with their premiums (33 percent) and deductibles (34 percent). While the large majority of those in compliant plans say they are satisfied with their choice of providers, about one in five say they are unsatisfied with their choice of specialists (20 percent), primary care doctors (19 percent), and hospitals (15 percent). Dissatisfaction with provider choice is somewhat higher among those in ACA-compliant plans than among those in non-compliant plans or among people with employer-sponsored coverage interviewed as part of a separate national survey (in the range of 5-7 percent for each of these measures, see Appendix Table 3 for more details).
Figure 7
More specifically when it comes to premiums, the survey finds that among those who previously bought non-group insurance and have switched to a new, ACA-compliant plan (referred to here as “plan switchers”), nearly half (46 percent) say their premium is lower under their current plan than it was under their previous plan, and about four in ten (39 percent) say it is higher.
Figure 8
Survey responses for plan switchers also indicate that their deductibles and level of coverage are, on average, similar to what they had in their previous plans. Roughly a third each of this group says their current deductible is higher, lower, and about the same as under their previous non-group plan. Similarly, when asked about the range of covered services and level of financial protection offered under their new plans, about four in ten plan switchers say these things are about the same, while roughly equal shares say they are better and worse.
Figure 9
Responses among plan switchers do offer some evidence of a trend toward plans with narrower networks. While over half say their choice of providers is “about the same” under their new plan as under their old plan, those reporting a change in the degree of choice are more likely to say they have less choice versus more choice when it comes to primary care doctors (32 percent versus 10 percent) and specialists (24 percent versus 11 percent).
Figure 10
Despite the fact that most plan switchers report paying similar premiums and getting similar coverage compared to their previous plans, this group stands out as being less satisfied with their plan costs and less likely to perceive their coverage as a good value compared to those in compliant plans who were previously uninsured. For example, 51 percent of plan switchers say the value of their coverage for what they pay for it is “only fair” or “poor”, compared with 32 percent of those who were previously uninsured. Similarly, plan switchers are twice as likely to say they are not satisfied with their premium compared with those who were previously uninsured (51 percent versus 25 percent). These differences may be related to the fact that about half of plan switchers report having received a cancellation notice from an insurer in the past year, compared with very small shares of those who were uninsured or had employer coverage before purchasing their current plan (see Appendix Tables 2 & 3 for more details).
Figure 11
What People Know And Don’t Know About Their Coverage
Health insurance is complicated, and many previous studies have documented gaps in health insurance literacy among consumers. The survey finds evidence of this among those who purchase their own coverage, with many respondents unable to answer some basic questions about their plans. For example, nearly one in five non-group enrollees (18 percent) say they don’t know the amount of their monthly premium and almost four in ten (37 percent) don’t know the amount of their annual deductible. Among those with ACA-compliant plans, three in ten (30 percent) say they don’t know the metal level of their plan (platinum, gold, silver or bronze)7, and among those who report getting a government subsidy to defray their premium cost, nearly half (47 percent) couldn’t say what the amount of the subsidy is.
Some groups are more knowledgeable than others, including college graduates, those with higher incomes, and small business owners. Plan switchers, who likely have more experience buying coverage in the non-group market, are also more likely than those who were previously uninsured to be able to report the metal level of their plan and their premium and deductible amounts.
In addition to knowledge gaps about their own plans, a third (33 percent) of those with non-group coverage are unaware that the ACA provides financial assistance to help low- and moderate-income Americans purchase coverage. Those in compliant plans purchased outside the Exchanges (53 percent) are the least likely to know that the ACA provides these subsidies, while awareness is somewhat higher among those in non-compliant plans (66 percent) and highest among those with Exchange coverage (76 percent).
Despite these gaps in knowledge, most people with non-group coverage feel they have a pretty good idea of what their plan covers (75 percent say they understand this “very” or “somewhat” well) and what they will have to pay out-of-pocket when they use services (83 percent). This is true even among those who were uninsured before purchasing their current plan (See Appendix Table 4).
Key Findings:
Section 3: Affordability And Financial Protection
Health insurance brings with it a measure of financial security. Among those with ACA-compliant coverage, more than half (56 percent) say they feel well-protected by their health plans, including 59 percent of those who were previously uninsured. Still, this leaves over a third saying they feel vulnerable to high medical bills, rising to 51 percent in the “plan switchers” group. Those with non-compliant plans are more likely to say they feel well-protected, with the difference between the compliant and non-compliant groups largely driven by the “plan switchers” (see Appendix Table 5 for more details). By comparison, people with employer-sponsored coverage interviewed as part of a separate national survey are also more likely than those in compliant plans to say they feel well-protected (again, not surprising due to the fact that employer plans tend to have lower patient cost-sharing than non-group coverage and employers generally cover a portion of the premium).
Figure 12
Feelings of vulnerability may stem more from worries about unexpected medical costs rather than concerns about paying for routine care. Nearly two-thirds (63 percent) of those with compliant plans say they feel confident about paying for “usual” medical costs, but a somewhat smaller share (52 percent) say they feel confident about paying for a serious illness. This leaves nearly half (46 percent) feeling “not too confident” or “not at all confident” that they would have enough money or insurance to pay for a major illness or injury. Those with non-compliant plans are more likely to feel confident about paying for both types of costs, perhaps related to the fact that they report their previous year’s income as higher than those with compliant plans. Health status may also play a role; enrollees in non-compliant plans are more likely to report they are in excellent or good health status compared to those in compliant plans. Looking at the non-group market as a whole (including those in compliant and non-compliant plans), those in fair or poor health are less likely to say they are confident about paying for routine care than their healthier counterparts (55 percent versus 71 percent). (See Appendix Table 6 for more details.)
Figure 13
Despite the fact that most people report being satisfied with their premiums, cost pressures remain. Overall, forty-three percent of those with ACA-compliant plans say it is “very” or “somewhat” difficult for them to afford to pay their premium each month.
Figure 14
The ACA’s premium tax credits were designed to help alleviate affordability concerns for people with low and moderate incomes. The survey finds that nearly half (46 percent) of Exchange enrollees say they are getting financial help from the government to help pay their monthly premium, which is substantially lower than official data (according to the Department of Health and Human Services, 85 percent of those selecting a plan in the Marketplace qualified for a premium tax credit).8 Multiple factors may be contributing to this apparent under-reporting on the survey, but it is likely that at least some individuals receiving government financial help may be unaware that the government is paying a portion of their premium. As noted in the section above on health literacy, insurance concepts are complicated and many people have trouble reporting detailed information about their plans. During the enrollment process, some people may have been focused on the bottom line question of “What do I pay?” and less focused on whether that amount was subsidized or not. Still, the vast majority (85 percent) of those who do report getting assistance – representing 39 percent of all Exchange enrollees – say they would not have been able to afford insurance without this financial help.
Most people with non-group insurance also express at least some level of worry about their future ability to afford and access care and insurance. For example, about six in ten (62 percent) say they are “very” or “somewhat” worried that their insurance company will raise their premium so much that they will no longer be able to afford insurance. Among those who report receiving government subsidies, over half (54 percent) say they are worried that their income will change and they will no longer be eligible for this financial help.
Figure 15
Key Findings:
Section 4: The Process Of Shopping For And Obtaining Coverage
Early problems with Healthcare.gov and many state Exchange websites were widely reported in the media, and the survey finds that about two-thirds of Exchange enrollees and nearly half (47 percent) of those with compliant coverage purchased outside the Exchanges spent at least some part of the shopping and enrollment process on the Internet. Other methods of shopping and enrollment were also common, however. Roughly half of Exchange enrollees and about four in ten non-Exchange purchasers report spending at least part of the process on the phone, while just over a quarter (27 percent) of those with Exchange plans and more than four in ten (43 percent) of those with non-Exchange plans say they spent time in person with someone helping them sign up for coverage. Internet enrollment required the biggest time investment for the largest share of people, with 18 percent of Exchange enrollees and 16 percent of non-Exchange purchasers saying they spent at least 5 hours shopping and enrolling on the web.
Figure 16
Overall, half of those in ACA-compliant plans say they got outside help with the enrollment process, while the other half say they completed the process on their own. The most common source of help for people with Exchange coverage was an Exchange representative (24 percent), while the most common source of help for those with coverage obtained outside the Exchanges was a health insurance broker or agent (24 percent).
Figure 17: Share In ACA-Compliant Plans Who Report Getting Help With Enrollment Process
Did someone help you enroll in health insurance or did you complete the enrollment process on your own? (If got help: Who was that person? Was it…)
Total in ACA-compliant plans
Exchange plans
Compliant plans purchased off-Exchange
Got help with enrollment process (NET)
50%
49%
52%
From an Exchange representative
18
24
4
From a health insurance broker or agent
13
8
24
From a family member or friend
8
7
16
From a community or county health worker
6
5
6
Completed the enrollment process on your own
49
51
48
Perhaps surprisingly given the extent to which Exchange website problems were reported in the media, most people in ACA-compliant plans purchased on and off the Exchanges say it was at least somewhat easy to compare costs and coverage when shopping for plans.9 Still, 35 percent of Exchange enrollees in states using Healthcare.gov and 30 percent of those in states with their own Exchange websites say it was at least somewhat difficult to set up an account with the marketplace, and roughly three in ten say it was difficult to figure out if their income qualified them for financial assistance.
Figure 18Figure 19
When it comes to choosing their current plan, those with compliant coverage report considering a variety of factors as important to their health plan choice, with costs rising to the top of the list. Among those who considered multiple plans, eight in ten (80 percent) say the monthly premium was a “very” or “extremely” important factor in choosing their current plan over other choices available, and seven in ten (72 percent) say the same about the plan’s copay and deductible. Somewhat fewer – though still sizeable shares – report placing a lot of importance on provider choice and covered benefits (63 percent each), while far fewer say recommendations from friends or family were an important factor (24 percent).
Figure 20
Key Findings:
Section 5: How Do Non-Group Enrollees Feel About The ACA?
Overall, those with non-group insurance coverage are more likely to have a favorable view of the ACA than the public at large. Views among non-group enrollees are roughly evenly split between favorable (47 percent) and unfavorable (43 percent), while among adults nationwide in the same age range, more have an unfavorable view of the law (46 percent) than a favorable one (38 percent).10
Figure 21
However, the average above masks some differences within the non-group market. Majorities have a favorable view of the ACA among those with Exchange plans (58 percent) and those who were previously uninsured (53 percent). On the other side, majorities of those in non-compliant plans and those who switched from a non-compliant to a compliant one (the “plan switchers”) express an unfavorable view of the law (52 percent and 53 percent, respectively).
Figure 22
As has been the case nationally since the passage of the ACA, partisanship plays a major role in people’s views of the ACA among those in the non-group market as well, with a large majority of Republicans (78 percent) expressing an unfavorable view of the law, a large majority of Democrats (69 percent) expressing a favorable view, and independents almost evenly split (44 percent favorable, 48 percent unfavorable).
Figure 23
On balance, those with ACA-compliant plans are about twice as likely to say the law has made it easier rather than harder for them to shop and compare health plans (41 percent easier, 19 percent harder) and to find affordable coverage (44 percent easier, 20 percent harder). Similarly, about twice as many say the law has increased (38 percent) rather than decreased (19 percent) the health plan choices available to them. In each of these areas, those with Exchange coverage and those who were uninsured prior to purchasing their current plan are more likely to say the law has made things easier, while those with non-Exchange coverage are more likely to say the law hasn’t made a difference and plan switchers are more mixed as to the law’s impact.
Figure 24Figure 25
When asked about the overall impact of the ACA on their own families, similar shares of non-group enrollees report that they’ve benefited (34 percent) and been negatively affected (29 percent) by the law. Among the 34 percent who report benefiting, the main ways in which they feel the law has helped them are lower costs and expanded access to care and insurance. The 29 percent who feel they’ve been negatively affected are most likely to cite increased costs, followed far behind by a range of concerns like opposition to the individual mandate, cuts to benefits or choices, and policy cancellations.
Figure 26Figure 27
Again, these averages mask some important differences within the non-group market. Those most likely to feel their families have benefited from the law include those with Exchange plans who report receiving government subsidies (60 percent), Exchange enrollees overall (54 percent), and the previously uninsured (50 percent). Those most likely to say the law has had a negative impact on their families include those who report experiencing a coverage cancellation in the past 12 months (57 percent), those who purchased ACA-compliant plans outside the Exchanges (48 percent), and the “plan switchers” who previously had other non-group coverage and are now in a compliant plan (47 percent).
Figure 28
Conclusion and Implications
The Affordable Care Act changes the non-group health insurance market substantially, requiring insurers to accept all applicants regardless of their health, standardizing coverage, creating new health insurance Exchanges to facilitate shopping for insurance, and providing income-based premium and cost-sharing subsidies. The Exchanges, along with expanded eligibility in Medicaid, are the primary mechanism for reducing the number of uninsured Americans under the ACA.
Currently, about two-thirds of non-group enrollees are in plans that meet all of the new rules (“ACA-compliant plans”), most of whom have purchased coverage through an Exchange. Three in ten remain in non-compliant plans, which includes those who were grandfathered under the ACA because they were purchased before the law went into effect, those who renewed policies last year or bought coverage that began before January 1, and those who have been able to keep their old policies for a period of time under a federal transition policy at the discretion of states. Over time, fewer people will remain in non-compliant plans as they lose or drop their coverage, and the only new plans available in the marketplace are those that comply with the ACA’s rules.
The new rules in the non-group market not only create new coverage opportunities for those who were previously uninsured, but they also mean changes for people who were buying their own coverage before the ACA took effect, in some cases creating disruption and in others better coverage at lower cost. The survey findings illustrate some of the real and perceived impacts of these changes on different groups.
For example, the survey finds that nearly six in ten of those now covered by Exchange plans were uninsured prior to signing up. The previously uninsured are one of the groups most likely to believe they have benefited from the ACA, and seven in ten of them say they would not have gotten coverage without the law. On the other side, people who were previously covered by non-group insurance and switched to an ACA-compliant plan (including those whose previous policies were cancelled because they didn’t meet the requirements of the health law and those who switched for other reasons) are one group that is more likely to feel they have been negatively affected by the law. However, in spite of reports last year about some people having plans cancelled and facing higher premiums, the survey finds that plan switchers are about as likely to report paying less for their new plan than their old one as to say they are paying more. This is likely due in part to the availability of tax credits for low- and moderate-income people who buy Marketplace coverage.
The survey also provides the first look at the health status of enrollees in ACA-compliant plans, which has implications for whether premiums this year will be adequate to cover the health expenses of enrollees and how much insurers may increase premiums for next year. While the majority of individuals in non-group plans report being in good health, those with ACA-compliant plans – which insurers rate as a single risk pool regardless of whether coverage was purchased on or off the Exchange – are more likely than those with non-compliant plans to report their health as “only fair” or “poor.” This suggests that people in new, ACA-compliant plans are somewhat sicker than those in the non-group market previously, some of whom have been able to retain their non-compliant coverage under transition policies. What this might mean for premiums in the non-group market is still uncertain, however, since many insurers anticipated a sicker-than-average mix of enrollees when they set their premiums for this year.
The survey’s findings about shopping and enrollment also have implications for future enrollment periods. While most of those who enrolled in coverage found it easy to compare plans, many spent significant time on the shopping process and half sought help with enrollment. This survey only looked at the experiences of those who successfully enrolled, and it’s likely that those who attempted to enroll but were unsuccessful encountered more problems with the process.
The non-group market will continue to undergo significant changes as people shift from non-compliant plans and more people enter the market in the years ahead. Though non-group enrollees represent a relatively modest share of the population, their experiences in the market have significant implications for whether the ACA is perceived as a success or not. This survey is the first in a series that the Foundation plans to conduct tracking the views and experiences of this important group.
Survey Methodology
The Kaiser Family Foundation (KFF) Survey of Non-Group Health Insurance Enrollees is the first in a series of surveys examining the views and experiences of people who purchase their own health insurance, either directly from an insurance company or through a state or federal Health Insurance Exchange created by the Affordable Care Act (ACA). The survey was designed and analyzed by researchers at KFF. Social Science Research Solutions (SSRS) collaborated with KFF researchers on sample design and weighting, and supervised the fieldwork.
The survey was conducted by telephone from April 3 through May 11, 2014 among a nationally representative random sample of 742 adults who purchase their own insurance. Computer-assisted telephone interviews conducted by landline (333) and cell phone (409, including 219 who had no landline telephone) were carried out in English and Spanish by SSRS. Respondents were considered eligible for the survey if they met the following criteria:
Between the ages of 18-64
Currently covered by health insurance that they purchase themselves
Not covered by health insurance through an employer, COBRA, Medicare, Medicaid, or the U.S. military or VA
If purchase insurance from a college or university, the insurance covers health services received both within and outside the university setting
If a small business owner, the health insurance they purchase is only for themselves and/or their family, and does not cover non-related employees of their business
If purchase from a trade association, respondent pays the entire premium themselves
Respondent was able to answer a question about whether insurance was purchased directly from an insurance company, from a state or federal health insurance marketplace, or through a health insurance agent or broker (Q35 in questionnaire)
Because the study targeted a low-incidence population, the sample was designed to increase efficiency in reaching this group, and consisted of three parts: (1) respondents reached through RDD landline and cell phone dialing to previously uncalled (“fresh”) sample (N=179); (2) respondents reached by re-contacting those who indicated in a previous RDD survey that they either purchased their own insurance or were uninsured (N=186); (3) respondents reached as part of the SSRS Omnibus survey (N=377), a weekly, nationally representative RDD landline and cell phone survey. All RDD landline and cell phone samples were generated by Marketing Systems Group. The “fresh” sample was designed to oversample areas with a lower-income population in order to complete more interviews with respondents who were uninsured prior to the ACA open enrollment period (since being uninsured is negatively correlated with income).
A multi-stage weighting process was applied to ensure an accurate representation of the national population of non-group enrollees ages 18-64. The first stage of weighting involved corrections for sample design, including accounting for the low-income oversample used in the “fresh” sample, the likelihood of non-response for the re-contact sample, number of eligible household members for those reached via landline, and a correction to account for the fact that respondents with both a landline and cell phone have a higher probability of selection. In the second weighting stage, demographic adjustments were applied to account for systematic non-response along known population parameters. No reliable administrative data were available for creating demographic weighting parameters for this group, since the most recent Census figures could not account for the changing demographics of non-group insurance enrollees brought about by the ACA this year. Therefore, demographic benchmarks were derived by compiling a sample of all respondents ages 18-64 interviewed on the SSRS Omnibus survey during the field period (N=4,312) and weighting this sample to match the national 18-64 year-old population based on the 2013 U.S. Census Current Population Survey March Supplement parameters for age, gender, education, race/ethnicity, region, population density, marital status, and phone use. This sample was then filtered to include respondents qualifying for the current survey, and the weighted demographics of this group were used as post-stratification weighting parameters for the “fresh” sample (including gender, age, education, race/ethnicity, marital status, income, and population density). A final adjustment was made to the full sample to adjust for previous insurance status (estimated based on the combined “fresh” and omnibus samples), to address the possibility that the criteria used in selecting the prescreened sample could affect the estimates for previous insurance status.
Weighting adjustments had a minor impact on the overall demographic distribution of the sample, with the biggest adjustments being made based on age (this is common in all telephone surveys, as younger respondents are the most difficult to reach and convince to participate). Weighted and unweighted demographics of the final sample are shown in the table below.
Unweighted % of total
Weighted % of total
Age
18-25
13%
20%
26-34
13
17
35-44
13
17
45-54
21
19
55-64
37
25
Refused
2
2
Gender
Male
47
50
Female
53
50
Education
Less than high school graduate
5
8
High school graduate
31
32
Some college
23
25
Graduated college
24
20
Graduate school or more
14
11
Technical school/other
3
3
Refused
1
1
Race/Ethnicity
White, non-Hispanic
69
63
Black, non-Hispanic
13
13
Hispanic
10
13
Other/Mixed
6
10
Refused
2
2
Self-reported health status
Excellent
24
24
Very good
33
31
Good
28
30
Fair
11
11
Poor
4
3
Don’t know/refused
*
1
Plan Type
Exchange plans
46
48
ACA-compliant, non-Exchange plans
17
16
Compliant, unknown if Exchange
3
3
Non-compliant plans
33
31
Unknown if compliant
1
1
All statistical tests of significance account for the effect of weighting. The sample size and margin of sampling error (MOSE) for key subgroups are shown in the table below.
Three percent of non-group enrollees overall are in ACA-compliant plans that were purchased through a broker but were unsure if their plan was purchased through an Exchange or not. These respondents are not included in either the “Exchange” or “Compliant, non-Exchange” groups. ↩︎
Nine percent of non-group enrollees overall are in ACA-compliant plans and either say they were covered by some other type of insurance (including Medicaid) before purchasing their current plan or did not answer the question about previous insurance status. These respondents are not included in any of the breakout groups of ACA-compliant plans by prior insurance status. ↩︎
Among those in Marketplace plans who report a metal level, the distribution of self-reported responses in the survey looks somewhat different from administrative data released by the Department of Health and Human Services (http://aspe.hhs.gov/health/reports/2014/MarketPlaceEnrollment/Apr2014/ib_2014Apr_enrollment.pdf). Silver is the most common metal tier in both data sources, but the survey finds a somewhat lower share reporting Silver plans (48 percent versus 65 percent) and a somewhat higher share reporting Bronze plans (30 percent versus 20 percent) compared with HHS. Differences between self-reported data from surveys and administrative data are not uncommon, particularly when it comes to a complicated topic like details about one’s health insurance plan. ↩︎
Since this is a survey of people who are enrolled in health plans, it only includes those who successfully completed the enrollment process and may not fully represent the ease or difficulty of the process for all those who tried to enroll. ↩︎
As the 15th anniversary of the Supreme Court’s Olmstead decision approaches this month, a new brief from the Kaiser Family Foundation examines the legacy of the landmark civil rights ruling that the institutionalization of people with disabilities is illegal discrimination under the Americans with Disabilities Act. The brief, Olmstead’s Role In Community Integration for People with Disabilities Under Medicaid: 15 Years After the Supreme Court’s Olmstead Decision, revisits the historic case and examines legal developments and policy trends that have emerged in recent years. The paper focuses on the role of the Court and the legal system in ensuring community integration of long-term care services through the Olmstead decision. The brief highlights Medicaid’s role as a vehicle in financing long-term care and furthering the delivery of such services in community settings. It includes brief profiles of people who have benefited from long-term care services under Medicaid and identifies ongoing challenges to achieving full community integration for people with disabilities.
.png?t=1412884944994)