What is at Stake for Health and Health Care Disparities under ACA Repeal?

Authors: Samantha Artiga, Petry Ubri, and Julia Foutz
Published: Mar 20, 2017

Issue Brief

Key Takeaways

Health and health care disparities, which are differences between groups in their health status and their ability to obtain care, remain a persistent issue in the United States. This brief describes health and health care disparities today, highlights recent advancements in reducing disparities under the Affordable Care Act (ACA), and discusses how the American Health Care Act (AHCA) and proposed reductions in discretionary funding may affect ongoing efforts to address disparities.

  • There have been recent advancements in reducing disparities that reflect provisions under the ACA. People of color and low-income individuals face significant disparities in access to and use of care as well as health outcomes. ACA investments through discretionary programs to strengthen public health and prevention and the health care workforce and delivery system supported reduction of disparities. In addition, the Medicaid and Marketplace coverage expansions led to large gains in health insurance for low-income individuals and people of color, narrowing longstanding disparities in coverage.
  • The proposed changes to Medicaid under AHCA would disproportionately affect low-income individuals and people of color for whom the program is a central source of coverage. Medicaid covers over half of all poor families, one in five adults of color, and over half of children of color. The changes proposed in AHCA, including the cap on federal Medicaid financing and elimination of enhanced federal funding for the Medicaid expansion, would likely lead to large coverage losses among these groups as would the proposed changes to tax credits for private coverage.
  • Other reductions in discretionary health spending may also reduce availability of services, limit progress expanding the health care workforce, and constrain continued research to understand and address disparities. Specifically, AHCA would eliminate funding for the Prevention and Public Health Fund, and the President’s 2018 budget proposes a 17.9% cut to discretionary funding for the Department of Health and Human Services (HHS).

Introduction

Many groups, including low-income individuals and people of color, face disparities in their ability to obtain needed care and in their health outcomes. There have been recent advancements in reducing disparities under the Affordable Care Act (ACA). The American Health Care Act (AHCA) proposal to repeal and replace the ACA and cuts to discretionary spending, as proposed in the President’s 2018 budget, could erode recent progress and negatively affect disparities. This brief describes health and health care disparities today, highlights recent advancements in reducing disparities under the ACA, and discusses how changes proposed in the AHCA and cuts to discretionary funding could affect ongoing efforts address disparities.

Health and Health Care Disparities Today

Health and health care disparities are differences between groups in their health status and ability obtain medical care that are rooted in historic economic, social, and racial disadvantages. Although disparities have been documented for decades and there have been overall improvements in our nation’s health, many disparities have persisted and, in some cases, widened over time.1  Addressing disparities is not only important from a social justice standpoint, but also for improving our nation’s health and reducing unnecessary costs.2  With projections estimating that people of color will make up more than half of the population by 2044, it is increasingly important to address disparities.3 

Today, many groups face significant disparities in their ability to access and use needed health care as well as in their health status and outcomes. There remain large disparities by race and ethnicity.4  For example, compared to Whites, Hispanics fare worse across measures of health access and use (Figure 1) and Blacks fare worse across a range of health measures (Figure 2).5  Disparities also exist by income, with lower income people facing greater barriers to obtaining care and reporting worse health status than those with higher incomes.6  Although disparities are often viewed through the frames of race and income, they also occur across other dimensions. For example, research shows increased barriers for LGBT individuals, people with limited English proficiency, and individuals living in rural and inner city areas.7  Moreover, these groups are not mutually exclusive and there often are disparities among subgroups of populations. 

Figure 1: Access to and Use of Care among Nonelderly Hispanic and White Adults, 2015
Figure 2: Health Status and Selected Health Conditions among Nonelderly Black and White Adults, 2015

Recent Advancements in Reducing Disparities

In recent years, there have been advancements in reducing disparities that reflect an increased federal focus on disparities and provisions to expand coverage and access under the ACA.

Health Coverage Expansions

The ACA’s broad health insurance coverage expansions through Medicaid and the Marketplaces have played a central role in reducing health care disparities. Since implementation of these expansions in 2014, there have been large gains in coverage for low-income individuals and people of color, which helped narrow disparities in coverage (Figure 3).8  The Medicaid expansion played a particularly important role in these coverage gains.

Figure 3: Uninsured Rate among Nonelderly Individuals by Race/Ethnicity, 2013-2015

Coverage gains among low-income individuals and by racial and ethnic group varied across states (Appendix Table 1). Figure 4 shows the states with the three largest percentage point reductions in their uninsured rate among the low-income population (below 200% of the federal poverty level, FPL) and among Hispanics, Blacks, and Whites. It shows that reductions in these states were often at least twice as large as the nationwide reduction for these groups. These states include a mix of those that have implemented the Medicaid expansion and those that have not as well as a mix of states led by both Republican and Democratic governors.

Figure 4: Percentage Point Reduction in Uninsured Rate among the Nonelderly Population, 2013-2015

These coverage gains are expected to reduce disparities in access to and use of health care as well as health outcomes over the long-term. Research shows that health insurance makes a key difference in whether and when people get medical care, where they get their care, and ultimately how healthy they are.9  There also has been growing recognition that, although health insurance is key to health, social and environmental factors also influence health. An increasing number of initiatives within the health care system have emerged to address broader social determinants of health.10  Further, there has been increased recognition of the need to increase diversity within the health care workforce, enhance providers’ ability to deliver culturally and linguistically appropriate care, and increase provider access in rural and underserved areas.11 

Enhanced Federal Focus and Investments in Public Health and Prevention

There has been an elevated focus on addressing health and health care disparities in recent years. In 2011, the Department of Health and Human Services (HHS) developed its first action plan to eliminate racial and ethnic disparities.12  The plan builds on organizational changes made within HHS under the ACA to prioritize and better coordinate efforts to reduce disparities. The ACA also strengthened data collection and research efforts to allow for improved measurement and monitoring of disparities and provided new protections from discrimination in health care.

The ACA included initiatives and investments through discretionary programs to strengthen public health and prevention, the health care workforce, and the delivery system that supported reduction of disparities. The ACA appropriated $11 billion over a five-year period (2011-2015) to support and enhance capacity of community health centers.13  Community health centers are a key source of care for low-income individuals and people of color.14  The ACA also contains provisions to increase the number of providers, particularly in underserved areas.15  Further, the ACA provided funding for and expanded initiatives to strengthen the public health workforce and infrastructure and prevention services, including the new Prevention and Public Health Fund.16 

Remaining Challenges

Despite nationwide gains in health insurance, differing state decisions to implement the ACA Medicaid expansion to low-income adults have widened disparities in coverage. In states that expanded, parents and childless adults with incomes up to 138% FPL, which is about $28,200 for a family of three, are eligible for Medicaid. In contrast, among the 19 states that have not expanded, 10 of which are in the South, the median Medicaid eligibility limit for parents is 44% FPL, or less than $9,000 per year for a family of three, and other adults generally are not eligible. As a result of these differences, overall, Medicaid expansion states have realized larger gains in coverage and access to care than states that have not expanded.17  In particular, there are widening gaps between the South, which is home to many people of color and has high rates of chronic disease and poor health, and the rest of the nation.18 

Further, although disparities in coverage have narrowed, low-income people and people of color still are more likely to be uninsured than those with higher incomes and Whites.19  Hispanics and American Indians and Alaska Natives (AI/ANs) have the highest uninsured rates among racial and ethnic groups, and these disparities persist among children.20  In 2015, Hispanic children were nearly twice as likely as White children to be uninsured (7% vs. 4%), and AI/AN children were nearly five times as likely as White children to be uninsured (19% vs. 4%).21 

Impact of ACA Repeal and Funding Reductions on Disparities

There is much at stake for health and health care disparities as Congress considers future funding decisions and broader health care reforms. The AHCA proposal to repeal and replace the ACA, as approved by the House Ways and Means and Energy and Commerce Committees and the House Budget Committee, would cap federal Medicaid financing, eliminate enhanced federal funding for the Medicaid expansion, make changes to premium tax credits for private health insurance, and eliminate funding for the Prevention and Public Health Fund. In addition, the President’s 2018 budget proposes a 17.9% reduction in discretionary funding for HHS.

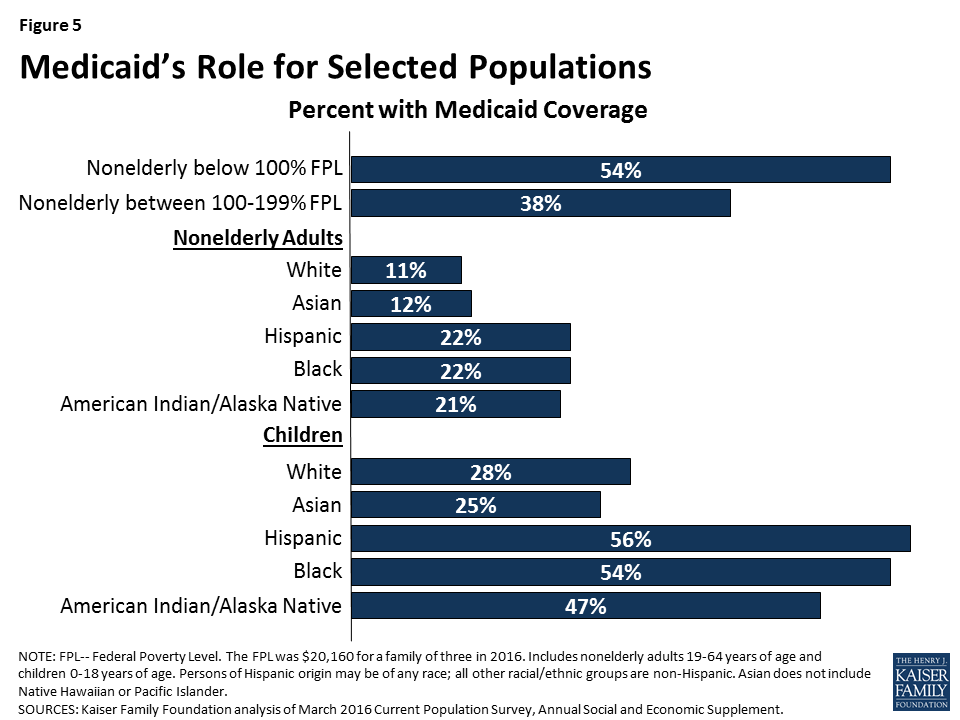
Changes to Medicaid under AHCA would disproportionately affect low-income individuals and people of color for whom the program is a central source of coverage. Medicaid provides coverage to over half (54%) of families with income below poverty and nearly four in ten (38%) of near-poor families, with incomes between 100% and 199% FPL (Figure 5). Moreover, it covers more than one in five nonelderly Hispanic, Black, and AI/AN adults. It plays an even larger role for children of color, covering nearly six in ten Hispanic (56%) and Black (54%) children and nearly half of AI/AN children (47%).

Figure 5: Medicaid’s Role for Selected Populations

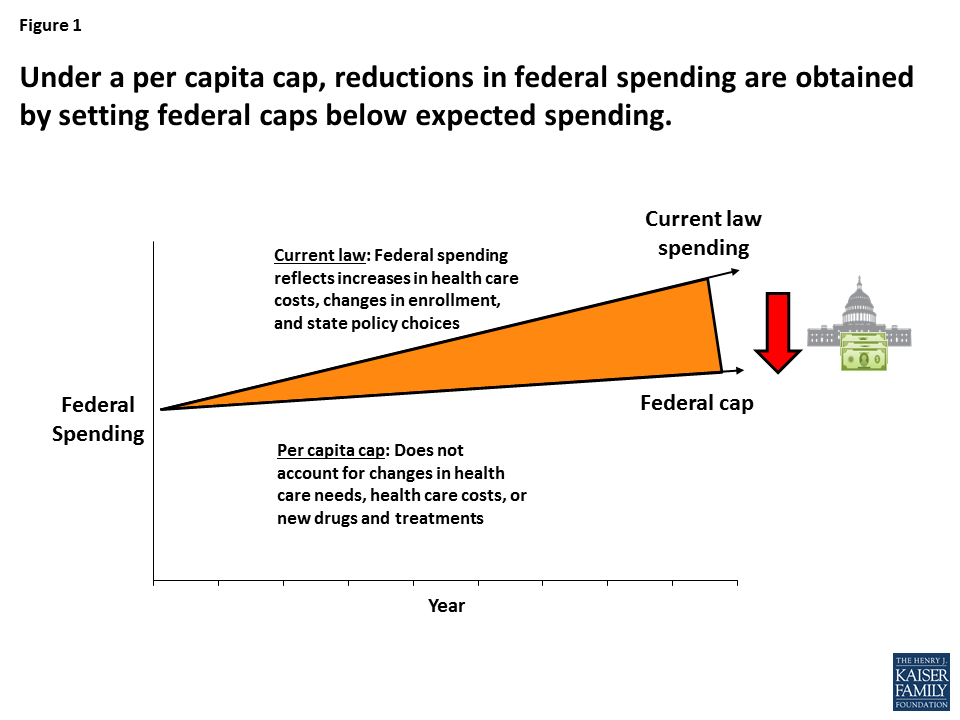
Capping federal Medicaid financing would fundamentally restructure the federal commitment to states to support care for individuals with the greatest health needs and lowest incomes. The cap would limit growth to a pre-set amount that is lower than projected growth in Medicaid spending.22  With more limited federal funds, states would need to increase spending or make program cutbacks such as reductions in eligibility, benefits, or provider payments that would lead to coverage losses and increased barriers to care for current enrollees. Capped financing also would lock in historic differences across states in benefits and spending and would not be responsive to changing health care costs, for example from new drug treatments or medical advancements, or new public health emergencies, such as the opioid epidemic.

Elimination of enhanced federal funding for the Medicaid expansion would likely result in large coverage losses among low-income people and people of color. As noted, low-income individuals and people of color experienced large coverage gains under the ACA coverage expansions, and the Medicaid expansion played a particularly large role in these gains. If the enhanced federal match rate for the expansion is eliminated, as proposed by AHCA, states would face substantial increased costs to maintain this coverage. It is projected that some of the 32 states that have already expanded their programs would eliminate this coverage and that no additional states would expand in the future.23  Eight of the expansion states (AR, AZ, IL, IN, MI, NH, NM, and WA) have legislation requiring them to eliminate the expansion if the federal match rate is reduced. As a result of these changes, many adults currently enrolled in expansion coverage would likely become uninsured, leading to growing uninsured rates among low-income individuals and people of color that would reverse the recent narrowing of coverage disparities that occurred under the ACA.

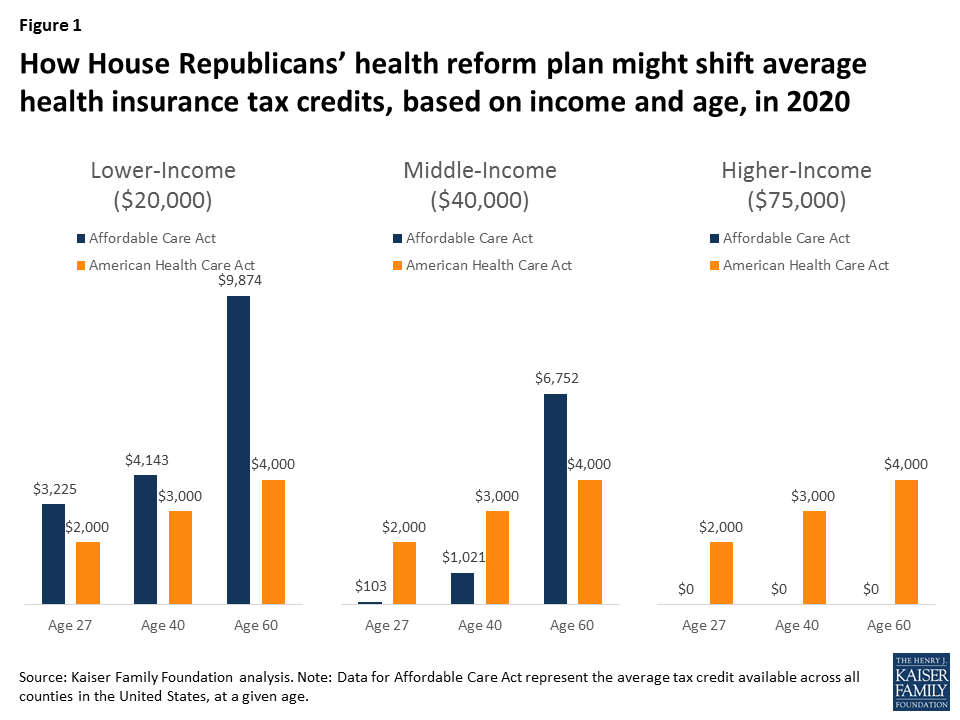
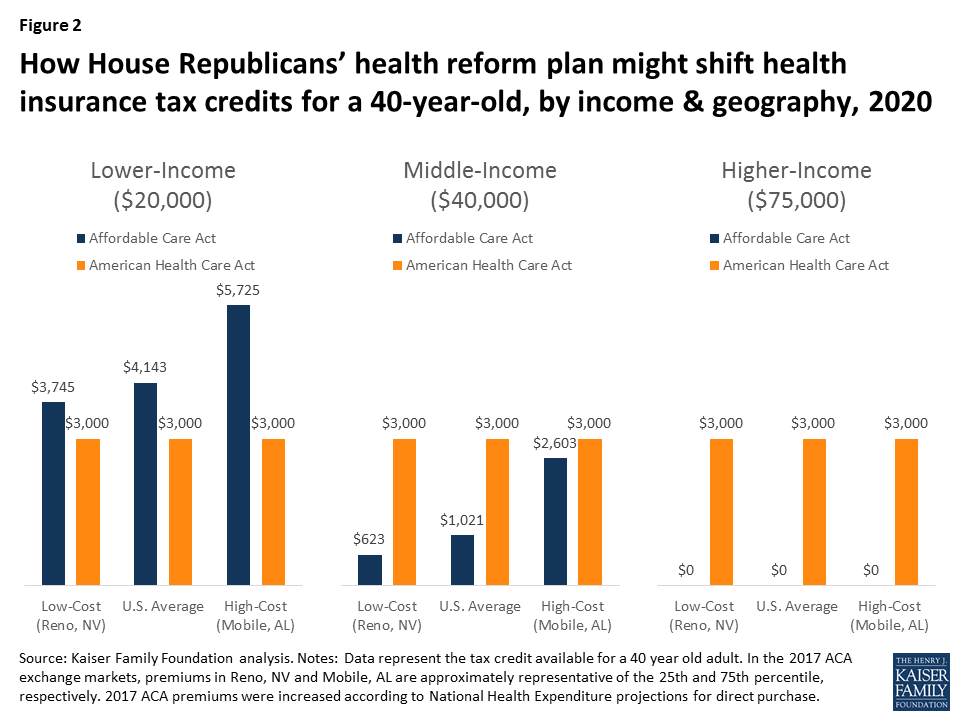
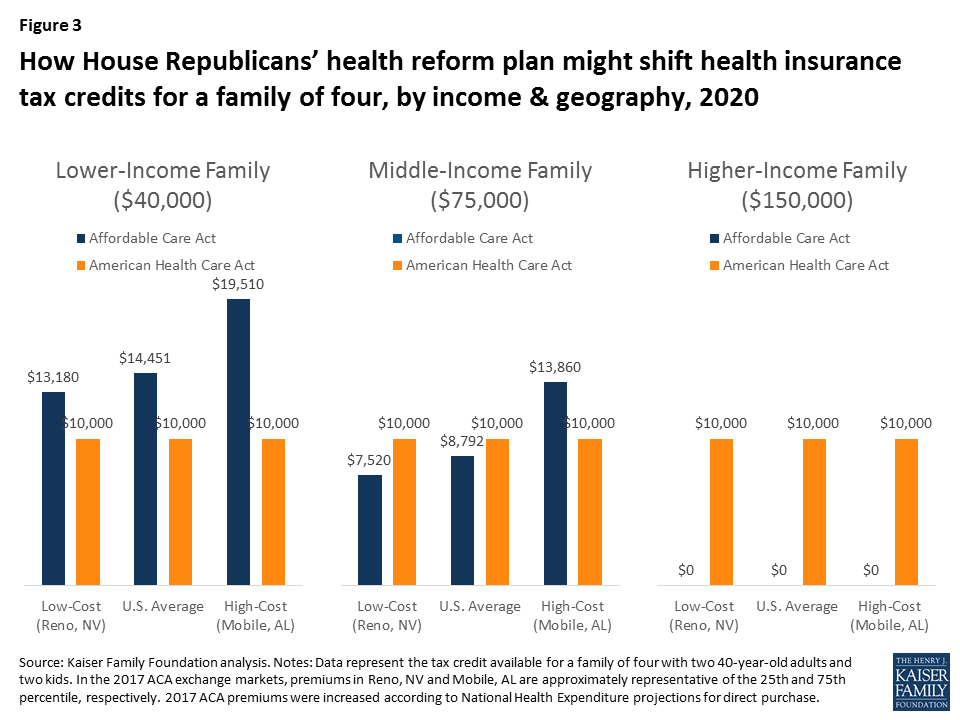
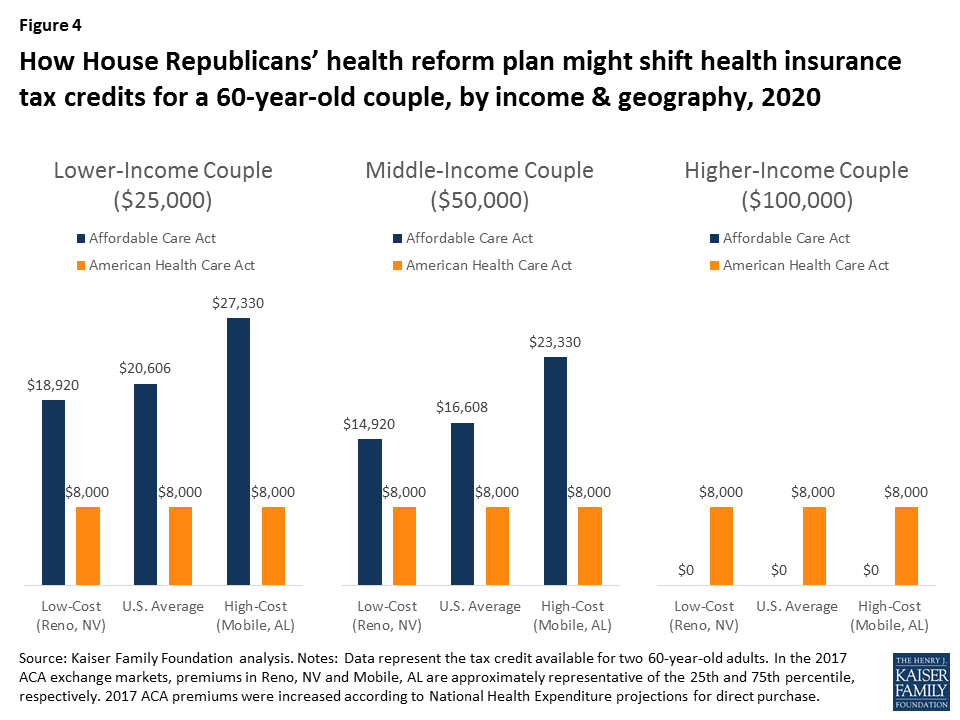
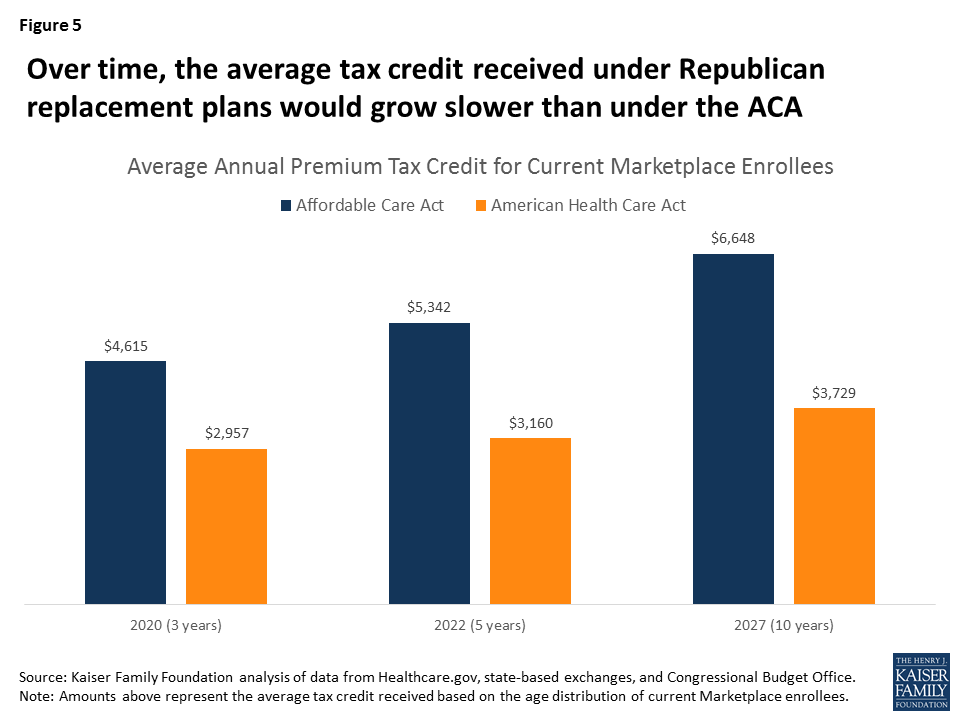
Changes in subsidies for private health coverage would also likely lead to coverage losses among low-income individuals and people of color. AHCA also would replace the ACA income-based premium tax credits for Marketplace coverage with flat premium tax credits based on age. Additionally, AHCA would eliminate the cost-sharing subsidies that lower deductibles and other out-of-pocket costs for lower-income individuals. These changes would reduce the levels of financial assistance to lower-income households, which would disproportionately affect people of color, since they are more likely to have lower family incomes compared to Whites. Without as much financial assistance, many low-income individuals and people of color will be unable to afford coverage and will become uninsured.

Elimination of funding for the Prevention and Public Health fund would reduce state capacity to provide these services at a time when there may be increased need due to coverage losses. Reductions in health insurance would increase strains on other parts of the health care system, including community health centers and public health programs. However, AHCA also would eliminate funding for the Prevention and Public Health Fund at the end of Fiscal Year 2018, and rescind any remaining unobligated funds.24  This fund supports public health and prevention services through immunization programs and grants to states to expand state and local capacity to provide prevention and public health services. It also provides targeted funding to states to strengthen their ability to respond to infectious disease and other public health threats, prevent childhood lead poisoning, and prevent healthcare-associated infections. In FY2016, over $625 million in grant funding was provided to states through the fund by the Centers for Disease Control and Prevention.25  A number of governors have pointed to the importance of this funding for supporting public health and prevention activities and cautioned against eliminating this funding under repeal.26 

Other reductions in discretionary health spending may also reduce availability of services, limit progress expanding the health care workforce, and constrain continued research efforts to understand and address disparities. The President’s 2018 budget proposes a 17.9% reduction in funding for HHS. This reduction includes a 19% cut in the budget for the National Institutes of Health, which is central to research efforts to better understand disparities and develop effective interventions to eliminate them, as well as specified reductions in nurse training programs. The budget also proposes a new block grant program to states to address public health outbreaks, without a specified amount, and increased funding to address opioid misuse, but it is unclear to what extent these programs would offset decreases in services to meet the overall 17.9% funding reduction.

Looking Ahead

Maintaining gains in health insurance and support for public health and prevention, the health care workforce, and the delivery system are key for maintaining progress achieved to date and ongoing efforts to reduce disparities.Changes being considered to health insurance through repeal of the ACA and restructuring of Medicaid, including capping federal financing and eliminating enhanced federal funding for the Medicaid expansion, could negatively affect disparities. People of color and low-income individuals would be disproportionately impacted by these changes since they had large coverage gains under the ACA and Medicaid is a central source of coverage for them. Reductions in health insurance and funding also would increase strains on other parts of the health care system, including community health centers and public health programs, which already face funding constraints and uncertainty regarding their future funding. Amid potential changes to health insurance, support for public health and prevention services and a health care workforce and delivery system that meets the needs of our increasingly diverse population is particularly important.

Appendix

Appendix Table 1: Uninsured Rates among the Nonelderly, 2013 and 2015
Below 200% FPLWhiteBlackHispanic
20132015Percentage PointDifference20132015Percentage PointDifference20132015Percentage PointDifference20132015Percentage PointDifference
United States25%17%-8%12%8%-4%17%12%-5%26%17%-9%
Implemented Medicaid Expansion-Democratic/Independent Governor
California25%14%-12%12%6%-6%12%8%-4%23%12%-11%
Colorado25%17%-7%11%8%-3%22%13%-9%21%14%-8%
Connecticut22%13%-10%9%5%-3%13%N/AN/A26%11%-15%
Delaware14%11%-3%7%6%-1%8%8%1%20%15%-5%
District of Columbia12%7%-4%6%3%-3%10%6%-5%15%8%-6%
Hawaii9%10%0%11%N/AN/AN/AN/AN/AN/AN/AN/A
Louisiana25%18%-6%13%11%-2%20%14%-7%29%18%-12%
Minnesota15%17%2%6%4%-2%15%N/AN/A19%20%1%
Montana28%18%-10%18%11%-7%N/AN/AN/AN/A19%N/A
New York16%12%-5%8%6%-2%14%9%-6%15%10%-4%
Oregon21%11%-10%13%7%-6%N/AN/AN/A27%14%-13%
Pennsylvania23%13%-9%10%6%-4%17%13%-4%17%9%-9%
Rhode Island19%8%-11%9%4%-5%19%N/AN/A17%12%-5%
Washington26%12%-15%10%7%-3%19%N/AN/A27%16%-11%
West Virginia23%11%-13%14%8%-6%16%N/AN/AN/AN/AN/A
Alaska25%27%2%13%10%-3%N/AN/AN/A15%N/AN/A
Implemented Medicaid Expansion-Republican Governor
Arizona29%22%-6%15%10%-5%16%N/AN/A30%17%-13%
Arkansas24%16%-8%16%8%-8%20%9%-11%27%31%4%
Illinois20%11%-9%9%6%-3%17%9%-8%20%11%-9%
Indiana24%19%-5%12%9%-3%20%15%-5%34%22%-13%
Iowa18%13%-5%8%6%-3%N/AN/AN/A18%13%-5%
Kentucky26%10%-17%15%7%-8%11%N/AN/A47%N/AN/A
Maryland22%13%-9%10%5%-5%12%8%-4%32%15%-17%
Massachusetts5%6%1%3%5%2%N/A6%N/A5%4%-2%
Michigan21%10%-11%11%6%-5%19%7%-12%15%16%1%
Nevada35%18%-17%16%9%-7%24%N/AN/A34%19%-15%
New Hampshire27%10%-18%13%6%-7%N/AN/AN/A28%N/AN/A
New Jersey26%17%-10%9%7%-3%16%8%-8%22%18%-3%
New Mexico29%19%-10%14%8%-5%N/AN/AN/A22%15%-7%
North Dakota25%16%-9%10%7%-3%N/AN/AN/A17%N/AN/A
Ohio24%13%-10%13%6%-6%17%8%-9%21%18%-4%
Vermont15%10%-5%9%6%-3%N/AN/AN/AN/AN/AN/A
Has Not Implemented Medicaid Expansion-Democratic Governor
North Carolina29%21%-7%14%10%-4%16%14%-2%38%30%-8%
Virginia27%22%-4%11%8%-3%14%14%1%25%21%-4%
Has Not Implemented Medicaid Expansion-Republican Governor
Alabama27%18%-9%17%11%-6%17%14%-3%29%28%-1%
Florida33%23%-10%18%13%-5%24%16%-8%29%19%-9%
Georgia31%25%-6%14%12%-2%19%16%-2%44%30%-14%
Idaho28%21%-7%15%11%-4%N/AN/AN/A23%23%0%
Kansas23%19%-4%9%9%0%11%20%10%29%21%-8%
Maine16%8%-8%11%6%-5%N/A0%N/AN/AN/AN/A
Mississippi24%21%-2%12%14%2%19%13%-6%58%30%-28%
Missouri24%21%-3%12%8%-4%14%16%2%20%28%7%
Nebraska19%19%1%8%8%-1%N/AN/AN/A18%18%0%
Oklahoma26%21%-4%15%10%-5%14%23%9%24%27%3%
South Carolina32%19%-13%15%13%-2%22%11%-12%43%24%-19%
South Dakota20%19%-1%9%8%-2%14%N/AN/A22%N/AN/A
Tennessee24%19%-5%12%11%-1%18%12%-6%41%30%-11%
Texas35%29%-6%14%12%-2%20%17%-3%32%25%-7%
Utah24%20%-4%11%9%-2%N/AN/AN/A25%21%-4%
Wisconsin17%15%-1%9%7%-2%17%N/AN/A19%16%-2%
Wyoming29%18%-11%16%10%-6%N/AN/AN/A34%13%-21%
SOURCES: Kaiser Family Foundation estimates based on the Census Bureau’s March 2014 and March 2016 Current Population Surveys (CPS: Annual Social and Economic Supplements).NOTES: Persons of Hispanic origin may be of any race; all other racial/ethnic groups are non-Hispanic. N/A: Estimates with relative standard errors greater than 30% are not provided.

Endnotes

  1. Agency for Healthcare Research and Quality, 2015 National Healthcare Quality and Disparities Report and 5th Anniversary Update on the National Quality Strategy, (Rockville, MD: Agency for Healthcare Research and Quality, May 2015), https://www.ahrq.gov/sites/default/files/wysiwyg/research/findings/nhqrdr/nhqdr15/2015nhqdr.pdf. ↩︎
  2. Thomas LaVeist, Darrell Gaskin, and Patrick Richard, The Economic Burden of Health Inequalities in the United States, (Washington, DC: Joint Center for Political and Economic Studies, September 2009), http://www.hhnmag.com/ext/resources/inc-hhn/pdfs/resources/Burden_Of_Health_FINAL_0.pdf. ↩︎
  3. Sandra L. Colby and Jennifer M. Ortman, Projections of the Size and Composition of the U.S. Population: 2014 to 2060, (Washington, D.C., U.S. Census Bureau, March 2015), https://www.census.gov/content/dam/Census/library/publications/2015/demo/p25-1143.pdf. ↩︎
  4. Agency for Healthcare Research and Quality, 2015 National Healthcare Quality and Disparities Report and 5th Anniversary Update on the National Quality Strategy, op cit. and Samantha Artiga et. al., Key Facts on Health and Health Care by Race and Ethnicity, (Washington, DC: Kaiser Family Foundation, June 2016), http://files.kff.org/attachment/Chartpack-Key-Facts-on-Health-and-Health-Care-by-Race-and-Ethnicity. ↩︎
  5. Samantha Artiga et. al., Key Facts on Health and Health Care by Race and Ethnicity, op cit. ↩︎
  6. Agency for Healthcare Research and Quality, 2015 National Healthcare Quality and Disparities Report and 5th Anniversary Update on the National Quality Strategy, op cit. ↩︎
  7. Kaiser Family Foundation, Health and Access to Care and Coverage for Lesbian, Gay, Bisexual, and Transgender Individuals in the U.S., (Washington, DC: Kaiser Family Foundation, June 2016), https://modern.kff.org/disparities-policy/issue-brief/health-and-access-to-care-and-coverage-for-lesbian-gay-bisexual-and-transgender-individuals-in-the-u-s/; Kaiser Commission on Medicaid and the Uninsured, Overview of Health Coverage for Individuals with Limited English Proficiency, (Washington, DC: Kaiser Commission on Medicaid and the Uninsured, August 2012), http://modern.kff.org/uninsured/8343.cfm; and Agency for Healthcare Research and Quality, 2013 National Healthcare Disparities Report, (Rockville, MD: Agency for Healthcare Research and Quality, May 2014), https://www.ahrq.gov/sites/default/files/publications/files/2013nhdr.pdf. ↩︎
  8. Samantha Artiga, et. al., Health Coverage by Race and Ethnicity: Examining Changes Under the ACA and the Remaining Uninsured, (Washington, DC: Kaiser Family Foundation, November 2016), https://modern.kff.org/disparities-policy/issue-brief/health-coverage-by-race-and-ethnicity-examining-changes-under-the-aca-and-the-remaining-uninsured/ and Rachel Garfield, et. al., The Uninsured: A Primer – Key Facts about Health Insurance and the Uninsured in the Wake of National Health Reform, (Washington, Kaiser Commission on Medicaid and the Uninsured, November 2016), https://modern.kff.org/uninsured/report/the-uninsured-a-primer-key-facts-about-health-insurance-and-the-uninsured-in-the-wake-of-national-health-reform/. ↩︎
  9. Kaiser Commission on Medicaid and the Uninsured, Key Facts About the Uninsured Population, (Washington, DC: Kaiser Family Foundation, September 2016), https://modern.kff.org/uninsured/fact-sheet/key-facts-about-the-uninsured-population/. ↩︎
  10. Harry J Heiman and Samantha Artiga, Beyond Health Care: The Role of Social Determinants in Promoting Health and Health Equity, op cit. ↩︎
  11. Office of Minority Health, National Standards for Culturally and Linguistically Appropriate Services in Health and Health Care: A Blueprint for Advancing and Sustaining CLAS Policy and Practice, (Washington, DC: U.S. Department of Health and Human Services, April 2013), https://www.thinkculturalhealth.hhs.gov/pdfs/EnhancedCLASStandardsBlueprint.pdf and The Commonwealth Fund, State and Federal Efforts to Enhance Access to Basic Health Care, (New York, NY: The Commonwealth Fund, March 2010), http://www.commonwealthfund.org/publications/newsletters/states-in-action/2010/mar/march-april-2010/feature/feature. ↩︎
  12. Department of Health and Human Services, HHS Action Plan to Reduce Racial and Ethnic Health Disparities, op cit. ↩︎
  13. Kaiser Family Foundation, Summary of the Affordable Care Act, (Washington, DC: Kaiser Family Foundation, April 2013), https://modern.kff.org/health-reform/fact-sheet/summary-of-the-affordable-care-act/. ↩︎
  14. Julia Paradise, et. al., Community Health Centers: Recent Growth and the Role of the ACA, (Washington, DC: Kaiser Family Foundation, January 2017), https://modern.kff.org/report-section/community-health-centers-recent-growth-and-the-role-of-the-aca-issue-brief/. ↩︎
  15. Kaiser Family Foundation, Summary of the Affordable Care Act, (Washington, DC: Kaiser Family Foundation, April 2013), https://modern.kff.org/health-reform/fact-sheet/summary-of-the-affordable-care-act/. ↩︎
  16. Ibid. ↩︎
  17. Larisa Antonisse, et. al., The Effects of Medicaid Expansion under the ACA: Updated Findings from a Literature Review, (Washington, DC: Kaiser Family Foundation, February 2017), https://modern.kff.org/medicaid/issue-brief/the-effects-of-medicaid-expansion-under-the-aca-updated-findings-from-a-literature-review/. ↩︎
  18. Samantha Artiga and Anthony Damico, Health and Health Coverage in the South: A Data Update, (Washington, DC: Kaiser Commission on Medicaid and the Uninsured, February 2016), https://modern.kff.org/disparities-policy/issue-brief/health-and-health-coverage-in-the-south-a-data-update/. ↩︎
  19. Michael E Martinez, Emily P Zammitti, and Roben A Cohen, Health Insurance Coverage: Early Release of Estimates from the National Health Interview Survey, January-September 2016, (Hyattsville, MD: National Center for Health Statistics, February 2017), https://www.cdc.gov/nchs/data/nhis/earlyrelease/insur201702.pdf. ↩︎
  20. Samantha Artiga, et. al., Health Coverage by Race and Ethnicity: Examining Changes Under the ACA and the Remaining Uninsured, op cit. ↩︎
  21. Ibid. ↩︎
  22. Congressional Budget Office (CBO), American Health Care Act: Budget Reconciliation Recommendations of the house Committees on Ways and Means and Energy and Commerce, March 9, 2017, (Washington, DC: CBO, March 2017), https://www.cbo.gov/sites/default/files/115th-congress-2017-2018/costestimate/americanhealthcareact.pdf. ↩︎
  23. Ibid. ↩︎
  24. Kaiser Family Foundation, Summary of the American Health Care Act, (Washington, DC: Kaiser Family Foundation, March 2017), http://files.kff.org/attachment/Proposals-to-Replace-the-Affordable-Care-Act-Summary-of-the-American-Health-Care-Act. ↩︎
  25. Centers for Disease Control and Prevention (CDC), Accomplishing CDC’s Mission with Investments from the Prevention & Public Health Fund, FY 2010- FY 2016, (Atlanta, GA: CDC, n.d.), https://www.cdc.gov/funding/documents/cdc-pphf-funding-impact.pdf. ↩︎
  26. Samantha Artiga, et. al., Views of Governors and Insurance Commissioners on ACA Repeal and Changes to Medicaid: Responses to a Congressional Request for State Input on Health Reform, (Washington, DC: Kaiser Family Foundation, March 2017), https://modern.kff.org/medicaid/issue-brief/views-of-governors-and-insurance-commissioners-on-aca-repeal-and-changes-to-medicaid-responses-to-a-congressional-request-for-state-input-on-health-reform/. ↩︎
News Release

11 Million People on Medicare Are Also Covered by Medicaid. What Could Switching to a Medicaid Per Capita Cap Mean for Them?

Published: Mar 20, 2017

A major structural change to Medicaid financing such as the per capita cap system called for under the American Health Care Act could have significant implications for the 11 million seniors and people with disabilities who are covered by both Medicare and Medicaid, according to a new brief by the Kaiser Family Foundation.

One in five Medicare beneficiaries relies on Medicaid for premium and cost-sharing assistance and to pay for services not covered by Medicare, such as nursing home care. Most are 65 or older, are disproportionately women and older than 85, but four in ten are under age 65 and have permanent disabilities. Medicaid also plays an important role in paying for long-term services and supports, helping to cover the costs for 2 out of 3 Medicare beneficiaries in nursing homes.

Under a Medicaid per capita cap system, the federal government would pay states a fixed amount of money per Medicaid enrollee annually, with the amount varying by category of beneficiary, including the elderly, disabled, children and adults who gained coverage under the Affordable Care Act’s Medicaid expansion, and other adults.  Payments to states would increase with medical inflation (CPI-M), rather than the current financing system, in which the federal government covers a percentage of all health care expenses incurred by enrollees.

The new brief, in FAQ format, examines the possible implications of such a system for the low-income seniors and people with disabilities on Medicare. They include the potential that states, facing fiscal pressure, could consider scaling back or eliminating optional services, such as dental care, vision care, and home and community-based services (HCBS); reduce provider payment rates; and restrict Medicaid eligibility for populations that they are not required to cover. The brief also looks at how the impact of a per capita cap or block grant could vary across states. It includes state-level data on the number of Medicare beneficiaries with Medicaid and other facts and figures.

News Release

Who Are the 7 Million Nonelderly Adults with Disabilities in Medicaid and What Would the House GOP Bill to Restructure Medicaid Financing and Repeal the Affordable Care Act Mean for Them?

Published: Mar 16, 2017

A new brief from the Kaiser Family Foundation explains the role that Medicaid plays for nearly 7 million nonelderly adults with disabilities in the U.S. and explores what the American Health Care Act could mean for their health care and coverage.

Medicaid covers more than three in 10 nonelderly adults with disabilities, including people with physical disabilities, such as cerebral palsy, multiple sclerosis, and traumatic brain or spinal cord injuries; intellectual or developmental disabilities such as Down syndrome and autism; and mental illness. Over half who are enrolled in Medicaid live below the federal poverty level. They are four times as likely to receive nursing or other health care at home, and more than 1.5 times as likely to have 10 or more health care visits in a year compared to those with private insurance.

Through Medicaid, nonelderly adults with disabilities have access to regular preventive care as well as medical care for illnesses and chronic conditions.  States must provide certain minimum services for adults, such as inpatient and outpatient hospital, physician, lab and x-ray, and nursing home services.  States also can choose to provide a broad range of optional services such as prescription drugs, physical therapy, private duty nursing, personal care, rehabilitative services, and case management.

The changes to Medicaid in the House GOP bill – notably the end of enhanced funding for the ACA Medicaid expansion and the fundamental change in program financing to a per capita cap – carry significant implications for this population. For those who have gained Medicaid eligibility through the expansion, loss of the enhanced match could curtail their prospects for keeping that coverage. And while per capita cap financing could come with increased flexibility for states in subsequent legislation, the associated federal funding reductions over time may lead states to consider cuts in Medicaid eligibility, benefits, and provider reimbursement. Nonelderly adults with disabilities could be particularly affected by such cuts, as many rely on Medicaid coverage pathways and services that are offered at state option and have higher spending, due to their greater need for acute and long-term care services.

White House Releases FY18 Budget Blueprint

Published: Mar 16, 2017

The White House released its budget blueprint on March 16, 2017 providing initial information on its budget request for FY18 (the full budget request is expected in May). While detail on funding levels for most global health programs is not specified, the blueprint does include total funding for the U.S. Agency for International Development (USAID) and the Department of State and highlights some specific global health programs and related areas:

  • USAID & State Department and Department of Treasury International Programs:
    • Total Funding: $39.1 billion, an $18.1 billion (-32%) cut from the FY17 Continuing Resolution (CR) level. This includes $25.6 billion for base activities ($10.1 billion or 28% below the FY17 CR) and $12.0 billion for Overseas Contingency Operations (OCO) ($7.2 billion or 37% below the FY17 CR) at USAID and the State Department, as well as $1.5 billion for Department of Treasury International Programs ($803 million or 35% below FY17 CR).
    • PEPFAR: “Provides sufficient resources to maintain current commitments and all current patient levels on HIV/AIDS treatment under the President’s Emergency Plan for AIDS Relief (PEPFAR).”
    • Global Fund: “The Budget also meets U.S. commitments to the Global Fund for AIDS, Tuberculosis, and Malaria by providing 33 percent of projected contributions from all donors, consistent with the limit currently in law.”
    • Malaria: “[M]aintains funding for malaria programs.”
    • Gavi, the Vaccine Alliance: “Provides sufficient resources on a path to fulfill the $1 billion U.S. pledge to Gavi, the Vaccine Alliance.”
    • International Organizations:
      • United Nations: “Reduces funding to the UN and affiliated agencies, including UN peacekeeping and other international organizations, by setting the expectation that these organizations rein in costs and that the funding burden be shared more fairly among members. The amount the U.S. would contribute to the UN budget would be reduced and the U.S. would not contribute more than 25 percent for UN peacekeeping costs.”
      • Multilateral Development Banks: “Reduces funding for multilateral development banks, including the World Bank, by approximately $650 million over three years compared to commitments made by the previous administration.”
    • Details on funding for other global health programs (e.g. tuberculosis, family planning and reproductive health, maternal and child health, etc.) was not included in the blueprint.
  • Department of Health and Human Services (HHS):
    • National Institutes of Health (NIH): Total funding would be $25.9 billion, a $5.8 billion (-18%) cut from the FY17 CR level. Additionally, the blueprint eliminates funding for the Fogarty International Center (FIC).
    • Public health, emergency preparedness, and prevention programs: “[T]he Budget restructures similar HHS preparedness grants to reduce overlap and administrative costs and directs resources to States with the greatest need. The Budget also creates a new Federal Emergency Response Fund to rapidly respond to public health outbreaks, such as Zika Virus Disease. The Budget also reforms the Centers for Disease Control and Prevention through a new $500 million block grant to increase State flexibility and focus on the leading public health challenges specific to each State.”
  • U.S. Department of Agriculture (USDA): Eliminates funding for the McGovern-Dole International Food for Education and Child Nutrition Program.

Medicaid Restructuring Under the American Health Care Act and Nonelderly Adults with Disabilities

Authors: MaryBeth Musumeci and Julia Foutz
Published: Mar 16, 2017

Issue Brief

Key Takeaways

This brief describes Medicaid’s role for nearly 7 million nonelderly adults with disabilities living in the community to help inform the debate about the American Health Care Act’s proposals to end enhanced federal funding under the ACA and reduce federal Medicaid funding under a per capita cap.

Medicaid covers more than three in 10 nonelderly adults with disabilities, providing a broad range of medical and long-term care services that enable people with disabilities to live and work in the community. 

  • Over half of nonelderly Medicaid adults with disabilities live below the federal poverty level, and nearly 85% have incomes below 200% of poverty ($24,120/year for an individual in 2017).
  • Nonelderly Medicaid adults with disabilities are four times as likely to receive nursing or other health care at home, more than 2.5 times as likely to have three or more functional limitations, and more than 1.5 times as likely to have 10 or more health care visits in a year compared to people with disabilities who are privately insured.

People with disabilities account for 15% of total Medicaid enrollment but 42% of program spending due to their greater health needs and more intensive service use.   

Medicaid spending per enrollee for people with disabilities is substantially higher than for those without disabilities, due to their greater health needs and reliance on Medicaid for expensive but necessary services, especially long-term care in the community and nursing homes, that are generally unavailable through private insurance and too costly to afford out-of-pocket.  Medicaid spending per enrollee for people with disabilities also varies substantially by state (from $10,142 in AL to $33,808 in NY in 2011).

Nonelderly adults with disabilities may be particularly affected by Medicaid changes in the American Health Care Act (AHCA), including the fundamental shift to per capita capped financing.

  • Most Medicaid disability-related coverage pathways and community-based long-term care services are provided at state option, making them subject to cuts as states adjust to substantial federal funding reductions under a per capita cap.  The CBO estimates that the AHCA will reduce Medicaid spending by $880 billion from 2017 to 2026.
  • The AHCA also would end enhanced federal funding for the ACA’s Medicaid expansion, which covers some nonelderly adults with disabilities, and Community First Choice attendant care services for people with disabilities, which could jeopardize states’ ability to continue to finance these options.

Over 22 million nonelderly adults, or 12% of adults ages 18 to 64, living in the community in the United States have a disability as of 2015.1   They include people with physical disabilities, such as cerebral palsy, multiple sclerosis, and traumatic brain or spinal cord injuries; intellectual or developmental disabilities (I/DD), such as Down syndrome and autism; and mental illness.  Some people live with a disability from birth or childhood, while others have a disability onset later in life resulting from an injury or chronic illness. Medicaid plays an important role by providing health insurance coverage for more than one in three nonelderly adults with disabilities (Figure 1).

Figure 1: Insurance coverage status of nonelderly adults with disabilities, 2015

The House American Health Care Act bill calls for changes to Medicaid that could affect nonelderly adults with disabilities.  Some nonelderly adults with disabilities have gained Medicaid eligibility through the ACA’s expansion, and the House bill calls for eliminating the expansion’s enhanced federal matching funds.2   The House bill also contains changes to Medicaid’s financing structure in ways that would limit federal funding through a per capita cap.  While states could be offered increased flexibility beyond what is available under current law in future legislation, states may look to cuts in Medicaid eligibility, benefits, and provider reimbursement as a result of the associated federal funding reductions.  People with disabilities have higher Medicaid spending relative to other populations due to their greater health needs and more intensive service use.  Nonelderly adults with disabilities could be particularly affected by potential cuts, as many of them rely on Medicaid coverage pathways and services that are offered at state option.  This issue brief describes the role that Medicaid plays for nonelderly adults with disabilities.  The appendix table contains per enrollee spending and take-up of selected eligibility and service options relevant to nonelderly adults with disabilities by state.

Background

The U.S. Census Bureau defines a disability as a limitation in vision, hearing, mobility, cognitive functioning, self-care, and/or independent living.  Self-care includes activities such as bathing and dressing.  Independent living includes the ability to move around the community, such as visiting a doctor’s office or going shopping.  People with disabilities have a range of medical and long-term care needs as a result of functional limitations.  They may need attendant care for help with getting out of bed, bathing, dressing, and eating; assistive technology such as power wheelchairs and speech generating devices; medical equipment and supplies; mental health counseling; and/or supportive services to maintain community-based housing or employment.

What Type of Health Insurance Do Nonelderly Adults with Disabilities Have?

Among people who are working, nonelderly adults with disabilities are significantly less likely to have a job that offers health insurance compared to those without disabilities (Figure 2).  Overall, nonelderly adults with disabilities are about half as likely to be working for pay than those without disabilities.  The ability of nonelderly adults with disabilities to work likely is limited as a result of their greater health needs and functional limitations, although with appropriate supports, many people with disabilities can and do work.  However, among those who are working, nonelderly adults with disabilities are significantly less likely to be working full-time and to have access to employer-sponsored health insurance.

Figure 2: Work status of nonelderly adults with disabilities compared to those without disabilities, 2015

Non-elderly adults with disabilities are significantly more likely to have Medicaid and significantly less likely to have private insurance than those without disabilities (Figure 3).  Those with disabilities are about three times as likely to be covered by Medicaid and about half as likely to have private insurance compared to those without disabilities. These differences are influenced by the greater health needs of people with disabilities and the fact that they are less likely to have access to employer-sponsored coverage.  Nonelderly adults with disabilities also are significantly less likely to be uninsured than those without disabilities, reflecting the important role that Medicaid plays in covering this population.

Figure 3: Insurance coverage status of nonelderly adults with disabilities compared to those without disabilities, 2015

How Do Nonelderly Adults with Disabilities Qualify for Medicaid?

Some nonelderly adults with disabilities are eligible for Medicaid through the ACA’s Medicaid expansion, based solely on their low income, in the 32 states (including DC) that have adopted the expansion as of 2017.3   The ACA expands Medicaid eligibility to nearly all nonelderly adults with income up to 138% FPL ($16,643/year for an individual in 2017) without an asset limit and provides enhanced federal matching funds for states to cover this group.4  Although having a disability is not required to qualify for Medicaid under the ACA’s expansion or other poverty-related pathways, more than three in 10 (35%) Medicaid adults who are not working report that they have an disability or illness.  People with disabilities may receive Medicaid as expansion adults while they are waiting for a disability determination, which can take a substantial amount of time, or they may have a disability that does not meet Supplemental Security Income (SSI) medical criteria but is nonetheless limiting, or they may not financially qualify for SSI.5   Some expansion adults with disabilities are working, and a recent study found that working-age adults with disabilities are significantly more likely to be employed if their state has adopted the Medicaid expansion, compared to states that have not expanded.6 

Some nonelderly adults with disabilities qualify for Medicaid through a disability-related pathway based on both their low income and functional limitations (Figure 4).7   All states generally must provide Medicaid to SSI beneficiaries, although this pathway does not include all people with disabilities.  Only 36% of nonelderly Medicaid adults with disabilities receive SSI,8  meaning that nearly 2/3 of nonelderly Medicaid adults with disabilities qualify through another pathway.  States can choose to extend Medicaid financial eligibility for people with disabilities up to 100% of the federal poverty level (FPL, $12,060 for an individual in 2017).  In addition, states can expand financial eligibility for people who need long-term care services, in nursing homes and/or in the community, up to three times the SSI benefit rate (equivalent to 219% FPL or $26,460/year for an individual in 2017).  States also can allow working people with disabilities at higher incomes to buy into Medicaid coverage by paying a premium.  The disability-related pathways also generally have asset limits set by the state, which typically are at the SSI level of $2,000 for an individual.

Figure 4: Medicaid eligibility pathways available to people with disabilities

What are the Characteristics of Non-Elderly Adults with Disabilities Receiving Medicaid?

Nonelderly adults with disabilities who receive Medicaid have very low incomes, with more than half living below the federal poverty level (Figure 5).  Nearly 85% of nonelderly Medicaid adults with disabilities have incomes below 200% FPL (less than $24,120/year for an individual in 2017).  Their low incomes reflect the fact that people with disabilities generally are poorer than those without disabilities as well as the low income eligibility limits associated with the Medicaid program. Nearly six in 10 nonelderly adults with disabilities receiving Medicaid are white, about one-quarter are black, and 16% are Hispanic.  Just under three in 10 are between ages 55 to 64, and another three in 10 are between ages 45 to 54.  About one-fifth are between ages 35 to 44, and one-quarter are ages 18 to 34.

Figure 5: Demographics of nonelderly adults with disabilities receiving Medicaid, 2015

Nonelderly adults with disabilities who receive Medicaid are significantly more likely to have multiple functional limitations compared to people with disabilities who have private insurance or those who are uninsured (Figure 6).  About one-third of nonelderly Medicaid adults with disabilities have three or more functional limitations, more than two and one-half times the rate of privately insured nonelderly adults with disabilities and more than double the rate for those who are uninsured.  By contrast, nonelderly Medicaid adults with disabilities are significantly less likely to have limited functioning in only one area compared to those who are privately insured.  For an example of a Medicaid beneficiary with multiple functional limitations, see Nicholas’s story below.

Figure 6: Number of functional limitations among nonelderly adults with disabilities, by insurance status, 2015
Nicholas, age 33, North Carolina
Nicholas was diagnosed with multiple sclerosis at age 29, and the disease is advancing.  He cannot walk more than a few feet, his hearing and vision are impaired, and he has difficulty using his hands.  He experiences a lot of pain on a daily basis.  Medicaid covers the medications he takes to control symptoms, doctor visits, and his power wheelchair.  Nicholas lives in an apartment that is physically inaccessible, and he was injured after a fall when he was trying to transfer from the bathroom to his wheelchair.  His Medicaid case plan includes help with making the shower accessible, home delivered meals, and a car hook-up for his power wheelchair so that he can more easily go out into the community.

Nonelderly adults with disabilities receiving Medicaid are significantly more likely to use health care services than those with private insurance or those who are uninsured (Figure 7).  They are four times as likely to receive nursing or other health care at home, nearly twice as likely to be hospitalized overnight, and more than one and one-half times as likely to have 10 or more health care visits in a year compared to those with private insurance.  This increased utilization likely reflects their greater health needs and functional limitations as well as the fact that certain services, such as care at home, are more likely to be covered by Medicaid than by private insurance.

Figure 7: Health care utilization among nonelderly adults with disabilities, by insurance status, 2015

Nonelderly adults with disabilities receiving Medicaid are significantly more likely to have lower out-of-pocket medical costs compared to people with disabilities who are privately insured (Figure 8).  Those with Medicaid are nearly three times as likely to incur costs of less than $500 per year compared to those with private insurance.  Those with Medicaid also were more than three times less likely to have the highest out-of-pocket costs (more than $5,000/year) compared to those with private insurance.  These differences are likely due to Medicaid’s cost-sharing rules, which are designed to protect people with low incomes from burdensome out-of-pocket costs, which can create financial barriers to receiving needed care.  The lower out-of-pocket costs among people with Medicaid also reflect their low incomes.  People with out-of-pocket medical expenses whose income exceeds Medicaid financial eligibility limits may become eligible for Medicaid through a “spend down’ by subtracting incurred medical expenses from their income.

Figure 8: Out-of-pocket medical costs in last 12 months among nonelderly adults with disabilities, by insurance status, 2015

What Services Does Medicaid Provide for Nonelderly Adults with Disabilities?

Medicaid covers a broad range of medical and long-term care services to meet the diverse needs of nonelderly adults with disabilities (Figure 9).   Through Medicaid, nonelderly adults with disabilities have access to regular preventive care as well as medical care for illnesses and chronic conditions.  States must provide certain minimum services for adults, such as inpatient and outpatient hospital, physician, lab and x-ray, and nursing home services.  States also can choose to provide a broad range of optional services, many of which are important to people with disabilities, such as prescription drugs, physical therapy, private duty nursing, personal care, rehabilitative services, and case management.  Most home and community-based services (HCBS) are provided at state option.9 

Figure 9: Minimum and Optional Medicaid Benefits

Medicaid provides long-term care services that support people with disabilities’ ability to live independently and safely in the community.  Medicaid is the primary payer for long-term services and supports and plays a key role in helping states finance services to meet their community integration obligations under the Americans with Disabilities Act and the Supreme Court’s Olmstead decision.10  Many of these services are unavailable through private insurance, and they are too costly for people to afford out-of-pocket, especially given the low incomes of most people with disabilities.  For example, Medicaid covers personal and attendant care services that assist people with disabilities with the tasks necessary for daily living, such as eating, bathing, dressing, preparing meals, and going grocery shopping.11   Medicaid also covers habilitative services that help people with disabilities learn independent living skills; assistive technology, such as lifts, wheelchairs, and speech-generating devices; supportive housing services that help people with disabilities obtain and retain community housing; and community-based mental health services, which help people with mental illness remain out of institutions.  For an example of a Medicaid beneficiary relying on long-term mental health services, see Bill’s story below.

Bill, age 42, Arizona
Bill was going to school and working as a nurse when he had his first mental break at age 27.  While he was hospitalized, he was diagnosed with bipolar disorder and found out that he qualified for Medicaid. Medicaid covers the day treatment program that he attends for 30 hours a week, along with medication and doctor visits, to manage his condition.  Bill says that Medicaid means he has “been given a second chance.”

Medicaid covers services that enable people with disabilities to work.  In addition to providing personal care and transportation services that help people with disabilities get ready for the day and get to work, states also can cover supported employment services, such as job coaching, to help people with disabilities work in the community.

The ACA offers states new and expanded options to provide community-based long-term care services.  The ACA created the Community First Choice option to provided attendant care services and supports with 6% enhanced federal matching funds; eight states elect this option as of 2016.  The ACA also expanded states’ ability to offer HCBS through the Section 1915 (i) option, which allows states to serve people with functional limitations that do not yet rise to an institutional level of care.  This enables states to offer services in efforts to retain people in the community and prevent the need for costlier and more intensive services in the future.  As of 2015, 17 states are using this option to provide targeted services to particular populations, such as people with mental health needs and those with I/DD.  The ACA also created the Medicaid health homes option, which enables states to provide care coordination services for people with chronic conditions at a 90% enhanced federal match for the first two years; 22 states offer health homes as of 2016.  For an example of a beneficiary receiving Medicaid community-based services, see Curtis’s story below.

Curtis, age 20, Kansas
Curtis lives with his mother and is diagnosed with autism, intellectual disabilities, and sensory integration issues.  He functions on the level of a 2nd or 3rd grader and recently has started to read. While he has a very easy-going personality, he cannot be left alone and needs help with shaving, bathing, and taking medication. Medicaid provides attendant care services that help him to learn basic life skills at home, such as making his bed and dusting his room, while his mother is at work. His attendant also accompanies him to the library, to get his hair cut, to community events, and to the book store where his favorite activity is looking at picture books.

Medicaid helps make coverage affordable for nonelderly adults with disabilities.  Federal minimum standards limit Medicaid beneficiaries’ out-of-pocket costs to prevent them from encountering financial barriers to accessing necessary care.  States can charge premiums to those with incomes above 150% FPL.  Copayment levels vary based on income and generally are limited to nominal amounts for those below poverty.  People who receive long-term care services, such as those in nursing homes, may be required to contribute most of their income toward the cost of their care, except for a small personal needs allowance to pay for items that Medicaid does not cover, such as clothing.

How Much Does Medicaid Spend on People with Disabilities?

Medicaid spending on people with disabilities is disproportionate to their enrollment in the program (Figure 10).  Unlike the data presented earlier in this paper, which are limited to nonelderly adults with disabilities, the Medicaid enrollment and spending data for people with disabilities in this section include both nonelderly adults and children with disabilities.  As of 2011, people with disabilities accounted for 15% of total Medicaid enrollment but 42% of program spending.  This discrepancy is likely due to their greater health needs and more intensive use of services compared to those without disabilities.

Figure 10: Medicaid enrollment and spending by coverage group, FY 2011

Per enrollee spending for people with disabilities is substantially higher than for those without disabilities (Figure 11).  Per enrollee spending for people with disabilities totaled $16,643 in 2011, more than five times higher than for adults without disabilities ($3,247) and nearly seven times higher than for children without disabilities ($2,463).  Some of this difference is due to people with disabilities’ greater use of both institutional and community-based long-term care services ($6,137) compared to those without disabilities, who have per enrollee long-term care spending at negligible amounts.  This is because some people enrolled in Medicaid through a pathway based solely on their low income also have disabilities and use long-term care services.  In addition to having higher per enrollee long-term care spending, people enrolled through a disability-related pathway also have higher per enrollee spending for acute care services ($10,505), more than eight times that of adults without disabilities ($3,234) and more than four times that of children without disabilities ($2,399).

Figure 11: Medicaid acute and long-term care spending per enrollee by coverage group, FY 2011

Per enrollee spending for people with disabilities varies substantially by state, ranging from $10,142 in AL to $33,808 in NY in 2011 (Figure 12 and Appendix Table).  Over half of states spend between $15,000 to $19,999 per enrollee for people with disabilities, and another third of states spend between $20,000 to $34,999 per enrollee for people with disabilities.  This variation is due to state choices about eligibility and services, as many disability-related coverage pathways and most home and community-based long-term care services are offered at state option.

Figure 12: Medicaid spending per enrollee for individuals with disabilities, FY 2011

As of 2011, 80% of nonelderly people with disabilities who use Medicaid long-term care are served in the community, with the remaining 20% in institutions (Figure 13).  Over the last several decades, states have made substantial progress in serving more nonelderly adults with disabilities in the community instead of in nursing homes.  HCBS typically are less expensive than nursing homes and are preferred by many nonelderly adults with disabilities.  However, state Medicaid programs must cover nursing home services, while nearly all HCBS are optional, making HCBS vulnerable to cuts if states are faced with funding reductions.

Figure 13: Predominant Care Setting for Nonelderly People with Disabilities Who Use Medicaid Long-Term Care Services, FY 2011

Looking Ahead

Medicaid covers more than three in 10 nonelderly adults with disabilities, providing a broad range of medical and long-term care services to meet their diverse needs and making coverage affordable.  Over half of nonelderly Medicaid adults with disabilities live below the federal poverty level, and nearly 85% have incomes of less than 200% FPL, or $24,120 per year for an individual in 2017.  They are significantly more likely to use health care services, including care at home, and to have lower out-of-pocket medical costs than nonelderly adults with disabilities who are privately insured, reflecting their lower incomes and greater functional limitations.  Medicaid spending for this population is disproportionate to their program enrollment, due to their greater health needs and reliance on Medicaid for expensive but necessary services, especially long-term care in the community and nursing homes, that are generally unavailable through private insurance and too costly to afford out-of-pocket.

The American Health Care Act, as approved by the House Energy and Commerce Committee, would fundamentally change Medicaid’s financing structure to a per capita cap, resulting in an estimated $880 billion reduction in federal Medicaid spending from 2017 to 2026.  People with disabilities may be especially affected by a per capita cap as most disability-related coverage pathways and many services important to people with disabilities, such as community-based long-term care, are provided at state option, making them subject to cuts if states are faced with federal funding reductions.  States’ delivery system reform efforts that affect people with disabilities, such as those that seek to improve care coordination; integrate physical, behavioral health, and long-term care services; and serve more people in the community instead of institutions also could be curtailed if federal Medicaid funding is limited.

While per enrollee Medicaid spending for both acute and long-term care services is substantially higher for people with disabilities compared to those without disabilities, it also varies substantially across states.  A per capita cap, as proposed in the American Health Care Act, could lock in historical state differences in scope of coverage and spending for people with disabilities. Changing Medicaid financing to a per capita cap also ties spending levels to a base year, which does not account for future spending increases due to new drug therapies or other medical advances yet to be developed, which could offer important new treatments to improve the lives and functioning of people with disabilities.

The American Health Care Act also ends enhanced federal funding for the ACA’s Medicaid expansion and the Community First Choice (CFC) option, both of which can be important to people with disabilities.  The ACA’s Medicaid expansion provides a pathway through which some nonelderly adults with disabilities newly gained coverage, while CFC allows states to offer attendant care services and supports that help people with disabilities live and work in the community.  As approved by the House Energy and Commerce Committee, the AHCA repeals the enhanced federal matching funds for the ACA’s expansion enrollees as of January 1, 2020, except for those enrolled as of December 31, 2019, who do not have a break in eligibility of more than one month, and ends the enhanced federal matching funds for CFC as of January 1, 2020.  These reductions in federal funding could jeopardize states’ ability to continue to finance the expansion coverage pathway and Community First Choice services.

Unlike nursing home services which are required, many home and community-based services important to people with disabilities are provided through optional waivers, which put them at risk for cuts as states look for ways to limit spending in the face of substantial federal funding reductions. In addition, new flexibility granted to states under Section 1115 Medicaid expansion waivers could further complicate coverage for nonelderly adults with disabilities. Existing Medicaid expansion waivers include provisions not otherwise permitted under current Medicaid rules, such as premiums, copayments above statutory limits, healthy behavior incentives, and health savings accounts.  People who are considered “medically frail” are exempt from some of these rules, which can create additional administrative burdens for states, health plans, and beneficiaries in making sure that people with disabilities are appropriately recognized.

Under a per capita cap and the elimination of enhanced federal financing as proposed in the AHCA, states will be faced with budgetary pressures resulting from the substantial reduction in federal Medicaid funds.  At the same time, states will continue to be required to meet their community integration obligations for people with disabilities under the Americans with Disabilities Act and the Supreme Court’s Olmstead decision.  Medicaid has played a key role in financing community-based long-term care services, but its ability to continue to do so may be limited by the loss of the CFC enhanced funding for attendant care services, along with the broader reductions in federal Medicaid funds under a per capita cap, thereby increasing budgetary pressures on states.  Because the AHCA could have significant consequences for enrollees and states, its potential implications warrant careful consideration for their impact on nonelderly Medicaid adults with disabilities.


Appendix

Appendix Table:  State Medicaid Spending and Options for People with Disabilities
StateMedicaid Spending Per Enrollee(2011)Share of Medicaid LTC SpendingDevoted to HCBS (FY 2014)ACA Expans.(2017)Optional Disability-Related Eligibility Pathways (2015)Optional Home and Community-Based Services
>73%-100% FPLWork Buy-InLTC to 300% SSIPers’l Care(2013)HCBS Waivers(2017)CFC(2016)Sec. 1915 (i)(2015)Health Homes(2016)
States with Republican Governor
Alabama$10,14242%XXX
Arizona$22,04070%XXXXX
Arkansas$14,02350%XXXXXX
Florida$15,00533%XXXX
Georgia$10,63948%XXX
Idaho$21,78153%XXXXXX
Illinois$16,68944%XXXX
Indiana$19,48831%XXXXXX
Iowa$20,24250%XXXXXX
Kansas$17,15353%XXXXX
Kentucky$12,85641%XXXX
Maine$16,92055%XXXXXX
Maryland$23,79856%XXXXXXXX
Massachusetts$16,92757%XXXXXX
Michigan$15,10935%XXXXXXXX
Mississippi$12,96027%XXXX
Missouri$17,48156%XXXX
Nebraska$17,44949%XXXX
Nevada$15,70649%XXXXXX
New Hampshire$21,54550%XXXXX
New Jersey$19,95141%XXXXXXX
New Mexico$18,50074%XXXXXX
North Dakota$28,69241%XXXX
Ohio$21,89252%XXXXX
Oklahoma$15,01044%XXXXX
South Carolina$12,83043%XXX
South Dakota$19,15647%XXXXX
Tennessee$14,68053%XX
Texas$17,70957%XXXXXX
Utah$19,71848%XXXXX
Vermont$17,78968%XXXXXX
Wisconsin$16,59964%XXXXXX
Wyoming$25,34650%XXX
TOTAL:  33N/AN/A1613273021332915
States with Democratic or Independent Governor
Alaska$28,79070%XXXXX
California$20,08064%XXXXXXX
Colorado$19,64363%XXXXX
Connecticut$31,00448%XXXXXX
Delaware$22,97242%XXXXX
DC$28,60453%XXXXXXXX
Hawaii$17,03542%XXX
Louisiana$15,09939%XXXXXX
Minnesota$26,89075%XXXXXXX
Montana$16,35257%XXXXXXX
New York$33,80858%XXXXXX
North Carolina$15,060n/aXXXXX
Oregon$18,25579%XXXXXXX
Pennsylvania$16,44144%XXXXX
Rhode Island$21,41758%XXXXXX
Virginia$18,95255%XXXX
Washington$16,20866%XXXXXXX
West Virginia$12,99348%XXXXXX
TOTAL:  18  N/AN/A16817141118687
NOTES: Spending per enrollee includes full benefit nonelderly adults and children with disabilities only.  Share of LTC spending devoted to HCBS omits managed care spending in CA and MA.  % HCBS not calculated for NC due to missing data.  Not all states electing the >73%-100% FPL expansion go up to 100% FPL.  HCBS waivers include § 1915 (c) and § 1115.SOURCES:  KFF, Data Note:  Variation in Per Enrollee Medicaid Spending Across States (Feb. 2017); Steve Eiken, Kate Sredl, Brian Burwell, and Paul Saucier, Medicaid Expenditures for Long Term Services and Supports (LTSS) in FY 2014, Table C (Bethesda, MD: Truven Health Analytics, April 2016); KFF, Status of State Action on the Medicaid Expansion Decision (Jan. 1, 2017). KFF, Medicaid Financial Eligibility for Seniors and People with Disabilities in 2015 (March 2016).  KFF, Medicaid Home and Community-Based Services Programs:  2013 Data Update (Oct. 2016). KFF, Medicaid Section 1115 Managed Long-Term Services and Supports Waivers:  A Survey of Enrollment, Spending, and Program Policies (Jan. 2017). KFF, Section 1915 (k) Community First Choice State Plan Option (March 2016). KFF, Health Home State Plan Option (April 2016).

Endnotes

  1. Kaiser Family Foundation analysis of 2015 National Health Interview Survey (NHIS) data. The total number of nonelderly adults with disabilities is likely higher as people living in long-term care facilities are excluded from NHIS. ↩︎
  2. As approved by the House Energy and Commerce Committee, the bill would eliminate the ACA’s enhanced federal matching funds for expansion enrollees as of January 1, 2020, except for those enrolled as of December 31, 2019, who do not have a break in eligibility of more than one month. ↩︎
  3. Applicants have their Medicaid eligibility assessed solely on the basis of income as the first step in the eligibility determination process. To the extent that different coverage groups receive different benefit packages, people who qualify for Medicaid both as an expansion adult and in a disability-related group can choose to remain in the expansion group or change their enrollment to the disability-related group so that they can access the benefit package that best meets their needs.  42 C.F.R. § 435.911(c)(2). ↩︎
  4. The expansion is optional for states, as a result of the Supreme Court’s ruling on the ACA’s constitutionality.  Prior to the ACA, there was not a Medicaid coverage pathway for childless adults regardless of how low their income was, and this remains the case in the 19 non-expansion states, except for Wisconsin, which covers childless adults up to 100% FPL. ↩︎
  5. To be eligible for SSI, beneficiaries must have low incomes, limited assets, and a significant disability that impairs their ability to work at a substantial gainful level. ↩︎
  6. Jean P. Hall, et al., Effect of Medicaid Expansion on Workforce Participation for People with Disabilities, 107 Amer. J. Pub. Health 262-264 (Feb. 2017), doi: 10.2105/AJPH.2016.303543. ↩︎
  7. These pathways were not changed by the ACA. ↩︎
  8. Kaiser Family Foundation analysis of 2015 NHIS data. ↩︎
  9. States also can provide HCBS through waivers which allow them to target particular populations and limit enrollment. ↩︎
  10. In Olmstead, the Supreme Court held that the unjustified institutionalization of people with disabilities is illegal discrimination under the ADA. ↩︎
  11. States have the option to allow beneficiaries to self-direct their services by selecting or dismissing personal care attendants and/or allocating their service budgets among available services. ↩︎

Restructuring Medicaid in the American Health Care Act: Five Key Considerations

Author: Julia Paradise
Published: Mar 15, 2017

On March 9, the House Ways and Means Committee and Energy and Commerce Committee passed the American Health Care Act, the Republican leadership’s plan to repeal and replace the Affordable Care Act (ACA). In fact, the legislation would make changes beyond the ACA, including major changes in the Medicaid program, which provides health coverage for 1 in 5 Americans. The House bill would cap federal funding for the more than 74 million low-income children, adults, seniors, and people with disabilities covered by Medicaid. It would also phase out enhanced federal funding for the 11 million adults newly eligible for Medicaid under the ACA Medicaid expansion.

The Congressional Budget Office (CBO) estimates that the House bill would reduce federal spending by $1.2 trillion over the period 2017-2026 and reduce the federal deficit by $337 billion. The total reduction in federal spending over the 2017-2026 period includes a reduction of $880 billion in federal spending for Medicaid. The reduction in federal Medicaid spending would be used to help finance the tax credits and the federal revenue reductions attributable to repeal of the ACA taxes provided by the House bill. By 2026, 14 million fewer people would be covered by Medicaid relative to the number expected under current law and number of uninsured people would increase by 21 million, reaching 52 million in 2026. This brief considers five key Medicaid implications of the House bill.

1.    The House bill would fundamentally change the federal role in financing care for the poorest people in the nation by capping the federal contribution to Medicaid, resulting in both federal savings and substantial cuts in federal Medicaid support over time.

The 74 million individuals covered by the Medicaid program include many of the most vulnerable and disadvantaged people in our society. Among those served by the program are millions of low-income pregnant women, infants, children, and parents and other adults – most of them in working families. Millions of poor senior citizens and millions of low-income Americans of all ages with physical disabilities, developmental disabilities, chronic conditions, and serious mental illness also rely on Medicaid. The individuals and families covered by Medicaid lack access to other affordable health insurance because of their low income or health needs. Without Medicaid, nearly all of them would be uninsured or underinsured for health and long-term care they need.

Throughout the Medicaid program’s history, Medicaid costs and risks have been shared by states and the federal government. The guarantee of federal Medicaid matching funds with no pre-set limit expands states’ capacity to provide health coverage for their residents and helps them manage increases in Medicaid costs that are fueled by health care cost inflation, the emergence of expensive new treatments and drugs, and the aging of the population. Because states share the costs of Medicaid, they have strong incentives to run efficient and effective programs, and state cost-cutting measures taken in hard economic times, including reductions in provider payment, have led to lean Medicaid operations. Beginning in FY 2020, the House bill would cap federal Medicaid funding per enrollee to achieve federal savings, shifting costs to states (Figure 1). According to the CBO, under the House bill, federal Medicaid spending would fall by $880 billion over the period 2017-2026. In 2026, federal spending for Medicaid would be about 25% lower than expected under current law, and 14 million fewer people would be covered by Medicaid than expected under current law.

The bill would give states some flexibility to reduce costs by repealing the requirement that states provide the federally-defined essential health benefits for Medicaid expansion adults. However, it would also reduce states’ flexibility to maintain Medicaid eligibility and coverage at current levels.

Figure 1: Under a per capita cap, reductions in federal spending are obtained by setting federal caps below expected spending.

2.    Capping federal Medicaid funding locks states into their past Medicaid cost and spending experience and does not adjust for key state variation.

Medicaid spending per enrollee varies widely by state, by enrollment group, and over time (Figure 2). This variation stems from many factors, including demographic and health differences across states, variation in spending by enrollment group, local health care prices, and state Medicaid policy choices. The House bill would cap federal Medicaid funding per enrollee based on five groups: the elderly; individuals with disabilities; children; Medicaid expansion adults; and other adults. The federal per-enrollee caps would be based on states’ Medicaid expenditures in 2016, trended forward to 2019 by the medical CPI. Using a base year and a uniform index to establish the federal caps would lock states into their past Medicaid experience and omit consideration of substantial state variation in actual Medicaid per-enrollee spending growth. To illustrate, although Medicaid spending per child fell by 1.4% annually in Connecticut and grew by 13.3% annually in Arizona during the period 2000-2011, the federal cap per child would be determined in both states using the medical CPI, which is high compared to Connecticut’s actual experience and low compared to Arizona’s. This uniform approach would have differential impacts on states’ ability to address changing needs and new health challenges.

Figure 2: Average annual growth in Medicaid spending per enrollee varies widely by state and enrollment group, 2000-2011

3.    Capped federal funding could limit states’ ability to meet the health care needs of their residents and respond to emerging health issues.

The availability of federal matching funds as needed helps states respond to changing coverage needs related to economic recessions; public health emergencies like HIV/AIDS and the opioid addiction epidemic; the growing numbers of the very old; disasters like 9/11 and Hurricane Katrina; and the emergence of new but costly treatments, like drugs for Hepatitis C (Figure 3). Converting to capped federal funding, as the House bill provides, would shift the risk for spending above the federal caps to states, increasing pressure on state budgets over time and likely leading to reduced coverage and access to care for low-income people, higher out-of-pocket costs, and increased uncompensated care costs for hospitals, clinics, doctors, nursing homes, and other providers.

Figure 3: As deaths from opioid overdose have climbed, state Medicaid programs have covered a range of medications and treatment.

4.    Capped federal Medicaid funding could increase state budget pressures, jeopardizing access to home and community-based services in Medicaid that enable seniors and people with disabilities to have integrated care and remain in the community.

In addition to providing health insurance for poor families, Medicaid is the nation’s predominant source of financing for long-term care, serving 1 in 5 Medicare beneficiaries and 2 in 5 people with disabilities. States have used their flexibility in Medicaid extensively to cover optional Medicaid groups and services to meet the long-term care needs of their residents, and a large share of their Medicaid spending is associated with these policy choices (Figure 4). Because of Medicaid, many people who would otherwise be in nursing homes are able to live independently and safely in the community. Under the House bill, states facing budget pressures might reconsider their optional expansions of Medicaid eligibility and services.

Figure 4: All states have taken up options to expand eligibility and services to serve people with long-term care needs.

5.    Ending enhanced federal financing for the Medicaid expansion puts coverage at risk for 11 million adults who gained Medicaid through the expansion.

Medicaid provides health coverage for people who are poor or who have substantial health care needs but cannot afford private insurance or need more extensive benefits than it provides. Federal and state expansions of Medicaid and CHIP for children have led to a sharp decline in the uninsured rate for children, which fell from 14% in 1997 to an historic low of 5% in 2016. Following passage of the ACA, the nation experienced an  unprecedented decline in the uninsured rate for nonelderly individuals, from 16.6% in 2013 to an all-time low of 10% in 2016. The 32 states – including 16 states with Republican Governors – that adopted the ACA Medicaid expansion to adults led the declines.

With enhanced federal funding for the Medicaid expansion, states have been able to provide coverage for millions of uninsured adults, including many with chronic physical and mental illnesses; the Medicaid expansion has also been instrumental to states’ ability to respond to the opioid addiction epidemic. The House bill would end the enhanced federal funding for the expansion population in 2020, which would place substantial budget pressures on states to maintain coverage, or lead the uninsured rate to climb if states are unable to shoulder these additional costs alone. CBO’s report on the House bill estimates that federal spending for Medicaid would drop by $880 billion over the 2017-2026 period due to capped federal Medicaid funding and the termination of enhanced federal funding for the Medicaid expansion.  By 2026, an estimated 14 million fewer people would be covered by Medicaid relative to the number expected under current law, and number of uninsured people would rise to 52 million – an increase of 21 million over 2017.

Figure 5: In the 32 states that expanded Medicaid under the ACA, 11 million newly eligible adults gained coverage.
News Release

Poll: Early Perceptions of House Bill Show Public Thinks It Would Cover Fewer People and Raise Health Costs

Published: Mar 15, 2017

Republicans More Likely to Expect Positive Changes Than Democrats or Independents

Large Majority Favors Continued Medicaid Funding to Planned Parenthood

Fielded March 6-12 as Americans were first learning about the American Health Care Act and before the Congressional Budget Office estimated its effects, the latest Kaiser Tracking Poll shows that large shares of the public expect the House Republican health care plan would result in fewer people having health insurance and higher costs for people who buy their own health insurance. Republicans are generally more likely to expect positive results from the plan while Democrats and independents are more likely to foresee negative ones.

About half (48%) of the public say the plan would result in fewer people having health insurance, compared to one in five (18%) who say it would increase the number of people with coverage.

Nearly half (45%) say protections for people with pre-existing conditions would stay about the same. Roughly a third (32%) say the replacement plan would weaken protections for people with pre-existing conditions, about twice the share who say it would increase protections (15%).

March alert charts - 1.png

The poll finds the public starts out skeptical of the potential effects of the Republican bill on costs for people who buy their own health insurance on the individual market, one of the groups most affected by Obamacare:

  • Nearly half (48%) expect the House plan to increase health costs for those who buy their own insurance compared to a quarter (23%) who expect it to lower their costs. Almost half (46%) of Republicans expect lower costs for this group, while most Democrats (71%) expect higher costs. More independents expect costs to increase (47%) than decrease (25%).
  • More say it would increase deductibles (41%) than lower deductibles (25%), though Republicans are more likely to expect deductibles would decrease (41%) than increase (16%).
  • At least four in 10 say they expect the plan to increase costs for younger people (41%), older people (45%), people with low incomes (46%), and people living in both urban (41%) and rural (42%) areas who buy their own insurance. Smaller shares expect it to decrease costs in each category.
  • The public’s views are more evenly split on one group: people with higher incomes. Similar shares say this group would see lower costs (27%) as higher costs (25%).

Public Remains Split on the ACA and its Repeal

Overall, the public remains divided on whether Congress should (45%) or should not (51%) repeal the Affordable Care Act at all. Among those who favor repeal, more want Congress to wait until the details of a replacement plan are known (24% overall) than want an immediate vote (19%).

Views of the Affordable Care Act overall are similar to last month, with 49 percent holding a favorable view and 44 percent unfavorable. As in the past, there are huge partisan divisions, with Democrats largely holding favorable views and Republicans largely holding unfavorable ones.

Large Majority Supports Continued Medicaid Funding to Planned Parenthood for Covered Services

The House replacement bill includes a provision that would prohibit federal funding for Planned Parenthood clinics for one year for all Medicaid services they provide, including contraception, testing and treatment for sexually transmitted diseases and cancer screenings.

Three quarters (75%) of the public oppose cutting off federal funds to Planned Parenthood for providing these services, while 22 percent favor it. Substantial majorities of Democrats and independents as well as narrower majorities of Republican men (55%) and Republican women (57%) oppose cutting off funding. Relatively few people change their minds when presented with counterarguments to their initial view.

March alert charts - 2.png

At least two thirds of Americans also report being aware of the range of services Planned Parenthood provides, including contraception (87%), testing and treatment for sexually transmitted diseases (80%), cancer screenings and preventive services (68%), and abortion (68%). In contrast, about one third (33%) of the public is aware that there is already a ban on using federal Medicaid funds to pay for abortions.

Majority Favors Allowing the Sale of Insurance Across State Lines, Though Views Are Malleable

President Trump and Republican leaders in Congress have supported the idea of allowing insurers to sell their plans across state lines as a way to drive down insurance costs, though this provision is not included in the current House legislation. The poll finds two thirds of the public (64%) generally favor this provision, compared to about three in 10 (28%) who oppose it. However, substantial shares of those who support or oppose the provisions change their minds when presented with counterarguments.

For instance, about half of those who originally supported the provision change to oppose it (bringing total opposition to 57%) after hearing that it could encourage insurers to operate from states with fewer consumer protections and make it harder for consumers to get help if they have a problem. Similarly, about four in 10 of those who initially opposed the provision switch to support it (bringing total support to 78%) after hearing it could encourage competition and decrease costs for consumers.

Designed and analyzed by public opinion researchers at the Kaiser Family Foundation, the poll was conducted from March 6-12 among a nationally representative random digit dial telephone sample of 1,206 adults. Interviews were conducted in English and Spanish by landline (421) and cell phone (785). The margin of sampling error is plus or minus 3 percentage points for the full sample. For results based on subgroups, the margin of sampling error may be higher.

Poll Finding

Kaiser Health Tracking Poll: ACA, Replacement Plans, Women’s Health

Authors: Ashley Kirzinger, Liz Hamel, Elise Sugarman, Bryan Wu, and Mollyann Brodie
Published: Mar 15, 2017

Findings

KEY FINDINGS:

  • The latest Kaiser Health Tracking Poll examines the public’s early attitudes towards the House Republican plan to replace the Affordable Care Act and finds that more expect the new plan will make things worse rather than better when it comes to the number of people with coverage and costs for those buying insurance on their own. Republicans are more optimistic, with nearly half expecting the plan to decrease costs and one-third saying it will increase the number of people covered.
  • More expect the law to increase rather than decrease costs in the individual insurance market for various groups, including younger and older people, those living in urban and rural areas, and those with lower incomes. The public is more divided on whether costs will increase or decrease for higher-income people who buy their own insurance.
  • Three-quarters of the public support continuing current federal Medicaid funding to Planned Parenthood to pay for non-abortion services received by people on Medicaid, while 22 percent support cutting off all federal funding to the group. Majorities of both Republican women and Republican men support continuing current funding.
  • At the same time, only one-third of the public is aware that there is currently a ban on federal Medicaid funds being used to pay for abortions, while almost half say there is not a ban and one in five say they don’t know.
  • After shifting in a positive direction in February, the public’s overall views of the ACA hold steady this month, with 49 percent holding a favorable view of the 2010 law and 44 percent holding an unfavorable view. The public is split on the question of repeal, with 51 percent saying Congress should not vote to repeal the law and 45 percent saying they should. As previous Kaiser surveys have found, more say lawmakers should wait to vote on repeal until the details of a replacement plan are worked out (24 percent) than say they should repeal the law immediately and work out the details of a replacement plan later (19 percent).

Public Opinion on ACA Replacement Plan

On March 6, 2017, House Republicans announced their plan to replace the Affordable Care Act (ACA) – the American Health Care Act (AHCA). While Americans are still learning about the details of this plan, the latest Kaiser Health Tracking Poll (which was in the field before the Congressional Budget Office released its analysis of the plan) examines the public’s first impressions of its likely effects on the number of uninsured, those who buy insurance on their own, and those with pre-existing conditions.

About half (48 percent) the public thinks the Republican replacement plan will decrease the number of people who have health insurance, while one in five (18 percent) say the number of insured people will increase and three in ten say it will stay about the same. Notably, the public is confused about the effect the current health care law has had on coverage rates in the U.S.; while four in ten (41 percent) know that the share of people who are uninsured has decreased since the ACA was passed, nearly as many (31 percent) believe it has increased and 26 percent think it has remained about the same.

When it comes to costs, about half (48 percent) expect the new plan to increase costs for people who buy insurance on their own, while about a quarter each say costs for these people will decrease (23 percent) or stay about the same (25 percent). Similarly, four in ten (41 percent) expect the replacement plan to provide health insurance with higher deductibles, while a quarter each think deductibles will decrease (25 percent) or stay the same (23 percent). When it comes to protections for people with pre-existing conditions, nearly half the public (45 percent) expects the replacement plan would provide similar protections to the current law, but about twice as many say the plan would offer fewer protections as say it would offer more (32 percent versus 15 percent).

Figure 1: More Say ACA Replacement Plan Will Make Things Worse Than Better on Coverage, Costs, and Pre-Existing Conditions

Not surprisingly, partisans hold very different views of how the replacement plan would impact coverage and costs. While majorities of Democrats believe the plan will decrease the number of people with insurance and increase costs, Republicans’ views are more mixed. Nearly half of Republicans (46 percent) think the plan will decrease costs for people who buy their own insurance, four in ten (41 percent) think it will provide insurance with lower deductibles, and one-third (34 percent) think it will increase the number of people with health insurance.

Table 1: Partisan Views on Likely Effects of Republican ACA Replacement Plan

Percent who say in general, compared to the current health care law, the replacement plan will…


Total PublicDemocratsIndependentsRepublicans
…decrease the number of people with health insurance48%68%49%22%
…increase the number of pople with health insurance18131534
…not change the number of people with insurance30173238
…increase costs for people who buy their own insurance48714719
…decrease costs for people who buy their own insurance2362546
…not change costs for people who buy their own insurance25202628
…provide insurance with higher deductibles41604116
…provide insurance with lower deductibles25132641
…provide insurance with about the same deductibles23172329
…provide fewer protections for people with pre-existing conditions3249309
…provide more protections for people with pre-existing conditions15121520
…provide about the same protections for people with pre-existing conditions45324763

Expected Changes in Costs for Different Groups Under Replacement Plan

A Kaiser Family Foundation analysis has shown that the tax credit structure under the replacement plan would generally increase costs for certain groups of people buying insurance in the non-group market and decrease costs for others. For example, compared with current law, lower-income individuals, older adults, and those living in rural areas would pay more for insurance on average under the replacement plan, while younger adults, those with higher incomes, and those living in urban areas would pay less.1 

However, the public does not see a distinction in how the replacement plan would impact costs for these different groups of individuals, except when it comes to income. About four in ten Americans expect costs to increase for younger, older, urban-dwelling, and rural-dwelling people buying insurance on the individual market, while between about two in ten and one quarter expect them to decrease. Similarly, almost half (46 percent) think costs would increase for lower-income people buying their own insurance, while one quarter think they would decrease. Views are more divided on how higher-income people buying their own insurance would be affected, with over four in ten (45 percent) saying their costs would be about the same, and about a quarter each saying they would increase (25 percent) or decrease (27 percent).

Figure 2: More Think ACA Replacement Plan Will Increase Than Decrease Costs for Most Groups, with Exception of Higher-Income

Public Opinion on the ACA

These views of the replacement plan are set against a backdrop of a public that continues to be divided in its view of the ACA. After shifting in a more favorable direction last month, public opinion on the current health care law mostly holds steady this month, with 49 percent having a favorable view and 44 percent unfavorable. Partisanship continues to underlie these views, with 77 percent of Republicans expressing an unfavorable view, 73 percent of Democrats expressing a favorable one, and independents evenly divided (46 percent favorable, 47 percent unfavorable).

Figure 3: Public Opinion on the Affordable Care Act Continues to Tilt Favorable

The public also remains divided in their views of repeal, with half (51 percent) saying lawmakers should not vote to repeal the law and 45 percent saying they should vote to repeal it. Of those who want to see Congress vote to repeal the law, more say they want lawmakers to wait to vote to repeal the law until the details of a replacement plan have been worked out (24 percent) than say Congress should vote to repeal the law immediately and work out the details of a replacement plan later (19 percent).

Figure 4: Americans Divided on ACA Repeal and Replacement

Again, these views are largely driven by party identification, with the vast majority of Republicans (81 percent) saying Congress should vote to repeal the law and a similar share of Democrats (78 percent) saying they do not want the law repealed. Republicans are about evenly divided between those who want Congress to wait to vote on repeal until the details of a replacement plan have been worked out (41 percent) and those who say they should vote to repeal the ACA immediately and work out the details of a replacement plan later (36 percent).

Table 2: Next Steps for the ACA

Percent who would like to see lawmakers do each of the following with the 2010 health care law:


TotalDemocratsIndependentsRepublicans
Should not vote to repeal51%78%50%14%
Should vote to repeal (NET)45194681
Wait to vote to repeal the law until the details of a replacement plan have been announced2492941
Vote to repeal the law immediately and work out the details of a replacement plan later19101536

Views on Planned Parenthood Funding

The House replacement bill includes a provision that would block Planned Parenthood for one year from receiving federal funds to provide services to low-income people on Medicaid, including non-abortion services like contraception, testing and treatment for sexually transmitted infections, and cancer screenings. Seventy-five percent of the public thinks Medicaid should continue to pay Planned Parenthood for non-abortion services, while 22 percent think all federal payments to the organization should be stopped.

Figure 5: Most Say Federal Medicaid Payments to Planned Parenthood Should Continue

While there are partisan and gender differences on this question, majorities across groups, including just over half of Republican men (55 percent) and Republican women (57 percent) say that the federal government should continue to pay Planned Parenthood for non-abortion services received by people on Medicaid.

Figure 6: Majorities Across Groups Say Federal Medicaid Payments to Planned Parenthood Should Continue

Americans’ attitudes towards federal payments to Planned Parenthood through the Medicaid program are largely stable, with few being persuaded from their opinions after hearing arguments for and against continued funding. Among those who think all federal Medicaid payments to Planned Parenthood should be stopped, about one-third (7 percent of the public overall) change their mind after hearing that this would make it difficult for many lower-income women to access certain health services, including treatment for sexually transmitted infections, cancer screenings, and birth control. On the other hand, a small share of those who initially support continuing current federal Medicaid payments to Planned Parenthood (10 percent overall) shift their opinion to oppose these payments after hearing that even though no federal funding goes directly to abortion services, Planned Parenthood does provide and refer women for abortions.

Figure 7: Attitudes on Federal Payments to Planned Parenthood Are Largely Unchanged by Arguments

When asked about services currently provided by Planned Parenthood, most are aware of the variety of health care services provided by the organization including contraception (87 percent), treatment and testing for sexually transmitted infections (80 percent), cancer screenings (68 percent), and abortions (68 percent). Similar shares of women and men are aware that Planned Parenthood provides each of these services.

Figure 8: Most Are Aware of Range of Services Provided by Planned Parenthood

Awareness is lower when it comes to the question of whether federal funds can be used to pay for abortion services. While the Hyde Amendment currently prohibits federal Medicaid funds from being used to pay for abortions, just one-third (33 percent) of the public is aware of this ban, while almost half (45 percent) say there is not a ban and one in five (21 percent) say they don’t know.

Republicans are less likely than Democrats to be aware that there is a ban on federal funds being used to pay for abortions. One-quarter of Republican women (25 percent) and Republican men (26 percent) are aware of the ban, compared with about four in ten women and about a third of men who identify as Democrats and independents.

Figure 9: One-Third Are Aware of Ban on Federal Funds Being Used to Pay for Abortions, with Lower Awareness Among Republicans

Government Role in Women’s Health

Beyond the question of federal funding for Planned Parenthood, more generally, a majority of the public says it is important that the federal government provides funding for reproductive health services including family planning and birth control for lower-income women. While a large majority of Democrats (84 percent) and over half of independents (56 percent) say this is “very” important, the share is much smaller among Republicans (36 percent).

Figure 10: Majority Say It Is Important for Federal Government to Fund Reproductive Health Services for Lower-Income Women

Large majorities of the public also say it is important (either “very” or “somewhat”) for several of the ACA’s requirements affecting women and children to be kept in place in any replacement plan. Roughly eight in ten say that if lawmakers decide to repeal and replace the 2010 health care law, it is “very” important that insurance companies cannot deny coverage to pregnant women (85 percent), that all private health plans must cover the full cost of preventive care with no cost-sharing for women (81 percent) and children (80 percent), and that insurance companies cannot charge women more than men for the same policy (79 percent). Fewer – 54 percent –  say it is very important to keep in place the requirement for health plans to provide birth control with no cost-sharing, but three-quarters (78 percent) say this is at least “somewhat” important.

Figure 11: Majority Support Keeping in Place ACA Provisions for Women’s and Children’s Health Care

Large majorities of women, regardless of political party, say keeping most of these requirements in place is very important. One exception is the requirement that private health plans cover the cost of birth control with no cost-sharing, which majorities of women who are Democrats and independents view as very important compared with a smaller share of Republican women (38 percent). Men’s views are more divided by partisanship, with substantially higher shares of men who identify as Democrats saying each requirement is very important compared with Republican men. Three in ten Republican men (31 percent) say it is very important that the requirement for private health plans to cover the full cost of birth control is kept in place if the ACA is repealed.

Table 3: Strong Support for Keeping in Place ACA Provisions Aimed at Women’s Health Services
MaleFemale
DemsIndsRepsDemsIndsReps
Percent who say it is very important to them that each of the following requirements be kept in place if lawmakers decide to repeal the 2010 health care law:
Private health insurance companies cannot deny coverage to pregnant women92%78%72%97%85%80%
Private health plans must cover mammograms and cervical cancer screenings with no out-of-pocket costs917354948477
Private health plans must cover preventive care for children, including vaccinations, with no out-of-pocket costs907457948473
Private health insurance companies cannot charge women more than men for the same policy837359928381
Private health plans must cover the cost of birth control with no out-of-pocket costs623931795738

A large majority of the public (89 percent) also supports the ACA’s requirement that all private health plans must include coverage for maternity care,  including 86 percent of Republicans and 94 percent of Democrats.

Views on this requirement are somewhat malleable. When those who initially support the requirement are read the argument that it means some people have to pay for benefits they do not use, about a quarter (22 percent of the public overall) change their mind so that 31 percent overall oppose the requirement. Still, a solid majority of 65 percent continues to support the requirement for all private health plans to include coverage for maternity care after this argument is read.

Figure 12: Majority Support Requirement for All Private Health Plans to Include Maternity Care, Even After Hearing Arguments

Buying Insurance Across State Lines

President Trump and Republican leaders in Congress have supported the idea of allowing insurers to sell their plans across state lines as a way to drive down insurance costs, though this provision is not included in the current House repeal and replace legislation.2  Overall, nearly two-thirds of Americans (64 percent) generally favor this proposal while three in ten (28 percent) oppose it. These attitudes are fairly malleable with both those who favor and oppose this policy being persuaded after hearing counter-messages.

Among the 28 percent who originally oppose this policy, four in ten (12 percent of the public overall) change their opinion after hearing that allowing the sale of insurance across state lines could encourage competition and decrease costs for consumers, increasing the total share who favor the policy to 76 percent.

On the other side, among the 64 percent who originally said they favor the policy, about half (30 percent of the public overall) change their opinion after hearing the argument that allowing the sale of insurance across state lines could encourage insurers to operate from states with fewer consumer protections and make it harder for people to get help if they have a problem with their plans, increasing the total share who oppose selling insurance across state lines to 57 percent.

Figure 13: Two-Thirds Favor Allowing Sale of Insurance Across State Lines; Attitudes Are Malleable

Awareness of Key ACA Provisions

As the focus of debate moves away from the ACA itself and on to potential replacement plans, the public’s awareness of what the 2010 health care law actually does is somewhat uneven. While large majorities are aware of many of the ACA’s key provisions, others are less well-known. A large majority of the public is aware that the ACA allows young adults to stay on their parents’ insurance until age 26 (83 percent) and that it requires nearly all Americans to have health insurance or pay a fine (82 percent). Between six and seven in ten are aware the law requires insurance plans purchased by individuals to include a minimum package of benefits (71 percent), that it provides financial help to low-and moderate-income Americans who do not get coverage through an employer (69 percent), that it gives states the option of expanding Medicaid (65 percent), that it prohibits insurers from denying coverage to those with pre-existing conditions (60 percent), and that it requires health insurance plans to cover the cost of children’s preventive services, including immunizations, with no cost-sharing (59 percent).

Smaller shares – about half the public – know that the law eliminates out-of-pocket costs for preventive health care services (53 percent) and birth control (47 percent). Fewer still – 42 percent – are aware that the law prohibits insurance companies from charging women more than men.

Figure 14: Most Are Aware of Key ACA Provisions

At the same time, misconceptions about the law remain. Half (50 percent) incorrectly believe the ACA allows undocumented immigrants to receive financial help from the government to buy health insurance, and four in ten (40 percent) mistakenly think it cuts benefits for people in the traditional Medicare program.

Methodology

This Kaiser Health Tracking Poll was designed and analyzed by public opinion researchers at the Kaiser Family Foundation (KFF). The survey was conducted March 6-12, 2017, among a nationally representative random digit dial telephone sample of 1,206 adults ages 18 and older, living in the United States, including Alaska and Hawaii (note: persons without a telephone could not be included in the random selection process). Computer-assisted telephone interviews conducted by landline (421) and cell phone (785, including 465 who had no landline telephone) were carried out in English and Spanish by Princeton Data Source under the direction of Princeton Survey Research Associates International (PSRAI). Both the random digit dial landline and cell phone samples were provided by Survey Sampling International, LLC. For the landline sample, respondents were selected by asking for the youngest adult male or female currently at home based on a random rotation. If no one of that gender was available, interviewers asked to speak with the youngest adult of the opposite gender. For the cell phone sample, interviews were conducted with the adult who answered the phone. KFF paid for all costs associated with the survey.

The combined landline and cell phone sample was weighted to balance the sample demographics to match estimates for the national population using data from the Census Bureau’s 2015 American Community Survey (ACS) on sex, age, education, race, Hispanic origin, and region along with data from the 2010 Census on population density. The sample was also weighted to match current patterns of telephone use using data from the January-June 2016 National Health Interview Survey. The weight takes into account the fact that respondents with both a landline and cell phone have a higher probability of selection in the combined sample and also adjusts for the household size for the landline sample. All statistical tests of significance account for the effect of weighting.

The margin of sampling error including the design effect for the full sample is plus or minus 3 percentage points. Numbers of respondents and margins of sampling error for key subgroups are shown in the table below. For results based on other subgroups, the margin of sampling error may be higher. Sample sizes and margins of sampling error for other subgroups are available by request. Note that sampling error is only one of many potential sources of error in this or any other public opinion poll. Kaiser Family Foundation public opinion and survey research is a charter member of the Transparency Initiative of the American Association for Public Opinion Research.

GroupN (unweighted)M.O.S.E.
Total1206±3 percentage points
Half Sample A609±5 percentage points
Half Sample B597±5 percentage points
Party Identification
   Democrats437±6 percentage points
   Republicans285±7 percentage points
   Independents377±6 percentage points
Gender
   Male616±5 percentage points
   Female590±5 percentage points

Endnotes

  1. C Cox, G Claxton, L Levitt, How Affordable Care Act Repeal and Replace Plans Might Shift Health Insurance Tax Credits. https://modern.kff.org/health-reform/issue-brief/how-affordable-care-act-repeal-and-replace-plans-might-shift-health-insurance-tax-credits/   ↩︎
  2. The ACA actually includes a provision allowing nongroup insurance plans to be offered in more than one state under interstate compacts. For more information, see Levitt, L, JAMA Forum: Those Pesky Lines Around States, October 2016. https://newsatjama.jama.com/2016/10/19/jama-forum-those-pesky-lines-around-states/   ↩︎

How Affordable Care Act Repeal and Replace Plans Might Shift Health Insurance Tax Credits

Published: Mar 10, 2017


Related: Interactive maps provide county-level comparisons of tax credits under the Affordable Care Act and the House GOP’s American Health Care Act.

Note: As of May 4, 2017, the American Health Care Act would allow states to waive certain consumer protections, including essential health benefits, community rating and age rating. If a state takes up such a waiver, the premium amounts for that state in this brief would no longer be applicable. For example, enrollee costs could depend on their health status, with healthy people paying less and sicker people or those with pre-existing conditions paying more.

An important part of the repeal and replacement discussions around the Affordable Care Act (ACA) will involve the type and amount of subsidies that people get to help them afford health insurance.  This is particularly important for lower and moderate income individuals who do not have access to coverage at work and must purchase coverage directly.

The ACA provides three types of financial assistance to help people afford health coverage: Medicaid expansion for those with incomes below 138% of poverty (the Supreme Court later ruled this to be at state option); refundable premium tax credits for people with incomes from 100% to 400% of the poverty level who purchase coverage through federal or state marketplaces; cost-sharing subsidies for people with incomes from 100% to 250% of poverty to provide lower deductibles and copays when purchasing silver plans in a marketplace.

This analysis focuses on alternative ways to provide premium assistance for people purchasing individual market coverage, explaining how they work, providing examples of how they’re calculated, and presenting estimates of how assistance overall would change for current ACA marketplace enrollees.  Issues relating to changing Medicaid or methods of subsidizing cost-sharing will be addressed in other analyses.

Premium Tax Credits Under the ACA and Current Replacement Proposals

The ACA and leading replacement proposals rely on refundable tax credits to help individual market enrollees pay for premiums, although the credit amounts are set quite differently.  The House Leadership proposal released on March 6, the American Health Care Act, proposes refundable tax credits which vary with age (with a phase-out for high-income enrollees) and grow annually with inflation.  The tax credits under the ACA vary with family income and the cost of insurance where people live, as well as age, and grow annually if premiums increase.

These various tax credit approaches can have quite different implications for different groups of individual market purchasers.  For example, the tax credits under the ACA are higher for people with lower incomes than for people with higher incomes, and no credit is provided for individuals with incomes over 400% of poverty.  The current replacement proposal, in contrast, is flat for incomes up to $75,000 for an individual and $150,000 for a married couple, and so would provide relatively more assistance to people with upper-middle incomes.  Similarly, the ACA tax credits are relatively higher in areas with higher premiums (like many rural areas), while the replacement proposal credits do not vary by location.  If premiums grow more rapidly than inflation over time (which they generally have), the replacement proposal tax credits will grow more slowly than those provided under the ACA.

What is a Tax Credit, and How is it Different from a Deduction?

A tax credit is an amount by which a taxpayer can reduce the amount they owe in federal income tax; for example, if a person had a federal tax bill of $2,500 and a tax credit of $1,000, their tax liability would be reduced to $1,500.  A refundable tax credit means that if the amount of the tax credit is greater than the amount of taxes owed, the taxpayer receives a refund of the difference; for example, if a person had a federal tax bill of $1000 and a tax credit of $1,500, they would receive a refund of $500.  Making the credit refundable is important if a goal is to assist lower-income families, many of whom may not owe federal income tax. An advanceable tax credit is made available at the time a premium payment is owed (which similarly benefits lower-income families so that they can receive the financial assistance upfront). The ACA and a number of replacement proposals allow for advance payment of credits.

A tax credit is different from a tax deduction.  A deduction reduces the amount of income that is taxed, while a credit reduces the amount of tax itself.  For example, if a person has taxable income of $30,000, a $500 deduction reduces the amount of taxable income to $29,500.  If the person’s marginal tax rate is 15%, the deduction reduces the person’s taxes by 15% of $500, or $75. Because people with lower incomes have lower marginal tax rates than people with higher incomes – and, typically don’t itemize their deductions – tax credits are generally more beneficial to lower income people than deductions.

The next section describes the differing tax credit approaches in more detail and draws out some of the implications for different types of purchasers.

How the Different Tax Credits Are Calculated

The ACA provides tax credits for individuals with family incomes from 100% to 400% of poverty ($11,880 to $47,520 for a single individual in 2017) if they are not eligible for employer-provided or public coverage and if they purchase individual market coverage in the federal or a state marketplace.  The tax credit amounts are calculated based on the family income of eligible individuals and the cost of coverage in the area where the live. More specifically, the ACA tax credit for an eligible individual is the difference between a specified percentage of his or her income (Table 1) and the premium of the second-lowest-cost silver plan (referred to as the benchmark premium) available in the area in which they live.  There is no tax credit available if the benchmark premium is less than the specified percentage of income (which can occur for younger purchasers with relatively higher incomes) or if family income falls outside of the 100% to 400% of poverty range.  For families, the premiums for family members are added together (including up to 3 children) and compared to specified income percentages. ACA tax credits are made available in advance, based on income information provided to the marketplace, and reconciled based on actual income when a person files income taxes the following.

Table 1: Affordable Care Act Tax Credit Premium Cap, by Income in 2017
Income % PovertyPremium Cap (maximum % of income one must pay for second-lowest silver plan available to in their area)
Under 100%No Cap
100% – 133%2.04%
133% – 150%3.06% – 4.08%
150% – 200%4.08% – 6.43%
200% – 250%6.43% – 8.21%
250% – 300%8.21% – 9.69%
300% – 400%9.69%
Over 400%No Cap
Source: Kaiser Family Foundation

Take, for example, a person age 40 with income of $30,000, which is 253% of poverty.  At this income, the person’s specified percentage of income is 8.28% in 2017, which means that the person receives a tax credit if he or she has to pay more than 8.28% of income (or $2,485 annually) for the second-lowest-cost silver premium where he or she lives.  If we assume a premium of $4,328 (the national average benchmark premium for a person age 40 in 2017), the person’s tax credit would be the difference between the benchmark premium and the specified percentage of income, or $4,328 – $2,485 = $1,843 (or $154 per month).

The American Health Care Act takes a simpler approach and specifies the actual dollar amounts for a new refundable tax credit that could be used to purchase individual market coverage.  The amounts vary only with age up until an income of $75,000 for a single individual, at which point they begin to phase out. Tax credits range from $2,000 for people under age 30, to $2,500 for people ages 30 to 39, $3,000 for people age 40 to 49, $3,500 for people age 50 to 59, and $4,000 for people age 60 and over starting in 2020. Eligibility for the tax credit phases out starting at income above $75,000 for single individuals (the credit is reduced, but not below zero, by 10 cents for every dollar of income above this threshold, reaching zero at an income of $95,000 for single individuals up to age 29 or $115,000 for individuals age 60 and older). For joint filers, credits begin to phase out at an income of $150,000 (the tax credit is reduced to zero at an income of $190,000 for couples up to age 29; it is reduced to zero at income $230,000 for couples age 60 or older; and it is reduced to zero at income of $290,000 for couples claiming the maximum family credit amount). People who sign up for public programs such as Medicare, Medicaid, public employee health benefit programs, would not be eligible for a tax credit. The proposal further limits eligibility for tax credits to people who do not have an offer available for employer-provided health benefits.

Table 2 shows how projected ACA tax credits in 2020 compare to what would be provided under the American Health Care Act for people at various incomes, ages, and geographic areas. To show the ACA amounts in 2020, we inflated all 2017 premiums based on projections for direct purchase spending per enrollee from the National Health Expenditure Accounts. This method applies the same premium growth across all ages and geographic locations.  Note that the table does not include cost-sharing assistance under the ACA that lowers deductibles and copayments for low-income marketplace enrollees. For example, in 2016, people making between 100 – 150% of poverty enrolled in a silver plan on healthcare.gov received cost-sharing assistance worth $1,440; those with incomes between 150 – 200% of poverty received $1,068 on average; and those with incomes between 200 – 250% of poverty received $144 on average.

Table 2: Projected Annual Premium Tax Credit available in the Individual Market under the Affordable Care Act and the American Health Care Act, 2020
Income (2020 FPL)AgeAffordable Care ActAmerican Health Care Act
Reno, NVUS AverageMobile, ALReno, NVUS AverageMobile, AL
$20,000 (160% FPL)27$2,899$3,225$4,522$2,000$2,000$2,000
40$3,745$4,143$5,725$3,000$3,000$3,000
60$9,030$9,874$13,235$4,000$4,000$4,000
$40,000 (320% FPL)27$0$103$1,400$2,000$2,000$2,000
40$623$1,021$2,603$3,000$3,000$3,000
60$5,908$6,752$10,113$4,000$4,000$4,000
$75,000 (600% FPL)27$0$0$0$2,000$2,000$2,000
40$0$0$0$3,000$3,000$3,000
60$0$0$0$4,000$4,000$4,000
$100,000 (800% FPL)27$0$0$0$0$0$0
40$0$0$0$500$500$500
60$0$0$0$1,500$1,500$1,500
Source: Kaiser Family Foundation analysis. Notes: In the 2017 ACA exchange markets, premiums in Reno, NV and Mobile, AL are approximately representative of the 25th and 75th percentile, respectively. 2017 ACA premiums were increased according to National Health Expenditure projections for direct purchase. Under the ACA, people with incomes below 250% of the poverty level receive additional financial assistance for cost-sharing (not shown above).

Under the ACA in 2020, we project that a typical 40-year-old making $20,000 per year would be eligible for $4,143 in premium tax credits (not including the additional cost-sharing subsidies to lower his or her deductibles and copayments), while under the American Health Care Act, this person would be eligible $3,000. For context, we project that the average ACA premium for a 40-year-old in 2020 would be $5,101 annually (meaning the tax credit in the ACA would cover 81% of the total premium) for a benchmark silver plan with comprehensive benefits and reduced cost-sharing. A $3,000 tax credit for this same individual under the American Health Care Act would represent 59% of the average 40-year-old benchmark silver premium under the ACA.

Generally, the ACA has higher tax credit amounts than the replacement plan for lower-income people – especially for those who are older and live in higher-cost areas – and lower credits for those with higher incomes. Unlike the ACA, the replacement plan provides tax credits to people over 400% percent of the poverty level (phasing out around 900% of poverty for a single person), as well as to people current buying individual market coverage outside of the marketplaces (not included in this analysis).

While replacement plan tax credits vary by age – by a factor of 2 to 1 for older adults relative to younger ones – the variation is substantially less than under the ACA. The big differences in ACA tax credits at different ages is due to the fact that premiums for older adults can be three times the level of premiums for younger adults under the ACA, but all people at a given income level are expected to pay the same percentage of their income towards a benchmark plan. The tax credit fills in the difference, and this amount is much higher for older adults. These differences by age would be even further magnified under the American Health Care Act (which permits premiums to vary by a factor of 5 to 1 due to age). Before the ACA, premiums for older adults were typically four or five times the premiums charged to younger adults.

Figure 1: How House Republicans’ health reform plan might shift average health insurance tax credits, based on income and age, in 2020

The tax credits in the ACA vary significantly with premium costs in an area (see Table 2 and Figure 2). At a given income level and age, people receive bigger tax credits in a higher premium area like Mobile, Alabama and smaller tax credits in a lower premium area like Reno, Nevada. Under the ACA in 2017, premiums in Mobile, Alabama and Reno, Nevada approximately represent the 75th and 25th percentile, respectively.

The disparities between the ACA tax credits and those in the American Health Care Act will therefore vary noticeably across the country. For more on geographic differences between the ACA and the replacement plan, see Tax Credits under the Affordable Care Act vs. the American Health Care Act: An Interactive Map.

Figure 2: How House Republicans’ health reform plan might shift health insurance tax credits for a 40-year-old, by income & geography, 2020

The same general pattern can be seen for families as individuals, with lower-income families – and particularly lower-income families in higher-cost areas – receiving larger tax credits under the ACA, while middle-income families in lower-cost areas would receive larger tax credits under the American Health Care Act (Figure 3).

Figure 3: How House Republicans’ health reform plan might shift health insurance tax credits for a family of four, by income & geography, 2020

Figure 4 below shows how tax credits under the ACA differ from those in the American Health Care Act for a couple in their 60’s with no children. In this scenario, because premiums for older adults are higher and the ACA ties tax credits to the cost of premiums, a 60-year-old couple would receive larger tax credits under the ACA than the American Health Care Act at lower and middle incomes, but would receive a larger tax credit under the American Health Care Act at higher incomes.

Figure 4: How House Republicans’ health reform plan might shift health insurance tax credits for a 60-year-old couple, by income & geography, 2020

Estimates of Tax Credits Under the ACA and the American Health Care Act Over Time

We estimated the average tax credits that current ACA marketplace enrollees are receiving under the ACA and what they would qualify for if the American Health Care Act were in place.

Table 3: Average Annual Premium Tax Credit for Current Marketplace Enrollees under the Affordable Care Act (ACA) and the American Health Care Act 3-year, 5-year, and 10-year projections
 YearAffordable Care ActAmerican Health Care ActChange from ACA
2020 (3 years)$4,615$2,957-36%
2022 (5 years)$5,342$3,160-41%
2027 (10 years)$6,648$3,729-44%
Source: Kaiser Family Foundation analysis of data from Healthcare.gov, state-based exchanges, and Congressional Budget Office. Note: Amounts above represent the average tax credit received based on the age distribution of current Marketplace enrollees.

The average estimated tax credit received by ACA marketplace enrollees in 2017 is $3,617 on an annual basis, and that this amount will rise to $4,615 by 2020 based on projected growth rates from the Congressional Budget Office. This includes the 81% who receive premium subsidies as well as the 19% who do not.

We estimate – based on the age distribution of marketplace enrollees – that current enrollees would receive an average tax credit under the American Health Care Act of $2,957 in 2020, or 36% less than under the ACA (see Table 3 and Figure 3). While many people would receive lower tax credits under the Affordable Health Care Act, some would receive more assistance, notably the 19% of current marketplace enrollees who do not qualify for ACA subsidies.

Figure 5: Over time, the average tax credit received under Republican replacement plans would grow slower than under the ACA

While ACA tax credits grow as premiums increase over time, the tax credits in the American Health Care Act are indexed to inflation plus 1 percentage point. Based on CBO’s projections of ACA tax credit increases and inflation, the disparity between the average credits under the ACA and the two replacement plans would widen over time. The average tax credit current marketplace enrollees would receive under the American Health Care Act would be 41% lower than under the ACA in 2022 and 44% lower in 2027.

Discussion

Like the ACA itself, the American Health Care Act includes refundable tax credits to help make premiums more affordable for people buying their own insurance. This might seem like an area where a replacement plan could preserve a key element of the ACA. However, the tax credits are, in fact, structured quite differently, with important implications for affordability and which groups may be winners or losers if the ACA is repealed and replaced.

For current marketplace enrollees, the American Health Care Act would provide substantially lower tax credits overall than the ACA on average. People who are lower income, older, or live in high premium areas would be particularly disadvantaged under the American Health Care Act. People with incomes over 400% of the poverty level – including those buying individual market insurance outside of the marketplaces – do not get any financial assistance under the ACA but many would receive tax credits under the replacement proposal.

The underlying details of health reform proposals, such as the size and structure of health insurance tax credits, matter crucially in determining who benefits and who is disadvantaged