What Could a Medicaid Per Capita Cap Mean for Low-Income People on Medicare?

Authors: Gretchen Jacobson, Tricia Neuman, and MaryBeth Musumeci
Published: Mar 24, 2017

Issue Brief

Key Take-Aways

  • Medicaid is now jointly financed as an open-ended shared responsibility between the federal and state governments; the AHCA proposes a major change in financing with a per capita cap
  • The shift to per capita caps would limit federal Medicaid contributions – a change that is likely to have fiscal implications for states and enrollees, including 11 million people with both Medicare and Medicaid
  • The impact on any given state will depend on a number of factors, including the growth in the share of its 85+ (highest cost) population
  • States with costs that exceed the cap for their senior or disabled enrollees would need to find other revenues to maintain coverage, or reduce costs

Policymakers are giving serious consideration to proposals, such as the American Health Care Act (AHCA),1  that would fundamentally change the structure and financing of Medicaid – the federal-state program that provides health coverage for 70 million low-income Americans, including one in five people on Medicare.  Federal financing for Medicaid would be converted to a per capita cap model (such as under the AHCA) or block grant, both of which aim to limit and make more predictable federal spending on Medicaid and provide states more flexibility in their management of Medicaid spending.  Such a change could affect low-income people on Medicare because Medicaid help cover Medicare’s premiums and cost-sharing, and pays for services not covered by Medicare, such as nursing home care.

Under current law, the federal government matches state Medicaid spending at a rate determined by a formula set in statute.  Federal spending increases in response to the rise in the cost of providing care to enrollees, with no limit on total federal contributions.

In contrast, under a block grant or per capita cap model, federal Medicaid spending would rise at a specified growth rate, irrespective of the actual rise in Medicaid spending in a state.  Limits on federal spending could put pressure on states to limit Medicaid spending over time, if Medicaid spending increased faster than the growth in federal contributions, potentially affecting 11 million seniors and people with disabilities on Medicare, who account for a disproportionate share of Medicaid spending.

This brief discusses the potential implications of Medicaid per capita cap or block grant proposals for low-income seniors and people with disabilities on Medicare.  It also describes how the per capita cap model proposed in the AHCA could potentially affect low-income people on Medicare who receive assistance from Medicaid. This brief will be updated as the bill is modified or other pieces of relevant legislation are introduced.

1.  Why could the debate over Medicaid per capita caps or block grants matter for people who are covered by Medicare?

Medicare is a federal program that provides health insurance for 57 million people – 48 million seniors and 9 million younger adults with significant disabilities – but the Medicaid program makes Medicare affordable for the 11 million people on Medicare with very low incomes (6.5 million seniors and 4.6 million people under the age of 65 with significant disabilities).  Medicaid pays Medicare premiums and cost-sharing for 8 million low-income people, and pays Medicare’s premiums (but not cost-sharing) for others.  In addition, Medicaid provides benefits that are not covered by Medicare, such as nursing home care and home and community-based long-term care that would otherwise be unaffordable for seniors with low incomes.  These benefits are specified under Title XIX of the Social Security Act (Medicaid) rather than Title XVIII (Medicare), which is why a change to Medicaid could affect low-income people on Medicare.

Low-income people on Medicare also receive assistance with premiums and out-of-pocket costs for prescription drug plans through the Part D Low-Income Subsidy (LIS) program; however, Part D LIS is financed by Medicare, rather than Medicaid and as a result would not be affected by a Medicaid per capita cap or block grant.

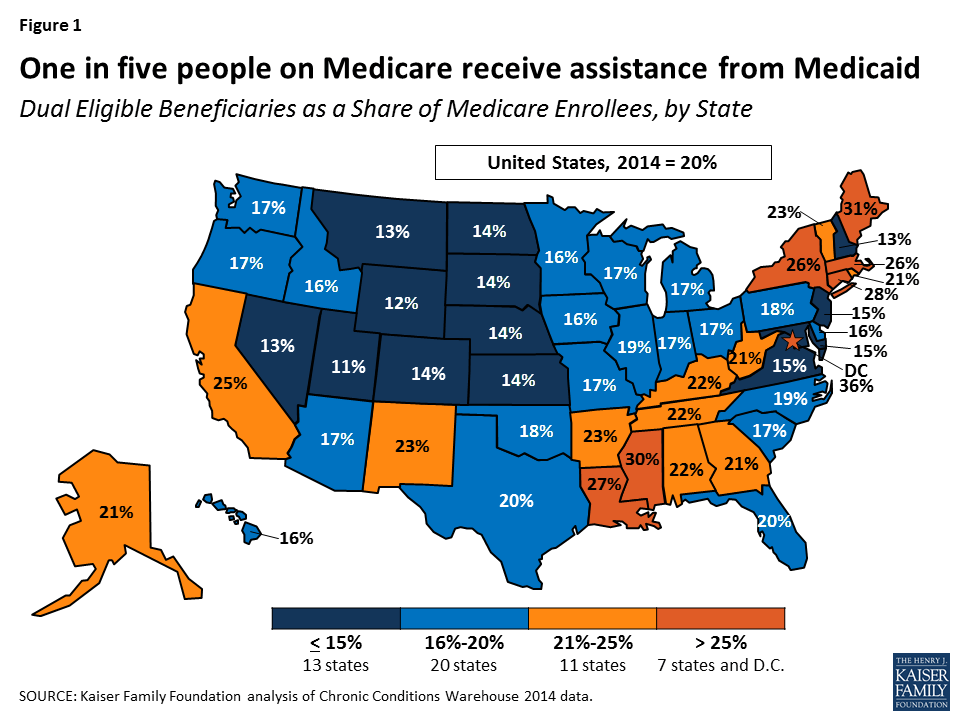
Low-income people on Medicare who receive assistance from Medicaid comprise 15 percent of all people on Medicaid, ranging from 9 percent in Utah to 28 percent in Maine, and comprise 20 percent of all people on Medicare (Figure 1; Table 1).   Federal and state Medicaid spending on low-income people on Medicare totaled $146.9 billion in 2011, most of which (62%) was for long-term care.

Figure 1: One in five people on Medicare receive assistance from Medicaid

A structural change to Medicaid financing could have significant implications for low-income people on Medicare because Medicaid plays a major role in providing and financing benefits to low-income people that Medicare does not cover, and because the cost of their care accounts for a disproportionately large share of Medicaid spending.  Most low-income people on Medicare who receive assistance from Medicaid have incomes below the federal poverty level ($12,060 per year for an individual in 2017) and have little in savings or other assets, and for these people, Medicaid plays an important role in helping to make Medicare more affordable.  For example, premiums for Medicare Part B ($121.80 per month) would comprise 12 percent of the income of someone living at the poverty line in 2017, and this amount does not include the cost-sharing that someone would incur for using Medicare-covered services or the costs of care not covered by Medicare, such as nursing home care.

2.  What are the characteristics of people on Medicare who receive assistance from Medicaid?

By definition, people on Medicare who receive assistance from Medicaid have relatively low incomes, but they also differ from others on Medicare in their demographic composition, medical and long-term care needs, and service utilization.  Women comprise the majority (60%) of all low-income people on Medicare who receive additional assistance from Medicaid (Table 2).  Medicaid also plays an important role for people on Medicare who are younger than age 65 and have a significant disability: half of Medicare’s under-age 65 population receives assistance from Medicaid.  While most people with both Medicare and Medicaid are seniors, about four in ten are under age 65 and qualified for Medicare because of a disability in 2012.

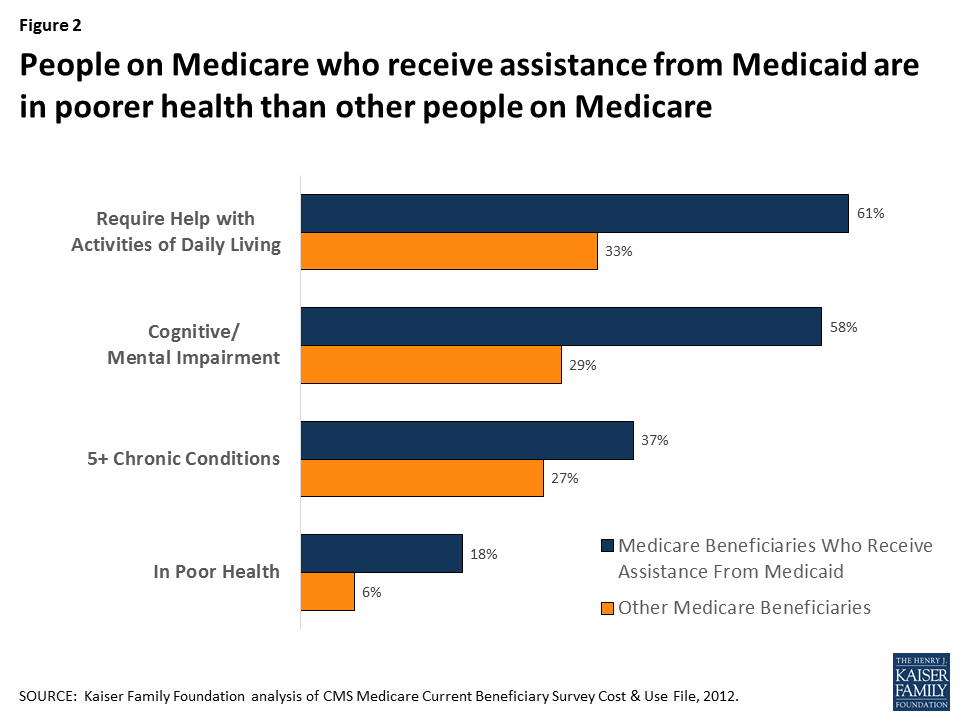
Low-income people on Medicare who receive assistance from Medicaid tend to have more chronic conditions, cognitive limitations and functional limitations than others on Medicare: about six in ten (61%) need assistance with one or more activities of daily living (versus 33% of other people on Medicare), more than half (58%) have a mental condition or cognitive impairment (versus 29%), one-third (37%) have five or more chronic conditions (versus 27%), and about one in six (18%) rate their health status as poor, more than three times the rate among other people on Medicare (6%; Figure 2).

Figure 2: People on Medicare who receive assistance from Medicaid are in poorer health than other people on Medicare

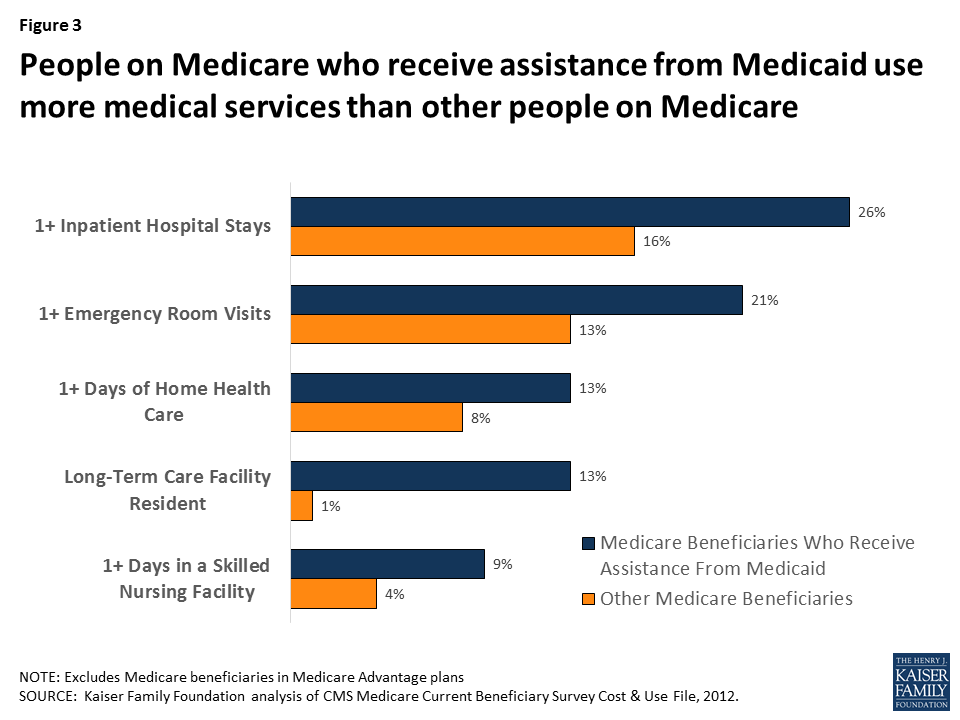
As a result of having greater medical, functional, and cognitive needs, low-income people with both Medicare and Medicaid also use more health care services than others on Medicare, including hospital stays, emergency rooms, home health care and skilled nursing facility stays (Figure 3).  With relatively high rates of cognitive and physical limitations, it is not surprising that a substantially larger share of low-income people on Medicare who receive assistance from Medicaid live in a facility, such as a nursing home or mental health facility (13% versus 1% of other people on Medicare).

Figure 3: People on Medicare who receive assistance from Medicaid use more medical services than other people on Medicare

3.    How does the federal government help to finance Medicaid under current law?

The Medicaid program is jointly financed by the federal government and states.  State spending for eligible beneficiaries and qualifying services is matched by the federal government.  The federal share of Medicaid is determined by a formula set in statute, and is structured so that the federal government pays a larger share of program costs in poorer states.  The formula for federal contributions, known as the Federal Medical Assistance Percentage (FMAP), results in federal contributions that range from 50 percent to 74 percent in 2017.

Under current law, federal contributions increase with the number of people covered and the rise in enrollees’ health and long-term care costs.  The federal government pays more for sicker people with higher health care costs and pays less for healthier people with lower health care costs, as it does with Medicare.  The federal contributions under Medicaid follow state spending and are not capped annually or per person.

4.    How would a per capita cap or block grant change federal financing of Medicaid for low-income people on Medicare?

The idea behind converting Medicaid to a per capita cap or block grant would be to make federal spending for Medicaid more predictable while providing states more flexibility in their management of Medicaid spending.  With a Medicaid per capita cap, such as that proposed in the American Health Care Act (AHCA), the federal government would provide states a fixed amount per Medicaid enrollee, with no limit on the number of people who can enroll in each state’s Medicaid program.  The amount provided by the federal government would be the same amount for each person in a category, irrespective of the person’s actual health care costs, and would be based on the state’s average per capita spending for people in that category in the base year, growing at a specified rate over time.

Under a Medicaid block grant, the federal government would provide states a fixed amount that would not vary by the number of Medicaid enrollees.  Unlike a per capita cap, federal funding for Medicaid under a block grant would not be based on enrollment.  However, similar to a per capita cap, federal funding under a block grant would not vary with the health needs or actual costs of the individuals enrolled in states’ Medicaid programs, and it would be based on average spending in a base year and grow at a specified rate over time.  Importantly, under the AHCA, as amended, states would have the option of receiving a block grant for certain populations, but not for the elderly, blind and disabled.

The AHCA would change federal funding for Medicaid financing to a per capita cap model.  Enrollees would be divided into five categories, with separate allotments for each category: elderly (65+), blind and disabled, children, adults who gained Medicaid coverage as a result of the state’s Medicaid expansion under the ACA, and non-expansion adults.  Each state’s average per person spending in fiscal year 2016 would serve as the base year and would be trended forward to 2019 by the medical care component of the consumer price index (CPI-M).  In future years, the annual per capita allotment would be inflated by CPI-M+1 for the elderly, and blind/disabled populations and by CPI-M for other Medicaid populations.

Federal financing for virtually all Medicaid benefits, including nursing home care, would be included in the allotment under the AHCA, but financing for assistance with Medicare premiums and cost-sharing provided by Medicaid to low-income people on Medicare would appear to continue to be provided as under current law and would not be included in the per capita allotment.  Congress is seeking to pass the AHCA through budget reconciliation, which requires any change to have a budgetary impact.  The bill does not include changes to mandatory Medicaid benefits and coverage groups; such a change might not be allowable under budget reconciliation rules if it did not have a direct impact on the federal budget.  However, it is possible that the Secretary of Health and Human Services could use his authority to provide states more latitude.2 ,3 ,4 

5.  Why might states consider reducing Medicaid spending for low-income people on Medicare?

A potential concern with per capita caps and block grants is that federal funding may not keep pace with state Medicaid programs’ growth in health care costs.  If this concern is borne out, states might feel pressure to consider options for reducing Medicaid spending for seniors and younger people on Medicare with disabilities who account for a disproportionately large share of Medicaid spending.  Although low-income people on Medicare accounted for just 15 percent of the Medicaid population, they accounted for 33 percent of Medicaid spending in 2012.5 

On a per person basis, Medicaid spent $17,540 on each person on Medicare who receives full Medicaid benefits (excluding amounts spent on Medicare premiums), on average, in fiscal year 2011 (Table 3).  For about half of the people with both Medicare and Medicaid, Medicaid spent less than $4,000 per person but Medicaid spending exceeded $40,000 per person for 15 percent of the low-income people on Medicare.

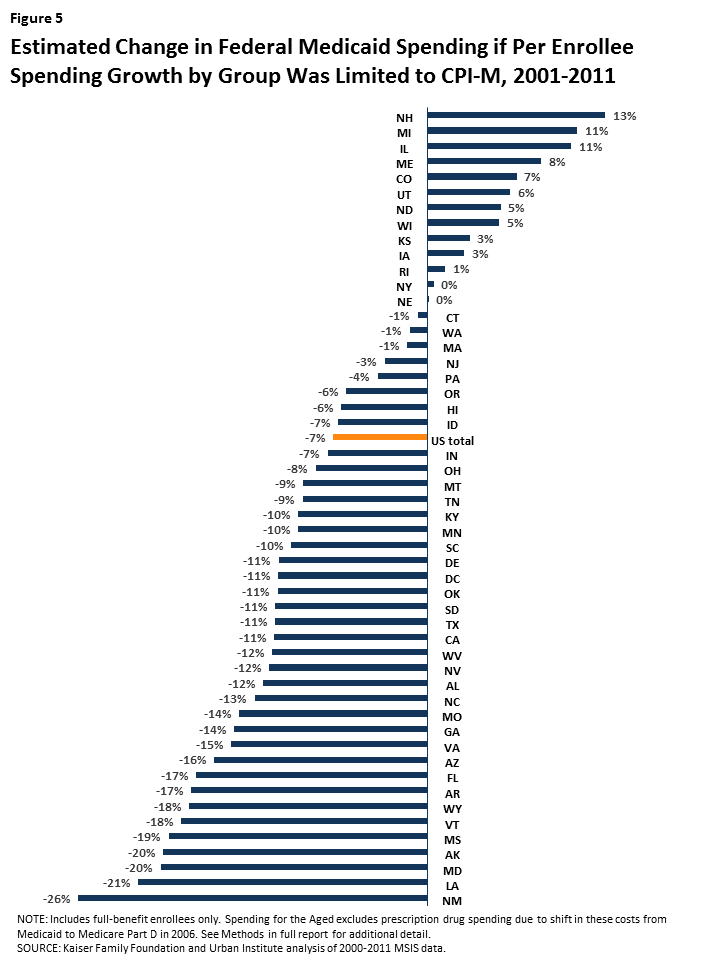
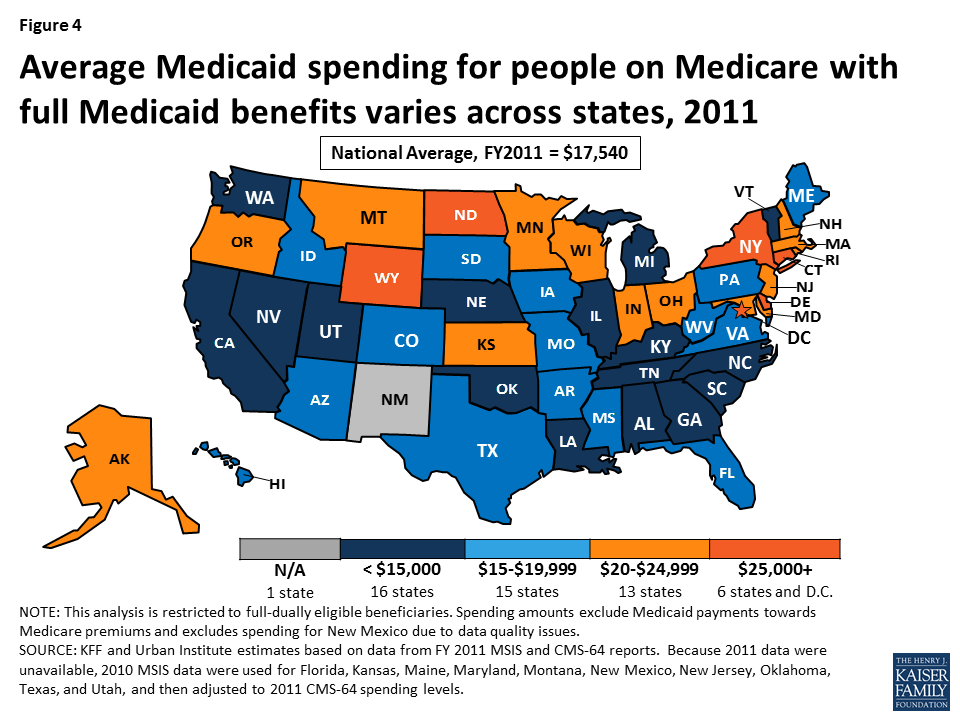
Federal funding under a per capita cap model, such as that in the AHCA, would provide allotments based on states’ average Medicaid spending in the base year, which in 2011, ranged from a low of $10,607 (SC) to $32,051 (WY) for people on Medicare (Figure 4; Table 3). However, a per capita cap model would also lock-in variation in spending across states that may or may not persist in the future.  States that are able to reduce their average Medicaid expenditures over time for seniors and younger adults with disabilities may be able to achieve savings under the per capita cap approach, while states that already adopted strategies to reduce average spending per enrollee may have fewer opportunities to achieve savings in the future.  Additionally, states that incur higher average costs over time due, for example, to a rapidly aging population, may need to find other sources of revenue or reduce costs under a per capita cap model, possibly by reducing provider payments or eliminating coverage for optional services or populations.

Figure 4: About one-quarter of low-income people on Medicare receiving assistance from Medicaid are in Medicare Advantage plans

6. What potential changes could states make under a per capita cap or block grant that could affect low-income people on Medicare?

The possible effects of Medicaid per capita cap or block grant proposals on low-income people on Medicare would vary depending on the details of the proposal.  States could, for example, decide to scale-back or eliminate optional services, such as dental care, vision care, and home and community-based services (HCBS), just as they can under current law in the absence of a Medicaid per capita cap or block grant.  While some proposals would explicitly require states to maintain coverage of mandatory services, such as nursing home care, other proposals would provide states more flexibility with regard to which services to cover.  The AHCA would not change the services that states are required to cover for seniors and people with disabilities.  Such a change to mandatory services might not be allowable under budget reconciliation rules if it did not have a direct impact on the federal budget.6 ,7 ,8 

In addition to scaling back optional benefits, states could restrict the eligibility criteria for populations that they are not required to cover.  Under current law, states are required to provide Medicaid assistance to all who qualify for Supplemental Security Income (SSI) or the Medicare Savings Programs (MSPs),9  and have the option to also provide coverage to other groups of people with low-incomes, which many states have opted to do.  For example, in 2015, 44 states covered people who need long-term care and have incomes up  to 300 percent of the SSI level (225% of the federal poverty level) through the special income rule.  To reduce state Medicaid spending, these states could opt to not cover these optional populations, which would result in fewer people qualifying for Medicaid long-term care coverage.

The AHCA would appear to retain current law financing for Medicare premiums and cost-sharing assistance, with the federal government providing matching funds under the current formula for this assistance.  This separate financing structure provides less of a financial incentive for states to scale back premium or cost-sharing assistance relative to other proposals that would incorporate these benefits into a per capita cap or block grant.  If states pared back these benefits, people with low-incomes could have difficulty affording Medicare. 

7.  How could a Medicaid per capita cap or block grant affect federal spending on Medicare?

A Medicaid per capita cap or block grant would not directly affect federal Medicare spending for low-income people on Medicare, which totaled $187 billion in 2012.10   Low-income people on Medicare would still be entitled to all services covered under Medicare Parts A and B, as well as prescription drug coverage under Medicare Part D, including assistance under the Part D LIS program.

However, a Medicaid per capita cap or block grant could have ripple effects that indirectly affect low-income people’s use of Medicare-covered services and Medicare spending, if federal funding for Medicaid does not keep pace with health care costs, or states look to reduce spending for other reasons.  If states scaled back optional benefits, or tightened eligibility for optional populations, costs could be shifted to low-income seniors and people with significant disabilities.  Similarly, if states reduced cost-sharing assistance by tightening eligibility for the Medicare Savings Programs, for example, then low-income people on Medicare who no longer qualify for cost-sharing assistance might go without needed care or postpone treatment due to cost concerns.

Given their low-incomes, people with both Medicare and Medicaid may not be able to shoulder these costs and instead forgo needed care or postpone treatments.  Higher cost-sharing requirements for low-income people, in the short-term, could lead to reductions in service utilization and lower Medicare spending, but could also result in higher rates of preventable hospitalizations and emergency room visits down the road – expensive services covered by Medicare.

Additionally, if more people become uninsured prior to going on Medicare as a result of changes made to Medicaid, Medicare spending could rise.  Research has shown that people who are uninsured prior to going on Medicare use more health care services and incur higher Medicare spending once they are on Medicare, than if they had health insurance before going onto Medicare.11 

8.  How could a Medicaid per capita cap or block grant affect providers that serve people with both Medicare and Medicaid?

It is not clear how Medicaid payments to health care providers on behalf of low-income people on Medicare would change under a Medicaid per capita cap or block grant.  Under a Medicaid per capita cap or block grant, states could be under financial pressure to reduce provider payment rates, to the extent that they able to do so, if federal funding for Medicaid does not keep pace with health care cost growth or states otherwise need to reduce Medicaid spending.  Reductions in provider payment rates could directly affect the providers that treat low-income people on Medicare who receive assistance from Medicaid, particularly nursing homes and other providers of long-term services and supports for whom Medicaid is a primary source of revenue.

Reductions in payment rates could also affect providers who accept Medicaid payments as cost-sharing for Medicare services, including hospitals, physicians, health centers, and clinics.  Today, many states pay less to providers than the total amount of due for Medicare cost-sharing since states are only required to pay the amount that would have been paid if Medicaid covered the service instead of Medicare, and Medicaid payments to providers are often lower than Medicare payments.

9.  How could a Medicare per capita cap or block grant affect Medicare private plans and people enrolled in the plans?

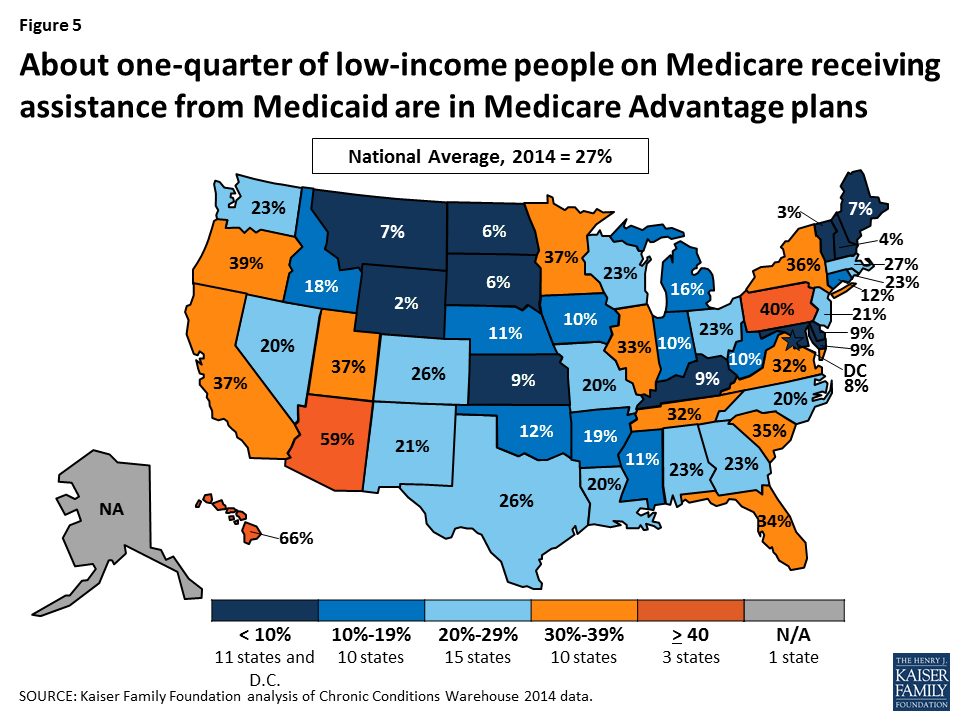
A Medicaid per capita cap or block grant could potentially affect Medicare Advantage plans that, as of 2014, provided benefits to as many as 3 million low-income people on Medicare who were also covered by Medicaid (Figure 5).  This includes 2.3 million enrollees who receive assistance from Medicaid with premiums only and 0.7 million who are eligible for cost-sharing assistance and other Medicaid benefits.  Similarly, a per capita cap or block grant could affect Medicare Part D drug plans and their enrollees.

Figure 5: About one-quarter of low-income people on Medicare receiving assistance from Medicaid are in Medicare Advantage plans

If states under fiscal pressure respond by reducing the number of people on Medicare who would be eligible for Medicaid assistance, then federal payments to Medicare Advantage and Medicare Part D drug plans could decline.  The capitated payments received by Medicare Advantage and Part D plans under current law are adjusted for the health status of the plans’ enrollees, with an automatic bump up in payments for enrollees who qualify for assistance from Medicaid.  This payment bump is intended to help compensate plans for these enrollees’ typically higher than average Medicare spending, and higher spending than can be explained by their health conditions.  If fewer Medicare Advantage and Part D enrollees were eligible for Medicaid, then plans would not receive the increase in payments for these enrollees, which would reduce federal payments to plans and could weaken the incentives for plans to enroll low-income people. 

10.  How could the effect of a per capita cap or block grant for low-income people on Medicare vary across states?

If federal payments to states for Medicaid are modified through a per capita cap or block grant, some states could face greater challenges than others in meeting the needs of an aging population, depending on state changes in demographics, population needs, and the growth in health and long-term care costs.  Neither a per capita cap nor block grant model would take into account changes in the specific health and long-term care needs of a given state’s population.  As a consequence, both models would likely have different effects across states.

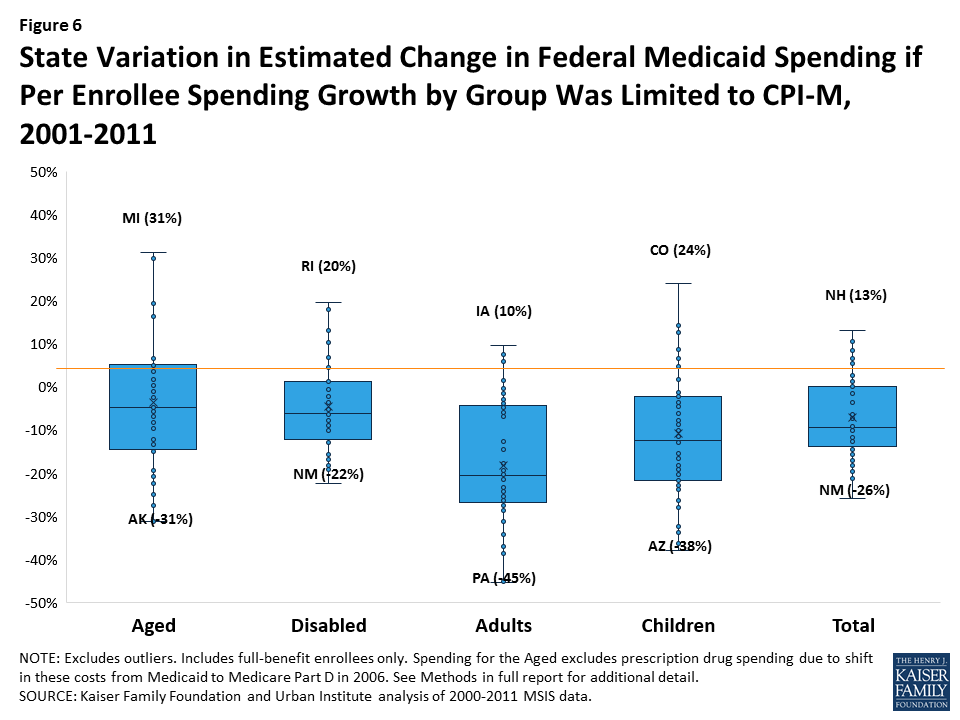
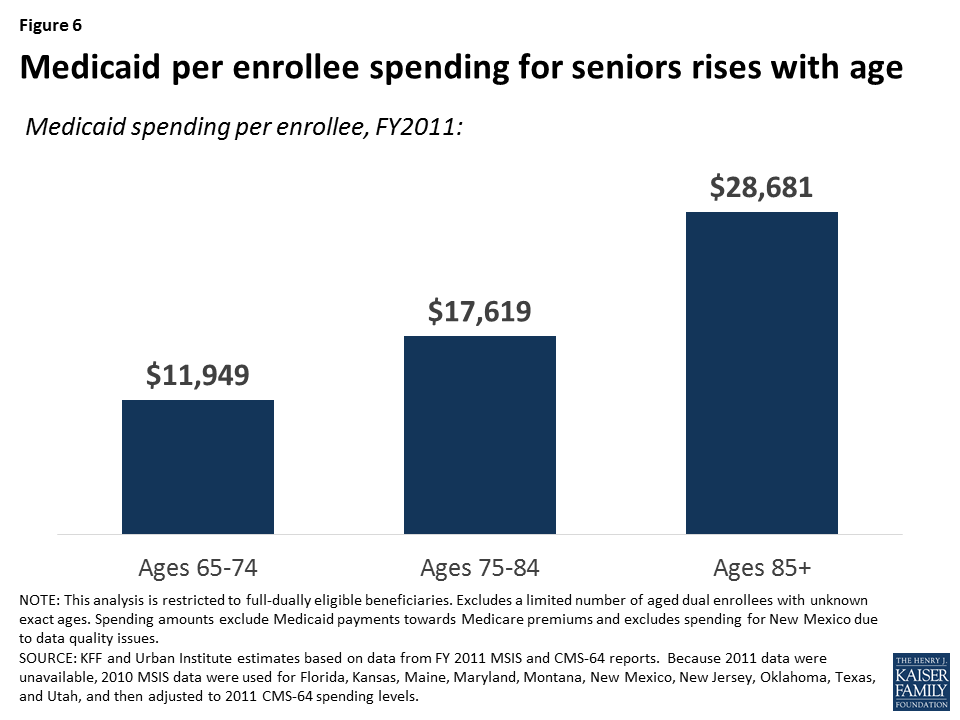
The impact on a given state could depend on a number of factors, including changes in the demographics and mix of high-cost versus low-cost enrollees since the per enrollee payment would be based on average costs in the base year.  For example, under either a Medicaid per capita cap or block grant model, states with a growing share of high-cost enrollees (e.g., nursing home residents) could face more fiscal pressure than states with relatively low average costs, and the former states may need to find other funds to maintain benefits or reduce Medicaid spending if they have trouble covering their Medicaid costs.  The aging of seniors on Medicaid, in particular, could affect how states fare under a per capita cap or block grant because average Medicaid costs rise with age – with costs for seniors ages 85 and older more than two-times larger  than for younger seniors between the ages of 65 and 74, on average (Figure 6).

Figure 6: Medicaid per enrollee spending for seniors rises with age

The impact of a block grant or per capita cap would also depend on underlying costs drivers that may vary across states.  For example, states that experience a relatively rapid increase in labor costs (e.g., for nurses and home care workers) may have greater difficulty absorbing costs than other states, if federal contributions are capped.   The effect for any given state would also vary with the growth in average health care and long-term care costs per person, and states in which Medicaid costs grow relatively rapidly would be more challenged than other states to find the resources to care for their residents.

This issue brief was funded in part by The Retirement Research Foundation.

Appendix

Table 1: Number of People on Medicare receiving assistance from Medicaid, by type of assistance and by state, 2014*
StateTotal low-income people on Medicare who receive assistance from Medicaid% of people with both Medicare and Medicaid receiving premium and cost-sharing assistance, and other Medicaid benefits% of people with both Medicare and Medicaid receiving premium assistance only% of people with both Medicare and Medicaid in Medicare Advantage plans% of all Medicare enrollees who receive assistance from Medicaid% of all Medicaid enrollees who are low-income people on Medicare (2011)
United States11,063,74072%15%27%20%15%
Alabama222,74042%27%23%22%20%
Alaska17,42095%4%NA21%11%
Arizona199,18077%21%59%17%12%
Arkansas138,48053%24%19%23%18%
California1,424,50097%2%37%25%11%
Colorado112,22070%13%26%14%10%
Connecticut181,12047%7%12%28%20%
Delaware30,44045%27%9%16%11%
D.C.32,58070%0.2%8%36%10%
Florida819,22049%22%34%20%18%
Georgia330,80046%25%23%21%16%
Hawaii39,86087%12%66%16%13%
Idaho45,98062%19%18%16%15%
Illinois402,62087%10%33%19%12%
Indiana205,58071%6%10%17%14%
Iowa91,92078%11%10%16%15%
Kansas71,54061%18%9%14%17%
Kentucky198,64056%19%9%22%20%
Louisiana218,10056%22%20%27%16%
Maine96,48058%15%7%31%28%
Maryland148,48063%17%9%15%12%
Massachusetts320,92092%8%27%26%17%
Michigan330,84084%13%16%17%12%
Minnesota149,66087%11%37%16%14%
Mississippi172,02050%21%11%30%21%
Missouri199,40078%14%20%17%16%
Montana27,42060%20%7%13%15%
Nebraska45,34088%11%11%14%16%
Nevada60,20051%24%20%13%13%
New Hampshire35,12064%17%4%13%20%
New Jersey229,66087%13%21%15%20%
New Mexico86,00061%12%21%23%12%
New York900,48080%13%36%26%14%
North Carolina345,24076%22%20%19%17%
North Dakota17,54080%11%6%14%19%
Ohio376,04064%16%23%17%15%
Oklahoma124,12081%18%12%18%14%
Oregon128,18063%19%39%17%15%
Pennsylvania469,58081%17%40%18%18%
Rhode Island43,36083%13%23%21%19%
South Carolina164,72083%17%35%17%17%
South Dakota22,88061%18%6%14%16%
Tennessee285,10054%22%32%22%18%
Texas740,94056%19%26%20%13%
Utah39,62083%15%37%11%9%
Vermont30,88072%20%3%23%15%
Virginia204,90065%19%32%15%18%
Washington200,04070%14%23%17%13%
West Virginia93,24058%19%10%21%20%
Wisconsin180,02086%8%23%17%13%
Wyoming12,38062%16%2%12%13%
NOTES: *All data are from 2014 unless otherwise noted.SOURCE: Data from Kaiser Family Foundation analysis of Chronic Conditions Warehouse 2014, except the share of Medicaid enrollees who are low-income people on Medicare, which used Kaiser Family Foundation’s State Health Facts 2011 data.
Table 2: Demographic Characteristics of People on Medicare Who Receive Assistance from MedicaidCompared to Others on Medicare, 2014
DemographicPeople on Medicare who receive assistance from MedicaidOther people on Medicare
AllUnder age 65Ages 65 and older
Number of people 11,063,7404,602,9606,460,78044,618,240
Gender
Female60%52%66%53%
Male40%48%34%47%
Age
Under age 6542%100%N/A10%
65-7428%N/A48%52%
75-8419%N/A32%26%
85 and older12%N/A20%12%
Race
White, non-Hispanic56%60%54%80%
Black, non-Hispanic18%21%16%7%
Hispanic17%13%19%8%
Asian5%2%7%2%
Other4%5%4%3%
SOURCE: Kaiser Family Foundation analysis of the Chronic Conditions Data Warehouse 5 percent sample of Medicare claims for 2014 (number of people, gender, and age) and Medicare Current Beneficiary Survey Cost and Use Files for 2012 (race)
Table 3. Distribution of Medicaid Spending for People Enrolled in Both Medicare and Medicaid, FY2011
Share of Beneficiaries by Medicaid Spending Level
StateEnrollmentTotal Medicaid Spending on ServicesAverage Medicaid Spending per EnrolleeMedian Medicaid Spending per Enrollee<$2,500$2,500-$4,999$5,000-$9,999$10,000-$14,999$15,00-$19,999$20,000-$39,999≥$40,000
United States7,441,812$129,845,614,977$17,540$3,93943.7%9.8%9.6%6.4%4.6%10.8%15.1%
Alabama96,882$1,327,632,854$13,704$1,08560.0%5.4%4.8%4.1%3.1%6.4%16.3%
Alaska14,612$335,901,051$22,988$3,90941.8%12.4%9.6%4.8%3.1%8.8%19.4%
Arizona114,960$1,763,307,549$15,338$4,0278.4%56.4%9.6%2.5%1.0%2.6%19.5%
Arkansas70,122$1,307,331,572$18,644$6,72136.6%9.6%9.3%7.0%5.4%13.6%18.5%
California1,259,402$16,377,204,527$13,004$4,38044.9%6.4%13.4%10.4%7.1%9.5%8.3%
Colorado69,375$1,366,499,536$19,697$6,25232.4%14.8%10.2%6.5%5.4%10.4%20.3%
Connecticut83,209$2,604,800,385$31,304$9,17336.2%7.4%7.4%5.2%4.4%11.5%28.0%
Delaware12,243$321,790,743$26,284$7,12738.1%7.1%9.1%6.1%5.4%8.3%25.8%
D.C.16,228$476,914,052$29,388$6,19339.4%8.3%7.1%3.6%2.9%12.0%26.7%
Florida368,833$5,703,485,693$15,464$1,74355.0%6.5%6.3%4.9%4.1%8.3%14.9%
Georgia155,676$1,876,320,906$12,053$1,47255.0%5.6%6.9%5.9%4.3%10.5%11.9%
Hawaii32,171$546,560,924$16,989$10,0254.5%4.4%40.2%12.2%18.5%7.0%13.1%
Idaho27,158$449,944,335$16,568$5,58540.8%7.8%9.8%8.1%7.2%14.9%11.4%
Illinois324,386$3,561,834,000$10,980$1,49155.0%6.2%7.2%6.0%5.2%14.4%6.2%
Indiana106,651$2,326,994,222$21,819$7,22040.5%5.9%7.3%5.3%3.8%13.5%23.7%
Iowa71,106$1,379,394,968$19,399$7,89930.1%12.5%11.5%8.7%6.6%14.2%16.4%
Kansas48,383$1,012,326,827$20,923$12,17728.8%9.4%8.6%7.2%6.8%20.8%18.3%
Kentucky112,394$1,550,460,641$13,795$2,23158.1%7.5%6.7%4.0%2.8%6.9%14.1%
Louisiana113,030$1,652,547,395$14,620$1,91452.7%5.1%5.2%4.9%5.1%13.8%13.3%
Maine56,217$1,001,899,470$17,822$1,40258.7%7.6%5.9%3.1%2.2%6.3%16.2%
Maryland79,917$1,939,152,798$24,265$6,40339.9%7.6%7.1%5.9%4.6%10.0%24.9%
Massachusetts233,411$5,118,787,400$21,930$2,63447.9%9.8%6.0%3.5%3.6%8.3%21.0%
Michigan248,567$3,420,625,070$13,761$5,39327.8%18.8%26.2%8.1%3.0%4.6%11.6%
Minnesota134,578$3,217,504,196$23,908$13,63223.6%6.5%13.1%8.6%5.0%23.4%19.9%
Mississippi84,255$1,298,322,955$15,409$3,35545.4%10.7%9.5%5.9%4.2%8.8%15.5%
Missouri163,567$2,467,614,937$15,086$4,32943.3%8.5%10.2%7.1%5.4%12.9%12.6%
Montana16,312$361,030,574$22,133$5,52839.6%9.3%7.7%5.0%3.7%11.4%23.3%
Nebraska44,223$615,812,643$13,925$3,11746.7%10.2%8.5%5.3%5.2%12.3%11.8%
Nevada24,248$309,812,196$12,777$2,04652.3%6.9%8.2%6.5%5.9%8.7%11.4%
New Hampshire22,654$550,487,678$24,300$10,22733.5%6.7%9.4%6.4%4.9%14.7%24.3%
New Jersey180,825$3,962,973,189$21,916$4,30038.5%12.8%6.8%5.8%4.5%12.5%19.1%
New Mexico39,079N/AN/AN/AN/AN/AN/AN/AN/AN/AN/A
New York720,924$21,460,518,904$29,768$3,84444.9%7.9%6.7%4.0%2.8%8.2%25.6%
North Carolina259,485$2,898,319,164$11,170$2,87247.7%10.7%13.4%7.1%3.4%9.2%8.4%
North Dakota12,881$389,087,187$30,206$12,57233.3%6.6%7.0%5.7%4.5%10.9%32.0%
Ohio237,235$5,792,329,344$24,416$11,39131.3%7.7%8.8%7.9%5.9%14.1%24.3%
Oklahoma98,462$1,166,731,644$11,850$3,21046.0%10.6%10.5%7.9%5.4%12.6%7.1%
Oregon68,240$1,368,580,769$20,055$4,98426.9%23.1%8.7%6.2%5.2%15.6%14.3%
Pennsylvania366,634$6,744,434,911$18,396$1,90455.9%7.9%4.6%3.7%2.8%7.4%17.8%
Rhode Island35,145$717,216,288$20,407$3,08048.1%6.2%6.9%4.7%3.8%15.8%14.5%
South Carolina137,451$1,457,955,047$10,607$1,23862.3%8.3%6.4%3.9%3.0%6.1%10.0%
South Dakota13,923$228,508,207$16,412$9,19030.6%10.4%10.5%8.1%6.0%24.5%9.9%
Tennessee155,658$2,197,033,243$14,114$3,03841.2%23.9%5.8%4.0%2.7%14.2%8.2%
Texas396,649$6,104,576,387$15,390$6,18330.7%16.0%10.7%6.9%5.9%19.9%10.0%
Utah28,586$428,057,561$14,974$6,38626.2%10.7%35.5%4.8%3.1%6.5%13.3%
Vermont21,042$249,200,762$11,843$4,73438.0%13.3%13.5%7.3%6.2%16.4%5.4%
Virginia127,154$2,062,459,965$16,220$1,92652.9%6.9%6.2%4.5%3.5%11.0%15.1%
Washington132,239$1,932,007,998$14,610$3,12348.2%5.5%7.6%7.1%5.8%14.8%11.0%
West Virginia51,358$902,321,881$17,569$1,36055.1%4.7%5.6%4.1%4.0%9.4%17.1%
Wisconsin146,766$3,306,837,031$22,531$5,53138.7%10.3%6.4%4.0%2.8%8.7%29.1%
Wyoming7,306$234,163,399$32,051$16,38624.6%6.1%9.7%7.7%6.4%14.5%30.9%
NOTES: Spending amounts excludes premiums.  Due to the unavailability of 2011 data, 2010 MSIS data were used for Florida, Kansas, Maine, Maryland, Montana, New Mexico, New Jersey, Oklahoma, Texas, and Utah, and then adjusted to 2011 CMS-64 spending levels. Excludes spending for New Mexico due to data quality issues.SOURCE: KFF and Urban Institute estimates based on data from FY2011 MSIS and CMS-64 reports.

Endnotes

  1. This brief examines the American Health Care Act as voted out of the House of Representatives Energy and Commerce Committee on March 9, 2017, and will be updated as changes to the bill are made. ↩︎
  2. See Letter from Thomas E. Price, Secretary of Health and Human Services, and Seema Verna, Administrator of the Centers for Medicare and Medicaid Services, to Governors on March 14, 2017, available at https://www.hhs.gov/sites/default/files/sec-price-cms-admin-verma-ltr.pdf. ↩︎
  3. The House of Representatives Committee on the Budget passed a motion to express the support of the Committee prior to the consideration of the rule for the American Health Care Act for state flexibility in the design of their Medicaid program on March 16, 2017. ↩︎
  4. Four governors, John Kasich from Ohio, Rick Snyder from Michigan, Brian Sandoval from Nevada, and Asa Hutchinson from Arkansas, send a letter to Majority Leader Mitch McConnell and House Speaker Paul Ryan describing how they believe the AHCA should be changed. ↩︎
  5. Medicare Payment Advisory Commission (MedPAC) and Medicaid and CHIP Payment and Access Commission (MACPAC), “Data book: Beneficiaries dually eligible for Medicare and Medicaid,” January 2017, Exhibit 4. ↩︎
  6. The Administration may be able provide states more latitude.  See Letter from Thomas E. Price, Secretary of Health and Human Services, and Seema Verna, Administrator of the Centers for Medicare and Medicaid Services, to Governors on March 14, 2017, available at https://www.hhs.gov/sites/default/files/sec-price-cms-admin-verma-ltr.pdf. ↩︎
  7. The House of Representatives Committee on the Budget passed a motion to express the support of the Committee prior to the consideration of the rule for the American Health Care Act for state flexibility in the design of their Medicaid program on March 16, 2017. ↩︎
  8. Four governors, John Kasich from Ohio, Rick Snyder from Michigan, Brian Sandoval from Nevada, and Asa Hutchinson from Arkansas, send a letter to Majority Leader Mitch McConnell and House Speaker Paul Ryan describing how they believe the AHCA should be changed. ↩︎
  9. The Medicare Savings Programs provide help for low-income people on Medicare with Medicare’s premiums and cost-sharing. ↩︎
  10. Medicare Payment Advisory Commission (MedPAC) and Medicaid and CHIP Payment and Access Commission (MACPAC), “Data book: Beneficiaries dually eligible for Medicare and Medicaid,” January 2017, Exhibit 3. ↩︎
  11. McWilliams, J. Michael, Ellen Meara, Alan M. Zaslavsky, and John Z. Ayanian, “Medicare Spending for Previously Uninsured Adults,” Annals of Internal Medicine (2009), Dec. 1; 151(11): 757-66. ↩︎
News Release

Brief Examines State Requests to Impose Work Requirements in Medicaid

Published: Mar 24, 2017

The proposed American Health Care Act (AHCA) includes a state option to make Medicaid eligibility for nondisabled, nonelderly, non-pregnant adults conditional upon satisfaction of a work requirement. Although the Centers for Medicare and Medicaid Services denied all state Section 1115 waiver requests to institute such work requirements under the Obama administration, earlier this month the Trump administration signaled in a letter to governors that CMS now would be open to considering such proposals.

A new brief from the Kaiser Family Foundation identifies key policy questions to consider about the impact of work requirements on Medicaid beneficiaries and states. It also highlights which states have sought approval for waiver requests relating to Medicaid work requirements, including both denied and still pending requests before CMS.

News Release

Most States Would Have Seen Declines in Federal Medicaid Funds from 2001 to 2011 Under a Per Enrollee Spending Cap Limiting Growth to Medical Inflation

Published: Mar 24, 2017

A new analysis from the Kaiser Family Foundation finds that the majority of states would have gotten less in federal Medicaid funding from 2001 to 2011 if Medicaid financing had been based on a per capita cap. The analysis looked at what would have happened if spending growth per Medicaid enrollee had been limited to growth in the medical care component of the Consumer Price Index (CPI-M) during that period.

This spending growth limit is not quite the same as some of the limits proposed in the latest public version of the House GOP’s American Health Care Act (AHCA) bill, which would repeal the Affordable Care Act (ACA) and fundamentally change the structure and federal funding of Medicaid. The AHCA would tie growth in federal funding per Medicaid enrollee to the medical CPI (CPI-M) plus one percentage point for the elderly and disabled groups, and limit growth to the CPI-M for children, ACA Medicaid expansion adults and other adults.  It also would allow states to elect a block grant for children and non-disabled adults. This analysis does not examine the specific policy revisions being proposed in the AHCA.

The analysis finds:

  • Over the 2001-2011 period, most states (38) would have experienced a reduction in federal Medicaid funds overall, including more than half (26) that would have seen a drop of 10 percent or more. (See figure below.) About half of states (25) would have seen a decline for each enrollee group (the aged, people with disabilities, children and other adults).
  • The state impact differs by eligibility group. For example, for children, Arizona would have faced a 38 percent drop in federal Medicaid funds but Colorado would have seen a 24 percent gain. For adults, Pennsylvania would have seen a 45 percent drop in federal Medicaid spending compared to a gain of 10 percent in Iowa. For people with disabilities, New Mexico would have lost 22 percent of federal Medicaid funds compared to a gain of 20 percent in Rhode Island. And among the aged, Alaska would have seen a 31 percent decline in federal Medicaid spending compared to a similar size gain in Michigan.

The timeframe for the new analysis is prior to the implementation of the ACA in 2014 and does not capture the differential impact that the AHCA would have in terms of policy or effects on states that adopted the Medicaid expansion. It therefore understates the potential impact of AHCA reductions on the 32 expansion states.

A separate analysis, conducted with the Rockefeller Institute of Government, examines three scenarios that modeled how reductions in federal Medicaid spending would have affected state budgets had they been in effect in fiscal year 2015, and had state officials tried to completely fill the gap with state funding through taxes or cuts in education.

Medcaid spending chart.png

.

Medicaid Restructuring Under the American Health Care Act and Implications for Behavioral Health Care in the US

Authors: Rachel Garfield and Julia Zur
Published: Mar 24, 2017

Issue Brief

Key Takeaways

Medicaid is a major source of coverage and financing for people with behavioral health conditions, and enrollees benefit from a comprehensive array of mandatory and optional services.

  • In 2014, Medicaid covered 20% of adults with mental illness, 24% of adults with serious mental illness, and 16% of adults with substance use disorder.
  • In 2011, average Medicaid spending for people with behavioral health conditions was nearly four times as much as it was for other enrollees ($13,303 vs. $3,564).
  • The ACA’s Medicaid expansion, federal parity rules, and the development of new service delivery models have further facilitated access to behavioral health services for Medicaid enrollees.

The American Health Care Act proposes to end the enhanced federal financing for newly eligible adults and to repeal the requirement that state Medicaid plans cover essential health benefits, which include behavioral health conditions.

  • Because enrollees with behavioral health conditions are some of the costliest enrollees, states may be incentivized to restrict their eligibility in response to pressures to cut costs. This may result in loss of coverage for these enrollees.
  • States may also limit benefit packages and remove many of the optional services that are particularly valuable to enrollees with behavioral health conditions.
  • These changes could lead to decreases in access to behavioral health services, increases in societal costs resulting from untreated behavioral health conditions, and greater uncompensated care costs for providers.

The American Health Care Act also proposes to convert federal Medicaid funding into a per capita cap, with a pre-set growth amount.

  • In response to limited funding, states may impose enrollment caps or waiting lists, reduce eligibility levels, and trim benefit packages. All of these changes could disproportionately impact the costliest enrollees, including those with behavioral health conditions.
  • States may also decrease provider payment rates, which may hinder provider participation in Medicaid and exacerbate the already limited availability of behavioral health providers. Costs may instead be shifted to State Mental Health Agencies.
  • The proposed changes may enable the Department of Health and Human Services to provide additional tools and flexibility to states to respond to emerging health issues, such as the opioid epidemic, and to develop innovative models of care for enrollees with behavioral health conditions. However, with decreased federal funding, states may be limited in their ability to take advantage of this flexibility.

The Medicaid program serves as a safety net for many low-income individuals with behavioral health conditions by facilitating access to and financing numerous clinical and non-clinical services. Medicaid expansion to adults at or below 138% FPL, federal parity rules, and development of new models of service delivery have been particularly beneficial for Medicaid enrollees with behavioral health conditions. These changes have resulted in greater availability of and access to services, better coordinated care, and state savings. The American Health Care Act, released on March 6, 2017, proposes to repeal enhanced federal funding for adults eligible for coverage through the ACA’s Medicaid expansion and to limit federal financing through a per capita cap. On March 13, 2017, the Congressional Budget Office projected that the legislation could reduce federal deficits by $337 billion from 2017-2026 but could cause 14 million people to become uninsured. These projections are largely due to the significant changes to the Medicaid program, which could result in a 25% decrease in Medicaid spending by 2026 and could substantially alter Medicaid’s role for people with behavioral health conditions. This brief reviews Medicaid’s current role for this population and assesses the potential implications of this policy proposal.

Medicaid’s Current Role in Behavioral Health

Medicaid, the federal-state health insurance program for poor and low-income individuals, is a major source of health coverage and financing for behavioral health care in the United States. The Medicaid program covers a disproportionate share of individuals with behavioral health conditions with 20% of adults with any mental illness, 24% of adults with serious mental illness (SMI), and 16% of adults with a substance use disorder (SUD) covered by Medicaid. In comparison, Medicaid covers 19% of adults with any behavioral health condition1  (Figure 1).  Medicaid enrollees generally have more complex health needs than the general population, and the Medicaid program serves as a safety net for many low-income individuals who have limited options for obtaining health insurance coverage.

Figure 1: Medicaid Coverage among Nonelderly Adults with Behavioral Health Conditions, 2014

Medicaid’s behavioral health benefits are generally more comprehensive than other payers’2  and include not only acute care services but also long-term services and supports to enable many people with chronic illness to receive community-based versus institutional care. Some Medicaid services are “mandatory” services that all state must cover under federal law (e.g., hospital services and psychiatric treatment), but many, such as case management, prescription medication, and rehabilitative services, are provided at state option. Flexibility in Medicaid benefits coverage enables states to cover non-clinical behavioral health services, including those that have emerged as evidence-based practices for treating individuals with the greatest impairments (e.g., assertive community treatment (ACT)), and to adapt to changing patterns of care, such as the demand for medication-assisted treatment of opioids (MAT). Medicaid expenditures for behavioral health are significant both to the program and to national spending for behavioral health. Nationally, Medicaid funded 25% of all mental health spending and 21% of SUD funding in 2014.3  In 2011, average Medicaid spending for people with behavioral health conditions was nearly four times as much as it was for other enrollees ($13,303 vs. $3,564), and enrollees with behavioral health conditions accounted for 48% of Medicaid spending4  (Figure 2).

Figure 2: Medicaid Spending on Enrollees with Behavioral Health Conditions, 2011

Medicaid coverage has expanded considerably with the passage of the Affordable Care Act and other policy changes, reaching more adults with behavioral health needs. States may now expand Medicaid eligibility to include almost all adults at or below 138% of the federal poverty level (FPL), or $27,821 for a family of three in 2016, and receive enhanced federal funding to finance the cost of this expansion. Traditionally, individuals could only be eligible for Medicaid if they both met income requirements and fell into a “category” of covered people, such as parents of dependent children or individuals with disabilities, which includes a mental illness that qualifies someone for Supplemental Security Income (SSI). These rules excluded many low-income adults without dependent children who had complex health needs, including substance use disorder or other behavioral health conditions, but did not meet criteria for having a disability.  Low-income individuals who were historically ineligible for Medicaid were more likely to be males, non-Hispanic whites, older than age 45, living in the South, and slightly healthier than the Medicaid-eligible population.5  Because they were ineligible for Medicaid coverage and had limited access to other types of coverage, many of these people remained uninsured.

As of January 2017, 31 states and the District of Columbia had expanded Medicaid,6  and 11 million newly eligible adults had gained coverage under these expansions.7  States that expanded Medicaid receive higher federal matching funds for new Medicaid enrollees, known as enhanced Federal Medical Assistance Percentages (FMAP). States must offer a set of benefits for individuals newly eligible for Medicaid, known as “Alternative Benefit Plans” (ABP), which must cover a set of 10 essential health benefits, including mental health and SUD benefits. Numerous studies have documented that the Medicaid expansion has had positive effects on behavioral health services in states that expanded, including increased availability of and access to behavioral health services,8 ,9  decreases in unmet need for behavioral health services among low-income adults,10  better integration of behavioral health and primary care,11  increased mental health services and staffing at safety net facilities,12 ,13  and state savings from enhanced federal matching funds, particularly in behavioral health programs.14  In recent years, state Medicaid programs have also made strides in expanding the scope of benefits and service delivery models in behavioral health, often using state flexibility to design and test new approaches to care.

Federal parity rules also require Medicaid managed care organizations (which deliver care to the majority of Medicaid beneficiaries15 ) to cover behavioral health services at parity, which means that behavioral health services must be covered to the same extent as physical health services. Parity rules apply to several aspects of behavioral health treatment, including cost-sharing, deductibles, and treatment limits,16  with the goal of making behavioral health services accessible and affordable for Medicaid beneficiaries who would otherwise be unable to obtain care. All Medicaid ABPs must cover behavioral services at parity.

Medicaid also has undertaken many service delivery changes that have made behavioral health care more accessible and effective. For example, over a third of states (20) have taken advantage of the “health homes” plan option in Medicaid,17  which enables states to better coordinate care for enrollees with chronic conditions. Most Medicaid health homes programs include beneficiaries with behavioral health conditions (primarily serious mental illness),18  and through this benefit, providers can integrate and coordinate physical health, behavioral health, and long-term services and supports for enrollees. Other Medicaid programs have implemented other strategies to better integrate physical and behavioral health care, including universal screening for both physical and behavioral health conditions and the co-location of services at one facility,19  or expanded the availability of community-based services to help people with mental illness transition out of institutional-based care.20 

Proposed Changes to Medicaid and Implications for Behavioral Health

Some proposals are calling for fundamental changes to the current Medicaid program. On March 6, 2017, the House unveiled the American Health Care Act, which proposes to substantially decrease federal funding for Medicaid enrollees. This decrease would be accomplished by ending the enhanced federal financing for individuals who become eligible because of the ACA’s Medicaid expansion and by converting federal Medicaid funding into a per capita cap. In addition, states would no longer be required to include essential health benefits, which include behavioral health services, in their ABPs.  These changes would begin in 2020.  These changes would likely make it difficult for states to finance and deliver services to residents with mental health and SUDs, increasing the burden on states at a time when systems are already stretched by a growing opioid crisis.

Ending of Enhanced Federal Financing

Ending enhanced federal financing for the Medicaid expansion population may lead to restrictions in eligibility among these enrollees, limiting the number of people who remain eligible for coverage. While some of these people may be able to qualify for the traditional Medicaid program based on having a disability, the process of gaining eligibility through this pathway requires a difficult and lengthy determination, during which individuals may lose coverage for significant amounts of time and may experience worsening symptoms as their conditions go untreated. Furthermore, individuals in the early stages of a potentially disabling condition, who do not yet meet criteria for disability under the Supplemental Security Income (SSI) program, could lose coverage for early intervention services that might forestall entry onto the SSI rolls. Although some individuals who gained coverage during the Medicaid expansion could have qualified for SSI and Medicaid prior to the expansion, qualifying for Medicaid based on income alone allows enrollees to obtain coverage more quickly and seamlessly, 21  which likely encouraged many of these individuals to finally obtain the coverage for which they had been eligible for a long time.

Limiting Medicaid eligibility has implications beyond reductions in Medicaid enrollment. A large body of literature demonstrates that Medicaid coverage helps facilitate access to needed care;22  thus, loss of coverage could lead to decreased access to early intervention and treatment services for behavioral health, which are essential for improving health outcomes. In addition to impacting health outcomes, untreated behavioral health conditions are associated with increased societal costs, which come from greater reliance on the emergency room, greater involvement with the criminal justice system, and loss of productivity resulting from being unable to work.23 ,24 ,25 ,26  Loss of coverage also has potential negative consequences for behavioral health providers, many of whom changed their operations in response to the ACA by, for example, accepting Medicaid and other insurance for the first time, and who saw a significant decline in uncompensated care costs under the ACA.27 

Under the current structure of Medicaid, where the program operates as an entitlement and those with incomes up to 138% FPL are eligible, there are opportunities for states to modify their programs through the waiver process. It is possible that in response to the proposed changes, some states may seek Medicaid waivers to expand coverage. Medicaid waivers provide states an avenue to test new approaches in Medicaid that differ from federal program rules and can provide states considerable flexibility in how they operate their programs, beyond what is available under current law. Existing waivers include provisions not otherwise permitted under current Medicaid rules, such as premiums, copayments above statutory limits, healthy behavior incentives, or the provision of premium support for purchasing private coverage. 28  Individuals who are “medically frail,” which includes those with disabling mental disorders and chronic SUDs, are often exempt from many of the provisions in the current Medicaid waivers, so many people with behavioral health conditions are not affected by these provisions to the same extent as non-medically frail enrollees are.

While the previous administration did not approve waiver requests to impose work requirements for Medicaid, recent policy statements have indicated interest in imposing work requirements.29  These requirements may pose significant challenges to Medicaid enrollees with behavioral health conditions, many of whom could struggle to pay premiums or purchase private coverage or whose disabilities may preclude them from working. Furthermore, Medicaid rarely provides full coverage of supported employment, which is an evidence-based practice shown to increase employment in competitive jobs; without this benefit, people with behavioral health problems could face challenges complying with work requirements. Furthermore, it is not yet clear if medically frail enrollees would be eligible for exemptions to work requirements in the proposed policy changes.

Restructuring Medicaid Financing

In addition to limiting enhanced federal financing for the Medicaid expansion population, the House bill has proposed limiting federal financing for Medicaid through a per capita cap. Unlike current law where eligible individuals have an entitlement to coverage and states are guaranteed federal matching dollars with no pre-set limit, the proposal under consideration could eliminate both the entitlement and the guaranteed match to achieve budget savings and to make federal funding more predictable. To achieve budget savings, federal funding limits would be set at levels below expected levels if current law were to stay in place. In exchange for these federal caps, proposals could allow states to impose enrollment caps or waiting lists or reduce eligibility levels or offer states other increased flexibility to design and administer their programs. The proposal does not specify the rules for state matching payments or what core federal eligibility and coverage standards would be changed.

The proposal could substantially limit federal funds available to states to help them cover and finance behavioral health services. On March 13, 2017, the Department of Health and Human Services released a letter highlighting the Department’s aim to increase state flexibility and opportunities for state-level innovation. While states could gain new flexibility under the proposed plan, it is not clear what actions states could take to preserve benefits and enrollment that they cannot already do under federal Medicaid law.30  Medicaid spending is already relatively low (largely due to lower payment rates31 ), growing at rates below private health insurance and national health expenditures between 2000 and 2011 (Figure 3). Faced with more limited federal dollars, states could face incentives or pressure (due to limited budgets) to maximize the limited federal funding they would receive. These incentives may mean trimming benefit packages to lower per enrollee spending.

Figure 3: Average Annual Spending across Medicaid and Other Benchmarks, 2000-2011

Given the relatively high cost among the population with behavioral health needs,32  and the high share of Medicaid program spending for behavioral health, it is likely that such populations or services would be a target for cuts under the proposed plan.  Even though per capita caps are set at the average spending level for an eligibility group, there are significant variations even within states. Individuals with behavioral health conditions typically have greater service use and spending than other enrollees,4 making them among the costliest enrollees within an eligibility category. As such, policy actions to help states administer programs within the average per capita allotment for the group could disproportionately impact people with behavioral health needs.

For example, cuts to services considered “ancillary,” such as peer support, non-emergency transportation, non-clinical services, and prescription drugs, could have significant implications for individuals with behavioral health conditions, who rely heavily on many of these services. In particular, pressures to cut spending on prescription drugs would disproportionately affect behavioral health care, as central nervous system agents, which include psychiatric medications, are the largest drug class of prescription drugs, both in terms of total number of prescriptions and total spending.33  Furthermore, because states are no longer required to include essential health benefits in their ABPs, states may choose to exclude behavioral health services from the list of covered services for the Medicaid expansion population. Other potential changes, such as cuts to provider payment, could hinder provider participation in Medicaid, which could exacerbate the already limited availability of behavioral health providers who accept Medicaid. Notably, cuts that affect individuals with behavioral health needs could ultimately shift these costs to State Mental Health Agencies, which bear responsibility for financing services for people with no source of coverage for the services they need.

Furthermore, there is also substantial variation across states with regard to per enrollee spending. Under the proposed changes, the growth in federal Medicaid funding would not adjust for differences in underlying state health care costs; thus, enrollees living in costlier states could be especially impacted by per capita caps. In response to increased pressure to reduce costs, states with higher spending may be incentivized to reduce eligibility and coverage for optional groups, many of which include enrollees with behavioral health conditions.

Lastly, proposed changes to Medicaid could limit states’ ability to develop new models of care, respond to emerging health issues, or respond to changing economic conditions. Medicaid’s open-ended financing has enabled it develop innovative approaches to increasing community integration for enrollees with behavioral health conditions. It has also enabled Medicaid programs to respond to recent events such as the Great Recession, which saw an uptick in mental distress,34  or the recent opioid crisis, making the program a key component of the nation’s response to developing behavioral health crises.  Because federal funding would be capped on a per person basis and limited to a pre-set growth rate, it would not change in response to new models of care and unforeseen events.

Conclusion

As research has shed light on the importance of addressing behavioral health in order to improve health outcomes and decrease costs, treatment of behavioral health conditions has become a greater priority for providers and policymakers. Medicaid has been an important resource for many low-income individuals with behavioral health conditions, and recent policy changes, including Medicaid expansion, federal parity rules, and service delivery changes, have further facilitated access to care. However, the proposal to limit the enhanced federal financing for the Medicaid expansion population and to limit federal financing for Medicaid through a per capita cap has important implications with regard to eligibility, coverage, access, and costs. Understanding the unique and complex needs of enrollees with behavioral health conditions, as well as the ways these proposals could affect the providers and systems that care for them, is a key component of evaluating the potential impact of this proposal.

This brief draws on a paper that was written as part of a series of papers commissioned by the Scattergood Foundation. The original paper can be found at: www.scattergoodfoundation.org.

Endnotes

  1. Kaiser Family Foundation analysis of the 2014 National Survey on Drug Use and Health ↩︎
  2. Garfield R: Mental Health Financing in the United States. Washington, DC, Kaiser Commission on Medicaid and the Uninsured, April 2011. Available at https://modern.kff.org/wp-content/uploads/2013/01/8182.pdf ↩︎
  3. Mark TL, Yee T, Levit KR, et al: Insurance financing increased for mental health conditions but not for substance use disorders. Health Affairs 35:958-65, 2016. ↩︎
  4. Report to Congress on Medicaid and CHIP. Washington, DC, Medicaid and CHIP Payment and Access Commission, June 2015. Available at https://www.macpac.gov/wp-content/uploads/2015/06/June-2015-Report-to-Congress-on-Medicaid-and-CHIP.pdf ↩︎
  5. Hill SC, Abdus S, Hudson JL, et al: Adults in the income range for the Affordable Care Act’s Medicaid expansion are healthier than pre-ACA Enrollees. Health Affairs, 33:691-699, 2014. ↩︎
  6. Status of State Action on the Medicaid Expansion. Washington, DC, Kaiser Family Foundation, January 2017. Available at https://modern.kff.org/health-reform/state-indicator/state-activity-around-expanding-medicaid-under-the-affordable-care-act/?currentTimeframe=0 ↩︎
  7. Rudowitz R, Artiga S, Young K: What Coverage and Financing is at Risk Under Repeal of the ACA Medicaid Expansion? Washington, DC, Kaiser Family Foundation, December 2016. Available at https://modern.kff.org/medicaid/issue-brief/what-coverage-and-financing-at-risk-under-repeal-of-aca-medicaid-expansion/ ↩︎
  8. Behavioral Health: Options for Low-Income Adults to Receive Treatment in Selected States. Pub no GAO-15-449. Washington, DC, Government Accountability Office, 2015. ↩︎
  9. DiPietro B, Artiga S, Gates A: Early Impacts of the Medicaid Expansion for the Homeless Population. Washington, DC, Kasier Family Foundation, November 2014. Available at https://modern.kff.org/uninsured/issue-brief/early-impacts-of-the-medicaid-expansion-for-the-homeless-population/ ↩︎
  10. Continuing Progress on the Opioid Epidemic: The Role of the Affordable Care Act. Washington, DC, Assistant Secretary for Planning and Evaluation, January 2017. Available at https://aspe.hhs.gov/pdf-report/continuing-progress-opioid-epidemic-role-affordable-care-act ↩︎
  11. Searing A, Hoadley J: Beyond the Reduction in Uncompensated Care: Medicaid Expansion is Having a Positive Impact on Safety Net Hospitals and Clinics. Washington, DC, Georgetown University Health Policy Institute, Center for Children and Families, June 2016. Available at http://ccf.georgetown.edu/wp-content/uploads/2016/05/Medicaid_hospitals-clinics-June-2016.pdf ↩︎
  12. Paradise J, Rosenbaum S, Markus A, et al: Community Health Centers: Recent Growth and the Role of the ACA. Washington, DC, Kaiser Family Foundation, January 2017. Available at https://modern.kff.org/medicaid/issue-brief/community-health-centers-recent-growth-and-the-role-of-the-aca/ ↩︎
  13. Shin P, Sharac J, Zur J, et al: Health Center Patient Trends, Enrollment Activities, and Service Capacity: Recent Experience in Medicaid Expansion and Non-Expansion States. Washington, DC, Kaiser Family Foundation, December 2015. Available at https://modern.kff.org/medicaid/issue-brief/health-center-patient-trends-enrollment-activities-and-service-capacity-recent-experience-in-medicaid-expansion-and-non-expansion-states/ ↩︎
  14. Bachrach D, Boozang P, Herring A, et al: States Expanding Medicaid See Significant Budget Savings and Revenue Gains. Princeton, Robert Wood Johnson Foundation, March 2016. Available at http://www.rwjf.org/en/library/research/2015/04/states-expanding-medicaid-see-significant-budget-savings-and-rev.html ↩︎
  15. Medicaid Managed Care Enrollment and Program Characteristics, 2014: Baltimore, Centers for Medicare & Medicaid Services, 2016. Available at https://www.medicaid.gov/medicaid-chip-program-information/by-topics/data-and-systems/medicaid-managed-care/downloads/2014-medicaid-managed-care-enrollment-report.pdf ↩︎
  16. Barry CL, Goldman HH, Huskamp HA: Federal parity in the evolving mental health and addiction care landscape. Health Affairs, 35:1009-16, 2015. ↩︎
  17. Smith VK, Gifford K, Ellis E, et al: Implementing Coverage and Payment Initiatives: Results from a 50-State Medicaid Budget Survey for State Fiscal Years 2016 and 2017. Washington, DC, Kaiser Family Foundation, October 2016. Available at https://modern.kff.org/medicaid/report/implementing-coverage-and-payment-initiatives-results-from-a-50-state-medicaid-budget-survey-for-state-fiscal-years-2016-and-2017/ ↩︎
  18. Medicaid Health Homes: Implementation Update. Hamilton, Center for Health Care Strategies, September 2015. Available at http://www.chcs.org/resource/medicaid-health-homes-implementation-update/. ↩︎
  19. Nardone M, Snyder S, Paradise J: Integrating Physical and Behavioral Health Care: Promising Medicaid Models. Washington, DC, Kaiser Family Foundation, February, 2014. Available at https://modern.kff.org/medicaid/issue-brief/integrating-physical-and-behavioral-health-care-promising-medicaid-models/ . ↩︎
  20. O’Malley Watts M, Reaves EL, Musumeci M: Money Follows the Person: A 2015 State Survey of Transitions, Services, and Costs. Washington, DC, Kaiser Family Foundation, October 2015. Available at  https://modern.kff.org/medicaid/report/money-follows-the-person-a-2015-state-survey-of-transitions-services-and-costs/. ↩︎
  21. O’Malley Watts M, Cornachione E, Musumeci M: Medicaid Financial Eligibility for Seniors and People with Disabilities in 2015. Washington, DC, Kaiser Family Foundation, March 2016. Available at http://files.kff.org/attachment/report-medicaid-financial-eligibility-for-seniors-and-people-with-disabilities-in-2015 ↩︎
  22. Paradise J, Garfield R: What is Medicaid’s Impact on Access to Care, Health Outcomes, and Quality of Care? Setting the Record Straight on the Evidence. Washington, DC, Kaiser Family Foundation, August 2013. Available at https://modern.kff.org/medicaid/issue-brief/what-is-medicaids-impact-on-access-to-care-health-outcomes-and-quality-of-care-setting-the-record-straight-on-the-evidence/ ↩︎
  23. Kessler RC, Barber C, Birnbaum HG et al: (1999). Depression in the workplace: Effects on short-term disability. Health Affairs, 18:163-71, 1999. ↩︎
  24. Jordan N, Grissom G, Alonzo G et al: Economic benefit of chemical dependency treatment to employers. Journal of Substance Abuse Treatment, 34:311-9, 2007. ↩︎
  25. James DJ, Glaze LE: Mental Health Problems of Prison and Jail Inmates. Washington, DC, Bureau of Justice Statistics, December 2006. Available at https://www.bjs.gov/content/pub/pdf/mhppji.pdf ↩︎
  26. [26] Cherpitel CJ, Ye Y: Drug use and problem drinking associated with primary care and emergency room utilization in the US general population: data from the 2005 national alcohol survey. Drug and Alcohol Dependence, 97:226-30, 2008. ↩︎
  27. Rudowitz R, Garfield R: New Analysis Shows States with Medicaid Expansion Experienced Declines in Uninsured Hospital Discharges. Washington, DC, Kaiser Family Foundation, September 2015. Available at https://modern.kff.org/health-reform/issue-brief/new-analysis-shows-states-with-medicaid-expansion-experienced-declines-in-uninsured-hospital-discharges/ ↩︎
  28. Hinton E, Rudowitz R, Musumeci M: 3 Key Questions: Section 1115 Medicaid Demonstration Waivers. Washington DC, Kaiser Family Foundation, February 2017. Available at https://modern.kff.org/medicaid/issue-brief/3-key-questions-section-1115-medicaid-demonstration-waivers/ ↩︎
  29. Goodnough A: The Adults a Medicaid Work Requirement Would Leave Behind. New York, New York Times, February 2017. https://www.nytimes.com/2017/02/25/health/medicaid-work-requirement.html ↩︎
  30. Artiga S, Hinton E, Rudowitz R, et al: Current Flexibility in Medicaid: An Overview of Federal Standards and State Options. Washington, DC, Kaiser Family Foundation, January 2017. Available at https://modern.kff.org/medicaid/issue-brief/current-flexibility-in-medicaid-an-overview-of-federal-standards-and-state-options/ ↩︎
  31. Medicaid-to-Medicare Fee Index. Washington, DC, Kaiser Family Foundation, 2014. Available at https://modern.kff.org/medicaid/state-indicator/medicaid-to-medicare-fee-index/?currentTimeframe=0 ↩︎
  32. Goodell S, Druss BG, Walker ER: Mental Disorders and Medical Comorbidity. Princeton, Robert Wood Johnson Foundation, February 2011. Available at http://www.rwjf.org/content/dam/farm/reports/issue_briefs/2011/rwjf69438/subassets/rwjf69438_1 ↩︎
  33. Young K, Rudowitz R, Garfield R, et al: Medicaid’s Most Costly Outpatient Drugs. Washington, DC, Kaiser Family Foundation, July 2016. Available at https://modern.kff.org/health-costs/issue-brief/medicaids-most-costly-outpatient-drugs/ ↩︎
  34. Margerison-Zilko C, Goldman-Mellor S, Falconi A, et al: Health impacts of the great recession: A critical review. Current Epidemiology Reports, 3:81-91, 2016. ↩︎

Data Note: Three Findings about Access to Care and Health Outcomes in Medicaid

Author: Julia Paradise
Published: Mar 23, 2017

The Medicaid program provides health coverage for 74 million low-income Americans, including many of the poorest and sickest people in our society. Among those served by Medicaid are pregnant women, infants, and children, parents and other adults, poor seniors, and people of all ages with physical, cognitive, and other disabilities. Given Medicaid’s major coverage role and the complex health care needs of the population it covers, data and evidence on access to care and health outcomes in Medicaid are of key interest. Such an assessment is also important to ensure that debate about the effectiveness of the Medicaid program is grounded in facts and analysis. This Data Note examines the research on access and health outcomes in Medicaid.

1. Most doctors accept new Medicaid patients.

About 70% of office-based physicians accept new Medicaid patients, compared to about 85% who accept new patients with private insurance or Medicare. The percentage of physicians accepting new Medicaid patients varies by state, ranging from 39% in New Jersey to 97% in Nebraska; the percentage accepting new privately insured patients ranges from 67% in the District of Columbia to 95% in Illinois. In 25 states, the percentage of physicians accepting new Medicaid patients is significantly higher than the national average, while in five states it is significantly lower (Figure 1). In 14 states, more than 85% of physicians accept new Medicaid patients, including 10 states where at least 90% do, and eight states where the percentage accepting new Medicaid patients is equal to or greater than the percentage accepting new privately insured patients.

Figure 1: Nearly 70% of physicians accept new Medicaid patients, but there is wide state variation.

In general, specialists are more likely than primary care physicians, except for pediatricians, to accept new Medicaid patients. But psychiatrists, in particular, are less likely to participate in Medicaid (and in health insurance generally) than other physicians. Virtually all doctors who practice in community health centers, which are a key source of primary care in low-income communities, accept new Medicaid patients. Well over half of Medicaid beneficiaries are enrolled in contracted managed care plans, which are responsible for ensuring adequate provider networks and access to care for their Medicaid members.

There is no evidence that physician participation in Medicaid is declining. In a 2015 survey, 4 in 10 primary care physicians who accepted Medicaid reported seeing an increased number of Medicaid patients since January 2014, when the coverage expansions in the Affordable Care Act (ACA) took full effect. Research has shown a correlation between higher Medicaid fees and higher rates of physician participation in Medicaid. A recent 10-state “secret shopper” study found that the availability of new-patient primary care appointments for Medicaid patients increased significantly after Medicaid fees for primary care physicians were increased to Medicare levels under the ACA.

2. On key measures, access to care in Medicaid is comparable to private insurance, while the uninsured lag far behind.  

Medicaid beneficiaries access health care at rates comparable to the rates for privately insured people and at sharply higher rates than the uninsured. In addition, Medicaid increases economic security for low-income households by making health care affordable, reducing financial strain, and protecting against catastrophic medical cost burdens and medical debt.

Ninety-five percent (95%) of children covered by Medicaid or the Children’s Health Insurance Program (CHIP) have a usual source of care, compared to 97% of children with private insurance and 69% of uninsured children. Nearly 90% of non-elderly adults with Medicaid as well as adults with private insurance have a usual source of care, while less than half of uninsured adults do; among adults at or below 138% of the federal poverty level (FPL), the privately insured are twice as likely as those with Medicaid to lack a usual source of care (19% versus 10%). Uninsured people are markedly less likely than Medicaid beneficiaries to get care and significantly more likely to delay or go without needed care due to cost.

Children covered by Medicaid are as likely as children with private coverage to receive a well-child checkup. They are also similarly likely to have had a primary care visit in the past year and, when health, demographic, and socioeconomic differences between the two groups are adjusted, they are just as likely to have had a specialist visit in the past year. Medicaid covers many children with special needs and disabilities, and provides wrap-around benefits for many children with special needs who have private insurance, giving them access to long-term therapies, medical equipment and supplies, and other supports and services not typically covered by private insurance. Under 4% of children with Medicaid/CHIP have trouble finding a doctor who accepts their insurance, compared to about 2% of children with private insurance.

The data on adults tell a similar story. Adults with Medicaid are as likely as privately insured adults to have a doctor visit, receive specialist care, and report that they are satisfied with their health care (Figure 2). Among low-income adults (income at or below 250% FPL) with full-year coverage, those with Medicaid receive preventive care and cancer screening at similar rates to those with private health insurance. A large body of research shows that state Medicaid expansions to adults are associated with increased use of screening services and preventive care, diabetes medications and other prescription drugs, dental care, and other services. Medicaid adults are more likely than privately insured adults to have difficulty finding a provider with availability (11% versus 6%), but most of those who report difficulty do find a provider – under 3% of Medicaid adults (and 2% of privately insured adults) report that they were unable to find a doctor or provider with availability. Many studies show that providers have expanded their capacity and are meeting increased demand for care associated with the Medicaid expansion to adults.

Figure 2: Nationally, Medicaid is comparable to private insurance for access and satisfaction – the uninsured fare far less well.

Gaps in access to certain providers, particularly psychiatrists and dentists, are ongoing challenges in Medicaid. These and other gaps in access tend to mirror system-wide access problems that also affect Medicare and the private insurance market, but they are exacerbated in Medicaid by provider shortages in low-income communities, lower physician fees and participation in Medicaid compared to private insurance, and lack of transportation.

3. Evidence about Medicaid’s impact on health outcomes continues to emerge.

Like private health insurance and Medicare, Medicaid connects enrollees with health care providers and services. Access to screening and preventive care in Medicaid translates into well-child care and earlier detection of health and developmental problems in children, earlier diagnosis of cancer, diabetes, and other chronic conditions in adults, and earlier detection of mental illness in people of all ages. Access to physician care, prescription drugs, emergency care, and other services improves the likelihood that Medicaid enrollees will get treatment for both their acute and chronic conditions.

Multiple studies, though not all, have documented improvements in beneficiaries’ self-reported health, reduced stress and anxiety, and improved quality of life following Medicaid expansions. The Oregon Health Insurance Experiment, which used a research design that is considered the gold standard, compared the experience of adults who gained and adults who did not gain Medicaid coverage through a lottery that allocated a limited number of new Medicaid “slots” for low-income uninsured adults in the state. The study found that Medicaid improved self-reported mental health and reduced clinically observed rates of depression by 30% relative to the uninsured group. The findings related to impacts on physical health were mixed. Medicaid increased the detection of diabetes and use of diabetes medication, but did not have a statistically significant effect on control of diabetes, high blood pressure, or high cholesterol. The researchers note that the study did not have sufficient statistical power to detect changes in these measures, and also that factors including missed diagnosis and inappropriate or ineffective treatments, among others, could mitigate the impact of coverage on clinical outcomes.

Figure 3: Health insurance is one of many factors that contribute to health outcomes.

The purpose of health insurance is to increase access to care and provide protection against high out-of-pocket costs. Health outcomes are determined by a large number of variables, from genetic factors to social supports and environmental processes (Figure 3), and direct evidence that Medicaid or any other type of health coverage improves not just access to care, but also health outcomes, is limited. However, research documents that Medicaid coverage of pregnant women and children has contributed to dramatic declines in infant and child mortality in the United States. A growing number of studies show that Medicaid eligibility during childhood also has long-term positive impacts, including reduced teen mortality, reduced disability, improved long-run educational attainment, and lower rates of emergency department visits and hospitalization in later life. In addition, Medicaid eligibility during childhood appears to yield downstream benefits to the economy, in the form of reduced earned income tax credit payments and increased tax collections due to higher earnings in adulthood.

Conclusion

Medicaid covers 1 in 5 Americans today. Data and research provide evidence that Medicaid provides effective access to care for those it covers, including many of the poorest and sickest people in our nation. Because of the program, millions of otherwise uninsured low-income individuals and families – many of them with chronic conditions and disabilities – are able to see a doctor and gain entry into the health care system. The American Health Care Act, the Republican leadership’s plan to repeal and replace the Affordable Care Act, would cap federal funding for Medicaid for the first time in the program’s history, putting Medicaid coverage at risk for millions of low-income people. While the Medicaid program could be strengthened and improved, limiting the scope of Medicaid is likely to jeopardize access to care for the population most in need, with adverse consequences for their health and well-being in the near term and beyond.

Data Note: What if Per Enrollee Medicaid Spending Growth Had Been Limited to CPI-M from 2001-2011?

Authors: Rachel Garfield, Robin Rudowitz, and Katherine Young
Published: Mar 23, 2017

Data Note

Congress is currently debating the American Health Care Act (AHCA), which would repeal and replace the Affordable Care Act (ACA) and also make substantial changes to the structure and financing of Medicaid. The AHCA as released on March 6, 2017 would use a per capita cap policy to cap federal funds to states for Medicaid. Growth in per enrollee amounts would be tied to growth in the medical care component of the CPI (CPI-M).  On March 20, the AHCA added provisions to allow states to elect a block grant for certain populations and increase the per enrollee amounts for the elderly and people with disabilities to CPI-M plus one percentage point. This data note examines what the implications of tying per enrollee growth to CPI-M would have been for the 2001-2011 period for federal spending nationally and state-by-state by major enrollment group. This analysis is meant to illustrate how actual spending compares to spending limits that would have been in place if growth rates had been limited to CPI-M, similar to the limits proposed by the AHCA; however, the analysis does not examine the specific policy provisions of the AHCA, and, unlike assessments of the AHCA by the Congressional Budget Office (CBO), does not include the impact of repealing the ACA Medicaid expansion or other responses that states might adopt in response to federal funding limits. An overview of the methods underlying the analysis is provided in the “Methods” box below.  

Key Takeaways

This data note illustrates how Medicaid spending would have differed from FFY 2001-2011 if spending growth per enrollee had been limited to CPI-M for each enrollment group. It finds:

  • Total Medicaid spending would have been $195 billion lower over the period on net across all groups (about 6.5% lower), and federal spending would have been $128 billion lower (about 7.0% lower).
  • Because spending growth and enrollment growth varied by eligibility group over the period, outcomes differ by eligibility group. Of the decline in federal dollars over the 2001-2011 period, nearly three quarters would have been for spending for children and people with disabilities (each account for 37% of the change), with declines in spending for adults accounting for 22% of the change and declines for the aged accounting for 4% of the change.
  • States varied widely in their actual per enrollee growth rates and enrollment from 2000-2011, leading to state variation in changes in federal spending under the per enrollee cap that limits all states to the same growth rate. Over the 2001-2011 period, most states (38) would have experienced a reduction in federal funds in total, and more than half the states (26) would have seen a drop in federal Medicaid funds of 10% or more. About half of states (25) would have experienced at decline for each enrollee group. For children, Arizona would have faced a 38% drop in federal funds but Colorado a 24% gain; for adults, Pennsylvania would have seen a 45% loss versus a gain of 10% in Iowa; for people with disabilities, New Mexico would have lost 22% of federal funds versus +20% in Rhode Island; and among the aged, Alaska would have seen a 31% loss compared to a similar size gain in Michigan.

National Changes in Medicaid Spending

Our analysis estimates that if 2000 per enrollee spending for full-benefit beneficiaries each enrollment group were limited to growth in CPI-M for the 2001-2011 period, total Medicaid spending would have been $195 billion lower over the period on net across all groups (about 6.5% lower), and federal spending would have been $128 billion lower (about 7.0% lower) than actual total spending (Figure 1).

Figure 1: Estimated Change in Total and Federal Medicaid Spending if Per Enrollee Spending Growth by Group Was Limited to CPI-M, 2001-2011

Changes in Spending by Eligibility Group

Because spending growth varied by eligibility group over the period, outcomes differ by eligibility group. Generally, spending growth per enrollee for the aged and people with disabilities was low over this period, relative to spending growth per enrollee for adults and children. Limiting growth to CPI-M for each group would have resulted in a slight increase in per enrollee spending for the aged (2%) and a slight decline for the disabled (-6%), but much larger declines for adults (-18%) and children (-15%) in 2011 (Figure 2).

Figure 2: Actual Full-Benefit Per Enrollee Amounts Compared to Estimated if Per Enrollee Spending Growth Was Limited to CPI-M, 2011

Reflecting these differences in growth rates by eligibility group, as well as differences in enrollment across groups, the total decline in Medicaid spending over the 2001-2011 period is not evenly distributed across groups. Of the estimated $128 billion decline in federal dollars over the 2001-2011 period, nearly three quarters would have been for spending for children and people with disabilities (each account for 37% of the change), with declines in spending for adults accounting for 22% of the change and declines for the aged accounting for 4% of the change (Figure 3).

Figure 3: Distribution of Estimated Change in Federal Medicaid Spending if Per Enrollee Spending Growth by Group Was Limited to CPI-M, 2001-2011

Limiting federal Medicaid spending to a per enrollee cap set at the sum of per enrollee spending by group yields different results than setting an overall per enrollee spending cap.  Our analysis finds that, using the overall per enrollee spending cap, Medicaid spending would have increased by approximately $19 billion over the period (a 0.6% increase) and federal spending would have increased by approximately $8 billion (a 0.4% increase) (data not shown). This different outcome occurs because the overall per enrollee spending amount reflects the weighted average of spending for relatively costly groups (aged and people with disabilities) as well as relatively inexpensive groups (children and adults without disabilities). Since total Medicaid enrollment is made up mostly of the less costly groups, states overall would have fared better under a cap set at the overall per enrollee amount. However, some states (11 states) would have fared worse under an overall cap. Use of an overall cap does not adjust for changes in case mix within a state over time.

Variation by State

States varied widely in their actual per enrollee growth rates and enrollment from 2000-2011, leading to state variation in changes in federal spending under the per enrollee cap. Over the 2001-2011 period, most states (38) would have experienced a reduction in federal funds in total (Figure 4 and Table 1). Nearly all states (47) would have experienced a reduction in the adult group.

Estimated Number of States Experiencing Decline in Federal Spending if Per Enrollee Spending Growth by Group Was Limited to CPI-M, 2001-2011

Depending on the structure of a federal per capita cap, states could possibly shift funds from a group whose expenses were below the cap to one whose expenses were above it. Based on the analysis of data from 2000-2011, about half of states (25) would have experienced declines in federal Medicaid spending for all four eligibility groups, so they would not have had savings from one group to transfer to another. Further, as evidenced by the fact that most states (38) still had a net decline in federal dollars, many states that had savings for one group would not have experienced sufficient savings to offset losses.

The magnitude of the change in federal Medicaid funds varies significantly by state (Table 2 and Figure 5). More than half the states (26) would have seen an overall drop in federal Medicaid funds of more than 10%. Across all eligibility groups, New Mexico, Louisiana, and Maryland would have experienced a reduction in federal funds of 26%, 21%, and 20%, respectively, while New Hampshire, Michigan, and Illinois would have received 13%, 11%, and 11% more federal dollars, respectively.  Limiting federal Medicaid spending increases to a uniform rate across states would not account for differences in states’ cost of care for Medicaid beneficiaries.

Figure 5: Estimated Change in Federal Medicaid Spending if Per Enrollee Spending Growth by Group Was Limited to CPI-M, 2001-2011

The variation by group is even larger (Figure 6).  For the aged, Alaska would have experienced a 31% loss in federal funding compared to a 31% increase in Michigan; New Mexico would have experienced a 22% loss in federal funds for people with disabilities compared to a 20% gain in Rhode Island; Pennsylvania would have experienced a 45% reduction in federal funds for adults compared to a 10% increase in Iowa; and Arizona would have experienced a reduction of 38% for children compared to an increase of 24% in Colorado. Notably, actual per enrollee spending amounts by eligibility group vary by year for some states due to data anomalies in the administrative data. While our analysis corrected for clear errors in the data (see Methods for more details), it is not always clear whether states experiencing year-to-year shifts experienced actual changes or faced data issues. These data anomalies highlight the challenge of finding timely, accurate data to serve as the basis for per enrollee spending rules.

Figure 6: State Variation in Estimated Change in Federal Medicaid Spending if Per Enrollee Spending Growth by Group Was Limited to CPI-M, 2001-2011

Looking Ahead

Changes to Medicaid financing proposed under the AHCA would be a major restructuring of the Medicaid program. Currently, federal Medicaid matching funds are provided on an open-ended basis and grow with both enrollment increases and changes in per enrollee spending; federal Medicaid funds also account for variation in changes to the cost of care across states. This structure has allowed Medicaid spending growth per enrollee to vary over time, accounting for changes in medical technology (e.g., new prescription drug treatments), new treatment patterns (e.g., the shift to community-based long-term care), or emerging illnesses (e.g., HIV/AIDS). It also allows spending growth to vary across states, based on variation in health care markets, the needs of residents and state policy choices. A federal per enrollee cap on Medicaid spending would grow with enrollment, but it would not account for this variation in per enrollee spending growth over time and across states. As illustrated by looking at spending per enrollee from 2001 to 2011, states would face very different outcomes if federal per enrollee growth were limited to CPI-M, and most states would have experienced a net decrease in federal Medicaid funds. Policies imposed going forward (instead of looking back) could result in federal savings, but could have significantly different implications across enrollment groups and across states. In response to limited federal funding for Medicaid, states would need to either offset those federal reductions or cut back on their Medicaid programs.

Methods

This analysis is based on data prepared by the Kaiser Family Foundation and the Urban Institute from the Medicaid Statistical Information System (MSIS) for FFY 2000-2011. We calculated Medicaid enrollment, total spending, and spending per enrollee for full-benefit enrollees in each year, both by eligibility group and for all eligibility groups combined. For aged enrollees, we excluded spending for prescription drugs to account for these costs being largely shifted to the Medicare Part D program starting in 2006. To estimate federal Medicaid spending, we apply each state’s effective Federal Medical Assistance Percentage (FMAP) for that year to total spending. FMAPs include adjustments to the federal share of Medicaid costs from April 2003-June 2004 and from October 1, 2008 through June 30, 2011.

To account for data anomalies, we made some adjustments to particular state-years in the data. Specifically, New Mexico’s spending data for FFY 2009-2011 is missing data for individuals enrolled in the state’s CoLTS program. To account for this issue, we applied nationwide annual growth rates by eligibility group to New Mexico’s 2008 per enrollee spending to calculate spending levels in subsequent years. In addition, to account for anomalies in baseline (FFY 2000) data for Tennessee (for aged) and Hawaii (for disabled), we imputed per enrollee spending for FFY 2000 for these states/groups using overall FFY 2000-2001 growth rates for the state for that year. Due to additional data quality issues, we imputed spending and enrollment in Georgia and New Mexico in FFY 2002, Maryland and West Virginia in FFY 2003, Tennessee and West Virginia in FFY 2004, and Idaho in FFY 2010. We used FFY 2010 data to estimate missing data for Florida, Kansas, Maine, Maryland, Montana, New Mexico, New Jersey, Oklahoma, Texas, and Utah in 2011. While other states may have data anomalies in the MSIS data over time, we did not adjust for all potential issues, as other anomalies were on a scale that it was difficult to determine if they were data issues or reflected real annual changes in spending or enrollment.

We then estimated per enrollee spending for FFY 2001-2011 if spending growth starting in FFY 2001 had been limited to the medical care component of the CPI (CPI-M). For each year and for the entire period, we compare actual per enrollee and total spending amounts for each eligibility group and for all eligibility groups combined to what it would have been with per enrollee growth limited to CPI-M. We assume that states cut state spending to keep per enrollee costs within federal caps.

This analysis is meant to illustrate how actual spending compares to spending limits that would have been in place if growth rates had been limited to CPI-M, similar to the limits proposed by the AHCA; however, the analysis does not examine the specific policy provisions of the AHCA (i.e. adjusting for non-supplemental DSH payments). Further, unlike assessments of the AHCA by the Congressional Budget Office (CBO), this analysis does not project future changes to Medicaid spending or include the impact of repealing the ACA Medicaid expansion.

Tables

Table 1: Estimated Change in Federal Medicaid Spending under Federal Per Capita Cap, 2001-2011 ($ in millions)
StateAgedPeople with DisabilitiesAdultsChildrenTotal
US Total $(5,712) $(47,194) $(27,839) $(46,983) $(127,730)
Alabama $(466) $(514) $(134) $(1,824) $(2,939)
Alaska $(302) $(339) $(122) $(420) $(1,183)
Arizona $1,639 $(2,287) $(1,446) $(4,654) $(6,747)
Arkansas $(1,601) $(1,264) $(349) $(638) $(3,853)
California $(7,188) $(10,335) $(913) $(2,827) $(21,263)
Colorado $90 $114 $(23) $903 $1,085
Connecticut $271 $(220) $(174) $(51) $(174)
Delaware $(198) $(4) $(298) $(106) $(607)
DC $(253) $(505) $(246) $(101) $(1,105)
Florida $(3,836) $(5,386) $(1,557) $(2,504) $(13,283)
Georgia $(2,308) $(1,665) $(1,815) $(761) $(6,549)
Hawaii $(86) $(407) $(290) $344 $(439)
Idaho $93 $(140) $(109) $(367) $(523)
Illinois $4,605 $2,995 $(28) $(765) $6,807
Indiana $(427) $(899) $(473) $(642) $(2,440)
Iowa $218 $150 $158 $(51) $476
Kansas $55 $867 $(31) $(466) $425
Kentucky $(137) $(1,185) $(917) $(943) $(3,182)
Louisiana $(1,577) $(3,545) $(466) $(1,662) $(7,250)
Maine $(78) $1,214 $23 $48 $1,207
Maryland $(967) $(2,575) $(1,046) $(1,108) $(5,696)
Massachusetts $(1,120) $4,516 $(1,217) $(2,961) $(782)
Michigan $4,263 $(178) $538 $1,563 $6,185
Minnesota $411 $(1,491) $(987) $(1,370) $(3,437)
Mississippi $(1,913) $(2,178) $(83) $(484) $(4,658)
Missouri $24 $(1,186) $(1,671) $(2,958) $(5,791)
Montana $(132) $(122) $(60) $(160) $(474)
Nebraska $507 $50 $(115) $(434) $7
Nevada $(167) $(511) $(26) $(42) $(747)
New Hampshire $(5) $649 $(8) $90 $727
New Jersey $627 $(772) $(487) $(506) $(1,138)
New Mexico $(635) $(1,764) $(911) $(1,809) $(5,119)
New York $3,440 $(6,524) $1,724 $2,357 $996
North Carolina $(177) $(2,148) $(1,125) $(3,400) $(6,850)
North Dakota $(32) $218 $(2) $28 $212
Ohio $(212) $(2,635) $(2,154) $(1,429) $(6,430)
Oklahoma $(424) $(457) $(805) $(875) $(2,562)
Oregon $(313) $(615) $(539) $286 $(1,181)
Pennsylvania $4,410 $(3,952) $(3,020) $(531) $(3,092)
Rhode Island $109 $848 $(242) $(608) $107
South Carolina $(433) $(357) $(811) $(1,228) $(2,829)
South Dakota $(67) $(147) $(92) $(181) $(486)
Tennessee $(3,220) $2,109 $(2,266) $(1,179) $(4,557)
Texas $(1,670) $(1,676) $(210) $(9,914) $(13,469)
Utah $58 $208 $(21) $378 $623
Vermont $(266) $(212) $(280) $(275) $(1,032)
Virginia $38 $(1,139) $(784) $(1,876) $(3,760)
Washington $2,504 $(2,197) $(153) $(541) $(386)
West Virginia $(528) $(414) $(271) $(708) $(1,921)
Wisconsin $1,736 $998 $(1,456) $515 $1,793
Wyoming $(73) $(185) $(48) $(139) $(445)
SOURCE: Kaiser Family Foundation and Urban Institute analysis of FFY 2000-2011 MSIS data.
Table 2: Estimated Percent Change in Federal Medicaid Spending under Federal Per Capita Cap, 2001-2011
StateAgedPeople with DisabilitiesAdultsChildrenTotal
US Total-1%-6%-14%-12%-7%
Alabama-7%-5%-20%-26%-12%
Alaska-31%-15%-14%-22%-20%
Arizona30%-17%-13%-38%-16%
Arkansas-28%-13%-39%-12%-17%
California-15%-12%-6%-8%-11%
Colorado2%2%-1%24%7%
Connecticut3%-2%-7%-1%-1%
Delaware-19%0%-21%-10%-11%
DC-12%-10%-20%-6%-11%
Florida-19%-15%-23%-16%-17%
Georgia-24%-10%-28%-6%-14%
Hawaii-5%-18%-18%28%-6%
Idaho7%-3%-21%-21%-7%
Illinois42%11%0%-5%11%
Indiana-5%-6%-18%-9%-7%
Iowa5%2%10%-2%3%
Kansas2%13%-3%-17%3%
Kentucky-2%-8%-25%-12%-10%
Louisiana-25%-19%-25%-23%-21%
Maine-2%18%1%2%8%
Maryland-15%-18%-38%-19%-20%
Massachusetts-8%19%-24%-34%-1%
Michigan31%-1%8%14%11%
Minnesota5%-9%-25%-20%-10%
Mississippi-31%-19%-5%-9%-19%
Missouri0%-6%-45%-28%-14%
Montana-8%-6%-26%-13%-9%
Nebraska20%1%-14%-18%0%
Nevada-15%-18%-4%-2%-12%
New Hampshire0%28%-2%7%13%
New Jersey5%-5%-19%-8%-3%
New Mexico-21%-22%-45%-26%-26%
New York5%-6%6%9%0%
North Carolina-2%-8%-23%-26%-13%
North Dakota-2%13%0%5%5%
Ohio-1%-7%-23%-13%-8%
Oklahoma-10%-5%-37%-13%-11%
Oregon-6%-8%-21%7%-6%
Pennsylvania19%-10%-45%-4%-4%
Rhode Island7%20%-31%-36%1%
South Carolina-7%-3%-29%-18%-10%
South Dakota-7%-8%-24%-16%-11%
Tennessee-46%10%-21%-11%-9%
Texas-8%-4%-2%-24%-11%
Utah5%4%-2%13%6%
Vermont-22%-9%-34%-20%-18%
Virginia1%-10%-34%-32%-15%
Washington37%-18%-4%-8%-1%
West Virginia-15%-5%-19%-22%-12%
Wisconsin16%7%-34%13%5%
Wyoming-13%-16%-27%-23%-18%
SOURCE: Kaiser Family Foundation and Urban Institute analysis of FFY 2000-2011 MSIS data.

Impact of Cost Sharing Reductions on Deductibles and Out-Of-Pocket Limits

Published: Mar 22, 2017

Issue Brief

The American Health Care Act (AHCA) proposes several changes to the financial support available to people enrolling in nongroup coverage. In addition to modifying the premium tax credits that people would get, the AHCA would eliminate the provision that reduces the cost sharing burden for lower- and moderate income enrollees who get their coverage through the federal or a state marketplace. The cost-sharing reductions are a key part of the financial support currently provided to these enrollees; over 6.4 million people were enrolled in a plan with reduced cost-sharing in 2016 (See State Health Facts ). This note briefly describes the cost-sharing reductions in current law and illustrates their impact by looking at how these provisions affect average deductibles and out-of-pocket maximum limits in benchmark silver plans in 2017 in states using the federally facilitated marketplace.

How Cost Sharing Reductions Work

Under current law, people who are eligible for premium tax credits based on their income also may be eligible for a reduction in their cost sharing (i.e., deductibles, coinsurance, copayments, out-of-pocket limits) if they enroll in a plan in the silver tier. Insurers are required to reduce the cost sharing applicable to people with low and moderate incomes by increasing the actuarial value of the plan that people choose. A silver plan generally has an actuarial value of 70%, which means that the insurers expects to pay, on average, 70% of the covered costs of enrollees in the plan. Insurers must increase the actuarial value to 94% for enrollees with incomes below 150% of poverty, to 87% for enrollees with incomes between 150% and 200% of poverty, and to 73% for enrollees with incomes between 200% and 250% of poverty. They do this by creating variants (called cost sharing reduction, or CSR plans) of each silver plan they offer: each variant lowers the cost sharing to meet the higher actuarial value required. Insurers are periodically reimbursed for the additional claims expenses they incur from lowering the cost sharing in these plans.

The law provides insurers flexibility in determining how cost sharing is arranged in order to meet these actuarial value levels, although the out-of-pocket limits on cost sharing cannot exceed prescribed amounts. An out-of-pocket limit is the maximum an enrollee must pay toward cost sharing for services received in-network; after the limit is reached the insurer pays 100% of the cost for covered services. In 2017, the maximum out-of-pocket limit applicable for most plans is $7,150 for single coverage and twice that amount for family coverage. For CSR plans, the maximum out-of-pocket limits for single coverage are $2,350 for enrollees with incomes below 200% of poverty, and $5,700 for enrollees with incomes between 200% and 250% of poverty1  (For More on Health Insurance subsidies). The limits for family CRS plans are twice the single limits. Table 1 illustrates how the cost sharing in a standard silver plan compares to cost sharing in its CSR variants.

Table 1: Example of Cost-Sharing Reductions on Plan Cost-Sharing
 CSR – 94CSR – 87 CSR – 73Silver
Combined Medical and Drug Deductible (Individual)$0$500$2,275$2,400
Out-of-Pocket (Individual)$1,250$2,250$5,700$7,150
Primary Care Physician Visit$0$10$20$20
Specialist Physician Visit$10$30$55$55
Emergency Room Visit$150$205$400$400
Inpatient Facility10%20%30%30%
Inpatient Physician10%20%30%30%
SOURCE: Plan characteristics for “Molina Marketplace Silver Plan” the Second Lowest Cost Plan in Franklin County, Ohio

Impact of Cost Sharing Reductions

To illustrate the impact of the provisions reducing cost sharing for low and moderate income enrollees, we look at the average reductions in deductibles and out-of-pocket limits in the silver plans offered in the federally facilitated marketplace (see Methods). We focus on the deductibles and out-of-pocket maximums because these are the most visible cost-sharing elements in policies.

The cost sharing reductions significantly lower deductibles in these plans: for plans where there is a combined deductible for medical care and prescription drugs, the average deductible is reduced for those with incomes below 150% of poverty from $3,609 to $255, a savings of $3,354; for those with incomes between 150% and 200% of poverty the average deductible is reduced to $809 a savings of $2,800 and for enrollees with incomes between 200% and 250% of poverty, the average deductible is $2,904, a savings of $705 (Figure 1 and Figure 2). For plans with a separate deductible for medical care and prescription drugs, the comparable reductions in the deductible for medical care are $3,103, $2,631 and $648 (Figure 2).

Figure 1: Average Medical Deductible In Plans with Combined and Separate Medical and Prescription Drug Deductible
Figure 2: Average Savings in Plan Deductibles Between Silver Plans and Cost-Sharing Reduction Plans, 2017

The impacts of the cost sharing reductions on the out-of-pocket limits in these plans is also large. The average combined medical and prescription drug out-of-pocket limit is reduced from $6,528 to $941 for a savings of $5,587 for enrollees with incomes below 150% of poverty. Likewise, the out-of-pocket maximum is reduced to $1,875 a savings of, $4,653 for enrollees with incomes between 150% and 200% of poverty, and reduced to$5,233 for enrollees with incomes between 200% and 250% of poverty, a savings of $1,294 (Figure 3 and Figure 4).

Figure 3: Average Out-Of-Pocket Limit In Plans with Combined Limit for Medical and Prescription Drug Cost Sharing
Figure 4: Average Difference in Out-of-Pocket Maximums Between Silver Plans and Cost-Sharing Reduction Plans, 2017

Discussion

The law provides considerable financial assistance for low and moderate income people who purchase non-group coverage. Premium tax credits, which are income adjusted, help make coverage more affordable, while reduced cost sharing helps to make the out-of-pocket costs at the point of service more affordable when they need care. Insurance policies can require significant cost sharing contributions from enrollees, which can strain the budgets of many families but often are out of reach for people with lower and modest incomes: in 2013, about one-third of nonelderly households with private insurance and with incomes above poverty did not have sufficient financial assets to meet deductibles of $2,500 for single person households or $5,000 for multi-person households, and the percentages are much higher for households with incomes between 100% and 250% of poverty (See Consumer Assets and Patient Cost-Sharing). While reductions in premium tax credits under the AHCA could put insurance out of reach for many low-income people, elimination of cost-sharing subsidies would make the insurance people do buy less valuable.

Methods

Data were obtained from the Data.HealthCare.gov 2017 QHP Landscape on March 17, 2017. Plans analyzed include those offered in 2017 in the 38 states using Healthcare.gov (which includes federally facilitated, supported, and partnership Marketplaces, including Oregon, New Mexico, Nevada and Hawaii).

The analysis focuses on plans in the Silver metal tier. Child-only plans were removed, and the remaining unique records (those with identical cost-sharing structures from the same issuer) were collapsed by state, thereby removing duplications where the same plans are offered in multiple counties within the state. For each Silver plan, we compared the deductible and out-of-pocket amounts with those in 73% actuarial value, 87% actuarial value, and 94% actuarial value cost-sharing variants. Averages are simple averages and not weighted by enrollment as plan-level enrollment data are not publicly available.

News Release

10 Ways Women Could Be Affected by Repeal of the Affordable Care Act

Published: Mar 22, 2017

Repeal of the Affordable Care Act could have a profound impact on women, as the law fundamentally changed women’s health coverage, benefits, and access to care.

In a new issue brief, the Kaiser Family Foundation outlines 10 ways women could be affected if the ACA is repealed or its provisions are otherwise eliminated or modified, including through changes proposed in the House Republican replacement bill, the American Health Care Act.

The brief discusses the potential impact on women of six provisions of the AHCA:

  • Eliminating federal funds for the ACA’s Medicaid expansion.
  • Capping federal funding available to states for Medicaid.
  • Cutting off federal Medicaid payments to Planned Parenthood.
  • Changing financial assistance in the individual insurance market, including how tax credits are calculated and how much insurers can account for age when determining premiums.
  • Implementing new restrictions on coverage for abortions.
  • Rescinding the requirement to cover essential health benefits, including maternity care, preventive services, and mental health care. The AHCA removes this requirement for Medicaid expansion, but does not address it for private plans.

The brief also examines the possible effect of four possible changes that are not included in the current House Republicans’ ACA replacement plan, but could be addressed later:

  • Eliminating the requirement that public and private plans cover preventive services without cost sharing, including cancer screenings and well-woman visits.
  • Eliminating or modifying the requirement that most plans cover birth control without cost sharing.
  • Weakening protections or benefits related to care for pregnant and postpartum women.
  • Repealing ACA insurance reforms, such as prohibitions on charging women more than men for the same coverage or denying coverage due to a pre-existing condition.

This analysis, along with poll findings on women’s health coverage and federal funding for reproductive health, were discussed today at a web briefing for media hosted by the Foundation. An archived webcast of the briefing is available on kff.org.

News Release

Health Insurance Premiums Under the ACA vs. AHCA: County-Level Data

Published: Mar 22, 2017

The Kaiser Family Foundation’s interactive map now allows users to compare what consumers in each county would pay in health insurance premiums after tax credits in 2020 under the Affordable Care Act vs. the House GOP replacement plan, the American Health Care Act.

The maps include estimates by county for current ACA marketplace enrollees at age 27, 40, or 60 with an annual income of $20,000, $30,000, $40,000, $50,000, $75,000, or $100,000.

In addition to premium and tax credit estimates, the maps show the share of an individual’s income they’d pay for health insurance premiums, and the dollar and percentage difference in premiums under the ACA vs. the House GOP’s AHCA.

Generally, people who are older, lower-income, or live in high-premium areas (like Alaska and Arizona) receive less financial assistance under the AHCA. Additionally, older people would have higher starting premiums under the AHCA and would therefore pay higher premiums. Because younger people with higher-incomes and living in lower-cost areas would receive more financial assistance and would have lower starting premiums on average, they would pay less on average.

map-email-032217.jpg

Note: This analysis does not take into account changes the House made on March 20 that would potentially allow for larger tax credits under the AHCA for people over age 50; it is not yet clear whether and how those funds would be allocated to tax credits. The map also does not include cost-sharing assistance under the ACA that lowers deductibles and copayments for low-income marketplace enrollees.

Poll Finding

Data Note: 5 Misconceptions Surrounding the ACA

Published: Mar 21, 2017

On the seventh anniversary of the passing of the Affordable Care Act, we highlight five of the most common misconceptions surrounding the 2010 health care law.

#1:  Six in Ten Do Not Know the Uninsured Rate has Decreased under the ACA…

But in fact, according to the federal government’s National Health Interview Survey, the U.S. uninsured rate among people under 65 was 10.4 in the second quarter of 2016. In 2010, the year the law was enacted, the rate was 18.2. The most recent Kaiser tracking poll finds that four in ten adults in the U.S. know that the share of people without health insurance has decreased since the 2010 health care law passed, while three in ten say the share has increased and a quarter say it has stayed about the same.

Figure 1: The Uninsured Rate is At An All-Time Low, But The Public Doesn’t Know It

#2:  Half Think the ACA Provides Health Insurance to Undocumented Immigrants…

But in fact, under the health law, undocumented immigrants remained ineligible for Medicaid and are ineligible for tax credits toward premiums for ACA marketplace plans. Half of the public incorrectly thinks the law allows undocumented immigrants to receive financial help from the government to buy health insurance.

Figure 2: Half Incorrectly Say ACA Allows Undocumented Immigrants to Receive Financial Help To Buy Insurance

#3:  Half Don’t Know the ACA Eliminated Cost-Sharing for Preventive Care…

But in fact, the ACA eliminated out-of-pocket costs for a variety of preventive care services including birth control. Overall, many Americans are unaware the 2010 health care eliminated cost-sharing for birth control (53 percent) and preventive services for adults (47 percent) and children (41 percent).

Figure 3: Many Are Unaware ACA Eliminated Out-of-Pocket Costs for Birth Control and Preventive Care

#4:  Four in Ten Think the ACA Cut Medicare Benefits…

But in fact, while the ACA has reduced growth in payments to providers and to private health plans that participate in the Medicare Advantage program, it did not cut benefits for seniors enrolled in the traditional Medicare program. Four in ten Americans incorrectly think the ACA cut benefits for people who are covered by traditional Medicare.

Figure 4: Four in Ten Incorrectly Say ACA Cuts Medicare Benefits

#5:  Three in Ten Think Most Americans Get Health Coverage Through the ACA…

But in fact, most Americans are insured through an employer or through a government program, such as Medicare or Medicaid. Less than 10 percent of Americans are covered by ACA marketplace plans. Overall, 29 percent of the public incorrectly thinks that more Americans get their health coverage through the ACA’s marketplaces than through either an employer or Medicaid or Medicare.

Figure 5: Three in Ten Think Most Americans Get Health Insurance through ACA Exchanges or Marketplaces