Poll Finding

Kaiser Health Tracking Poll – March 2018: Non-Group Enrollees

Authors: Ashley Kirzinger, Liz Hamel, Cailey Muñana, and Mollyann Brodie
Published: Apr 3, 2018

Findings

Key Findings:

  • As part of the Republican tax reform plan signed into law at the end of 2017, lawmakers eliminated the ACA’s individual mandate penalty starting in 2019. About one-fifth of non-group enrollees (19 percent) are aware the mandate penalty has been repealed but is still in effect for this year. Regardless of the lack of awareness, nine in ten non-group enrollees say they intend to continue to buy their own insurance even with the repeal of the individual mandate. About one-third (34 percent) say the mandate was a “major reason” why they chose to buy insurance.

    Survey: 9 in 10 people with non-group health insurance plan to continue buying insurance despite the repeal of the individual mandate penalty

  • About half the public overall believes the ACA marketplaces are “collapsing,” including six in ten of those with coverage purchased through these marketplaces. In fact, across party identification and insurance type, more say the marketplaces are “collapsing” than say the marketplaces are not collapsing.
  • Overall, the population who buy their insurance through the ACA marketplace report being satisfied with the insurance options available to them during the most recent open enrollment period and more than half give the value of their insurance a positive rating. Yet, some (32 percent) experienced problems while trying to renew or buy their coverage and six in ten marketplace enrollees say they are worried about the possible lack of health insurance coverage in their areas.
  • In 2017, President Trump issued an executive order directing his administration to expand the availability of non-renewable short-term insurance plans, and regulations have been proposed to implement the order. When asked whether non-group enrollees would prefer to purchase such a plan or prefer to keep the plan they have now, the vast majority (84 percent) say they would keep the plan they have now while 12 percent say they would want to purchase a short-term plan.
  • The most common response offered by people who are uninsured when asked the reason why they don’t have health insurance is that it is too expensive and they can’t afford it (36 percent), followed by job-related issues such as unemployment or their employer doesn’t offer health insurance (20 percent).

Who Are Non-Group Enrollees?

This report examines people’s experiences with the current health insurance market focusing on individuals who currently have health insurance they purchased themselves (referred to as “non-group enrollees” throughout the report). This is comprised of individuals who purchase their own insurance through an Affordable Care Act (ACA) marketplace (“marketplace enrollees”) as well as those who purchase their insurance outside of the ACA markets.1 

In the first half of 2017, 10.1 million people had health insurance that they purchased through the ACA exchanges or marketplaces.2  For comparison, the report also examines individuals ages 18-64 without health insurance (“uninsured”) as well as those who get their insurance through their employer (“employer-sponsored insurance”). These extended interviews were conducted as part of the February and March Kaiser Health Tracking Polls and were completed after the close of the law’s fifth open enrollment period, which ended earlier this year.

The Individual Mandate

As part of the Republican tax reform plan signed into law at the end of 2017, lawmakers eliminated the ACA’s individual mandate penalty. The tax plan reduced the individual penalty for not having health insurance to zero beginning in 2019, effectively repealing the least favorable provision of the ACA (according to polling conducted by Kaiser Family Foundation). There is still uncertainty among the public as well as among the groups most directly affected by the individual mandate (non-group enrollees and the uninsured) on the status of the mandate. About one-fifth of non-group enrollees (19 percent) and one in ten uninsured (11 percent) are aware that the individual penalty has been repealed but it is still in effect for the current year. This is similar to the share of the overall public (11 percent) who are aware.

Figure 1: Confusion Remains on Status of the ACA’s Individual Mandate, Even Among Those Most Affected

In KFF polling last fall before the mandate was repealed, few non-group enrollees (22 percent) reported that the individual mandate was a “major reason” why they chose to purchase their coverage.3  This continues to be true after the repeal of the mandate penalty, with the mandate ranking lowest on a list of “major reasons” people give for buying their own insurance. A majority of non-group enrollees say protecting against high medical bills (75 percent) and peace of mind (66 percent) are “major reasons” why they chose to purchase their own insurance. About four in ten say they buy insurance because they or a family member has an ongoing health condition (41 percent), while one-third say the major reason is because there is government financial help to make it affordable (35 percent) or because the law requires them to have it (34 percent).
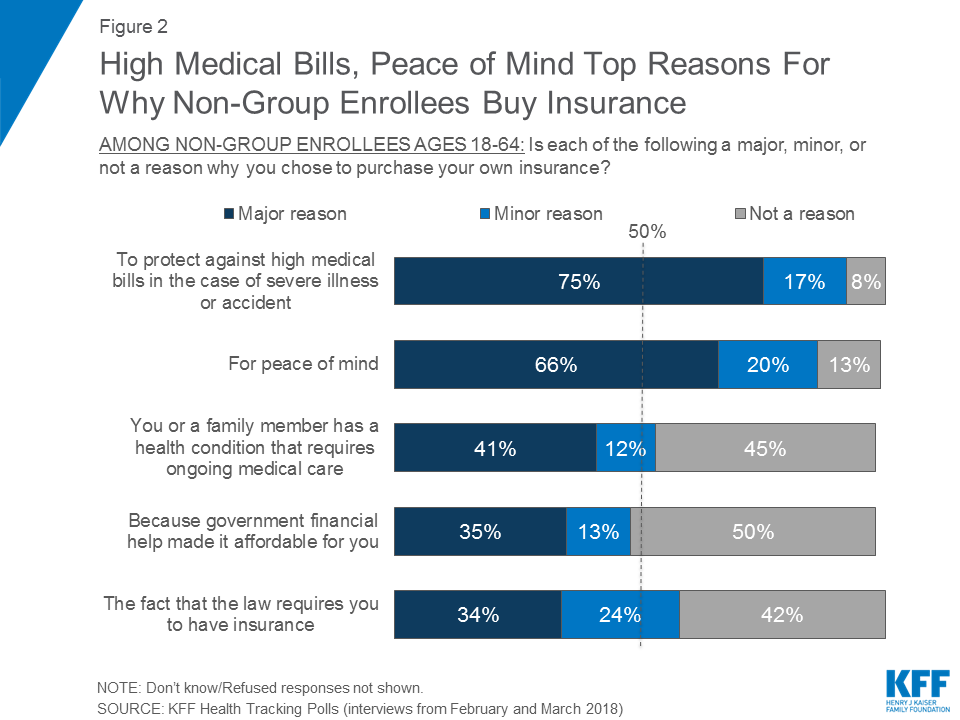
Figure 2: High Medical Bills, Peace of Mind Top Reasons For Why Non-Group Enrollees Buy Insurance

In addition, nine in ten non-group enrollees say they intend to continue to buy their own insurance in 2019 when the mandate penalty is no longer in effect. This is nearly identical to the share who said they would continue to buy their own insurance even if the government stopped enforcing the fine for people who don’t have health insurance in October 2017.
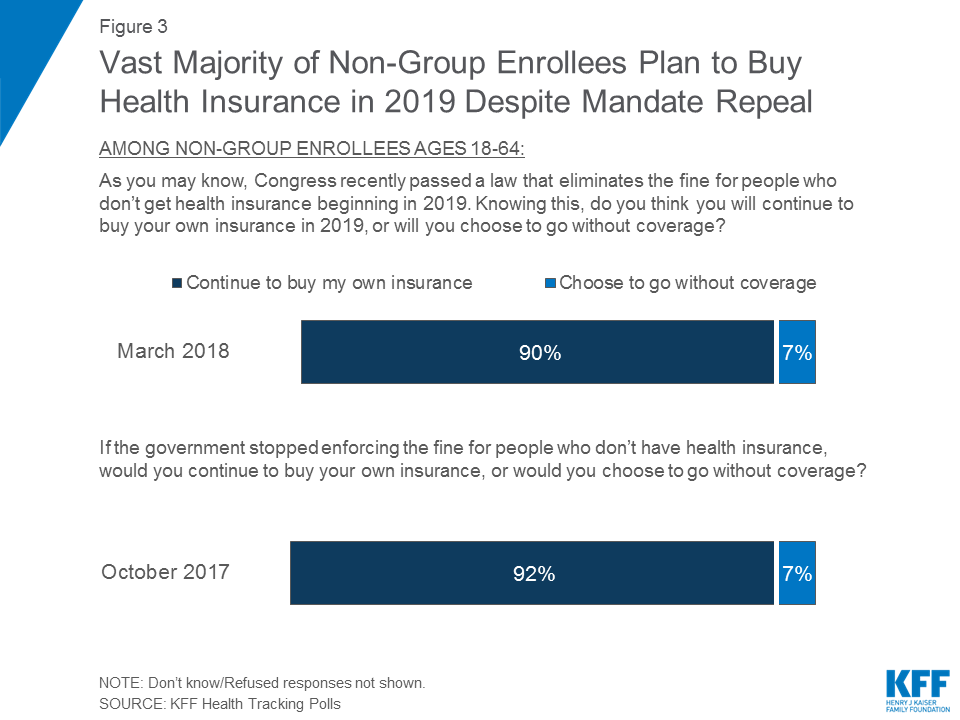
Figure 3: Vast Majority of Non-Group Enrollees Plan to Buy Health Insurance in 2019 Despite Mandate Repeal

Views of ACA Marketplace

With the Affordable Care Act’s (ACA) fifth open enrollment period recently ending, this report – focusing on the experiences and attitudes of individuals who buy their own health insurance – finds major concerns among this population about the future of the ACA marketplaces. About half of the public say they think the marketplaces are collapsing. This holds true across party identification and insurance type – including six in ten of those who purchase their insurance through the marketplaces. Slightly larger shares of the overall public now say the marketplaces for people who purchase their own insurance are collapsing than said the same earlier this year (53 percent compared to 42 percent in January).4 
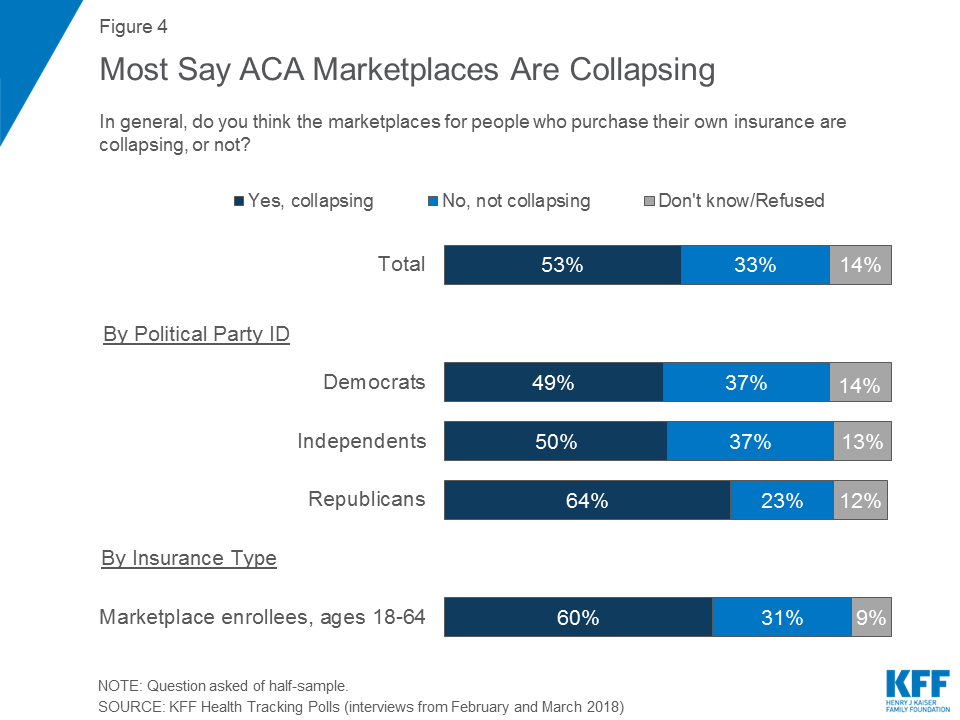
Figure 4: Most Say ACA Marketplaces Are Collapsing

Non-Group Enrollees Are Worried About Lack of Coverage in Their Areas

Half of non-group enrollees and six in ten marketplace enrollees say they are worried about the potential for lack of health insurance coverage in their areas. Half of non-group enrollees (51 percent) and six in ten marketplace enrollees (58 percent) say they are “very worried” or “somewhat worried” there will be no insurance companies left selling plan in their area in the future, similar to the share who say they worry that their own current insurance company will stop selling plans in their area (49 percent and 58 percent, respectively).

Figure 5: Non-Group Enrollees and Marketplace Enrollees Are Worried About Future Coverage in Their Area

Non-Group Enrollees Are Worried About Future Affordability of Coverage

Even larger shares of marketplace enrollees and non-group enrollees worry about the future affordability of their copays, deductibles, and premiums. Eight in ten marketplace enrollees and three-fourths of non-group enrollees report being either “very worried” or “somewhat worried” about their out-of-pocket costs increasing so high that either will not be able to get the health care they need or afford the health insurance plan they have now.
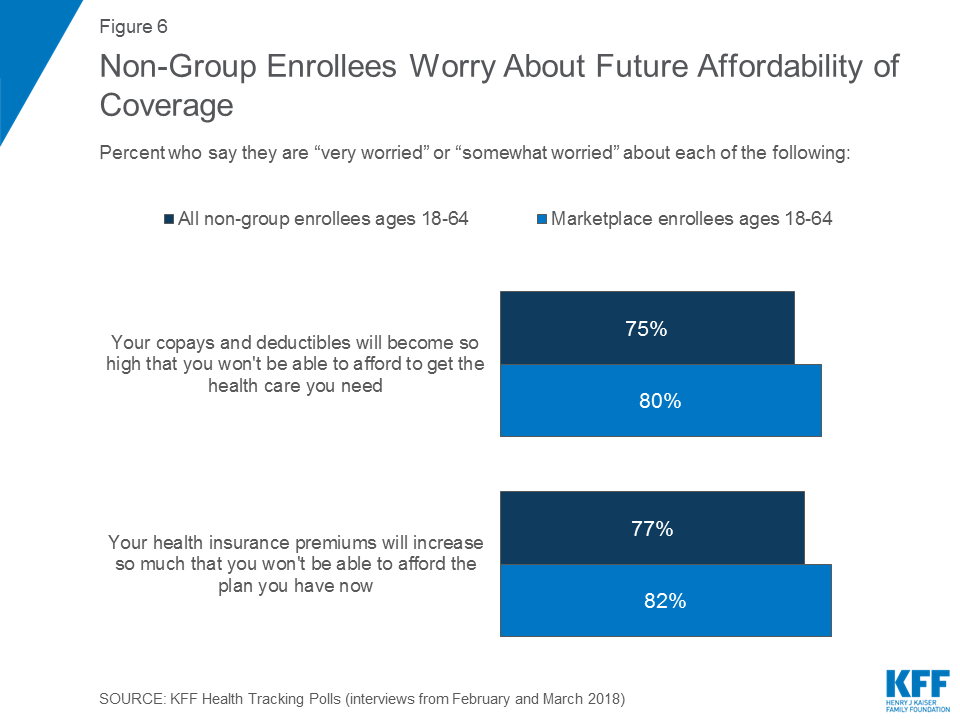
Figure 6: Non-Group Enrollees Worry About Future Affordability of Coverage

Experiences of Marketplace Enrollees During Most Recent Open Enrollment Period

The most recent open enrollment period for non-group insurance ended for people in most states on December 15, 2017. Most current enrollees (67 percent) say they renewed a plan that they had in 2017 while one-third purchased a new plan this year.

Figure 7: One-Third of Non-Group Enrollees Signed Up for A New Insurance Plan in 2018

Overall, the marketplace population report being satisfied with the insurance options available to them; yet, about one-third (32 percent) experienced problems while trying to renew or buy their coverage.

Choice of Plans or Insurers

About seven in ten marketplace enrollees (71 percent) say they had a choice of health plans from different insurance companies when they bought their current plan, while about one-fourth (23 percent) say there was only one insurer selling plans in their area. A majority of marketplace enrollees (61 percent) report being satisfied with their insurance choices with about one-third (32 percent) reporting being “very satisfied.”
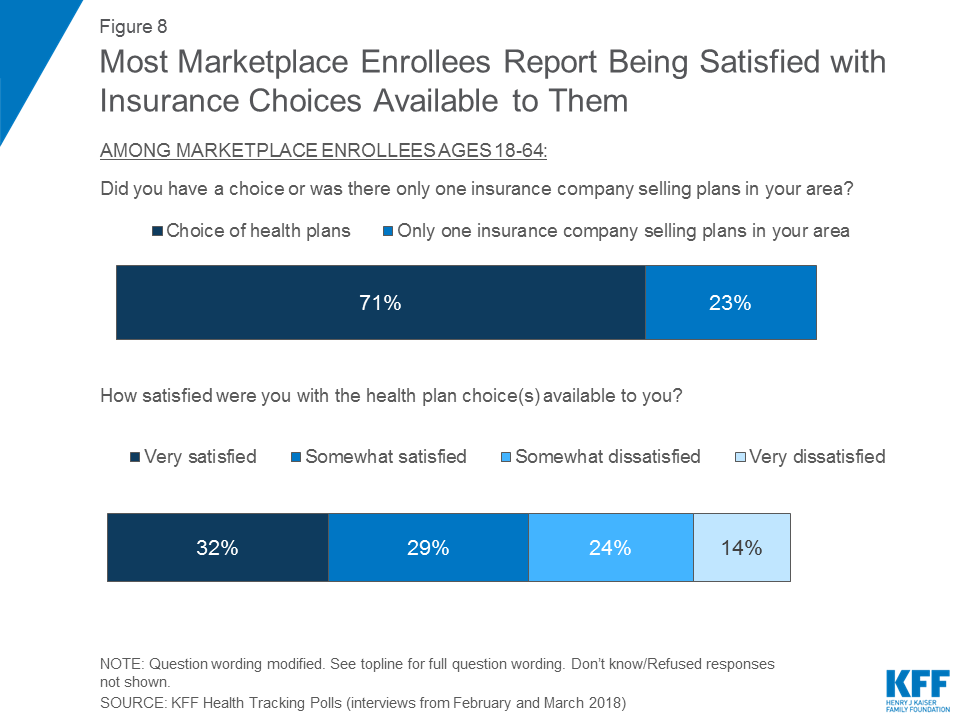
Figure 8: Most Marketplace Enrollees Report Being Satisfied with Insurance Choices Available to Them

Marketplace Enrollees Divided on the Value of Health Insurance

Nearly equal shares of marketplace enrollees say their coverage is an “excellent” or “good” value as say it is a “fair” or “poor” value. About half of marketplace enrollees (51 percent) say their coverage is an “excellent” (20 percent) or “good” value (31 percent) for what they pay for it, while 48 percent say it is a “fair” (28 percent) or “poor” value (20 percent). This is similar to the results in 2016 and appears to halt the increase in the share who said their health insurance was a “fair” or “poor” value as reported two years ago.
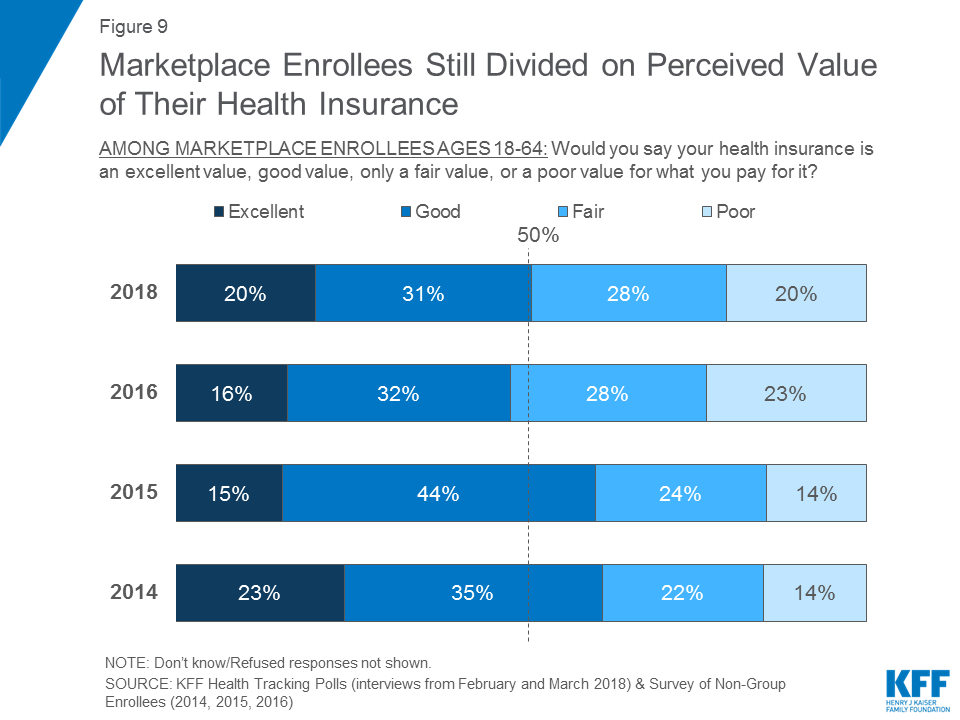
Figure 9: Marketplace Enrollees Still Divided on Perceived Value of Their Health Insurance

Most Common Problems During Open Enrollment Period

One-third (32 percent) of marketplace enrollees said they experienced problems when they tried to renew or sign up for health coverage for 2018. About one in eight said they experienced problems when setting up or logging into their account (15 percent) or when comparing the different plans available (15 percent). About one in ten said they had problems enrolling in their insurance choice (12 percent), and applying for financial assistance (11 percent), or understanding the dates and deadlines (10 percent).

Figure 10: One-Third of Marketplace Enrollees Said They Experienced Problems During Most Recent Open Enrollment Period

Half of those who experienced problems (19 percent of all marketplace enrollees), said that they received help from an outside source when they had a problem.

Most Say Their Monthly Premiums Are Lower or Will Stay the Same in 2018

Most marketplace enrollees, who also were in the non-group market in 2017, say their health insurance premiums are either “lower” this year or “about the same” as they were in 2017. One-third (34 percent) say their premiums are “about the same” this year compared to last year while one-fourth (23 percent) say they experienced a decrease in their premiums this year. This may be because many marketplace enrollees receive financial assistance through premium tax credits to help cover the cost of their premiums, which protects them from being directly impacted by premium increases. About four in ten (42 percent) marketplace enrollees say their health insurance premiums are higher this year compared to last year, including one-fourth who say their premiums are “a lot higher” and 17 percent who say they are “a little bit higher.”

Figure 11: Most Marketplace Enrollees Say Premiums and Deductibles Are Lower or Similar in 2018 Compared to 2017

The majority of marketplace enrollees (60 percent) say their deductibles are about the same this year as they were last year. Three in ten saw an increase in their deductibles and few (8 percent) say they experienced a decrease.

Four in Ten Marketplace Enrollees Say Increases in Monthly Premiums Are A Financial Burden

Four in ten marketplace enrollees say the increase in their premium will be a financial burden for them this year. One-fifth say the increase will be a “major financial burden,” while 18 percent say the increase will be a “minor financial burden.”
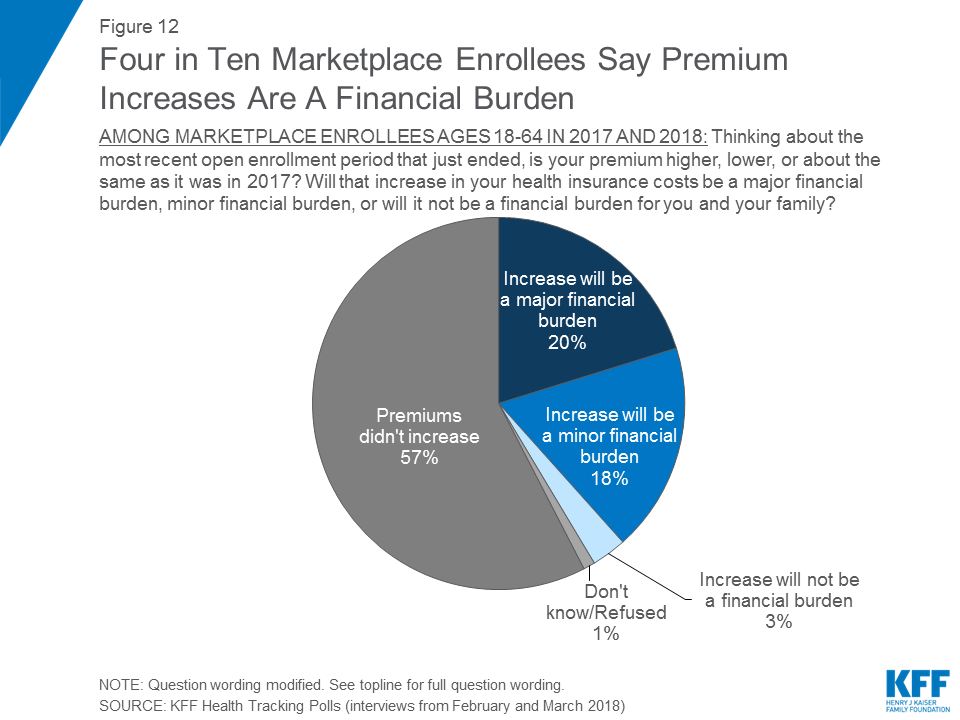
Figure 12: Four in Ten Marketplace Enrollees Say Premium Increases Are A Financial Burden

Most See Health Insurance as Something They Need

This report compares the attitudes of individuals who purchase their own insurance through an ACA marketplace or more generally the non-group health insurance market to those who get their insurance through their employer as well as to those who do not have health insurance coverage. Overall, the views of these groups are more similar than different, especially when it comes to their overall views of health insurance with majorities valuing health insurance and prioritizing comprehensive coverage.

Vast majorities of those with employer-sponsored insurance (91 percent), non-group enrollees (84 percent) and marketplace enrollees (88 percent), as well as seven in ten uninsured adults (71 percent), say it is “very important” to them personally to have health insurance.
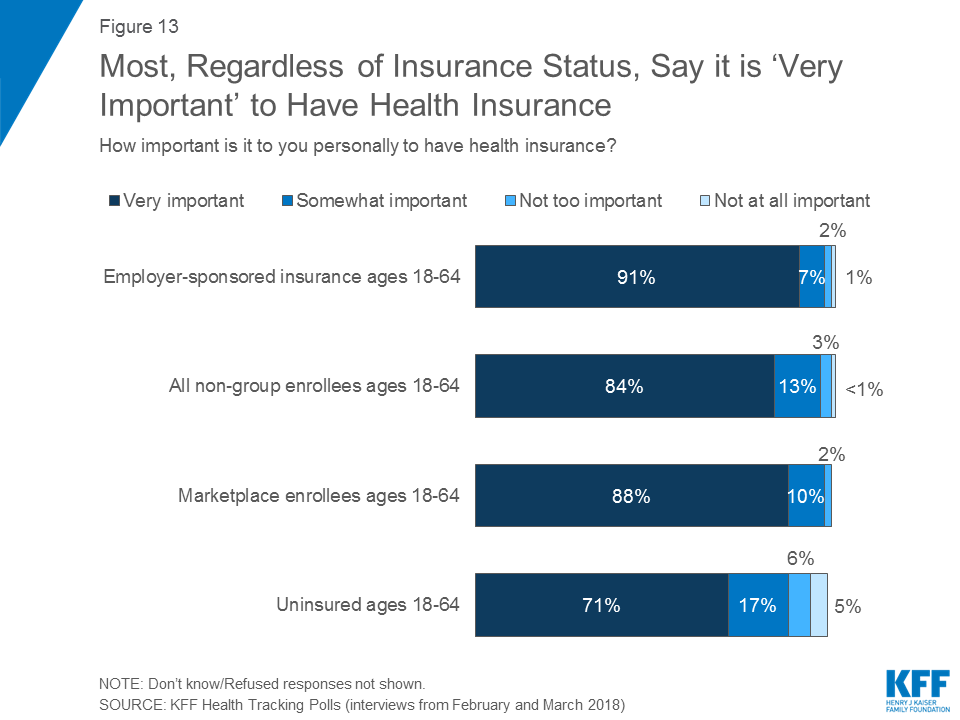
Figure 13: Most, Regardless of Insurance Status, Say it is ‘Very Important’ to Have Health Insurance

In addition, when asked whether health insurance is something they need, at least three-fourths of those with employer-sponsored insurance (89 percent), non-group enrollees (84 percent), marketplace enrollees (87 percent), and uninsured (76 percent) say health insurance is something they need. Among the uninsured, 23 percent say they are healthy enough that they don’t need insurance.
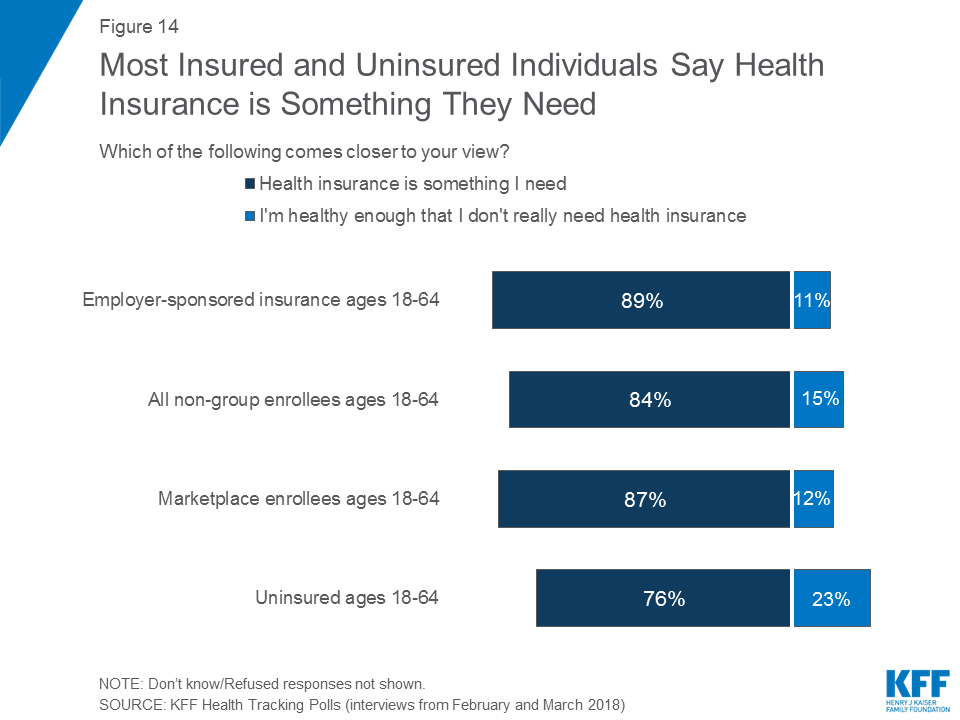
Figure 14: Most Insured and Uninsured Individuals Say Health Insurance is Something They Need

Majorities Prioritize Comprehensive Coverage over Affordability

Larger shares say comprehensive coverage is more important to them when choosing a health plan than affordability. Three-fourths (74 percent) of those with employer-sponsored coverage say that when choosing a health plan, comprehensive coverage – that is, health insurance that costs more but covers almost every benefit – is more important to them than choosing a plan that costs less but does not cover every needed benefit (24 percent). While larger shares of non-group enrollees and marketplace enrollees say affordable coverage is more important (38 percent and 37 percent), most still say comprehensive coverage is more important (59 percent and 60 percent).
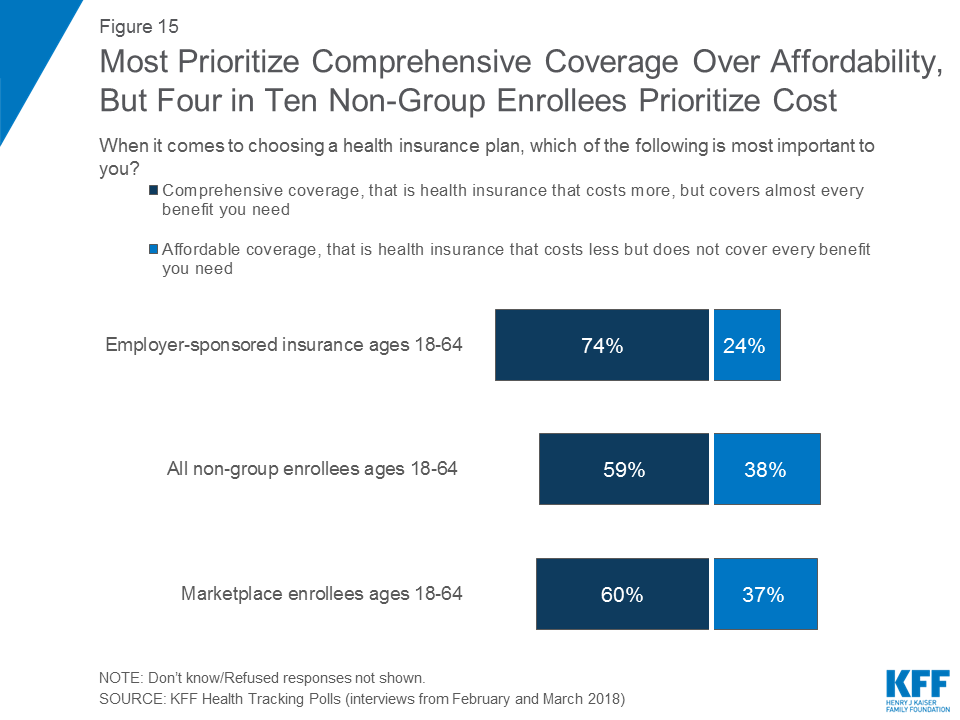
Figure 15: Most Prioritize Comprehensive Coverage Over Affordability, But Four in Ten Non-Group Enrollees Prioritize Cost
Few Non-Group Enrollees Say They Would Purchase A Short-term Insurance Plan

In 2017, President Trump issued an executive order directing his administration to expand the availability of non-renewable short-term insurance plans, and regulations have been proposed implementing that order. These plans are designed for people who have a temporary gap in their coverage and the plans are exempt from many of the requirements of the ACA, including the requirements that insurance companies must accept all applicants and cover pre-existing conditions.5  These plans tend to cost less but provide fewer benefits overall. When non-group enrollees were asked whether they would want to purchase such a plan or prefer to keep the plan they have now, the vast majority (84 percent) say they would keep the plan they have now while 12 percent would want to purchase a short-term plan. Responses to this question were similar among individuals living in households both with and without pre-existing conditions.
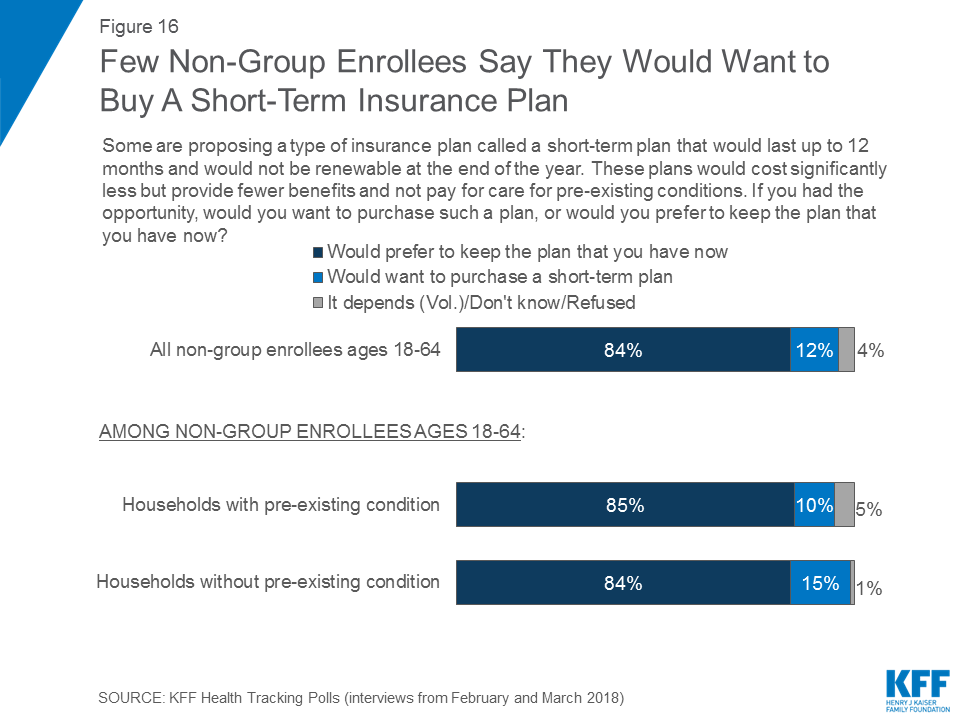
Figure 16: Few Non-Group Enrollees Say They Would Want to Buy A Short-Term Insurance Plan

Experiences of the Uninsured

A potential target group for marketplace enrollment are those who remain without health coverage. When people who are uninsured are asked about the main reason they don’t have coverage, the most common response offered is that it is too expensive and they can’t afford it (36 percent), followed by job-related issues such as unemployment or their employer doesn’t offer health insurance (20 percent). Fewer say they don’t need or want health insurance (8 percent), citizenship or residency issues have prevented them from getting it (6 percent), they aren’t eligible for insurance or government help (5 percent), or that they missed the deadline or have been too busy to sign-up (2 percent).
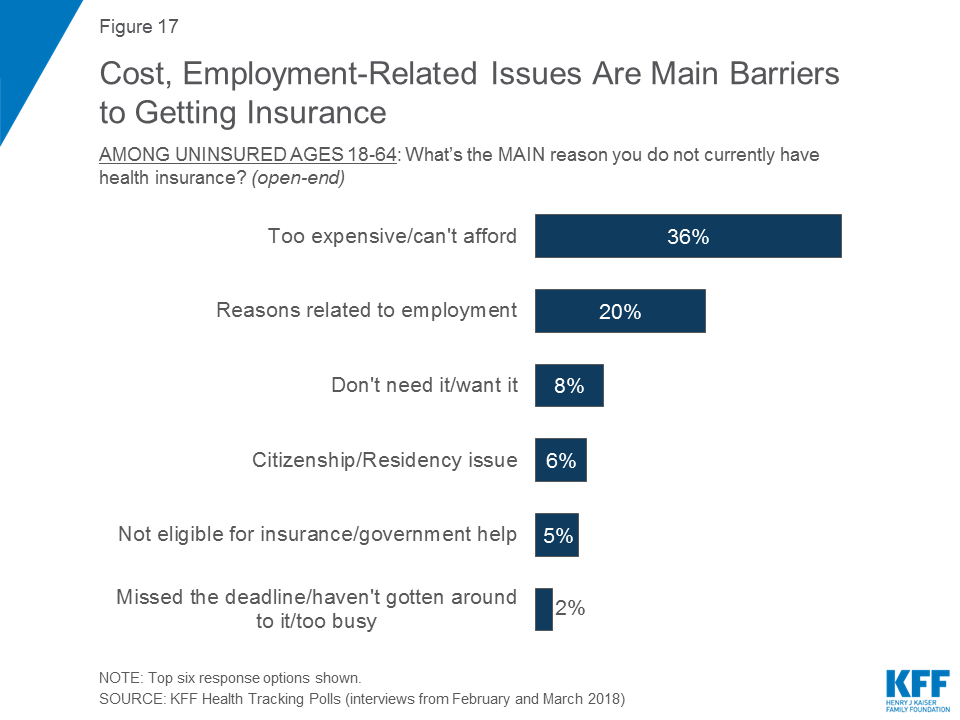
Figure 17: Cost, Employment-Related Issues Are Main Barriers to Getting Insurance

Most uninsured people (70 percent) say they have not tried to get health insurance in the past six months while three in ten say they have tried to get coverage.
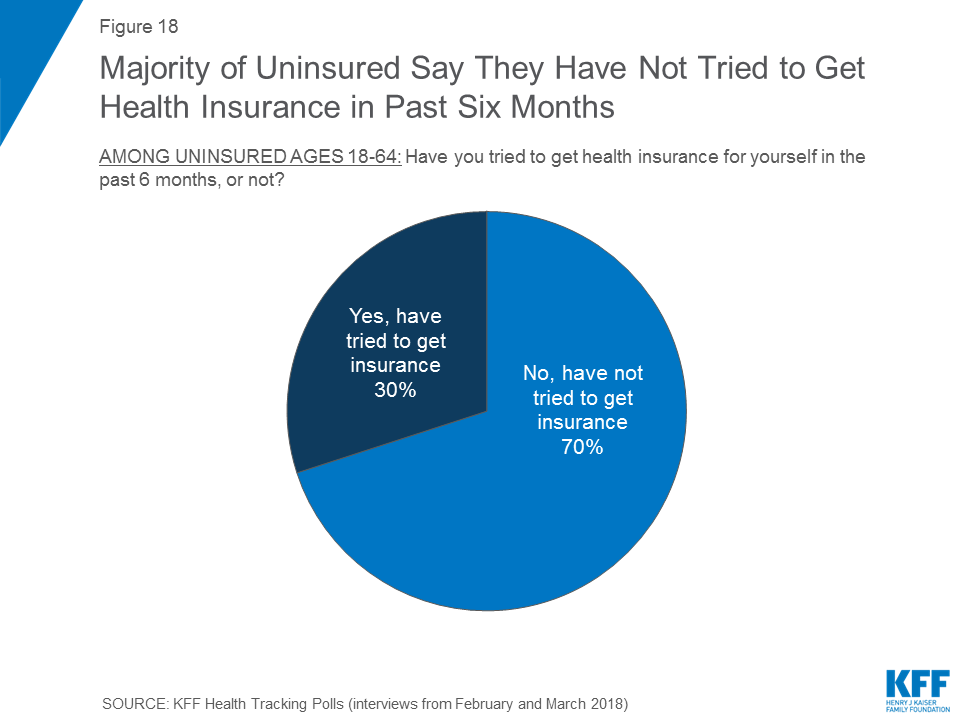
Figure 18: Majority of Uninsured Say They Have Not Tried to Get Health Insurance in Past Six Months

Similarly, one-third (35 percent) say they have tried to figure out if they qualify for Medicaid or financial assistance to pay for health coverage in the past six months, but few (11 percent of all uninsured) sought outside help in order to figure out if they qualified.
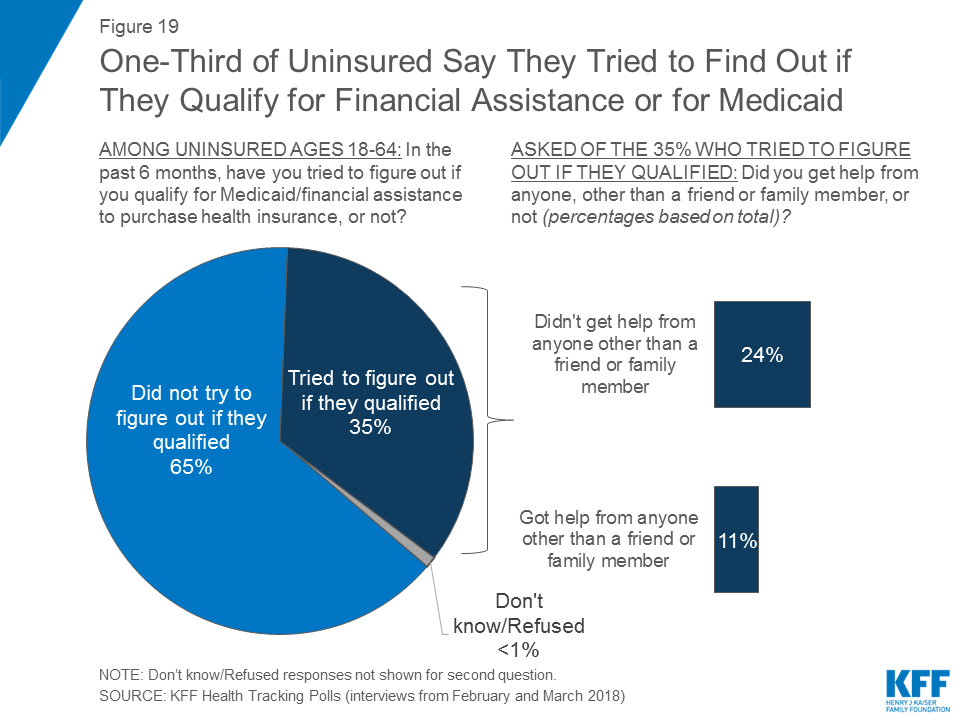
Figure 19: One-Third of Uninsured Say They Tried to Find Out if They Qualify for Financial Assistance or for Medicaid

Slightly more than half (54 percent) of people who are uninsured say they won’t have to pay a fine for not having health insurance in 2017, while one-third (35 percent) anticipate that they will have to pay a fine for not being covered. The remaining 11 percent say either they don’t know or they had insurance in 2017. Some uninsured people may in fact be exempt from the fine because of hardship exemptions available under the law.
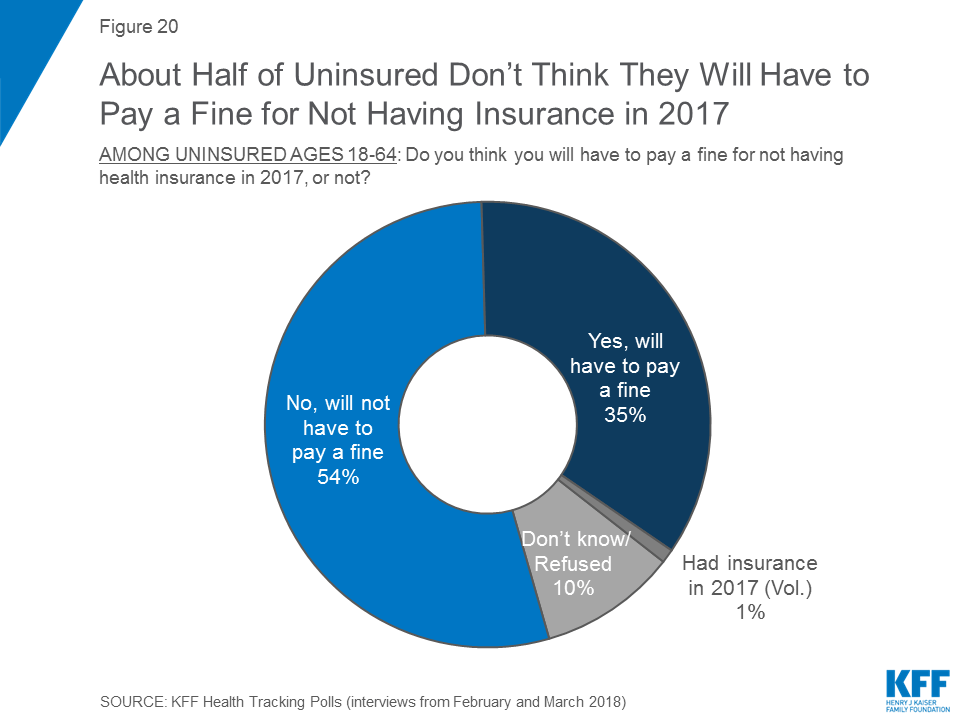
Figure 20: About Half of Uninsured Don’t Think They Will Have to Pay a Fine for Not Having Insurance in 2017

Methodology

This survey was designed and analyzed by public opinion researchers at the Kaiser Family Foundation (KFF). Interviews were conducted by telephone from February 15th-20th and March 8th-13th, 2018, among a nationally representative random digit dial telephone sample of 2,534 adult U.S. residents. This includes interviews conducted as part of the February and March Kaiser Health Tracking Polls, as well as an oversample of respondents who purchase their own insurance non-Group Enrollees). Computer-assisted telephone interviews conducted by landline (882 and cell phone (1,652, including 1,050 who had no landline telephone) were carried out in English and Spanish by SSRS of Glen Mills, PA. For the landline sample, respondents were selected by asking for the youngest adult male or female currently at home based on a random rotation. If no one of that gender was available, interviewers asked to speak with the youngest adult of the opposite gender. For the cell phone sample, interviews were conducted with the adult who answered the phone. KFF paid for all costs associated with the survey.

Respondents were considered Non-Group Enrollees if they were between the ages of 18-64 and their main source of health care coverage is health insurance that they purchase themselves (excluding small business owners whose self-purchased insurance covers non-related employees). To efficiently obtain a sufficiently large sample of Non-Group Enrollees, given their overall low incidence in the general adult population, the sample included a subsample of respondents who had previously completed interviews on the SSRS Omnibus poll, and indicated that they met the specifications of Non-Group Enrollees (n=129). All RDD landline and cell phone samples were generated by Marketing Systems Group (MSG). The SSRS Omnibus poll involves a similar overlapping frame design.

A multi-stage weighting process was applied to ensure an accurate representation of the national population overall, and of non-group enrollees in particular. The first stage of weighting involved corrections for sample design, including accounting for the likelihood of non-response for the re-contact sample, number of eligible household members for those reached via landline, and a correction to account for the fact that respondents with both a landline and cell phone have a higher probability of selection. In the second weighting stage, demographic adjustments were applied to account for systematic non-response along known population parameters. First, interviews conducted as part of the Health Tracking Poll (excluding the Non-Group Enrollee oversample) were weighted to match estimates for the national population using data from the Census Bureau’s 2015 American Community Survey (ACS) on sex, age, education, race, Hispanic origin, and region along with data from the 2010 Census on population density and current patterns of telephone use from the January-June 2017 National Health Interview Survey. This weighted sample was used to estimate the population share of Non-Group Enrollees, as defined for this study. The combined sample of Non-Group Enrollees (from both the Health Tracking Polls and the oversample) was then weighted separately, and scaled down to the proportion of Non-Group Enrollees in the weighted general population sample.

No reliable administrative data were available for creating demographic weighting parameters for this group, since the most recent Census figures could not account for the changing demographics of non-group insurance enrollees, specifically as they are defined in this study. Therefore, demographic benchmarks were derived by compiling a sample of all respondents ages 18-64 interviewed on the SSRS Omnibus survey between July 1 and December 30, 2017 n=22,066 and weighting this sample to match the national 18-64 year-old population based on the 2017 U.S. Census Current Population Survey March Supplement parameters for age, gender, education, race/ethnicity, region, population density, and marital status, as well phone use based on the most recent estimates from the National Health Interview Survey NHIS). This weighted sample was then filtered to include respondents meeting the definition of Non-Group Enrollee (n=1,989), and the demographics of this group were used as post-stratification weighting parameters for the combined Non-Group Enrollee sample.

The margin of sampling error including the design effect for the full sample is plus or minus 2 percentage points. Numbers of respondents and margins of sampling error for key subgroups are shown in the table below. For results based on other subgroups, the margin of sampling error may be higher. Sample sizes and margins of sampling error for other subgroups are available by request. Note that sampling error is only one of many potential sources of error in this or any other public opinion poll. Kaiser Family Foundation public opinion and survey research is a charter member of the Transparency Initiative of the American Association for Public Opinion Research.


GroupN (unweighted)M.O.S.E.
Total2,534±2 percentage points
 
Non-Group Enrollees ages 18-64279±7 percentage points
Age 18-64 with Employer Insurance901±4 percentage points
Uninsured ages 18-64182±8 percentage points
Marketplace Enrollees age 18-64177±9 percentage points


Endnotes

  1. Sixty-six percent of non-group enrollees in this survey are marketplace enrollees. ↩︎
  2. Centers for Medicare & Medicaid Services, December 2017,   https://www.cms.gov/Newsroom/MediaReleaseDatabase/Fact-sheets/2017-Fact-Sheet-items/2017-12-13-2.html ↩︎
  3. A Kirzinger, L Hamel, C Muñana, Kaiser Health Tracking Poll – October 2017: Experiences of the Non-Group Marketplace Enrollees, https://modern.kff.org/health-reform/poll-finding/kaiser-health-tracking-poll-october-2017-experiences-of-the-non-group-marketplace-enrollees/ ↩︎
  4. A Kirzinger, B Wu, M Brodie, Kaiser Health Tracking Poll – January 2018: The Public’s Priorities and Next Steps for the Affordable Care Act, https://modern.kff.org/health-reform/poll-finding/kaiser-health-tracking-poll-january-2018-publics-priorities-next-steps-affordable-care-act/ ↩︎
  5. K Pollitz, Understanding Short-Term Limited Duration Health Insurance, https://modern.kff.org/health-reform/issue-brief/understanding-short-term-limited-duration-health-insurance/ ↩︎
How Might Older Nonelderly Medicaid Adults with Disabilities Be Affected By Work Requirements in Section 1115 Waivers?

Authors: MaryBeth Musumeci, Julia Foutz, and Rachel Garfield
Published: Mar 30, 2018

Data Note

Most of the states with approved or pending Section 1115 waivers that condition Medicaid eligibility on work would apply those requirements to all or most nonelderly adults (ages 19-64) who are not receiving Supplemental Security Income (SSI) cash assistance, including older nonelderly adults (ages 50-64).1  Older nonelderly adults may be limited in their ability to satisfy a work requirement due to barriers resulting from age and/or disability. Previous analysis shows that many nonelderly Medicaid adults (ages 19-64) have functional limitations that may interfere with their ability to work but do not rise to the stringent SSI level of disability, making them potentially subject to work requirements. Older nonelderly adults are over twice as likely to have a disability than younger adults (17% vs. 7%).2  Furthermore, older nonelderly adults account for nearly half (45%) of all nonelderly Medicaid adults with a disability but not SSI who could be affected by a work requirement.3  This analysis examines the implications of work requirements for Medicaid adults ages 50 to 64 (referred to as “older nonelderly Medicaid adults”) and provides national and state level estimates of their disability, SSI, and work status using data from the 2016 American Community Survey (ACS).

How might older nonelderly #Medicaid adults ages 50 to 64 with disabilities be affected by #workrequirements in Section 1115 #waivers?

Key Findings

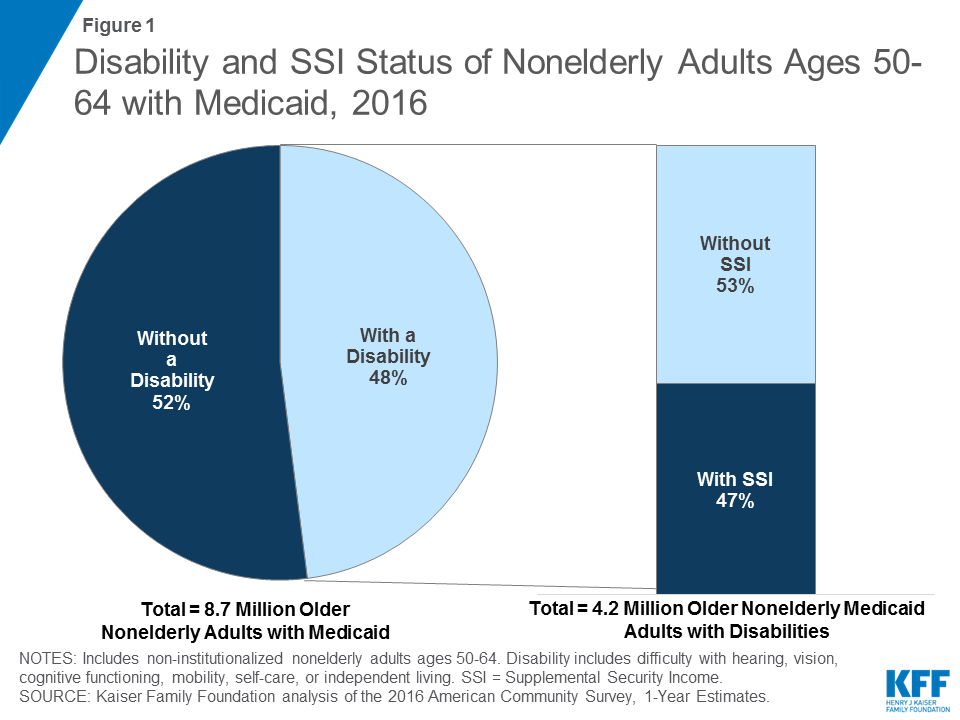
Of the 8.7 million older nonelderly Medicaid adults, nearly half (48%) report having a disability according to the ACS definition (Figure 1). The ACS classifies a person as having a disability if the person reports serious difficulty with hearing, vision, cognitive functioning (concentrating, remembering, or making decisions), mobility (walking or climbing stairs), self-care (dressing or bathing), or independent living (doing errands, such as visiting a doctor’s office or shopping, alone).4 

Over half (53%) of older nonelderly Medicaid adults with a disability do not receive SSI cash assistance (Figure 1); these adults could be subject to a Medicaid work requirement, despite experiencing serious difficulty in at least one ACS functional area. Although the Centers for Medicare and Medicaid Services (CMS) work requirement guidance excludes people who are eligible for Medicaid based on a disability (such as those who receive SSI), many adults with disabilities will face Medicaid work requirements because they qualify for Medicaid on another basis (i.e., low-income).5  The CMS guidance allows states to apply work requirements to “working age” enrollees (those under age 65).  The guidance provides that states “may” provide exemptions from a work requirement, such as an exemption based on age, but leaves that decision up to the states. People subject to work requirements must verify that they are meeting the required number of hours or meet a specified exemption.

Figure 1: Disability and SSI Status of Nonelderly Adults Ages 50-64 with Medicaid, 2016

Eight of the 10 states with approved or pending Medicaid work requirement waivers as of March, 2018, would apply those requirements to all or most older nonelderly Medicaid adults.6  Just two states (Arkansas and Wisconsin) would exempt all older nonelderly (age 50+) Medicaid adults from work requirements. One state (Arizona) would exempt those age 55 and older, and two states (Indiana and Utah) would exempt those age 60 and older. Medicaid work requirements would apply to all older nonelderly Medicaid adults in the remaining five states (Kansas, Kentucky, Maine, Mississippi, and New Hampshire) under the current proposals (Table 1).

Table 1:  State Section 1115 Medicaid Work Requirement Waivers, as of March 13, 2018
State Waiver StatusCovered Populations*Age Group Exemption
ArkansasApproved – implementation June, 2018Expansion adults50+
ArizonaPendingExpansion adults55+
IndianaApproved – implementation 2019Expansion and traditional adults60+
KansasPendingTraditional adults (parents 0-38% FPL)65+
KentuckyApproved – implementation July, 2018Expansion and traditional adults65+
MainePendingTraditional adults (parents 0-105% FPL)65+
MississippiPendingTraditional adults (parents 0-27% FPL)65+
New HampshirePendingExpansion adults65+
UtahPendingTraditional adults (parents 0-60% FPL; childless adults 0-100% FPL)60+
WisconsinPendingTraditional adults (childless adults 0-100% FPL)50+
NOTE:  *Other groups, such as Transitional Medical Assistance, family planning only, or former foster care youth, may be included in some states. SOURCE:  Kaiser Family Foundation analysis of states’ Section 1115 waiver applications posted on Medicaid.gov.

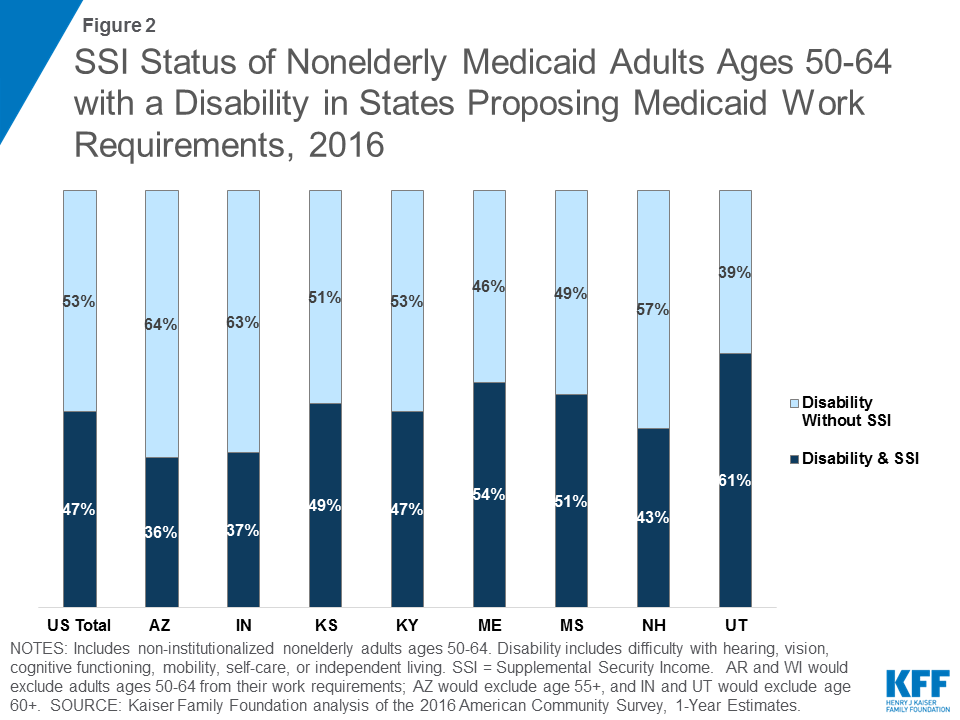
In the eight states that would apply Medicaid work requirements to all or most older nonelderly adults, substantial shares of these adults have a disability but do not receive SSI, making them subject to the work requirement unless they are otherwise exempt.7  The share of older nonelderly Medicaid adults with a disability but not SSI in these states ranges from 39% in Utah8  to 64% in Arizona.9   These shares are 63% in Indiana10  and 53% in Kentucky, the two states with CMS approval to implement work requirement waivers that include all or most older nonelderly Medicaid adults to date (Figure 2).  (Arkansas also has CMS approval to implement a Medicaid work requirement, but, as indicated above, its waiver exempts adults ages 50 and over.)

Figure 2: SSI Status of Nonelderly Medicaid Adults Ages 50-64 with a Disability in States Proposing Medicaid Work Requirements, 2016

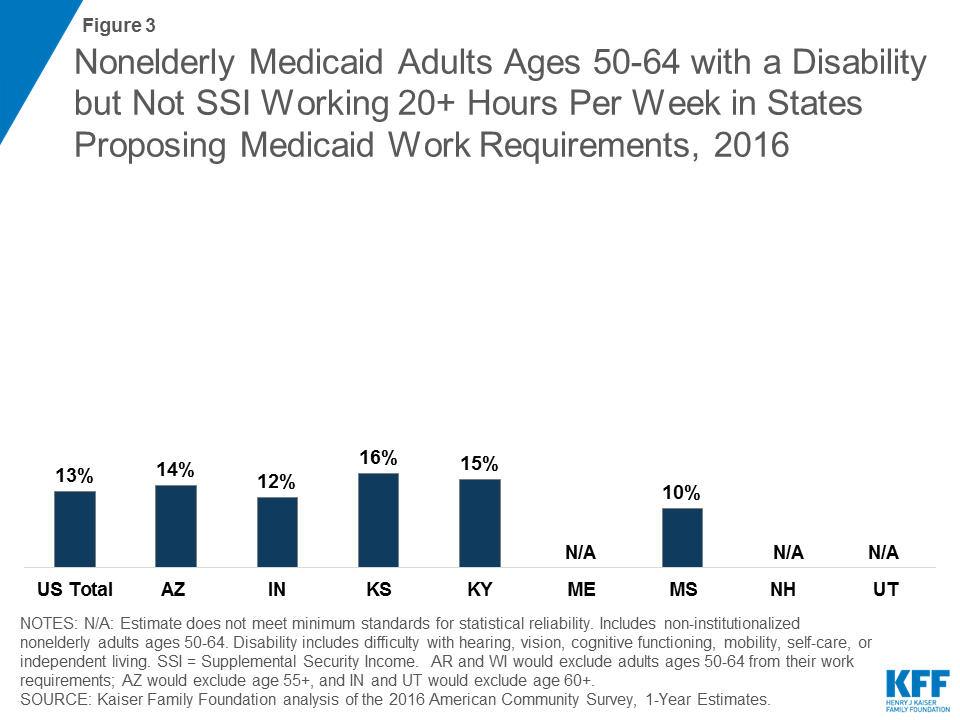
Just over 1 in 10 (13%) older nonelderly Medicaid adults with disabilities but not SSI are working 20 or more hours per week (Figure 3). The majority (83%) of older nonelderly Medicaid adults with a disability but not SSI are not working (unemployed or not in the labor force) (Table 3). For comparison, Kentucky’s approved waiver requires enrollees under age 65 to work 80 hours per month (equivalent to 20 hours per week), and Indiana’s approved waiver scales up to a requirement of 20 hours per week (after 18 months of enrollment) for those under age 60. Work rates vary, but are generally low, in the eight states with approved or pending Medicaid work requirement waivers that do not exempt any older nonelderly Medicaid adults based on age. In these states, the share of older nonelderly Medicaid adults with a disability but not SSI who are working 20 or more hours per week ranges from 10% in Mississippi to 16% in Kansas. (Figure 3).

Figure 3: Nonelderly Medicaid Adults Ages 50-64 with a Disability but Not SSI Working 20+ Hours Per Week in States Proposing Medicaid Work Requirements, 2016

Discussion

Most of the states with approved or pending Medicaid work requirement waivers would apply those requirements to all or most older nonelderly adults. Older nonelderly adults may face age-related barriers to complying with work requirements, and these barriers may be compounded for those who also have a disability. For example, people with low incomes are likely to be working in jobs with physical demands, such as being on one’s feet all day, walking, carrying or lifting heavy items, or performing repetitive motions. These jobs can be increasingly difficult to perform as people age. In addition, over half of older nonelderly Medicaid adults have a disability but do not receive SSI cash assistance. This population could be subject to work requirements despite experiencing a disability that limits their ability to work, such as a serious difficulty in the ability to hear; see; concentrate, remember, or make decisions; walk or climb stairs; or perform daily self-care and/or independent living tasks.

In Indiana and Kentucky, the two states with approved work requirement waivers that apply to all or most older nonelderly Medicaid adults, substantial shares of this population (63% in IN,11  and 53% in KY) have a disability but do not receive SSI. They therefore could be adversely affected if they do not comply with the work and documentation requirements or obtain an exemption, which depends on what the state exemption policies are and how they are implemented. By contrast, small shares of older nonelderly Medicaid adults with a disability but not SSI in these states are currently working at a level likely to satisfy the work requirement (20 or more hours per week, 13% in IN,12  and 15% in KY). Some older nonelderly adults with disabilities but not SSI might be exempt from the work requirement if they are determined to be “medically frail.” However, it is unclear whether everyone in this group will qualify for an exemption, how the process will work, and what specific criteria will apply.

Kentucky plans to implement its work requirement in July, 2018, and Indiana plans to implement in 2019. As these waivers are implemented, it will be important to monitor the impact on Medicaid beneficiaries, especially those whose older age and/or health status could affect their ability to comply. It will be important to assess how the work requirements and exemptions affect older nonelderly Medicaid adults with disabilities and the impact on access to coverage and care.

Table 2: Older Nonelderly Medicaid Adults by Disability and SSI Status, 2016
 Total Older Nonelderly Medicaid Adults Ages 50-64Total Older Nonelderly Medicaid Adults with a DisabilityOlder Nonelderly Medicaid Adults with a Disability but Not SSI
As a Share of Older Nonelderly Medicaid Adults with a DisabilityNumber
US Total8,730,3004,161,50053%2,222,700
Alabama117,30075,10043%32,400
Alaska14,6006,70054%3,600
Arizona214,20097,60064%62,100
Arkansas103,30053,10053%28,300
California1,455,700506,40057%286,400
Colorado134,20059,00061%36,100
Connecticut108,30041,30066%27,100
Delaware27,70012,40052%6,400
DC33,40014,90066%9,800
Florida465,700251,40048%120,400
Georgia192,900121,00039%47,300
Hawaii34,80011,20057%6,500
Idaho22,10013,50040%5,500
Illinois344,600156,10064%99,600
Indiana153,00083,90063%53,100
Iowa75,10036,50056%20,400
Kansas41,00026,70051%13,600
Kentucky192,900104,40053%55,500
Louisiana143,70084,10047%39,200
Maine41,60025,50046%11,800
Maryland148,00071,90056%40,200
Massachusetts275,700105,80056%59,000
Michigan344,200180,40054%97,300
Minnesota135,20056,30064%36,300
Mississippi83,90053,30049%26,000
Missouri110,40070,20059%41,600
Montana28,00015,50060%9,300
Nebraska20,70013,00049%6,400
Nevada76,70034,70059%20,300
New Hampshire25,90011,50057%6,500
New Jersey216,50087,50046%40,000
New Mexico85,40040,50056%22,600
New York811,100290,40053%154,100
North Carolina199,800116,30050%57,800
North Dakota10,3005,70051%2,900
Ohio331,200162,10064%103,100
Oklahoma61,00041,30050%20,800
Oregon140,10063,40058%36,500
Pennsylvania360,500199,70052%104,800
Rhode Island41,10021,70040%8,700
South Carolina109,70067,70047%32,100
South Dakota11,7007,10039%2,800
Tennessee178,100114,30047%53,200
Texas411,400246,30043%106,300
Utah32,20018,90039%7,300
Vermont26,8009,80052%5,100
Virginia99,40057,70058%33,700
Washington205,20098,70061%60,000
West Virginia84,90045,90054%24,600
Wisconsin140,00068,20054%36,800
Wyoming9,1005,10034%1,700
NOTES: Includes non-institutionalized nonelderly adults ages 50-64. SSI = Supplemental Security Income. Disability includes serious difficulty with hearing, vision, cognitive functioning, mobility, self-care, or independent living. SOURCE: Kaiser Family Foundation analysis based on the 2016 American Community Survey, 1-Year Estimates.
 Table 3: Work Status of Older Nonelderly Medicaid Adults with a Disability but Not SSI, 2016
 Total Non-SSI Medicaid Adults with Disabilities, Ages 50-64Total WorkingShare WorkingShare Working 20+ Hours/WeekShare Working <20 Hours/WeekShare Unemployed or Not in Labor Force
US Total2,222,700370,20017%13%3%83%
Alabama32,4002,5008%7%N/A92%
Alaska3,600N/AN/AN/AN/A85%
Arizona62,10010,60017%14%3%83%
Arkansas28,3003,20011%9%N/A89%
California286,40053,30019%16%3%81%
Colorado36,1007,10020%14%5%80%
Connecticut27,1004,10015%12%N/A85%
Delaware6,4001,60024%23%N/A76%
DC9,800N/AN/AN/AN/A84%
Florida120,40013,50011%9%N/A89%
Georgia47,3004,60010%8%N/A90%
Hawaii6,500N/AN/AN/AN/A85%
Idaho5,500N/AN/AN/AN/A84%
Illinois99,60016,20016%13%3%84%
Indiana53,1008,50016%12%N/A84%
Iowa20,4005,50027%19%8%73%
Kansas13,6002,40018%16%N/A82%
Kentucky55,5009,30017%15%N/A83%
Louisiana39,2004,00010%8%N/A90%
Maine11,800N/AN/AN/AN/A87%
Maryland40,2009,00022%19%N/A78%
Massachusetts59,00012,90022%16%6%78%
Michigan97,30018,30019%14%5%81%
Minnesota36,30011,00030%22%9%70%
Mississippi26,0003,00011%10%N/A89%
Missouri41,6004,30010%8%N/A90%
Montana9,3001,600N/AN/AN/A83%
Nebraska6,400N/AN/AN/AN/A76%
Nevada20,3001,90010%N/AN/A90%
New Hampshire6,500N/AN/AN/AN/A81%
New Jersey40,0007,40018%15%4%82%
New Mexico22,6005,80026%23%N/A74%
New York154,10032,80021%18%3%79%
North Carolina57,8005,50010%8%N/A90%
North Dakota2,900N/AN/AN/AN/A92%
Ohio103,10017,50017%13%3%83%
Oklahoma20,8002,10010%10%N/A90%
Oregon36,5007,80021%17%N/A79%
Pennsylvania104,80019,00018%12%6%82%
Rhode Island8,7002,30026%25%N/A74%
South Carolina32,1003,80012%10%N/A88%
South Dakota2,800N/AN/AN/AN/A84%
Tennessee53,2006,70013%11%2%87%
Texas106,30014,50014%11%3%86%
Utah7,300N/AN/AN/AN/A87%
Vermont5,100N/AN/AN/AN/A69%
Virginia33,7003,80011%10%N/A89%
Washington60,00011,30019%13%6%81%
West Virginia24,6003,70015%12%N/A85%
Wisconsin36,8006,20017%13%4%83%
Wyoming1,700N/AN/AN/AN/A75%
NOTES: Includes non-institutionalized nonelderly adults ages 50-64. SSI = Supplemental Security Income. Disability includes serious difficulty with hearing, vision, cognitive functioning, mobility, self-care, or independent living. SOURCE: Kaiser Family Foundation analysis based on the 2016 American Community Survey, 1-Year Estimates.

Endnotes

  1. People who receive SSI cash assistance (for those with low incomes and disabilities) are not subject to Medicaid work requirements according to Centers for Medicare and Medicaid Services (CMS) guidance. ↩︎
  2. Kaiser Family Foundation analysis of the 2016 American Community Survey, 1-Year Estimates. ↩︎
  3. Ibid. ↩︎
  4. The ACS questions used to classify an individual as having a disability include:  (1) Is this person deaf, or does he/she have serious difficulty hearing? (2) Is this person blind, or does he/she have serious difficulty seeing, even when wearing glasses? (3) Because of a physical, mental, or emotional condition, does this person have serious difficulty concentrating, remembering, or making decisions? (4) Does this person have serious difficulty walking or climbing stairs? (5) Does this person have difficulty dressing or bathing? (6) Because of a physical, mental, or emotional condition, does this person have difficulty doing errands alone, such as visiting a doctor’s office or shopping?  U.S. Census Bureau, How Disability Data are Collected from the American Community Survey, (Oct. 17, 2017). The ACS definition of disability is intended to capture whether a person has a functional limitation that results in a participation limitation and is similar to measures used in other federal surveys, such as the National Health Interview Survey. ↩︎
  5. People who meet the ACS definition of disability but do not receive SSI can be eligible for Medicaid as expansion adults or Section 1931 parents (based solely on their low income). They also may be eligible for Medicaid through an optional disability-related pathway (such as the state option to cover people with disabilities up to the federal poverty level or a home and community-based services waiver). People who qualify for Medicaid both as an expansion adult and based on a disability can choose the group through which they enroll in coverage; benefit packages may differ by coverage group.  42 C.F.R. § 435.911 (c) (2), (d). ↩︎
  6. These states include those with waiver approved by or pending with CMS. ↩︎
  7. For example, states may exempt people who are medically frail, in substance use disorder treatment, students, experiencing a “catastrophic event,” caregiving, or receiving unemployment compensation. Kaiser Family Foundation, Medicaid and Work Requirements:  New Guidance, State Waiver Details, and Key Issues (Jan. 2018). ↩︎
  8. Utah would exempt adults ages 60 and older from its work requirement. Data are for ages 50-64. ↩︎
  9. Arizona would exempt adults ages 55 and older from its work requirement. Data are for ages 50-64. ↩︎
  10. Indiana exempts ages 60 and older from its work requirement. Data are for ages 50-64. ↩︎
  11. Ibid. ↩︎
  12. Ibid. ↩︎

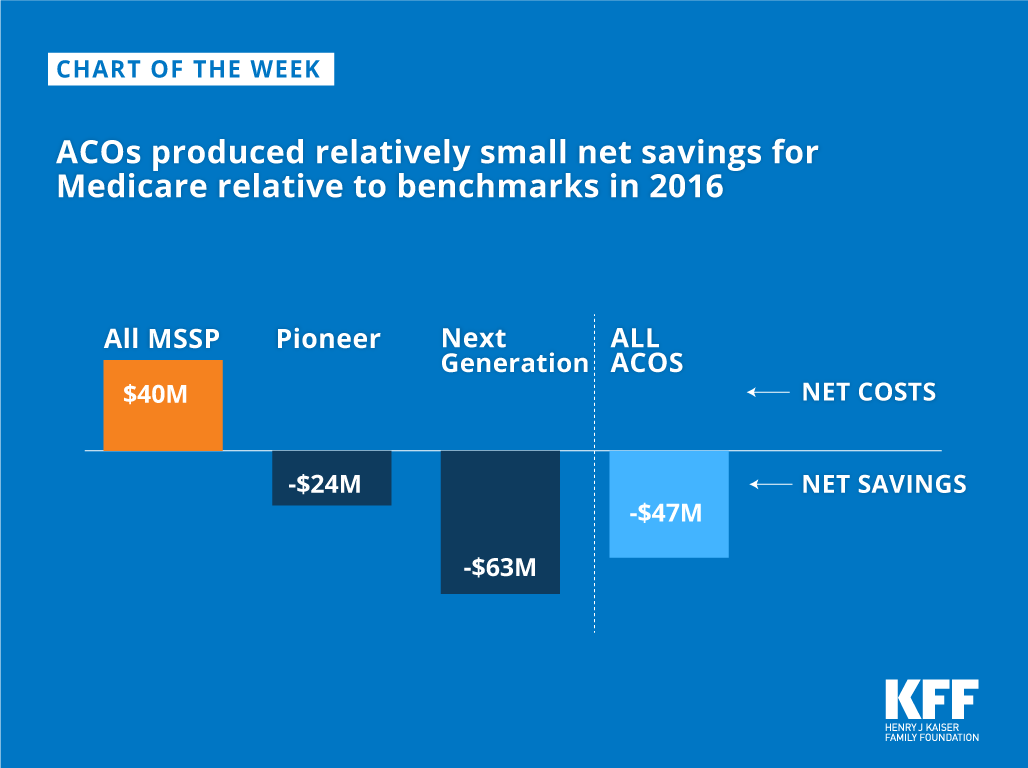
ACOs produced relatively small net savings for Medicare relative to benchmarks in 2016

Published: Mar 29, 2018

Source

Kaiser Family Foundation analysis of 2016 CMS Public Use Files for MSSP, Pioneer, and Next Generation ACOs.

State and Federal Contraceptive Coverage Requirements: Implications for Women and Employers

Published: Mar 29, 2018

Issue Brief

Contraceptive Coverage under the Affordable Care Act (ACA) has made access to the full range of contraceptive methods affordable to millions of women. Since it was first issued in 2012, this provision has been controversial and has been the focus of two major cases that have reached the Supreme Court. Following the Hobby Lobby ruling, the Obama Administration took the stand that almost all women had an entitlement to the contraceptive benefit and developed an “accommodation” to assure they would still get coverage, even if their employer had religious objections to contraception. The Trump Administration, in contrast, has prioritized the rights of employers, and in October 2017, issued regulations that significantly broadened the exemption to nearly any employer with a religious or moral objection. The new regulations have been challenged by 8 states and have been blocked from being implemented pending the outcome of the litigation.

Before the ACA was passed, many states had enacted contraceptive equity laws that required plans to treat contraceptives in the same way they covered other services. In addition, since the ACA was passed, a number of states have enacted laws that basically codify in state legislation the ACA benefit rules (requiring all plans to cover, without cost-sharing each of the 18 FDA approved contraceptive methods). This issue brief provides an update on the status of the continuing litigation on the federal contraceptive requirement and explains the interplay between the federal and state contraceptive coverage laws and the implications for employers and women.

Background on State and Federal Contraceptive Coverage Requirements

Before the ACA, coverage for prescription contraceptives was generally widespread in the private and public sectors, but not universal, and certainly not free of cost-sharing. In 2000, a ruling by the Employment Equal Opportunity Commission found that employers that covered preventive prescription drugs and services but did not cover prescription contraceptives were in violation of the Civil Rights Act.1  Currently, 30 states and DC2  require insurance plans to cover contraceptives, with a wide range of coverage and cost-sharing requirements, and exemptions among these mandates (Appendix A). State laws, however, do not have authority over all plans; they only apply to state regulated (fully-insured) plans, but not self-funded plans under ERISA where 60% of covered workers are insured.3 

The ACA is the first law to set preventive coverage requirements for health insurance across all markets – individual, small group, large group and self-insured plans. Starting in 2012, all new private plans were required to cover, without cost-sharing, the full range of contraceptive services and supplies approved by the Food and Drug Administration (FDA) as prescribed for women. Only employers that were classified as a “house of worship” were exempted from this requirement. While a number of states had contraceptive equity laws that required plans to cover some or all methods, cost-sharing typically applied. Fully-insured plans must comply with both state and federal laws. For some health services, the federal law may require a higher level of benefits, and for other services the state law may require a higher level of benefits.

How Would the New Federal Regulations Change the Contraceptive Coverage Exemptions for Employers?

Since they were announced in 2011, the ACA contraceptive coverage rules have evolved through litigation and new regulations (Table 1). Most employers are required to include the coverage in their plans. Limited categories of employers are eligible for an exemption under the Obama Administration regulations (Table 2). Houses of worship can choose to be exempt from the requirement if they have religious objections. Workers and dependents of exempt employers do not have coverage for either some or all FDA approved contraceptive methods. Religiously-affiliated nonprofits and closely held for-profit corporations4  can opt out of providing contraceptive coverage by electing an accommodation, but are not eligible for an exemption. In these cases, women workers and dependents covered by an employer electing an accommodation get contraceptive coverage, but it is the insurer, not the employer, who pays for the contraceptive coverage.

Table 1: Who Regulates Health Insurance Plans
Type of PlanWho assumes the risk?Who is the regulator and which laws apply?
Fully-Insured PlanInsurer collects premiums and assumes the risk of providing covered servicesState insurance regulators – state AND federal regulations apply
Self-Insured ERISA planEmployer assumes the risk of providing covered services and usually contracts with a third party administrator (TPA) to manage the claims payment process.Department of Labor under the Employer Retirement Income Security Act (ERISA)- only federal regulations apply

Some nonprofits, including the Little Sisters of the Poor, have continued to challenge the accommodation as requiring them to be complicit in the provision of contraceptives which they believe to be sinful. These cases made their way through the federal courts and were heard by the Supreme Court. In May 2016, the Supreme Court remanded Zubik v. Burwell, sending 7 cases brought by religious nonprofits objecting to the contraceptive coverage accommodation back to the respective Federal Courts of Appeal. These lawsuits were not resolved at the time of the November 2016 presidential election. The Trump Administration has not continued to defend these lawsuits, and has settled with most of the litigants.

Timeline of Recent Contraceptive Coverage Regulations & Litigation

Oct. 6, 2017: Trump Administration issues new regulations expanding exemption without the usual notice and comment period.

Nov.– Dec. 2017: 4 lawsuits were filed by states challenging the regulations as violating the 1st and 5th Amendments of the Constitution and contending the Trump Administration did not follow the Administrative Procedure Act.

Dec. 2017: Federal District Courts in PA and CA courts issue preliminary injunctions blocking implementation of new regulations pending outcome of the litigation.

Jan.– Feb. 2018: Trump Administration appealed PA case to 3rd Circuit Court of Appeal; Trump Administration and the nonprofits granted party status (Little Sisters of the Poor & March for Life) appealed CA case to 9th Circuit Court of Appeal.

March 2018: Federal court in MA dismissed the case, ruling that MA lacks standing.

The Trump Administration’s Interim Final Regulations were issued on October 6, 2017 and took effect the date they were issued without an opportunity for public notice and comment, as normally required under the Administrative Procedure Act. Under the October 2017 regulations, there would no longer be a guaranteed right of contraceptive coverage for female employees and dependents or students. These regulations greatly expand the number of employers that are eligible for an exemption to all nonprofit and closely held for-profit employers with objections to contraceptive coverage based on religious beliefs or moral convictions, including private institutions of higher education that issue student health plans. In addition, publicly traded for-profit companies with objections based on religious beliefs would also qualify for an exemption. Table 2 presents the changes to the contraceptive rule from the Obama Administration to those included in the new Interim Final regulations issued by the Trump Administration. Any employer eligible for an exemption could instead opt for an accommodation by notifying their insurer, third party administrator, or the government. If an employer opts for an accommodation, then their workers and dependents would still have contraceptive coverage without cost-sharing. It is not clear how many employers would choose an accommodation rather than an exemption.

Four nonprofit advocacy groups and 8 states (CA, DE, VA, MD, NY, PA, MA, & WA) have filed lawsuits challenging the new regulations. The federal court in Massachusetts ruled that the state of Massachusetts lacks “standing” because the state cannot show that it will likely suffer future injury from the regulations and dismissed the case. In the cases lead by California and Pennsylvania, the federal courts have issued preliminary injunctions blocking the enforcement of these regulations pending the outcome of the litigation. These decisions have been appealed to the 3rd Circuit (PA) and 9th Circuit Courts of Appeal (CA, DE, VA, MD, NY).5  The Supreme Court will likely ultimately hear these cases, which would mark the third round of litigation involving the contraceptive coverage provision reaching the high court.

Table 2: Summary of Changes in the Contraceptive Coverage Regulations for Objecting Entities
 Obama AdministrationCurrently EffectiveTrump AdministrationIssued October 6, 2017-Blocked by Courts December 2017
What types of contraceptives must plans cover without cost-sharing?
  • At least one of each of the 18 FDA approved contraceptive methods for women, as prescribed, along with counseling and related services must be covered without cost-sharing.
  • No change.
Are any employers “exempt” from the contraceptive mandate?
  • Religious institutions defined as “houses of worship.”
  • Grandfathered plans.
  • No notice to employees is required. Women workers and female dependents must pay for their own contraceptives.
  • Religious institutions defined as “houses of worship.”
  • Grandfathered plans.
  • Nonprofit or for-profit employers (including publicly traded companies), insurers, or private colleges or universities that issue student insurance plans with a religious objection to contraceptive coverage.
  • Nonprofit or closely held for-profit employers, insurers, or private colleges or universities that issue student insurance plans with a moral objection to contraceptive coverage.
  • Notice is only required if the plan previously included contraceptive coverage. Women workers and female dependents must pay for their own contraceptives.
Who pays for contraceptive coverage for employees of organizations receiving an exemption?
  • The cost of contraceptives is borne by women workers and female dependents.
  • There is no guarantee of contraceptive coverage for employees of an exempt organization.
  • The employer may choose to cover some methods, but has no obligation to cover all 18 FDA methods without cost-sharing.
  • No change.
What type of employers may seek an “accommodation” to avoid paying for contraceptives in their plans?
  • Closely held for-profit corporations and religiously affiliated nonprofits with religious objections to contraception can opt out of providing and paying for contraceptive coverage.
  • Notice must be provided to either their insurer, third party administrator, or the federal government of their objection.
  • Women workers and female dependents receive no cost contraceptive coverage.
  • Any entity (except for houses of worship) eligible for an exemption can choose the accommodation instead of the exemption.
  • Notice must be provided to either their insurer, third party administrator, or the federal government of their objection.
  • Women workers and female dependents receive no cost contraceptive coverage.
Who pays for contraceptive coverage for employees of organizations receiving an accommodation?
  • Insurance companies of firms obtaining an accommodation must pay for contraceptive coverage.
  • Third-party administrators (TPA) of self-funded health plans must cover the costs of contraceptives for employees. The costs of the benefit are offset by reductions in the fees the TPA pays to participate in the federal exchange.
  • No change.
When can entities change from an accommodation to an exemption?
  • N/A
  • When an employer or private college or university currently using the accommodation opts for an exemption, the revocation of contraceptive coverage will be effective on the first day of the first plan year that begins 30 days after the date of the revocation or 60-day notice may be given in a summary of benefits statement.
  • The issuer or third party administrator is responsible for providing the notice to the beneficiaries.

How Does the ACA Contraceptive Coverage Requirement Interact with State Laws Regulating Fully-Insured Plans?

As discussed earlier, federal law applies to all plans while state law applies to only individual plans and fully-insured group plans. Currently, 29 states and DC require insurance plans to cover contraceptives, with a wide range of coverage and cost-sharing requirements, and exemptions among these mandates.6  Eleven of these states and DC7  have requirements that build on the federal requirement for no cost-sharing for all FDA approved contraceptive methods for women (CA, DE, IL, MA8 , MD, ME9 , NV, NY, OR10 , VT, WA11 ). Some of these states have gone beyond the ACA requirements mandating coverage of covering vasectomies or over-the-counter contraceptives. Most allow for fewer exemptions than currently permitted under federal law. In these states, employers with fully-insured plans must comply with the higher state standard.

While federal law is more expansive in benefit scope than most state laws, the Trump Administration regulations allow more types of employers to be exempt than is permitted by most state laws. Therefore, employers eligible for a federal exemption under the proposed regulations would still have to comply with their state law and provide the level of contraceptive coverage that is required in their state. In some states, these benefit requirements are more limited than those required by the ACA. Nineteen states with contraceptive coverage laws allow cost-sharing and may not require coverage of all FDA approved methods. In these states, some employers with religious or moral objections who offer their workers a fully-insured plan would need to comply with this narrower state benefit requirement, even though the employer would be eligible for an exemption under federal law. As a result, a woman’s coverage will depend on her employer, the type of plan her employer has, and the state in which she resides.

Exemptions Allowed Under State Contraceptive Coverage Laws

  • Nine States (CO, GA, IA MT, NH, NV, VT, WA and WI) do not allow any exemptions to employers.
  • Only three states (IL, MO and WV) allow for an employer with a moral objection to be exempt.
  • All the other states with a contraceptive coverage requirement have allowed exemptions for narrowly defined religious employers, typically houses of worship or employers affiliated with a religious group that primarily employ people of the same faith.

To illustrate the complicated intersection of state and federal law, it is helpful to compare how the contraceptive coverage exemption to the ACA requirement would play out for objecting employers with fully-insured plans in two states: California, a state with an expansive contraceptive coverage law, and Iowa, a state with a minimal contraceptive equity law and no exemption (Table 3). If the Trump Administration’s proposed regulations are implemented, all women enrolled in a fully-insured plan in California will continue to be entitled to coverage of all FDA approved methods without cost-sharing, unless their employer is a house of worship. Only the exemptions offered by the state would be available to objecting employers (with fully-insured plans). Because state law does not apply to self-insured plans, the federal rule would allow employers with those plans to qualify for the broader exemption.

In contrast, Iowa’s law only requires plans to include contraceptive drugs and devices if the plan provides benefits for other outpatient drugs and devices. Unlike the federal and California requirements, plans in Iowa may charge cost-sharing for contraceptives. However, the state law has no religious or moral exemptions. Therefore, a woman enrolled in a fully-insured employer plan that includes outpatient drugs and devices would be guaranteed contraceptive coverage regardless of her employer’s objections to contraception, but could be charged cost-sharing.

Table 3: Comparison of Federal Law to Two States: Scope of Benefits and Exemptions
 Applies toScope of BenefitsExemptions Accommodation
ACA – Current regulations All plansMust cover all FDA approved contraceptives with no cost-sharing; must cover at least one contraceptive within each method categoryHouse of worshipClosely held for-profit employers and religiously affiliated nonprofit employers
ACA – Proposed Trump Administration regulationsAll plansMust cover all FDA approved contraceptives with no cost-sharing; must cover at least one contraceptive within each method categoryAny employer with a religious objection and any employer except publicly traded companies with a moral objectionOptional for any employer eligible for an exemption
California Individual market plans, fully-insured group plans, Medicaid managed care plansMust cover all FDA approved contraceptives with no cost-sharing; must cover each therapeutically unique contraceptiveHouse of worshipNone
Iowa Fully-insured group plansEquity law – no prohibition on cost-sharing, tiering and formulary permittedNoneNone

Conclusion

The outcome of the litigation challenging the Trump Administration’s new regulations is not clear. Currently, the federal government is blocked from enforcing the new regulations. The new regulations would substantially expand the exemption to nonprofit and for-profit employers, as well as to private colleges or universities with religious or moral objections to contraceptive coverage. If the new regulations become effective, for women enrolled in fully-insured employer plans, the scope of their contraceptive benefits would depend on the coverage policies and exemptions established by state laws. Employers who qualify for the exemption under federal law would still need to comply with the state contraceptive requirement. Depending on the state law, employers may still have to provide no-cost coverage for some or all methods of contraception or a narrower set of contraceptive benefits. For women covered by fully-insured plans issued for employers with religious or moral exemptions, their choice of contraceptive methods would be determined by the scope of benefits and exemptions allowed by state law where they live.


Appendix

Appendix Table 1: Exemptions Permitted Under State Laws for Employers with Objections to Contraceptive Coverage
  ReligiousMoral
StateApplies to Individual or Group Market Plans

No Exemptions to Employers(9 states)

House of WorshipReligiously affiliated non-profitOther
Arizona12 GroupXX
ArkansasBothXX
California(no cost-sharing) BothX
ColoradoBothX
Connecticut13 BothXX
District of Columbia(no cost-sharing;effective April 17, 2018)BothX^^
Delaware(no cost-sharing)GroupXX
GeorgiaBothX
HawaiiGroupXX
Illinois(no cost-sharing)BothXXXX
IowaBothX
Maine(no cost-sharing; effective January 2019) BothXX
Maryland(no cost-sharing)BothXX
Massachusetts(no cost-sharing; effective May 2018) BothXX#
MichiganGroupXX
MissouriBothXXX¥X¥
MontanaGroupX
Nevada(no cost-sharing)BothXX
New Hampshire14 GroupX
New Jersey15 BothXX
New Mexico16 BothXX
New York(no cost-sharing) GroupXX
North CarolinaBothXX
Oregon(no cost-sharing; effective January 2019)BothX
Rhode Island17 BothXX
TexasBothXX
Vermont(no cost-sharing)BothX
Washington(no cost-sharing; effective January 2019) BothX
West VirginiaBothX*XXX
WisconsinGroupX
NOTES: AZ defines religious employers non-profit organizations described in section 6033(a)(3)(A)(i) or (iii) OR an entity whose articles of incorporation clearly state that it is a religiously motivated organization and whose religious beliefs are central to the organizations operating principles.

AR, HI, & NC define religious employers as a nonprofit that is organized for religious purpose, primarily employs person who share the religious tenets of the entity, and serves primarily persons who share the religious tenets of the entity.

CA, NY, & OR define religious employers as non-profit organizations described in section 6033(a)(3)(A)(i) or (iii).

CT, MA, ME, NJ, RI define religious employers as “qualified church-controlled organizations” as defined in 26 USC 3121.

DE, MD, NM, & TX state statutes do not define what is considered a religious employer.

^Mirroring the current federal regulations, DC allows for religiously affiliated nonprofits and closely held for-profits to request an accommodation which requires the group health insurer issuer to provide separate payments for contraceptive products and services without imposing any fee or cost-sharing to the employer or policy holders.

IL allows any employer with a moral or religious objection to have an exemption.

# MA only allows houses of worship and church controlled organizations to be eligible for an exemption.

¥MO allows any entity with a moral or religious objection to have an exemption.

NV does not exempt any employers but allows religious insurers to exclude contraceptive coverage.

NY requires the insurer to offer a rider to policy holders so that women will have contraceptive coverage

*WV defines religious an entity whose sincerely held religious beliefs or sincerely held moral convictions are central to the employer’s operating principles, and the entity is an organization listed under 26 U.S.C. 501 (c)(3), 26 U.S.C. 3121, or listed in the Official Catholic Directory published by P.J. Kennedy and Sons

Endnotes

  1. U.S. Equal Employment Opportunity Commission. December 14, 2000. Decision- Contraception. ↩︎
  2. DC’s law becomes effective April 17, 2018. ↩︎
  3. Kaiser Family Foundation and Health Research Educational Trust, 2017 Employer Health Benefits Survey. ↩︎
  4. After the Supreme Court ruling in Burwell v. Hobby Lobby, the Obama administration issued new regulations, extending the accommodation to closely held for profit corporation. The regulations define closely held corporation as an entity that 1) is not a nonprofit, 2) has no publicly traded ownership interests, and 3) has more than 50 percent of the value of its ownership interest owned directly or indirectly by five or fewer individuals. 45 CFR §147.131 (b)(4) ↩︎
  5. The Little Sisters of the Poor (LSOP), a religiously-affiliated nursing home that challenged the accommodation under the Obama Administration regulations, requested party status as an intervenor in both the PA and CA cases. The California Northern District Court granted the LSOP party status, the Pennsylvania Eastern District Court denied the LSOP request for party status. The LSOP have appealed the Pennsylvania Eastern District Court decision to deny them party status. The California Northern District Court also granted March for Life Education and Defense Fund, a nonprofit with moral objections to some contraceptive methods, party status. As parties in the case, the LSOP and March for Life Education and Defense Fund have appealed the California Northern District Court decision issuing the preliminary injunction. ↩︎
  6. Kaiser Family Foundation analysis of state laws, and Insurance Coverage of Contraceptives, State Policies in Brief, as of March 1, 2018, Guttmacher Institute. ↩︎
  7. DC’s law becomes effective April 17, 2018. ↩︎
  8. Massachusetts’s law becomes effective May 2018. ↩︎
  9. Maine’s law becomes effective January 2019. ↩︎
  10. Oregon’s law becomes effective January 2019. ↩︎
  11. Washington’s law becomes effective January 2019. ↩︎
  12. Ariz. Rev. Stat. Ann. § 20-826Y, Ariz. Rev. Stat. Ann. § 20-1057.08A(1)–(2), Ariz. Rev. Stat. Ann. § 20-1402L(1)–(2), Ariz. Rev. Stat. Ann. §20-1404U(1)–(2), Ariz. Rev. Stat. Ann.§ 20-2329A(1)–(2). ↩︎
  13. Conn. Gen. Stat. Ann. § 38A-503e, Conn. Gen. Stat. Ann. § 38A-530e ↩︎
  14. NH Rev. Stat. sec. 420-B:8-gg, NH Rev. Stat. sec. 415:18-I, NH Rev. Stat. sec. 420A:17-c ↩︎
  15. NJ Stat. Ann. § 17:48-6ee, NJ Stat. Ann. § 17:48a-7bb, NJ Stat. Ann. § 17:48E-35.29, NJ Stat. Ann. § 17:48F-13.2, NJ Stat. Ann § 17B:26-2.1y, NJ Stat. Ann. § 17B:27-46.1ee, NJ Stat. Ann. § 17B:27A-7.12, NJ Stat. Ann. § 17B:27A-19.15, NJ Stat. Ann. § 26:2J-4.30, NJ Stat. Ann. § 52:14-17.29j ↩︎
  16. NM Stat § 59A-22-42, NM Stat. Ann. § 59A-46-44 ↩︎
  17. RI Gen. Laws § 27-19-48(b)–(d), RI Gen. Laws § 27-18-57(b)–(e), RI Gen. Laws § 27-20-43(b)–(d), RI Gen. Laws § 27-41-59(b)–(d) ↩︎

HIV and the Opioid Epidemic: 5 Key Points

Published: Mar 27, 2018

Issue Brief

Background

The opioid epidemic represents a significant and worsening public health crisis in the United States. In 2016, 2.1 million Americans were estimated to have an opioid use disorder and nearly 12 million to have misused opioids at some point during the preceding year.1  Death rates from opioid overdoses nearly doubled between 2012 and 2016, rising from 7.4 to 13.3 per 100,000, and in 2016, an estimated 115 people per day died of an opioid overdose.2 

As the opioid epidemic has worsened, there has been growing concern about how injection drug use might fuel transmission of infectious disease. Those misusing opioids commonly move from oral use to insufflation to injection use.3  In fact, an estimated 10-20% of people who abuse prescription opioids move on to inject either opioids or heroin.4  Injection drug use increases the risk of blood-borne infections including HIV, hepatitis, and bacterial endocarditis, which spread efficiently through needle sharing.

In 2015, opioid use resulted in an HIV outbreak in Scott County, Indiana, with 181 individuals diagnosed with HIV by year-end, most of whom were co-infected with hepatitis C (HCV).5 ,6   In response to this outbreak and the threat posed by the opioid epidemic more broadly, the Centers for Disease Control and Prevention (CDC) identified 220 jurisdictions particularly vulnerable to a similar type of outbreak in an effort to detect and prevent additional events.7  Indeed, recent reports suggest new outbreaks may in fact be occurring. In the context of HIV, this has raised particular concerns given that, prior to the opioid epidemic, HIV infections due to injecting drug use had fallen dramatically.

This graphic series highlights key things to know about the intersection of the nation’s HIV and opioid epidemics.

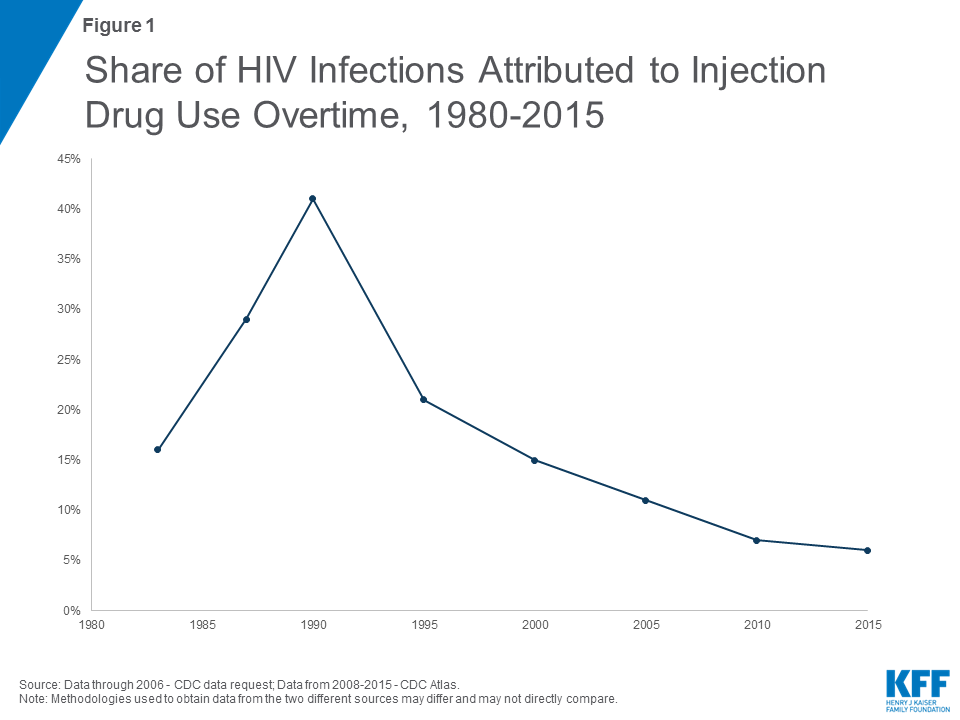
1. The decline in HIV infections associated with injection drug use has been a major success in the fight against HIV in the U.S., with the share of new HIV infections attributed to injection drug use falling from an estimated 40% in 1990 to just 6% in 2015.

Figure 1: Share of HIV Infections Attributed to Injection Drug Use Overtime, 1980-2015

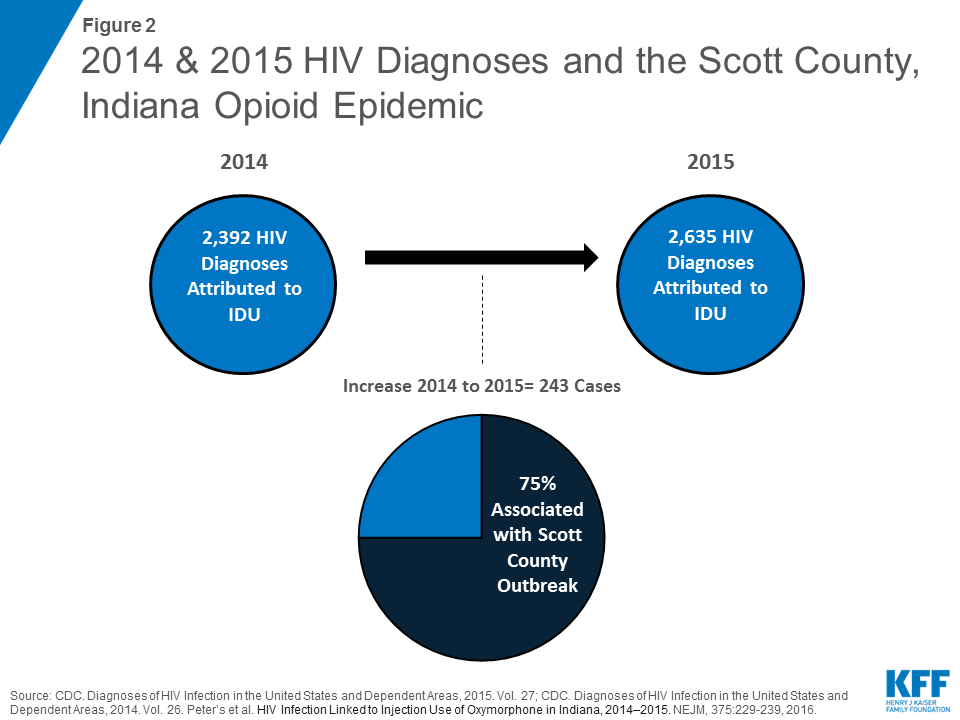
2. However, 2015 marked the first time in two decades where the number of HIV diagnoses attributed to IDU increased, largely associated with the opioid epidemic and subsequent HIV outbreak in Scott County, Indiana. (Early data suggests a decline in 2016, back to 2014 levels, after the peak of this localized outbreak.)8 

Figure 2: 2014 & 2015 HIV Diagnoses and the Scott County, Indiana Opioid Epidemic

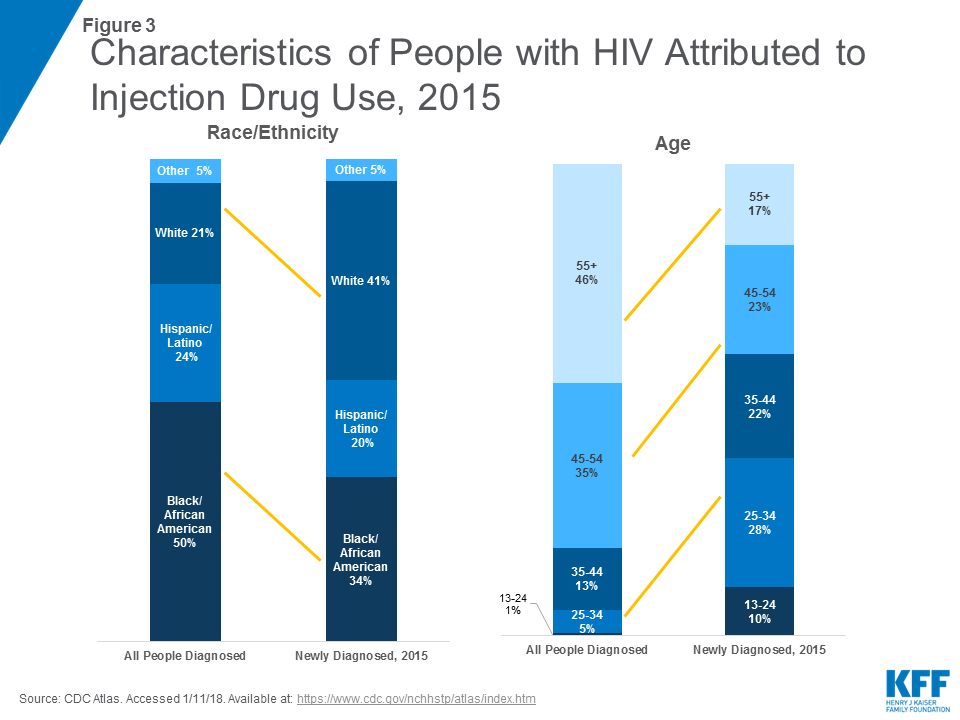
3. The demographics of people with HIV attributed to injection drug are increasingly similar to those most at risk for opioid use and addiction, with greater shares of those newly diagnosed being white and younger, relative to earlier years in the epidemic.

Figure 3: Characteristics of People with HIV Attributed to Injection Drug Use, 2015

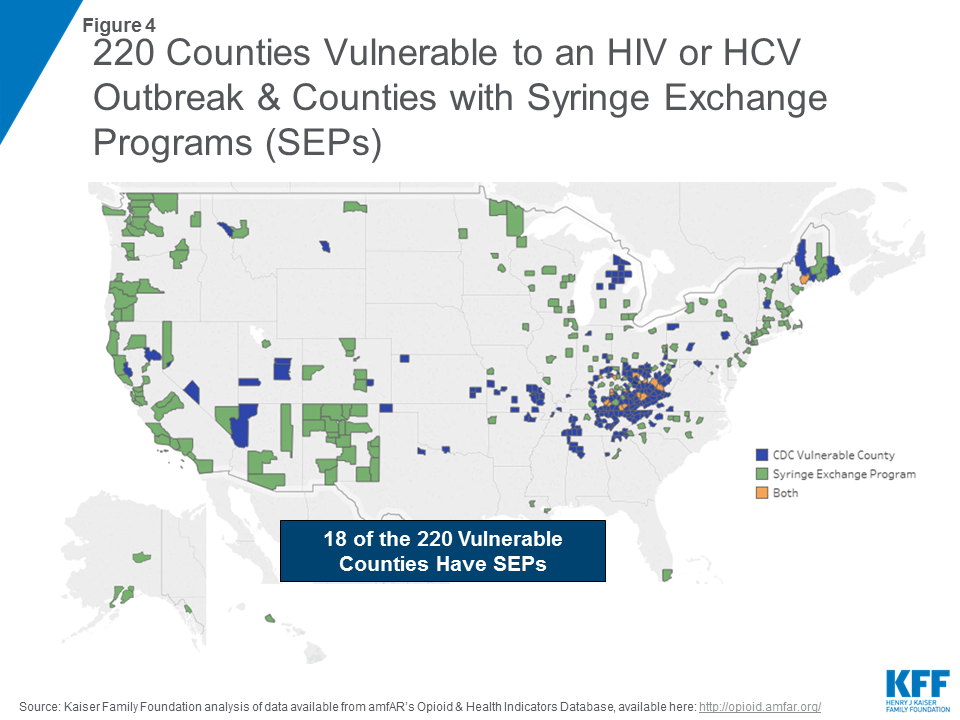
4. While there are several proven strategies available to reduce risk of infectious disease associated with injection drug use, including the provision of Syringe Exchange Programs (SEPs), access varies significantly across the country and does not always align with opioid epidemic epicenters.9  Of the 220, mostly rural, counties CDC determined were potentially vulnerable to an HIV or HCV outbreak among people who inject drugs, just 8% have an SEP in place.10 ,11 

Figure 4: 220 Counties Vulnerable to an HIV or HCV Outbreak & Counties with Syringe Exchange Programs (SEPs)

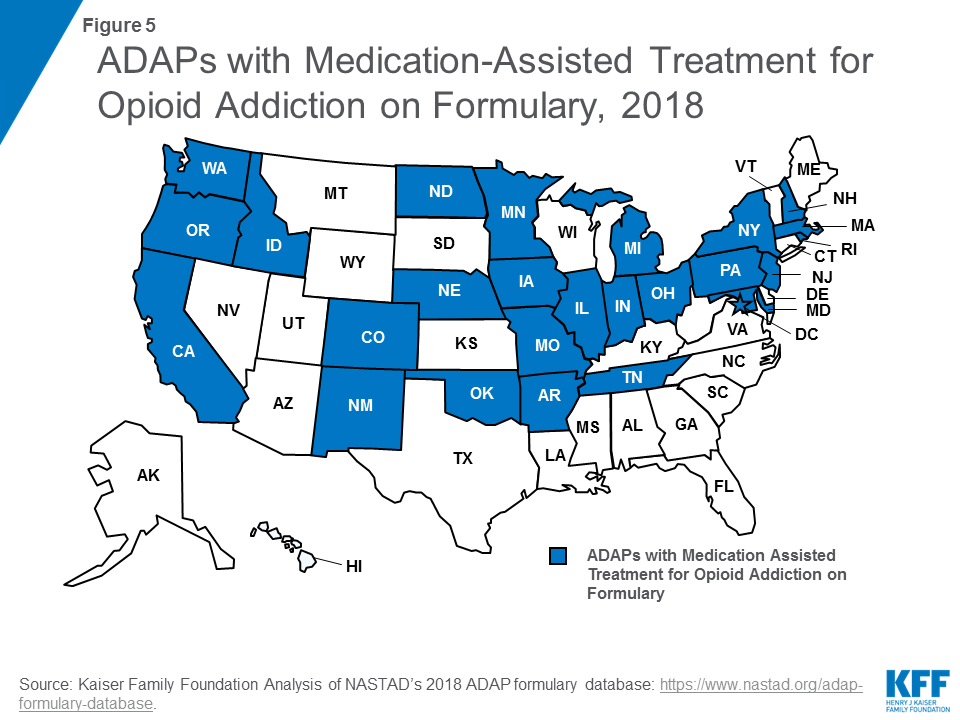
5. While all Medicaid programs and some private plans cover Medication-Assisted Treatments (MATs) to address substance use problems, the AIDS Drug Assistance Program (ADAP) of the federal Ryan White HIV/AIDS Program offers an additional source of support for people with HIV with limited or no insurance coverage.12 ,13  However, access varies across the country with just half (26) of state ADAPs covering at least one of the three commonly prescribed MATs for opioid addiction.14 ,15 

Figure 5: ADAPs with Medication-Assisted Treatment for Opioid Addiction on Formulary, 2018

Endnotes

  1. SAMHSA. 2016 National Survey on Drug Use and Health. https://www.samhsa.gov/data/sites/default/files/NSDUH-FFR1-2016/NSDUH-FFR1-2016.pdf ↩︎
  2. Kaiser Family Foundation. State Health Facts. Opioid Overdose Deaths. https://modern.kff.org/other/state-indicator/opioid-overdose-deaths-by-gender/ ↩︎
  3. Peters, P., et al. (2016.) “HIV Infection Linked to Injection Use of Oxymorphone in Indiana, 2014–2015.” New England Journal of Medicine. 375:229-239. ↩︎
  4. Van Handle, M., et al. (2016). “County-level Vulnerability Assessment for Rapid Dissemination of HIV or HCV Infections among Persons who Inject Drugs, United States.” Journal of AIDS. 73:3, 323-331 ↩︎
  5. Peters, P., et al. (2016.) “HIV Infection Linked to Injection Use of Oxymorphone in Indiana, 2014–2015.” New England Journal of Medicine. 375:229-239. ↩︎
  6. See for example, Zibell, J., et al. (2018). “Increases in Acute Hepatitis C Virus Infection Related to a Growing Opioid Epidemic and Associated Injection Drug Use, United States, 2004 to 2014. AJPH: Hepatitis C and Opioids. 108:2,175-181 and Van Handle, M., et al. (2016). “County-level Vulnerability Assessment for Rapid Dissemination of HIV or HCV Infections among Persons who Inject Drugs, United States.” Journal of AIDS. 73:3, 323-331. ↩︎
  7. Van Handle, M., et al. (2016). “County-level Vulnerability Assessment for Rapid Dissemination of HIV or HCV Infections among Persons who Inject Drugs, United States.” Journal of AIDS. 73:3, 323-331. ↩︎
  8. Centers for Disease Control and Prevention. NCHHSTP AtlasPlus. Updated 2017. https://www.cdc.gov/nchhstp/atlas/index.htm. Accessed February 2018. ↩︎
  9. Wejnert, et al. (2016). MMWR. “Vital signs: Trends in HIV Diagnoses, Risk Behaviors. And Prevention Among Persons Who Inject Drugs –United States.” 65:47,1336-1342. ↩︎
  10. Kaiser Family Foundation analysis of data available from amfAR’s Opioid & Health Indicators Database. Maps from amfAR database, available here: http://opioid.amfar.org/. 220 Vulnerable Counties originally identified in Van Handle, M., et al. (2016). “County-level Vulnerability Assessment for Rapid Dissemination of HIV or HCV Infections among Persons who Inject Drugs, United States.” Journal of AIDS. 73:3, 323-331. ↩︎
  11. The original article identifying these counties also notes that 43% of the counties did not have a buprenorphine-waivered physician (another indicator of limited capacity to respond to an emerging opioid epidemic). ↩︎
  12. Kaiser Family Foundation. 2018. Medicaid’s Role in Addressing Opioid Addiction. https://modern.kff.org/infographic/medicaids-role-in-addressing-opioid-epidemic/ ↩︎
  13. Peters, R. Wengle, E. 2016. The Urban Institute. Coverage of Substance-Use Disorder Treatments in Marketplace Plans in Six Cities. https://www.urban.org/sites/default/files/publication/81856/2000838-Coverage-of-Substance-Use-Disorder-Treatments-in-Marketplace-Plans-in-Six-Cities.pdf ↩︎
  14. The three common MATs are buprenorphine; Methadone, and Naltrexone. ↩︎
  15. 23 ADAP formularies include buprenorphine, 16 include Methadone, and 20 cover Naltrexone. NASTAD’s 2018 ADAP formulary database: https://www.nastad.org/adap-formulary-database. ↩︎
Poll Finding

Kaiser Health Tracking Poll – March 2018: Views on Prescription Drug Pricing and Medicare-for-all Proposals

Authors: Ashley Kirzinger, Bryan Wu, and Mollyann Brodie
Published: Mar 23, 2018

Findings

Key Findings:

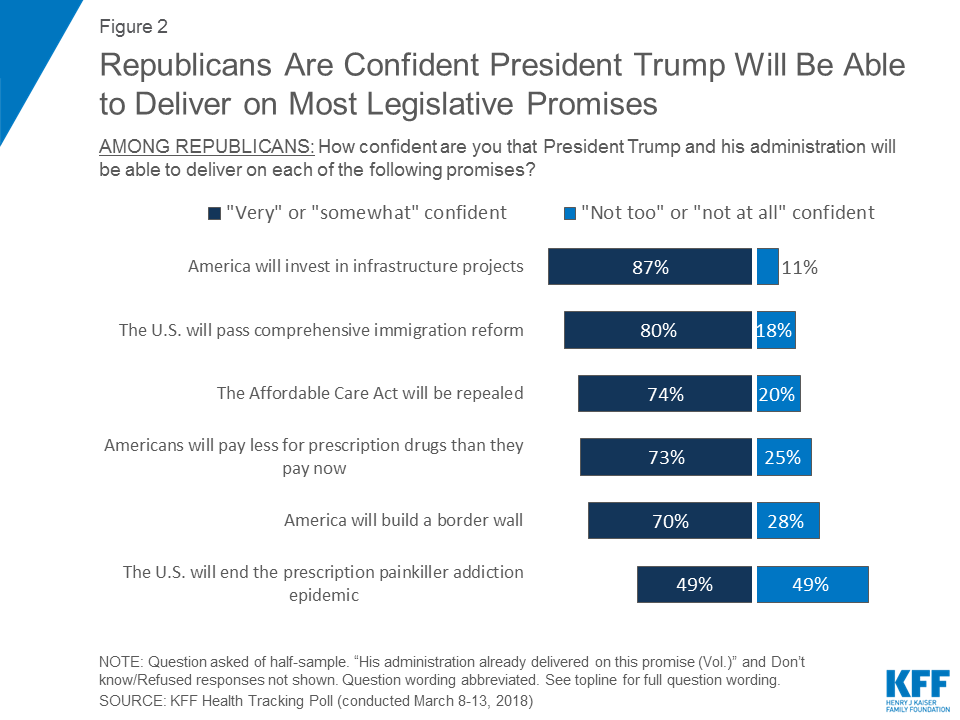
  • The March Kaiser Health Tracking Poll finds that more than a year into President Trump’s presidency, half of the public (52 percent) say passing legislation to bring down the price of prescription drugs should be a “top priority” for President Trump and Congress. Yet, less than half of the public (39 percent) say they are confident that President Trump and his administration will be able to deliver on the promise that Americans will pay less for prescription drugs than they pay now.

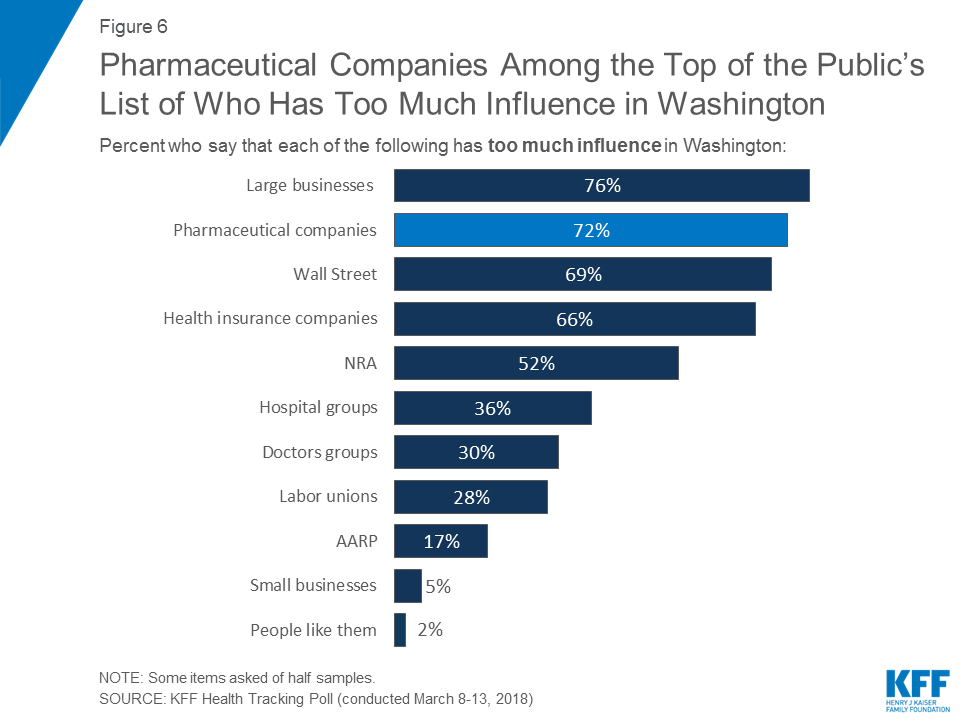
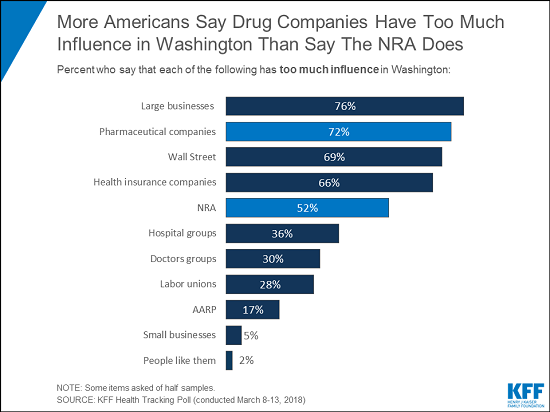
    72% of Americans say drug companies have too much influence in Washington – more than say the same about the National Rifle Association

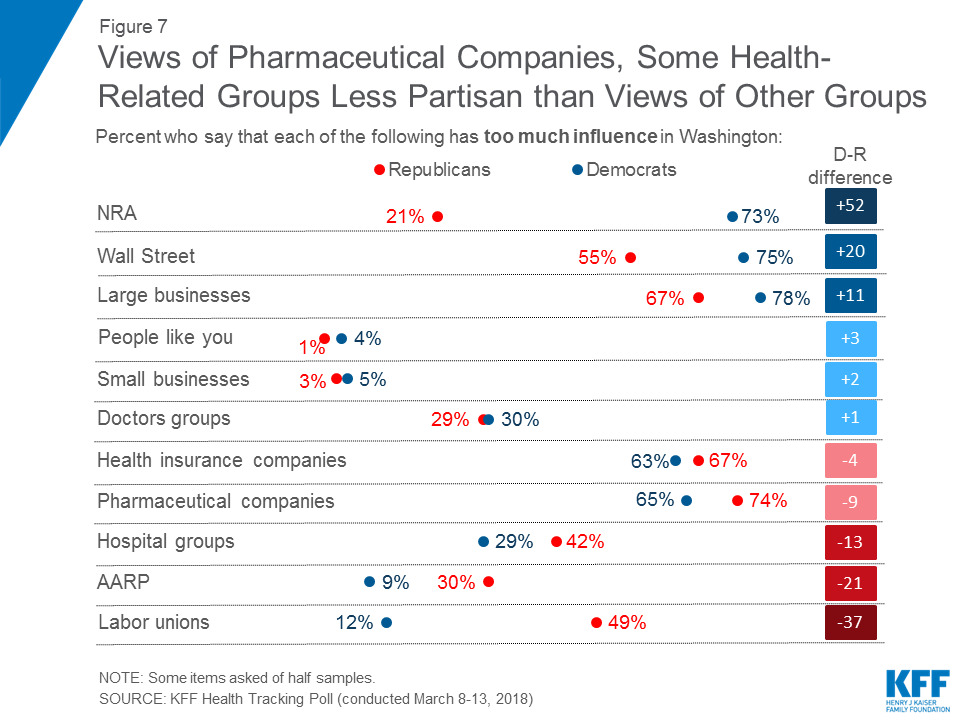
  • Pharmaceutical companies rank among the top organizations that the public – including majorities of Democrats, independents, and Republicans – say has “too much influence” in Washington. Seven in ten (72 percent) say pharmaceutical companies have “too much influence,” which is similar to other entities like large businesses and Wall Street, but much higher than the shares of the public who say the National Rifle Association (NRA), hospital groups, or doctors groups have “too much influence” (52 percent, 36 percent, 30 percent, respectively). There is stronger agreement among partisans on the influence of pharmaceutical companies with majorities of both Democrats (65 percent) and Republicans (74 percent) saying pharmaceutical companies have “too much influence” in Washington.
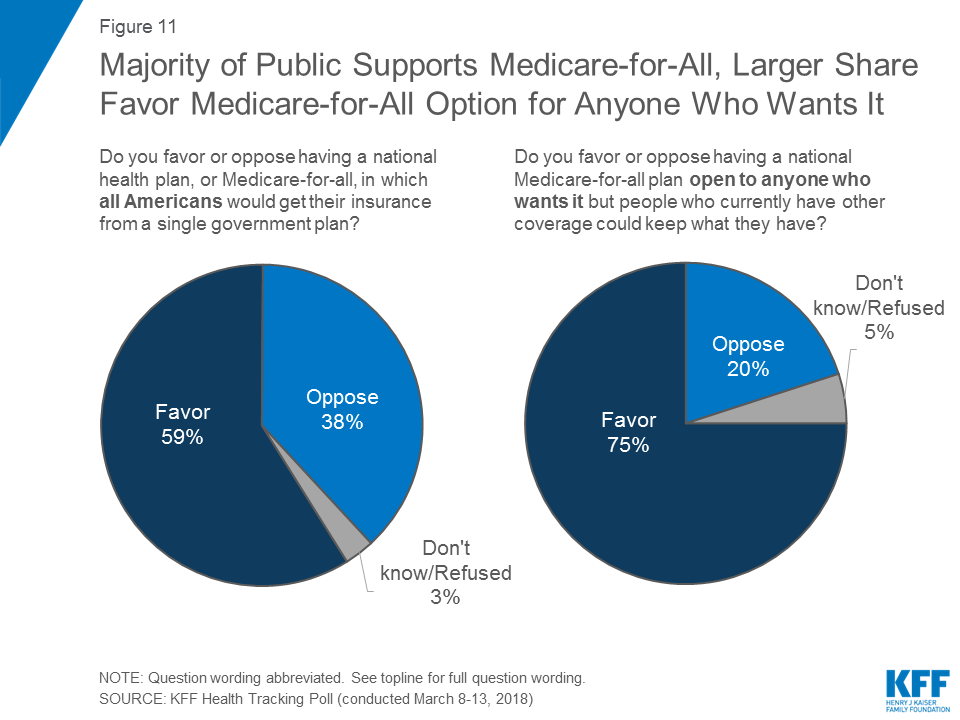
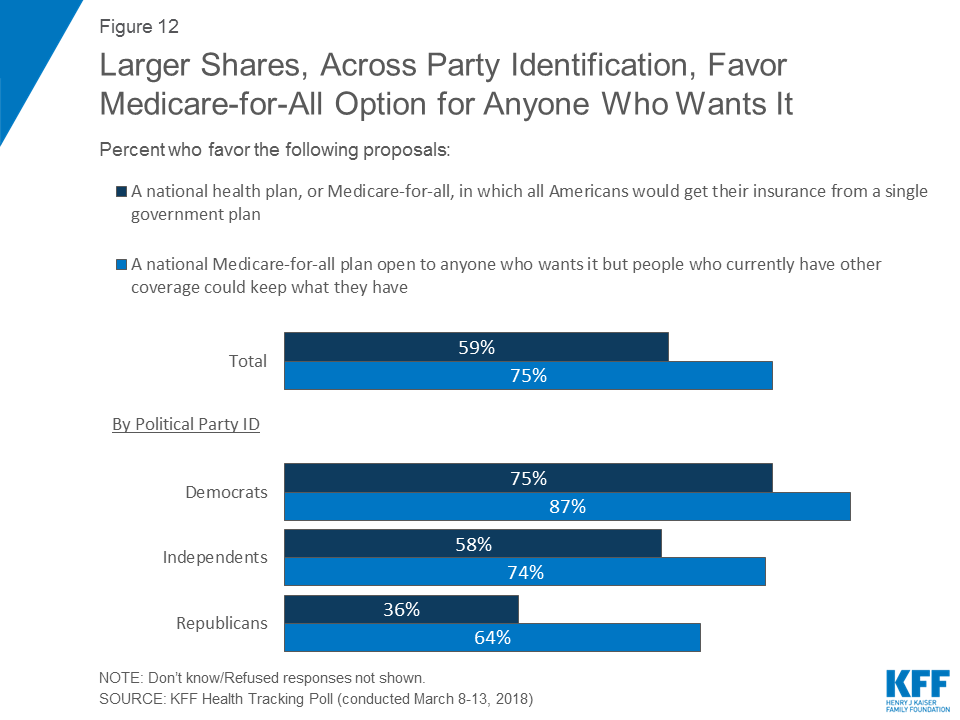
  • This month’s Kaiser Health Tracking Poll finds six in ten (59 percent) favor a national health plan, or Medicare-for-all, in which all Americans would get their insurance from a single government plan – including a majority of both Democrats and independents and about one-third of Republicans. Support for such a proposal increases among the overall public (75 percent) and among partisans (87 percent of Democrats, 74 percent of independents, and 64 percent of Republicans) when framed as an option for anyone who wants it, but people who currently have other forms of coverage can keep the coverage they already have. It is unclear how support would fare if these proposals became part of the larger public debate as previous KFF polling has found the public’s attitudes can be quite malleable.
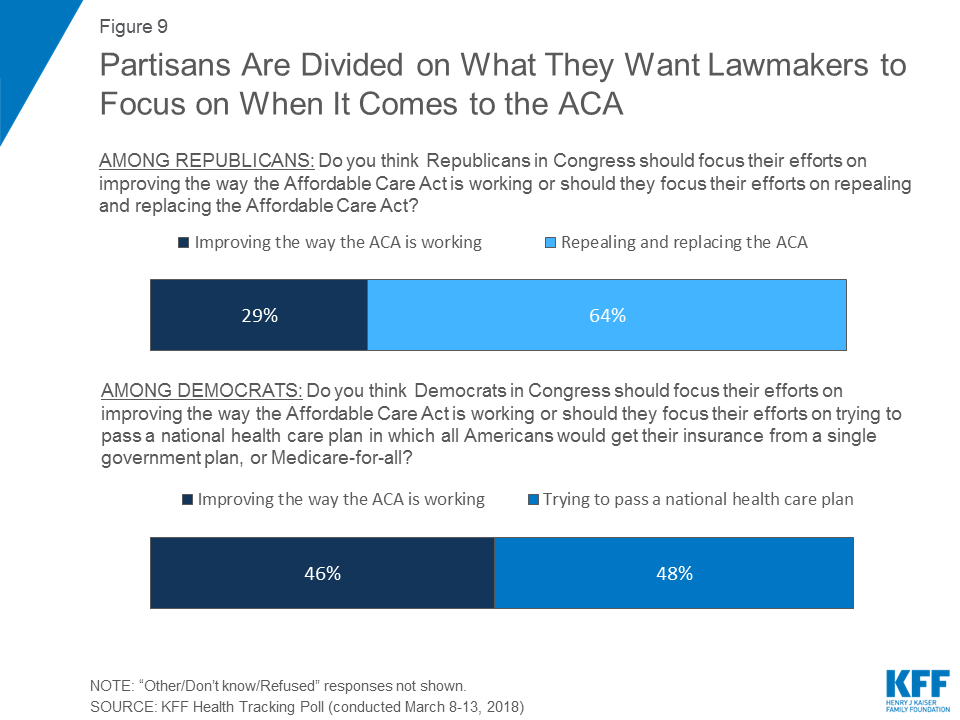
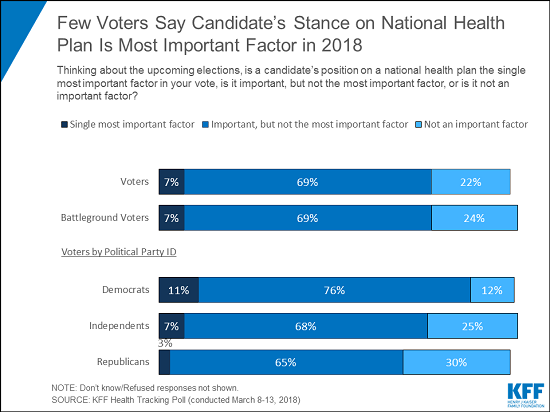
  • Democrats are divided on what they want Democrats in Congress to focus on: improving the Affordable Care Act (46 percent) or trying to pass a national health plan (48 percent). But few voters, regardless of

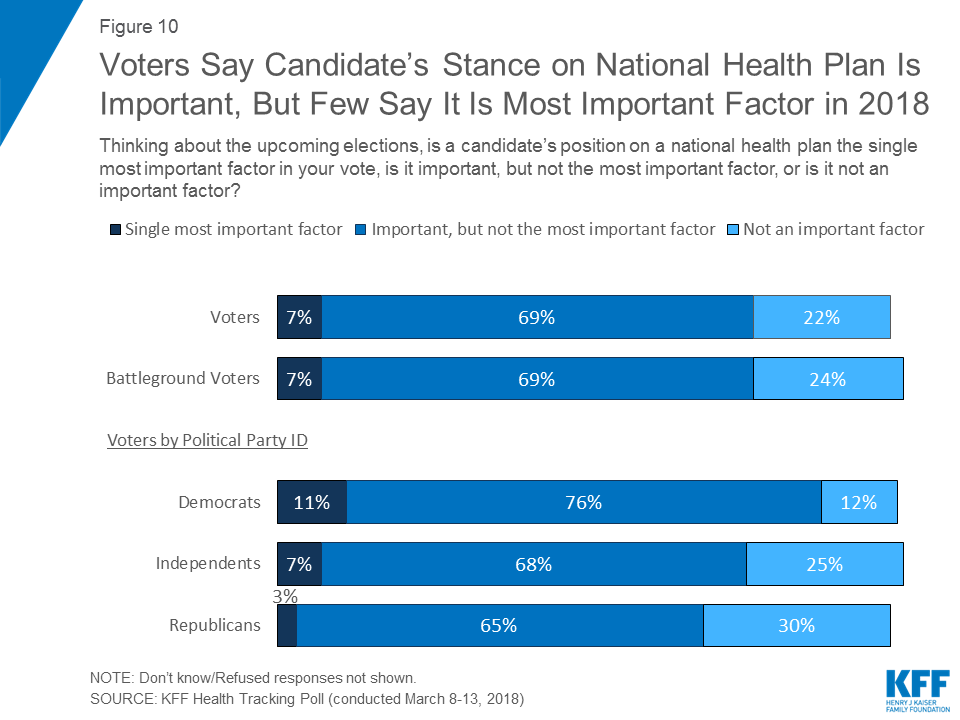
    partisanship, say a candidate’s position on a national health plan will be the most important factor in their vote during the 2018 midterm elections. Among all voters, voters living where there are competitive House, Senate, or Governor races, and Democratic voters, about one in ten say a candidate’s position on a national health plan will be the “single most important factor” in their 2018 vote choice. An additional 69 percent of all voters, and battleground voters, say it will be an “important, but not the most important factor” as do 76 percent of Democratic voters.

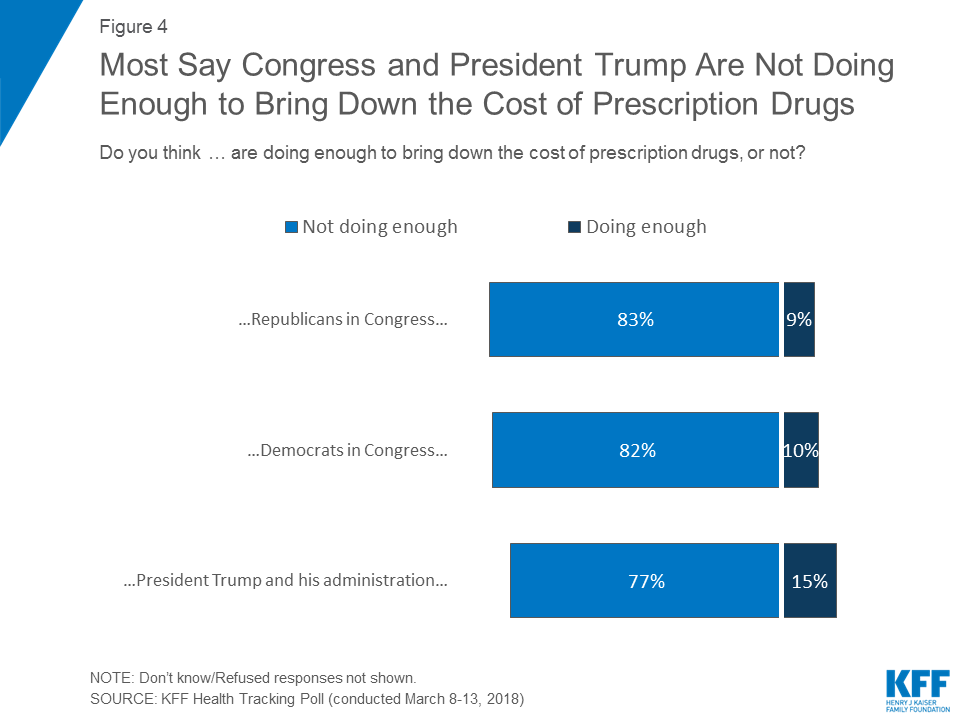
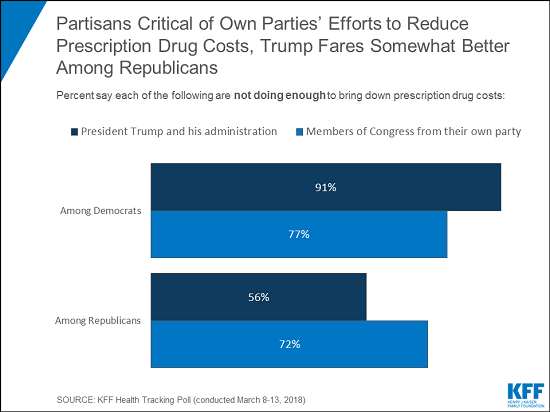
    Poll: Majorities across parties say the Trump administration and both parties in Congress aren’t doing enough to fix high drug costs

The Public’s Priorities for Washington

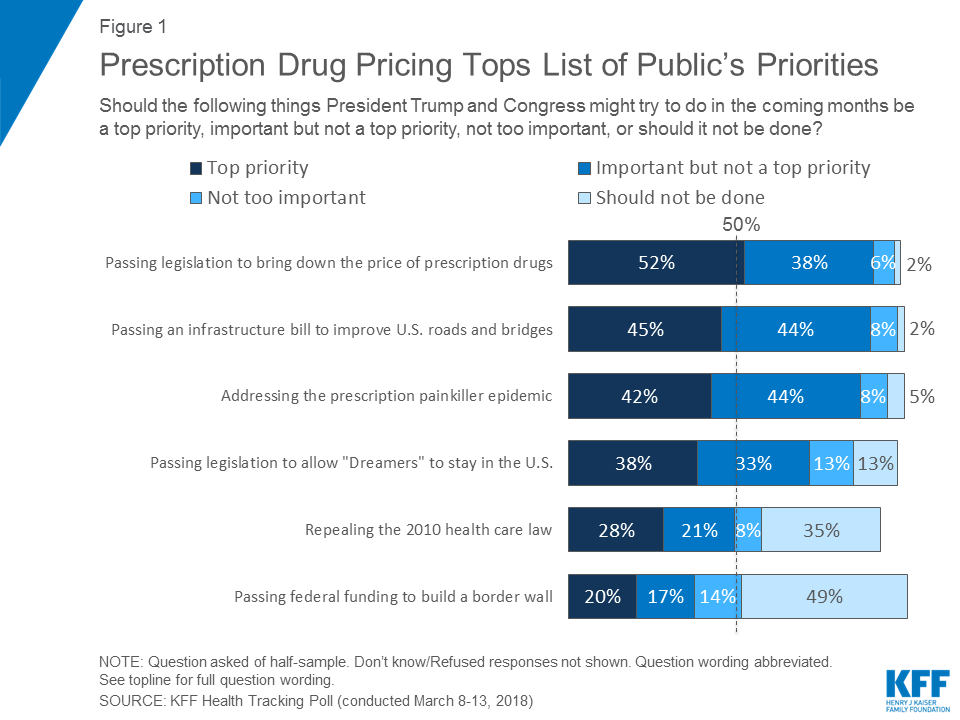
More than a year into President Trump’s presidency, half of the public (52 percent) say passing legislation to bring down the price of prescription drugs should be a “top priority” for President Trump and Congress to do in the coming months. Fewer – but still about four in ten – say the same about passing an infrastructure bill (45 percent), addressing the prescription painkiller addiction epidemic (42 percent), or passing legislation to allow individuals who illegally came into this country before the age of 16 (known as Dreamers) to legally stay in the country (38 percent). Repealing the Affordable Care Act (ACA) and passing federal funding to build a border wall between the U.S. and Mexico rank at the bottom of the public’s priorities with less than one-third (28 percent and 20 percent, respectively) saying each of these is a “top priority” for the president and Congress.

Figure 1: Prescription Drug Pricing Tops List of Public’s Priorities

Public Confidence in President Trump’s Ability to Address Priorities

Four in ten (39 percent) say they are either “very confident” or “somewhat confident” President Trump and his administration will be able to deliver on the promise1  that Americans will pay less for prescription drugs than they pay now – the top priority for the public. The public is somewhat more optimistic in President Trump’s ability to deliver on some of the other promises asked about, including 54 percent who are confident President Trump will deliver on the promise to invest in infrastructure projects like fixing roads, bridges, and schools; passing an infrastructure bill is also a top priority for 45 percent of the public. Ending the prescription painkiller addiction epidemic ranks lowest among the public with three in ten (28 percent) confident President Trump will be able to deliver on this promise.

Table 1: Public Confidence in President Trump’s Ability to Address Public’s Priorities
 Percent who are confident President Trump’s administration will be able to deliver on this promisePercent who say each should be a top priority for President Trump and Congress
Passing an infrastructure bill54%45%
Passing comprehensive immigration reform4838
Repealing the Affordable Care Act4728
Lowering prescription drug prices3952
Building a border wall between the U.S. and Mexico3820
Ending the prescription painkiller addiction epidemic2842
Republicans Are More Confident in President Trump’s Ability to Deliver on Promises

The majority of Republicans are confident President Trump and his administration will be able to deliver on most of the promises asked about, with one notable exception – ending the prescription painkiller addiction epidemic. Vast majorities of Republicans are confident in President Trump and his administration’s ability to deliver on infrastructure (87 percent) and on immigration reform (80 percent), while about seven in ten are confident in their ability to repeal the ACA (74 percent), lower the cost of prescription drugs (73 percent), and build a border wall between the U.S. and Mexico (70 percent). Notably, equal shares of Republicans (49 percent) say they are both confident and not confident that President Trump and his administration will be able to deliver on his promise to end the prescription painkiller addiction epidemic.

Figure 2: Republicans Are Confident President Trump Will Be Able to Deliver on Most Legislative Promises

Prescription Drug Costs

With prescription drug prices weighing heavily on the minds of the public, this month’s KFF Health Tracking Poll examines the public’s perceptions on the cost of prescription drugs, attitudes towards policymakers’ actions to address drug prices, and views of pharmaceutical companies.

Public Thinks Prescription Drug Costs Are Unreasonable and Lawmakers Aren’t Doing Enough to Address Costs

A large majority (80 percent) of the public perceive prescription drug costs as “unreasonable” while one-fifth (17 percent) say the costs are “reasonable.” The share of the public who say prescription drug costs are unreasonable has increased slightly over the past several years (up from 73 percent in June 2015).

Figure 3: Eight in Ten Say Prescription Drug Costs Are Unreasonable

Large majorities of the public say that President Trump, as well as Democrats and Republicans in Congress, are “not doing enough” to bring down the cost of prescription drugs. About eight in ten say Republicans in Congress (83 percent) and Democrats in Congress (82 percent) are “not doing enough,” as do three-fourths (77 percent) who say the same about President Trump and his administration.

Figure 4: Most Say Congress and President Trump Are Not Doing Enough to Bring Down the Cost of Prescription Drugs

Poll: Majorities across parties say the Trump administration and both parties in Congress aren’t doing enough to fix high drug costs

Large shares across partisans not only say that lawmakers from the opposite party are “not doing enough” to bring down the cost of prescription drugs, but also say lawmakers from their own party are “not doing enough.” About three-fourths (77 percent) of Democrats and Republicans (72 percent) say lawmakers from their own party in Congress “are not doing enough.” The vast majority of Democrats (91 percent) and independents (80 percent) say President Trump and his administration “are not doing enough” to bring down the cost of prescription drugs. But Republicans are less harsh in their judgment of President Trump; 56 percent say he is “not doing enough” and one-third say his administration is “doing enough.”

Table 2: Majorities Across Parties Say Politicians Are Not Doing Enough to Bring Down the Cost of Prescription Drugs
Percent who say each of the following are not doing enough to bring down the cost of prescription drugs:DemocratsIndependentsRepublicans
President Trump and his administration91%80%56%
Democrats in Congress778785
Republicans in Congress908872
Increase in the Share of the Public Who Don’t Trust Either Political Party to Lower Prescription Drug Costs

When asked which political party they trust to do a better job at lowering prescription drug costs, a larger share of the public say they trust the Democratic Party (44 percent) to do a better job than the Republican Party (30 percent). The share of the public who explicitly mention “neither,” when asked which party they trust to do a better job at lowering the cost of prescription drugs has increased from 12 percent in 2016 to 21 percent in 2018. Vast majorities of both Republicans and Democrats say they trust their own political party to do a better job handling this issue (78 percent and 84 percent, respectively) and very few say they trust the opposing party (4 percent and 5 percent, respectively). A larger share of independents say they trust Democrats (38 percent) than Republicans (24 percent), but one-third of independents (32 percent) say they trust “neither” to do a better job.

Figure 5: Party Drives Who Public Trusts on Prescription Drug Costs, One-Third of Independents Trust Neither Party

Pharmaceutical Companies Rank Among Top Organizations Perceived as Having Too Much Influence in Washington

Overall, pharmaceutical companies rank among the top of a list of organizations that the public says has “too much influence” in Washington. Seven in ten (72 percent) say pharmaceutical companies have “too much influence,” which is similar to the share who say the same about large businesses (76 percent), Wall Street (69 percent), and health insurance companies (66 percent). All of these organizations rank higher than the National Rifle Association (NRA), which has been in the news due to recent school shootings and subsequent protests. About half (52 percent) of the public feels the NRA has too much influence in Washington.

Figure 6: Pharmaceutical Companies Among the Top of the Public’s List of Who Has Too Much Influence in Washington

There is stronger agreement among partisans on the influence of pharmaceutical companies and other health care-related organizations than organizations like the NRA and labor unions. While majorities of both Democrats (65 percent) and Republicans (74 percent) say pharmaceutical companies have “too much influence” in Washington, there is a strong partisan divide on the perceived influence of the NRA, with three-fourths of Democrats (73 percent) saying it has “too much influence” compared to one-fifth of Republicans (21 percent), and of labor unions (12 percent of Democrats, 49 percent of Republicans). Other groups that had shared partisan consensus include health insurance companies, doctors groups, small businesses, and people like you.

Figure 7: Views of Pharmaceutical Companies, Some Health-Related Groups Less Partisan than Views of Other Groups

Affordable Care Act

Half of the public now holds a favorable view of the 2010 Affordable Care Act (ACA) while 43 percent hold an unfavorable view of the law. This is down slightly from February 2018, when KFF recorded the highest level of favorability since tracking attitudes on the law began in 2010. Partisans’ views remained stable with the vast majority of Democrats continuing to view the law favorably (73 percent) and the vast majority of Republicans continuing to hold unfavorable views (78 percent), while the share of independents with favorable views slipped from 55 percent last month to 47 percent this month.

Figure 8: Half of the Public Hold a Favorable View of the ACA, Down Slightly from Last Month

Partisans also hold different views on what they want Congress to do when it comes the ACA. Two-thirds (64 percent) of Republicans think that Republicans in Congress should focus their efforts on repealing and replacing the Affordable Care Act while three in ten (29 percent) say Republicans in Congress should focus on improving the way the ACA is working. Democrats, on the other hand, are more divided in their views of how Democrats in Congress should focus their efforts with similar shares saying they should focus on improving the way the ACA is working (46 percent) or trying to pass a national health care plan in which all Americans would get their insurance from a single government plan (48 percent).

Figure 9: Partisans Are Divided on What They Want Lawmakers to Focus on When It Comes to the ACA

National Health Plan in 2018 Midterm Elections

Few say a candidate’s position on a national health plan will be the most important factor in their vote during the 2018 midterm elections. Among all voters as well as voters living where there are competitive House, Senate, or Governor races, seven percent say a candidate’s position on a national health plan will be the “single most important factor” in their 2018 vote choice. An additional seven in ten (69 percent) say it will be “important, but not the most important factor,” while about a fourth (22 percent of voters and 24 percent of battleground voters) say it is “not an important factor.” The share of voters who say it will be the most important factor in their 2018 vote choice is similar among Democratic voters (11 percent) and among voters who favor either of the Medicare-for-all proposals included in this month’s tracking survey (9 percent).

Figure 10: Voters Say Candidate’s Stance on National Health Plan Is Important, But Few Say It Is Most Important Factor in 2018

2018 Midterm Election Analysis

As part of Kaiser Family Foundation’s effort to examine the role of health care in the 2018 midterm elections, throughout the year we will be tracking the views of voters – paying special attention to those living in states or congressional districts in which both parties have a viable path to win the election. This group, referred to in our analysis as “voters in battlegrounds” is defined by the 2018 Senate, House, and Governor ratings provided by The Cook Political Report. Congressional and Governor races categorized as “toss-up” were included in this group. A complete list of the states and congressional districts included in the comparison group is available in Appendix A.

Medicare-for-all Proposals

While many want Democrats in Congress to focus on improving the way the ACA is working rather than trying to pass a national health care plan, there is support for such a proposal. This month’s Kaiser Health Tracking Poll finds six in ten (59 percent) favor a national health plan, or Medicare-for-all, in which all Americans would get their insurance from a single government plan. Support for such a proposal increases when framed as an option for anyone who wants it; three-fourths of the public favor a national Medicare-for-all plan open to anyone who wants it, but would allow people who currently have other forms of coverage to keep the coverage they already have.

Figure 11: Majority of Public Supports Medicare-for-All, Larger Share Favor Medicare-for-All Option for Anyone Who Wants It

The majority of Democrats and independents support both of these Medicare-for-all proposals. On the other hand, one-third (36 percent) of Republicans support having a national health plan in which all Americans would get their insurance from a single government plan, but support increases to 64 percent when asked about a national Medicare-for-all plan open to anyone who wants it, but would allow people to keep the coverage they already have. It is unclear how support levels would fare once each of these proposals became part of the larger public debate on health care in this country. Prior Kaiser Family Foundation surveys have found the public’s attitudes can be quite malleable, and some people could be convinced to change their position after hearing typical pro and con arguments that might come up in a national debate.2 

Figure 12: Larger Shares, Across Party Identification, Favor Medicare-for-All Option for Anyone Who Wants It

Methodology

This Kaiser Health Tracking Poll was designed and analyzed by public opinion researchers at the Kaiser Family Foundation (KFF). The survey was conducted March 8-13 2018, among a nationally representative random digit dial telephone sample of 1,212 adults ages 18 and older, living in the United States, including Alaska and Hawaii (note: persons without a telephone could not be included in the random selection process). Computer-assisted telephone interviews conducted by landline (421) and cell phone (791, including 483 who had no landline telephone) were carried out in English and Spanish by SSRS of Glen Mills, PA. Both the random digit dial landline and cell phone samples were provided by Marketing Systems Group (MSG). For the landline sample, respondents were selected by asking for the youngest adult male or female currently at home based on a random rotation. If no one of that gender was available, interviewers asked to speak with the youngest adult of the opposite gender. For the cell phone sample, interviews were conducted with the adult who answered the phone. KFF paid for all costs associated with the survey.

The combined landline and cell phone sample was weighted to balance the sample demographics to match estimates for the national population using data from the Census Bureau’s 2016 American Community Survey (ACS) on sex, age, education, race, Hispanic origin, and region along with data from the 2010 Census on population density. The sample was also weighted to match current patterns of telephone use using data from the January-June 2017 National Health Interview Survey. The weight takes into account the fact that respondents with both a landline and cell phone have a higher probability of selection in the combined sample and also adjusts for the household size for the landline sample. All statistical tests of significance account for the effect of weighting.

The margin of sampling error including the design effect for the full sample is plus or minus 3 percentage points. Numbers of respondents and margins of sampling error for key subgroups are shown in the table below. For results based on other subgroups, the margin of sampling error may be higher. Sample sizes and margins of sampling error for other subgroups are available by request. Note that sampling error is only one of many potential sources of error in this or any other public opinion poll. Kaiser Family Foundation public opinion and survey research is a charter member of the Transparency Initiative of the American Association for Public Opinion Research.

GroupN (unweighted)M.O.S.E.
Total1,212±3 percentage points
Party Identification
   Democrats384±6 percentage points
   Republicans325±6 percentage points
   Independents395±6 percentage points
2018 Election
   Registered voters1,044±4 percentage points
   Voters in competitive elections283±7 percentage points

Endnotes

  1. Axios, Trump: Azar will bring drug prices “way down,” January 29, 2018. https://www.axios.com/trump-azar-drug-prices-way-down-1517250647-2e81ca5f-f608-4184-ad97-ccaaf20cb460.html ↩︎
  2. L Hamel, B Wu, M Brodie, Data Note: Modestly Strong but Malleable Support for Single-Payer Health Care, July 5, 2017. https://modern.kff.org/health-reform/poll-finding/data-note-modestly-strong-but-malleable-support-for-single-payer-health-care/ ↩︎
News Release

Poll: Public Says Drug Companies Have More Influence in Washington than the NRA

Most Americans Say the White House and Both Republicans and Democrats in Congress Aren’t Doing Enough to Address High Drug Costs

Published: Mar 23, 2018

Democrats Split on Whether to Fix the ACA or Push for a National Health Plan; Few Democratic Voters Say a National Health Plan is Their Top Issue for the Midterms

As policymakers weigh strategies to address the high cost of prescription drugs, the latest Kaiser Health Tracking Poll finds that a large majority of the public (72%) view pharmaceutical companies as having too much influence in Washington – more than say the same about the National Rifle Association (NRA).

Drug makers rank among the top tier of groups that Americans say have too much influence in Washington, along with large businesses (76%), Wall Street (69%), and health insurance companies (66%). All of these organizations rank higher than the NRA (52%), which has been at the center of the debate about school safety and gun laws following recent school shootings and subsequent protests.

Charts_for_Alert_FINAL_marchpolltwo.png

One reason why drug companies rank so high on this list is that both Democrats (65%) and Republicans (74%) see them as having too much influence in Washington. In contrast, Democrats are far more likely than Republicans to say the NRA has too much influence (73% compared to 21%).

Across Parties, Majorities Say the Administration and Congress Aren’t Doing Enough on Drug Costs

Most of the public (80%) view prescription drug costs as unreasonable, and about half (52%) say passing legislation to bring down prescription costs should be a “top priority” for President Trump and Congress – more than say the same about five other issues tested, including passing an infrastructure bill (45%), ending the prescription opioid epidemic (42%), and repealing the Affordable Care Act (28%). Reducing the cost of prescription drugs continues to be a top priority among the public during President Trump’s administration as noted in previous KFF surveys.

At the same time, a minority of the public (39%) expresses confidence that President Trump and his administration will deliver on their promises to lower drug costs, and an even smaller share (28%) say that they are confident the administration will deliver on its promise to end the opioid epidemic.

Overall, at least three in four say that Congressional Republicans (83%), Congressional Democrats (82%), and President Trump and his administration (77%) aren’t doing enough to bring drug costs down.

Unlike other issues such as repealing the Affordable Care Act or creating a national health plan, the poll does not find a sharp partisan divide on this perception. Most Democrats (77%) say that Congressional Democrats aren’t doing enough, while most Republicans say that Congressional Republicans (72%) and President Trump and his administration (56%) aren’t doing enough.

Charts_for_Alert_FINAL_march pollthree.png

Democrats Divided on What Their Party Should Focus On Next, But Few Say National Health Plan Will Be Major Factor in Their 2018 Vote

Looking ahead to the 2018 midterms, the polling at this point suggests that candidates’ positions on a national health plan are not likely to play a major role in the elections. While Democrats are divided in whether their party should focus on improving the way the ACA is working (46%) or focus on passing a national health care plan (48%), few Democratic voters (11%) say a candidate’s position on a national health plan will be the “single most important factor” in their vote.

Charts_for_Alert_FINAL_marchpollone-1.png

While still not a major campaign issue, the poll finds that most of the public (59%) favor a national health plan, or Medicare-for-all, in which all Americans would get their insurance from a single government plan. This includes a majority of Democrats (75%) and independents (58%), and one-third of Republicans (36%).

Support for such a proposal increases among the overall public (75%) and among partisans (87% of Democrats, 74% of independents, and 64% of Republicans) when framed as an option for anyone who wants it, but allows people who currently have other forms of coverage to keep it. It is unclear how support would fare if these proposals became part of the larger public debate as previous KFF polling has found the public’s attitudes can be quite malleable.

Designed and analyzed by public opinion researchers at the Kaiser Family Foundation, the poll was conducted from March 8-13, 2018 among a nationally representative random digit dial telephone sample of 1,212 adults. Interviews were conducted in English and Spanish by landline (421) and cell phone (791). The margin of sampling error is plus or minus 3 percentage points for the full sample. For results based on subgroups, the margin of sampling error may be higher.

Abortion Coverage in the Bipartisan Health Care Stabilization Act of 2018 (S. 1771)

Authors: Laurie Sobel, Caroline Rosenzweig, and Alina Salganicoff
Published: Mar 22, 2018

The Bipartisan Health Care Stabilization Act of 2018 does not directly ban plans from covering abortions, however, it disqualifies all individual plans on and off the Marketplace  that offer abortion coverage from receiving federal assistance for reinsurance, invisible high-risk pools, and cost-sharing reductions. This would serve as a major financial disincentive for plans to continue to offer abortion coverage to their policyholders and would conflict with laws in 4 states that currently require plans to cover abortion services.

The role of government in regulating abortion coverage began to be debated shortly after the landmark Supreme Court ruling in Roe v Wade. Since 1976, the Hyde Amendment has blocked federal funds under Medicaid and other federal programs from being used to pay for abortion, allowing exceptions only for pregnancies that endanger a woman’s life, or that result from rape or incest. The Affordable Care Act (ACA) interpreted the federal abortion-funding ban to include the federal tax credits that functioned as premium subsidies to help individuals afford Marketplace plans. This issue brief reviews current federal and state policies on private insurance coverage of abortion services, and how the Bipartisan Health Care Stabilization Act of 2018 would affect abortion coverage for women enrolled in the individual market.

State Laws on Abortion Coverage

Private Plans

States have the responsibility to regulate fully insured individual, small, and large group health insurance policies issued in their state, whereas self-insured plans are regulated by the federal government under the Employee Retirement Income Security Act (ERISA). States can choose to regulate whether abortion coverage is included or excluded in private plans that are not self-insured.

Four states, California, New York, Oregon, and Washington, require all state-regulated private health insurance policies to include abortion coverage. California requires all fully insured plans, including individual and employer plans to treat abortion coverage and maternity coverage neutrally. As all plans are required to include maternity coverage, all plans must also include abortion coverage.1  New York requires all fully insured insurance policies that provide hospital, surgical, or medical expense coverage to cover “medically necessary” abortions without copayments, coinsurance, or annual deductibles, unless the policy is a tax-qualified high deductible health plan. Oregon’s Reproductive Health Equity Act requires state-regulated health plans to cover abortion without cost sharing. Washington recently enacted a law, effective January 2019, requiring state-regulated health plans to treat abortion and maternity coverage equally.

Eleven states (Idaho, Kentucky, Missouri, North Dakota, Oklahoma, Indiana, Kansas, Michigan, Nebraska, Texas, and Utah) restrict abortion coverage in private plans. Some states follow the same restrictions as the federal Hyde Amendment for their private plans, while others are more restrictive. Nine of the eleven states allow insurers to sell riders for abortion coverage on the private market; however, these riders are not available, and there is no documentation of their cost or impact on access. Utah bans abortion riders.

ACA Marketplace Plans

Under the Affordable Care Act (ACA), abortion is not included in the required an “essential health benefit” list, and federal premium tax credits and cost sharing reductions (CSR) are prohibited from subsidizing abortion. Furthermore, the ACA allows states to ban coverage of abortions in the plans that are available through the ACA Marketplace, and 25 states have done so. In 2016, in an additional six states without an abortion coverage ban, the Marketplaces nonetheless did not offer any plans that included abortion coverage.2   In the states that permit Marketplace abortion coverage, plans that include abortion coverage must collect separate premium payments from individuals, and the plans must segregate those funds to ensure no federal tax subsidy dollars are applied to abortion coverage. In addition, federal reimbursement to insurers that receive CSR payments is restricted to claims for essential health benefits, and so does not subsidize abortion coverage.

Abortion Coverage Restrictions under S. 1771

The Bipartisan Health Care Stabilization Act of 2018 would provide funding for reinsurance and invisible high-risk pools to states that have implemented 1332 waivers. The Act also appropriates cost-sharing reduction payments for plan years 2017-2021. The bill prohibits states from allocating any funds provided under either reinsurance, invisible high-risk pools or cost sharing reductions to health plans that include abortion coverage. An exception is made for abortions for pregnancies resulting from rape or incest, or if the pregnancy endangers the woman’s life. This Act would go further than current law in limiting abortion coverage in private plans. Plans that operate in states that receive these federal funds for cost-sharing reduction payments, invisible high-risk pools or reinsurance to stabilize premiums and reduce costs for high cost enrollees would not be permitted to include abortion coverage, even if it is paid for with private dollars. This bill would (Table 1):

  • Disqualify insurers that cover abortion in circumstances beyond the Hyde exceptions for rape, incest, or life endangerment of the woman from receiving cost-sharing reduction payments to assist low-income individuals enrolled in Qualified Health Plans on the Marketplace.
  • Disqualify insurers that cover abortion in circumstances beyond Hyde exceptions from receiving federal reinsurance or invisible high-risk pool funding to reduce premiums in the individual market, both on and off the Marketplace.

The Bipartisan Health Care Stabilization Act would not block State Medicaid programs from using their own state funds to cover abortion beyond the limited Hyde circumstances.

Table 1: Summary of Proposed Changes to Abortion Coverage Restrictions in the Marketplace and Individual Insurance Market
 The Affordable Care Act (ACA)The Bipartisan Health Care Stabilization Act of 2018
Who regulates abortion coverage in fully insured private plans sold in states?States regulate fully insured private plans.
  • Eleven states ban abortion coverage in private fully insured plans sold in their state.
  • Four states require abortion coverage in all fully insured private plans.
States would continue to regulate fully insured plans.
Who regulates abortion coverage in state Marketplace exchanges? States can choose to ban abortion coverage from plans offered through the Marketplace (25 states have done this).

Federal regulations require that at least one Multi-State Plan that excludes abortion coverage must be available in each Marketplace.

States would continue to regulate plans offered through the Marketplace under ACA provisions.
How are federal funds limited for abortion coverage in Marketplace and private insurance plans?No federal premium and cost-sharing subsidies can be used to pay for abortion. Exceptions are only made for pregnancies resulting from rape, incest, or if it is determined to endanger the life of the woman (Hyde).

If a plan offers abortion coverage, premiums paid for that coverage must be segregated from premiums for other services. Every Marketplace must offer an option to enroll in a plan that does not include abortion.

Plans that offer abortion coverage are not blocked from receiving cost-sharing reduction payments from the federal government.

Only insurers that exclude abortion coverage would be eligible for federal invisible high-risk pool or reinsurance funding to reduce premiums in the individual market, both on and off the Marketplace.

Only insurers that exclude abortion coverage would be eligible for cost-sharing reduction payments to assist low-income individuals enrolled in Qualified Health Plans.

For cost-sharing reduction payments and invisible high-risk pool and reinsurance funding, exceptions would only be made for pregnancies resulting from rape, incest, or if it is determined to endanger the life of the woman (Hyde).

State Laws in Conflict with the Bipartisan Health Care Stabilization Act

California, New York, Oregon and Washington require plans that are not self-insured to cover abortion. If the Bipartisan Health Care Stabilization Act becomes law, these states would not be permitted to allocate any federal funds for reinsurance, invisible high-risk pools, or cost-sharing reduction payments to health plans operating in the individual market.

Four States Require Individual Plans to Include Abortion Coverage

California – In 2014, the California Department of Managed Care reasserted that the Knox-Keene Health Care Service Plan Act requires the provision of basic health care services. Several court decisions have confirmed that the California Constitution prohibits discrimination against women who choose to terminate their pregnancy. Therefore, all fully insured health plans in California must cover both maternity services and abortion services.

New York – New York law requires health insurance plans to cover medically necessary abortions without co-pays, coinsurance, or deductibles.

Oregon – The Reproductive Health Equity Act, passed in 2017, requires all health plans to cover abortion without cost sharing.

Washington – The Reproductive Parity Act, passed in March 2018, requires all health plans that cover maternity services, to provide substantially equivalent coverage for abortion, starting in January 2019.

The Future of Women’s Abortion Coverage

While the Bipartisan Health Care Stabilization Act of 2018, does not directly ban plans from covering abortions, it disqualifies plans that have abortion coverage from receiving federal assistance for reinsurance, invisible high-risk pools, and cost-sharing reductions. This would serve as a major financial disincentive for plans to continue to offer abortion coverage to their policyholders. Given the direct conflict with state laws in California, New York, Oregon and Washington that require all state-regulated plans to include abortion coverage, there will likely be legal challenges if the Act were enacted with the current abortion coverage restrictions.

  1. Michelle Rouillard, Director of Department of Managed Health Care letter to Mark Morgan, California President of Anthem Blue Cross, RE: Limitations or Exclusions of Abortion Services. August 22, 2014. Available: https://www.dmhc.ca.gov/Portals/0/082214letters/abc082214.pdf. ↩︎
  2. Kaiser Family Foundation. Coverage for Abortion Services in Medicaid, Marketplace Plans and Private Plans. January 2016. ↩︎

President Signs FY18 Omnibus Bill

Published: Mar 22, 2018

On March 23, 2018, the President signed the FY 2018 Omnibus bill, which provides funding for the U.S. government through the rest of the 2018 fiscal year including for U.S. global health programs.

Key highlights from the bills are as follows (see table for additional detail):

  • Funding provided to the State Department and USAID through the Global Health Programs (GHP) account, which represents the bulk of global health assistance, totaled $8.7 billion, essentially flat compared to the FY 2017 enacted level, and $2.2 billion (34%) above the President’s FY 2018 request.
  • Funding provided to CDC for global health totaled $488.6 million, $53.5 million (12%) above the FY 2017 enacted level ($435.1 million), and $138.6 million (40%) above the President’s FY 2018 request. The majority of the increase in FY 2018 ($50 million) was provided to support CDC’s global health security (GHS) activities over a three-year period.
  • While total global health funding at NIH is not yet known, funding for the Fogarty International Center (FIC) at NIH totaled $75.7 million, $3.5 million (5%) above the FY 2017 enacted levels ($72.2 million); the administration proposed to eliminate FIC in the President’s FY 2018 request.
  • Details on global health funding in the FY 2018 Omnibus bill are as follows (unless otherwise specified, all funding amounts are under the GHP account):
    • Bilateral HIV funding through the President’s Emergency Plan for AIDS Relief (PEPFAR) was $4,650 million in the FY 2018 Omnibus bill, matching the FY 2017 enacted level and $800 million (21%) above the President’s FY 2018 request.
    • The bill included $1,350 million as the U.S. contribution to the Global Fund to Fight AIDS, Tuberculosis and Malaria (Global Fund), matching the FY 2017 enacted level and $225 million (20%) above the President’s FY 2018 request.
    • The bill provided $261 million in total funding for Tuberculosis (TB), which was $20 million (8%) above the FY 2017 enacted level and $82.6 million (46%) above the President’s FY 2018 request; funding for TB was one of only two programs under the GHP account that increased in the FY 2018 omnibus compared to the FY 2017 enacted level.
    • The bill provided $755 million for Malaria activities, which matched the FY 2017 enacted levels and was $81 million (12%) above the President’s FY 2018 request (the FY 2018 request included $424.0 million for malaria through the GHP account and $250 million through a one-time transfer of unspent emergency Ebola funding).
    • The bill provided $172.6 million in total funding for Global Health Security (GHS), of which $100 million was provided through a one-time transfer of unspent emergency Ebola funding. The FY 2018 GHS total funding level was $100 million (138%) above both the FY 2017 enacted level and the President’s FY 2018 request (the FY 2018 request included $72.5 million for GHS through a one-time transfer of unspent emergency Ebola funding).
    • The FY 2018 Omnibus bill included $35 million for the “Emergency Reserve Fund” through a one-time transfer of unspent emergency Ebola funding. This fund was created in FY 2017 to address emerging health threats.
    • The bill included $967.0 million for Maternal and Child Health (MCH), $15 million (2%) above the FY 2017 enacted level. It is not possible to calculate total MCH funding in the President’s FY 2018 request due to uncertainty over the source of funding for the U.S. contribution to UNICEF. Specific areas under MCH include:
      • Gavi, the Vaccine Alliance was $15 million (5%) above the FY 2017 enacted level ($275 million) and matched the FY 2018 request ($290 million); funding for Gavi, the Vaccine Alliance was one of only two programs under the GHP account that increased in the FY 2018 omnibus compared to the FY 2017 enacted level.
      • Polio, matched the FY 2017 enacted level ($51.5 million in the GHP account and $7.5 million in the ESF account) and was $15 million (25%) above the FY 2018 request.
      • The bill provided $137.5 million as the U.S. contribution to the UNICEF through the International Organizations and Programs (IO&P) account. The FY 2018 request proposed to eliminate the IO&P account, but allowed for contributions to UNICEF through other unspecified accounts.
    • Funding for Nutrition totaled $125 million in the bill, matching the FY 2017 enacted level and $46.5 million (59%) above the FY 2018 request.
    • Funding for Vulnerable Children totaled $23 million, matching the FY 2017 enacted level; funding for Vulnerable Children was eliminated in the FY 2018 request.
    • Funding for Neglected Tropical Diseases (NTDs) was $100 million, matching the FY 2017 enacted level and $25 million (33%) above the FY 2018 request.
    • Family Planning and Reproductive Health (FP/RH) funding in the bill totaled $607.5 million from all accounts, matching the FY 2017 enacted level; funding for FP/RH was eliminated in the President’s FY 2018 request.
      • Of the $607.5 million in FP/RH funding, $575 million was provided for bilateral programs ($524 through the GHP account and $51 million through the ESF account).
      • The FY 2018 Omnibus bill included $32.5 million as the U.S. contribution to UNFPA, which matched the FY 2017 enacted level; funding for UNPFA was eliminated in the FY 2018 request.

Note: Some funding amounts (e.g. global health funding provided through the Economic Support Fund account at USAID and NIH funding for international HIV research) are determined at the agency level, and were not earmarked by Congress in the Omnibus bill.

Resources:

UPDATED: This posted was updated to reflect the President’s signing of the bill into law.

The table (.xls) below compares the FY 2018 Omnibus bill to the FY 2017 enacted funding amounts as outlined in the “Consolidated Appropriations Act, 2017” (P.L. 115-31; KFF summary here) and President’s FY 2018 request (KFF summary here).