KFF designs, conducts and analyzes original public opinion and survey research on Americans’ attitudes, knowledge, and experiences with the health care system to help amplify the public’s voice in major national debates.
Insurers setting rates for health coverage options on the 2018 individual market have faced substantial uncertainty regarding whether or not the federal government would continue to make payments for cost-sharing reduction subsidies to insurers, as well as whether or not the administration would continue to enforce the Affordable Care Act’s individual mandate. Following the September 27th deadline for insurers planning to offer coverage on the ACA’s federal marketplace to finalize premiums and sign
ANALYSIS: ACA Silver Plan Premium Increases from 7% to 38% Attributed to End of Cost-Sharing Payments
contracts, the federal government announced on October 12th that cost-sharing reduction (CSR) payments would end, effective immediately, unless Congress appropriated the funds. In some cases insurers also increased rates due to concerns that the individual mandate might not be enforced, although no formal change in enforcement has been announced.
Regardless of whether the federal government reimburses insurers for CSR subsidies, insurers are still legally required under the ACA to offer reduced cost-sharing via silver-level plans to low-income consumers with incomes up to 250% of the poverty level. Many insurers anticipated that the CSR payments might not continue and built the loss of payments into their premiums for 2018. In some cases, state insurance departments directed insurers what to assume regarding CSR payments, and in other cases regulators were silent. Some state insurance regulators approved two sets of rates, one to be used if CSR payments continued and another if they did not.
Following the October 12th cessation of CSR payments, many insurers that had assumed the payments would continue were able to adjust their 2018 rates upward, under the review of the federal Centers for Medicare and Medicaid Services (CMS), state insurance departments, and state-based marketplaces.
Insurers – often under the guidance or direction of state regulators – have taken one of four general approaches to the end of CSR payments:
Not adjust rates at all in response to the termination of CSR payments. Only two states (North Dakota and Vermont) are known to have prevented insurers from adjusting rates.
Increase premiums for all ACA-compliant individual market policies across-the-board, both inside and outside the marketplace.
Increase premiums for silver-level plans inside and outside the marketplace. Silver plans are relevant because cost-sharing reductions for low-income marketplace enrollees are only available in those plans.
Increase premiums only for silver-level plans inside the marketplace, under the logic that cost-sharing reductions are only available in marketplace silver plans.
Premiums for silver plans have particular significance in the ACA marketplace not only because they are the only plans that offer reduced cost-sharing, but also because the second-lowest cost silver plan in each area is the benchmark for tax credits provided to subsidize premiums for low and moderate income enrollees.
A crowd-sourced compilation of the strategies used in different states is available here.
This analysis seeks to quantify the impact of the termination of cost-sharing subsidy payments, based on publicly available data for 32 states and the District of Columbia. Table 1 below highlights those insurers that have explicitly factored into their final premiums the fact that cost-sharing subsidy payments will not be made and have specified the degree to which that assumption is influencing their premiums in public filings.
Insurers are not always consistent in how they report the premium effect of the end of CSR payments. In some cases insurers report the average impact across all ACA-compliant individual market plans, even though they have applied an increase only to silver plans, which is the approach most insurers seem to have taken. In other cases, insurers specifically cite how much of a surcharge they have applied to silver plans.
As shown in Table 1, among those insurers that specify the surcharge on silver plans for the discontinuation of CSR payments, the amount of the surcharge ranges from 7.1% to 38%.
For those insurers that report the impact on average across all plans – whether increases were actually applied to all plans or only to silver plans – the surcharge ranges from 0.1% to 27.2%. (Note that New York’s insurers, at the low end of the range, are outliers. The basic health program in that state, known as the Essential Plan, covers people with incomes from 138% to 200% of the poverty level, meaning that few people in the marketplace are in the income range to receive cost-sharing reductions.)
These results are generally consistent with a KFF estimate released in April projecting that silver marketplace premiums would have to increase by 19% on average to compensate for the loss of CSR payments, with the amount varying substantially by state.
Table 1: Examples of 2018 Insurer Strategies and Rate Increases Attributed toCost-Sharing Reduction Payments Ending, by State and Insurer
State
Insurer
Plans with CSR surcharges
Amount of CSR surcharge
Arkansas
Celtic Insurance Company
Silver – Both on and off-exchange
11.5% added to the overall rate increase
QCA Health Plan
Silver – Both on and off-exchange
15.53% added to the overall rate increase
QualChoice Life & Health Insurance Company
Silver – Both on and off-exchange
16% added to the overall rate increase
USAble Mutual Insurance Company
Silver – Both on and off-exchange
6.4% added to the overall rate increase
California
L.A. Care Health Plan
Silver – Exchange only
21% added to silver exchange plans
Blue Shield of California
Silver – Exchange only
8% or 16% added to silver exchange plans
Health Net
Silver – Exchange only
12% or 13% added to silver exchange plans
Molina Healthcare
Silver – Exchange only
12% or 20% added to silver exchange plans
Kaiser Permanente
Silver – Exchange only
15% added to silver exchange plans
Oscar Health Plan of California
Silver – Exchange only
10% added to silver exchange plans
Sharp Health Plan
Silver – Exchange only
27% added to silver exchange plans
Valley Health Plan
Silver – Exchange only
12% added to silver exchange plans
Chinese Community Health Plan
Silver – Exchange only
16% added to silver exchange plans
Western Health Advantage
Silver – Exchange only
17% or 18% added to silver exchange plans
Anthem
Silver – Exchange only
11% added to silver exchange plans
Colorado
Bright Health Insurance Company
All metals levels
2.6% added to the overall rate increase
Cigna Health and Life Insurance Company
All metals levels
8.5% added to the overall rate increase
Colorado Choice Health Plans
All metals levels
6.1% added to the overall rate increase
Denver Health Medical Plan
All metals levels
12% added to the overall rate increase
HMO Colorado
All metals levels
1.6% added to the overall rate increase
Kaiser Foundation Health Plan of Colorado
All metals levels
8.2% added to the overall rate increase
Rocky Mountain HMO
All metals levels
14% added to the overall rate increase
Connecticut
Anthem Blue Cross and Blue Shield of Connecticut
Silver – Exchange only
16.7% added to silver exchange plans
ConnectiCare Benefits
Silver – Exchange only
16.7% added to silver exchange plans
Georgia
Blue Cross Blue Shield Healthcare Plan of Georgia
Not specified
16.9% added to the overall rate increase
Alliant Health Plans
Silver – Exchange only
22.3% added to the overall rate increase
Kaiser Foundation Health Plan of Georgia
Silver – Exchange only
26.1% added to the overall rate increase
Ambetter of Peach State
Not specified
27.2% added to the overall rate increase
Iowa
Medica Insurance Company
Silver – Unclear if all or exchange only
13.3% added to the overall rate increase
Indiana
Celtic Insurance Company
All metal levels
16.6% added to the overall rate increase
Kentucky
CareSource Kentucky
Silver – Both on and off-exchange
10.4% added to the overall rate increase
Maryland
CareFirst BlueChoice
Silver – Exchange only
20.14% added to silver exchange plans
Group Hospitalization and Medical Services
Silver – Exchange only
15% added to silver exchange plans
CareFirst of Maryland
Silver – Exchange only
15% added to silver exchange plans
Kaiser Foundation Health Plan of the Mid-Atlantic States
Silver – Exchange only
16.86% added to silver exchange plans
Maine
Harvard Pilgrim Health Care
Silver – Both on and off-exchange
17.3% added to silver plans
Maine Community Health Options
Silver – Exchange only
22% added to silver exchange plans
Michigan
Blue Care Network of Michigan
Silver – Both on and off-exchange
14.8% added to silver plans
Blue Cross Blue Shield of Michigan
Silver – Both on and off-exchange
9.9% added to silver plans
McLaren Health Plan Community
Silver – Exchange only
19% added to silver exchange plans
Meridian Health Plan of Michigan
Silver – Both on and off-exchange
38% added to silver plans
Molina Healthcare of Michigan
Silver – Both on and off-exchange
28.1% added to silver plans
Physicians Health Plan
Silver – Exchange only
20% added to silver plans
Priority Health
Silver – Both on and off-exchange
21.7% added to silver plans
Montana
Montana Health Cooperative
Silver – Both on and off-exchange
22% added to silver plans
PacificSource Health Plans
Silver – Both on and off-exchange
12.1% added to silver plans
North Carolina
Blue Cross & Blue Shield of North Carolina
Not specified
14% added to the overall rate increase
New Mexico
CHRISTUS Health Plan
Silver – Both on and off-exchange
12.6% added to the overall rate increase
Nevada
Health Plan of Nevada
Silver – Exchange only
11% added to silver exchange plans
New York
Capital District Physicians Health Plan
Silver – Both on and off-exchange
0.3% added to the overall rate increase
Health Insurance Plan of Greater New York
Silver – Both on and off-exchange
0.4% added to the overall rate increase
Excellus Health Plan
Silver – Both on and off-exchange
0.2% added to the overall rate increase
New York State Catholic Health Plan
Silver – Both on and off-exchange
0.6% added to the overall rate increase
HealthNow New York
Silver – Both on and off-exchange
0.4% added to the overall rate increase
Independent Health Benefits Corporation
Silver – Both on and off-exchange
0% added to the overall rate increase
MetroPlus Health Plan
Silver – Both on and off-exchange
1.1% added to the overall rate increase
MVP Health Plan
Silver – Both on and off-exchange
1.1% added to the overall rate increase
Oscar Insurance Corporation
Silver – Both on and off-exchange
0.1% added to the overall rate increase
UnitedHealthcare of New York
Silver – Both on and off-exchange
0.5% added to the overall rate increase
Healthfirst PHSP
Silver – Both on and off-exchange
1.1% added to the overall rate increase
Ohio
CareSource
Silver – Unclear if all or exchange only
12.2% added to the overall rate increase
Medical Health Insuring Corporation of Ohio
Silver – Exchange only
20% added to silver exchange plans
Molina Healthcare of Ohio
Silver – Unclear if all or exchange only
21.4% added to silver plans
Oscar Insurance Corporation of Ohio
Silver – Exchange only
14% added to silver exchange plans
Paramount Insurance Company
Silver – Exchange only
23.5% added to silver exchange plans
Summa Insurance Company
Silver – Exchange only
17.9% added to silver exchange plans
Oregon
BridgeSpan Health Company
Silver – Both on and off-exchange
7.1% added to silver plans
Moda Health Plan
Silver – Both on and off-exchange
7.1% added to silver plans
PacificSource Health Plans
Silver – Both on and off-exchange
7.1% added to silver plans
Kaiser Foundation Health Plan of the Northwest
Silver – Both on and off-exchange
7.1% added to silver plans
Providence Health Plan
Silver – Both on and off-exchange
7.1% added to silver plans
Pennsylvania
Capital Advantage Assurance Company
Silver – Exchange only
34.29% added to silver exchange plans
First Priority Health
Silver – Exchange only
34.29% added to silver exchange plans
Highmark
Silver – Exchange only
34.29% added to silver exchange plans
Highmark Choice Company
Silver – Exchange only
34.29% added to silver exchange plans
Highmark Health Insurance Company
Silver – Exchange only
34.29% added to silver exchange plans
Geisinger Health Plan
Silver – Exchange only
34.29% added to silver exchange plans
Keystone Health Plan East
Silver – Exchange only
34.29% added to silver exchange plans
QCC Insurance Company
Silver – Exchange only
34.29% added to silver exchange plans
UPMC Health Options
Silver – Exchange only
34.29% added to silver exchange plans
Rhode Island
Neighborhood Health Plan of Rhode Island
Silver – Exchange only
22.4% to 22.8% added to silver exchange plans
Blue Cross & Blue Shield of Rhode Island
Silver – Exchange only
19.5% added to silver exchange plans
South Carolina
Blue Cross and Blue Shield of South Carolina
Silver – Exchange only
24% added to silver exchange plans
Tennessee
BlueCross BlueShield of Tennessee
Silver – Both on and off-exchange
14% added to the overall rate increase
Cigna Health and Life Insurance Company
Silver – Both on and off-exchange
17.4% to 21.4% added to silver plans
Oscar Insurance Company of Tennessee
Silver – Exchange only
17% added to silver exchange plans
Utah
University of Utah Health Insurance Plans
Silver – Exchange only
~30% added to silver exchange plans
SelectHealth
Silver – Exchange only
~30% added to silver exchange plans
Virginia
HealthKeepers
Silver – Exchange only
12% added to silver exchange plans
CareFirst BlueChoice
Silver – Exchange only
21% added to silver exchange plans
Cigna Health and Life Insurance Company
Silver – Both on and off-exchange
18.8% – 20.5% added to silver plans
Group Hospitalization and Medical Services
Silver – Exchange only
24% added to silver exchange plans
Kaiser Foundation Health Plan of the Mid-Atlantic States
Silver – Exchange only
12.4% added to silver exchange plans
Washington
BridgeSpan
Silver – Exchange only
27% added to silver exchange plans
Coordinated Care Corporation
Silver – Exchange only
10% added to silver exchange plans
Kaiser Foundation Health Plan of Washington
Silver – Exchange only
23% added to silver exchange plans
Kaiser Foundation Health Plan of the Northwest
Silver – Exchange only
18% added to silver exchange plans
LifeWise Health Plan of Washington
Silver – Exchange only
14% added to silver exchange plans
Molina Healthcare of Washington
Silver – Exchange only
12% added to silver exchange plans
Premera Blue Cross
Silver – Exchange only
10% added to silver exchange plans
NOTES: “Not specified” indicates the insurer stated the amount of their overall average rate increase attributed to CSR payments ending but did not explicitly state how the increase was applied. Data for Colorado, Montana, and Pennsylvania were confirmed by state insurance departments.SOURCE: Kaiser Family Foundation analysis of insurer rate filings to state regulators; state insurance regulators.
Discussion
Data on 2018 marketplace premiums indicate premiums will increase substantially for the vast majority of insurers due to the discontinuation of cost-sharing reduction payments. In many cases, the premium surcharges are only for silver-level plans.
How consumers themselves will be affected by these premium increases, if at all, will depend in some cases on the approach taken by insurers (sometimes at the direction of state regulators).
Eighty-four percent of marketplace enrollees receive premium subsidies through tax credits, and those tax credits will increase dollar for dollar along with benchmark silver premiums. These enrollees should not be affected financially by the premium surcharges. Lower-income consumers eligible for cost-sharing reductions will likely want to continue to enroll in silver plans to qualify for those reductions.
Marketplace enrollees with incomes 250-400% of the poverty level – who are eligible for premium subsidies but not cost-sharing subsidies – could in some instances be better off. They will receive bigger premium subsidies, and could use those to pay less than they would now for a bronze plan (with higher patient cost-sharing) or a gold plan (with lower patient cost-sharing).
How middle and upper income people ineligible for premium subsidies will be affected will depend largely on the approach taken by insurers and states. Where premiums are increasing across-the-board to offset the loss of cost-sharing subsidies payments, they will be unable to avoid higher premiums. Where only silver premiums are increasing, they can avoid paying a surcharge by enrolling in a bronze or gold plan. And, where only silver premiums inside the marketplace are increasing, they can avoid paying more by enrolling in a bronze or gold marketplace plan or any type of plan outside the marketplace.
While consumers will generally be protected, the federal government could end up paying more in premium subsidies than it is saving in discontinuing the cost-sharing reduction payments.
Methods
Data were collected from health insurer rate filing submitted to state regulators. These submissions are publicly available for the states we analyzed. Most rate information is available in the form of a SERFF filing (System for Electronic Rate and Form Filing) that includes a base rate and other factors that build up to an individual rate. For some states where approved filings were unavailable, we gathered data from information released by state insurance departments. Premium data are current as of October 24, 2017; however, filings may still be updated before open enrollment for some states and insurers included in this analysis.
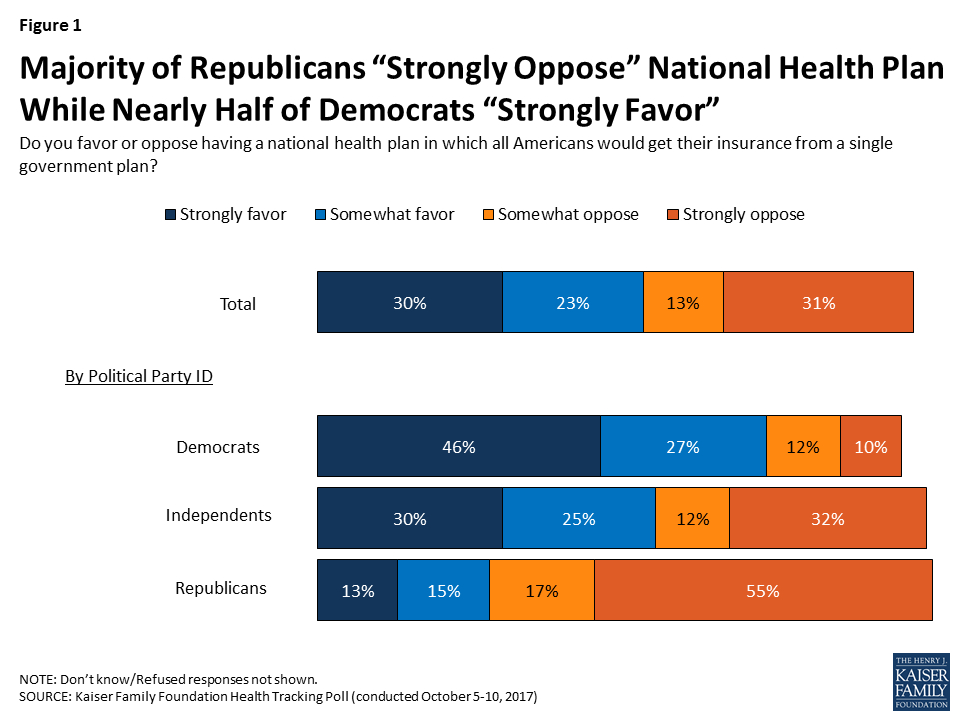
The October Kaiser Health Tracking Survey continues our efforts to track attitudes towards a national health plan, sometimes referred to as a “single-payer plan” or “Medicare-for-all,” in which all Americans would get health insurance from a single government plan. About half of the public (53 percent) favor having a national health plan, while 44 percent oppose such a plan. Support for such a proposal is largely driven by Democrats with three-fourths (73 percent) favoring such a plan, of which nearly half (46 percent) say they “strongly favor” it. On the other hand, seven in ten (71 percent) Republicans oppose such a plan, including more than half (55 percent) of Republicans who say they “strongly oppose” it. Independents are more divided with a slightly larger share favoring a national health plan than opposing it (55 percent vs. 43 percent).
Figure 1: Majority of Republicans “Strongly Oppose” National Health Plan While Nearly Half of Democrats “Strongly Favor”
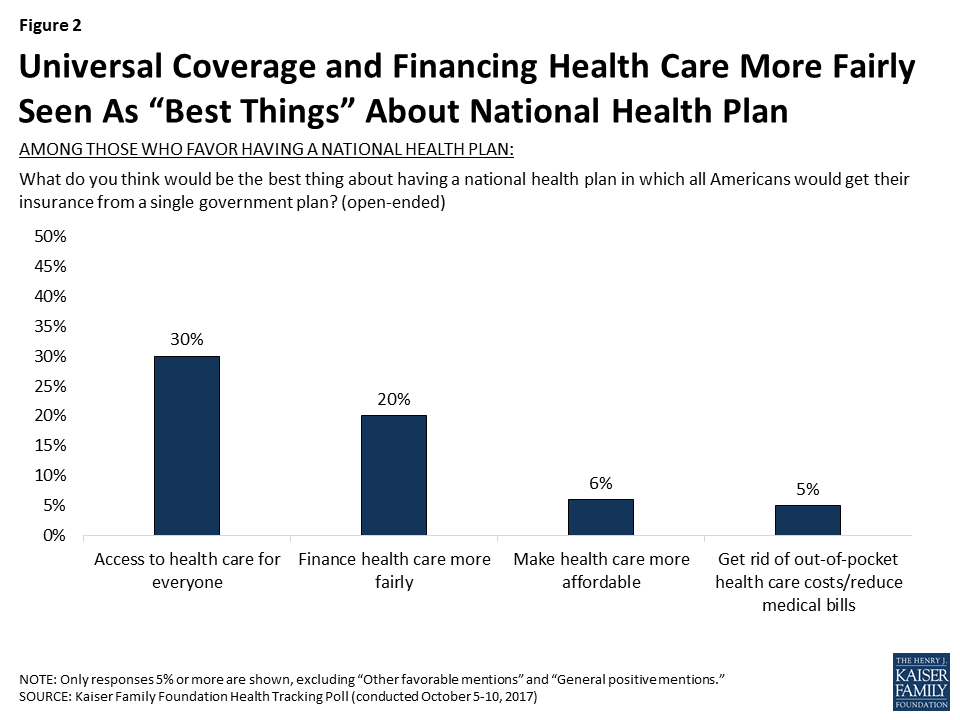
When asked to say in their own words the “best” or “worst” thing about having a national health plan, three in ten of those who favor such a plan offer the “best thing” is that it would provide access to health care for everyone. This is followed by one-fifth who offer it would finance health care more fairly, six percent who say it would make health care more affordable and five percent who say it would get rid of out-of-pocket costs.
Figure 2: Universal Coverage and Financing Health Care More Fairly Seen As “Best Things” About National Health Plan
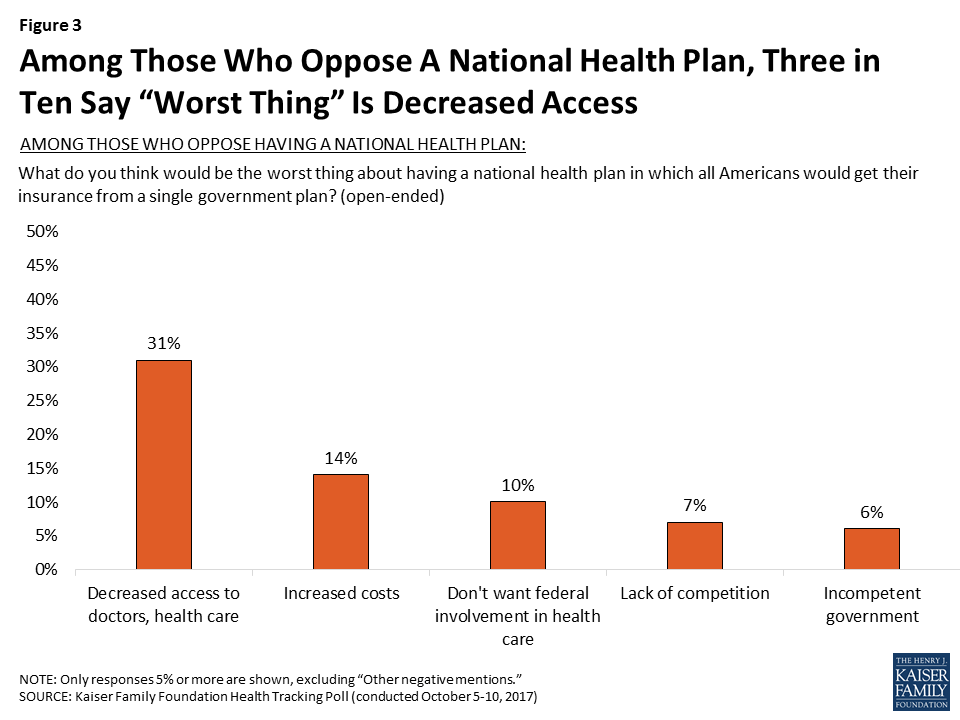
On the other side of the argument, three in ten (31 percent) of those who oppose a national health plan offer the “worst thing” about such a plan is that it would decrease access to doctors or health care fourteen percent say it would increase costs, and one in ten offer the “worst thing” about a national health plan is that they don’t want federal involvement in health care. Slightly less than ten percent offer the “worst thing” is that it would result in a lack of competition (7 percent) or say the government is incompetent (6 percent).
Figure 3: Among Those Who Oppose A National Health Plan, Three in Ten Say “Worst Thing” Is Decreased Access
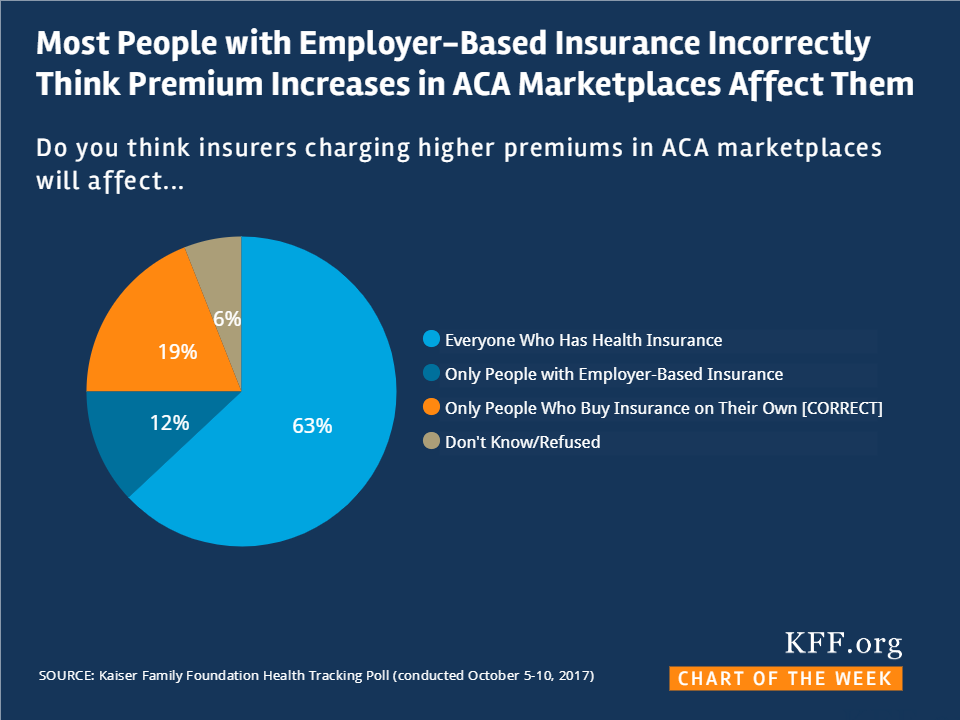
The Perceived Impact of Implementing a National Health Plan
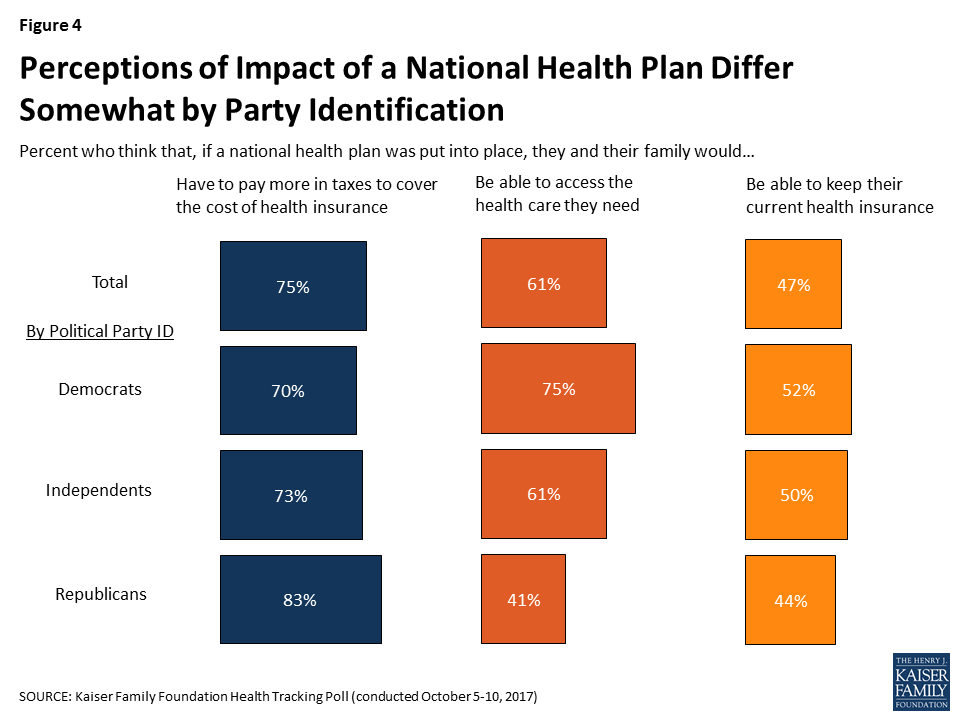
This month’s survey also assessed how the public thinks implementing a national health plan would affect their current health insurance plans, access to care, and whether they will have to pay more in taxes to cover the cost of their health insurance. The majority of the public (75 percent) – including the majority of Republicans, independents, and Democrats – think that if a national health was put into place, they will have to pay more in taxes to cover the cost of health insurance. Fewer, but still a majority (61 percent) believe they would be able to access the health care they need, including a majority of Democrats (75 percent) and independents (61 percent), compared to about four in ten Republicans (41 percent). In addition, about half of Democrats (52 percent), independents (50 percent), and more than four in ten Republicans (44 percent) think they would be able to keep their current health insurance under a national health plan. Among individuals who currently get their health insurance through an employer, a group that would likely not be able to keep their current health insurance if a national health plan was implemented, nearly half (44 percent) incorrectly believe they would be able to keep their current health insurance.
Figure 4: Perceptions of Impact of a National Health Plan Differ Somewhat by Party Identification
While efforts to pass major federal legislation to repeal and replace the Affordable Care Act (ACA) and restructure and reduce federal Medicaid financing may be on hold temporarily, the focus of the Centers for Medicare and Medicaid Services (CMS) and states is expected to turn to achieving significant Medicaid program changes through Section 1115 demonstration waivers. Going back to the mid-1990s, each new administration has used discretion to approve and promote different types of demonstration waivers. Although few waivers have been approved recently, the Trump Administration has signaled its openness to allowing states to test policies that have never before been approved in Medicaid and is considering waivers that seek to impose work requirements, drug screening and testing, eligibility time limits, enforceable premiums, and other eligibility and enrollment restrictions on existing expansion adults and/or traditional Medicaid populations. The limited waiver activity that has occurred so far in 2017 provides some insights into how the purpose of waivers and their approval process, implementation, and oversight may be evolving. As of September 2017, there were 33 states with 41 approved waivers and 18 states with 21 pending waivers. This issue brief presents three questions to help analyze the evolution of federal waiver policy as new waiver proposals and decisions emerge.
1. How Are Waiver Approval Criteria Changing?
Each administration has some discretion to approve demonstration waivers that will further Medicaid program objectives. Different administrations have each used waivers to further their particular policy priorities. For example, the Obama Administration used federal Medicaid funding to promote Delivery System Reform Incentive Payment (DSRIP) waivers, while the Bush Administration introduced Health Insurance Flexibility and Accountability (HIFA) waivers that sought to expand coverage within “current-level” resources and offered states increased flexibility to reduce benefits and charge cost-sharing to offset expansion costs.
However, discretion around waivers has limits. For example, the HHS Secretary’s Medicaid waiver authority is limited to certain provisions in Section 1902 of the Social Security Act. Section 1902 sets out the requirements for state Medicaid plans, such as provisions related to eligibility and benefits. However, many parts of the law are contained in other sections of the Social Security Act and therefore cannot be waived under Section 1115. For example, the formula that establishes federal Medicaid matching rates for states is outside Section 1902. In addition, the Secretary must determine that a waiver request will be an experimental, pilot or demonstration project that will further program objectives. In response to criticism from the General Accounting Office (GAO) about the lack of standards used to make this determination in the past, CMS posted a set of criteria to evaluate waiver requests in 2015.1 These criteria focus on serving Medicaid eligible and low-income state residents and include whether the waiver would increase coverage; increase access to providers; improve health outcomes; or increase the efficiency and quality of care through delivery system reform initiatives.
Early Insights: What to Watch
The March 2017 letter to state governors signals that the Trump Administration may change the criteria for waiver approval to impose welfare-like standards that could result in reduced rather than expanded coverage. While the 2015 waiver approval criteria have not been formally revised or rescinded to date, the Trump Administration’s March 2017 letter to state governors shows some movement toward a different interpretation of Medicaid program objectives. That letter describes the ACA’s Medicaid expansion as a “clear departure from the core, historical mission of the program” and distinguishes “the truly vulnerable.” The letter also invites state waiver requests to “support innovate approaches to increase employment and community engagement” and “align Medicaid and private insurance policies for non-disabled adults.” Some pending state waiver requests that seek policies like work requirements and time limits, such as those in Kentucky, Indiana, Maine, and Wisconsin, estimate that these waivers will result in reduced coverage. Additionally, a long-standing body of research demonstrates that premiums and cost-sharing result in decreased enrollment and barriers to care for low-income populations. To change policy that is not in formal regulations, the administration could issue a letter to State Medicaid Directors or other guidance; however, such policy changes could face litigation challenges.
2. What Are Potential Changes to Public Input and Waiver Policy Development?
The ACA included requirements to allow for public input on waivers at the state and federal level. While there are no set timeframes for CMS to approve or deny a waiver, the ACA included new transparency rules that require public comment periods at the state level before the waiver is submitted to CMS and a federal comment period after the waiver is submitted. The intent of this requirement is for states to address public comments and modify their waiver requests to reflect issues raised.
Waivers are generally approved with a detailed set of terms and conditions, although some provisions may be conditionally approved subject to the development of additional protocols or meeting other requirements. A waiver approval results in a list of specific waiver and expenditure authorities granted by CMS and a detailed set of waiver terms and conditions that includes key implementation dates and reporting and evaluation requirements, posted on Medicaid.gov. Some waivers may be approved subject to certain conditions that may seek to ensure that certain readiness standards are met or certain beneficiary rights are protected. Often, details about the implementation of more administratively complex waiver policies, such as premiums, health accounts, or healthy behavior incentives, are specified in protocols that are developed by the state and submitted to CMS after the waiver approval. Waiver implementation plans include a process to receive public input on implementation within the first six months for new waivers and then annually thereafter. These procedural elements are ways for stakeholders such as enrollees, providers, and health plans to understand and offer input into the implementation of policies that could significantly change the Medicaid program.
Early Insights: What to Watch
While the March 2017 letter affirms “reasonable public input processes and transparency guidelines” for waiver applications and renewals, some deviation from the ACA’s public notice and comment process is occurring. For example, Kentucky did not hold a state-level public comment period before submitting an amendment to its pending new waiver application to CMS, instead indicating that it would “accept CMS’s offer” to hold a “voluntary” state-level public comment period, which will run concurrently with the federal public comment period.2
CMS may consider removing some conditional approval requirements for existing waivers. Arkansas’ retroactive eligibility waiver was conditioned on the state completing an eligibility determination mitigation plan, providing benefits during a reasonable opportunity period, and implementing hospital presumptive eligibility. CMS is considering the state’s request to remove those conditions. Stakeholders may be interested in assessing whether the policy goals underlying these conditions have been achieved before the conditions are removed.
3. How Will the Impact of Significant Waiver Changes Be Reported and Measured?
Oversight of waiver implementation is important, particularly for waivers that seek to implement new or complex policies. Waivers terms and conditions typically require states to report on waiver implementation and administration through both quarterly and annual reports to CMS. This reporting allows CMS and other stakeholders to oversee and understand waiver policy implementation and effects on beneficiaries. Even renewals of long-standing waivers often involve the addition of new or adjusted policies that may not have been previously implemented.
Although not always addressed in the waiver approval, adequate administrative staff and funding are key to waiver implementation. Experience with Medicaid expansion waivers involving premiums, health accounts, and healthy behavior incentives in Michigan and Indiana reveals that substantial resources for beneficiary and provider outreach and education and sophisticated information technology systems to track payments and exchange information among the state, health plans, and providers are key to successful implementation.
Despite the challenges in conducting waiver evaluations, timely and publicly available results enable CMS, states, and stakeholders to learn from waivers. Consistent with the statutory requirement that waivers further an experimental or demonstration goal, waiver terms and conditions include requirements for states to conduct independent waiver evaluations. States may face challenges in waiver evaluations including access to timely data and isolating the effects of administratively complex waivers that evolve during implementation. The ACA reaffirmed the importance of waiver evaluations by newly requiring that states have a publicly available, approved evaluation strategy with comprehensive research questions. Evaluation findings allow CMS, states, and stakeholders to make mid-course corrections as necessary, determine whether waiver policies had their intended effect, and if certain provisions could or should be replicated in other states.
Early Insights: What to Watch
CMS has removed some waiver reporting requirements in a recent extension approval. Florida’s recent waiver approval removes the requirement for the state to provide quarterly updates thereby limiting data available to CMS and other stakeholders to oversee implementation to annual reporting.
Some waiver policies prove to be too costly or complex to implement as originally intended and are reshaped or dropped. For example, Indiana is seeking to change its premiums to a tiered structure based on income bands instead of a flat 2% of income to improve administrative efficiency in tracking and recalculating premium amounts as enrollee income changes. Indiana also wants to discontinue its premium assistance program for people with access to employer-sponsored insurance due to low enrollment and high administrative costs. Arkansas has discontinued its health savings account model with monthly beneficiary contributions due to high administrative costs and administrative complexity. Although Kentucky has not yet received waiver approval, it already has amended its initial request to change its pending work requirement to a flat 20 hours per week instead of graduated hours increasing from 5 to 20 based on length of program enrollment due to concerns about administrative complexity. If waivers are not implemented according to the approval parameters, it is not possible to adequately measure the effects of specific policies.
Policy makers and researchers will be watching to see if waiver evaluations are required, conducted and used to inform decisions on future waiver requests. While there is not much evidence about how the new administration will proceed with waiver evaluations, CMS recently relieved Montana from the requirement to evaluate its expansion waiver based on its participation in a cross-state federal evaluation. There are also questions about what data will be available for researchers and analysts to assess the impact of waivers on program coverage and on beneficiaries, and how that data and experience will be applied to other state waiver requests.
Although the final regulations involving public notice do not require a state-level public comment period for amendments to existing/ongoing demonstrations, CMS has historically applied these regulations to amendments. CMS guidance also encourages states to comply with public notice regulations when making changes that affect benefits, cost sharing, eligibility, and delivery systems. CMS, SHO#12-001 (April 27, 2012), https://www.medicaid.gov/federal-policy-guidance/downloads/sho-12-001.pdf. ↩︎
50-State Survey Finds Medicaid Enrollment Growth Slowing, with an Uptick in Spending Growth Driven by Provider Rate Increases and Rising Costs for Rx Drugs and Long-Term Care
Several States Are Seeking to Restrict Medicaid Eligibility through Waivers
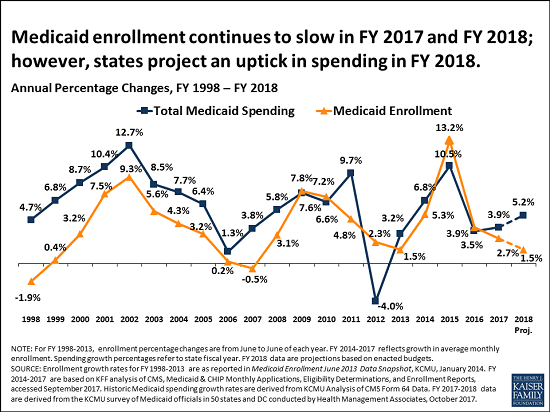
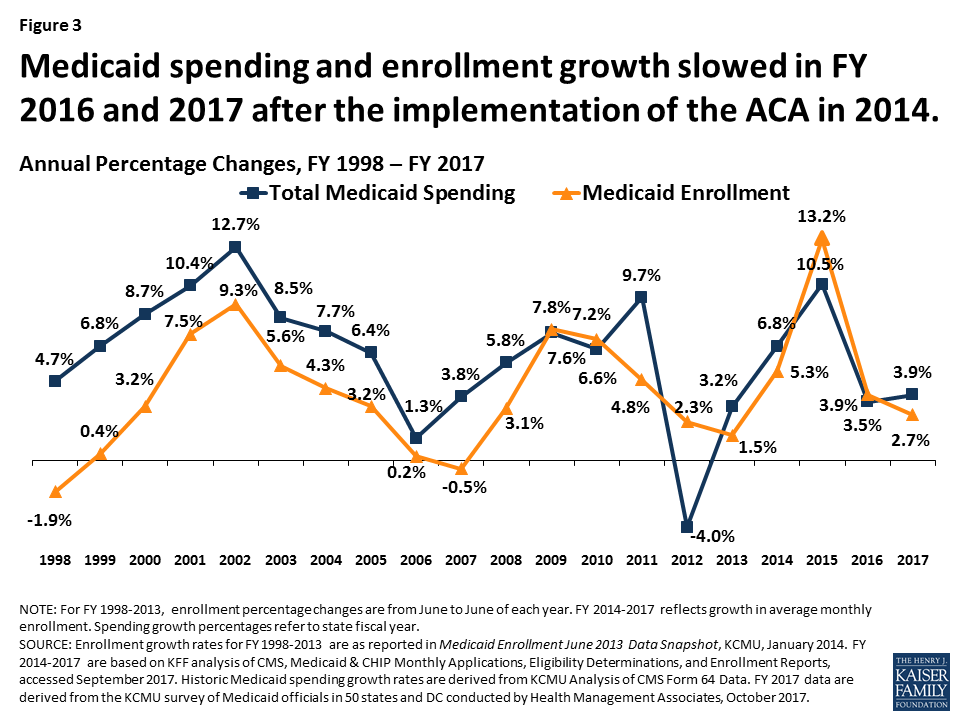
Medicaid enrollment growth slowed to 2.7 percent in state fiscal year 2017, down from 3.9 percent the prior year and far off the peak of 13.2 percent in 2015 that followed implementation of the Affordable Care Act’s (ACA) Medicaid expansion, according to a new survey from the Kaiser Family Foundation. Findings of Kaiser’s 17th annual 50-state survey of Medicaid directors across the country suggest the slowdown in enrollment growth may be attributable to the tapering of new ACA-related Medicaid enrollment, a stable economy, and states’ processing of delayed eligibility redeterminations.
At the same time, total Medicaid spending grew by 3.9 percent in state FY 2017 and states project it will grow by 5.2 percent in state FY 2018, down from 10.5 percent growth in state FY 2015 after implementation of the ACA. Major drivers of spending growth include rising costs of prescription drugs and long-term care services and supports, and increases in payment rates for most provider groups.
State Medicaid spending grew by 3.5 percent in state FY 2017 and states project it will grow by 6 percent in state FY 2018, in part because the 32 expansion states are now paying a share of ACA Medicaid expansion costs after several years in which the federal government footed the entire bill. The Medicaid expansion states began paying 5 percent of expansion costs in January 2017, midway through state FY 2017. State FY 2018 is the first full budget year that states will have to cover some expansion costs, with states’ share rising to 6 percent in January. In addition, some states are experiencing a decrease in the formula-driven federal match rate for the traditional Medicaid population that can result in faster state spending growth.
The survey findings come at a time of uncertainty for Medicaid and state budgets. Forty-eight states assumed continuation of federal Children’s Health Insurance Program (CHIP) funding in their state FY 2018 budgets; that money expired in September and 11 states report they will exhaust federal funding by the end of 2017 if Congress does not reauthorize it. Nearly two-thirds of states also did not budget for reductions in Medicaid disproportionate share (DSH) payments. Congress had delayed those cuts, originally scheduled for federal FY 2014, to October 2017. States were busy preparing estimates of the effects of repeal and replace legislation and many assumed that Congress would act to reauthorize CHIP and potentially delay DSH reductions further into the future.
Medicaid waivers
In an emerging trend, several states are seeking approval to implement Medicaid eligibility restrictions through pending Section 1115 waivers. Proposed restrictions include work requirements (AR, IN, KY, ME, UT, WI); time limits on coverage (ME, UT, WI); eliminating retroactive eligibility (AR, IA, ME, UT); ending Medicaid expansion coverage for people with incomes above the poverty level while maintaining the enhanced federal matching rate for the remaining expansion population (AR, MA); and drug screening and testing (WI). Although these waivers are pending, several states plan to implement some of the proposed restrictions in state FY 2018.
Opioid concerns
As public concern rises about opioid addiction and overdose deaths, more state Medicaid programs are adopting Centers for Disease Control guidelines for the prescribing of opioids, and nearly all have various fee-for-service pharmacy management strategies targeted at opioid harm reduction. Forty-six states reported that naloxone, an opioid overdose antidote, was available without prior authorization.
Other survey findings include:
37 states in state FY 2017 and 36 in state FY 2018 reported increased efforts at cost containment for prescription drugs.
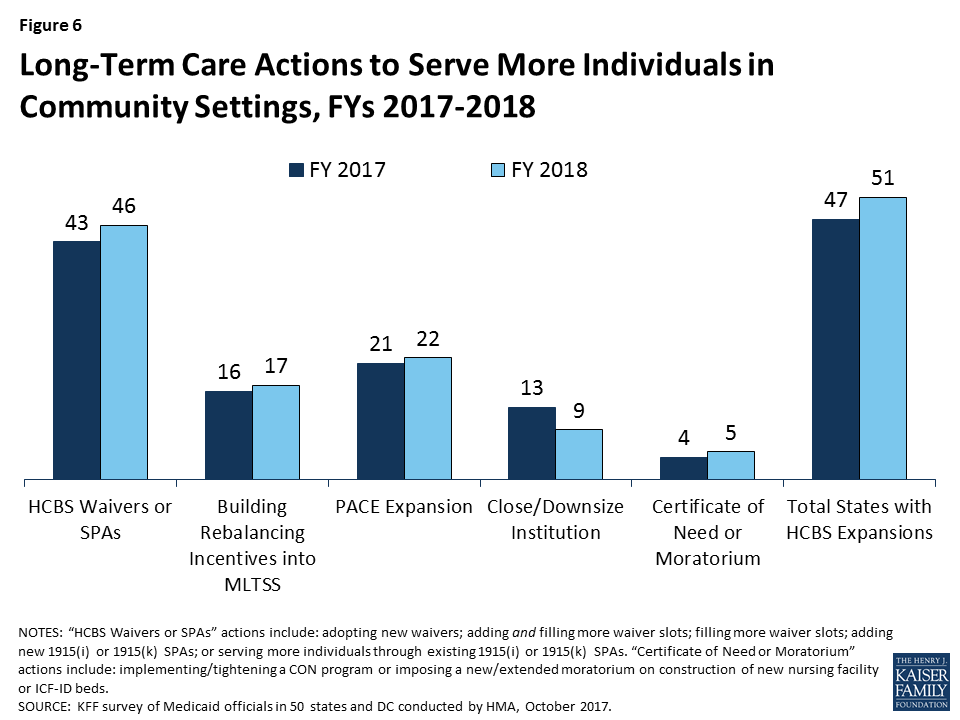
The vast majority of states in FY 2017 (47 states) and all states in FY 2018 are using a variety of tools and strategies to expand the number of people served in home and community-based settings. States are also implementing housing related activities as part of long-term services and supports (LTSS) and working to address LTSS direct care workforce shortages and turnover.
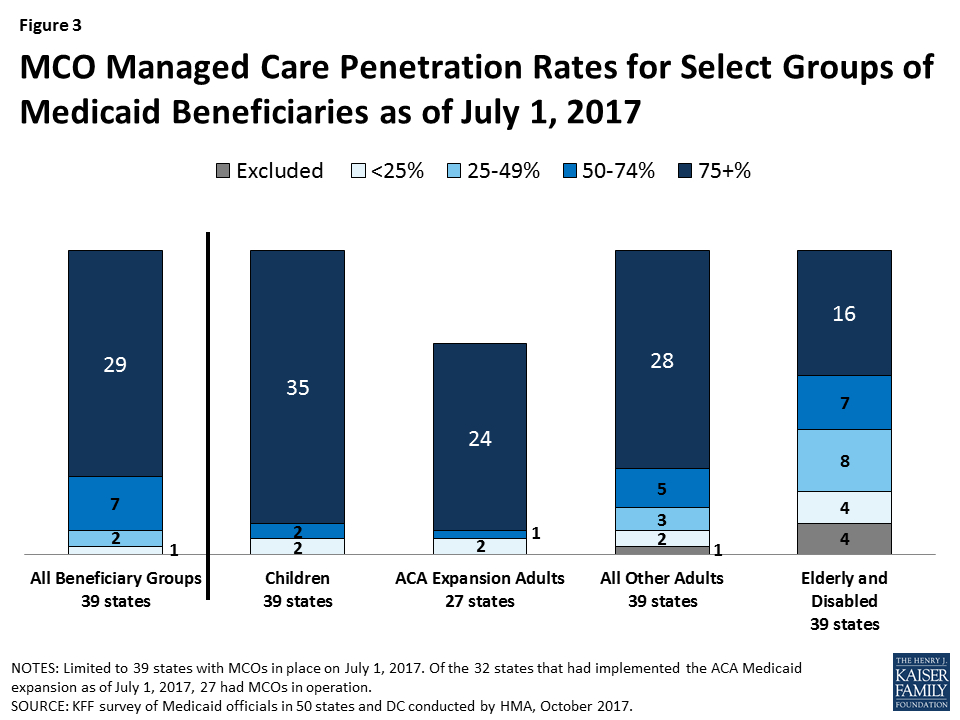
States continue to rely more on managed care. At least 75 percent of Medicaid enrollees are in risk-based managed care organizations (MCOs) in 29 of the 39 states that contract with MCOs.
These and other findings from the 50-state survey, conducted by analysts at the Foundation and Health Management Associates, were discussed today at a briefing held jointly by the Foundation and the National Association of Medicaid Directors (NAMD). The following new reports are available:
States adopted budgets for state fiscal year (FY) 2018 as Congress debated legislative proposals that created a lot of uncertainty about the future of the Affordable Care Act (ACA), financing for the Medicaid expansion as well as overall financing for the Medicaid program. The federal debate was playing out as states grappled with other Medicaid budget issues related to the economy, health care costs, implementation of delivery system reforms, and addressing emerging public health issues like the opioid epidemic. This brief discusses Medicaid enrollment and spending trends for FY 2017 and FY 2018 based on interviews and data provided by state Medicaid directors as part of the 17th annual survey of Medicaid directors in all 50 states and the District of Columbia. The survey was conducted by the Kaiser Family Foundation (KFF) and Health Management Associates (HMA) from June 2017 to August 2017, during the same timeframe that Congress was debating legislative proposals with significant implications for Medicaid. Key findings are described below and in a companion report. The methodology used to calculate enrollment and spending growth as well as additional information about Medicaid financing can be found at the end of the brief.
50-state survey finds #Medicaid enrollment growth slowing, with uptick in spending growth projected for FY2018
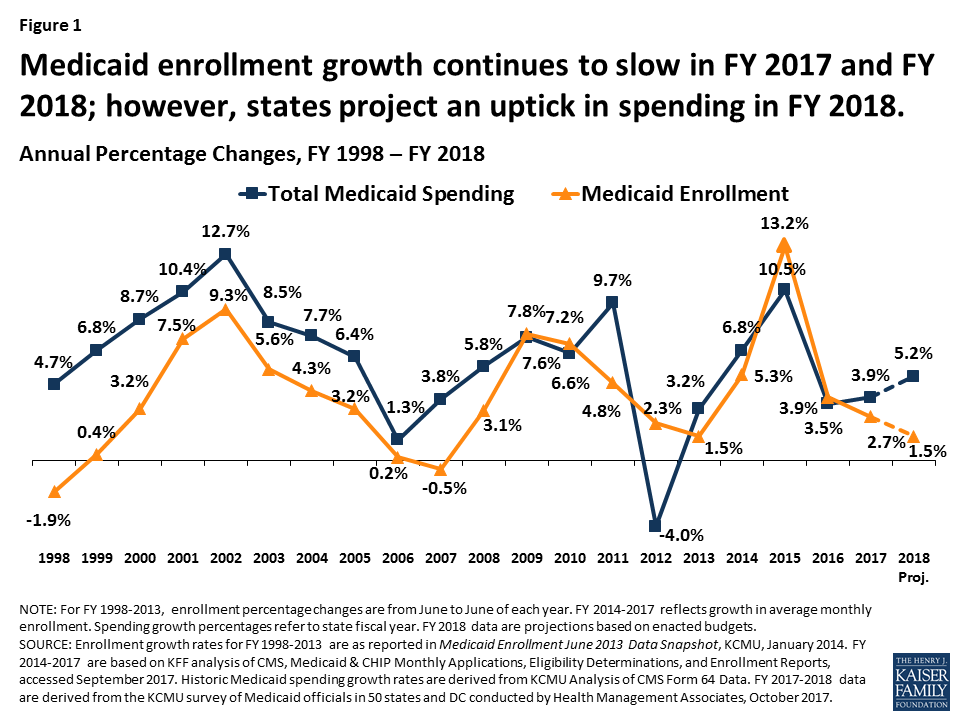
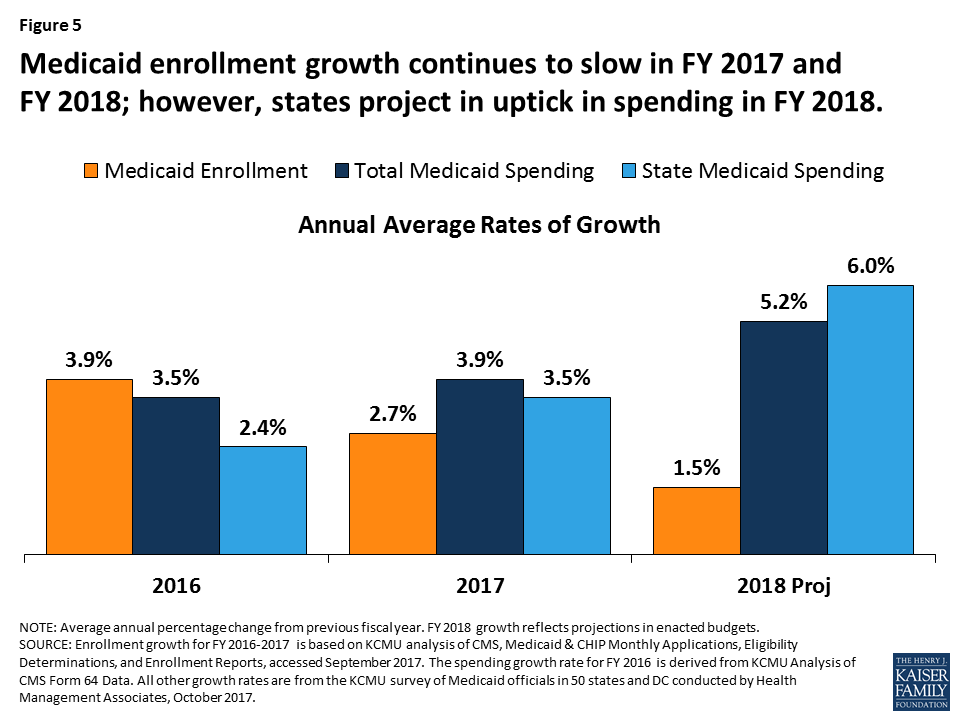
FY 2017: Following peaks in enrollment and spending growth in 2015 due to the implementation of the ACA, Medicaid enrollment growth slowed to 2.7 percent nationally in FY 2017, down from 3.9 percent in FY 2016 (Figure 1). Total spending growth was stable at 3.9 percent, up only slightly from 3.5 percent the previous year. State Medicaid spending experienced a slight uptick from 2.4 percent in FY 2016 to 3.5 percent in FY 2017, as states that implemented the Medicaid expansion started to pay 5 percent of the costs of those enrollees in January 2017 (mid-way through the state fiscal year). However, state spending growth for Medicaid was slower than overall state general fund growth in FY 2017.
Figure 1: Medicaid enrollment growth continues to slow in FY 2017 and FY 2018; however, states project an uptick in spending in FY 2018.
FY 2018: For FY 2018, states on average project Medicaid enrollment growth to dip to 1.5 percent and total spending to increase by 5.2 percent. States attributed slower enrollment growth projections to tapering ACA related enrollment, a stable economy, and the processing of delayed redeterminations. States pointed to high cost prescription drugs and policy decisions to increase payment rates for specific provider groups as factors contributing to higher projected spending growth. Growth in the state share of Medicaid spending is expected to be slightly higher on average than for total spending due to formula-driven FMAP changes (that occur based on lagged personal income data) and, in 32 expansion states, the full-year effect of the state share for expansion enrollees, which increases from 5 percent to 6 percent in January 2018.
Future Outlook: States indicated that they could face budget challenges as reductions to disproportionate share hospital payments go into effect in October 2017, if Congress fails to reauthorize the Children’s Health Insurance Program (CHIP) and if legislative proposals under consideration to restructure Medicaid financing were to be enacted into law. As states started FY 2018 and looking ahead, many were concerned about volatility in state revenues that affects states ability to finance the state share of Medicaid.
Context
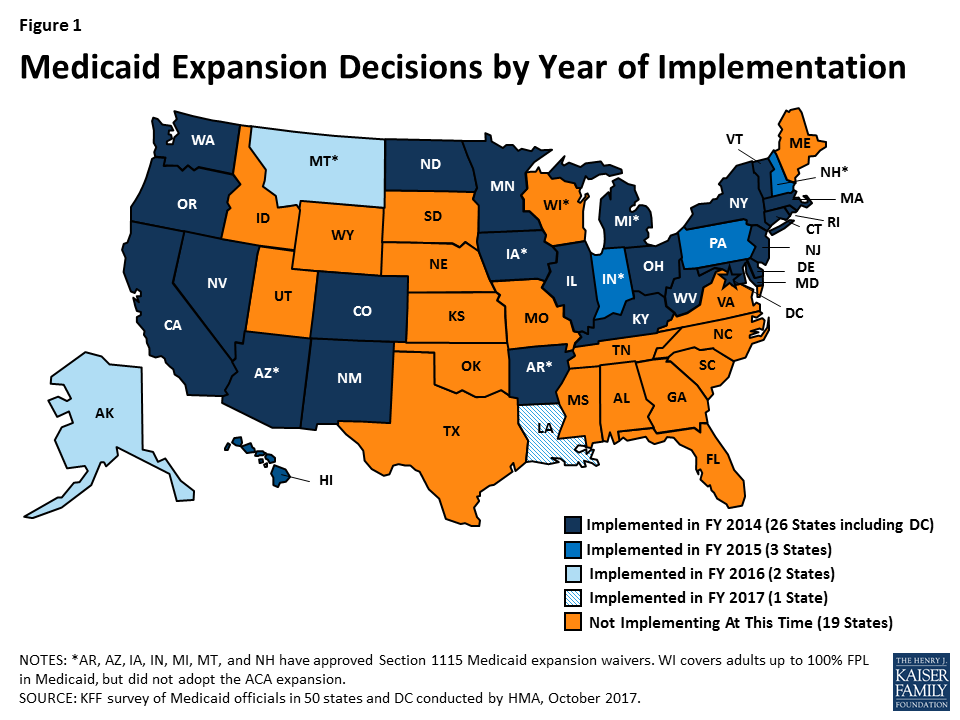
Medicaid provided coverage to about one in five Americans, or about 74 million as of June 2017.1 Total Medicaid spending was $553 billion in FY 2016 with 63 percent paid by the federal government and 37 percent by states.2 Medicaid accounts for one in six dollars spent in the health care system, but more than 50 percent of long-term care spending and 10 percent of prescription drug spending.3 The key factors affecting total Medicaid spending and enrollment changes over the last decade have been the lingering effects of The Great Recession followed by the implementation of the Affordable Care Act (ACA). As of September 2016, 32 states including DC have adopted the ACA Medicaid expansion, with Louisiana implementing at the beginning of FY 2017. Under the law, the federal government provided 100 percent of the cost of expansion for calendar years 2014-2016, gradually phasing down to 95 percent in CY 2017, 94 percent in CY 2018, 93 percent in CY 2019, and 90 percent in CY 2020 and beyond.
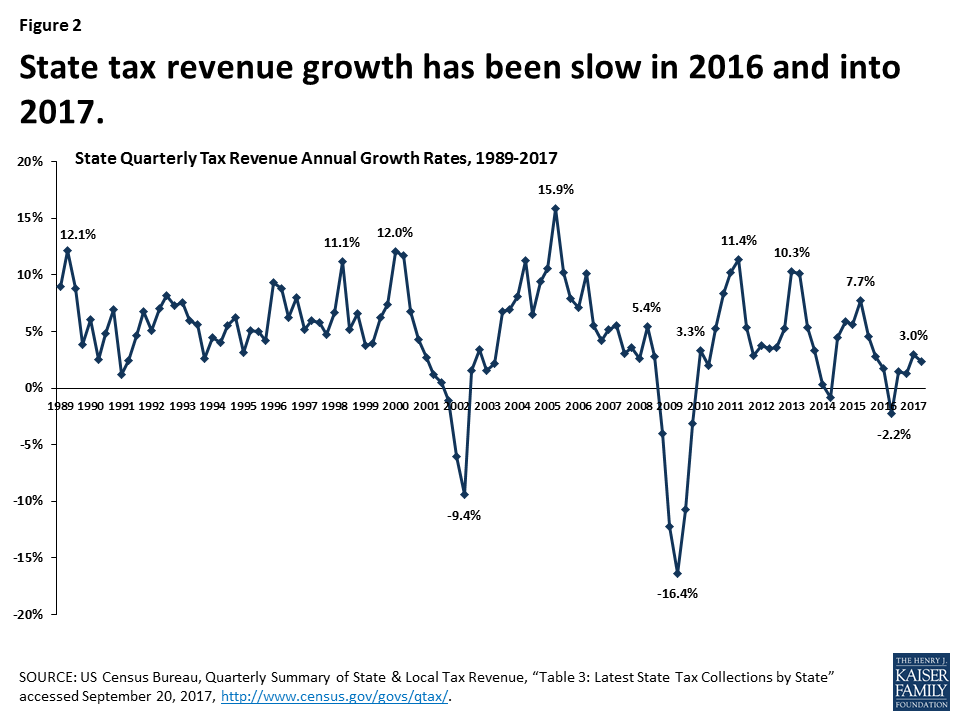
Medicaid enrollment and spending growth are counter-cyclical, influenced by broader changes in the economy. For example, during and after the “Great Recession,” which began in 2008, states experienced high unemployment and major declines in revenue along with significant increases in Medicaid enrollment and spending. The U.S. unemployment rate peaked at 10 percent in October 2009. With economic recovery, the unemployment rate has gradually declined to 4.4 percent in August 2017, relieving pressure on Medicaid enrollment growth. In FY 2016, aggregate state general fund spending and revenues surpassed peak levels from 2008 in real terms (after adjusting for inflation).4 However, recent analysis of revenues shows slow state revenue growth in 2016 and volatility in revenues at the start of 2017. Changes in income tax revenue may be related to shifts in the timing of payment of these taxes in anticipation of lower tax rates in 2017 from federal tax reform legislation. Sales tax revenue was weak at the start of 2017 and corporate tax revenues were declining (Figure 2).5
Figure 2: State tax revenue growth has been slow in 2016 and into 2017.
Underneath the national trends is a lot of state variation. Unemployment rates range from below three percent in North Dakota, Colorado, Hawaii, New Hampshire, Nebraska, and Idaho to higher than six percent in New Mexico, the District of Columbia, and Alaska. The Rockefeller Institute estimates total state tax revenue growth of 2 percent for FY 2017 based on three quarters of data. Thirty-eight states reported growth in the first three quarters of FY 2017, while twelve states reported declines, with the greatest declines in North Dakota and Wyoming. Declines in oil prices have resulted in declines in state tax revenue in oil dependent states. Recent hurricanes in Texas and Florida are expected to result in fiscal issues for those states in the months to come.6
Key Findings
Trends Through FY 2017
Medicaid enrollment growth continued to slow in FY 2017 and spending growth was stable. Historically, Medicaid enrollment drives growth in in Medicaid spending, and enrollment increases during economic downturns or major policy changes (Figure 3). High growth in FY 2015 was due to the implementation of the ACA and recent trends in FY 2016 and FY 2017 reflect the tapering of ACA related enrollment and the delayed effects of improvements in the economy. A number of states noted that the resolution of eligibility redetermination as new systems came online also contributed to slowing enrollment growth.
Figure 3: Medicaid spending and enrollment growth slowed in FY 2016 and 2017 after the implementation of the ACA in 2014.
Slower enrollment growth trends along with efforts to control costs due to budget pressures contributed to lower total spending growth. Slower state revenue growth in FY 2017 added pressure on states to control Medicaid costs. Medicaid officials identified the high costs for prescription drugs, especially for specialty drugs, as well as policy decisions to increase payment rates to specific provider groups as factors putting upward pressures on total Medicaid spending.
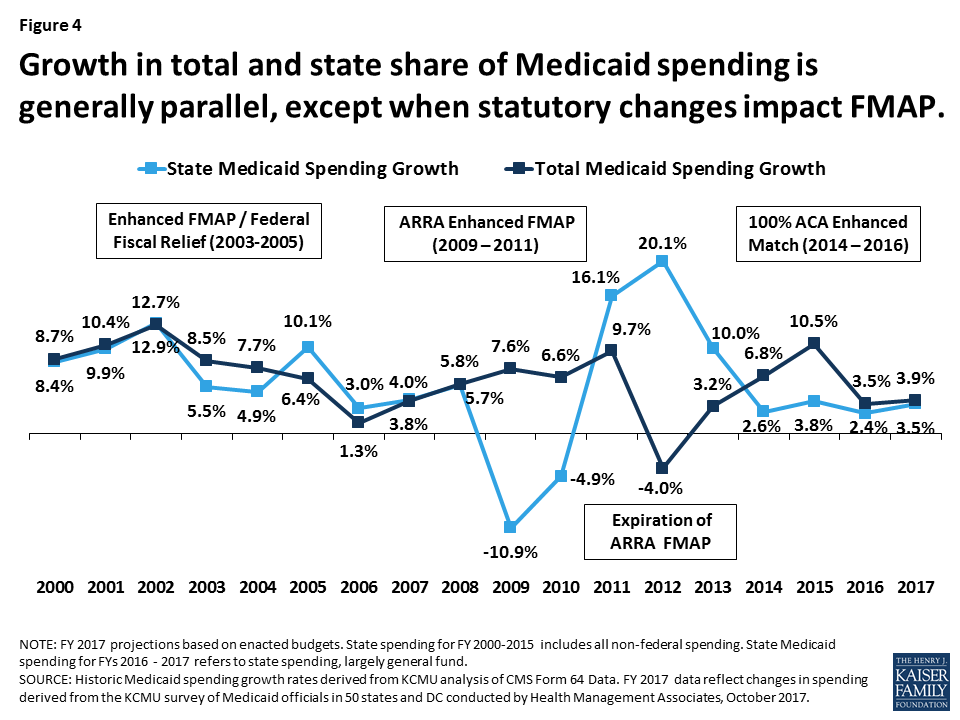
State spending growth experienced an uptick in FY 2017 as expansion states were required to start paying for a share of new adults. Historically, total spending and the state share of Medicaid spending grow in tandem except when there have been changes in federal match rate. Following the implementation of the ACA, state spending growth was lower than total spending growth because the federal government was paying 100 percent of the costs of the expansion group. Mid-way through FY 2017, expansion states began to pay 5 percent of the costs of the new group that resulted in slightly higher state spending growth compared to FY 2016; however the rate of growth for state Medicaid spending (3.5 percent) was still below growth for total Medicaid spending (3.9 percent). State spending growth for Medicaid was lower than overall state general fund growth in FY 2017 of 4.8 percent (Figure 4).
Figure 4: Growth in total and state share of Medicaid spending is generally parallel, except when statutory changes impact FMAP.
Projections for FY 2018
States project low enrollment growth and higher spending growth in FY 2018. For FY 2018, states project that enrollment growth will slow, while total spending growth will increase. While this trend is not typical, this has occurred in the past, particularly a few years after an economic downturn as enrollment continues to trend downward and spending trends up as states restore rate or benefit cuts. For FY 2018 several factors account for the differential in enrollment and spending growth. A sluggish but stable economy may contribute to slower enrollment growth, and states are no longer seeing the increases associated with the implementation of the ACA. A number of states reported that new eligibility systems were able to process backlogs and delayed redeterminations that also resulted in downward enrollment growth. Factors driving higher spending growth include faster growth in the aged and disabled enrollment groups that account for a larger share of program spending, high cost prescription drugs, and provider rate increases. In addition, high growth projected in a few large states drives the national weighted average higher. (Figure 5)
Figure 5: Medicaid enrollment growth continues to slow in FY 2017 andFY 2018; however, states project in uptick in spending in FY 2018.
State spending growth in FY 2018 is expected to slightly exceed total spending growth in FY 2018 due to traditional FMAP changes and phase-in of the state share of Medicaid for the expansion. Twelve states had reductions in the formula driven FMAP for Medicaid which would increase state spending relative to total spending. Kansas, Indiana, and Oklahoma saw reductions in their FMAP of more than 1 percent. The federal match rate (or FMAP) is calculated annually for each state using a formula set in the statute that relies on lagged personal income data. Even small changes in a state’s FMAP can mean large changes in the amount of state funds needed to maintain current programs. In addition, starting in January 2017, expansion states paid five percent of the costs of the new adult group. Since this was implemented part-way into FY 2017, the full effects of the increase will be experienced in FY 2018. The state share for the expansion group will increase from 5 percent to 6 percent for calendar 2018 (Figure 4).
As states began the 2018 state fiscal year much was in flux and much uncertainty remains. Revenues were volatile and states were facing major uncertainty about the outcome of federal legislation that would repeal and replace the ACA and fundamentally change the financing structure of Medicaid; both would reduce federal funding for states to operate their Medicaid programs. However, the recent legislative debate highlighted how difficult it is to gain consensus on major changes to Medicaid and the ACA, that these changes have significant implications for individuals as well as states and providers, and that Medicaid has broad general support and intense support from special populations served by the program. The debate also highlighted how current flexibility in the design and structure of the Medicaid program has resulted in variation across states, made greater by state decisions about whether to implement the ACA Medicaid expansion. In addition, health status, demographic and state fiscal circumstance further complicate proposals to impose per enrollee caps or uniform growth rates across all states.
Looking ahead, the federal budget for FY 2018, legislation to improve ACA market stability and other efforts to reform the tax code may open the door to additional debate around Medicaid and its role. Other changes without legislation are likely to occur through administrative actions that change Medicaid through approval new waivers and regulations. Other administrative changes to the Marketplace could also have potential implications for Medicaid. Finally, emergency assistance to provide relief to states and territories hit hardest by recent hurricanes as well as for efforts to address the opioid epidemic could bring additional resources to some states. All of these legislative and administrative actions could have implications for state budgets and the Medicaid program in FY 2018 and beyond.
Methodology
Definition of Medicaid Spending. Total Medicaid spending includes all payments to Medicaid providers for Medicaid covered services provided to enrolled Medicaid beneficiaries. Medicaid spending also includes special disproportionate share hospital (DSH) payments that subsidize uncompensated hospital care for persons who are uninsured and unreimbursed costs care for persons on Medicaid. Not included in total Medicaid spending are Medicaid administrative costs and federally mandated state “Clawback” payments to Medicare (to help finance the Medicare Part D prescription drug benefit for Medicaid beneficiaries who are also enrolled in Medicare.) States are also asked to exclude costs for the Children’s Health Insurance Program (CHIP) though a few states provided percentage changes for spending that reflected Medicaid and CHIP combined. Total Medicaid spending includes payments financed from all sources, including state funds, local contributions, and federal matching funds. Historical state Medicaid spending refers to all non-federal spending, which may include local funds and provider taxes and fees as well as state general fund dollars. State spending for FYs 2016-2017 collected as part of this survey reflect state spending, largely state general fund dollars.
Methodology. The Kaiser Family Foundation (KFF) commissioned Health Management Associates (HMA) to survey Medicaid directors in all 50 states and the District of Columbia to identify and track trends in Medicaid spending, enrollment, and policy making. Given differences in the financing structure of their programs, the U.S. territories were not included in this analysis. This is the seventeenth annual survey, conducted at the beginning of each state fiscal year from FY 2002 through FY 2018.
The KFF/HMA Medicaid survey for this report was sent to each Medicaid director in June 2017. Medicaid directors and staff responded to the written survey and participated in follow-up telephone interviews from June through August 2017. The telephone discussions are an integral part of the survey to ensure complete and accurate responses and to record the complexities of state actions. All 50 states and DC completed surveys and participated in telephone discussions.
For FY 2017 and FY 2018, annual rates of growth for Medicaid spending were calculated as weighted averages across all states. Weights for spending were derived from the most recent state Medicaid expenditure data for FY 2016, based on estimates prepared for KFF by the Urban Institute using CMS Form 64 reports, adjusted for state fiscal years. These data were also used for historic Medicaid spending. In FY 2013, there was wide inexplicable variation between states, which inflated the overall growth rate. To adjust for this anomaly, spending growth from FYs 2012, FY 2013, and FY 2014 was averaged to estimate growth in FY 2013. The resulting estimate is similar to trends reported by the National Association of State Budget Officers (NASBO).
Medicaid average annual growth rates for enrollment were calculated using weights based on Medicaid and CHIP monthly enrollment data for June 2017 published by CMS.7 Historical enrollment trend data for FY 1998 to FY 2013 reflects the annual percentage change from June to June of monthly enrollment data for Medicaid beneficiaries collected from states.8 Enrollment trend data for FY 2014 to FY 2017 reflects growth in average monthly enrollment based on Medicaid & CHIP Monthly Applications, Eligibility Determinations, and Enrollment Reports from CMS. The baseline for FY 2013 was the monthly average of July 2013 through September 2013 as of August 2015. FY 2014 was estimated by averaging the monthly average of July 2013 through September 2013 with the monthly average of January 2014 through June 2014.
The data reported for FYs 2017 and FY 2018 for Medicaid spending and FY 2018 for Medicaid enrollment are weighted averages, and therefore, data reported for states with larger enrollment and spending have a greater effect on the national average.
Additional information collected in the survey on policy actions taken during FY 2016 and FY 2017 can be found in the companion report at: www.kff.org
Appendix
Appendix: Background on Medicaid Financing
Medicaid Financing Structure. The Medicaid program is jointly funded by states and the federal government. The federal government guarantees match funds to states for qualifying Medicaid expenditures. The federal match rate (Federal Medical Assistance Percentage, or FMAP) is calculated annually for each state using a formula set in the Social Security Act which is based on a state’s average personal income relative to the national average; poorer states have higher FMAPs. The FMAP in FFY 2017 varies across states from a floor of 50 percent to a high of 75.7 percent.9 Personal income data are lagged, so data used for FFY 2018 FMAPs are from the three years of 2013 to 2015. Decreases in the FMAP could increase pressure on state budgets.
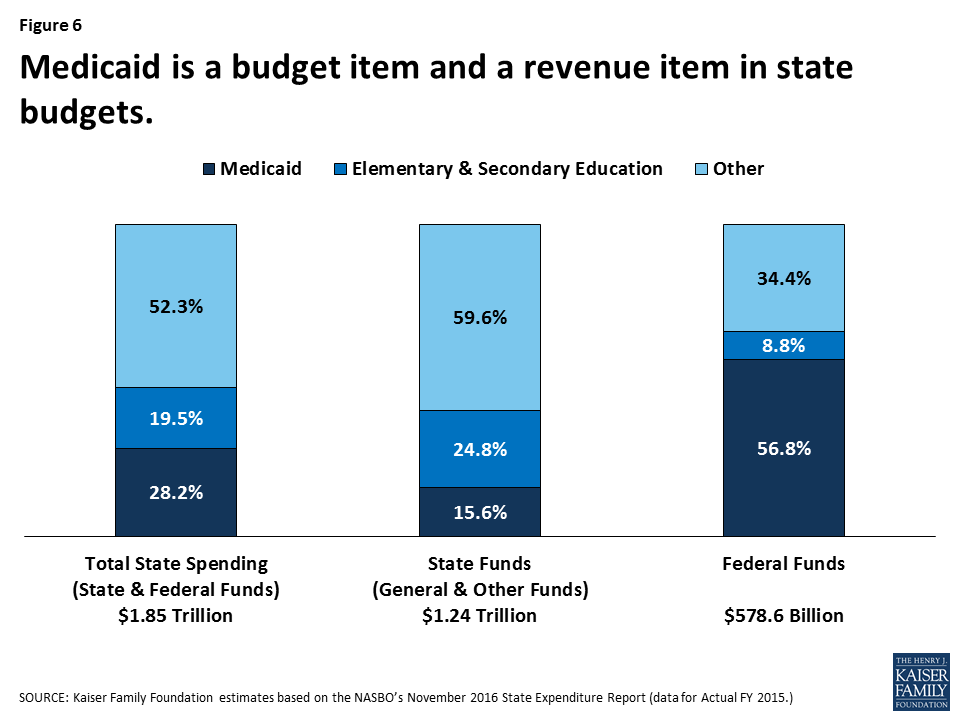
As a result of the federal matching structure, Medicaid has a unique role in state budgets as both an expenditure item and a source of federal revenue for states. In FY 2015, Medicaid accounted for 28.2 percent of total state spending for all items in the state budget, but 15.6 percent of state funds (general fund plus other state funds), a far second to spending on K-12 education (24.8 percent of state funds). Medicaid is the largest single source of federal funds for states, accounting for half (56.8 percent) of all federal funds for states in FY 2015 (Figure 6).10
Figure 6: Medicaid is a budget item and a revenue item in state budgets.
Medicaid and the Economy. Medicaid is a countercyclical program. During economic downturns more people qualify and enroll in Medicaid, which increases program spending at the same time that state tax revenues level or fall. To help mitigate these budget pressures, Congress has twice passed temporary increases to the FMAP to help support states during economic downturns, most recently in 2009 as part of the American Recovery and Reinvestment Act (ARRA). The ARRA-enhanced match rates were the primary vehicle for federal fiscal relief to states during the “Great Recession,” providing states over $100 billion in additional federal funds over 11 quarters, ending in June 2011.11
Medicaid and the ACA. Effective January 1, 2014, the ACA expanded Medicaid eligibility to millions of non-elderly adults with income at or below 138 percent of the federal poverty level (FPL) – about $16,643 for an individual in 2017. The law also provided for 100 percent federal funding of the expansion through 2016, declining gradually to 90 percent in 2020 and future years. The Supreme Court ruling on the ACA in June 2012 effectively made the Medicaid expansion optional for states. As of September 2016, 32 states (including the District of Columbia) have implemented the ACA Medicaid expansion. The ACA also required all states to implement new streamlined and coordinated application, enrollment, and renewal processes, including transitioning to a new income standard (Modified Adjusted Gross Income or MAGI) to determine Medicaid financial eligibility for non-elderly, non-disabled populations.
Kaiser Commission on Medicaid and the Uninsured estimates based on the data reported in: National Association of State Budget Officers, State Expenditure Report – Examining Fiscal 2014-2016 State Spending (Washington, DC: National Association of State Budget Officers, November 2016), http://www.nasbo.org/reports-data/state-expenditure-report. ↩︎
To be eligible for ARRA funds, states could not restrict eligibility or tighten enrollment procedures in Medicaid or CHIP.
Vic Miller, Impact of the Medicaid Fiscal Relief Provisions in the American Recovery and Reinvestment Act (ARRA) (Washington, DC: Kaiser Commission on Medicaid and the Uninsured, October 2011), https://modern.kff.org/medicaid/issue-brief/impact-of-the-medicaid-fiscal-relief-provisions/. ↩︎
Medicaid Moving Ahead in Uncertain Times: Results from a 50-State Medicaid Budget Survey for State Fiscal Years 2017 and 2018
Authors:
Kathleen Gifford, Eileen Ellis, Barbara Coulter Edwards, Aimee Lashbrook, Elizabeth Hinton, Larisa Antonisse, Allison Valentine, and Robin Rudowitz
Medicaid covers one in five Americans, accounts for one in six dollars spent on health care in the United States and more than half of all spending for long-term services and supports, and is a state budget driver as well as the largest source of federal revenues to states. Medicaid is constantly evolving as policymakers strive to improve program value and outcomes through delivery system reforms, respond to economic conditions or public health concerns (such as the opioid epidemic), or implement federal policy changes including those in the Affordable Care Act (ACA) or other regulatory changes (like the recent Medicaid managed care rule). As states began state fiscal year (FY) 2018, Congress was debating major ACA repeal and replace legislation generating great uncertainty for states around Medicaid including the future of the ACA and financing for the Medicaid expansion as well as overall financing for the Medicaid program.
KFF #Medicaid budget survey has data on #opioids initiatives, provider rates, #managedcare & more
This report provides an in-depth examination of the changes taking place in Medicaid programs across the country during this time of uncertainty. The findings are drawn from the 17th annual budget survey of Medicaid officials in all 50 states and the District of Columbia conducted by the Kaiser Family Foundation (KFF) and Health Management Associates (HMA), in collaboration with the National Association of Medicaid Directors (NAMD). This report highlights certain policies in place in state Medicaid programs in FY 2017 and policy changes implemented or planned for FY 2018. The District of Columbia is counted as a state for the purposes of this report. Given differences in the financing structure of their programs, the U.S. territories were not included in this analysis.
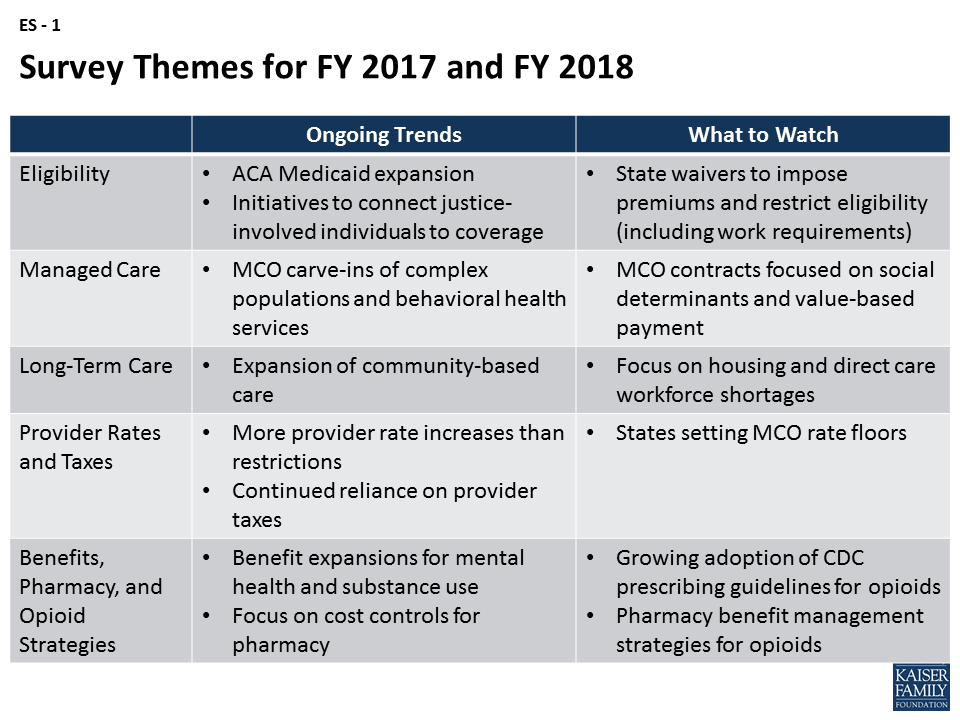
Key findings show that despite uncertainty about federal legislative changes, many states were continuing efforts to expand managed care, move ahead with payment and delivery system reforms, increase provider payment rates, and expand benefits as well as community-based long-term services and supports. Emerging trends include proposals to restrict eligibility (e.g., work requirements) and impose premiums through Section 1115 waivers, movement to include value-based purchasing requirements in MCO contracts, and efforts to combat the growing opioid epidemic. Key areas to watch include federal legislative efforts to restructure and limit federal Medicaid financing as well as Section 1115 waiver activity (state waiver proposals and CMS approvals). These issues will have implications for states, providers, and beneficiaries that could shape the future of the Medicaid program in FY 2018 and beyond (Figure ES – 1).
Figure ES-1: Survey Themes for FY 2017 and FY 2018
Eligibility Policies
Since 2014, most major eligibility changes have been related to adoption of the ACA Medicaid expansion. To date, 32 states have implemented the expansion (Louisiana was the latest state to adopt the expansion in FY 2017). Largely because the Medicaid expansion made many individuals involved in the criminal justice system newly eligible for coverage (including childless adults who were not previously eligible in most states), many states have implemented policies to facilitate enrollment in Medicaid upon release and to suspend, rather than terminate, Medicaid eligibility for incarcerated individuals. The majority of states also have policies in place to provide Medicaid coverage of inpatient care for those incarcerated in prisons or jails.
What to watch: Several non-expansion states (Idaho, Tennessee, Virginia, and Wyoming) reported this year that consideration of the Medicaid expansion was on hold due to uncertainty about the future of the Medicaid expansion option. For FY 2018, several states are seeking Medicaid eligibility restrictions through Section 1115 waivers, including conditioning eligibility on meeting work requirements,1 elimination of retroactive eligibility, and elimination of Medicaid expansion coverage for those with incomes above 100 percent of the federal poverty level (FPL).2 Eligibility provisions in proposals in Arkansas and Indiana would apply to ACA Medicaid expansion populations and proposals in Iowa, Maine, and Utah would apply to non-expansion populations. Two states (Arkansas and Indiana) reported activity related to Medicaid premiums in FY 2017 or FY 2018, both through Section 1115 waivers.
Managed Care And Delivery System Reforms
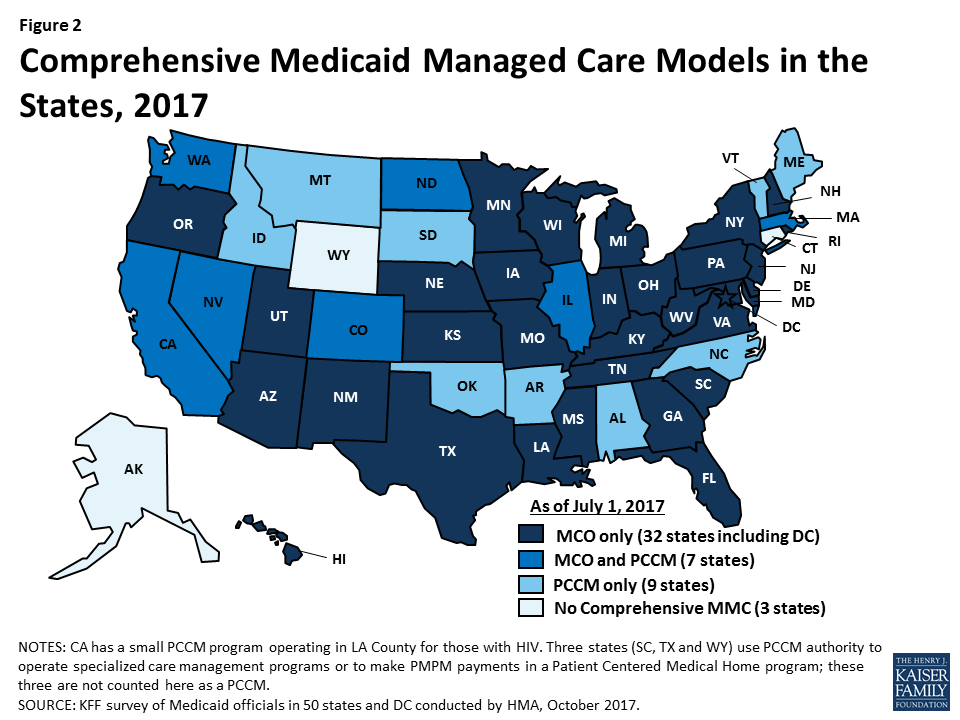
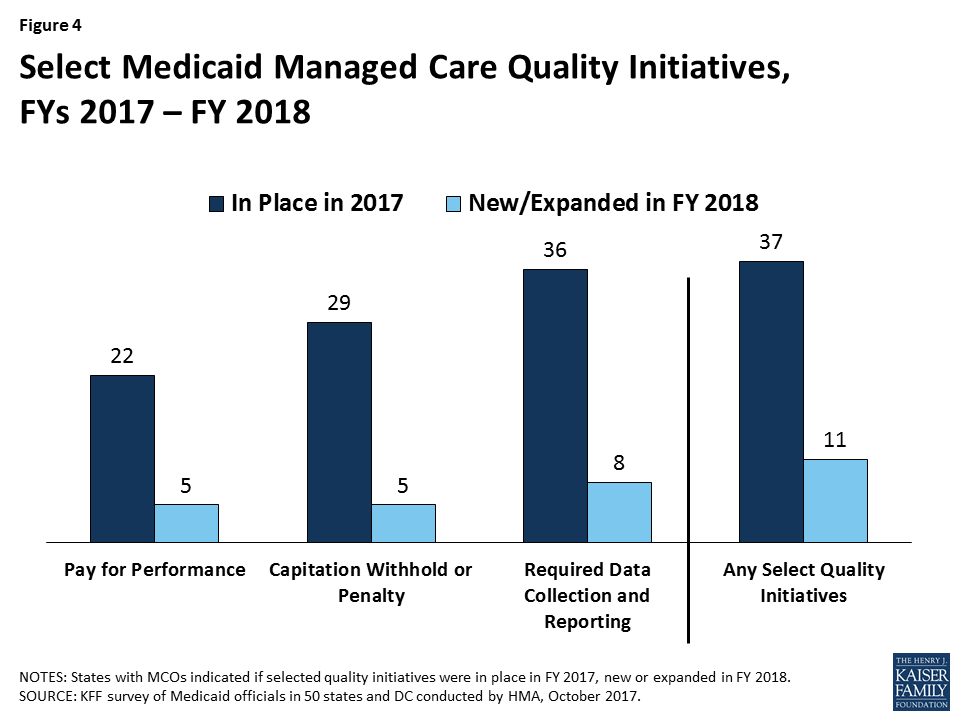
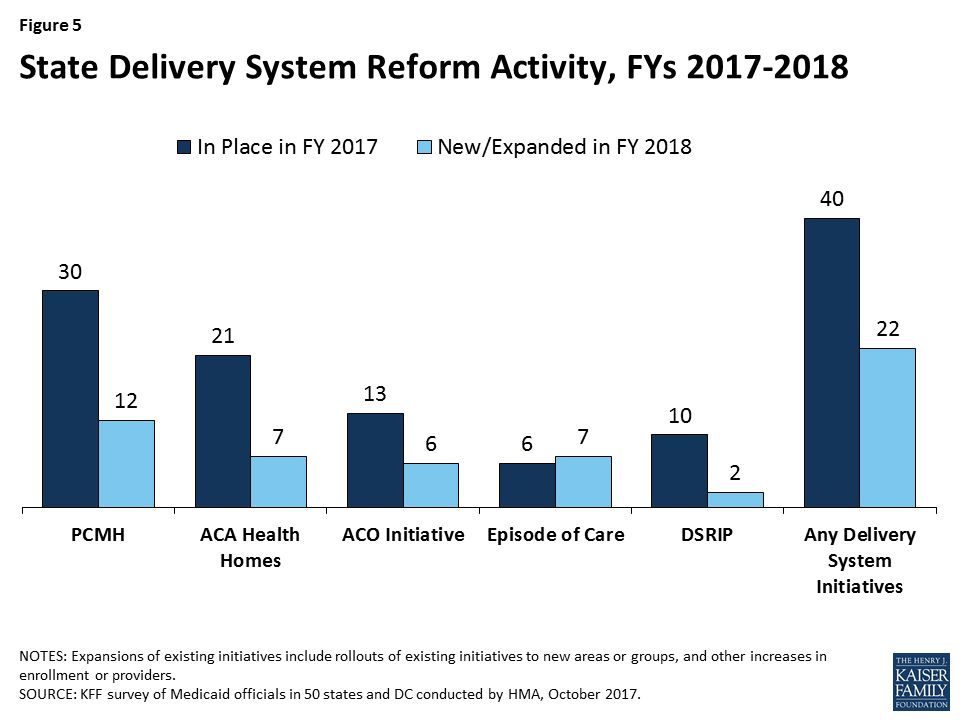
Managed care is the predominant delivery system for Medicaid in most states. Among the 39 states with comprehensive risk-based managed care organizations (MCOs), 29 states reported that 75 percent or more of their Medicaid beneficiaries were enrolled in MCOs as of July 1, 2017. More states continue to carve complex populations as well as behavioral health services into MCO contracts. Twenty-six of the 39 MCO states reported that they plan to use authority to receive federal matching funds for adults receiving inpatient psychiatric or substance use disorder (SUD) treatment in an institution for mental disease (IMD) for no more than 15 days a month included in the 2016 managed care regulations. Close to half of MCO states reported that the day limit is insufficient to meet acute inpatient or residential treatment needs for those with serious mental illness (SMI) or SUD.3 Nearly all states have managed care quality initiatives in place such as pay for performance or capitation withholds. Working in conjunction with or outside of MCO contracts, the majority of states (40) had one or more delivery system or payment reform initiative in place in FY 2017 (e.g., patient-centered medical home, ACA Health Home, accountable care organization, episode of care payment, or delivery system reform incentive program (DSRIP)).
What to watch: States are using MCO arrangements to increase attention to the social determinants of health and to promote value-based payment. States are increasingly requiring MCOs to: screen beneficiaries for social needs (19 states in FY 2017 and two additional states in FY 2018); provide care coordination pre-release to incarcerated individuals (six states in FY 2017 and one additional state in FY 2018); and use alternative payment models (APMs) to reimburse providers (13 states in FY 2017 set a target percentage of MCO provider payments that must be in APM and nine additional states plan to set a target in FY 2018). More than one in three states also have initiatives to expand dental access or improve oral health outcomes (for children and/or adults) and to expand the use of telehealth.
Long-Term Services And Supports (LTSS)
The vast majority of states in FY 2017 (47 states) and all states in FY 2018 are using a variety of tools and strategies to expand the number of people served in home and community-based settings. The most common strategies include using home and community-based services (HCBS) waivers or state plan options, serving more individuals through Programs of All-Inclusive Care for the Elderly (PACE), and building rebalancing incentives into managed long-term services and supports (MLTSS) contracts. Twenty-three states cover LTSS through one or more capitated managed care arrangements as of July 1, 2017.
What to watch: Housing supports are an increasingly important part of state LTSS benefits. Over half of states (27) reported that they implemented or expanded housing-related activities outlined in CMS’s June 2015 Informational Bulletin (e.g., housing transition services or housing and tenancy sustaining services) in FY 2017 or FY 2018 (up from 16 states reported last year). States are also focused on addressing LTSS direct care workforce shortages and turnover: 17 states reported efforts in FY 2017 or 2018 to increase wages for direct care workers and/or engage in targeted workforce development activities (recruiting, training, credentialing, etc.).
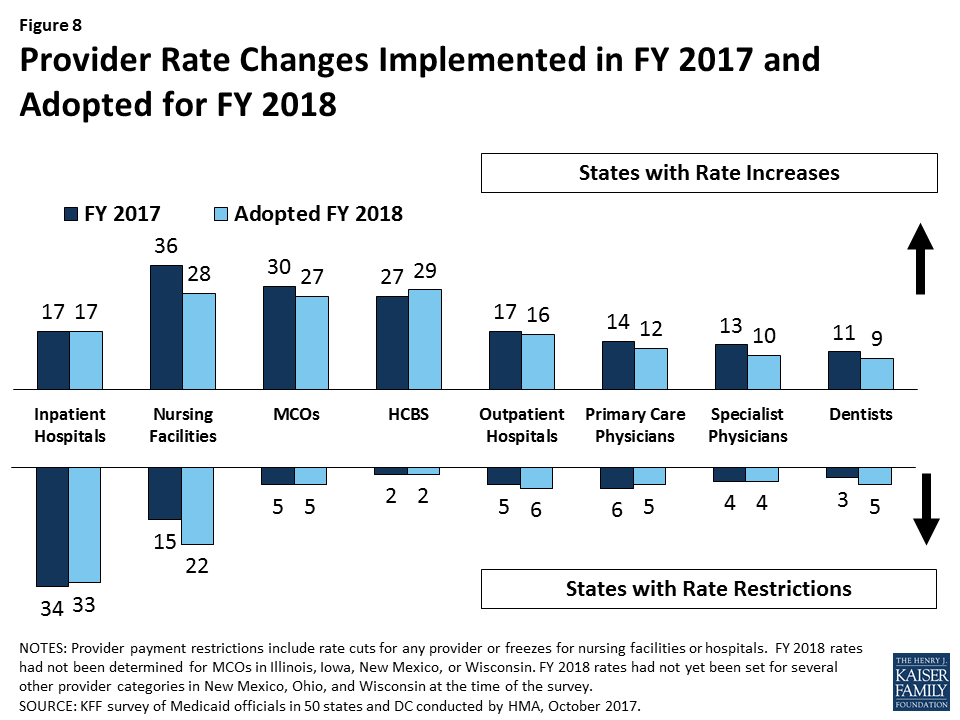
Provider Payment Rates And Taxes
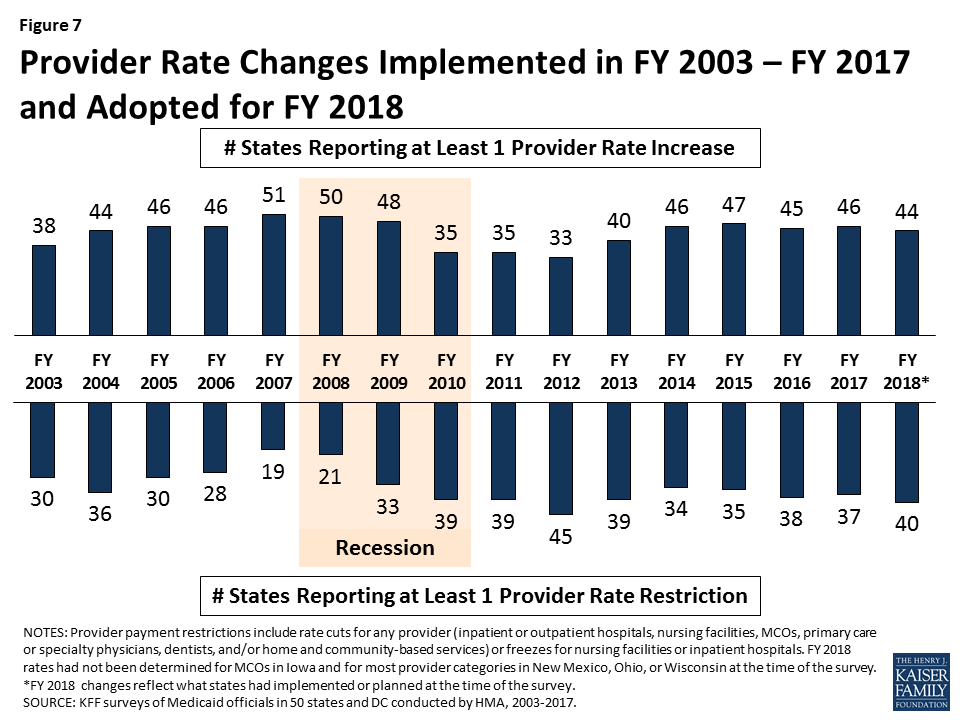
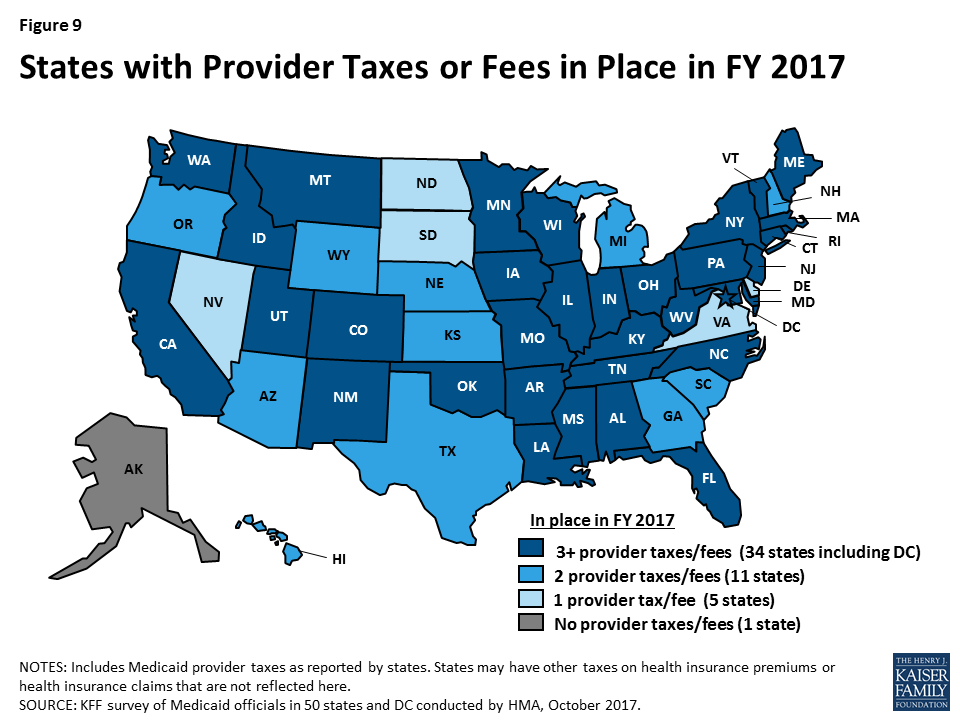
In FY 2017 and FY 2018, more states made or are planning provider rate increases compared to restrictions across all provider types, except for inpatient hospital rates (hospital rate restrictions are primarily rate freezes, which are counted as restrictions in this report). All states except Alaska rely on provider taxes and fees to provide a portion of the non-federal share of the costs of Medicaid. Three states indicated plans for new provider taxes in FY 2018 and 13 states plan provider tax increases.
What to watch: Survey responses related to MCO rate setting show that 18 of 39 MCO states require MCO rates to follow fee-for-service (FFS) rate changes for some provider types, and two states require MCO rates to follow FFS rate changes for all provider types. Twenty-four states reported they had MCO rate floors for some provider types, and five states said they had rate floors for all types of Medicaid providers. Federal legislation considered in the Senate proposed limiting the use of provider taxes by lowering the “safe harbor threshold” from the current allowable level, 6.0 percent of net patient revenues, to 5.0 percent of net patient revenues by FY 2025 in one proposal and 4.0 percent by FY 2025 in another. The survey shows that 29 states reported having at least one provider tax exceeding 5.5 percent of net patient revenues and 46 states reported having at least one provider tax exceeding 3.5 percent as of July 1, 2017.
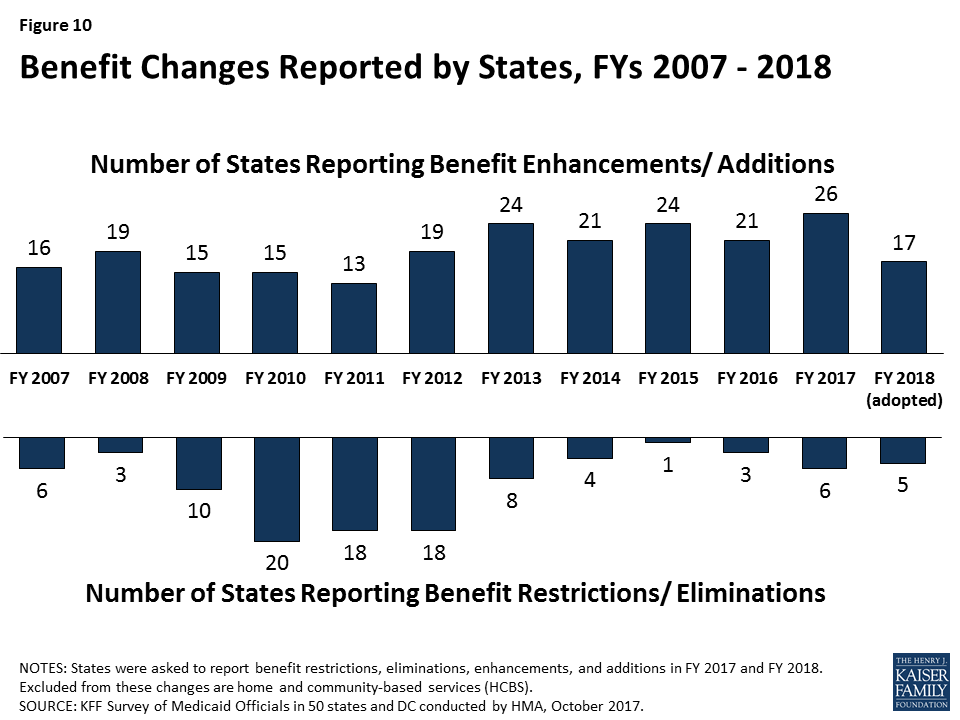
Benefits, Prescription Drugs, and Opioid Strategies
A total of 26 states expanded or enhanced covered benefits in FY 2017 and 17 states plan to add or enhance benefits in FY 2018, most commonly for behavioral health/substance use disorder services and dental services. Thirteen states reported changes to copayment requirements in either FY 2017 or FY 2018, including new or increased copayments for enrollees with income above 100 percent FPL, for non-emergency use of a hospital emergency department, and pharmacy. Most states identified high cost and specialty drugs (including hepatitis C antivirals) as a significant cost driver for state Medicaid programs. The majority reported actions to refine and enhance their pharmacy programs, especially implementation of new utilization controls (e.g., prior authorization requirements, clinical edits, and quantity limits). Thirty-five of 39 MCO states reported that the pharmacy benefit was “generally carved-in.” Of these 35 states, the majority reported requirements that MCOs have uniform clinical protocols (31 states) or uniform preferred drug lists (PDLs) (19 states) that will be in place for one or more drugs as of the end of FY 2018.
What to watch: A growing number of states have chosen to adopt the CDC guidelines for the prescribing of opioid pain medications for adults in primary care settings (34 states as of the end of FY 2018). Nearly all states have various FFS pharmacy management strategies targeted at opioid harm reduction in place as of FY 2017, including quantity limits (48 states); clinical criteria claim system edits (46 states); step therapy (34 states); and other prior authorization requirements (32 states). Somewhat fewer states (28 states) reported requirements in place for Medicaid prescribers to check their states’ Prescription Drug Monitoring Program before prescribing opioids to a Medicaid patient. Among the 35 states that used MCOs to deliver pharmacy benefits, 24 reported that they required MCOs to follow some or all of their FFS pharmacy benefit management policies for opioids. For FY 2017, the vast majority of states (46 states) reported that naloxone (a prescription opioid overdose antidote) was available in at least one formulation without prior authorization (PA) and most states (42) also covered the naloxone nasal spray formulation without PA. The standard of care for opioid use disorder is medication-assisted treatment (MAT), which combines psychosocial treatment with medication. All 49 states that responded to a new question about medication-assisted treatment (MAT) drugs reported coverage of buprenorphine and both oral and injectable naltrexone, but a somewhat smaller number (36 states) reported coverage of methadone in FY 2017.4
Looking Ahead
Medicaid is constantly evolving as policymakers strive to improve program value and outcomes through delivery system reforms, respond to economic conditions or public health concerns (such as the opioid epidemic), or implement federal policy changes including those in the ACA or other regulatory changes (like the recent Medicaid managed care rule). As states began FY 2018, Congress was debating major ACA repeal and replace legislation generating great uncertainty for states around Medicaid including the future of the ACA and financing for the Medicaid expansion as well as overall financing for the overall Medicaid program. On this year’s survey, Medicaid directors were asked to comment on state-specific implications of federal proposals. Most Medicaid directors from the 32 ACA Medicaid expansion states reported that they would not be able to continue covering the expansion population, or that coverage would be at substantial risk, if the ACA enhanced federal match for this population were terminated. Almost all Medicaid directors expressed concern about the likely negative fiscal consequences tied to proposed limits on federal Medicaid spending. Some directors mentioned that they welcomed potential new state policy flexibility under federal legislative proposals, but a greater number of Medicaid directors expressed concern that proposals to convert Medicaid to a per capita cap or block grant would not provide sufficient flexibility to enable states to make up for the reduction in federal funds.
Despite the uncertain policy environment, many states continue efforts to expand managed care, move ahead with payment and delivery system reforms, increase provider payment rates, expand benefits, and expand community-based LTSS. Emerging trends from this year’s survey include proposals to restrict eligibility (e.g., work requirements) and impose premiums through Section 1115 waivers, movement to include value-based purchasing requirements in MCO contracts, and efforts to combat the growing opioid epidemic. Key areas to watch include federal legislative efforts to restructure and limit federal Medicaid financing as well as Section 1115 waiver activity (state waiver proposals and CMS approvals). These issues will have implications for states, providers, and beneficiaries that could shape the future of the Medicaid program in FY 2018 and beyond.
Report: Introduction
Medicaid provides health insurance coverage to more than one in five Americans, and accounting for over one-sixth of all U.S. health care expenditures.5 The Medicaid program constantly evolves, as policy makers in each state make changes to improve their programs, respond to economic conditions, come into compliance with new federal requirements, and implement other state budget and policy priorities. As fiscal year (FY) 2018 began in most states, legislative proposals to repeal major portions of the Affordable Care Act (ACA), including the Marketplace and Medicaid coverage expansions, were under consideration in Congress. These proposals would also have fundamentally restructured federal Medicaid financing, converting the current open-ended entitlement to a federal block grant or per capita cap. It is within that context that this year’s survey was conducted.
This report examines the reforms, policy changes, and initiatives that occurred in FY 2017 and those adopted for implementation for FY 2018 (which began for most states on July 1, 20176 ). Report findings are drawn from the annual budget survey of Medicaid officials in all 50 states and the District of Columbia conducted by the Kaiser Family Foundation (KFF) and Health Management Associates (HMA), in collaboration with the National Association of Medicaid Directors (NAMD). This was the 17th annual survey, which has been conducted from FY 2002 through FY 2018. (Copies of previous reports are archived here.7 )
The KFF/HMA Medicaid survey on which this report is based was conducted from June through September 2017. The survey was sent to each state Medicaid director in June 2017. Directors and their staff provided data for this report in their written survey response and through a follow-up telephone interview. All 50 states and DC completed surveys and participated in telephone interview discussions between July and September 2017. Given differences in the financing structure of their programs, the U.S. territories were not included in this analysis. An acronym glossary and the survey instrument are included as appendices to this report.
The survey collects data about Medicaid policies in place or implemented in FY 2017, policy changes implemented at the beginning of FY 2018, or policy changes for which a definite decision has been made to implement in FY 2018. Some policies adopted for the upcoming year are occasionally delayed or not implemented for reasons related to legal, fiscal, administrative, systems or political considerations, or due to delays in approval from CMS. The District of Columbia is counted as a state for the purposes of this report; the counts of state policies or policy actions that are interspersed throughout this report include survey responses from the 51 “states” (including DC). Key findings of this survey, along with state-by-state tables providing more detailed information, are described in the following sections of this report:
Since 2014, most major eligibility changes have been related to adoption of the ACA Medicaid expansion. To date, 32 states have implemented the expansion (Louisiana was the latest state to adopt the expansion in FY 2017). Only a few states adopted other Medicaid eligibility expansions for FYs 2017 or 2018, and these changes were generally narrow in scope and targeted to a limited number of beneficiaries. The majority of states have policies in place to provide Medicaid coverage of inpatient care for those incarcerated in prisons or jails, to facilitate enrollment in Medicaid upon release, and to suspend, rather than terminate, Medicaid eligibility for incarcerated individuals.
What to watch:
For FY 2018, several states are seeking Medicaid eligibility restrictions through Section 1115 waivers that apply to ACA Medicaid expansion and/or traditional Medicaid populations, including the addition of work requirements, elimination of retroactive eligibility, and elimination of Medicaid expansion coverage for those with income above 100 percent of the federal poverty level (FPL).8 Several non-expansion states reported that consideration of the Medicaid expansion was on hold due to uncertainty about the future of the Medicaid expansion option.
Two states reported activity related to premiums in FY 2017 or FY 2018, both through Section 1115 waivers.
Tables 1, 2, and 3 at the end of this section include additional details on eligibility and premium policy changes in FYs 2017 and 2018.
Changes to Eligibility Standards
The ACA Medicaid expansion was one of the most significant Medicaid eligibility changes in the history of the program. By FY 2017, 32 states had implemented the ACA Medicaid expansion: 26 states in FY 2014; three states (Indiana, New Hampshire and Pennsylvania) in FY 2015; two states (Alaska and Montana) in FY 2016, and one state (Louisiana) on July 1, 2016 (FY 2017) (Figure 1).
Figure 1: Medicaid Expansion Decisions by Year of Implementation
Several non-expansion states (Idaho, Tennessee, Virginia, and Wyoming) reported that consideration of the Medicaid expansion was on hold due to uncertainty about the future of the Medicaid expansion option. North Carolina’s governor announced plans to adopt the expansion shortly after taking office in January 2017. These plans have been delayed, however, by a lawsuit brought by a group of legislators challenging the governor’s authority to expand without legislative approval.9 In Maine, voters will decide whether the state will adopt the ACA Medicaid expansion in a referendum this November.10
Other Eligibility Expansions
Beyond the ACA Medicaid expansion, states have made very few changes to expand Medicaid eligibility since 2014, and states reported only a few narrow expansions targeting a limited number of beneficiaries implemented in FY 2017 or planned for FY 2018 (Tables 1 and 2).
In addition to the ACA Medicaid expansion in Louisiana, a total of six other states made changes that expanded Medicaid eligibility in FY 2017. For FY 2018, seven states plan to implement eligibility expansions. Notable expansions reported include the following:
In FY 2017, both Florida and Utah implemented the option to eliminate the five-year bar on Medicaid eligibility for lawfully-residing immigrant children. Arkansas and Nevada both intend to implement this option in FY 2018 (pending CMS approval of their plans, which were adopted by both states’ legislatures during FY 2017).
In FY 2018, a pending Section 1115 waiver in Utah proposes covering a new eligibility group: individuals with income below 5 percent of the FPL who are chronically homeless, justice-involved, or individuals in need of substance use and/or mental health treatment.
Eligibility Restrictions
Only one state reported implementing an eligibility restriction in FY 2017: Missouri suspended its family planning waiver11 in FY 2017 following legislative restrictions contained in the state’s FY 2017 appropriations bill.12 Although Missouri replaced the Medicaid family planning waiver with a state-funded family planning program, this change eliminated Medicaid coverage for family planning services and placed new restrictions on which providers are accessible to the population. (The new restrictions apply only to individuals eligible through the waiver, however, and do not affect coverage of family planning services for other Medicaid eligible individuals.)
Eight states reported eligibility restrictions for FY 2018 (six states through Section 1115 waivers and two states through state plan authority), some in response to a March 2017 Trump administration letter to state governors13 that signaled an openness to approve Section 1115 waivers that include work requirements and more expansive use of premiums and cost sharing. This year’s survey captured changes that states have implemented or plan to implement in FY 2018, even if these changes are included in Section 1115 Waiver proposals that are pending approval 14 at CMS. Waiver provisions (in approved or pending waivers) that states plan to implement in FY 2019 or after are described later in the “Challenges and Priorities” section of this report.15 A description of key eligibility restrictions included in pending Section 1115 waivers planned for FY 2018 implementation follows.
Arkansas 17 has proposed to amend its “Arkansas Works” Medicaid expansion waiver to: (1) eliminate coverage for persons with income above 100 percent of the FPL while still maintaining the enhanced federal matching rate for the remaining expansion population at or below 100 percent FPL, (2) include a work requirement for the remaining expansion population, and (3) eliminate the conditions CMS placed on the state’s waiver of retroactive eligibility for expansion enrollees (including the medically frail).18
Indiana19 plans to impose a three-month lock-out from coverage on individuals who fail to comply with redetermination requirements. Beneficiaries who fail to verify eligibility at renewal would be disenrolled but could re-enroll without a new application if they provide necessary documentation within 90 days. After 90 days, a three-month lock-out period would follow before individuals could re-enroll.20
FY 2018 restrictions for non-ACA expansion Medicaid populations:
Iowa plans to eliminate retroactive Medicaid eligibility for all Medicaid enrollees with an October 1, 2017 target implementation date.21
Maine22 plans to: (1) waive retroactive eligibility so that coverage would begin no earlier than the first day of the month of application, (2) impose a work requirement for adults (ages 19 to 64), such as parents and former foster care youth, and a time limit on coverage for those who fail to comply with work requirement, (3) apply a $5,000 asset test to all coverage groups that currently do not have an asset test, and (4) eliminate hospital presumptive eligibility for all coverage groups. The state’s pending waiver application proposes to implement these initiatives within six months of demonstration approval (the state’s estimated start date is January 1, 2018).23
Utah plans to impose a work requirement for its existing Primary Care Network (PCN) waiver adults,24 impose a 60-month time limit on eligibility for PCN adults, and end hospital presumptive eligibility for all current enrollees.
A pending Section 1115 waiver in Utah proposes covering a new eligibility group: individuals with income below 5 percent of the FPL who are chronically homeless, justice-involved, or individuals in need of substance use and/or mental health treatment. The state also plans to implement the following restrictive policies for this proposed new childless adults coverage group: 60-month time limit on coverage; no retroactive eligibility; and no hospital presumptive eligibility. Implementation is proposed for January 1, 2018.25
Premiums
The Medicaid statute generally does not allow states to charge premiums to Medicaid beneficiaries. Only two states reported activity related to Medicaid premiums in either FY 2017 or FY 2018.26 In FY 2017, Arkansas replaced the requirement that expansion enrollees make contributions to “Health Independence Accounts” with a new 2 percent of income premium requirement (up to $13/month) for expansion enrollees above 100 percent FPL. Indiana’s pending waiver includes requests to: (1) add a 1 percent premium surcharge for tobacco users beginning in the second year of enrollment, (2) require Transitional Medical Assistance parents with income up to 138 percent FPL to pay premiums like expansion adults, and (3) change to a tiered premium structure instead of a flat charge of 2 percent of income (this change is planned for FY 2018 and expected to have a neutral effect on beneficiaries) (Table 2).
Coverage Initiatives for the Criminal Justice Population
In recent years, many states have implemented new policies to connect individuals involved with the criminal justice system to Medicaid given that the Medicaid expansion made many of these individuals newly eligible for coverage (including childless adults who were not previously eligible in most states). Connecting these individuals to health coverage27 can facilitate their integration back into the community. Individuals may be enrolled in Medicaid while they are incarcerated, but Medicaid cannot cover the cost of their care during their period of incarceration, except for inpatient services. Nearly all states have policies in place to cover inpatient care for individuals who are incarcerated under Medicaid. Most states are also working with corrections agencies and with local jails to facilitate enrolling individuals in Medicaid before they are released. In addition, half of the states (25) have enrollment initiatives to facilitate Medicaid enrollment for parolees. Some states train criminal justice employees to assist with Medicaid applications and other states have dedicated Medicaid staff to work with the corrections agencies to facilitate enrollment for inmates or payment for inpatient care of inmates. Finally, the majority of states suspend rather than terminate Medicaid coverage for enrollees who become incarcerated. When coverage is suspended, it can be reinstated more easily and quickly upon release from incarceration or when an inpatient hospital stay occurs.28
While both Medicaid expansion and non-expansion states have adopted these strategies to connect justice-involved individuals to Medicaid coverage, these initiatives affect many more people in expansion states because eligibility for adults remains restrictive in non-expansion states. In this year’s survey, one non-expansion state commented that the administrative costs of implementing Medicaid coverage policies for the criminal justice population would be excessive since the policies would apply to such a small number of people in the state.
Details on Medicaid coverage for individuals involved with the criminal justice system are included in Exhibit 1 and Table 3.
Exhibit 1: Coverage Initiatives for the Criminal Justice Population in FY 2017 and/or FY 2018 (# of States)
Select Medicaid Coverage Policies for the Criminal Justice Population
Jails
Prisons*
Parolees
Medicaid coverage for inpatient care provided to incarcerated individuals
41
47
N/A
Medicaid outreach/assistance strategies to facilitate enrollment prior to release from incarceration or for parolees
33
40
25
Eligibility suspended (rather than terminated) for Medicaid enrollees who become incarcerated^
36
37
N/A
^States that continue Medicaid eligibility for incarcerated individuals but limit covered benefits to inpatient hospitalization are also included in the count of states that suspend eligibility. *The District of Columbia has jails but not a prison system. However, DC is counted under Medicaid outreach/assistance strategies because some individuals who serve prison terms outside of DC may be placed in residential re-entry centers upon returning to DC and may apply for Medicaid to access coverage for 24-hour inpatient care and to facilitate enrollment prior to release.
Louisiana Medicaid and Corrections Policies
Louisiana has implemented several strategies to increase coverage and access to care for individuals released from incarceration, particularly those with high health care needs.Louisiana Medicaid shares data with the Louisiana Department of Corrections (LDOC), which adds incarceration and release dates to the Medicaid eligibility system. As a result of this data sharing, the state Medicaid agency can automatically identify individuals pre-release and begin planning nine months before the scheduled release date. Additionally, in FY 2017 the state began using a new system and streamlined application to enroll state prisoners in Medicaid prior to release and connect them to a health plan. As part of this process, the system also identifies high need individuals for discharge planning/case management. There are “high needs” markers for those with serious mental illness, substance use disorder, co-morbid medical conditions, or those who are “bed bound”. The Medicaid health plans are required to do pre-release care planning and ensure that there will be sufficient medications available at discharge for these high-need individuals.
Plans are underway to expand outreach/ enrollment assistance to local jails in FY 2018.
Table 1: Changes to Eligibility Standards in all 50 States and DC, FY 2017 and FY 2018
Eligibility Standard Changes
States
FY 2017
FY 2018
(+)
(-)
(#)
(+)
(-)
(#)
Alabama
Alaska
Arizona
Arkansas
X
X
X
California
Colorado
X
X
Connecticut
Delaware
DC
Florida
X
Georgia
Hawaii
Idaho
X
Illinois
Indiana
X
X
Iowa
X
Kansas
Kentucky
Louisiana
X-Medicaid Expansion
Maine
X
X
Maryland
Massachusetts
X
Michigan
Minnesota
X
Mississippi
Missouri
X
X
Montana
Nebraska
Nevada
X
New Hampshire
New Jersey
New Mexico
X
New York
North Carolina
North Dakota
Ohio
X
Oklahoma
Oregon
Pennsylvania
Rhode Island
South Carolina
South Dakota
Tennessee
Texas
Utah
X
X
X
Vermont
Virginia
X
X
Washington
West Virginia
Wisconsin
Wyoming
X
Totals
7
1
1
7
8
2
NOTES: From the beneficiary’s perspective, positive changes counted in this report are denoted with (+), negative changes are denoted with (-), and neutral changes are denoted with (#). This table captures eligibility changes that states have implemented or plan to implement in FY 2017 or 2018, including changes that are part of pending Section 1115 waivers. For pending waivers, only provisions planned for implementation before the end of FY 2018 (according to waiver application documents) are counted in this table. Waiver provisions in pending waivers that states plan to implement in FY 2019 or after are not counted here.SOURCE: Kaiser Family Foundation Survey of Medicaid Officials in 50 states and DC conducted by Health Management Associates, October 2017.
Table 2: States Reporting Eligibility29and Premium30Changes in FY 2017 and FY 201831
State
Fiscal Year
Eligibility Changes
Arkansas
2017
Premiums (New only for expansion population, under Sec. 1115 waiver): Arkansas Works program ended prior required contributions to “Health Independence Accounts” and replaced them with a 2% premium requirement for expansion populations with income 100-133% FPL (up to $13/month). Non-payment does not affect eligibility, but a debt to the state is accumulated (1/1/2017).
2018
Expansion Adults (-) Pending Sec. 1115 Waiver: Eliminate the conditions CMS placed on the state’s waiver of retroactive eligibility for expansion enrollees (including the medically frail), effective 1/1/2018 (60,000 individuals).32
Expansion Adults (-) Pending Sec. 1115 Waiver: Eliminate coverage for expansion population with income 100-133% FPL. (Implementation phased based on redetermination date.)
Expansion Adults (-) Pending Sec. 1115 Waiver: Work requirement for “remaining” expansion adults (0-100% FPL), similar to SNAP program.
Expansion Adults (#) Pending Sec. 1115 Waiver: End premium assistance program for employer sponsored insurance (40 individuals).
Children (+): Implement the CHIPRA option to eliminate the 5-year bar on Medicaid eligibility for legally-residing immigrant children.
Colorado
2017
Adults (+): Implementing annualized income for eligibility for MAGI populations (affects 3,000).
2018
Aged & Disabled (+) Planned Sec. 1115 Waiver: Medicaid buy-in option for individuals in support living services, spinal cord injury, & brain injury waivers.
Florida
2017
Children (+): Implement the CHIPRA option to eliminate the 5-year bar on Medicaid eligibility for legally-residing immigrant children.
Idaho
2018
Children (+): Cover children with severe emotional disorder in families with income between 185 and 300% FPL (1,000 children).
Indiana
2018
Expansion Adults (-) Pending Sec. 1115 Waiver: Three-month lock-out of coverage following a 90-day period of disenrollment for failure to comply with redetermination requirements.
Expansion Adults (#): End HIP Link premium assistance program for Employer Sponsored Insurance. (Enrollees will be moved to other HIP 2.0 coverage).
Premiums (New) Pending Sec. 1115 Waiver: Require Transitional Medical Assistance parents up to 138% FPL to pay premiums like expansion adults.
Premiums (New) Pending Sec. 1115 Waiver: Add a 1% premium surcharge for tobacco users beginning in the second year of enrollment.
Premiums (Neutral for Expansion Population) Pending Sec. 1115 Waiver: Seeking a tiered contribution amount instead of flat 2% of income, effective February 1, 2018 for the HIP 2.0 program.
Iowa
2018
All Groups (-) Pending Sec. 1115 Waiver: Eliminate retroactive eligibility, target effective date 10/1/17.
Louisiana
2017
Expansion Adults (+): Implemented Medicaid expansion on July 1, 2016 (430,000 individuals).
Maine
2017
Adults (+): Increased eligibility under family planning pathway to 209% FPL.
2018
Adults (-) Pending Sec. 1115 Waiver: Add a work requirement for many groups of adults ages 19-64: parents, former foster care youth, individuals receiving transitional medical assistance, medically needy parents/caretakers, individuals eligible for family planning services only, and individuals with HIV. Those who fail to comply with work requirement would be limited to no more than 3 months in a 36-month period.
All Groups (-) Pending Sec. 1115 Waiver: Eliminate retroactive eligibility.
Adults (-) Pending Sec. 1115 Waiver: Apply a $5,000 asset test to all coverage groups that do not currently have an asset test (under current law there is no asset test for coverage groups based solely on low income (vs. old age/disability)).
All Groups (-) Pending Sec. 1115 Waiver: Eliminate hospital presumptive eligibility.
Massachusetts
2018
Adults (-) Pending Sec. 1115 Waiver: Eliminate 90 day period of provisional eligibility for adults under age 65 without verified income who are not either pregnant or HIV positive (130,000).33
Minnesota
2017
Aged & Disabled (+): Increased income standard for the medically needy from 75% FPL to 80% FPL on 7/1/2016.
Adults (+): Added optional Medicaid eligibility group for family planning for those with income up to 278% FPL.
Missouri
2017
Adults (-): Family Planning Waiver ended and replaced with a state-only (non-Medicaid) program.
Children (+): Implement the CHIPRA option to eliminate the 5-year bar on Medicaid eligibility for legally-residing immigrant children.
New Mexico
2018
Aged & Disabled (-): Home equity exclusion changed from the federal maximum of $840,000 to the federal minimum of $560,000 (Fewer than 5 individuals).
Ohio
2017
Aged & Disabled (#): Conversion from 209(b) to 1634 for SSI related groups.
Utah
2017
Children (+): Implementing the CHIPRA option to eliminate the 5-year bar on Medicaid eligibility for legally-residing immigrant children (Estimated to affect 750 children).
2018
Parents & Caretakers (+): Increased the Basic Maintenance Standard to 55% FPL (3,000 individuals).
Adults (+) Pending Sec. 1115 Waiver: New eligibility group for chronically homeless, justice-involved individuals and those in need of substance abuse and/or mental health treatment, with income below 5% FPL.
Adults (-) Pending Sec. 1115 Waiver: Add a work requirement for Primary Care Network (PCN) group.
Adults (-) Pending Sec. 1115 Waiver: Eliminate of retroactive eligibility for PCN adults.
Adults (-) Pending Sec. 1115 Waiver: Add 60-month limit on eligibility for PCN adults.
Current Enrollees (-) Pending Sec. 1115 Waiver: Eliminate hospital presumptive eligibility.
Virginia
2017
Disabled (+) Under Sec. 1115 Waiver: Increased eligibility from 60% to 80% FPL for waiver services for people with serious mental illness (GAP waiver program). (Note: had been decreased from 100% FPL to 60% FPL in FY 2016.)
2018
Disabled (+) Under Sec. 1115 Waiver: Increase eligibility from 80% to 100% FPL for waiver services for people with serious mental illness (GAP waiver program) (2,000 adults with SMI). (Full restoration to pre-2016 level.)
Wyoming
2018
Adults (-): Income level for Breast and Cervical Cancer program reduced to 100% FPL (fewer than 50 individuals).
Aged & Disabled (-): Income level for Employed Persons with Disabilities program reduced to 100% FPL (163 individuals).
TABLE 3: CORRECTIONS-RELATED ENROLLMENT POLICIES IN ALL 50 STATES AND DC, FY 2017 AND FY 2018
States
Medicaid Coverage For Inpatient Care Provided to Incarcerated Individuals
Medicaid Outreach/Assistance Strategies to Facilitate Enrollment Prior to Release*
Medicaid Eligibility Suspended Rather Than Terminated For Enrollees Who Become Incarcerated*
Jails
Prisons
Jails
Prisons
Jails
Prisons
In place FY 2017
New or Expanded FY 2018
In place FY 2017
New or Expanded FY 2018
In place FY 2017
New or Expanded FY 2018
In place FY 2017
New or Expanded FY 2018
In place FY 2017
New or Expanded FY 2018
In place FY 2017
New or Expanded FY 2018
Alabama
X*
X*
X*
X*
X*
X*
Alaska
X
X
X
X
X
X
Arizona
X
X
X
X
X
X
X
X
Arkansas
X
X
X
X
X
X
California
X
X
X
X
X
X
Colorado
X
X
X
X
X
X
Connecticut
X
X
X
X
X
X
Delaware
X
X
X
X
X*
X*
DC
X
N/A
N/A
X
X
X
N/A
N/A
Florida
X
X
Georgia
X
X
Hawaii
X
X
X
Idaho
X
X
Illinois
X
X
X
X
Indiana
X
X
X
X
X
X
Iowa
X
X
X
X
X
Kansas
X
X
Kentucky
X
X
X
X
X
X
Louisiana
X
X
X
X
X
X
X
Maine
X
X
X
X
Maryland
X
X
X
X
X
X
X
X
Massachusetts
X
X
X
X
X
X
Michigan
X
X
X
X
X
X
Minnesota
X
X
X
X
X
X
Mississippi
X
X
X
Missouri
X
X
X
X
Montana
X
X
X
X
X
X
Nebraska
X
X
X
Nevada
X
X
X
X
X
X
X
New Hampshire
X
X
X
X
X
X
New Jersey
X
X
X
X
X
X
New Mexico
X
X
X
X
X
X
X
X
X
New York
X
X
X
X
X
X
North Carolina
X
X
North Dakota
X
X
X
Ohio
X
X
X
X
X
Oklahoma
X
Oregon
X
X
X
X
X
X
Pennsylvania
X
X
X
X
X
X
X
X
X
X
Rhode Island
X
X
X
X
X
X
South Carolina
X
X
X
X
X
X
South Dakota
X
X
X
X
Tennessee
X
X
X
X
Texas
X
X
X
X
Utah
X
X
X
X
Vermont
X
X
X
X
Virginia
X
X
X
X
X
Washington
X
X
X
X
X
X
X*
X*
West Virginia
X
X
X
X
X
X
Wisconsin
X
X
X
X
Wyoming
Totals
40
2
46
2
31
9
39
9
33
6
34
4
NOTES: ^States with “Medicaid outreach assistance strategies to facilitate enrollment prior to release” include those implementing a variety of strategies. In many cases, staff of the prison or jail provide most of the assistance in collaboration with the Medicaid agency. ^States that continue Medicaid eligibility for incarcerated individuals but limit covered benefits to inpatient hospitalization are also included in the count of states that suspend eligibility. “*” indicates that a policy was newly adopted in FY 2018, meaning that the state did not have any policy in that category/column in place in FY 2017.N/A: The District of Columbia has jails but no prisons. However, DC is counted under Medicaid outreach/assistance strategies because some individuals who serve prison terms outside of DC may be placed in residential re-entry centers upon returning to DC and may apply for Medicaid to access coverage for 24-hour inpatient care and to facilitate enrollment prior to release.SOURCE: Kaiser Family Foundation Survey of Medicaid Officials in 50 states and DC conducted by Health Management Associates, October 2017.
Report: Managed Care Initiatives
Key Section Findings
Managed care is the predominant delivery system for Medicaid in most states. Among the 39 states with comprehensive risk-based managed care organizations (MCOs), 29 states reported that 75 percent or more of their Medicaid beneficiaries were enrolled in MCOs as of July 1, 2017. Because of nearly full MCO saturation in most MCO states, only a few states reported actions to increase MCO enrollment. Although many states still carve-out behavioral health services from MCO contracts, movement to carve-in these services continues. Nearly all states have managed care quality initiatives in place such as pay for performance or capitation withholds.–What to watch:
Twenty-six of the 39 MCO states reported that they plan to use authority to receive federal matching funds for adults receiving inpatient psychiatric or substance use disorder (SUD) treatment in an institution for mental disease (IMD) for no more than 15 days a month included in the 2016 managed care regulations. Close to half of MCO states reported that the day limit is insufficient to meet acute inpatient or residential treatment needs for those with serious mental illness (SMI) or SUD.34
States are using MCO arrangements to increase attention to the social determinants of health and to promote value-based payment. States are increasingly requiring MCOs to screen beneficiaries for social needs (19 states in FY 2017 and 2 additional states in FY 2018); to provide care coordination pre-release to incarcerated individuals (6 states in FY 2017 and 1 additional state in FY 2018); and to use alternative payment models (APMs) to reimburse providers (13 states in FY 2017 set a target percentage of MCO provider payments that must be in an APM and 9 additional states plan to set targets in FY 2018).
Tables 4 through 8 include more detail on the populations covered under managed care (Tables 4 and 5), behavioral health services covered under MCOs (Table 6), managed care quality initiatives (Table 7), and minimum Medical Loss Ratio (MLR) policies (Table 8).
The Centers for Medicare and Medicaid Services (CMS) issued a final rule on managed care in Medicaid and CHIP in April 2016. The new rule represents a major revision and modernization of federal regulations in this area.3536 On June 30, 2017, CMS released an Informational Bulletin37 indicating they would use “enforcement discretion” to work with states on achieving compliance with the new managed care regulations, except for specific areas that “have significant federal fiscal implications.”
Managed care remains the predominant delivery system for Medicaid in most states. As of July 2017, all states except three – Alaska, Connecticut,38 and Wyoming– had some form of managed care in place, unchanged from July 2016. The number of states contracting with comprehensive risk-based managed care organizations (MCOs) (39 states) or operating a Primary Care Case Management (PCCM) program (16 states) as of July 2017 also remained unchanged from the prior year. PCCM is a managed fee-for-service (FFS) based system in which beneficiaries are enrolled with a primary care provider who is paid a small monthly fee to provide case management services in addition to primary care.
Of the 48 states that operate some form of managed care, seven operate both MCOs and a PCCM program while 32 states operate MCOs only and nine states operate PCCM programs only39 (Figure 2). Wyoming, one of the three states without any managed care (i.e., without either MCOs or a PCCM program), does operate a limited-benefit risk-based prepaid health plan (PHP). In total, 25 states (including Wyoming) contracted with one or more PHPs to provide Medicaid benefits including, behavioral health care, dental care, vision care, non-emergency medical transportation (NEMT), or long-term services and supports (LTSS).
Figure 2: Comprehensive Medicaid Managed Care Models in the States, 2017
Populations Covered by Risk-Based Managed Care
The share of Medicaid beneficiaries enrolled in MCOs or PCCM programs or remaining in FFS for their acute care varies widely by state. However, the share of Medicaid beneficiaries enrolled in MCOs has steadily increased as states have expanded their managed care programs to new regions and new populations and made MCO enrollment mandatory for additional eligibility groups. This year’s survey showed continued modest growth. The survey asked states to indicate the approximate share of specific Medicaid populations who receive their acute care in MCOs, PCCM programs, and FFS. As shown in Figure 3, among the 39 states with MCOs, 29 states reported that 75 percent or more of their Medicaid beneficiaries were enrolled in MCOs as of July 1, 2017 (up from 28 states in last year’s survey), including four of the five states with the largest total Medicaid enrollment. These four states (California, New York, Texas, and Florida) account for nearly four out of every 10 Medicaid beneficiaries across the country (Figure 3 and Table 4).40
Consistent with past survey results, this year’s survey found that children and adults (particularly those enrolled through the ACA Medicaid expansion) are much more likely to be enrolled in an MCO than elderly Medicaid beneficiaries or those with disabilities. Thirty-five of the 39 MCO states covered 75 percent or more of all children through MCOs. Twenty-eight of the 39 MCO states covered 75 percent or more of low-income adults in pre-ACA expansion groups (e.g., parents, pregnant women) through MCOs. The elderly and people with disabilities were the group least likely to be covered through managed care contracts, with only 16 of the 39 MCO states covering 75 percent or more such enrollees through MCOs (Figure 3).
Figure 3: MCO Managed Care Penetration Rates for Select Groups of Medicaid Beneficiaries as of July 1, 2017
Of the 32 states that had implemented the ACA Medicaid expansion as of July 1, 2017, 27 were using MCOs to cover newly eligible adults. (The five Medicaid expansion states without risk-based managed care were Alaska, Arkansas, Connecticut, Montana, and Vermont.) The large majority (24) of these 27 states covered more than 75 percent of beneficiaries in this group through risk-based managed care. New Hampshire, however, reported that approximately 80 percent of its ACA expansion adults receive premium assistance to enroll in Qualified Health Plans in the state’s Marketplace and that only 13.5 percent were enrolled in MCOs. The other two states reporting less than 75 percent MCO penetration for this group were Colorado and Illinois.
Seven of the 16 states with PCCM programs also contract with MCOs. In most of these states, MCOs cover a larger share of beneficiaries than PCCM programs. However, Colorado and North Dakota are exceptions. As of July 1, 2017, a majority of Colorado’s enrollees were in the PCCM program, which is the foundation of the state’s Accountable Care Collaboratives, and 40 percent of enrollees in North Dakota were enrolled in the PCCM program (compared to 25 percent in the MCO program).
Only two states reported policies implemented in FY 2017 or planned for FY 2018 that reduced or will reduce the states’ reliance on the MCO model of managed care: Colorado reported that a small MCO pilot initiated on July 1, 2016 terminated on June 30, 2017, and Massachusetts reported that the implementation of its Accountable Care Organization (ACO) program in FY 2018 will result in the transition of MCO enrollees to ACOs.
Populations with Special Needs
For geographic areas where MCOs operate, this year’s survey asked MCO states whether, as of July 1, 2017, certain subpopulations with special needs were enrolled in MCOs for their acute care services on a mandatory or voluntary basis or were always excluded. On the survey, states selected from “always mandatory,” “always voluntary,” “varies,” or “always excluded” for the following populations: pregnant women, foster children, persons with intellectual and developmental disabilities (ID/DD), children with special health care needs (CSHCNs), persons with a serious mental illness (SMI) or serious emotional disorder (SED), and adults with physical disabilities. This year’s survey found an increase in the number of states reporting that enrollment for these populations is always mandatory (Exhibit 2).
As shown in Exhibit 2 and Table 5, and consistent with results in last year’s survey, pregnant women were the group most likely to be enrolled on a mandatory basis while persons with ID/DD were least likely to be enrolled on mandatory basis and also most likely to be excluded from MCO enrollment. Foster children were the group most likely to be enrolled on a voluntary basis, although they were enrolled on a mandatory basis in a larger number of states. Among states indicating that the enrollment approach for a given group or groups varied, LTSS eligibility was the most frequently cited basis of variation.
Exhibit 2: MCO Enrollment of Populations with Special Needs, July 1, 2017 (# of States)
In both FY 2017 and FY 2018, only a few states reported actions to increase enrollment in acute care managed care, reflecting full or nearly full MCO saturation in most MCO states. Of the 39 states with MCOs, a total of 14 states indicated that they made specific policy changes in either FY 2017 (7 states) or FY 2018 (8 states) to increase the number of enrollees in MCOs through geographic expansion, voluntary or mandatory enrollment of new groups into MCOs, or mandatory enrollment of specific eligibility groups that were formerly enrolled on a voluntary basis (Exhibit 3). Thirty-six states reported that acute care MCOs were operating statewide as of July 2017 and Illinois reported plans to expand MCOs statewide in FY 2018. The remaining two states without statewide MCO programs (Colorado and Nevada) did not report a geographic expansion planned for FY 2018.
Exhibit 3: Medicaid Acute Care Managed Care Population Expansions, FY 2017 and FY 2018
FY 2017
FY 2018
Geographic Expansions
MO
IL
New Population Groups Added
LA, NE, OH, TX, WV
IL, NY, PA, TX
Voluntary to Mandatory Enrollment
WA
NY, OR, SC, VA, WI
Some of the notable acute care MCO expansions include:
West Virginia transitioned its SSI population from FFS to mandatory MCO enrollment in July 2016.
Missouri extended its MCO program geographically statewide on May 1, 2017 for children, pregnant women, refugees, and custodial parents.
In January 2018, Pennsylvania will begin to phase-in its Community HealthChoices program which will provide both physical health and long-term services and supports through newly contracted MCOs. CHC enrollees will include individuals in nursing facilities (currently carved out of managed care after 30 days), full benefit dually-eligible individuals, and individuals receiving home and community-based services.
In FY 2017 and FY 2018, states expanded MCO enrollment (either voluntary or mandatory) to additional groups. Some states added multiple groups. Some groups that states added or are planning to add include: foster care or adoption assistance children (New York, Ohio, and Texas); persons eligible for LTSS (Nebraska, New York, Ohio, Pennsylvania, and Texas); ACA expansion, newly eligible adult group and enrollees in the state’s Health Insurance Premium Payment Program (Louisiana); Breast and Cervical Cancer Treatment Program group (Ohio and Texas); children with special health care needs or SSI (Illinois, Ohio, and Texas); SSI population (West Virginia); and persons with intellectual and developmental disabilities (Nebraska and Ohio).
One state in FY 2017 and five in FY 2018 made enrollment mandatory for a specific eligibility group that was formerly enrolled on a voluntary basis: Washington (clients with Third Party Liability (TPL)/other insurance, excluding Medicare); New York (children with special health care needs in 1915(c) waiver programs); Oregon (Medicare/Medicaid dual eligibles); South Carolina (former foster care adults); Virginia (aged, blind, and disabled enrollees); and Wisconsin (SSI adults that do not have LTSS needs).
Services Covered Under MCO Contracts
Behavioral Health Services Covered Under MCO Contracts
Although MCOs are at risk financially for providing a comprehensive set of acute care services, nearly all states exclude or “carve-out” certain services from their MCO contracts, most commonly behavioral health services. In this year’s survey, states with acute care MCOs were asked to indicate whether specialty outpatient mental health (MH) services, inpatient mental health services, and outpatient and inpatient substance use disorder (SUD) services are always carved-in (i.e., virtually all services are covered by the MCO), always carved-out (to PHP or FFS), or carve-in status varies by geographic or other factors.
For purposes of this survey, “specialty outpatient mental health” services mean services used by adults with Serious Mental Illness (SMI) and/or youth with serious emotional disturbance (SED), commonly provided by specialty providers such as community mental health centers. Depending on the service, more than half of the 39 MCO states reported that specific behavioral health service types were carved into their MCO contracts, with specialty outpatient mental health services somewhat less likely to be carved in (Exhibit 4 and Table 6). Also, with the exception of inpatient SUD services, the number of states reporting that the other services were always carved-in increased modestly from last year.
Exhibit 4: MCO Coverage of Behavioral Health, July 1, 2017 (# of States)
Specialty Outpatient MH
Inpatient MH
Outpatient SUD
Inpatient SUD
Always carved-in
23
26
26
26
Always carved-out
11
8
8
7
Varies
5
5
5
6
States reporting actions in FY 2017 to carve in behavioral health services into their MCO contracts (in at least some regions/contracts) included six states (Minnesota, Nebraska, South Carolina, Texas, Virginia, and Washington). In FY 2018, ten states (Louisiana, Michigan, Minnesota, Mississippi, New Jersey, New York, Ohio, South Carolina, Washington, and West Virginia) report new/continued actions to carve in behavioral health services.
Institutions for Mental Diseases (IMD) Rule Change
The 2016 Medicaid Managed Care Final Rule42 allows states (under the authority for health plans to cover services “in lieu of” those available under the Medicaid state plan), to receive federal matching funds for capitation payments on behalf of adults who receive inpatient psychiatric or substance use disorder treatment or crisis residential services in an IMD for no more than 15 days in a month.43 States were asked in the survey whether they planned to use this new authority. Of the 39 states with MCOs, 26 states answered “yes” for FY 2017, FY 2018, or both FYs 2017 and 2018, five states answered “no,” and eight states answered “undetermined.”
States were also asked whether they believed the Final Rule allows MCOs sufficient flexibility to provide cost-effective “in lieu of” IMD services to meet acute inpatient or residential treatment needs for members with severe mental illness (SMI) or substance use disorders (SUDs). Only a small number of states (9 for SMI and 8 for SUD) answered “yes.” The remaining MCO states answered “no” (19 for SMI and 19 for SUD) or “don’t know” (11 for SMI and 12 for SUD). Many states commented that the 15-day limit was too restrictive, especially for SUD services, and a number of states indicated plans to seek a Section 1115 waiver to cover more than 15 days per month.44
Additional Services
States with MCO contracts reported that plans in their states may offer a range of services beyond those described in the state plan or waivers. Eleven states reported that MCOs provide limited or enhanced adult dental services beyond contractually required state plan benefits, and nine states reported enhanced vision services for adults. Several states noted that MCOs offer cell phones for reminder services or other technology supports from scales to telemedicine. Half of MCO states reported that MCOs provide a wide variety of non-clinical supports as value added services, including infant car seats and cribs, nominal gift cards for healthy behavior, air conditioners for asthma treatment, weight management classes or memberships, and even support for obtaining a GED. Health education, wellness supports, and non-traditional therapies were also noted by some states.
Managed Care (Acute and LTSS) Quality, Contract Requirements, and Administration
Quality Initiatives
Over time, the expansion of comprehensive risk-based managed care in Medicaid has been accompanied by greater attention to measuring quality and plan performance and, increasingly, to measuring health outcomes. After years of comprehensive risk-based managed care experience within the Medicaid program, many states now incorporate quality into the procurement process, as well as into ongoing program monitoring.
States procure MCO contracts using different approaches; however, most states use competitive bidding, in part because the dollar value is so large. Under these procurements, states can specify requirements and criteria that go beyond price, and may expect plans to compete on the basis of value-based payment arrangements with network providers, specific policy priorities such as improving birth outcomes, or strategies to address social determinants of health, and/or other specific performance and quality criteria. In this year’s survey, states were asked if they used, or planned to use, National Committee for Quality Assurance’s (NCQA’s) Healthcare Effectiveness Data and Information Set (HEDIS®) scores as criteria for selecting MCOs. Of the 39 states with MCOs, 18 indicated that they used or plan to use HEDIS scores as criteria for selecting MCOs.
States were asked to indicate whether they had select quality strategies in place in FY 2017 and to indicate newly added or expanded initiatives for FY 2018. Thirty-seven MCO states reported one or more select MCO quality initiatives in place in FY 2017 (Figure 4 and Table 7). The most common strategies were requirements for data collection and reporting (often public reporting) on quality measures and the use of quality-based capitation withholds or penalties. Withhold amounts for acute care services typically ranged from 1 percent (Michigan, Oregon, and Washington) to 5 percent (Minnesota and Missouri); managed long-term services and supports (MLTSS) withhold amounts typically ranged from 0.5 percent (Iowa and Wisconsin) to 3 percent (California and Ohio). Over half the 39 states with managed care contracts reported the use of pay for performance strategies. In addition, several states reported “other” quality initiatives, including the use of liquidated damages for poor performance and the required operation of and reporting on performance improvement projects (PIPs).
In FY 2018, 11 states expect to implement new or expanded quality initiatives (Figure 4). The most common new quality initiatives are pay for performance initiatives while the most common expanded initiatives are data collection and reporting initiatives (Table 7).
Alternative [Provider] Payment Models within MCO Contracts
Value-based purchasing (VBP) strategies are important tools for states pursuing improved quality and outcomes and reduced costs of care within Medicaid and across payers. Generally speaking, VBP strategies include activities that hold a provider or MCO accountable for cost and quality of care.45 This often includes efforts to implement alternative payment models (APMs). APMs replace FFS/volume-driven provider payments with payment models that incentivize quality, coordination, and value (e.g., shared savings/shared risk arrangements and episode-based payments). Many states have included a focus on adopting and promoting APMs as part of their federally supported State Innovation Models (SIM) projects and as part of delivery system reform efforts approved under Section 1115 Medicaid waivers.46 States are increasingly encouraging or requiring Medicaid MCOs to adopt APMs to advance VBP in Medicaid. The survey found that:
Thirteen states (Arizona, California, Delaware, Hawaii, Nebraska, New Hampshire, New Mexico, New York, Ohio, Pennsylvania, Rhode Island, South Carolina, and Washington) identified a specific target in their MCO contracts for the percentage of provider payments, network providers, or plan members that plans must cover via alternative provider payment models in FY 2017 (compared to five states in FY 2016); and
Nine additional states (District of Columbia, Iowa, Kansas, Louisiana, Michigan, New Jersey, Oregon, Texas, and West Virginia) will include a target percentage in their contracts for FY 2018.
State APM Targets for Medicaid MCOs
California’s Medi-Cal 2020 Waiver includes a requirement that MCOs must have VBP arrangements for 50-60 percent of all managed care lives assigned to receive care through a Designated Public Hospital participating in the PRIME program.47
Delaware will require that 80 percent of all MCO members receive services from a provider under an alternative payment model by 2019.
Iowa has a target of 40 percent for the share of an MCO’s membership to be covered by a VBP arrangement by FY 2018 and requires use of a common quality measurement tool.
Washington requires MCOs to negotiate value-based contracts for at least 30 percent of capitated payments in FY 2017.
Further, in FY 2017, eight states had contracts that required Medicaid MCOs to adopt specific alternative provider payment models (e.g., episode of care payments, shared savings/shared risk, etc.), while eight states had contracts that encouraged MCOs to adopt specific APMs. In FY 2018, four additional states plan to require the use of specific APMs while five additional states plan to encourage use of specific APMs. The box below provides state examples of APM requirements.
State-Specific APM Requirements
Minnesota MCOs are required to participate in the state’s ACO program, known as the Integrated Health Partnership. MCOs and the state share risk (gains and losses).
Ohio requires MCOs to participate in Ohio’s retrospective episode-based payment model (with both positive and negative incentive payments) and the Ohio Comprehensive Primary Care program, Ohio’s patient-centered medical home (PCMH) program (with prospective, quarterly per-member per-month (PMPM) payments as well as retrospective total cost of care shared savings).
Pennsylvania requires MCOs to make PCMH payments.
Social Determinants of Health
In April 2017, the CMS Center for Medicare and Medicaid Innovation selected 32 organizations to implement and test models to support local communities in addressing the health-related social needs of Medicare and Medicaid beneficiaries, aiming to bridge the gap between clinical and community service providers. This “Accountable Health Communities” model represents the first CMS innovation model that focuses on social determinants of health. The goal of the five-year program is to encourage innovation to deliver local solutions that improve access to community-based services.48 This development reflects growing awareness and interest on the part of CMS to address other issues, such as housing and food insecurity, by linking beneficiaries to social services and supports, ultimately to improve health and health outcomes. States have also focused on addressing social determinants of health, so federal and state activity are occurring simultaneously.
The survey found that, of the 39 MCO states, 19 states required while 12 states encouraged MCOs to screen enrollees for social needs and provide referrals to other services in FY 2017. Two additional states plan to require and two plan to encourage MCOs to screen/refer enrollees for social needs in FY 2018.
Strategies to Address Social Determinants of Health
Arizona requires coordination of community resources like housing and utility assistance under its MLTSS contract. The state provides state-only funding in conjunction with its managed behavioral health contract to provide housing assistance. The state also encourages health plans to coordinate with the Veterans’ Administration and other programs to meet members’ social support needs.
The District of Columbia encourages MCOs to refer beneficiaries with three or more chronic conditions to the “My Health GPS” Health Home program for care coordination and case management services, including a biopsychosocial needs assessment and referral to community and social support services.
Louisiana requires screening for problem gaming and tobacco usage and requires referrals to Special Supplemental Nutrition Program for Women, Infants, and Children (WIC) and the Louisiana Permanent Supportive Housing program when appropriate.
Nebraska requires MCOs to have staff trained on social determinants of health and be familiar with community resources; plans are also required to have policies to address members with multiple biopsychosocial needs.
New Jersey requires MLTSS plans to have a dedicated housing specialist and to provide assistance with attaining or maintaining housing as an “in lieu of” service.
Criminal Justice-Involved Populations
Engaging Medicaid MCOs in efforts to improve continuity of care for individuals released from correctional facilities into the community is important to ensure that individuals with complex or chronic health conditions, including behavioral health needs, have an effective transition to treatment in the community. In FY 2017, of the 39 states that contract with MCOs, six states (Arizona, Iowa, Kansas, Louisiana, Ohio, and Virginia) require MCOs to provide care coordination services to enrollees prior to release from incarceration, while two states (Kentucky and New Mexico) encourage MCOs to provide care coordination services prior to release. Five states intend to use contracts to encourage or require such care coordination in FY 2018. The following are examples of pre-release state requirements: Louisiana requires plans to offer care management at least 30 days prior to scheduled release; Kansas requires pre-release care management for LTSS populations, and new legislation in Washington will require care coordination pre-release and post-incarceration in FY 2018. New Mexico, a state that encourages but does not require pre-release activity, reported that one health plan is piloting a care coordination model through collaboration with a metropolitan detention center to test and learn effective methods to impact recidivism and improve public health and safety.
Administrative Policies
Minimum Medical Loss Ratios
The Medical Loss Ratio (MLR) is the proportion of total capitation payments received by an MCO spent on clinical services and quality improvement. CMS published a final rule in 2016 that requires states to develop capitation rates for Medicaid to achieve an MLR of at least 85 percent in the rate year, for rating periods and contracts starting on or after July 1, 2017.49 This 85 percent minimum MLR is the same standard that applies in Medicare Advantage and private large group plans. There is no federal requirement that Medicaid plans must pay remittances to the state if they fail to meet the MLR standard, but states have discretion to require remittances.
As of July 1, 2017, 25 of the 39 states that contract with comprehensive risk-based MCOs specified a minimum MLR in Medicaid MCO contracts. Twenty of these 25 states applied the MLR requirement to all MCO contracts, while five states applied it on a limited basis. Seventeen of the 25 states with minimum MLR requirements always require remittance payments to the state if the minimum MLR is not achieved; one state (Ohio) requires remittance under some circumstances.50
Medicaid MLRs vary by state but are most commonly set at 85 percent or higher. A few states noted that their minimum MLRs varied by type of plan or population. For example, in New Jersey, the MLR is calculated separately for each population covered, with an MLR of 85 percent set for acute care contracts and an MLR of 90 percent set for MLTSS contracts.
Table 8 provides state-specific information regarding the use of a minimum MLR.
Auto-Enrollment
Generally, beneficiaries who are required to enroll in MCOs must be offered a choice of at least two plans. Those who do not select a plan are auto-enrolled in a plan by the state. The proportion of MCO beneficiaries who are auto-enrolled varies widely across states. State auto-enrollment algorithms also vary, but usually take into consideration variables like previous plan or provider relationships, beneficiary geographic location, and/or plan enrollments of other family members. States may also aim to balance enrollment among plans. As of July 1, 2017, 11 states took plan quality or performance rankings into consideration in the auto-enrollment algorithm (Arizona, California, Hawaii, Michigan, Minnesota, New Mexico, New York, Ohio, South Carolina, Virginia, and Washington).
PCCM and PHP Program Changes
Primary Care Case Management (PCCM) Program Changes
Of the 16 states with PCCM programs, two reported enacting policies to increase PCCM enrollment in FY 2017 or FY 2018: Colorado reported continued growth in its PCCM-based Accountable Care Collaboratives in both FY 2017 and FY 2018, and Arkansas reported implementing new billing software that would auto-assign beneficiaries to a primary care physician. Two other states reported new PCCM programs: Alaska – one of only three states without either an MCO or PCCM program as of July 1, 2017 – reported plans to implement a PCCM program in FY 2018, and Arizona reported plans to implement an American Indian Medical Home effective October 1, 2017 using PCCM authority.
Three states51 (California, Illinois, and Massachusetts) reported actions to decrease enrollment in a PCCM program in FY 2017 or FY 2018. California plans to transition its one-county HIV PCCM program to a full-risk MCO model in CY 2018; Illinois reported that its Integrated Health Homes would move to managed care under new MCO contracts that would begin in FY 2018, and Massachusetts reported that implementation of its Accountable Care Organization (ACO) program in FY 2018 will include the transition of PCCM members to ACO Plans.
Limited-Benefit Prepaid Health Plans (PHP) Changes
In this year’s survey, the 25 states contracting with at least one PHP as of July 1, 2017, were asked to indicate whether certain services (listed in Exhibit 5 below) were provided under these arrangements. The most frequently cited services provided (of those included in the question) were outpatient mental health services (14 states), followed by non-emergency medical transportation (NEMT) (12 states) and inpatient mental health and outpatient substance use disorder (SUD) treatment services (11 states each).
Exhibit 5: Services Covered Under PHP Contracts, July 1, 2017
Nine states reported implementing policies to increase PHP enrollment in FY 2017 or FY 2018. Five states (Arkansas, Iowa, Idaho, Nebraska, and Nevada) reported new or expanded dental PHPs in FY 2018, Indiana reported plans for an NEMT PHP contract in FY 2018, California reported adding inpatient SUD treatment to its PHP program in FY 2018, Louisiana will add “Coordinated System of Care” PHPs in FY 2018 (serving youth with behavioral health challenges and their families), and New York reported increased enrollment in its LTSS PHPs in both FY 2017 an FY 2018.
Four states also reported actions to decrease PHP enrollment in FY 2017 or FY 2018. Nebraska and Texas reported ending a behavioral health PHP and folding the covered services into MCO contracts in FY 2017. Washington reported that PHP enrollment decreased in FY 2017 and will decrease further in FY 2018 when the state converts behavioral health PHPs to fully integrated MCO contracts in additional geographic areas. Massachusetts reported that implementation of its Accountable Care Organization (ACO) program in FY 2018 will reduce enrollments in its behavioral health PHP program.
TABLE 4: SHARE OF THE MEDICAID POPULATION COVERED UNDER DIFFERENT DELIVERY SYSTEMS IN ALL 50 STATES AND DC, AS OF JULY 1, 2017
States
Type(s) of Managed Care In Place
Share of Medicaid Population in Different Managed Care Systems
MCO
PCCM
FFS / Other
Alabama
PCCM
—
86.4%
13.6%
Alaska
FFS
—
—
100.0%
Arizona
MCO
93.1%
—
6.9%
Arkansas*
PCCM
—
NR
NR
California
MCO and PCCM*
78.9%
—
21.1%
Colorado
MCO and PCCM*
10.5%
72.6%
16.9%
Connecticut
FFS*
—
—
100.0%
DC
MCO
78.0%
—
22.0%
Delaware
MCO
94.2%
—
5.8%
Florida
MCO
92.0%
—
8.0%
Georgia
MCO
73.0%
—
27.0%
Hawaii
MCO
99.9%
—
<0.1%
Idaho*
PCCM
—
95.0%
5.0%
Illinois
MCO and PCCM
63.4%
10.4%
26.2%
Indiana
MCO
80.0%
—
20.0%
Iowa
MCO
92.6%
—
7.4%
Kansas
MCO
95.0%
—
5.0%
Kentucky
MCO
91.0%
—
9.0%
Louisiana
MCO
92.0%
—
8.0%
Maine
PCCM
—
NR
NR
Maryland
MCO
89.2%
—
10.8%
Massachusetts
MCO and PCCM
48.0%
21.0%
31.0%
Michigan
MCO
74.5%
—
25.5%
Minnesota
MCO
76.0%
—
24.0%
Mississippi
MCO
70.0%
—
30.0%
Missouri
MCO
75.8%
—
24.2%
Montana
PCCM
—
72.0%
28.0%
Nebraska
MCO
99.6%
—
0.4%
Nevada
MCO and PCCM
72.0%
6.0%
22.0%
New Hampshire*
MCO
73.0%
—
4.1%
New Jersey
MCO
95.8%
—
4.2%
New Mexico
MCO
88.7%
—
11.3%
New York
MCO
82.7%
—
17.3%
North Carolina
PCCM
—
90.0%
10.0%
North Dakota
MCO and PCCM
25.0%
40.0%
35.0%
Ohio
MCO
88.5%
—
11.5%
Oklahoma
PCCM
—
75.1%
24.9%
Oregon
MCO*
89.0%
—
11.0%
Pennsylvania
MCO
82.3%
—
17.7%
Rhode Island
MCO
90.4%
—
9.6%
South Carolina
MCO*
76.0%
—
24.0%
South Dakota
PCCM
—
80.0%
20.0%
Tennessee
MCO
100.0%
—
0.0%
Texas
MCO*
91.7%
—
8.1%
Utah
MCO
84.9%
—
15.1%
Vermont
PCCM
—
63.0%
37.0%
Virginia
MCO
76.0%
—
24.0%
Washington
MCO and PCCM
85.0%
2.0%
13.0%
West Virginia
MCO
80.0%
—
20.0%
Wisconsin
MCO
67.0%
—
33.0%
Wyoming
FFS*
0.2%
—
99.8%
NOTES: NR – not reported. Share of Medicaid Population that is covered by different managed care systems. MCO refers to risk-based managed care; PCCM refers to Primary Care Case Management. FFS/Other refers to Medicaid beneficiaries who are not in MCOs or PCCM programs. *AR – Most Expansion Adults served by Qualified Health Plans through “Arkansas Works” premium assistance waiver. *CA – PCCM program operates in LA county for those with HIV. *CO – PCCM enrollees are part of the state’s Accountable Care Collaboratives (ACCs). *CT – terminated its MCO contracts in 2012 and now operates its program on a fee-for-service basis using four ASO entities. *ID – The Medicaid-Medicare Coordinated Plan (MMCP) has been recategorized by CMS as an MCO but is not counted here as such since it is secondary to Medicare. *NH – 22.9% of overall population and 80.1% of Expansion Adults are served by Qualified Health Plans under NH’s premium assistance program waiver *OR – MCO enrollees include those enrolled in the state’s Coordinated Care Organizations. *SC – uses PCCM authority to provide care management services to approximately 200 medically complex children. *TX – Texas Medicaid Wellness program provides care management services for high-cost/high-risk enrollees (under PCCM authority).*WY – the state does not operate a traditional PCCM or MCO program, but does use PCCM authority to make PCMH payments.SOURCE: Kaiser Family Foundation Survey of Medicaid Officials in 50 states and DC conducted by Health Management Associates, October 2017.
TABLE 5: ENROLLMENT OF SPECIAL POPULATIONS UNDER MEDICAID MANAGED CARE CONTRACTS FOR ACUTE CARE IN ALL 50 STATES AND DC, AS OF JULY 1, 2017
States
Pregnant Women
Foster Children
Persons with ID/DD
CSHCNs
Persons with SMI/SED
Adults w/ physical disabilities
Alabama
—
—
—
—
—
—
Alaska
—
—
—
—
—
—
Arizona
Always mandatory
Always mandatory
Always mandatory
Always mandatory
Always mandatory
Always mandatory
Arkansas
—
—
—
—
—
—
California
Always mandatory
Varies
Varies
Always mandatory
Always mandatory
Always mandatory
Colorado
Always voluntary
Always voluntary
Always voluntary
Always voluntary
Always voluntary
Always voluntary
Connecticut
—
—
—
—
—
—
DC
Always mandatory
Varies
Always excluded
Varies
Varies
Varies
Delaware
Always mandatory
Always mandatory
Varies
Always mandatory
Always mandatory
Always mandatory
Florida
Always mandatory
Always mandatory
Always voluntary
Always mandatory
Always mandatory
Always mandatory
Georgia
Always mandatory
Always mandatory
Always excluded
Always excluded
Always excluded
Always excluded
Hawaii
Always mandatory
Always mandatory
Always mandatory
Always mandatory
Always mandatory
Always mandatory
Idaho
—
—
—
—
—
—
Illinois
Varies
Always excluded
Varies
Varies
Varies
Varies
Indiana
Always mandatory
Always voluntary
Varies
Varies
Varies
Varies
Iowa
Always mandatory
Always mandatory
Always mandatory
Always mandatory
Always mandatory
Always mandatory
Kansas
Always mandatory
Always mandatory
Always mandatory
Always mandatory
Always mandatory
Always mandatory
Kentucky
Varies
Varies
Varies
Varies
Varies
Varies
Louisiana
Always mandatory
Always mandatory
Varies
Always mandatory
Varies
Varies
Maine
—
—
—
—
—
—
Maryland
Always mandatory
Always mandatory
Varies
Varies
Varies
Always excluded
Massachusetts
Always voluntary
Always voluntary
Always voluntary
Always voluntary
Always voluntary
Always voluntary
Michigan
Always mandatory
Always mandatory
Always mandatory
Always mandatory
Always mandatory
Always mandatory
Minnesota
Always mandatory
Always voluntary
Always excluded
Always voluntary
Varies
Always voluntary
Mississippi
Always mandatory
Always voluntary
Varies
Varies
Varies
Varies
Missouri
Always mandatory
Always mandatory
Always excluded
Varies
Varies
Always excluded
Montana
—
—
—
—
—
—
Nebraska
Always mandatory
Always mandatory
Always mandatory
Always mandatory
Always mandatory
Always mandatory
Nevada
Always mandatory
Varies
Always excluded
Varies
Varies
Always excluded
New Hampshire
Always mandatory
Always mandatory
Always mandatory
Always mandatory
Always mandatory
Always mandatory
New Jersey
Varies
Always mandatory
Always mandatory
Always mandatory
Always mandatory
Always mandatory
New Mexico
Always mandatory
Always mandatory
Always mandatory
Always mandatory
Always mandatory
Always mandatory
New York
Always mandatory
Varies
Varies
Varies
Always mandatory
Always mandatory
North Carolina
—
—
—
—
—
—
North Dakota
Always excluded
Always excluded
Always excluded
Always excluded
Always excluded
Always excluded
Ohio
Always mandatory
Always mandatory
Varies
Varies
Varies
Always mandatory
Oklahoma
—
—
—
—
—
—
Oregon
Always mandatory
Varies
Varies
Always mandatory
Always mandatory
Always mandatory
Pennsylvania
Always mandatory
Always mandatory
Always mandatory
Always mandatory
Always mandatory
Always mandatory
Rhode Island
Always mandatory
Always mandatory
Varies
Always mandatory
Varies
Varies
South Carolina
Always mandatory
Always voluntary
Always excluded
Varies
Varies
Varies
South Dakota
—
—
—
—
—
—
Tennessee
Always mandatory
Always mandatory
Always mandatory
Always mandatory
Always mandatory
Always mandatory
Texas
Always mandatory
Always voluntary
Varies
Always mandatory
Always mandatory
Always mandatory
Utah
Varies
Varies
Varies
Varies
Varies
Varies
Vermont
—
—
—
—
—
—
Virginia
Always mandatory
Always mandatory
Varies
Varies
Varies
Varies
Washington
Always mandatory
Always voluntary
Varies
Always mandatory
Always mandatory
Always mandatory
West Virginia
Always mandatory
Always excluded
Always excluded
Always mandatory
Varies
Varies
Wisconsin
Always mandatory
Varies
Always voluntary
Varies
Always voluntary
Always voluntary
Wyoming
—
—
—
—
—
—
Always Mandatory
32
20
11
20
18
19
Always Voluntary
2
8
4
3
3
4
Varies
4
8
16
14
16
11
Always Excluded
1
3
8
2
2
5
NOTES: “–” indicates there were no MCOs operating in that state’s Medicaid program in July 2017. ID/DD – intellectual and developmental disabilities, CSHCN – Children with special health care needs, SMI – Serious Mental Illness, SED – Serious Emotional Disturbance. States were asked to indicate for each group if enrollment in MCOs is “always mandatory,” “always voluntary,” “varies,” or if the group is “always excluded” from MCOs as of July 1, 2017.SOURCE: Kaiser Family Foundation Survey of Medicaid Officials in 50 states and DC conducted by Health Management Associates, October 2017.
TABLE 6: BEHAVIORAL HEALTH SERVICES COVERED UNDER ACUTE CARE MCO CONTRACTS IN ALL 50 STATES AND DC, AS OF JULY 1, 2017
States
Specialty OP Mental Health
Inpatient Mental Health
Outpatient SUD
Inpatient SUD
Alabama
—
—
—
—
Alaska
—
—
—
—
Arizona
Varies
Varies
Varies
Varies
Arkansas
—
—
—
—
California
Always Carved-out
Always Carved-out
Always Carved-out
Always Carved-out
Colorado
Always Carved-out
Always Carved-out
Always Carved-out
Always Carved-out
Connecticut
—
—
—
—
DC
Always Carved-in
Always Carved-in
Always Carved-out
Always Carved-in
Delaware
Varies
Always Carved-in
Always Carved-in
Always Carved-in
Florida
Always Carved-in
Always Carved-in
Always Carved-in
Always Carved-in
Georgia
Always Carved-in
Always Carved-in
Always Carved-in
Always Carved-in
Hawaii
Always Carved-out
Always Carved-out
Always Carved-in
Always Carved-in
Idaho
—
—
—
—
Illinois
Always Carved-in
Always Carved-in
Always Carved-in
Always Carved-in
Indiana
Always Carved-out
Always Carved-in
Always Carved-in
Always Carved-in
Iowa
Always Carved-in
Always Carved-in
Always Carved-in
Always Carved-in
Kansas
Always Carved-in
Always Carved-in
Always Carved-in
Always Carved-in
Kentucky
Always Carved-in
Always Carved-in
Always Carved-in
Always Carved-in
Louisiana
Always Carved-in
Always Carved-in
Always Carved-in
Always Carved-in
Maine
—
—
—
—
Maryland
Always Carved-out
Always Carved-out
Always Carved-out
Always Carved-out
Massachusetts
Always Carved-in
Always Carved-in
Always Carved-in
Always Carved-in
Michigan
Always Carved-out
Always Carved-out
Always Carved-out
Always Carved-out
Minnesota
Always Carved-in
Always Carved-in
Always Carved-in
Always Carved-in
Mississippi
Always Carved-in
Always Carved-in
Varies
Varies
Missouri
Always Carved-out
Varies
Varies
Varies
Montana
—
—
—
—
Nebraska
Always Carved-in
Always Carved-in
Always Carved-in
Always Carved-in
Nevada
Always Carved-in
Always Carved-in
Always Carved-in
Always Carved-in
New Hampshire
Always Carved-in
Always Carved-in
Always Carved-in
Always Carved-in
New Jersey
Varies
Varies
Varies
Varies
New Mexico
Always Carved-in
Always Carved-in
Always Carved-in
Always Carved-in
New York
Always Carved-in
Always Carved-in
Always Carved-in
Always Carved-in
North Carolina
—
—
—
—
North Dakota
Always Carved-in
Always Carved-in
Always Carved-in
Always Carved-in
Ohio
Always Carved-out
Always Carved-out
Always Carved-out
Always Carved-out
Oklahoma
—
—
—
—
Oregon
Always Carved-in
Always Carved-in
Always Carved-in
Always Carved-in
Pennsylvania
Always Carved-out
Always Carved-out
Always Carved-out
Always Carved-out
Rhode Island
Always Carved-in
Always Carved-in
Always Carved-in
Always Carved-in
South Carolina
Always Carved-in
Varies
Always Carved-in
Always Carved-in
South Dakota
—
—
—
—
Tennessee
Always Carved-in
Always Carved-in
Always Carved-in
Always Carved-in
Texas
Always Carved-in
Always Carved-in
Always Carved-in
Always Carved-in
Utah
Always Carved-out
Always Carved-out
Always Carved-out
Always Carved-out
Vermont
—
—
—
—
Virginia
Always Carved-out
Always Carved-in
Always Carved-in
Always Carved-in
Washington
Varies
Varies
Varies
Varies
West Virginia
Always Carved-in
Always Carved-in
Always Carved-in
Varies
Wisconsin
Varies
Always Carved-in
Always Carved-in
Always Carved-in
Wyoming
—
—
—
—
Always Carved-in
23
26
26
26
Always Carved-out
11
8
8
7
Varies
5
5
5
6
NOTES: OP – Outpatient. SUD – Substance Use Disorder. “–” indicates there were no MCOs operating in that state’s Medicaid program in July 2017. For beneficiaries enrolled in an MCO for acute care benefits, states were asked to indicate whether these benefits are always carved-in (meaning virtually all services are covered by the MCO), always carved-out (to PHP or FFS), or whether the carve-in varies (by geography or other factor). “Specialty outpatient mental health” refers to services utilized by adults with Serious Mental Illness (SMI) and/or youth with serious emotional disturbance (SED) commonly provided by specialty providers such as community mental health centers.SOURCE: Kaiser Family Foundation Survey of Medicaid Officials in 50 states and DC conducted by Health Management Associates, October 2017.
TABLE 7: SELECT MEDICAID MANAGED CARE QUALITY INITIATIVES IN ALL 50 STATES AND DC, IN PLACE IN FY 2017 AND ACTIONS TAKEN IN FY 2018
States
Pay for Performance/Performance Bonus
Capitation Withhold or Penalty
Required Data Collection and Reporting
Any Select Quality Initiatives
In Place
New
Expanded
In Place
New
Expanded
In Place
New
Expanded
In Place
New
Expanded
2017
2018
2018
2017
2018
2018
2017
2018
2018
2017
2018
2018
Alabama
Alaska
Arizona
Arkansas
California
X
X
X
Colorado
X
X
Connecticut
DC
X
X
X
X
Delaware
X
X
Florida
X
X
X
X
Georgia
X
X
X
X
X
X
Hawaii
X
X
X
X
X
Idaho
Illinois
X
X
X
X
Indiana
X
X
X
X
Iowa
X
X
X
X
Kansas
X
X
X
X
Kentucky
X
X
X
X
Louisiana
X
X
X
X
X
X
Maine
Maryland
X
X
X
X
Massachusetts
X
X
X
Michigan
X
X
X
X
Minnesota
X
X
X
Mississippi
X
X
Missouri
X
X
X
X
X
X
Montana
Nebraska
X
X
X
X
X
X
Nevada
X
X
X
X
X
New Hampshire
X
X
X
X
X
X
New Jersey
X
X
X
X
New Mexico
X
X
X
New York
X
X
X
X
X
X
North Carolina
North Dakota
Ohio
X
X
X
X
Oklahoma
Oregon
X
X
X
X
Pennsylvania
X
X
X
X
X
X
X
X
X
X
Rhode Island
X
X
X
X
South Carolina
X
X
X
X
South Dakota
Tennessee
X
X
X
X
Texas
X
X
X
X
X
Utah
X
X
Vermont
Virginia
X
X
X
X
Washington
X
X
X
West Virginia
X
X
X
Wisconsin
X
X
X
X
X
X
X
Wyoming
Totals
22
4
2
29
2
4
36
2
7
37
5
8
NOTES: States with MCO contracts were asked to report if select quality initiatives were included in contracts in FY 2017, or are new or expanded in FY 2018. The table does not reflect all quality initiatives states have included as part of MCO contracts.SOURCE: Kaiser Family Foundation Survey of Medicaid Officials in 50 states and DC conducted by Health Management Associates, October 2017.
TABLE 8: MINIMUM MEDICAL LOSS RATIO POLICIES FOR MEDICAID MCOs IN ALL 50 STATES AND DC, JULY 1, 2017
Minimum Medical Loss Ratio (MLR)
States
Require minimum MLR
% if required
Remittance required if MCO does not meet minimum MLR?
Acute
LTSS
Alabama
—
Alaska
—
Arizona
Yes — always
85%
85%
No
Arkansas
—
California
No
Colorado
Yes — always
85%
—
Yes — always
Connecticut
—
DC
Yes — always
85%
—
No
Delaware
No
Florida
Yes — sometimes
85%
N/A
No
Georgia
No
Hawaii
No
Idaho
—
Illinois
Yes — always
85%*
88%
Yes — always
Indiana
Yes — always
85-87%*
—
Yes — always
Iowa
Yes — always
88%
88%
Yes — always
Kansas
No
Kentucky
Yes — always
90%
—
Yes — always
Louisiana
Yes — always
85%
—
Yes — always
Maine
—
Maryland
Yes — always
85%
—
Yes — always
Massachusetts
Yes — sometimes
N/A
80%*
No
Michigan
Yes — sometimes
85%
N/A
No
Minnesota
No
Mississippi
Yes — always
85%
—
Yes — always
Missouri
Yes — always
85%
—
Yes — always
Montana
—
Nebraska
Yes — always
85%
—
Yes — always
Nevada
Yes — always
85%
—
Yes — always
New Hampshire
Yes — always
89%
—
No
New Jersey
Yes — always
85%
90%
Yes — always
New Mexico
Yes — always
86%
86%
No
New York
No*
North Carolina
—
North Dakota
No
Ohio
Yes — sometimes
85%
N/A
Yes — sometimes*
Oklahoma
—
Oregon
Yes — always
80%
—
Yes — always
Pennsylvania
No
Rhode Island
No
South Carolina
Yes — sometimes
86%
N/A
Yes — always
South Dakota
—
Tennessee
No
Texas
No*
Utah
No
Vermont
—
Virginia
Yes — always
85%
85%
Yes — always
Washington
Yes — always
85-87%*
—
Yes — always
West Virginia
Yes — always
85%
—
Yes — always
Wisconsin
No
Wyoming
—
Yes — always
20
17
Yes — sometimes
5
1
No
14
7
N/A – No MCOs
12
NOTES: In “Require Minimum MLR” column “–” indicates states that do not have Medicaid MCOs and “–” also appears in “LTSS %” column if state does not have MLTSS. “N/A” appears in “LTSS %” column if state with managed LTSS does not have LTSS MLR or in “Acute %” column if MCO state does not have acute MLR. *IL, IN, and WA indicated that the minimum acute MLR varies by population. *MA Senior Care Options (SCO) program has a minimum MLR of 80%. *NY is implementing MLR for acute and MLTSS in CY 2018 which will be effective retroactively to CY 2017. *TX has experience rebate on plans above a certain profit level.SOURCE: Kaiser Family Foundation Survey of Medicaid Officials in 50 states and DC conducted by Health Management Associates, 2017.
Report: Emerging Delivery System And Payment Reforms
Key Section Findings
In addition to managed care, Medicaid programs have been expanding their use of other service delivery and payment reform models to achieve better outcomes and lower costs. Forty states have one or more delivery system or payment reform initiatives in place in FY 2017 (e.g., patient-centered medical home (PCMH), ACA Health Home, accountable care organization (ACO), episode of care payment, or delivery system reform incentive program (DSRIP)).
What to watch: Six states reported episode of care initiatives in place in FY 2017 (up from only two states in FY 2015). For FY 2018, four of these states reported expanding these initiatives and three states reported new episode of care initiatives. Although states continue to show interest in DSRIP initiatives (that emerged under the Obama administration), the future of DSRIP remains unclear under the new administration. In response to two new survey questions, 19 states reported new or expanded initiatives to expand dental access or improve oral health outcomes (for children and/or adults) in FY 2017 or FY 2018 and 19 states also reported initiatives to expand the use of telehealth in FY 2018 or FY 2019.
Table 9 contains more detailed information on emerging delivery system and payment reform initiatives in place in FY 2017 and new or expanded initiatives in FY 2018.
This year’s survey asked states whether certain delivery system and payment reform models designed to improve health outcomes and constrain cost growth were in place in FY 2017, and whether they planned to adopt or enhance these models in FY 2018. Over three-quarters of all state Medicaid programs (40) had at least one of the specified delivery system or payment reform models in place in FY 2017 (Figure 5 and Table 9). If all actions reported by states for FY 2018 are implemented as planned, that number will grow to 44 states by the end of FY 2018, demonstrating the continued widespread and growing interest in Medicaid transformation. For FY 2018, a total of 22 states reported plans to adopt or expand one or more of the models to reward quality and encourage integrated care. Key initiatives include patient-centered medical homes (PCMHs), Health Homes, and Accountable Care Organizations (ACOs).
Figure 5: State Delivery System Reform Activity, FYs 2017-2018
Patient-Centered Medical Homes (PCMHs)
PCMH initiatives operated in over half (30) of Medicaid programs in FY 2017 (Table 9). Under a PCMH model, a physician-led, multi-disciplinary care team holistically manages the patient’s ongoing care, including recommended preventive services, care for chronic conditions, and access to social services and supports. Generally, providers or provider organizations that operate as a PCMH seek recognition from organizations like the National Committee for Quality Assurance (NCQA).53 PCMHs are often paid (by state Medicaid agencies directly or through MCO contracts) a per member per month (PMPM) fee in addition to regular FFS payments for their Medicaid patients.54
In this year’s survey, 12 states reported plans to adopt or expand PCMHs in FY 2018 (Table 9). A few of these states reported notable expansions. Through its Centennial Care managed care program, New Mexico indicated that it now serves approximately 300,000 members through a PCMH and further expansion is planned for FY 2018. Tennessee reported launching its statewide multi-payer PCMH program (through its TennCare MCOs) with 29 organizations in January 2017 with plans to add practices each year. Wyoming, a state without MCO or PCCM programs, implemented PCMHs prior to FY 2017, but reported that it will continue to recruit and enroll physician practices into the program in FY 2018. Alaska, Delaware, and Illinois are planning to implement new PCMH initiatives in FY 2018 and Georgia’s MCO contracts will support expansion of the number of PCMHs in FY 2018.
In contrast, three states reported the restriction or elimination of a PCMH program: Massachusetts ended a PCMH program in December 2016 as part of its transition towards primary care-led reform through ACO models; Maine reported that the multi-payer PCMH program that it participated in was eliminated at the federal level, and South Carolina reported that it would be restricting its PCMH program by eliminating “level 1” funding after finding that many PCMHs remained in the application phase for more than 18 months.
ACA Health Homes
The ACA Health Homes option, created under Section 2703 of the ACA, builds on the PCMH concept. By design, Health Homes must target beneficiaries who have at least two chronic conditions (or one and risk of a second, or a serious and persistent mental health condition), and provide a person-centered system of care that facilitates access to and coordination of the full array of primary and acute physical health services, behavioral health care, and social and long-term services and supports. This includes services such as comprehensive care management, referrals to community and social support services, and the use of health information technology (HIT) to link services, among others. States receive a 90 percent federal match rate for qualified Health Home service expenditures for the first eight quarters under each Health Home State Plan Amendment; states can (and have) created more than one Health Home program to target different populations.
Over one-third of states (21) had at least one Health Home initiative in place in FY 2017 (Table 9). One of these states (Alabama) specifically noted that it is continuing to operate its Health Home initiative even though the eight quarters of enhanced federal funding has expired. In this survey, seven states also reported plans to adopt or expand Health Homes in FY 2018 (Table 9). Of these seven states, three (Alaska, California, and Illinois) reported new Health Home State Plan Amendments (SPAs) and four states (New Mexico, New York, Vermont, and West Virginia) reported expansions of existing Health Home programs. Ohio, however, reported plans to end its Health Home program in January 2018 as part of a behavioral health redesign initiative.
Accountable Care Organizations (ACOs)
Thirteen states reported having ACOs in place for at least some of their Medicaid beneficiaries in FY 2017 (Table 9).55 While there is no uniform, commonly accepted federal definition of an ACO, an ACO generally refers to a group of health care providers or, in some cases, a regional entity that contracts with providers and/or health plans, that agrees to share responsibility for the health care delivery and outcomes for a defined population.56 An ACO that meets quality performance standards that have been set by the payer and achieves savings relative to a benchmark can share in the savings. States use different terminology in referring to their Medicaid ACO initiatives, such as Regional Care Collaborative Organizations (RCCOs) in Colorado57 and Accountable Entities in Rhode Island.
In this survey, no state reported a new ACO initiative, but six states reported plans to expand an existing initiative in FY 2018 (Table 9). Four states with more mature ACO programs (Colorado, Maine, Minnesota, and Vermont) reported continued expansions of those programs in FY 2018, including Vermont, which also reported that it had aligned its existing ACO model with the design of the Medicare/CMS Next Generation ACO model beginning in January 2017. Two states (Massachusetts and Rhode Island) reported more significant expansions. Massachusetts reported that its ACO pilot program would be expanded statewide in January 2018 employing three different ACO models: an ACO/MCO partnership model; an ACO contracting directly with the state (without an MCO partner), and an exclusively MCO administered model. Massachusetts expects approximately 900,000 Medicaid beneficiaries to be enrolled in an ACO (out of 1.4 million total Medicaid enrollees). Rhode Island also reported plans to expand its current pilot “Accountable Entity” (AE) program in partnership with its existing MCOs with a long-term goal of having at least one-third of its Medicaid eligibles attributed to a certified AE.58
Episode-of-Care Payment Initiatives
Unlike FFS reimbursement, where providers are paid separately for each service, or capitation, where a health plan receives a PMPM payment for each enrollee intended to cover the costs for all covered services, episode-of-care payment provides a set dollar amount for the care a patient receives in connection with a defined condition or health event (e.g., heart attack or knee replacement). Episode-based payments usually involve payment for multiple services and providers, creating a financial incentive for physicians, hospitals, and other providers to work together to improve patient care and manage costs. Six states (Arkansas, New Mexico, New York, Ohio, Pennsylvania, and Tennessee) reported that they had episode-of-care payment initiatives in place in FY 2017, up from only two states in FY 2015 (Table 9). Four of these states (Arkansas, New Mexico, Ohio, and Tennessee) also reported planned expansions of these initiatives in FY 2018. Another three states (Alaska, Connecticut, and South Carolina) reported plans to implement a new episode-of-care initiative in FY 2018 (Table 9).
Delivery System Reform Incentive Payment (DSRIP) Program
DSRIP initiatives,59 which emerged under the Obama administration, provide states with significant federal funding to support hospitals and other providers in changing how they provide care to Medicaid beneficiaries.[endnote 239092-11] DSRIP initiatives link funding for eligible providers to process and performance metrics. Ten states reported DSRIP initiatives in place in FY 2017 (Table 9). Two of these states (Massachusetts and Texas) reported expansions planned for FY 2018: Massachusetts’ expanded DSRIP will support the development of ACOs and Texas reported new protocols for DSRIP activities, subject to CMS approval. Although states continue to show interest in pursuing delivery system reform through Section 1115 waiver authority, the future of DSRIP initiatives remains unclear under the new administration.
Other Initiatives
In addition to the initiatives discussed above, states mentioned a variety of other delivery system and payment reform initiatives (not counted in the totals for Figure 5 and Table 9). For example, DC reported on its pay for performance (P4P) initiatives including a new rate methodology for nursing facilities that includes P4P and an federally qualified health center (FQHC) P4P program focused on reducing inappropriate use of the emergency room, decreasing the rate of potentially avoidable hospital admissions, and addressing the problem of hospital readmissions. Montana reported on the implementation and expansion of a tribal health improvement program. Nevada reported implementing Certified Community Behavioral Health Clinics (CCBHCs) using an integrated behavioral health model, a prospective payment system, and pay for performance measures. Rhode Island reported using Section 1115 waiver authority to receive federal matching funds for services currently provided by various state agencies to support a new Designated State Health Program aimed at supporting quality-based payment programs, and Wisconsin reported plans to implement incentives to reduce potentially preventable hospital readmissions among both managed care and FFS members.
All-payer claims database (APCD) systems are large-scale databases that systematically collect medical claims, pharmacy claims, dental claims (typically, but not always), and eligibility and provider files from both private and public payers. APCDs can be used to help identify areas to focus reform efforts and for other purposes. Sixteen states (up from 11 in FY 2015) reported that an APCD was in place in their states (although Minnesota reported that the Medicaid program did not have access to the APCD in its state); one state (Connecticut) reported an APCD expansion planned for FY 2018; and three states (Delaware, Hawaii, and Washington) reported plans for new APCDs in FY 2018. Tennessee, however, reported that its APCD would be eliminated stating that following the United States Supreme Court’s 2016 decision in Gobeille v. Liberty Mutual Insurance Company,60 the Tennessee Attorney General opined that the statute authorizing the Tennessee APCD could no longer be enforced.
Access Improvement Focus Areas
This year’s survey included additional questions for states focusing on initiatives to increase access to dental care or improve oral health outcomes and initiatives to increase access to telehealth. States were asked to briefly describe initiatives implemented in FY 2017 or planned for FY 2018.
Improving Dental Access or Oral Health Outcomes
Oral health is a critical component of overall health and well-being, but the prevalence of dental disease and tooth loss is disproportionately high among people with low income, reflecting lack of access to dental coverage and care.61 While all state Medicaid programs are required to provide a comprehensive dental benefit for children, dental services remain an optional benefit for adults and securing an adequate number of dental providers is a challenge in many areas. In this year’s survey, 19 states described a variety of new or expanded initiatives to expand dental access or improve oral health outcomes (for children and/or adults) implemented in FY 2017 or FY 2018 (Exhibit 6).
Exhibit 6: Strategies to Improve Dental Access or Oral Health Outcomes
# of States
States
Payment incentives or value-based purchasing arrangements
8
CA, DC, MN, OH, OR, TX, WA, WI
Reimbursement rate increases (sometimes targeted)
5
CA, MN, OR, PA, WI
New or planned contracts with Dental Benefit Managers (DBMs)
4
AR, FL, NE, NV
Dental performance measures or Performance Improvement Projects (PIPs) within managed care
4
FL, MI, MO, OR
Consumer outreach/education campaigns
2
FL, MN
In addition to the strategies noted in Exhibit 6 above, Pennsylvania reported expanded use of mid-level oral healthcare providers; Maryland reported expanded dental coverage to former foster care adults; and South Dakota reported working with its DBM vendor on care coordination initiatives (between primary care and dental care). Also see the “Benefit Changes” section of this report for details on states with dental benefit expansions. A number of other states mentioned ongoing initiatives implemented prior to FY 2017.
Improving Access to Care Through Telehealth
Interest in telehealth has grown across both public and commercial payers as a way to expand access to care, create greater convenience for patients, improve the quality of care, and reduce the costs of care. There are various types of telehealth services including: medical care/consultation between a patient at home and a distant clinician or between a patient in the presence of a clinician and a distant clinician; consultations between two clinicians without the patient present; remote monitoring of a patient at home or in a hospital or other facility; and secure electronic transfer of patient information (e.g., an image or lab results) to a clinician.62
In this year’s survey, 19 states reported initiatives to expand the use of telehealth in FY 2017 or FY 2018. Nine states reported expanding telehealth by covering additional services, diagnoses, or provider types (Arizona, Minnesota, Mississippi, Montana, and Washington), removing a 20 mile distance restriction (Indiana), adding or encouraging remote patient monitoring (Florida and Maryland) and distant site providers (Maryland), and allowing a patient’s home to be an acceptable patient site and clarifying that an initial in-person visit is not required if the telehealth service is being used to treat a behavioral health condition (Texas). California and Colorado reported telehealth pilot programs; Nevada indicated that its MCOs had implemented “NowClinics” to promote telehealth utilization, and South Dakota reported that it was working with tribal facilities to expand telehealth availability. Other states that reported new or expanded telehealth initiatives include Arkansas, Hawaii, Illinois, New Jersey, New Mexico, and New York.
TABLE 9: SELECT DELIVERY SYSTEM AND PAYMENT REFORM INITIATIVES IN ALL 50 STATES AND DC, IN PLACE IN FY 2017 AND ACTIONS TAKEN IN FY 2018
States
Patient-Centered Medical Homes(PCMH)
ACA Health Homes
Accountable Care Organizations (ACO)
Episode of Care Payments
Delivery System Reform Incentive Payment Program(DSRIP)
Any Delivery System or Payment Reform Initiatives
In Place FY 2017
New/ Expand FY 2018
In Place FY 2017
New/ Expand FY 2018
In Place FY 2017
New/ Expand FY 2018
In Place FY 2017
New/ Expand FY 2018
In Place FY 2017
New/ Expand FY 2018
In place FY 2017
New/Exp in FY 2018
Alabama
X
X
X
Alaska
X*
X*
X*
X*
Arizona
X
X
Arkansas
X
X
X
X
X
X
California
X*
X
X
X
Colorado
X
X
X
X
X
X
Connecticut
X
X
X
X*
X
X
Delaware
X*
X*
DC
X
X
Florida
X
X
Georgia
X*
X*
Hawaii
Idaho
X
X
Illinois
X*
X*
X*
Indiana
Iowa
X
X
X
X
Kansas
X
X
Kentucky
Louisiana
Maine
X
X
X
X
Maryland
X
X
Massachusetts
X
X
X
X
X
X
X
Michigan
X
X
X
X
X
Minnesota
X
X
X
X
X
X
Mississippi
Missouri
X
X
X
X
Montana
X
X
Nebraska
X
X
Nevada
X
X
New Hampshire
X
X
New Jersey
X
X
X
X
New Mexico
X
X
X
X
X
X
X
X
X
New York
X
X
X
X
X
X
X
X
North Carolina
X
X
X
North Dakota
Ohio
X
X
X
X
X
X
X
Oklahoma
X
X
X
Oregon
X
X
Pennsylvania
X
X
X
X
X
X
X
Rhode Island
X
X
X
X
X
X
South Carolina
X
X*
X
X
South Dakota
X
X
Tennessee
X
X
X
X
X
X
X
Texas
X
X
X
X
X
Utah
Vermont
X
X
X
X
X
X
X
Virginia
X
X
Washington
X
X
X
West Virginia
X
X
X
X
Wisconsin
X
X
X
Wyoming
X
X
X
X
Totals
30
12
21
7
13
6
6
7
10
2
40
22
NOTES: Expansions of existing initiatives include rollouts of existing initiatives to new areas or groups and significant increases in enrollment or providers. “*” indicates that a policy was newly adopted in FY 2018, meaning that the state did not have any policy in that category/column in place in FY 2017.SOURCE: Kaiser Family Foundation Survey of Medicaid Officials in 50 states and DC conducted by Health Management Associates, October 2017.
Report: Long-term Services And Supports Reforms
Key Section Findings
The vast majority of states in FY 2017 (47) and all states in FY 2018 are employing one or more strategies to expand the number of people served in home and community-based settings. The most common strategies include using HCBS waivers or state plan options, building rebalancing incentives into managed long-term services and supports (MLTSS) contracts, and serving more individuals through Programs of All-Inclusive Care for the Elderly (PACE) programs. Twenty-three states cover LTSS through one or more capitated managed care arrangements.
What to watch: Housing supports are an increasingly important part of state LTSS benefits. Over half of states (27) reported that they implemented or expanded housing-related activities outlined in CMS’s June 2015 Informational Bulletin63 (e.g., housing transition services, housing and tenancy sustaining services) in FY 2017 or FY 2018 (up from 16 states reported last year). In response to a new survey question about how states are addressing LTSS direct care workforce shortages and turnover, 17 states reported efforts in FY 2017 or FY 2018 to increase wages for direct care workers and/or engage in targeted workforce development activities (recruiting, training, credentialing, etc.).
Additional information on HCBS expansions implemented in FY 2017 or planned for FY 2018 as well as state-level details on capitated MLTSS models can be found in Tables 10 and 11.
Medicaid is the nation’s primary payer for long-term services and supports (LTSS), covering a continuum of services ranging from home and community-based services (HCBS) that allow persons to live independently in their own homes or in other community settings to institutional care provided in nursing facilities (NFs) and intermediate care facilities for individuals with intellectual disabilities (ICF-IDs). In 2015, spending on HCBS increased 7 percent while institutional spending decreased slightly, by 0.1 percent. HCBS represented 55 percent of total Medicaid expenditures on LTSS, and institutional LTSS represented 45 percent,64 a dramatic shift from 1995, when institutional settings accounted for 82 percent of national Medicaid LTSS expenditures.65
This year’s survey shows the vast majority of states in FY 2017 (47) and all states in FY 2018 (51) employing one or more strategies to expand the number of people served in home and community-based settings (Figure 6 and Table 10).
Figure 6: Long-Term Care Actions to Serve More Individuals in Community Settings, FYs 2017-2018
Forty-three states in FY 2017 and 46 states in FY 2018 report using HCBS waivers and/or State Plan Amendments (SPAs) to expand the number of people receiving HCBS.66 HCBS waivers and SPAs include Section 1915(c) and Section 1115 waivers67 as well as Section 1915(i) and 1915(k) (“Community First Choice”) state plan options.
Sixteen states in FY 201768 and 17 states in FY 2018 report including specific rebalancing incentives, performance targets and/or financial incentives, in managed care contracts to encourage MCOs that cover LTSS to expand access to HCBS.
Twenty-one states in FY 2017 and 22 states in FY 2018 report serving more individuals through Programs of All-Inclusive Care for the Elderly (PACE) programs.69
Thirteen states in FY 2017 and nine states in FY 2018 are closing or downsizing a state institution and transitioning residents into community settings.
Four states in FY 2017 and five states in FY 2018 are implementing or tightening a Certificate of Need (CON) program or imposing or extending a moratorium on construction of new NF or ICF-ID beds.
States were also asked whether they have adopted or plan to adopt new restrictions on the number of people served in the community. In FY 2018, Missouri noted they are reducing enrollees’ state plan consumer directed services budgets to equal 60 percent of the cost of nursing home care. In addition, Texas noted that, while the state budget included increased funding to support additional slots in Section 1915(c) waivers, the state has slowed down the rollout of new slots because of unanticipated increases in Community First Choice expenditures.
Table 10 shows state use of LTSS rebalancing tools in FY 2017 and FY 2018.
Housing Supports
In June 2015, CMS issued an Informational Bulletin to clarify when and how Medicaid reimburses for certain housing-related activities, including individual housing transition services, individual housing and tenancy sustaining services, and state-level housing related collaborative activities.70 CMS’s intent was to assist states in designing benefits that support community integration for seniors, individuals with disabilities, and individuals experiencing chronic homelessness. Over half of states (27 states) reported that they implemented or expanded a housing-related strategy outlined in the CMS bulletin in FY 2017 and/or FY 2018 (Exhibit 7).
Exhibit 7: States Implementing or Expanding Housing-Related Services Outlined in the CMS Informational Bulletin
FY 2017 only
FY 2018 only
Both FY 2017 and FY 2018
DC, IN, KY, MA, MN, RI, TN, VT
CT, DE, GA, HI, IL, KS, UT
AZ, CA, FL, MD, MI, MS, NJ, NY, OH, PA, SC, WA
Many of the services outlined in CMS’s Informational Bulletin were developed under the auspices of federal grant programs, including the Money Follows the Person (MFP) rebalancing demonstration. MFP is a federal grant program, enacted under the Deficit Reduction Act of 2005 and extended through September 2016 by the Affordable Care Act, which operated in 44 states.71,72 Enhanced federal funding under MFP has supported the transition of over 63,000 individuals from institutional to home and community-based long-term care settings as of December 2015.73 Under MFP, states identified the lack of affordable and accessible housing as a major barrier to assisting individuals to leave institutional settings of care.74 With MFP resources, many states have offered new housing related services, incorporated housing expertise within the Medicaid program to increase the likelihood of successful community living for persons who need supports, and engaged in strategic activities to assist in identifying and securing housing resources for individuals who choose HCBS.75
After September 2016, with CMS approval, states can continue to transition eligible individuals through 2018 and expend remaining MFP funds through federal FY 2020.76 As of July 2017, 30 states report that they currently offer housing-related services under a state plan, Section 1915(c) waiver, or Section 1115 waiver that the state intends to continue after the expiration of the MFP. However, 21 states report some services will likely be discontinued when MFP funding runs out. Examples of MFP services and activities that states may discontinue include: home delivered meals, vehicle modifications, independent living skills training, housing transition services, peer mentorship, and caregiver education, among others.
LTSS Direct Care Workforce
Many states are struggling to find sufficient numbers of trained direct care workers to meet the growing LTSS demand, including the demand for care in home and community-based settings.77,78 Low wages, few benefits, limited opportunities for career advancement, inadequate training, and high rates of worker injury are all factors that contribute to a workforce shortage and high workforce turnover among paid LTSS direct care workers. In this year’s survey, states were asked to describe any Medicaid initiatives intended to address LTSS direct care workforce shortages or turnover. Seventeen states report efforts underway in FY 2017 or FY 2018 related to wage increases for direct care workers or to workforce development (Exhibit 8).79
Exhibit 8: Strategies to Address LTSS Direct Care Workforce Shortages & Turnover
# of States
States
Wage Increases
11
IL, IN, KS, ME, MI, MT, NC, NH, NY, RI, UT
Workforce Development (including recruiting, training, credentialing etc.)
6
AZ, CT, MA, TN, WA, WI
HCBS Benefit Changes
Fourteen states in FY 2017 and 13 states in FY 2018 reported a wide variety of HCBS benefit additions or expansions. HCBS benefits include those in Section 1915(c) waivers, under Section 1915(i) authority or Section 1915(k) authority (“Community First Choice” or “CFC”), and state plan personal care services, home health services, or private duty nursing, and PACE (Exhibit 9).80 Most HCBS benefit changes reported involve the addition of HCBS services to existing waiver or state plan programs. Examples of HCBS services added by states include assistive technology, home delivered and medically tailored meals, personal supports, unpaid caregiver training, housing transition services and tenancy supports, and supported employment.
Some states implemented new HCBS programs in FY 2017 or FY 2018. Six states report establishing eleven new PACE sites over the reporting period (Exhibit 9). In FY 2017, Tennessee added a new HCBS program for individuals with ID/DD under its Section 1115 waiver (Employment and Community First CHOICES). In FY 2018, Idaho will implement a new Section 1915(i) state plan HCBS option for children with a serious emotional disturbance, Pennsylvania will add a new Community Living waiver for individuals with ID/DD, and Wyoming will implement a new Section 1915(k) (CFC) state plan service.
Only one state, Oregon, reported eliminating an HCBS benefit, proposing to eliminate coverage for a live-in program in FY 2018.
Exhibit 9: HCBS Benefit Enhancements or Additions
Benefit
FY 2017
FY 2018
HCBS Enhancements or Additions to Existing HCBS Authority
CA, KY, MA, MN, MS, NC, NE, PA, SC, SD, WI
CA, DE, NH, NY, PA, TX, UT, VA, WA
New PACE site
IN, LA
CA (2 sites), CO, IN, NC (2 sites), TX (3 sites)
New Section 1915(c), (i), or (k)
IN, TN
ID, PA, WY
Washington’s LTSS Changes through Section 1115 Transformation Waiver
Washington is implementing LTSS eligibility and benefit package changes (described below) under its Section 1115 waiver to broaden the array of services available to individuals and to support unpaid family caregivers. The state hopes that these reforms will enable beneficiaries to stay at home and delay or avoid the need for more intensive care, while preserving quality of life, reducing costs, and avoiding the need for beneficiaries to impoverish themselves to access LTSS.
Medicaid Alternative Care (MAC) LTSS benefit package – MAC is a new LTSS benefit package option for Medicaid beneficiaries to support those living at home with assistance provided by unpaid family caregivers. MAC is only available to Medicaid beneficiaries eligible for but not receiving Medicaid-funded LTSS through the state plan or a Section 1915(c) waiver benefit package. MAC benefits include caregiver assistance services, caregiver training and education, specialized medical equipment and supplies, and health maintenance therapy supports.
Tailored Supports for Older Adults (TSOA) eligibility pathway for LTSS – TSOA will serve individuals who do not meet existing Medicaid financial eligibility criteria but who are “at-risk” of future Medicaid LTSS use. TSOA creates a new coverage group with access to a limited HCBS benefit package. MAC benefits include caregiver assistance services, caregiver training and education, specialized medical equipment and supplies, health maintenance therapy supports, and personal assistance.
Capitated Managed Long-Term Services and Supports (MLTSS)
As of July 1, 2017, almost half of states (23 states) covered LTSS through oneor more of the following types of capitated managed care arrangements:
Medicaid MCO covering Medicaid acute care and LTSS (18 states)
PHP covering only Medicaid LTSS (6 states)
MCO arrangement for dual eligible beneficiaries covering Medicaid and Medicare acute care and Medicaid LTSS services in a single contract under the federal Financial Alignment Demonstration (FAD) (10 states)
Of the 23 states that reported using one or more of these MLTSS models, nine states reported using two models, and one state (New York) reported using all three. Of the states with capitated MLTSS, 15 offered some form of MLTSS plan on a statewide basis for at least some LTSS populations as of July 1, 2017 (Table 11).
Ten states offered an MCO-based FAD (California, Illinois, Massachusetts, Michigan, New York, Ohio, Rhode Island, South Carolina, Texas, and Virginia) as of July 1, 2017.81,82 The FAD model involves a three-way contract between an MCO, Medicare, and the state Medicaid program.83,84 Massachusetts also operates an administrative alignment demonstration (without financial alignment) for dually eligible beneficiaries (Senior Care Options program). Minnesota only operates an administrative alignment demonstration (without financial alignment) for dually eligible beneficiaries (Minnesota Senior Health Options program).
Other states not participating in a formal demonstration have taken action to encourage improved coordination and integration of services for the dually eligible population under MCO arrangements. Eight states85require Medicaid-contracting MCOs to be Medicare Dual Eligible Special Needs Plans (D-SNP)86 or Fully Integrated Dual Eligible (FIDE) Special Needs Plans,87 creating an opportunity for improved coordination and integration for beneficiaries. Five states88encourage MCOs to be a D-SNP or a FIDE-SNP.
MLTSS Enrollment
For geographic areas where MLTSS operates, this year’s survey asked whether, as of July 1, 2017, certain populations were enrolled in MLTSS on a mandatory or voluntary basis or were always excluded. On the survey, states selected from “always mandatory,” “always voluntary,” “varies,” or “always excluded” for the following populations: seniors, persons with ID/DD, nonelderly adults with physical disabilities, and full benefit dual eligible individuals. As shown in Exhibit 10 below, seniors were most likely to be enrolled on a mandatory basis. Persons with ID/DD were excluded from enrollment in only three MLTSS states, though they were least likely to be enrolled on a mandatory basis. No state offering MLTSS always excludes full benefit dual eligible individuals from MLTSS enrollment.
Exhibit 10: MLTSS Enrollment by Populations, July 1, 2017 (# of States)
Seniors
Persons with ID/DD
Nonelderly Adults with Physical Disabilities
Full Benefit Dual Eligibles
Always mandatory
13
7
11
11
Always voluntary
5
5
4
6
Varies
4
8
6
6
Always excluded
1
3
2
0
MLTSS Population Changes
Growth in the use of MLTSS has continued since the prior survey reporting year. South Carolina expanded MLTSS to new regions in FY 2017 while Pennsylvania will expand to new regions in FY 2018 (Exhibit 11). In FY 2018, Virginia will roll out a new MLTSS program. Wisconsin’s Family Care Program will be statewide by the end of FY 2018. Five states extended MLTSS to new populations in FY 2017 (Illinois, New York, South Carolina, Tennessee, and Texas). In FY 2018, two states (New York and Pennsylvania) will extend MLTSS to new populations. No states reported actions or plans to decrease the number of enrollees served in MLTSS in FY 2017 or FY 2018.
Exhibit 11: MLTSS Population Expansions, FY 2017 and FY 2018
FY 2017
FY 2018
Geographic Expansions
SC, WI
PA, VA, WI
New Population Groups Added
IL, NY, SC, TN, TX
NY, PA
MLTSS Benefits
Almost every MLTSS state (21 out of 23 states) includes both institutional and HCBS in the same contractual arrangement, while two states (Michigan and Tennessee) report that this varies by MLTSS arrangement. Only one state reported a MLTSS benefit change in FY 2017 or FY 2018. Michigan added hospice benefits to its FAD in FY 2017.
TABLE 10: LONG-TERM CARE ACTIONS TO SERVE MORE INDIVIDUALS IN COMMUNITY SETTINGS IN ALL 50 STATES AND DC, FY 2017 AND FY 2018
States
Sec. 1915(c) or Sec. 1115 Waiver
Sec. 1915(i) HCBS State Plan Option
Sec. 1915(k) “Community First Choice” Option
Building Rebalancing Incentives into MLTSS
PACE Expansion
Close/ Downsize Institution
Certificate of Need or Moratorium
Total States with HCBS Expansions
2017
2018
2017
2018
2017
2018
2017
2018
2017
2018
2017
2018
2017
2018
2017
2018
Alabama
X
X
X
X
Alaska
X
X
Arizona
X
X
X
X
Arkansas
X
X
X
X
X
X
California
X
X
X
X
X
X
X
X
X
X
X
X
X
X
Colorado
X
X
X
X
X
X
X
X
Connecticut
X
X
X
X
X
X
X
X
X
X
DC*
X
X
Delaware
X
X
X
X
X
X
X
X
X
X
Florida
X
X
X
X
X
X
X
X
Georgia
X
X
X
X
Hawaii
X
X
X
X
Idaho
X
X
X
X
X
X
X
Illinois
X
X
X
X
X
X
Indiana
X
X
X
X
X
X
X
X
X
X
Iowa
X
X
X
X
X
X
X
X
Kansas
X
X
X
X
Kentucky
X
X
X
X
Louisiana
X
X
X
X
Maine
X
X
X
X
Maryland
X
X
X
X
X
Massachusetts
X
X
X
X
X
X
X
Michigan
X
X
X
X
X
X
X
X
X
Minnesota
X
X
X
X
X
X
Mississippi
X
X
X
X
X
Missouri
X
X
X
X
Montana
X
X
X
X
X
X
X
Nebraska
X
X
X
X
X
X
Nevada
X
X
X
New Hampshire
X
X
X
X
X
New Jersey
X
X
X
X
X
X
X
X
New Mexico
X
X
X
X
X
X
New York
X
X
X
X
X
X
X
X
X
X
X
X
North Carolina
X
X
X
X
X
X
North Dakota
X
X
X
X
X
X
X
X
X
X
Ohio
X
X
X
X
X
X
X
X
Oklahoma
X
X
X
X
X
X
Oregon
X
X
X
X
X
X
X
X
Pennsylvania
X
X
X
X
X
X
X
X
X
X
Rhode Island
X
X
X
X
South Carolina
X
X
X
X
X
South Dakota
X
X
X
X
Tennessee
X
X
X
X
X
X
X
X
X
Texas
X
X
X
X
X
X
X
X
X
X
Utah
X
X
X
X
Vermont
X
X
X
X
Virginia
X
X
X
X
X
X
X
X
X
Washington
X
X
X
X
X
X
X
X
West Virginia
X
X
Wisconsin
X
X
X
X
X
X
X
Wyoming
X
X
X
X
X
X
X
Totals
41
42
8
13
8
10
16
17
21
22
13
9
4
5
47
51
NOTES: “1915(c) or Sec. 1115 Waiver” actions include: adopting new waivers; adding and filling more waiver slots; or filling more waiver slots. Actions under “1915(i) and 1915(k)” include adding new 1915(i) or 1915(k) SPAs or serving more individuals through existing 1915(i) or 1915(k) SPAs. “Certificate of Need or Moratorium” actions include: implementing/tightening a CON program or imposing a new/extended moratorium on construction of new nursing facility or ICF-ID beds. *DC – Although not reflected in the table/counts above, DC also reported implementing a uniform assessment tool and increasing the availability of Medicaid application assistance, streamlining the eligibility and enrollment process. Several states also highlighted continued rebalancing efforts through the Money Follows the Person (MFP) program; although this federal grant program ended in September 2016, with CMS approval, states can continue to transition eligible individuals through 2018 and expend remaining MFP funds through federal FY 2020.SOURCE: Kaiser Family Foundation Survey of Medicaid Officials in 50 states and DC conducted by Health Management Associates, October 2017.
TABLE 11: CAPITATED MLTSS MODELS IN ALL 50 STATES AND DC, AS OF JULY 1, 2017
States
Medicaid MCO
PHP
Medicare + Medicaid Demonstration
Any MLTSS
Statewide
Alabama
Alaska
Arizona
X
X
X
Arkansas
California
X
X
X
Colorado
Connecticut
DC
Delaware
X
X
X
Florida
X
X
X
Georgia
Hawaii
X
X
X
Idaho
X
X
Illinois
X
X
X
Indiana
Iowa
X
X
X
Kansas
X
X
X
Kentucky
Louisiana
Maine
Maryland
Massachusetts
X
X*
X
Michigan
X
X
X
X
Minnesota*
X
X
X
Mississippi
Missouri
Montana
Nebraska
Nevada
New Hampshire
New Jersey
X
X
X
New Mexico
X
X
X
New York
X
X
X
X
X
North Carolina
X
X
X
North Dakota
Ohio
X
X
X
Oklahoma
Oregon
Pennsylvania
Rhode Island
X
X
X
X
South Carolina
X
X
South Dakota
Tennessee
X
X
X
X
Texas
X
X
X
X
Utah
Vermont
Virginia
X
X
Washington
West Virginia
Wisconsin
X
X
X
Wyoming
Totals
18
6
10
23
15
NOTES: States were asked whether they cover long-term services supports through any of the following managed care (capitated) arrangements as of July 1, 2017: Medicaid MCO (MCO covers Medicaid acute + Medicaid LTSS); PHP (covers only Medicaid LTSS); or Medicare + Medicaid Demonstration (Medicaid MCO covers Medicaid and Medicare acute + Medicaid LTSS). “Medicare + Medicaid Demonstration” – these states use Medicaid MCOs in Financial Alignment Demonstration (FAD) initiatives which involve care coordination for dually eligible beneficiaries. States were also asked whether MLTSS plans were operating in all regions of the state as of July 1, 2017 (statewide). *MA operates a FAD and another administrative alignment demonstration for dually eligible beneficiaries. *MN operates an administrative alignment demonstration (without financial alignment) for dually eligible beneficiaries. *OH offers a Medicaid MCO (MCO offers Medicaid acute + Medicaid LTSS) only in those counties where the FAD is offered; dually eligible seniors who opt out of the FAD must enroll in this Medicaid MCO model for Medicaid services.SOURCE: Kaiser Family Foundation Survey of Medicaid Officials in 50 states and DC conducted by Health Management Associates, 2017.
Report: Provider Rates And Taxes
Key Section Findings
Provider rate changes are often tied to the economy. In FY 2017 and FY 2018, with relatively stable economic conditions in most states, more states made, or are planning, provider rate increases compared to restrictions. This holds true across provider types, except for inpatient hospital rates (hospital rate restrictions are primarily rate freezes, which are counted as restrictions in this report). All states except Alaska rely on provider taxes and fees to fund a portion of the non-federal share of the costs of Medicaid. Three states indicate plans for new provider taxes in FY 2018 and 13 states plan at least one provider tax increase.
What to watch:
About half of MCO states (18 of 39) require MCO rates to follow FFS rate changes for some provider types and two states (Louisiana and Mississippi) require MCO rates to be tied to FFS for all providers. Twenty-four states reported they had MCO rate floors for some provider types, and five states reported they had minimum MCO payment requirements for all types of Medicaid providers.
Federal legislation recently under consideration in the Senate proposed to phase down the limit on state use of provider taxes (the “safe harbor threshold”) from the current allowable level, 6.0 percent of net patient revenues, to 5.0 percent of net patient revenues by FY 2025 in one proposal and 4.0 percent by FY 2025 in another. In this year’s budget survey, 29 states reported having at least one provider tax exceeding 5.5 percent of net patient revenues and 46 states reported having at least one provider tax exceeding 3.5 percent as of July 1, 2017. The data suggests that these federal proposals would restrict states’ ability to supply the non-federal share to finance Medicaid and could therefore shift additional costs to states.
Tables 12 through 14 provide complete listings of Medicaid provider rate changes and provider taxes and fees in place in FY 2017 and FY 2018.
Provider Rates
Provider rate changes are often tied to the economy. During economic downturns and budget shortfalls, states often turn to rate restrictions to contain costs and are more likely to increase rates during periods of recovery and revenue growth. This report examines rate changes across major provider categories: inpatient hospital, nursing facilities, MCOs, outpatient hospital, primary care physicians, specialists, dentists, and home and community-based services (HCBS). States were asked to report aggregate rate changes for each provider category in their FFS programs. In FY 2017, more states implemented rate increases for at least one category of providers (46 states) compared to rate restrictions (37 states) (Figure 7 and Table 12). Compared with what states projected for FY 2017 on last year’s survey, this year’s survey responses showed that six more states implemented rate increases in FY 2017 and four fewer states implemented rate restrictions.
Figure 7: Provider Rate Changes Implemented in FY 2003 – FY 2017 and Adopted for FY 2018
For FY 2018, the number of states with at least one implemented or planned rate increase (44 states) is greater than the number of states with at least one implemented or planned rate restriction (40 states) (Table 13).
The number of states with rate increases exceeded the number of states with restrictions in FY 2017 and FY 2018 across all major categories of providers (physicians, MCOs, and nursing facilities) with the exception of rates for inpatient hospital services89 (Figure 8). For the purposes of this report, cuts or freezes in rates for inpatient hospitals and nursing facilities are counted as restrictions.90 Most of the restrictions are for rate freezes. Four states in FY 2017 and five states in FY 2018 had implemented or planned reductions to inpatient hospital rates; only one state cut nursing facility rates in FY 2017, and two states plan to cut nursing facility rates in FY 2018.
Figure 8: Provider Rate Changes Implemented in FY 2017 and Adopted for FY 2018
The number of states planning to increase nursing facility rates dropped in FY 2018 (28) compared to FY 2017 (36 states). HCBS providers were among those most likely to receive rate increases (27 states in FY 2017 and 29 states in FY 2018).
Capitation payments for MCOs are generally bolstered by the federal requirement that states pay actuarially sound rates. In FY 2017 and FY 2018, the majority of the 39 states with Medicaid MCOs either implemented or planned increases in MCO rates. Five states reported MCO rate cuts in FY 2017, and five states plan to cut MCO rates in FY 2018. Four states were not able to report MCO rate changes for FY 2018 because rate development was not complete. States are increasingly moving to calendar year MCO contracts.
Tables 12 and 13 provide state level details on provider rate changes in FY 2017 and FY 2018.
MCO Rate Requirements
In many states, MCOs make most of the Medicaid payments to providers. States were asked whether they require their MCOs to make changes to their provider payments when the state makes changes to FFS rates (such as rate increases). Of the 39 states with MCOs, 19 states indicated that they had no such requirement, 18 states have such a requirement for some provider types, and two states (Louisiana and Mississippi) required MCOs to make these changes for all types of Medicaid providers. States were also asked if their MCO contracts mandate minimum provider reimbursement rates. Of the 39 MCO states, ten indicated that they had no rate floors, 24 states indicated that they had rate floors for some provider types, and five states said they had minimum MCO payment requirements for all Medicaid provider types.
Provider Taxes and Fees
Provider taxes are an integral source of Medicaid financing. In this year’s survey, states reported continuing or increased reliance on provider taxes and fees to fund a portion of the non-federal share of Medicaid costs in FY 2017 and FY 2018. At the beginning of FY 2003, 21 states had at least one provider tax in place. Over the next decade, a majority of states imposed new taxes or fees and increased existing tax rates and fees to raise revenue to support Medicaid. By FY 2013, all but one state (Alaska) had at least one provider tax or fee in place.91 In FY 2017, 34 states had three or more provider taxes in place (Figure 9).
Figure 9: States with Provider Taxes or Fees in Place in FY 2017
The most common Medicaid provider taxes in place in FY 2017 were taxes on nursing facilities (44 states), followed by taxes on hospitals (42 states) and taxes on intermediate care facilities for the intellectually disabled (36 states) (Table 14). Three states reported plans to add new taxes in FY 2018. Oregon reported a new MCO tax, Ohio’s MCO tax transitioned from a sales tax on premium revenues to a member month tax, and Tennessee expects to have a new ground ambulance provider assessment, which was enacted by the Tennessee General Assembly during its 2017 legislative session. Thirteen states reported increases to one or more provider taxes in FY 2018, compared to only five states reporting provider tax decreases.92
Recent federal health reform legislation93 under consideration in the Senate proposed phasing down the limit on state use of provider taxes (the “safe harbor threshold”) from the current allowable level, 6.0 percent of net patient revenues, to 5.0 percent of net patient revenues by FY 2025.94Another proposal would lower the threshold to 4.0 percent in FY 2025.95 In this year’s budget survey, 29 states reported having at least one provider tax exceeding 5.5 percent of net patient revenues and 46 states reported having at least one provider tax exceeding 3.5 percent as of July 1, 2017. These data suggest that federal action to lower the safe harbor threshold would restrict states’ ability to supply the non-federal share to finance Medicaid and could therefore shift additional costs to states. If states were not able to find additional funds to replace provider tax funding, limits on provider taxes could result in program cuts with implications for Medicaid providers and beneficiaries.
TABLE 12: PROVIDER RATE CHANGES IN ALL 50 STATES AND DC, FY 2017
States
Inpatient Hospital
Outpatient Hospital
Primary Care Physicians
Specialists
Dentists
Managed Care Organizations
Nursing Facilities
HCBS
Total
Rate Change
+
–
+
–
+
–
+
–
+
–
+
–
+
–
+
–
+
–
Alabama
X
—
—
X
X
X
Alaska
X
X
X
X
—
—
X
X
X
Arizona
X
X
X
X
X
X
Arkansas
X
—
—
X
X
X
California
X
X
X
X
X
X
X
Colorado
X
X
X
X
X
Connecticut
X
X
—
—
X
X
Delaware
X
X
X
X
X
X
X
X
X
DC
X
X
X
X
X
X
X
X
X
Florida
X
X
X
X
X
X
X
Georgia
X
X
X
X
X
X
X
Hawaii
X
X
X
X
X
X
X
X
X
Idaho
X
X
X
X
—
—
X
X
X
Illinois
X
X
X
X
X
Indiana
X
X
X
X
X
X
Iowa
X
X
X
Kansas
X
X
X
X
X
X
X
X
X
X
Kentucky
X
X
X
X
X
X
X
Louisiana
X
X
X
X
X
Maine
X
—
—
X
X
X
Maryland
X
X
X
X
X
X
Massachusetts
X
X
X
X
X
X
Michigan
X
X
X
X
X
X
Minnesota
X
X
X
X
X
X
X
X
Mississippi
X
X
X
X
X
X
X
X
Missouri
X
X
X
X
X
X
X
X
X
X
Montana
X
X
X
—
—
X
X
X
X
Nebraska
X
X
X
X
X
X
X
X
Nevada
X
X
X
X
X
X
New Hampshire
X
X
X
X
X
New Jersey
X
X
X
X
X
X
X
X
New Mexico
X
X
X
X
X
X
X
X
X
New York
X
X
X
X
X
X
North Carolina
X
—
—
X
X
X
North Dakota
X
X
X
X
X
X
X
Ohio
X
X
X
X
X
X
Oklahoma
X
—
—
X
X
Oregon
X
X
X
X
X
X
Pennsylvania
X
X
X
X
X
Rhode Island
X
X
X
X
X
X
South Carolina
X
X
X
X
X
X
South Dakota
X
X
X
X
X
—
—
X
X
Tennessee
X
X
X
Texas
X
X
X
X
X
X
Utah
X
X
X
X
X
X
X
Vermont
X
X
X
—
—
X
X
X
X
Virginia
X
X
X
X
X
X
Washington
X
X
X
X
X
West Virginia
X
X
X
X
X
Wisconsin
X
X
X
X
X
X
X
Wyoming
X
X
X
X
—
—
X
X
X
X
Totals
17
34
17
5
14
6
13
4
11
3
30
5
36
15
27
2
46
37
NOTES: “+” refers to provider rate increases and “-” refers to provider rate restrictions. HCBS: Home and community-based services. For the purposes of this report, provider rate restrictions include cuts to rates for physicians, dentists, outpatient hospitals, managed care organizations, and HCBS as well as both cuts or freezes in rates for inpatient hospitals and nursing facilities. There are 12 states that did not have Medicaid MCOs in operation in FY 2017; they are denoted as ‘–‘ in the MCO column.SOURCE: Kaiser Family Foundation Survey of Medicaid Officials in 50 states and DC conducted by Health Management Associates, October 2017.
TABLE 13: PROVIDER RATE CHANGES IN ALL 50 STATES AND DC, FY 2018
States
Inpatient Hospital
Outpatient Hospital
Primary Care Physicians
Specialists
Dentists
Managed Care Organizations
Nursing Facilities
HCBS
Total
Rate Change
+
–
+
–
+
–
+
–
+
–
+
–
+
–
+
–
+
–
Alabama
X
—
—
X
X
X
Alaska
X
X
X
X
X
—
—
X
X
Arizona
X
X
X
X
X
X
X
X
Arkansas
X
—
—
X
X
X
California
X
X
X
X
X
X
X
X
X
Colorado
X
X
X
X
X
X
X
X
Connecticut
X
X
—
—
X
X
Delaware
X
X
X
X
X
X
X
X
X
DC
X
X
X
X
X
X
Florida
X
X
X
X
X
X
X
Georgia
X
X
X
X
X
X
X
X
X
Hawaii
X
X
X
X
X
X
X
X
X
X
Idaho
X
X
X
X
—
—
X
X
X
X
Illinois
X
TBD
TBD
X
X
X
X
Indiana
X
X
X
X
X
Iowa
X
X
TBD
TBD
X
X
X
Kansas
X
X
X
X
X
X
X
X
X
Kentucky
X
X
X
X
X
X
Louisiana
X
X
X
X
X
X
Maine
X
—
—
X
X
X
X
Maryland
X
X
X
X
X
Massachusetts
X
X
X
X
X
X
X
X
X
Michigan
X
X
X
X
X
X
Minnesota
X
X
X
X
X
X
X
Mississippi
X
X
X
X
X
X
Missouri
X
X
X
X
X
X
X
X
X
X
Montana
X
X
X
X
X
—
—
X
X
X
X
Nebraska
X
X
X
X
Nevada
X
X
X
X
X
X
X
X
X
New Hampshire
X
X
X
X
X
X
New Jersey
X
X
X
X
X
X
X
New Mexico
TBD
TBD
TBD
TBD
TBD
TBD
TBD
TBD
TBD
TBD
TBD
TBD
TBD
TBD
TBD
TBD
TBD
TBD
New York
X
X
X
X
X
X
North Carolina
X
—
—
X
X
North Dakota
X
X
X
X
X
Ohio
X
X
TBD
TBD
TBD
TBD
TBD
TBD
X
X
TBD
TBD
X
X
Oklahoma
X
—
—
X
X
Oregon
X
X
X
X
X
X
X
Pennsylvania
X
X
X
X
Rhode Island
X
X
X
X
X
X
X
South Carolina
X
X
X
X
X
X
X
South Dakota
X
—
—
X
X
X
X
Tennessee
X
X
X
X
X
X
X
Texas
X
X
X
X
X
Utah
X
X
X
X
X
X
Vermont
X
X
X
—
—
X
X
X
X
Virginia
X
X
X
X
X
X
Washington
X
X
X
X
X
West Virginia
X
X
X
X
X
Wisconsin
X
X
TBD
TBD
TBD
TBD
TBD
TBD
TBD
TBD
X
X
Wyoming
X
—
—
X
X
X
X
Totals
17
33
16
6
12
5
10
4
9
5
27
5
28
22
29
2
44
40
NOTES: “+” refers to provider rate increases and “-” refers to provider rate restrictions. HCBS: Home and community-based services. For the purposes of this report, provider rate restrictions include cuts to rates for physicians, dentists, outpatient hospitals, managed care organizations, and HCBS as well as both cuts or freezes in rates for inpatient hospitals and nursing facilities. There are 12 states that did not have Medicaid MCOs in operation in FY 2017; they are denoted as “–” in the MCO column. TBD: At the time of the survey, calendar year 2018 MCO rates had not been set for Illinois, Iowa, or New Mexico. FY 2018 rates had not been determined for several categories of providers in Ohio and Wisconsin. New Mexico reported that rate decisions would be made “as needed” during FY 2018.SOURCE: Kaiser Family Foundation Survey of Medicaid Officials in 50 states and DC conducted by Health Management Associates, October 2017.
TABLE 14: PROVIDER TAXES IN PLACE IN ALL 50 STATES AND DC, FY 2017 AND FY 2018
States
Hospitals
Intermediate Care Facilities
Nursing Facilities
Other
2017
2018
2017
2018
2017
2018
2017
2018
Alabama
X
X
X
X
X
X
Alaska
Arizona
X
X
X
X
Arkansas
X
X
X
X
X
X
California
X
X
X
X
X
X
X
X
Colorado
X
X
X
X
X
X
Connecticut
X
X
X
X
X
X
X
X
Delaware
X
X
DC
X
X
X
X
X
X
X
X
Florida
X
X
X
X
X
X
Georgia
X
X
X
X
Hawaii
X
X
X
X
Idaho
X
X
X
X
X
X
Illinois
X
X
X
X
X
X
Indiana
X
X
X
X
X
X
Iowa
X
X
X
X
X
X
Kansas
X
X
X
X
Kentucky
X
X
X
X
X
X
X*
X*
Louisiana
X
X
X
X
X
X
X*
X*
Maine
X
X
X
X
X
X
X
X
Maryland
X
X
X
X
X
X
X
X
Massachusetts
X
X
X
X
X
X
Michigan
X
X
X
X
Minnesota
X
X
X
X
X
X
X
X
Mississippi
X
X
X
X
X
X
X
X
Missouri
X
X
X
X
X
X
X*
X*
Montana
X
X
X
X
X
X
Nebraska
X
X
X
X
Nevada
X
X
New Hampshire
X
X
X
X
New Jersey
X
X
X
X
X
X
X*
X*
New Mexico
X*
X*
New York
X
X
X
X
X
X
X*
X*
North Carolina
X
X
X
X
X
X
North Dakota
X
X
Ohio
X
X
X
X
X
X
X
X
Oklahoma
X
X
X
X
X
X
Oregon
X
X
X
X
X
Pennsylvania
X
X
X
X
X
X
X*
X*
Rhode Island
X
X
X
X
X
X
South Carolina
X
X
X
X
South Dakota
X
X
Tennessee
X
X
X
X
X
X
X
X*
Texas
X
X
X
X
Utah
X
X
X
X
X
X
X
X
Vermont
X
X
X
X
X
X
X*
X*
Virginia
X
X
Washington
X
X
X
X
X
X
West Virginia
X
X
X
X
X
X
X*
X*
Wisconsin
X
X
X
X
X
X
X
X
Wyoming
X
X
X
X
Totals
42
42
36
36
44
44
24
25
NOTES: This table includes Medicaid provider taxes as reported by states. Some states also have premium or claims taxes that apply to managed care organizations and other insurers. Since this type of tax is not considered a provider tax by CMS, these taxes are not counted as provider taxes in this report. (*) has been used to denote states with multiple “other” provider taxes.SOURCE: Kaiser Family Foundation Survey of Medicaid Officials in 50 states and DC conducted by Health Management Associates, October 2017.
Report: Benefits, Copayments, Pharmacy, And Opioid Strategies
Key Section Findings
A total of 26 states expanded or enhanced covered benefits in FY 2017 and 17 states plan to add or enhance benefits in FY 2018. The most common benefit enhancements reported were for behavioral health/substance use disorder services and dental services. Most states identified high cost and specialty drugs (including many states that specifically referenced hepatitis C antivirals) as a significant cost driver for state Medicaid programs. The majority (37 states in FY 2017 and 36 in FY 2018) reported actions to refine or enhance their pharmacy programs, especially implementation of new utilization controls (e.g., prior authorization requirements, clinical edits, quantity limits etc.). Thirty-five of 39 MCO states reported that the pharmacy benefit was “generally carved-in.” Of these 35 states, the majority reported requirements that MCOs have uniform clinical protocols (31 states) or uniform preferred drug lists (PDLs) (19 states) that will be in place for one or more drugs as of the end of FY 2018.
What to watch:
A growing number of states have chosen to adopt the CDC guidelines for the prescribing of opioid pain medications for adults in primary care settings: 34 states reported adoption or plans for adoption in FY 2018 for their FFS programs (compared to 21 states in last year’s survey), and 18 states reported requiring MCOs to adopt the CDC guidelines or plans to do so in FY 2018 (compared to 11 in last year’s survey).
Nearly all states have various FFS pharmacy management strategies targeted at opioid harm reduction including quantity limits (48 states); clinical criteria claim system edits (46 states); step therapy (34 states), and other prior authorization requirements (32 states). Somewhat fewer states (28) reported requirements in place for Medicaid prescribers to check their states’ Prescription Drug Monitoring Program before prescribing opioids to a Medicaid patient. For the 35 states that used MCOs to deliver pharmacy benefits, 24 reported that they required MCOs to follow some or all of their FFS pharmacy management policies for opioids.
For FY 2017, the vast majority of states (46) reported that naloxone (a prescription opioid overdose antidote) was available in at least one formulation without prior authorization (PA) and most states (42) also covered the naloxone nasal spray formulation without PA. All 49 states that responded to a new question about medication-assisted treatment (MAT) drugs, reported coverage of buprenorphine and both oral and injectable naltrexone, but a somewhat smaller number (36 states) reported coverage of methadone in FY 2017.96
Tables 15 and 16 provide a complete listing of Medicaid benefit changes for FY 2017 and FY 2018. Table 17 provides a list of states that reported copayment actions for FY 2017 and 2018, and tables 18 and 19 provide additional details on Medicaid pharmacy benefit management strategies for opioids and naloxone coverage in FFS programs.
Benefit Changes
The number of states reporting new benefits and benefit enhancements continues to outpace the number of states reporting benefit cuts and restrictions. Twenty-six states reported new or enhanced benefits in FY 2017, and 17 states plan to add or enhance benefits in FY 2018. Fewer states reported benefit cuts or restrictions – six in FY 2017 and five in FY 2018 (Table 15 and Figure 10).
The most common benefit enhancements reported were for mental health and substance use disorder (SUD) services. Exhibit 12 also highlights states implementing other select benefit enhancements for dental, alternative pain therapies, and telemonitoring/telehealth.
Exhibit 12: Select Categories of Benefit Enhancements or Additions
Benefit
FY 2017
FY 2018
Mental Health/Substance Use Disorder Services
9 States
IN, MA, NE, NH, NJ, RI, TX, VA, WI
10 States
CO, HI, IN, MD, NE, NH, OH, UT, VA, WV
Dental Services
5 States
AZ, IN, MD, OR, VT
3 States
AZ, CA, UT
Alternative Pain Therapies (e.g., Chiropractic and Acupuncture)
4 States
CA, DE, OH, OR
2 States
IN, OH
Telemonitoring/ Telehealth Services
2 States
NE, RI
1 State
MD
Nearly half of states that reported expanded mental health and/or SUD services made the changes as part of a new, comprehensive package of services versus a more limited benefit change. States using Section 1115 authority for SUD enhancements include states responding to CMS guidance97 issued in 2015, which describes a new Section 1115 waiver opportunity that supports states’ ability to provide more effective care to Medicaid beneficiaries with an SUD, including the provision of treatment services not otherwise covered under Medicaid. In addition to the dental and telehealth services benefit enhancements noted in Exhibit 12 and Table 16, many states also reported broader initiatives to increase access to dental care/improve oral health outcomes and to increase access to telehealth. See the “Emerging Delivery System and Payment Reform” section of this report for details on these initiatives.
Other key benefit expansions include:
Family planning: Oregon is taking many steps to expand access to family planning services. In FY 2017, it added coverage of pharmacist-prescribed oral contraceptives, becoming (according to the state) the first Medicaid program in the country to do so. In FY 2018, it will cover a one-year supply of birth control pills, and is adding coverage of pharmacist-administered contraceptives (e.g., NuvaRing and Depo-Provera). Additional states adding family planning benefits include New Mexico (adding coverage of long-acting reversible contraceptive services as a separately billable service at Federally Qualified Health Centers and Rural Health Centers in FY 2017) and Nevada (adding coverage for a one-year supply of birth control pills in FY 2018).
Cancer screenings: Four states reported cancer screening-related benefit enhancements. Louisiana and South Dakota added coverage for genetic testing for BRCA98 breast cancer gene mutations in FY 2017, Virginia added coverage for lung cancer screening with low dose computed tomography without prior authorization in FY 2017, and New York added coverage for digital breast tomosynthesis screening services in FY 2018. Louisiana also expanded coverage of breast reconstruction surgery to the contralateral unaffected breast for beneficiaries diagnosed with breast cancer.
Benefit restrictions reflect the elimination of a covered benefit or the application of utilization controls for existing benefits. The most common services restricted were dental services (Connecticut, Nevada, and Wyoming) and non-emergency medical transportation services (Arkansas and Massachusetts); however, most benefit restrictions in FY 2017 or FY 2018 were narrowly targeted. Some states restricting benefits provided exceptions for beneficiaries with mental health conditions or substance use disorders (Massachusetts and Nevada). One additional notable benefit restriction is Utah’s proposal to eliminate Early and Periodic Screening, Diagnostic, and Treatment (EPSDT) coverage for individuals ages 19 to 20 in FY 2018, subject to CMS approval.99
Tables 15 and 16 provide state-level information on benefit changes in FY 2017 and FY 2018.
Copayments
Federal law limits cost-sharing for people with income below 100 percent FPL to “nominal” amounts (defined in federal regulations), with higher amounts allowed for beneficiaries at higher income levels. Certain groups are exempt from cost-sharing, including mandatory eligible children, pregnant women, most children and adults with disabilities, people residing in institutions, and people receiving hospice care. In addition, certain services are exempt from cost-sharing: emergency services, preventive services for children, pregnancy-related services, and family planning services. Also, total Medicaid premiums and cost-sharing for a family cannot exceed 5 percent of the family’s income on a quarterly or monthly basis.100
Most state Medicaid programs require beneficiary copayments, but to varying degrees. Thirteen states reported changes to copayment requirements in either FY 2017 or FY 2018. Details about state actions related to copayments can be found in Table 17 and key changes are described below.
Six states reported new or increased copayment requirements. Key changes include:
Three states (Michigan, New Hampshire, and New Mexico) reported new or increased copayments for enrollees with income above 100 percent of the FPL. In New Mexico, this change also applies to working individuals with disabilities.
Three states (Maine, New Mexico, and Utah) reported new or increased copayments for non-emergency use of a hospital emergency department (ED). (These changes are part of pending Section 1115 waiver requests in Maine101 and Utah.)
Colorado, New Mexico, and Utah are adding or increasing pharmacy copayments. Colorado reported increased copayments for hospital outpatient services.
Seven states reported policies that eliminate or reduce a copayment requirement for some or all covered populations. Key changes include:
Three states (Indiana, North Dakota, and Tennessee) are reducing or eliminating higher copayments for non-emergency use of the ED.
Oregon eliminated copayments for preventive services, Utah decreased inpatient copayments, and Vermont exempted sexual assault-related services from copayments.
TABLE 15: BENEFIT CHANGES IN ALL 50 STATES AND DC, FY 2017 AND FY 2018
States
FY 2017
FY 2018
Enhancements/ Additions
Restrictions/ Eliminations
Enhancements/ Additions
Restrictions/Eliminations
Alabama
Alaska
Arizona
X
X
Arkansas
X
California
X
X
Colorado
X
Connecticut
X
X
Delaware
X
DC
X
Florida
Georgia
Hawaii
X
Idaho
Illinois
Indiana
X
X
Iowa
Kansas
Kentucky
Louisiana
X
X
Maine
Maryland
X
X
Massachusetts
X
X
X
Michigan
X
Minnesota
X
Mississippi
Missouri
Montana
Nebraska
X
X
Nevada
X
X
X
X
New Hampshire
X
X
New Jersey
X
New Mexico
X
New York
X
North Carolina
North Dakota
Ohio
X
X
Oklahoma
X
X
X
Oregon
X
X
Pennsylvania
Rhode Island
X
South Carolina
South Dakota
X
Tennessee
X
Texas
X
Utah
X
X
Vermont
X
Virginia
X
X
Washington
West Virginia
X
X
Wisconsin
X
Wyoming
X
X
Totals
26
6
17
5
NOTES: States were asked to report benefit restrictions, eliminations, enhancements, and additions in FY 2017 and FY 2018. Home and community-based services (HCBS) and pharmacy benefit changes are excluded from this table.SOURCE: Kaiser Family Foundation Survey of Medicaid Officials in 50 states and DC conducted by Health Management Associates, October 2017.
Table 16: States Reporting Benefit Actions Taken in FY 2017 and FY 2018[endnote 239102-31]
State
Fiscal Year
Benefit Changes
Arizona
2017
Adults (+): Add coverage for podiatry services (August 6, 2016).
LTSS Adults (+): Add a $1,000 per year dental benefit for MLTSS beneficiaries (October 1, 2016).
2018
Adults (+): Add a $1,000 per year benefit for emergency dental services (October 1, 2017).
Expansion Adults (-): Eliminate non-emergency medical transportation coverage for expansion adults participating in Employer Sponsored Insurance feature of the Section 1115 waiver renewal (January 1, 2017).
California
2017
All (+): Restore acupuncture services (eliminated in 2009 for most populations excluding children, pregnant women, and nursing facility residents) (July 1, 2016).
Pregnant Women (+): Add licensed midwives to the Comprehensive Perinatal Services Program (July 1, 2016).
2018
All (nc): Reaffirm coverage of non-emergency medical transportation as provided in state law (July 1, 2017).
All (+): Add Health Home services (“My Health GPS”) for beneficiaries with three or more chronic conditions (July 1, 2017).
Hawaii
2018
Adults (+): Expand mental health and substance abuse benefits including addition of intensive case management and tenancy supports for beneficiaries classified as chronically homeless (upon CMS approval).
Indiana
2017
All (+): Add coverage of physician-administered fluoride varnish (January 1, 2017).
All (+): Expand coverage of tobacco dependence treatment (January 1, 2017).
2018
Adults (+): Add coverage of chiropractic spinal manipulation for HIP Plus enrollees (February 1, 2018).
All (+): Add coverage of new substance use disorder treatment services, including expanded inpatient detoxification, additional residential services, addiction-specific outpatient treatment services, peer recovery supports, and relapse prevention (February 1, 2018).
Adults (+): Increase member incentives for healthy behaviors to $200 per initiative, with a total of no more than $300 annually for HIP Basic and HIP Plus enrollees (February 1, 2018).
Kansas
2017
Children (nc): Expand Autism-related services by moving three services from HCBS waiver coverage to State Plan coverage (January 1, 2017).
Kentucky
2018
All (nc): Expand non-emergency medical transportation services to include travel to pharmacies (July 1, 2017).
Louisiana
2017
Pregnant Women (+): Add coverage of mosquito repellant, when prescribed by a physician, for pregnant women and women trying to conceive as a Zika virus prevention measure (July 1, 2016).
All (+): Add coverage of genetic testing for BRCA 1 and BRCA 2 breast cancer gene mutations (July 1, 2016).
All (+): Expand coverage of breast reconstruction surgery to the contralateral unaffected breast for beneficiaries diagnosed with breast cancer (October 1, 2016).
2018
All (+): Expand coverage of preventive services eligible for the one percent increase in federal match under Section 4106 of the ACA (May 1, 2017).
Maryland
2017
Children (nc): Add coverage for Applied Behavioral Analysis services for children with autism spectrum disorder to meet federal requirements (January 1, 2017).
Foster Children (+): Expand coverage for dental services for former foster children up to age 26 (January 1, 2017).
All (+): Add coverage of remote patient monitoring for beneficiaries who meet qualifying medical criteria (January 1, 2018).
Massachusetts
2017
All (+): Expand coverage of substance use disorder treatment services to include residential rehabilitation services and transitional support services (November 4, 2016).
2018
Medicaid Expansion (-): Eliminate coverage of non-emergency transportation services, except for transportation to substance use disorder treatment services for Medicaid expansion beneficiaries (November 1, 2017).
All (+): Add coverage of enhanced “flexible services” as an incentive for beneficiaries to enroll in an ACO (March 1, 2018).
Michigan
2017
Non-expansion Adults (+): Add coverage of preventive services assigned a grade A or B by the United States Preventive Services Task Force (USPSTF) (July 1, 2017).
Minnesota
2017
All (+): Add coverage of kidney transplants under Emergency Medical Assistance to eligible beneficiaries who are currently receiving dialysis services (July 1, 2016).
All (+): Add coverage of gender confirmation surgery (January 1, 2017).
All (+): Add coverage of community emergency medical technician services after discharge from a hospital or nursing home, and for safe home checks (January 1, 2017).
Nebraska
2017
Children (+): Add coverage for Multisystemic Therapy/Family Functional Therapy (July 1, 2016).
All (+): Add coverage of telehealth services, including telemonitoring and originating site fee (January 1, 2017).
2018
All (+): Add coverage of nutrition services (July 1, 2017).
All (+): Add coverage of peer support services (July 1, 2017).
Nevada
2017
All (-): Reduce coverage of targeted case management services, to 10 hours in the initial month and five hours in the following three consecutive calendar months for adults without serious mental illness and children without serious emotional disturbance (February 23, 2017).
All (+): Added coverage for paramedicine services (July 1, 2016).
Non-expansion Beneficiaries (-): Limit coverage of case management services with additional prior authorization requirements (July 1, 2017).
All (+): Add coverage of one-year supply of birth control pills (July 1, 2017).
New Hampshire
2017
Non-expansion Adults (+): Expand coverage of substance use disorder treatment services, to include assessment, outpatient services, residential treatment, opioid treatment programs, recovery support services, and recovery monitoring (July 1, 2016).
2018
Children (+): Expand coverage of behavioral health services for children with serious emotional disturbance (January 1, 2018).
New Jersey
2017
Non-expansion Adults (+): Expand substance use disorder benefit to align with the state’s Alternative Benefit Package for Medicaid expansion beneficiaries (July 1, 2016).
New Mexico
2017
All (+): Add coverage of long-acting reversible contraception services as a separately billable service at FQHCs and RHCs (September 1, 2016).
All (+): Add coverage of medication monitoring services by nurses and physician assistants (January 1, 2017).
Pregnant Women (nc): Add coverage of licensed birthing centers as a new provider type to meet federal requirements (February 25, 2017).
New York
2018
Children (+): Add coverage of pasteurized donor human breast milk for infants <1500 grams (April 1, 2017).
All (+): Add coverage of continuous glucose monitoring devices for beneficiaries with Type 1 diabetes (September 1, 2017).
All (+): Add coverage of digital breast tomosynthesis (DBT) screening services (September 1, 2017 for FFS and November 1, 2017 for managed care).
All (+): Add limited infertility benefit for women between the ages of 21 to 44 (September 1, 2017, pending CMS approval).
North Dakota
2017
Children (nc): Add coverage for Applied Behavioral Analysis services for children with autism spectrum disorder to meet federal requirements (June 1, 2017).
Ohio
2017
All (+): Add coverage of acupuncture services (January 1, 2017).
2018
All (+): Expand coverage of behavioral health services to include assertive community treatment for adults, family counseling, intensive home-based treatment for youth at risk of out-of-home placement, and primary care services delivered by a behavioral health provider (January 1, 2018).
All (+): Expand provider types who may provide acupuncture services (October 1, 2017).
Oklahoma
2017
Children (+): Mandate polycarbonate lenses for children (September 1, 2016).
Pregnant Women (-): Limit high-risk obstetrical services, such as quantity limits on ultrasounds (September 1, 2016).
All (+): Provide coverage of non-emergency medical transportation services for additional passengers (October 1, 2016).
Children (+): Remove barriers to receiving school-based services for children with IEPs (November 1, 2016).
Adults (+): Restore previously cut restorative dental benefits (relaxed limitation criteria for dentures; coverage for crowns; scaling and planning) (July 1, 2016).
Adults (+): Expand coverage for alternative back pain therapies including acupuncture, chiropractic manipulation, and yoga (July 1, 2016).
Children (nc): Added coverage for Applied Behavioral Analysis services for children with autism spectrum disorder to meet federal requirements (July 1, 2016).
All (+): Add coverage of pharmacist-prescribed oral contraceptives, as permitted under state law (January 1, 2017).
2018
All (+): Add coverage of one-year supply of birth control pills and pharmacist-administered contraceptives (i.e., NuvaRing and Depo-Provera) (January 1, 2018).
All (+): Add coverage of other pharmacist-prescribed medications (TBD), as permitted under state law (January 1, 2018).
Rhode Island
2017
All (+): Add coverage for home stabilization services.
All (+): Add coverage for telehealth services in new managed care contracts.
Adults (+): Implement the Sobering Treatment Opportunity Program (STOP), an ER diversion pilot in Providence that will cover an overnight stay and referral to appropriate counseling for beneficiaries with chronic alcohol dependence who are homeless.
South Carolina
2018
Children (nc): Add autism spectrum disorder services to the State Plan for eligible beneficiaries up to age 21 to meet federal requirements (July 1, 2017).
South Dakota
2017
Adults (+): Add coverage of genetic testing for BRCA breast cancer gene mutations (July 1, 2016).
Tennessee
2017
Adults (-): Limit Allergy Immunotherapy to clinical practice guidelines (July 1, 2016).
Texas
2017
Children (+): Add coverage for family therapy without the patient present as a benefit for children under age 21 (January 1, 2017).
Children (+): Add coverage for Prescribed Pediatric Extended Care Centers for medically fragile children receiving extensive private duty nursing services at home, up to 12 hours (July 1, 2017).
Utah
2018
All (+): Add coverage of screening, brief intervention, and referral to treatment services (July 1, 2017).
Aged, Blind or Disabled (+): Add coverage of dental services for the blind and disabled (July 1, 2017).
Adults (-): Eliminate EPSDT coverage for parents and childless adults age 19 to 20 (effective the later of January 1, 2018, or upon CMS approval).
Vermont
2017
All (+): Allow licensed dental hygienists to bill Medicaid directly (July 1, 2016).
Virginia
2017
All (+): Expand coverage of addition recovery treatment services, including residential treatment, day treatment/partial hospitalization, intensive outpatient treatment, medication-assisted treatment, substance use case management, inpatient detoxification, inpatient substance use disorder treatment, and residential or inpatient substance use disorder treatment in an institution of mental disease with greater than 16 beds (April 1, 2017).
All (+): Add coverage of lung cancer screening with low dose computed tomography without prior authorization (January 1, 2017).
2018
Traditional Beneficiaries (+): Add coverage for peer support services for beneficiaries with serious mental illnesses and/or substance use disorders (July 1, 2017).
Limited Adult Coverage Group (+): Expand coverage of addiction recovery and treatment services and add coverage for peer support services for beneficiaries with serious mental illnesses and/or substance use disorders (October 1, 2017).
West Virginia
2017
All (+): Expand coverage of Hepatitis C antiviral agents with a revised clinical policy (April 1, 2017).
2018
All (+): Expand coverage of substance use disorder services, including services provided by institutions for mental disease, peer recovery support services, and Naloxone treatment (January 1, 2018).
Wisconsin
2017
All (+): Add licensed midwives as an allowable Medicaid provider (January 1, 2017).
All (+): Add coverage of residential substance abuse treatment through comprehensive community service programs (May 1, 2017).
Wyoming
2017
All (+): Add coverage for dietician services (July 1, 2016).
Aged, Blind and Disabled (-): Reduce nursing facility bed-hold days (October 1, 2016).
Aged, Blind and Disabled (-): Limit behavioral health, therapy, and home health services by imposing soft caps (January 1, 2017).
Adults (-): Eliminate coverage of dental services.
Table 17: Copayment Actions Taken in the 50 States and DC, FY 2017 and FY 2018[endnote 239102-32]
State
Fiscal Year
Copayment Changes
Colorado
2018
Increase: Increase pharmacy copayment to $3.00 per prescription for all non-exempt eligibility groups (1/1/2018).
Increase: Double the hospital outpatient copayments for all non-exempt eligibility groups (1/1/2018).
Delaware
2018
Decrease: Treatment of pre-eligibility medical expenses in determining post eligibility cost of care contribution for LTSS population; “look-back” period expanded from 30 days to 90 days. Potential to reduce the monthly “patient pay” amount (effective date dependent on SPA approval).
Indiana
2018
Decrease (for HIP 2.0 expansion population): Eliminating the graduated copayment for non-emergent ER use (2/1/2018).
Maine
2018
New: Maine’s Section 1115 waiver would impose a copay on all populations for non-emergent use of the ED. (Dual eligibles, those in institutions and a few other groups are exempt.)
Michigan
2017
Increase (for adult enrollees with incomes between 100% and 133% FPL): Increase in prescription, hospital, and office visit copays. Copays were doubled (4/1/2017).
New Hampshire
2018
Increase (for adult enrollees with incomes between 100% and 133% FPL): Increase in Copayments for Inpatient Hospital, Primary and BH Care, Imaging, X-rays, and PT/OT Services (1/1/2018).
New Mexico
2018
New (for most populations): Copays for brand-name prescriptions when there is a less expensive generic equivalent medicine available (1/1/2018).
New (for most populations): Copays for non-emergency use of the emergency department (1/1/2018).
New (for Working Disabled, Adult expansion group with income above 100% FPL): New copayments for outpatient office visits (excluding behavioral health), inpatient stays, outpatient surgeries, and pharmacy (1/1/2018).
North Dakota
2017
Elimination (for all Medicaid groups): Higher copayment for non-emergency use of the ER was eliminated (1/1/2017).
Oregon
2017
Elimination (for all Medicaid groups): Copayments were eliminated for preventive services, office visits, and pharmacy (1/1/2017).
Tennessee
2017
Decrease (for waiver-eligible children): Copayment for non-emergency use of the ER was reduced from $10 to $8.20 (12/16/2016).
Utah
2018
Decrease: Inpatient copayments will be reduced to comply with federal maximum (date TBD).
Increase: Outpatient copayments are being increased for all but children and pregnant women (date TBD).
Increase (for current enrollees and childless adults): Establish a $25 copay for non-emergency use of the ER (1/1/18).
Increase: Increase pharmacy copayments.
Vermont
2017
Decrease: Remove copays for sexual assault-related services for all Medicaid groups (10/1/2016).
West Virginia
2018
Neutral: Changing from a tiered copayment based on cost to $1 generic and $3 brand (date TBD).
Prescription Drug Utilization and Cost Control Initiatives
Almost all states have implemented aggressive strategies to slow Medicaid spending growth for prescription drugs, including preferred drug lists (PDLs), supplemental rebate programs, and state maximum allowable cost programs. In recent years, however, a disproportionate increase in prescription drug costs relative to overall spending has heightened state attention on pharmacy reimbursement and coverage policies. In this year’s survey, states reported a variety of actions in FY 2017 and FY 2018 to refine and enhance their pharmacy programs, including actions to react to new and emerging specialty and high-cost drug therapies.
Pharmacy Cost Drivers
This year’s survey asked states to identify the biggest cost drivers that affected growth in total pharmacy spending102 (federal and state) in FY 2017 and projected for FY 2018. Consistent with the results of the 2015 and 2016 surveys, most states identified specialty and high cost drugs as the most significant cost driver, with many states pointing specifically to hepatitis C antivirals. For these drugs, high costs are attributable to the high per prescription cost as well as increased utilization. Two states (Georgia and Tennessee) noted that they are seeing hepatitis C antiviral costs moderating (although costs remain high compared to other drugs). Other specialty drugs, behavioral health, and/or substance use disorder drugs were cited as cost drivers, and some specific drug classes (such as hemophilia factor, oncology drugs, and diabetes products) were also identified as major cost drivers. For FY 2018, several states also cited a new spinal muscular atrophy drug (Spinraza), priced at $125,000 a dose, or $750,000 for the first year and $375,000 per year thereafter for life (due to fewer doses per year).
Medicaid Covered Outpatient Drug Final Rule
State Medicaid programs historically reimbursed pharmacies for the “ingredient cost” of each prescription using an Estimated Acquisition Cost (EAC), plus a dispensing fee.103 The new federal Covered Outpatient Drug final rule104 replaced EAC with “Actual Acquisition Cost” (AAC) and required states to provide a “professional dispensing fee” that reflects the pharmacist’s professional services and costs to dispense a drug to a Medicaid beneficiary. States can determine their own AAC prices or use the pricing files published and updated weekly by CMS – the “National Average Drug Acquisition Costs” (NADACs) – which are derived from outpatient drug acquisition cost surveys of retail community pharmacies.105 Some states had already transitioned to an AAC methodology prior to the issuance of the final rule, but all other states were required to come into compliance by April 1, 2017. The new methodology generally results in lower ingredient cost reimbursement but higher dispensing fees.–This year’s survey asked states whether implementation of the rule’s AAC and professional dispensing fee requirements was expected to result in budget savings or greater costs, or be budget neutral. Most states reported that implementation of the rule was expected to have a budget neutral impact (16 states) or result in savings (12 states). Fourteen states reported an expectation of greater costs.106 Several states reported adoption of an AAC methodology prior to FY 2017 (8 states), and one of these states (Idaho) commented that it was continuing to achieve savings as a result of Medicaid provider rate changes and provider taxes and fees in place in FY 2017 and FY 2018. For purposes of this report, implementation of the Covered Outpatient Drug final rule is not counted as a cost containment action because it is an implementation of a federal regulatory requirement.
Pharmacy Cost Containment Actions in FY 2017 and FY 2018
Almost all states had prescription drug cost containment policies (including prior authorization requirements and PDLs) in place prior to FY 2017, and most are constantly refining and updating these policies. Although states may not have reported every refinement or routine change in this year’s survey, 37 states in FY 2017 and 36 states in FY 2018 reported implementing or making changes to a wide variety of cost containment initiatives in the area of prescription drugs, comparable to the number of states taking such actions in recent years. By far the most frequently cited action was the application of new or expanded utilization controls (e.g., prior authorization requirements, clinical edits, and quantity limits) reported by 32 states in FY 2017 and 29 in FY 2018. Sixteen states in FY 2017 and 17 in FY 2018 also reported new or expanded initiatives to generate greater rebate revenue, including New York which is implementing a new state law in FY 2018 that applies a cap on Medicaid drug expenditures as a separate component of the global state Medicaid spending cap that the state has had in place since 2011. If the state determines that drug spending will exceed the annual growth limit, the Commissioner of the Department of Health may identify and refer drugs to the Drug Utilization Review (DUR) Board for a recommended target supplemental rebate.
Other frequently cited newly implemented or expanded pharmacy cost containment actions were:
Provider education or profiling initiatives (14 states in FY 2017 and 16 in FY 2018)
Initiatives to reduce pharmacy-related fraud, waste, and abuse (13 states in FY 2017 and 14 in FY 2018)
Medication therapy management programs (8 states in FY 2017 and 7 in FY 2018)
Managed Care’s Role in Delivering Pharmacy Benefits
Since the passage of the ACA, states have been able to collect rebates on prescriptions purchased by managed care organizations (MCOs) operating under capitated arrangements. As a result, many states have chosen to “carve in” the pharmacy benefit to their managed care benefits. As more states have enrolled additional Medicaid populations into managed care arrangements over time, and as Medicaid enrollment has increased due to ACA coverage expansions, MCOs have played an increasingly large role in administering the Medicaid pharmacy benefit. In this year’s survey, states with MCO contracts were asked whether pharmacy benefits were covered under those contracts as of July 1, 2017.
Of the 39 states contracting with comprehensive risk-based MCOs, 35 states reported that the pharmacy benefit was “generally carved-in (with possible exceptions)” including Nebraska that completed a full pharmacy carve-in during FY 2017 and Indiana that completed a pharmacy carve-in for its Hoosier Healthwise program (for low-income pregnant women and children) in FY 2017. Among the states that carved drugs into MCOs, several reported carve-outs for selected drug classes. The most common drugs carved out were behavioral health drugs and HIV drugs (California, Maryland, and Michigan), hemophilia clotting factor (California, Florida, Michigan, and New Hampshire), and hepatitis C antivirals (Colorado, Massachusetts, Michigan, New Hampshire, South Carolina, and Texas). New York reported, however, that it reversed its carve-out of hemophilia clotting factor in July 2017.
Four states (Missouri, Tennessee, West Virginia, and Wisconsin) reported that the pharmacy benefit was “generally carved-out,” including West Virginia that completed a full carve-out as of July 2017. While Wisconsin noted that pharmacy was carved into its Family Care Partnership program (an integrated health and long-term care program for frail elderly and people with disabilities), the state noted that this program had a very small enrollment (approximately 3,000 as of July 2017107 ) and that all other Wisconsin Medicaid enrollees received their pharmacy benefit through the FFS delivery system.
Prior reports show that nearly all states use prior authorization and PDLs in FFS programs. This year’s survey asked whether MCOs were required (in FY 2017) or would be required (in FY 2018) to adhere to uniform clinical protocols (state prescribed medical necessity criteria) for one or more drugs or a uniform PDL (state prescribed requirements for designating a specified drug product as either preferred, meaning covered without the need to obtain prior authorization, or non-preferred). This means that to the extent states impose these policies in FFS, the same policies would apply in managed care. Compared to last year’s survey, there was a notable increase in the number of states with uniform clinical protocols in place and a modest increase in the number of states that reported having a uniform PDL requirement in place. States were also asked whether MCO contracts included risk-sharing provisions for one or more drugs (e.g., risk corridors, risk pools, reinsurance, etc.), a new question not included in last year’s survey (Exhibit 13).
Exhibit 13: Managed Care Pharmacy Policies
Policy
In Place in FY 2017
FY 2018 Changes
New
Expanded
Uniform Clinical Protocols(1 or more drugs)
28 States
CA, DC, DE, GA, HI, IA, IL, IN, KS, KY, MA, MD, MI, MS, NE, NJ, NM, NV, NY, OH, OR, PA, RI, TX, UT, VA, WA, WV*
3 States
LA, ND, VA
7 States
DE, KY, MA, NV, OH, PA, WA
Uniform PDL(1 or more drug classes)
15 States
AZ, DE, FL, IA, KS, LA, MN, MS, NE, NV, OR, TX, UT, WA, WV*
4 States
IL, ND, OH, VA
2 States
LA, WA
Risk-sharing (for 1 or more drugs)
15 States
AZ, CA, DE, FL*, HI, IN, KS, MA, NM, NV, OH, OR, PA, RI, VA
0 States
5 States
DE, HI, IN, MA, SC
* WV removed the pharmacy benefit from its MCO contracts July 1, 2017. FL discontinued hepatitis C kick-payments in August 2017.
Uniform clinical protocols and PDL requirements reported by states were often limited to one or a few specific drug classes. Hepatitis C antivirals were the most commonly mentioned drug class targeted by uniform clinical protocols (reported by DC, Georgia, Hawaii, Illinois, Maryland, New Jersey, New Mexico, Oregon, Rhode Island, Pennsylvania, and Virginia) and were also reported as a specific focus of uniform PDL requirements in Minnesota and Oregon. Strategies reported by states to mitigate or share financial risk with MCOs for certain high cost drugs included selected drug carve-outs, risk corridors, kick payments,108 and risk pools, and were most commonly applied to hepatitis C antivirals, but in some cases were applied to drugs above a certain dollar threshold (Hawaii), cystic fibrosis drugs (Pennsylvania), and hemophilia clotting factor (Delaware). Two states also commented that new risk-sharing arrangements were currently under consideration for a new spinal muscular atrophy drug and one state was considering a risk sharing arrangement for a Duchenne muscular dystrophy drug.
Opioid Harm Reduction Strategies
According to the Centers for Disease Control and Prevention (CDC), drug overdose deaths continue to increase in the United States and the majority of these deaths (six out of ten) involve an opioid (including prescription opioids and heroin).109 The CDC cites the amount of prescription opioids sold in the United States – which have nearly quadrupled since 1999 – as a driving factor in opioid overdose deaths, which have more than quadrupled since 1999.110Medicaid plays an important role in addressing the epidemic, covering 3 in 10 people with opioid addiction in 2015 and facilitating access to a number of addiction treatment services.111 In a January 2016 Informational Bulletin,112 CMS highlighted the important role state Medicaid programs can play to help address the opioid epidemic in their states by encouraging safer opioid alternatives for pain relief, working with other state agencies to educate Medicaid providers on best practices for opioid prescribing, employing pharmacy management practices (PDL placement, clinical criteria, prior authorization, quantity limits, etc.) and working to increase access to naloxone, an overdose antidote. In this year’s survey, we asked states about their pharmacy benefit strategies for preventing opioid harm in place in FY 2017 and planned for FY 2018 and their coverage of certain medication-assisted treatment (MAT) medications.
CDC Opioid Prescribing Guidelines
This year’s survey shows a growing number of states choosing to adopt the CDC guidelines for the prescribing of opioid pain medications for adults in primary care settings.113 Both last year and this year, the survey asked states if their Medicaid program has adopted or is planning to adopt these guidelines in their FFS programs or as a requirement for MCOs to adopt. As shown in Exhibit 14 below, 34 states reported adoption or plans for adoption in FY 2018 for their FFS programs (compared to 21 states in last year’s survey). Of the 39 states with MCO contracts, 18 states reported requiring MCOs to adopt the CDC guidelines or plans to do so in FY 2018 (compared to 11 states in last year’s survey). Many other states indicated that these policies were under review for FFS and MCOs.
Exhibit 14: Number of States Adopting CDC Opioid Prescribing Guidelines
Status
For FFS
As a requirement for MCOs to adopt
Yes, have adopted
23 States
AR, AZ, CT,* FL, ID, IN, KY, LA, MA, ME, MS, NE, NH, NV, NY, OR, PA, TN, TX,* VA, VT, WA,* WV
8 States
IN, KY, LA, MS, NE, NH, VA, WA,
Plan to adopt in FY 2018
11 States
DC, GA, IA, KS, MD, MN, MO, MT, NC, NM, SC
10 States
DC, DE, IA, KS, MA, MD, MN, NV, PA, SC
* CT and TX reported adoption of part, but not all, of the CDC guidelines. WA indicated that its state statutory prescribing guidelines include a Morphine Equivalent Dose (MED) limit (110 mg) that differs from the CDC limit (90 mg).
States were also asked to describe any implementation challenges related to the CDC guidelines. The most commonly reported challenge was the inability of a state’s claims processing system to apply the Morphine Equivalent Dose (MED) limit across multiple products and multiple prescription claims. Other reported challenges included obtaining stakeholder consensus and support (including providers); titrating dosages downward for patients who have been stabilized on higher dosages; and the inability to control or enforce appropriate prescribing behavior. One state also expressed concern that the CDC’s MED limit is too low and could have the unintended consequence of driving up heroin use and overdoses. A few states reported having state guidelines already in place that were aligned with the CDC guidelines.
Medicaid Pharmacy Benefit Management Strategies
The January 2016 CMS Informational Bulletin highlighted Medicaid pharmacy benefit management strategies for preventing opioid-related harms.114 The survey asked states to report strategies that were in place in FY 2017 for FFS and changes to these strategies planned for FY 2018. Specifically, the survey asked about the following strategies: opioid quantity limits,115 clinical criteria claim system edits116 (subject to prior authorization (PA) override), step therapy PA criteria,117 other PA requirements for opioids, and requirements that prescribers check the state’s Prescription Drug Monitoring Program (PDMP) before prescribing opioids.118 All but one state reported having at least one of these opioid-focused pharmacy management policies in FFS in place in FY 2017, and nearly three-quarters of states (37) plan to take at least one action in FY 2018 to newly implement or increase opioid controls through one of these strategies. See Exhibit 15 and Table 18 for details on states implementing or expanding these controls.
Exhibit 15: States Implementing Opioid-Focused Pharmacy Benefit Management Strategies in FFS
Strategy
In Place in FY 2017(# of states)
FY 2018 (# of states)
New
Expanded
Quantity Limits
48
3
26
Clinical criteria claim system edits (subject to Prior Authorization override)
46
1
21
Step Therapy PA criteria
34
1
6
Other Prior Authorization
32
5
14
Required use of Prescription Drug Monitoring Programs
28
6
3
For states that use MCOs to deliver pharmacy benefits, the survey asked whether, as of July 1, 2017, the MCOs were required to follow the state’s FFS pharmacy benefit management policies for opioids. Of the 35 states with MCOs that deliver pharmacy benefits, 12 states responded “yes” and 12 states responded “yes, in part.” Of the 12 states answering “yes in part,” a few indicated that their MCOs were in the process of coming into alignment with the state’s FFS policies. One state indicated that MCOs may conduct additional maximum dose and quantity reviews; one state reported that MCOs must adopt the FFS management strategies but have some latitude in preferred drug selection and specific clinical criteria, and one state reported that MCOs may provide additional naloxone coverage without prior authorization and/or naloxone atomizers.
Other Pharmacy Management Strategies
A few states mentioned other pharmacy management strategies in use or planned including the following:
Day limits were applied by Arizona and Utah (no more than seven days for the initial fill of any prescription opioid), Colorado (seven-day supply limit for opioid naïve patients), and Vermont (seven-day limit applied for adults and a three-day limit applied for children).
MED limits were applied or lowered in Colorado, Maryland, and Vermont, and Connecticut implemented an “MME calculator” to provide prescribers with a MME (morphine milligram equivalent) calculation at the point of service.
Maryland reported a new requirement for prescriber attestations (checked PDMP, drug urine test, offered naloxone, pain management contract).
Nevada and DC reported pharmacy lock-in programs.119
Oregon reported expanding access to medication-assisted treatment drug by ending its lock-in program for Suboxone.
Access to Naloxone
Naloxone is a prescription opioid overdose antidote that prevents or reverses the life-threatening effects of opioids including respiratory depression, sedation, and hypotension. There are three FDA-approved formulations of naloxone: an injectable formulation offered as a generic; a brand, prefilled auto-injection formulation (approved in 2014) designed for use by persons without medical training (Evzio); and a brand prepackaged nasal spray (approved in 2015) (Narcan).120 All formulations have experienced significant price increases in recent years; most notably, the list price for the auto-injection formulation increased from $690 in 2014 to $4,500 in 2016.121 In this year’s survey, states were asked whether the various naloxone formulations were available without a prior authorization (PA) in their Medicaid programs in FY 2017 and whether any changes were planned for FY 2018. States were also asked if naloxone coverage was provided for family members and friends obtaining prescriptions on an enrollee’s behalf. See Exhibit 16 and Table 19 for details on state naloxone pharmacy benefit management strategies.
A number of states commented that the auto-injector manufacturer (Evzio) had ended its participation in the federal drug rebate program for this product which allows states to eliminate all Medicaid coverage of this product (with or without PA). Of the 10 states reporting coverage of Evzio without PA in FY 2017, one state reported plans to move the Evzio to non-preferred status in FY 2018 (subject to PA) and three states indicated all coverage would be eliminated.
Exhibit 16: States Implementing Naloxone Pharmacy Benefit Management Strategies in FFS
Strategy
In Place in FY 2017 (# of states)
FY 2018 (# of states)
New
Expanded
Naloxone available in at least one formulation without prior authorization (PA)
46
1
1
Naloxone nasal spray covered without PA
42
0
1
Naloxone nasal spray atomizer covered without PA
20
0
0
Naloxone auto-injector covered without PA
10*
0
0
Naloxone coverage provided for family members and friends obtaining prescriptions on enrollee’s behalf
11
0
0
* Three of these states (LA, MD, and MN) reported ending coverage of naloxone auto-injectors in FY 2018 and one state (NV) changed to non-preferred status.
Medication-Assisted Treatment
The ACA requires state Medicaid programs to provide coverage for treating substance use disorders (SUDs) for their ACA expansion populations, but does not specify which SUD services must be included. This requirement has bolstered states’ work to respond to the opioid epidemic. The standard of care for opioid use disorder is medication-assisted treatment (MAT), which combines psychosocial treatment with medication.122 Compared to psychosocial treatment alone, MAT is associated with greater adherence to treatment, decreased opioid use, and reduced likelihood of overdose fatalities.123 The FDA has approved the following medications that can be used as part of MAT for opioid use disorder: methadone, buprenorphine, and both oral and extended-release injectable naltrexone.124 In this year’s survey, states were asked whether they covered each of these drugs (when used to treat opioid use disorders) or planned to add coverage in FY 2018. All 49 states that responded reported coverage of buprenorphine and both oral and injectable naltrexone, but a somewhat smaller number (36 states) reported coverage of methadone in FY 2017.125 However, one state reported plans to add coverage for methadone in FY 2018 (Indiana) and five states reported that methadone coverage was under consideration (Kentucky, Louisiana, North Dakota, South Carolina, and West Virginia). Seven states (Alabama, Idaho, Iowa, Nebraska, Tennessee, Texas, and Wyoming) reported no coverage or plans to add coverage for Methadone.
TABLE 18: MEDICAID FFS PHARMACY BENEFIT MANAGEMENT STRATEGIES FOR OPIOIDS IN ALL 50 STATES AND DC, IN PLACE IN FY 2017 AND ACTIONS TAKEN IN FY 2018
States
Opioid Quantity Limits
Clinical Edits in Claim System
Opioid Step Therapy Requirements
Other Prior Authorization Requirements for Opioids
Required use of Prescription Drug Monitoring Programs
Any Opioid Management Strategies
In place FY 2017
New/Exp FY 2018
In place FY 2017
New/Exp FY 2018
In place FY 2017
New/Exp FY 2018
In place FY 2017
New/Exp FY 2018
In place FY 2017
New/Exp FY 2018
In place FY 2017
New/Exp FY 2018
Alabama
X
X
X
X
X
X
Alaska
X
X
X*
X
X
Arizona
X
X
X
X
X
X
X
X
X
Arkansas
X
X
X
X
X
X
X
California
X
X
X
X*
X
X
Colorado
X
X
X
X
X
Connecticut
X
X
X
X
Delaware
X
X
X
X*
X
X
X
DC
X
X
X
X*
X
X
X
Florida
X
X
X
X
X
X
X*
X
X
Georgia
X
X
X
X
X
X
Hawaii
X*
X*
Idaho
X
X
X
X
X
X
X
X
Illinois
X
X
X
X
X
Indiana
X
X
X
X
X
Iowa
X
X
X
X
X
X
X*
X
X
X
Kansas
X
X
X
X
X
X
X
X
Kentucky
X
X
X
X
X
X
X
X
X
Louisiana
X
X
X
X
X
X
X
X
X
X
Maine
X
X
X
X
X
X
Maryland
X
X
X*
X
X
X*
X
X
Massachusetts
X
X
X
X
X
X
X
X
Michigan
X
X
X
X
X
X
X*
X
X
Minnesota
X
X
X
X
X
X
X
X
Mississippi
X
X
X
X
X
X
X
X
Missouri
X
X
X
X
X
X
X
Montana
X
X
X
X
X
X
X
X
X
Nebraska
X
X
X
X
X
Nevada
X
X
X
X*
X
X
New Hampshire
X
X
X
X
X
X
New Jersey
X
X
X
New Mexico
X
X
X
New York
X
X
X
X
X
X
X
X
North Carolina
X
X
X
X
X
X
X
X
X
X
North Dakota
X
X
X
X
X
X
X
X
X
X
X
Ohio
X
X
X
X
X
X
X
X
X
X
Oklahoma
X
X
X
X
X
X
Oregon
X
X
X
X
X
X
X*
X
X
X
Pennsylvania
X
X
X
X
X
X
X
X
X
Rhode Island
X*
X
X
X
X
X
X
X*
X
X
South Carolina
X
X
X
X
X
X
X
X
South Dakota
X
X
X
X
Tennessee
X
X
X
X
X
X
X
X
X
X
Texas
X
X
X
X
X*
X
X
Utah
X
X
X
X
Vermont
X
X
X
X
X
X
X
X
Virginia
X
X
X
X
X
X
X
X
X
Washington
X*
X
X
X
West Virginia
X
X
X
X
X
X
Wisconsin
X
X
X
X
X
X
X
Wyoming
X
X
X
X
X
X
Totals
48
29
46
22
34
7
32
19
28
9
50
37
NOTES: States were asked to report whether they had select pharmacy benefit management strategies in place in their FFS programs in FY 2017, and/or had plans to adopt or expand these strategies in FY 2018. “*” indicates that a policy was newly adopted in FY 2018, meaning that the state did not have any policy in that category/column in place in FY 2017.SOURCE: Kaiser Family Foundation Survey of Medicaid Officials in 50 states and DC conducted by Health Management Associates, October 2017.
TABLE 19: MEDICAID FFS PHARMACY BENEFIT MANAGEMENT STRATEGIES FOR NALOXONE IN ALL 50 STATES AND DC, IN PLACE IN FY 2017 AND ACTIONS TAKEN IN FY 2018
States
Naloxone Available ‒ At Least One Formulation Without PA
Naloxone Nasal Spray Covered Without PA
Naloxone Nasal Atomizer Covered Without PA
Naloxone Auto-Injectors Covered Without PA
Naloxone Covered for Family/Friends Obtaining Scripts on Enrollee’s Behalf
Any Naloxone Strategies
In place FY 2017
New/Exp in FY 2018
In place FY 2017
New/Exp in FY 2018
In place FY 2017
New/Exp in FY 2018
In place FY 2017
New/Exp in FY 2018
In place FY 2017
New/Exp in FY 2018
In place FY 2017
New/Exp in FY 2018
Alabama
X
X
X
Alaska
X
X
X
X
Arizona
X
X
X
X
Arkansas
X
X
California
X
X
X
Colorado
X
X
X
X
Connecticut
X
X
X
X
X
Delaware
X
X
DC
X*
X
Florida
X
X
X
X
X
Georgia
X
X
Hawaii
Idaho
X
X
X
X
Illinois
Indiana
X
X
X
X
X
Iowa
X
X
X
X
Kansas
X
X
X
Kentucky
X
X
X
X
Louisiana
X
X
X
X
X
Maine
Maryland
X
X
X
X
X
Massachusetts
X
X
X
X
X
Michigan
X
X
X
X
Minnesota
X
X
X
X
X
Mississippi
X
X
X
Missouri
X
X
X
X
X
Montana
X
X
X
Nebraska
X
X
X
Nevada
X
X
X
X
X
X
New Hampshire
X
X
X
X
New Jersey
X
X
X
X
X
X
New Mexico
X
X
X
X
X
X
New York
X
X
X
X
North Carolina
X
X
X
X
X
North Dakota
X
X
X
Ohio
X
X
X
Oklahoma
X
X
X
Oregon
X
X
X
X
Pennsylvania
X
X
X
X
Rhode Island
X
X
X
X
South Carolina
X
X
X
X
South Dakota
X
X
X
Tennessee
Texas
X
X
X
X
Utah
X
X
X
Vermont
X
X
X
X
Virginia
X
X
X
Washington
X
X
X
X
West Virginia
X
X
X
Wisconsin
X
X
X
X
Wyoming
X
X
X
Totals
46
2
42
1
20
0
10
0
11
0
46
3
NOTES: States were asked to report whether they had select pharmacy benefit management strategies in place in their FFS programs in FY 2017, and/or had plans to adopt or expand these strategies in FY 2018. “*” indicates that a policy was newly adopted in FY 2018, meaning that the state did not have any policy in that category/column in place in FY 2017. Three states (LA, MD, and MN) reported ending coverage of naloxone auto-injectors in FY 2018 and one state (NV) changed to non-preferred status.SOURCE: Kaiser Family Foundation Survey of Medicaid Officials in 50 states and DC conducted by Health Management Associates, October 2017.
Report: Administrative Challenges, Priorities, And Conclusion
Challenges and Priorities in FY 2018 and Beyond Reported by Medicaid Directors
As one Medicaid director noted, “this is an extremely difficult and challenging time for Medicaid directors.” In FY 2018, the normal challenges of administering a complex program that consumes a large share of the state’s budget have been exacerbated by the uncertainty generated by debates at the federal level regarding the future of Medicaid policy and financing. The challenge of continuing to move forward on state level initiatives under these circumstances was echoed by a number of states. States therefore reported pressing ahead on a wide variety of priorities for FY 2018 and beyond, including: pursuing new Section 1115 demonstration waivers; implementing payment and delivery system reform initiatives; enhancing access to and delivery of behavioral health services, with a specific focus on tackling the opioid epidemic; implementing long-term services and supports reforms and improvements; and executing major systems projects.
Federal Legislative Proposals
ACA Medicaid Expansion
This year’s survey was conducted as Congress debated proposals to repeal major portions of the ACA, including the ACA’s Marketplace and Medicaid coverage expansions, as well as other proposals to fundamentally restructure Medicaid’s financing structure. The survey asked states about the implications of these proposals.
Most Medicaid directors from the 32 ACA Medicaid expansion states reported that they would not be able to continue covering the expansion population, or that coverage would be at substantial risk, if the ACA enhanced federal match for this population were terminated. These coverage losses would increase the number of uninsured. Medicaid directors also pointed to budget gaps and broader state economic consequences as well as increases in uncompensated care for hospitals and FQHCs without the expansion. A number of directors also highlighted the potential negative impacts on access to behavioral health services (especially, states’ ability to address the opioid epidemic). Directors also noted the difficulty of rolling back the expanded behavioral health services and delivery system changes that have been implemented in conjunction with the Medicaid coverage expansion. Two directors (from Minnesota and New York) also noted that coverage under their Basic Health Plans would also be at risk if the ACA were repealed. A few non-expansion state Medicaid directors reported that expansion discussions were currently on hold, or had been delayed, by the ongoing federal reform debate.
Proposed Federal Medicaid Financing Reforms
Federal legislative proposals under debate at the time of the survey called for fundamental changes in Medicaid financing by converting the current open-ended matching structure to a capped financing program under a per capita cap or block grant designed to ensure federal savings.
Almost all Medicaid directors expressed concern about the likely negative fiscal consequences tied to proposed limits on federal Medicaid spending. Medicaid directors were concerned about budget shortfalls and the potential need to make program cuts and reductions (e.g., to provider rates, optional benefits, and optional eligibility pathways) as they anticipated that inflation factors included in the proposals would not be adequate to cover projected costs, particularly for new and expensive pharmaceuticals and medical treatments, growth in the aging population who have greater needs for LTSS, or public health emergencies. A number of directors expressed concern that the caps would not account for current and past state efforts, including LTSS rebalancing and movement to risk-based managed care that have helped to contain program costs but would ultimately depress a state’s base year amount used to calculate state federal funding cap amounts under a per capita cap formula. Some Medicaid directors commented that the formulas should reward efficient states. Some directors mentioned that they welcomed potential new state policy flexibility under federal legislative proposals, but a greater number of Medicaid directors expressed concern that proposals to convert Medicaid to a per capita cap or block grant would not provide sufficient flexibility to enable states to make up for the reduction in federal funds. The National Association of Medicaid Directors has issued statements on recent legislative proposals and more broadly on health reform calling for Congress to carefully consider the impacts of legislative proposals on states.126
Section 1115 Medicaid Demonstration Waivers
All new administrations can shape Medicaid through administrative actions and Section 1115 demonstration waivers. In March 2017, the Trump administration sent a letter to state governors127 that signaled a willingness to use Section 1115 authority to “support innovative approaches to increase employment and community engagement” and “align Medicaid and private insurance policies for non-disabled adults.” The letter indicates a willingness to expand these policies to traditional Medicaid adults as well as a willingness to approve landmark program changes, like work requirements.128
While previous sections of this report capture Section 1115-related policy actions planned for implementation in FY 2018, the survey also asked states whether they are planning program changes under Section 1115 authority that would be implemented after FY 2018. Nearly half of states reported activity planned for implementation after FY 2018 – as part of Section 1115 waivers currently pending at CMS, Section 1115 concept papers submitted to CMS, or more preliminary waiver ideas/concepts still under development at the state level.129 Waiver components under consideration include a range of policies such as premiums and cost-sharing (including HSA-like accounts), work requirements, healthy behavior incentives, retroactive coverage waivers, behavioral health services and systems reform, and NEMT waivers. A few examples follow:
Kentucky131 has a waiver pending that seeks changes to its traditional Medicaid expansion. The state proposes implementing sliding scale premiums, requiring premium payment before coverage is effective, and locking those above 100 percent FPL out of coverage for six months for premium non-payment. The state seeks to require work as a condition of eligibility for most adults, proposes locking beneficiaries out of coverage for six months for failure to timely renew eligibility, and proposes waiving NEMT (an otherwise required benefit). Kentucky also submitted an amendment to its pending application. The amendment seeks to change the work requirement from a graduated requirement132 to a flat 20 hour/week requirement, adds disenrollment and lock-out provisions for failure to timely report changes to income or employment or for making false statements involving work verification, and removes a proposed expansion of presumptive eligibility sites included in the original waiver application.133
Massachusetts has submitted an amendment to its MassHealth waiver to better align coverage with commercial plans. Under the terms of the amendment, the state would enroll higher income, non-disabled adults in the state’s Marketplace and prohibit Medicaid enrollment for certain populations with access to affordable employer coverage. The state also proposes to eliminate some of the wrap around benefit requirements for premium assistance, increase cost-sharing, implement narrow provider networks in MassHealth’s Primary Care Clinician Plan (to encourage enrollment in ACOs and MCOs instead), establish a closed formulary focused on drug efficacy, and leverage a specialty pharmacy network to reduce drug costs.134
Wisconsin135 has submitted an amendment to its BadgerCare Reform demonstration.136 As directed by state law, they seek to amend their existing waiver for childless adults to require monthly premiums for childless adults from 51 percent to 100 percent FPL, with a coverage lock-out of up to six months for non-payment. The state proposes to offer premium reductions for completion of a health risk assessment and healthy behavior program. The state also seeks to require, as a condition of eligibility, that childless adults complete a drug screening, and if indicated, a drug test at application and renewal and would require childless adults ages 19 to 49 to work or participate in job training for 80 hours per month. In addition, the state seeks to limit childless adults’ eligibility to 48 months followed by a six-month lock-out,137 proposes to use Medicaid funds to pay for residential SUD treatment up to 90 days in institutions for mental disease for all Medicaid enrollees, and seeks authority to charge an $8 copay for emergency department utilization by childless adults.138
Concept Papers
Alaska has developed a waiver concept paper that proposes a comprehensive behavioral health system transformation with increased access to behavioral health screening, intervention, and support services in community-based settings and via telehealth. It also proposes enhanced behavioral health services to targeted populations, such as “super-utilizers”, the homeless, and justice-involved populations, and integrating behavioral and physical health care through a new Administrative Services Organization (ASO) arrangement.139
New Mexico reported plans to make targeted modifications to improve its existing Centennial Care managed care program. These include but are not limited to LTSS reforms to support improved care transitions, a uniform benefit package for most Medicaid adults, enhanced care coordination for justice-involved and other target populations, expanded healthy behavior incentives, a waiver of retroactive coverage requirements, and fees for missed appointments.140 The state also reported that it would like to create a DSRIP-like program for nursing homes.
Other State Priorities and Challenges
Payment and Delivery System Reform Initiatives
As noted in previous survey reports, many states are continuing to develop and implement significant initiatives that restructure delivery systems and payment structures with the goals of improving the quality of care and patient health outcomes and containing costs. One director anticipated that since federal Medicaid funding may be reduced in the future, it was more important than ever to keep making progress on delivery system reform and value-based purchasing efforts. Payment and delivery system reform efforts mentioned include value-based purchasing approaches (e.g., alternative provider payment models (APMs)), efforts to integrate physical and behavioral health, managed care expansions and reforms, integrated care partnership initiatives that engage providers at the point of service to improve care for patients, Accountable Care Organization initiatives, and multi-payer quality efforts.
Substance Use Disorder (SUD) Treatment Initiatives
With overdose deaths across the country continuing to increase, a majority involving opioids (including prescription opioids and heroin), many states are taking steps through Medicaid and other channels to reverse these trends. A number of Medicaid directors identified addressing the opioid epidemic or expanding SUD treatment efforts as a top Medicaid priority, including directors from a number of states that are seeking federal waiver authority to offer residential SUD services.
Long-Term Services and Supports
Medicaid is the nation’s primary payer for long-term services and supports (LTSS) and LTSS is also a major cost driver in state Medicaid budgets. It is therefore not surprising that a number of Medicaid directors identified LTSS reforms as a top priority for FY 2018 and beyond. Some of the initiatives mentioned included MLTSS efforts, 1915(c) waiver redesign projects, rebalancing initiatives, and other LTSS redesign efforts.
Medicaid Infrastructure Development
Most Medicaid programs have undertaken major system development projects in recent years, most notably for new eligibility systems and for new Medicaid Management Information Systems (MMIS). Several states listed the development and operationalization of these projects as a major priority in FY 2018. These Medicaid infrastructure initiatives are critically important for the success of the major delivery system and payment reforms that are often being implemented concurrently. Medicaid programs also need the systems capability to implement quality improvement, provider and MCO monitoring, data analytics, and cost control strategies.
Conclusion
This report provides information about the current landscape of state policy decisions for Medicaid during a time of great uncertainty about the future of the Medicaid program, as Congress may continue to consider reforms that could substantially roll back coverage in many states and dramatically change the financing structure of the program which has been the foundation of the federal-state Medicaid partnership. While some states are pursuing opportunities to reshape this partnership through Section 1115 demonstration waivers, others are continuing to press ahead with efforts to rebalance their long-term services and supports systems, and with delivery system and payment initiatives designed to improve health care and health outcomes and lower costs. At the same time, many states are mobilizing to address the nation’s continuing opioid epidemic by utilizing their Medicaid programs to expand access to substance use disorder treatment. Based on the findings of this survey, state Medicaid programs continue to take significant actions, both large and small, to move toward greater value, better health, and improved service for the over one-in-five Americans who are now served by the program.
Methods
The Kaiser Family Foundation (KFF) commissioned Health Management Associates (HMA) to survey Medicaid directors in all 50 states and the District of Columbia to identify and track trends in Medicaid spending, enrollment, and policy making. This is the 17th annual survey, each conducted at the beginning of the state fiscal year from FY 2002 through FY 2017. Additionally, eight mid-fiscal year surveys were conducted during state fiscal years 2002-2004 and 2009-2013, when a large share of states were considering mid-year Medicaid policy changes due to state budget and revenue shortfalls. Findings from previous surveys are referenced in this report when they help to highlight current trends. Archived copies of past reports are available on the following page.141
The KFF/HMA Medicaid survey on which this report is based was conducted from June through September 2017. The survey instrument (in the Appendix) was designed to document policy actions in place in FY 2017 and implemented or adopted for FY 2018 (which began for most states on July 1, 2017).142 The survey captures information consistent with previous surveys, particularly for eligibility, provider payment rates, benefits, long-term care, and managed care to provide some trend information. Each year, questions are added to address current issues.
Medicaid directors and staff provided data for this report in response to a written survey and a follow-up telephone interview. The survey was sent to each Medicaid director in June 2017. All 50 states and DC completed surveys and participated in telephone interview discussions in July, August, and September 2017. The telephone discussions are an integral part of the survey to ensure complete and accurate responses and to record the complexities of state actions.
The survey does not attempt to catalog all Medicaid policies in place for each state. The focus is on changes in Medicaid policy and new initiatives that are planned for FY 2018. Experience has shown that adopted policies are sometimes delayed or not implemented, for reasons related to legal, fiscal, administrative, systems or political considerations, or due to delays in approval from CMS. Policy changes under consideration without a definite decision to implement are not included in the survey. The District of Columbia is counted as a state for the purposes of this report; the counts of state policies or policy actions that are interspersed throughout this report include survey responses from the 51 “states” (including DC). Given differences in the financing structure of their programs, the U.S. territories were not included in this analysis.
Glossary
Acronym Glossary
AAC – Actual Acquisition Cost
ACA – Affordable Care Act
ACO – accountable care organization
ASO – Administrative Services Organization
APCD – all-payer claims database
APM – alternative payment model
BH – behavioral health
CDC – The Centers for Disease Control and Prevention
CFC – Community First Choice
CHIP – Children’s Health Insurance Program
CHIPRA – Children’s Health Insurance Program Reauthorization Act of 2009
CMS – The Centers for Medicare and Medicaid Services
CON – Certificate of Need
CSHCNs – children with special health care needs
DBM – dental benefit manager
D-SNP – Medicare Dual Eligible Special Needs Plans
DSRIP – Delivery System Reform Incentive Program
DUR – drug utilization review
EAC – Estimated Acquisition Cost
ED – emergency department
EPSDT – Early and Periodic Screening, Diagnostic, and Treatment
FAD – Financial Alignment Demonstration
FDA – Food and Drug Administration
FFS – fee-for-service
FFY – federal fiscal year
FIDE-SNP – Fully Integrated Dual Eligible Special Needs Plans
FPL – federal poverty level
FQHC – federally qualified health center
FY – state fiscal year
GED – general educational development or diploma
HSA – health savings account
HCBS – home and community-based services
HEDIS – Healthcare Effectiveness Data and Information Set
HIT – health information technology
ICF-ID – intermediate care facilities for individuals with intellectual disabilities
ID/DD – intellectual and developmental disabilities
IEP – individualized education program
IMD – institutions for mental diseases
LTSS – long-term services and supports
MAGI – modified adjusted gross income
MAT – medication-assisted treatment
MCO – managed care organization
MED – morphine equivalent dose
MFP – Money Follows the Person (federal grant program)
MH – mental health
MLTSS – managed long-term services and supports
MLR – medical loss ratio
MME – morphine milligram equivalent
MMIS – Medicaid Management Information System
NADAC – National Average Drug Acquisition Costs
NCQA – National Committee for Quality Assurance
NEMT – non-emergency medical transportation
NF – nursing facility
OT – occupational therapy
P4P – pay for performance
PA – prior authorization
PACE – Programs of All-Inclusive Care for the Elderly
PCCM – primary care case management
PCMH – patient-centered medical home
PDL – preferred drug list
PDMP – Prescription Drug Monitoring Program
PHP – prepaid health plan
PIP – performance improvement projects
PMPM – per-member per-month
PT – physical therapy
RHC – rural health center
SED – serious emotional disturbance
SIM – State Innovation Models federal grant program
SMI – serious mental illness
SNAP – Supplemental Nutrition Assistance Program
SPA – State Plan Amendment
SSI – supplemental security income
SUD – substance use disorder
TPL – third party liability
VBP – value-based purchasing
WIC – Special Supplemental Nutrition Program for Women, Infants, and Children
Medicaid work requirement proposals generally require beneficiaries to verify their participation in approved activities, such as employment, job search, or job training programs, for a certain number of hours per week to receive health coverage. The proposals typically would exempt certain populations. To date, CMS has not approved state waiver requests to require that Medicaid beneficiaries work as a condition of eligibility. ↩︎
While still maintaining the enhanced federal matching rate for coverage of the remaining expansion population at or below 100% FPL. ↩︎
Six states (CA, MA, MD, VA, VT, and WV) currently have received federal approval through Section 1115 waiver authority to waive the IMD payment exclusion to receive federal Medicaid funds for inpatient behavioral health services for nonelderly adults. Nine states (AZ, IL, IN, KY, MA, MI, NJ, WI, and UT) currently have pending Section 1115 waivers at CMS which seek to waive the IMD payment exclusion. ↩︎
AR and IL did not respond to the MAT drug coverage question; however, a Health Affairs article (citation below) that uses 2013-2014 data indicates that all 51 states cover buprenorphine.
Colleen Grogan et al., “Survey Highlights Differences in Medicaid Coverage for Substance Use Treatment and Opioid Use Disorder Medications,” Health Affairs 35 no. 12 (December 2016): 2289-2296, http://content.healthaffairs.org/content/35/12/2289. ↩︎
While still maintaining the enhanced federal matching rate for coverage of the remaining expansion population at or below 100% FPL. ↩︎
Legislators dropped their lawsuit challenging Governor Cooper’s authority to expand Medicaid without legislative approval in July 2017 because Cooper never formally submitted his expansion proposal to the federal government for review. However, in a joint statement, the State Senate President and Speaker of the State House said that they would renew a legal challenge if the Governor made another attempt to expand without lawmakers’ approval. ↩︎
Individuals eligible for the Family Planning Waiver included women ages 18 through 55 who have family income at or below 185 percent of the federal poverty level (FPL) and assets totaling less than $250,000, and who are not otherwise eligible for Medicare, Medicaid, the Children’s Health Insurance Program (CHIP), or health insurance coverage that provides family planning services. ↩︎
Missouri has replaced its family planning waiver with a state-funded family planning coverage program that does not cover or pay for services provided by organizations that also provide abortion services, including Planned Parenthood. Women who are eligible for the federally-funded program will continue to be eligible for the state-funded program, without change. The available services remain the same but the provider qualifications are modified.
Missouri Department of Social Services, Public Notice of Suspension of Federal Expenditure Authority for Section 1115 Family Planning Demonstration, entitled “Missouri Woman’s Health Services Program,” (Missouri Department of Social Services, July 2016), https://dss.mo.gov/mhd/waivers/1115-demonstration-waivers/files/missouri-women-health-services-waiver-suspension-notice-phase-out-plan.pdf. ↩︎
States with pending waiver proposals with provisions slated for implementation after FY 2018 include Alaska, Colorado, Illinois, Indiana, Kentucky, Maine, Massachusetts, New Mexico, North Carolina, Oklahoma, Virginia, and Wisconsin. ↩︎
CMS’s waiver of retroactive eligibility in Arkansas is conditioned on the state completing an eligibility determination mitigation plan, making timely eligibility determinations, providing benefits during a reasonable opportunity period for otherwise eligible individuals who attest to immigration status, and implementing a hospital presumptive eligibility program. ↩︎
The member can reenroll within 90 days from the end of the expired benefit period if they submit the requested redetermination information. However, after the 90-day period, the member is required to wait another three months, or six months from the initial date of disenrollment, until their next open enrollment before being permitted to reenroll in HIP. Indiana has also proposed a work requirement, but that provision would not be effective until FY 2019. ↩︎
As of the date of publication, the state’s waiver amendment was still pending approval at CMS. ↩︎
Enrollment in the PCN limited benefit package for adults up to 100% FPL is capped at 25,000. ↩︎
Although these policies are similar to policies in other states that are counted as eligibility restrictions in this report, they are not counted as eligibility restrictions in Utah because they apply only to the new childless adult group that does not currently have access to coverage. ↩︎
Maine’s pending Section 1115 waiver proposes requiring monthly premiums for traditional adults (such as parents, former foster care youth, those receiving TMA, medically needy, those receiving family planning services). While the waiver proposal’s estimated implementation date for most other (non-premium) provisions is January 1, 2018, the state doesn’t plan to implement the premium provisions until six months later (estimated at July 1, 2018). Given this FY 2019 anticipated implementation date, Maine’s premium proposal is not counted in this section of the report (which captures premium changes in FY 2017 and planned for FY 2018). ↩︎
Some states suspend by limiting covered benefits to inpatient hospitalization. ↩︎
Positive changes from the beneficiary’s perspective that were counted in this report are denoted with (+). Negative changes from the beneficiary’s perspective that were counted in this report are denoted with (-). Reductions to Medicaid eligibility pathways in response to the availability of other coverage options (including Marketplace or Medicaid expansion coverage) were denoted as (#). ↩︎
New premiums are denoted as (New). Changes to premium policies that have a neutral impact from the beneficiary’s perspective are denoted as (Neutral). ↩︎
This table captures eligibility and premium changes that states have implemented or plan to implement in FY 2017 or 2018, including changes that are part of pending Section 1115 waivers. For pending waivers, only provisions planned for implementation before the end of FY 2018 (according to waiver application documents) are counted in this table. Waiver provisions in pending waivers that states plan to implement in FY 2019 or after are not counted here. ↩︎
CMS’s waiver of retroactive eligibility in Arkansas is conditioned on the state completing an eligibility determination mitigation plan, making timely eligibility determinations, providing benefits during a reasonable opportunity period for otherwise eligible individuals who attest to immigration status, and implementing a hospital presumptive eligibility program. ↩︎
Massachusetts’ pending amendment would remove an existing waiver provision that allows it to enroll expansion adults and other populations in coverage during a 90-day provisional eligibility period while income verification is pending. ↩︎
Six states (CA, MA, MD, VA, VT, and WV) currently have received federal approval through Section 1115 waiver authority to waive the IMD payment exclusion to receive federal Medicaid funds for inpatient behavioral health services for nonelderly adults. Nine states (AZ, IL, IN, KY, MA, MI, NJ, WI, and UT) currently have pending Section 1115 waivers at CMS which seek to waive the IMD payment exclusion. ↩︎
Connecticut does not have capitated managed care arrangements, but does carry out many managed care functions, including ASO arrangements, payment incentives based on performance, intensive care management, community workers, educators, and linkages with primary care practices. ↩︎
California has a small PCCM program operating in LA County for those with HIV. Three states use PCCM authority to operate specialized programs that are not counted here as PCCM programs: South Carolina uses PCCM authority to provide care management services to approximately 200 medically complex children; the Texas Medicaid Wellness program provides care management services for high-cost/high-risk enrollees, and Wyoming’s Patient Centered Medical Home program uses PCCM authority to make PMPM payments. ↩︎
Arizona was re-characterized from “Varies” to “Always Mandatory” across all population groups as the only non-mandatory group is Native Americans in compliance with federal requirements. ↩︎
In the rule, CMS formalizes its policy around “in lieu of,” which is an authority that a number of states were using to cover stays in IMDs prior to this rule. Some of these states must now adapt policies to meet the 15-day requirement, which may have fiscal and programmatic implications for these states. ↩︎
Six states (CA, MA, MD, VA, VT, and WV) currently have received federal approval through Section 1115 waiver authority to waive the IMD payment exclusion to receive federal Medicaid funds for inpatient behavioral health services for nonelderly adults. Nine states (AZ, IL, IN, KY, MA, MI, NJ, WI, and UT) currently have pending Section 1115 waivers at CMS which seek to waive the IMD payment exclusion. ↩︎
Remittances are required for the expansion population in Ohio. ↩︎
Texas reported ending its Texas Medicaid Wellness Program in August 2017. This care management program was not counted as a PCCM program for purposes of this report although it operated under PCCM authority. ↩︎
One of the 25 states reporting a PHP arrangement that is not included in Exhibit 5 is Alabama, which reported having a PHP for maternity care. ↩︎
In this report, Oregon’s Coordinated Care Organization (CCO) program is counted as an MCO program, but not as an ACO program, consistent with its CMS designation and the state’s survey response. According to the state, “A coordinated care organization is a network of all types of health care providers (physical health care, addictions and mental health care and sometimes dental care providers) who have agreed to work together in their local communities to serve people who receive health care coverage under the Oregon Health Plan (Medicaid).” (Oregon Health Authority website accessed at: http://www.oregon.gov/oha/HPA/Pages/CCOs-Oregon.aspx.) ↩︎
Gobeille v. Liberty Mutual Insurance Company, No. 14-181, 577 U.S. ___ (2016). In this case, the Supreme Court of the United States held that the Employee Retirement Income Security Act (ERISA) pre-empts a Vermont law that requires certain entities, including health insurers, to report payments relating to health care claims and other information relating to health care services to a state agency for compilation in an all-inclusive health care database. ↩︎
Serving more individuals through “HCBS Waivers or SPAs” means: adopting new waiver; adding and filling more waiver slots; filling more waiver slots; adding new 1915(i) or 1915(k) SPA; or serving more individuals through existing 1915(i) or 1915(k) SPA. ↩︎
While various Medicaid state plan authorities enable states to expand beneficiary access to home and community-based services (HCBS), some states are using Section 1115 waivers to streamline program administration, improve care coordination, and expand beneficiary access to home and community-based services (HCBS). ↩︎
After September 2016, with CMS approval, states can continue to transition eligible individuals through 2018 and expend remaining MFP funds through federal FY 2020. ↩︎
Oregon is not included in this count. The state terminated its MFP program, effective June 30, 2015. ↩︎
Most of these states are using current Section 1915(c) waivers that provide community transition services and environmental modifications for seniors, individuals with physical disabilities and/or individuals with intellectual or developmental disabilities, and some states offer housing coordinators or other search services to assist waiver beneficiaries. ↩︎
Arkansas, Delaware, and Minnesota noted they are/will be forming work/advisory groups to study the issue further. New York also reported an expanded scope of practice for home care aides. North Carolina reported consumer-directed care is included as an option in the newly approved children’s waiver. North Dakota reported ongoing efforts to address LTSS direct care workforce through its MFP program. Texas reported working with external and internal stakeholders to develop measures and methods to monitor access to MLTSS as it relates to managed care organization network adequacy. ↩︎
HCBS benefit expansions reported in this section may include new HCBS waiver or SPA initiatives, which may have also been reported/counted as expansions in persons served under HCBS through waivers or SPAs. ↩︎
Arizona, Hawaii, Massachusetts, New Mexico, Pennsylvania, Tennessee, Texas, and Virginia. (Virginia has FAD model that the state plans to terminate by the end of 2017. Virginia is also launching MLTSS program in August 2017.) ↩︎
Fully Integrated Dual Eligible SNPs were created by Congress in Section 3205 of the Affordable Care Act to promote full integration and coordination of Medicaid and Medicare benefits for dual eligible beneficiaries by a single managed care organization. They must have a MIPPA compliant contract with a State Medicaid Agency that includes coverage of specified primary, acute and long-term care benefits and services under risk-based financing. For more information see: https://www.cms.gov/Medicare/Health-Plans/SpecialNeedsPlans/DualEligibleSNP.html#s3. ↩︎
Delaware, Iowa, Idaho, Minnesota, and New Jersey. ↩︎
Rates for calendar year 2017 not yet determined at the time of the survey included MCO rates for Florida, Illinois, Maryland, and Minnesota. While some states with calendar year contracts provided the budgeted level of MCO rate increases, these four states indicate that they are waiting for work by their actuaries. Wisconsin is implementing APR-DRGs in in January 2017, which could potentially move funds between inpatient and outpatient hospital rates. ↩︎
Historically, Medicaid reimbursement for hospitals and nursing homes was cost-based, automatically reflecting incurred cost increases. When rates for these providers are frozen, such annual increases do not occur; hence for this report, rate freezes are counted as restrictions. ↩︎
Some states also have premium or claims taxes that apply to managed care organizations and other insurers. Since this type of tax is not considered a provider tax by CMS, these taxes are not counted as provider taxes in this report. ↩︎
In addition to the “Medicaid provider taxes” included in this report, several states have more general health care taxes that are used to fund their Medicaid programs. For instance, some states have taxes on insurance premiums or health care claims that apply to all payers. States were asked whether they have a tax on MCOs, health insurance premiums, or health care claims that does not apply to other goods and services. Thirteen states that had not indicated a Medicaid MCO provider tax replied “yes”. Two of these states indicated that all of the health insurance tax is dedicated to Medicaid. Four indicated that it was dedicated to Medicaid in part. ↩︎
AR and IL did not respond to the MAT drug coverage question; however, a Health Affairs article (citation below) that uses 2013-2014 data indicates that all 51 states cover buprenorphine.
Colleen Grogan et al., “Survey Highlights Differences in Medicaid Coverage for Substance Use Treatment and Opioid Use Disorder Medications,” Health Affairs 35 no. 12 (December 2016): 2289-2296, http://content.healthaffairs.org/content/35/12/2289. ↩︎
BRCA1 and BRCA2 are human genes that produce tumor suppressor proteins that help repair damaged DNA and play a role in ensuring the stability of the cell’s genetic material. When either of these genes are mutated or altered, cells are more likely to develop additional genetic alterations that can lead to cancer. Specific inherited mutations in BRCA1 and BRCA2 increase the risk of female breast and ovarian cancers. More information is available from the National Cancer Institute: https://www.cancer.gov/about-cancer/causes-prevention/genetics/brca-fact-sheet. ↩︎
Utah proposes covering a new eligibility group: individuals with income below 5 percent of the FPL who are either chronically homeless, justice-involved, or individuals in need of substance use and/or mental health treatment. This EPSDT restriction would apply to 19 and 20 year olds in this group. ↩︎
In accordance with federal and state law, states pay the lower of (a) the ingredient cost rate plus a dispensing fee; (b) the Federal Upper Limit (FUL) or State Maximum Allowable Cost rate, if applicable, plus a dispensing fee; or (c) the pharmacy’s Usual and Customary Charge. ↩︎
One of the states that projected greater costs (South Carolina) reported, however, that it is negotiating with CMS to retain its current reimbursement methodology and not move to AAC and a professional dispensing fee. The state’s interpretation of the rule is that it sets an aggregate cost cap based on the AAC methodology but does not require adoption of this methodology. South Carolina believes it is compliant with the rule as its pharmacy expenditures are within the aggregate cap based on AAC, but if the state were to adopt the AAC methodology, it would incur greater costs. ↩︎
A “kick payment” is a supplemental payment over and above the capitation payment made to an MCO for beneficiaries utilizing a specified set of services or having a certain condition. ↩︎
Li Hui Chen, Holly Hedegaard, and Margaret Warner, “Drug-poisoning deaths involving opioid analgesics: United States, 1999–2011,” National Center for Health Statistics data brief, no 166 (September 2014), https://www.cdc.gov/nchs/data/databriefs/db166.pdf. ↩︎
Deborah Dowell, Tamara Haegerich, and Roger Chou, “CDC Guideline for Prescribing Opioids for Chronic Pain — United States, 2016,” Centers for Disease Control and Prevention Morbidity and Mortality Weekly Report, 65, no. 1 (March 2016):1–49, http://dx.doi.org/10.15585/mmwr.rr6501e1. ↩︎
Several states mentioned plans to implement quantity limits based on a “morphine equivalent dose” (MED), which is the amount of opioid prescription drugs, converted to a common “standard” unit (milligrams of morphine). For example, both 60 mg of oxycodone (approximately 2 tablets of oxycodone sustained-release 30 mg) and approximately 20 mg of methadone (4 tablets of methadone 5 mg) are equal to 90 MMEs (morphine milligram equivalents). ↩︎
“Clinical edits” are clinically-based claims adjudication rules that a claims system will follow when processing a pharmacy claim. ↩︎
Step therapy prior authorization criteria involves requiring the use of another agent prior to the use of a specific opioid. ↩︎
Prescription Drug Monitoring Programs (PDMPs) are state-run electronic databases that are valuable tools for addressing prescription drug diversion and abuse. Currently, except for Missouri, every state and the District of Columbia operates a PDMP. On July 17, 2017, however, Missouri Governor Eric Greitens issued an Executive Order directing the Missouri Department of Health and Senior Services (DHSS) to implement a PDMP and promulgate regulations to require dispensers to submit controlled substance prescription and dispensation information to DHSS or its designee. ↩︎
Lock-in programs limit Medicaid beneficiaries to a specific pharmacy and/or prescriber. These programs are intended to prevent Medicaid beneficiaries from obtaining excessive quantities of prescribed drugs through visits to multiple physicians and pharmacies. ↩︎
Ravi Gupta, Nilay Shah, and Joseph Ross, “The Rising Price of Naloxone – Risks to Efforts to Stem Overdose Deaths,” New England Journal of Medicine, 375 (December 2016): 2213-2215, http://www.nejm.org/doi/full/10.1056/NEJMp1609578#t=article. ↩︎
Colleen Grogan et al., “Survey Highlights Differences in Medicaid Coverage for Substance Use Treatment and Opioid Use Disorder Medications,” Health Affairs 35 no. 12 (December 2016): 2289-2296, http://content.healthaffairs.org/content/35/12/2289. ↩︎
AR and IL did not respond to the MAT drug coverage question; however, a Health Affairs article (citation below) that uses 2013-2014 data indicates that all 51 states cover buprenorphine.
Colleen Grogan et al., “Survey Highlights Differences in Medicaid Coverage for Substance Use Treatment and Opioid Use Disorder Medications,” Health Affairs 35 no. 12 (December 2016): 2289-2296, http://content.healthaffairs.org/content/35/12/2289. ↩︎
Medicaid work requirement proposals generally require beneficiaries to verify their participation in approved activities, such as employment, job search, or job training programs, for a certain number of hours per week to receive health coverage. The proposals typically would exempt certain populations. To date, CMS has not approved state waiver requests to require that Medicaid beneficiaries work as a condition of eligibility. ↩︎
Implementation dates for Section 1115 waiver provisions included/cited in this report are the dates proposed in state waiver applications submitted to CMS. ↩︎
In 2014, Wisconsin implemented a new Section 1115 waiver covering childless adults ages 19 to 64 with income up to 100% FPL; those above 100% FPL are covered in the Marketplace. (Wisconsin covers childless adults without ACA enhanced matching funds.) ↩︎
State proposes to exempt childless adults ages 19 to 49 from the 48 month time limit if working or attending job training 80 hours per month and proposes to use Medicaid funds to offer job training as a covered benefit for childless adults. ↩︎
Medicaid has long-played an important role in the U.S. healthcare system, accounting for one in every six dollars of all U.S. health care spending while providing health and long-term services and supports coverage to millions of low-income Americans.1 Medicaid also plays an important role in states budgets as both an expenditure item and the largest source of federal revenue for states.
KFF #Medicaid budget survey takes a deeper look at programs in #Nevada, #NorthCarolina and #WestVirginia.
This year’s survey was conducted as Congress debated proposals to repeal major portions of the Affordable Care Act (ACA), including the ACA’s Marketplace and Medicaid coverage expansions, as well as other proposals to fundamentally restructure Medicaid’s financing structure. States adopted budgets for FY 2018 facing uncertainty about the outcome of the federal legislative debate, some volatility in state revenues and while trying move forward with an array of initiatives to advance Medicaid payment and delivery system reforms and to address emerging public health issues like the opioid epidemic. These policy priorities are playing out in the context of broader state budgets and an economy that varies across states, with some states experiencing steady economic growth and others facing declines in state revenues.
This report provides an in-depth examination of Medicaid program changes in the larger context of state budgets in three states:
These case studies build on findings from the 17th annual budget survey of Medicaid officials in all 50 states and the District of Columbia conducted by the Kaiser Family Foundation (KFF) and Health Management Associates (HMA). Additional research on budget activity, economic conditions, and other relevant health policy activity was collected to supplement survey responses.
Issue Brief: Nevada
Economic and Budget Outlook
Economy and State Revenues
While Nevada’s recovery from the Great Recession initially lagged behind much of the rest of the country, in recent years, the state’s economic growth has outpaced the national average. In 2016, Nevada’s Gross Domestic Product (GDP) grew by 2.4 percent to $147.5 billion compared to the national average of 1.5 percent growth. Finance, insurance, real estate, rental, and leasing are the largest industries in Nevada, followed by the arts, entertainment, recreation, accommodation, and food service industries. While per capita personal income in Nevada was only 88 percent of the national average in 2016,2 per capita personal income growth in the state (3.9 percent) outpaced the national average 2.9 percent. During the Great Recession, Nevada’s unemployment rate peaked at 13.7 percent in September 2010, above the national peak of 10 percent in October 2009. As of August 2017, however, the state has an unemployment rate of 4.9 percent, down from 5.5 percent in August 2016, but still slightly above the August 2017 U.S. average of 4.4 percent.3
While Nevada gaming revenues have been affected by the increased availability of gaming throughout the U.S., Las Vegas remains a strong tourist destination, with an estimated 42.3 million visitors in 2016. The Governor’s budget for the 2017-2019 biennium notes that “Nevada’s tourism industry has diversified its offerings by expanding its amenities beyond gaming with world class entertainment, dining and high-end shopping. In fact, non-gaming revenue now makes up about two thirds of this industry’s revenue.”4 At the time of this report, however, the economic impact of the tragic October 1st mass shooting in Las Vegas on the tourism sector remains unknown.
State Budget
The Nevada legislature meets only in odd-numbered years, when it addresses the full range of legislative issues and must adopt a balanced biennial budget. The enacted budget for FY 2017-18 mirrors actual spending in FY 2015-16 for most budget categories within Medicaid.5 While the aggregate authorization for Medicaid is 3.5 percent less than actual expenditures in FY 2015-16, the state general fund share is increased by nearly 12 percent, due in large part to the reduction in the federal share of funding for the Medicaid expansion.
Demographic Characteristics and Medicaid’s Role
Fewer Nevada residents live in poverty (10 percent in 2016) compared to the national average (13 percent),6 but Nevada has a low per capita income ($43,567 in 2016 compared to $49,246 nationally)7 that generates a relatively high federal Medicaid matching assistance percentage (FMAP) at 66 percent.8Medicaid plays an important role in the state, covering 18 percent of the population in 2016,9 and Medicaid spending per full-benefit enrollee in Nevada in federal fiscal year 2014 ($4,003) was lower than that in any other state.10 While this suggests that the state’s program is already relatively efficient, it also means achieving increased savings in response to a potential future cap on federal Medicaid financing could be particularly difficult in Nevada.11 After expanding Medicaid under the Affordable Care Act (ACA) to all individuals up to 138 percent of the federal poverty level (FPL) in 2014, Nevada experienced the largest percent decline in the nonelderly uninsured rate of any state between 2013 and 2016 (11.8 percent).12
While Nevada’s population distribution by age as of 2016 is relatively close to the national average,13 the state has the second highest projected growth rate of its age 85+ population (95 percent) between 2015 and 2030.14 Because Medicaid is the primary payer for institutional and community-based long-term services and supports, this growth could increase future Medicaid spending levels in the state as the demand for these costlier services increases with age. Nevada is also a relatively diverse state in terms of its racial/ethnic population distribution. Over a quarter of Nevadans (27 percent) are of Hispanic origin, which is the 5th largest percentage of any state. Data suggest that Nevada’s adoption of the ACA Medicaid expansion has helped reduce longstanding disparities in health coverage faced by Hispanics in Nevada: between 2013 and 2015, the uninsured rate for nonelderly Hispanics in Nevada fell from 34 percent to 19 percent.15
Nevada has been more severely impacted than most states by the HIV and opioid epidemics. The state has an estimated HIV diagnosis rate of 20.1 per 100,000 population compared to a national average of 14.7 per 100,000 population, the 7th highest in the country.16 In addition, Nevada’s opioid death rate was 13.8 deaths per 100,000 population in 2015, compared to a national average of 10.4 deaths per 100,000 population.17 The state is closer to national averages on certain other measures of health status: the percentage of the population that reports poor health status (17.6 percent),18 reports poor mental health status (34.9 percent),19 or is overweight or obese (64.7 percent).20
Update on the Affordable Care Act and Other Eligibility Changes
Nevada expanded Medicaid coverage to newly eligible groups under the ACA in January 2014. As of August 2017, more than 211,000 people were enrolled in the expansion group, representing nearly one-third of total Nevada Medicaid enrollment.21 Nevada uses its State General Fund to finance the state share of Medicaid expansion costs.
More recently, in June 2017, the Nevada legislature adopted the Immigrant Children’s Health Improvement Act (ICHIA) option to remove the five-year bar on coverage for lawfully-residing immigrant children. If approved by CMS, the plan is estimated to provide coverage to up to 7,500 Nevada children.22 The legislature also passed the Nevada Care Plan to offer a state-based health coverage plan to uninsured individuals. Approximately 9 percent of Nevadans were uninsured in 2016.23 Under the Nevada Care Plan, sometimes called “Medicaid for all”, individuals would have been able to purchase a product with covered benefits and provider payment rates based on the Nevada Medicaid program. The proposed legislation, which had a proposed implementation date of January 1, 2019, provided a general concept without many details.24 On June 16, Governor Sandoval vetoed the legislation, indicating that there were too many unanswered questions about how the program would work.25
Health System Reform in Nevada
Section 1115 Nevada Comprehensive Care Waiver
The Nevada Comprehensive Care Waiver (NCCW) was implemented in 2013 to provide care management services for individuals that are not eligible for MCO enrollment and who have at least one qualifying chronic health condition or a complex condition, as well as individuals that are high utilizers of medical services, including those with excessive use of the emergency room.26
While 68 percent of Nevada Medicaid enrollees are now served by HMOs,27 some of the costliest and sickest beneficiaries are in unmanaged fee-for-service.28 Under the NCCW waiver, up to 41,500 beneficiaries can be enrolled with a Care Management Organization (CMO). The CMO functions are much more extensive than primary care case management. The CMO does not provide direct medical care but it performs beneficiary assessments and works with the beneficiary’s health care team to develop, manage, and maintain a care plan. The CMO also coordinates care transitions, referrals to community and social support services.29 The Health Care Guidance Program is the selected CMO.30
Nevada Medicaid Delivery Model Review
In 2015, the Nevada Legislature passed a bill requiring an impact analysis of the Medicaid managed care program. The Nevada Division of Health Care Financing and Policy (DHCFP) engaged Navigant to perform a comprehensive review of the Nevada Medicaid delivery system and make recommendations for revisions to that model, based on stakeholder input, data about Nevada Medicaid, and Navigant experience with models used in other states.
Navigant delivered a draft report on January 3, 2017 that recommends a phased approach to Medicaid delivery system changes in Nevada. Navigant indicates that the four phases are “designed to address performance, access, and satisfaction issues that exist in the current program, and build upon positive program elements.” The report recommends that DHCFP work on strategies to increase access to care for Medicaid enrollees, build additional capacity to oversee Medicaid MCOs, and work with providers to increase the number of Primary Care Medical Homes and enable value-based payment arrangements. The final phase would be a managed fee-for-service program that would replace the current CMO model and could serve as a pathway to prepare Nevada MCOs to take on full-risk for additional Medicaid populations and services.” 31
Section 1115 Waivers in Development
Nevada Medicaid officials reported that two new Section 1115 waivers were under development at the state level as of Summer 2017: one that would extend the CMO demonstration and potentially add some additional features, particularly related to the adult expansion population, and a second that would apply to children in foster care. In 2015, Nevada received a System of Care Implementation Grant from the federal Substance Abuse and Mental Health Services Administration, which the state is using to focus on children’s behavioral health care needs.32 The grant initiative includes development of specific service packages for therapeutic foster care homes for clinical interventions. As a part of that process, the state is exploring a potential Section 1115 waiver that would relate to children with serious emotional disturbances.
Other Delivery System Reforms
Paramedicine Initiative
Nevada implemented Medicaid coverage for medically necessary community paramedicine services as of July 1, 2016 with the goal of increasing access to primary health care services, especially in medically underserved areas. Community paramedicine services are provided by emergency medical technicians (EMTs), advanced EMTs, or paramedics. The services must be part of the care plan ordered by the recipient’s primary care provider and provided under the supervision of an ambulance service’s Medical Director.33 While there has been some success in the cities of Reno and Winnemucca and in Clark County (Las Vegas), rural counties have not taken advantage of this option to the extent the state had hoped would occur.
Certified Community Behavioral Health Clinics
Nevada was one of eight states awarded a demonstration grant for Certified Community Behavioral Health Clinics (CCBHC). 34 As of July 1, 2017, there are four organizations with five locations enrolled in Nevada Medicaid to provide services under a prospective payment system (PPS) model for the two-year grant period. The goal of the CCBHC initiative is to support improvement of behavioral health outcomes through integration of primary health care with behavioral health care, and increased access to high quality coordinated care.
Dental Carve-Out
Nevada Medicaid provides comprehensive dental care for individuals under age 21 as part of Early and Periodic Screening, Diagnosis, and Treatment (EPSDT). For non-pregnant adults, the dental benefit is generally limited to emergency extractions and palliative dental care. Some prosthetic care (dentures or partials) is also covered under certain guidelines and limitations. Through June 30, 2017, the Medicaid MCOs were responsible for these dental services for their child and adult members. Nevada carved the dental benefit out of the MCO benefit package effective July 1, 2017, at which time dental services were covered through the Nevada Medicaid FFS program.35 The state has now selected a prepaid dental health plan which will be operational on January 1, 2018 and will provide dental care for the MCO population. (Dental services for the FFS population will continue to be managed by the current vendor.) Nevada expects that this change will improve the quality of Medicaid dental care as the dental benefits manager will be accountable for the quality of care.
Addressing the Opioid Abuse Crisis
In August 2016 Governor Sandoval convened a drug abuse summit with approximately 500 stakeholders to develop a plan to prevent drug abuse in Nevada. Governor Sandoval continues to chair the Governor’s Opioid State Action Accountability Taskforce. One component of the plan developed at the August 2016 summit was a proposal for legislation to further strengthen opioid prescribing policies. The resulting state law36 includes provisions that limit initial painkiller prescriptions to 14-day supplies, requires that physicians conduct mental health assessments before prescribing certain painkillers for the first time, and includes a new requirement that Medicaid prescribers check the Prescription Drug Monitoring Program before prescribing opioids.
Nevada has also adopted the CDC guidelines for opioid policy for its fee-for-service Medicaid program and plans to add a requirement during FY 2018 that Medicaid MCOs follow the guidelines as well. DHCFP revised its quantity limits for opioid prescriptions to require prior authorization for any opioid prescription exceeding a 7-day supply.
DHCFP, in collaboration with the Division of Public and Behavioral Health, was awarded a $5.7 million Opioid State Target Response (STR) grant from the Substance Abuse and Mental Health Services Administration.37 Nevada plans to use its grant to reform its Medication Assisted Treatment (MAT) program, including development of criteria for the certification of MAT centers which will then be used for purposes of Medicaid provider enrollment and reimbursement. This project is currently in the planning stages with a goal of implementation for January 1, 2018.
Nevada Medicaid Policy Changes FY 2017 and FY 2018
Eligibility Policies
Nevada made no changes to eligibility policy in FY 2017. In FY 2018, if they receive approval from CMS, Nevada plans to eliminate the five-year bar on Medicaid eligibility for lawfully-residing immigrant children.38
Medicaid outreach or assistance strategies to facilitate enrollment of inmates prior to release were expanded in FY 2018 for both prisons and jails.
Delivery System and Payment Reforms
In FY 2018, plan to implement a pilot program encouraging MCOs to provide care coordination and other services to corrections-involved enrollees prior to release from incarceration. Goal is to ensure continuity of care and reduce recidivism.
Provider Rates and Provider Fees/Taxes
For FY 2017, provider rates frozen across-the-board, except for rate increases for MCOs and home and community based services (HCBS).
For FY 2018, rates were cut for outpatient hospital, specialty physicians and dentists, based on budget issues and some realignment with Medicare rates. Inpatient hospital, nursing facility, primary care physician, and HCBS rates are being increased in FY 2018.
Nevada’s only provider tax, for nursing facilities, was unchanged. State legislation requires Nevada Medicaid to work with “other interested facilities” or “personal care services” during FY 2018 to potentially establish new provider taxes.
Benefits and Pharmacy
Added coverage for paramedicine services for all coverage groups effective 7/1/2016.
Reduced hours for Targeted Case Management, from 30 per month to 10 for initial month and 5 for next three consecutive calendar months for non-seriously mentally ill (SMI) adults and non-seriously emotionally disturbed (SED) children as of 2/23/2017.
Restored coverage for adult podiatry and added coverage for nutritional therapy by registered dieticians for state plan (non-expansion) population as of 01/01/2018
Added coverage for one-year contraception for both expansion and non-expansion groups as of 7/1/2017.
Changed several coverage policies as of 7/1/2017 to limit coverage of Private Duty Nursing, hospice, case management, and orthodontia. These changes affected all non-expansion populations.
Expanded coverage for home health durable medical equipment services 07/01/2017, and for gender reassignment surgery as of 01/01/2018
Issue Brief: North Carolina
Economic and Budget Outlook
Economy and State Revenues
North Carolina’s economy is ranked 10th in the nation, with a Gross Domestic Product (GDP) of $517.9 billion in 2016. Finance, insurance, real estate, rental, and leasing is the dominant industry, followed by government.39 Compared to the rest of the nation, North Carolina’s economy has experienced slower growth since the recession. This is associated with the state’s large manufacturing industry, which has experienced a sharp decline over the last several years. Only recently, from 2015 to 2016, is the state’s economy showing positive signs of change.40
North Carolina’s unemployment rate hit a high of 11.3 percent in 2010, following the end of the recession, but has steadily declined since then. The state’s unemployment rate was 4.1 percent in August 2017, down from 5.0 percent in August 2016 and below the U.S. average of 4.4 percent. 41,42
State Budget
North Carolina operates under a biennial budget. Cutting taxes and saving for future expenses are priorities for the Republican-led General Assembly. The state started 2017 with a surplus and, as of February, was anticipating moderate, steady economic growth that will yield a 4.5 percent increase in general fund revenues in 2017-18 and another 4.7 percent increase in 2018-19.43,44 In 2017, the state’s “rainy day” fund exceeded $1.8 billion.45
Since taking control of the North Carolina General Assembly in 2011, Republican legislators have passed sweeping tax reforms that include replacing a progressive income tax with a flat tax and cutting the corporate tax rate by more than half. Proponents of the tax cuts say they are providing a needed boost to North Carolina’s economy. Others worry about investments not being made in areas like education and the long-term impact that $2 billion in lost revenue will have on the state.46
The final budget for 2017-19, totaling $23 billion for FY 2018 and $23.6 billion for FY 2019, features a new set of controversial tax cuts that will take effect in 2019. The personal income tax rate will drop from 5.499 percent to 5.25 percent and the standard deduction will increase from $17,500 to $20,000. The budget also lowers the corporate income tax rate from 3 percent to 2.5 percent. Although Governor Roy Cooper vetoed this Republican-led plan citing fiscal concerns, the General Assembly swiftly overrode his veto.47
In the final budget bill, the General Assembly retained a portion of the governor’s recommendation for raising teacher’s salaries, created a jobs incentives program to encourage new businesses to locate in the state, and provided some of the funding recommended by the governor to expand opioid and substance abuse treatment services.48
Demographic Characteristics and Medicaid’s Role
The percentage of North Carolinians living in poverty in 2016 (14 percent) was slightly above the national percentage (13 percent).49 Per capita personal income in the state is $39,171, the 12th lowest among states and below the national average of $46,049.50 Consequently, the state’s federal medical assistance percentage (FMAP) is relatively high at 68 percent.51 In FY 2015, Medicaid accounted for 67 percent of federal funds received by the state, followed by K-12 education accounting for 12 percent of federal funds.52
Twenty-two percent of the nonelderly population lives in rural areas in North Carolina (compared to a national average of 19 percent), and research shows that Americans in rural areas often face unique challenges in health care coverage and access, including low density of providers and longer travel times to care, limited access to employer-sponsored coverage, and greater health care needs due to older age and lower income.53
Medicaid plays an important role in North Carolina’s health system, covering 18 percent of the population in 2016.54 However, North Carolina is one of 19 states that has chosen not to expand Medicaid up to 138 percent of the federal poverty level (FPL) with enhanced federal funding provided under the ACA. Due to this decision, many adults in the state fall into a “coverage gap” because their incomes are above Medicaid eligibility limits but below the lower limit (100 percent FPL) for Marketplace insurance premium tax credits. In 2016, North Carolina had the fourth largest number of adults in the coverage gap (219,000) among states, following Texas, Florida, and Georgia.55 Overall, 11 percent of North Carolina’s total population remained uninsured in 2016 (compared to nine percent nationally).56
North Carolina performs worse than the national average on a number of health status measures. It had the 13th highest percentage of people reporting fair or poor health status in 2015 (19.2 percent)57 and ranked 32nd among states in overall health status in 2016.58 The state’s opioid overdose death rate was higher than the national rate in 2015 (11.9 deaths per 100,000 people compared to 10.4 nationally).59 The rate of new HIV diagnoses among adults and adolescents was also higher than the national rate in 2015 (15.9 deaths per 100,000 people compared to 14.7 nationally).60 North Carolina had the eighth highest percentage among states of people reporting not seeing a doctor due to cost in 2015 (15.5 percent, tied with Arkansas and Tennessee),61 and had the 10th highest percentage of adults reporting a serious mental illness in the last year in 2014-2015 (tied with Oregon and Missouri).62
North Carolina’s Medicaid Expansion Efforts
North Carolina is one of the 19 states that has not expanded Medicaid.63 Shortly after taking office in January 2017, Governor Cooper announced his intention to take immediate executive action to expand Medicaid under the Affordable Care Act (ACA). He planned to do so by filing an amendment to the state Medicaid plan, seeking approval from the Obama administration in the waning days before the presidential transition.64 However, on January 13, 2017, Republican legislative leaders in the state House and Senate filed a federal lawsuit challenging the governor’s plan to expand without legislative approval65 and on January 14, 2017, a federal judge issued an order to temporarily suspend Cooper’s effort to expand for 14 days or until the court took further action.66 Given the timing, the temporary suspension prevented the expansion plan from moving forward before the Trump Administration took power.67
The lawsuit pointed to a 2013 state law that prohibits the executive branch from expanding Medicaid unilaterally, however, Governor Cooper contended that the statute impinges on the “core executive authority” of the executive branch. Although the state legislators ultimately dropped the lawsuit in July 2017 because the governor’s office never officially submitted an expansion proposal to the Centers for Medicare and Medicaid Services (CMS),68 the president of the state Senate and speaker of the state House pledged to renew the lawsuit if the governor makes further attempts to expand Medicaid without legislative approval.69
In 2017, a group of Republican lawmakers introduced legislation called Carolina Cares. This legislation would increase eligibility for Medicaid up to 138 percent of FPL, impose premiums and co-payments, implement work requirements, and encourage preventive care and wellness activities.70 If it passes, implementation will occur in coordination with other delivery system transformation activities underway.
Managed Care in North Carolina Today
Community Care of North Carolina (CCNC) is North Carolina’s provider-led enhanced primary care case management (PCCM) program. Over 1,800 physician practices participate, and North Carolina’s program is often cited as a national model for PCCM. It assigns eligible beneficiaries to a medical home that coordinates their care. It also offers access to local care managers who provide complex case management to high risk beneficiaries and education to help all beneficiaries self-manage their chronic conditions. The model is designed to reduce potentially preventable hospital admissions and readmissions, improve access to primary care, and better manage chronic conditions.
As part of the CCNC model, 14 regional Community Care networks receive a monthly administrative fee in exchange for providing population health management tools, case management, data analysis, and quality improvement support for participating medical homes. Behavioral health services are not included in the PCCM program. They are managed separately by Local Management Entities (LMEs) under 1915(b) and (c) waiver authority.
Many studies have evaluated CCNC’s impact and estimate savings ranging from $105 to $2,290 annually across different eligibility groups.71 One study showed that certain measures of health outcomes, such as reduction in hospital admissions and reduction in emergency department visits for asthma, also improved.72
Medicaid Redesign in North Carolina
In 2015, the state General Assembly passed Session Law 2015-245. This legislation requires the state’s Medicaid program to transition from the enhanced PCCM model to capitated managed care.73 Session Law 2015-245 envisions a competitive bid process with participation by commercial plans, which would operate statewide, and regional, provider-led entities licensed by the state Department of Insurance. It requires that cost growth not exceed two percentage points below the national Medicaid spending growth rate and requires submission of a Section 1115 demonstration waiver.
Under Governor Pat McCrory (R), the state crafted a Section 1115 demonstration waiver to implement the statute’s reforms. The waiver was submitted to CMS on June 1, 2016. It reflected the vision of the prior administration, and closely tracked the program design established in state statute.
While the waiver was pending, Governor Cooper, a Democrat, took office on January 1, 2017. Waiver negotiations have resumed, and Governor Cooper’s administration indicated they plan to submit an amended Section 1115 demonstration waiver request. The Cooper administration’s initial plan for implementing capitated Medicaid managed care was outlined in a program design document recently released by the Department for Health and Human Services (DHHS) for public comment.74 The main features of the new administration’s plan are outlined below.
MCO Types And Enrollment Requirements
DHHS’s plan calls for participation by both commercial plans and regional, provider-led entities. State law specified three commercial plans would offer products statewide. Additionally, providers with a history of serving Medicaid beneficiaries can own and operate regional risk-based Medicaid managed care plans. Most Medicaid and CHIP beneficiaries will be mandatorily enrolled in capitated managed care. There will be limited exceptions for certain populations.75 However, specified special populations will be phased into mandatory managed care after program launch, ranging from one year for foster children to four years for dual eligibles and Medicaid-only beneficiaries receiving long-stay nursing home services.
Plan Types And Behavioral Health Integration
Pending legislative approval, DHHS intends to allow commercial MCOs and provider-led entities to offer two plan types: standard plans and tailored plans. Standard plans would cover most Medicaid and CHIP beneficiaries and would provide integrated physical health, behavioral health, and pharmacy services. Standard plan enrollees would have access to all state plan behavioral health benefits including inpatient and outpatient behavioral health services and enhanced behavioral health services. Tailored plans would cover special populations with complex health care needs including individuals with serious mental illness (SMI), substance use disorder, or intellectual or developmental disabilities (I/DD)) (and eventually other populations like dual eligibles).76 Tailored plans would provide integrated physical health, behavioral health, and pharmacy services but would also offer enhanced services, including facility-based crisis services, partial hospitalization ambulatory detoxifications, outpatient opioid treatment, and substance abuse intensive outpatient services.77
Medical Homes, Value Based Payment, and Provider Transformation Support
DHHS will certify “Advanced Medical Homes,” initially based on the state’s existing Carolina Access program, which over time must provide expanded care management activities, such as addressing social determinants of health or opioid addiction, to receive additional reimbursement. Health plans will work closely with the providers, and be responsible for monitoring their care management activities and filling in any gaps. They will also be incentivized to adopt value-based payment reimbursement models to improve population health and telehealth initiatives to expand access in rural parts of the state. DHHS will create standardized social needs screening tools and will seek Section 1115 waiver expenditure authority to establish Regional Provider Support Centers. These new centers will provide tools, resources, and other supports to help providers, especially small and rural providers, achieve their care goals.
Safety Net Funding
DHHS indicates it will develop an alternative payment approach to support safety net providers in compliance with new federal rules as it transitions to managed care.78
Redesign Next Steps and Implementation Timeline
For the next two fiscal years, implementing managed care is DHHS’ number one priority. It pervades everything the Medicaid program is doing, and requires preparing staff, beneficiaries, and providers for the change. The state is currently working with the state legislature to obtain additional statutory authority required by their revised plan. Later this year the state will seek additional stakeholder input through a Request for Information (RFI) to assess the market’s readiness to implement managed care. The state will also need to submit an updated waiver request to CMS, negotiate waiver terms, develop a Request for Proposal (RFP) to select participating commercial and regional provider-led health plans, and conduct readiness reviews. The state has set a target implementation date of July 2019.
Addressing the Opioid Abuse Crisis
North Carolina has been hit hard by the nation’s opioid abuse crisis. More than 12,000 people have died from opioid-related overdoses since 1999 and from 2013 to 2015 the opioid death rate has grown by 37 percent.79,80 Opioid-related overdose deaths cost the state $1.3 billion in 2015. Governor Cooper’s goal is to reduce opioid-related deaths by 20 percent. An Opioid Action Plan supports this goal, and includes recommendations for building a coordinated infrastructure, expanding treatment and recovery services, improving access to Naloxone, reducing oversupply and diversion of prescription drugs, and increasing community awareness. 81
In June 2017, the General Assembly passed the Strengthen Opioid Misuse Prevention (STOP) Act. The STOP Act limits initial opioid prescriptions for acute pain, supports needle exchange programs, and requires prescribers and pharmacies to check the state’s prescription drug monitoring system prior to prescribing or filling an opioid prescription. The legislation also expands access to Naloxone through local health departments and law enforcement agencies, and requires electronic prescribing for opioids.82
North Carolina’s Medicaid program has adopted its own efforts to combat opioid abuse. In FY 2017, it decreased daily dose limits (from 750 morphine milligram equivalents (MMEs) to 120 MMEs); established quantity limits (14-day quantity limit) for initial opioid prescriptions; increased the refill threshold for opioids and benzodiazepines from 75 percent to 85 percent; and made it easier to obtain Naloxone. It also expanded its lock-in program capacity to ensure that all individuals who meet program criteria are enrolled, and extended the required lock-in period from one to two years.83
Going forward, DHHS hopes to implement additional initiatives to enhance prevention and treatment. Strategies outlined in DHHS’s recently proposed program redesign for Medicaid managed care include:
Adding low intensity residential services to improve transitions between inpatient and outpatient care
Establishing behavioral health homes for individuals with SMI, serious emotional disturbance, and substance use disorders
Using the state’s prescription drug monitoring system to issue care alerts to providers when patients have opioid prescriptions through multiple providers
Offering bundled payments for buprenorphine treatment to support effective care management and medication and counseling services
Using community pharmacies to help screen, identify, and refer individuals to available resources
Incorporating opioid prescribing performance metrics into future health plan contracts, and requiring health plans to design and implement an opioid misuse prevention program
North Carolina Medicaid Policy Changes FY 2017 and FY 2018
Provider Rates
4 percent rate increase for nursing facilities in FY 2017
Anticipate targeted provider rate increases in FY 2018 for physician-administered vaccines and contraceptives and personal care services
Benefits and Pharmacy
Implementing new pharmacy utilization controls in FY 2017 and FY 2018
Planning to adopt Centers for Disease Prevention and Control (CDC) opioid prescribing guidelines in FY 2018
Strengthening pharmacy benefit management policies to prevent opioid-related harms, decreasing daily dose limits (from 750 MMEs to 120 MMEs); establishing quantity limits (14-day quantity limit) for initial opioid prescriptions; increasing the refill threshold for opioids and benzodiazepines from 75 percent to 85 percent; and making it easier to obtain Naloxone. In FY 2018, North Carolina will further decrease the quantity limit for initial opioid prescriptions to five days for acute pain and seven days for post-operative pain as required by state law.
Planning to remove prior authorization requirements for SUD treatment (i.e., Suboxone) to ensure immediate access in FY 2018
Long-term Services and Supports (LTSS) Rebalancing
Increasing the number of individuals receiving home and community-based services (HCBS) in the community by adding a total of 320 slots to a 1915(c) waiver for adults with disabilities in FY 2018
Planning to add two new PACE locations in FY 2018
Renewed the 1915(c) waiver for medically frail children, which includes consumer-directed care, in FY 2017, and increased the number of slots to 4,000
Increased slots in the intellectual and developmental disabilities (IDD) waiver by 400 in FY 2018
Issue Brief: West Virginia
Economic and Budget Outlook
Economy and State Revenues
In 2015, West Virginia fell into an economic recession primarily driven by continued job losses in the coal industry and a slowdown in the natural gas industry.84 The state continued to struggle economically in 2016 as its real Gross Domestic Product (GDP) shrank by 0.9 percent. West Virginia was one of only seven states with negative GDP growth in 2016, driven, again, by negative growth in the mining sector but also by losses in the construction sector.85 More recently, however, growth in the mining sector nationwide resulted in economic growth in the state. In the first quarter of 2017, West Virginia had the second-highest GDP growth rate in the nation (3.0 percent), second only to Texas (3.9 percent) and just ahead of New Mexico (2.8 percent) whose economies are also heavily reliant on mining.86
Looking ahead, University of West Virginia economists forecast continued moderate growth for the remainder of CY 2017, but warned that economic outcomes vary across the state and that “it will take years to recover all of the jobs that have been lost since early 2012.”87 The state’s labor force has shrunk by nearly 5 percent since its high in June of 2009, which has contributed to decreasing rates of unemployment.88 The state’s unemployment rate dropped from 6.0 percent in August 2016 to 5.0 percent in August 2017, the labor force also shrank by 0.5 percent) during that same time period.89 West Virginia had the lowest work force participation rate among all states at 53.2 percent, presenting “a significant hurdle for long-run economic prosperity.” 90,91
Except for a one-year state revenue rebound of 8.1 percent in FY 2011, West Virginia state revenue growth has remained low or negative since the onset of the Great Recession with an average annual growth rate of -0.2 percent between FY 2008 and FY 2016.92 In addition to weak economic growth, a variety of tax cuts since 2007 have also reduced annual state revenues by at least $415 million.93 For FY 2017, general revenues were originally projected to grow by 2 percent, but came in $21 million below target as of June 30, 2017.94 Improving severance tax collections beginning in March 2017, resulting from natural gas price increases and an increase in coal production, helped the state avoid a larger shortfall predicted to be as high as $192 million earlier in 2017.95 Looking ahead, state general revenue collections are projected to grow by a modest 1.4 percent in FY 2018.96
State Budget
At the start of CY 2017, newly-elected Democratic Governor Jim Justice faced both a current year budget shortfall for FY 2017 of $123 million and a projected budget gap for FY 2018 of $497 million.97 To close the FY 2017 shortfall, the Governor used a combination of midyear spending cuts totaling nearly $60 million and one-time special revenues, including $40 million from the state’s Rainy Day reserve.98,99 In February, he also offered an Executive Budget proposal that included over $450 million in revenue enhancements to close the projected budget gap for FY 2018 and fund base budget increases for Medicaid, public retirement systems, and classroom teacher raises.100
In April 2017, Governor Justice vetoed a state budget passed by the Republican-controlled legislature that did not include the revenue enhancements proposed by the Governor, but did include $110 million in spending cuts and a $90 million transfer from the Rainy Day reserve that the Governor feared would put the state’s bond rating at risk.101 On June 21, 2017, however, the Governor announced that he would allow a subsequent budget passed by the legislature to become law without his signature – despite his objections to its cuts – to avoid a state government shut-down that might otherwise have occurred on July 1, 2017.102 Compared to FY 2017 appropriation levels, nearly every area of the FY 2018 budget, including Medicaid, was cut with the only significant funding increases for payments to the Teacher’s Retirement System Unfunded Liability and the State Police.103 FY 2018 General Revenue Fund appropriations are slightly below actual FY 2013 spending and, after adjusting for inflation, also less than FY 2008 spending.104
Less than seven months into his first term, Governor Justice announced on August 3, 2017, that he was switching parties to become a Republican later saying that his decision was driven by the refusal of legislative Democrats to support his push for tax reform during the budget special session. He also said he made the change because it had given him the ear of President Trump and his Administration to listen and seriously consider plans to bring back coal jobs and allocate federal funds to the state.105
Demographic Characteristics and Medicaid’s Role
West Virginia has the third highest percentage of people living in poverty among all states (along with New Mexico, 18 percent in 2016),106 the second lowest personal income per capita among states ($36,132 in 2014),107 and the second highest share of its total population enrolled in Medicaid (26 percent in 2016).108 Due to the state’s low per capita income, it has one of the highest federal medical assistance percentages (FMAPs) at 73 percent in fiscal year 2018,109 and over three-quarters (79 percent) of all federal funds that West Virginia receives are for Medicaid.110 Nearly half (46 percent) of West Virginia’s population resided in rural areas in 2015.111
West Virginia’s population faces multiple high health needs and limited access to care. The state ranked 43rd among states in overall health status in 2016112 and had the highest percentage among states of people reporting fair or poor health status in 2015 (25.9 percent).113 In addition to being hit harder than any other state by the opioid epidemic (as described in detail below), West Virginia has the highest obesity rate in the country (71.1 percent in 2015)114 and the highest percent among states of the non-institutionalized population reporting a disability (19.5 percent in 2015).115 Access limitations in the state make addressing these serious health needs even more difficult: 30 percent of people in West Virginia lived in a health professional shortage area for primary care and had limited access to the services they need as of December 2016 (the 8th highest percentage among states),116 while 13.8 percent of adults reported not seeing a doctor due to cost in 2015.117 This range of serious health needs and access challenges coupled with Medicaid’s important role in providing necessary services to high-need populations suggest that West Virginia is a state that would be at particularly high risk under potential caps on Medicaid funding.118
Update on the Affordable Care Act
Medicaid Expansion
West Virginia elected to expand Medicaid coverage to newly eligible groups under the Affordable Care Act (ACA) in January 2014, extending coverage to non-disabled childless adults for the first time. While the state’s actuaries had predicted new enrollments in the first year of about 63,000, actual enrollment through the end of June 2014 increased by over 130,000 – more than twice the projected first year increase.119 As of FY 2016, statewide Medicaid expansion enrollment had grown to over 180,000 and accounted for nearly one-third of total Medicaid enrollment.120 West Virginia’s expansion enrollment success was partially related to their implementation of facilitated enrollment (or “fast track enrollment”) options, including enrolling eligible individuals into coverage using data already available from the state’s Supplemental Nutrition Assistance Program (SNAP) as well as Medicaid enrollment data for children (used to reach eligible parents).121 According to the Centers for Medicare & Medicaid Services (CMS), total West Virginia Medicaid and Children’s Health Insurance Program (CHIP) enrollments grew by over 57 percent between the third quarter of CY 2013 (prior to the implementation of the ACA and Medicaid coverage expansions) through June 2017.122
Marketplace Coverage
The ACA provided states the option of establishing their own Marketplaces or relying on the federally-facilitated Marketplace (FFM), www.healthcare.gov. West Virginia was one of seven states that chose a “State Partnership Marketplace” model allowing the state to rely on the FFM but retain control over plan management and some consumer assistance activities.123 In April 2017, however, Governor Justice signed into law HB 2119 that repeals the state law establishing the West Virginia Health Benefit Exchange effective July 4, 2017,124 likely resulting in the state reverting to the FFM model. The West Virginia Marketplace had just one carrier in 2014 and 2015, but grew to two carriers in 2016 and 2017 and will continue to have two carriers in 2018.125 During open enrollment for the 2017 plan year, 34,045 West Virginians selected a West Virginia Marketplace plan.126
Delivery System Reforms
Managed Care
West Virginia has operated a risk-based Medicaid managed care program – Mountain Health Trust – since September 1996. Under this program, the state currently contracts with four managed care organizations (MCOs) to provide medically necessary Medicaid services to most Medicaid enrollees statewide, although, school-based services, transplant services, long-term care, personal care and non-emergency medical transportation services are “carved out” of the MCO contracts. As of July 1, 2017, pharmacy services were also carved out of the MCO benefit package.127 As of September 2017, there were approximately 420,000 members enrolled in Mountain Health Trust.128
Addressing The Substance Use Disorder Crisis
The misuse of and addiction to opioids, including prescribed pain relievers, heroin, and synthetic opioids such as fentanyl, is a serious and growing national public health crisis that has hit West Virginia harder than most other states. In 2015, West Virginia had the highest age-adjusted drug overdose death rate (41.5 per 100,000), more than twice the national rate (16.3 per 100,000). 129 Between 2012 and 2015, the drug overdose death count increased by nearly 30 percent, from 558 to 725,130 and between 2014 and 2016, 37 of every 1,000 births in the state involved a baby born with Neonatal Abstinence Syndrome (NAS) resulting from substance abuse among pregnant women.131 The state has the second highest rate of prescription drugs filled: 21.8 drugs per capita, compared to 12.7 nationwide.132 Out of home foster care placements have grown by more than 30 percent over the past three years from 4,366 in April 2014 to 5,772 in April 2017, driven in part by substance abuse by the parents.133
Recognizing the substantial public and private harms generated by this crisis, the state has taken numerous steps in recent years to curb the epidemic:134
In 2015:
The legislature passed legislation making naloxone (an opioid overdose antidote) available to first responders and to relatives, friends, caregivers or persons in a position to assist someone at risk of experiencing an opiate-related overdose.
The state launched its first ever Behavioral Health Referral and Outreach Call Center to provide resources and referral support 24-hours a day (this took place in September 2015).
The West Virginia Department of Health and Human Resources (DHHR), Bureau for Children and Families (BCF) launched Safe at Home West Virginia (this took place in October 2015). This program provides wraparound behavioral health and social services to youth ages 12 – 17 years with certain behavioral health needs who are currently in congregate care or at risk of entering congregate care.
In 2016, the legislature:
Authorized pharmacists and pharmacy interns to dispense naloxone without a prescription in accordance with a Board of Pharmacy protocol.
Passed the Medication-Assisted Treatment (MAT) bill. MAT combines behavioral therapy and medications to treat substance use disorders (SUDs). Clinics that use MAT must be licensed or registered by the state, provide counseling in conjunction with treatment and test their patients to ensure they are using the medication as intended.
The Substance Abuse and Mental Health Services Administration (SAMHSA) awarded the state a Cooperative Agreement to Benefit Homeless Individuals in partnership with four Continuum of Care Organizations. This agreement will be used to enhance the state’s infrastructure to provide effective, accessible treatment and recovery support services to veterans, nonveterans, families, and youth experiencing homelessness who have mental health and SUDs.
Some cities and towns have also initiated syringe exchange programs to reduce the risk of spreading diseases associated with intravenous drug use, such as hepatitis B, hepatitis C and HIV/AIDS, and in Huntington, a non-profit residential infant recovery center, Lily’s Place, has opened to provide short-term medical care to infants suffering from prenatal drug exposure.
Adoption of CDC Opioid Prescribing Guidelines
Building on the Centers for Disease Control (CDC) Opioid Prescribing Guidelines, West Virginia Medicaid initiated a new program on January 17, 2017, to encourage the safe prescribing of opioid medications. This program is designed to help prescribers be aware of the total morphine milligram equivalency (MME) of their patient’s opioid prescriptions, especially patients seeing more than one provider for pain management. The Public Employees Insurance Agency (PEIA) implemented the same program in January 2017, and a common prior authorization form was developed for use in both the PEIA and Medicaid Programs.135 Beginning in July 2017 (the effective date of the carve-out of pharmacy benefits from managed care contracts), these opioid prescribing guidelines are also being phased in for MCO members.136
Section 1115 SUD Waiver
On October 6, 2017, CMS approved West Virginia’s Section 1115 demonstration waiver application to address the state’s SUD crisis with an effective date of January 1, 2018.137 The purpose of the Creating a Continuum of Care for Medicaid Enrollees with Substance Use Disorders waiver is to promote access to SUD treatment and prevention services and build a comprehensive continuum of care across the state to more effectively prevent and treat SUDs in West Virginia. Features of the waiver include expanded coverage for methadone, naloxone, peer recovery support, withdrawal management and short-term residential services for all Medicaid enrollees.
Health Homes
In July 2014, the West Virginia Department of Health and Human Resources, Bureau for Medical Services implemented a Health Homes initiative (authorized under ACA Section 2703) focused on members in a six-county region who suffer from bipolar disorder and who may have hepatitis B or C (Health Home I). In April 2017, this initiative was expanded statewide (Health Home II), and a second Health Home pilot (Health Home III), targeting diabetes and obesity, was launched in 14 counties.138
The state’s Health Home model focuses on the member’s entire condition, behavioral health, physical health, and social needs. By addressing all member needs, the Health Home model is designed to reduce emergency room (ER) visits and inpatient admissions for both physical and behavioral health issues, and improve the member’s overall quality of life. Results from the Health Home I implementation demonstrated success in reducing ER utilization, inpatient admissions, and overall costs, which led the state to initiate the Health Homes II statewide expansion and the new Health Homes III pilot.
Additional policy actions the state either implemented in FY 2017 or planned to implement in FY 2018 are described in the table below.
West Virginia Medicaid Policy Changes FY 2017 and FY 2018139
Provider Rates
FY 2017:
Increased MCO rates and nursing facility rates.
All other rates were flat.
FY 2018:
Plan to increase MCO rates and nursing facility rates.
Plan to hold all other rates flat.
Benefit Changes
FY 2017:
Liberalized medical necessity criteria for hepatitis C antiviral agents.
FY 2018:
Through Section 1115 waiver authority, the state will expand substance use disorder (SUD) treatment coverage to create a continuum of care for Medicaid enrollees with SUD issues. New SUD treatment services and supports will include:
Statewide adoption of the Screening, Brief Intervention, and Referral to Treatment (SBIRT) method to ensure a consistent and effective enrollment process for the waiver
Expanded coverage of withdrawal management in regionally identified settings
Short term, residential SUD treatment
Enhanced access to outpatient SUD treatment as appropriate when residential treatment is not required
Coverage of methadone and methadone administration
Comprehensive initiative for distributing naloxone and cross-training staff on administration of naloxone
Coverage of clinical and peer recovery support services and recovery housing supports.
Copayment Changes
FY 2018:
Changing the pharmacy copayment requirements from a tiered approach ($0.50 – $3) based on drug price to a flat rate of $1 for generics and $3 for brands. The change is expected to be cost-neutral to the state.
Pharmacy Changes
FY 2017:
Hepatitis C antivirals carved out of managed care contracts effective April 1, 2017.
New pharmacy utilization controls applied.
New provider education/profiling initiative implemented.
CDC Opioid Prescribing Guidelines adopted for fee-for-service enrollees.
FY 2018:
Pharmacy benefit carved out of managed care contracts effective July 1, 2017.
Following pharmacy managed care carve-out, plan to enhance rebate collection efforts and further reduce ingredient cost reimbursement.
Will expand pharmacy utilization controls.
Will expand provider education/profiling initiative.
CDC Opioid Prescribing Guidelines will be implemented, on a phased-in basis, for MCO members beginning July 1, 2017.
Managed Care and Delivery System and Payment Reforms
FY 2017:
Non-dual, non-LTSS SSI members enrolled into managed care on a mandatory basis.
·Health Homes for persons with bipolar disorder and who have or are at risk of having hepatitis B or C expanded statewide (April 2017).
New Health Home pilot targeting diabetes and obesity implemented (April 2017).
FY 2018:
Quality withhold eliminated from managed care contracts.
Requirement added to MCO contract requiring 10 percent of the plan’s enrollees to be part of an Alternative Provider Payment Model. Plans allowed to determine model(s) used.
Long Term Services and Supports Rebalancing
FY 2018:
Planning to expand the number of persons served in the Individuals with Developmental Disabilities Waiver.
Bureau of Labor Statistics, Tables & Calculators by Subject: Labor Force Statistics from the Current Population Survey (Bureau of Labor Statistics, October 2017), https://data.bls.gov/timeseries/LNS14000000. ↩︎
Governor Cooper later called on the General Assembly to implement expansion in his FY 2017-2019 budget proposal, which would add up to 624,000 individuals to the program. The governor argued that expansion would pay for itself, with the non-federal share covered by provider contributions and the influx of federal dollars leading to job creation, healthier hospital finances, and $4.4 billion in new spending in the state.
NC Office of the Governor, Governor Roy Cooper’s Recommended Budget, 2017-2019: Common Ground Solutions for North Carolina, (Office of the Governor, March 2017), https://files.nc.gov/ncosbm/documents/files/BudgetBook_2017_web.pdf. ↩︎
Federal and state Health and Human Services were named as defendants in the lawsuit, not Governor Cooper. ↩︎
Beneficiaries dually eligible for Medicaid and Medicare, PACE beneficiaries, medically needy beneficiaries, beneficiaries only eligible for emergency services, presumptive eligible enrollees (during presumptive eligibility period), and Health Insurance Premium Payment (HIPP) beneficiaries, family planning beneficiaries, and prison inmates. All excluded populations would continue to receive health benefits on a fee-for-service basis. Members of federally recognized tribes will have a choice between FFS and capitated managed care plans. ↩︎
The state envisions phasing tailored plans in. At program launch, beneficiaries with more serious behavioral health or I/DD needs would continue to receive care via FFS and LME-MCO. ↩︎
Enhanced care management through behavioral health and I/DD health homes is also under consideration. ↩︎
In contrast to the original waiver application, DHHS no longer plans to pursue a Delivery System Reform Incentive Payment (DSRIP) initiative. ↩︎
The Kaiser Family Foundation State Health Facts. Data Source: Kaiser Family Foundation analysis of Centers for Disease Control and Prevention (CDC), National Center for Health Statistics. Multiple Cause of Death 1999-2015 on CDC WONDER Online Database, released 2016. “Opioid Overdose Death Rates and All Drug Overdose Death Rates per 100,000 Population (Age-Adjusted)” accessed September 19, 2017, http://modern.kff.org/other/state-indicator/opioid-overdose-death-rates. ↩︎
The unemployment rate represents the total number of unemployed individuals divided by the size of the labor force. A decreasing labor force can lead to decreases in unemployment rates even if the number of unemployed individuals remains the same or even increases since the denominator (size of the labor force) shrinks. ↩︎
Since 2007, the state has phased out both the grocery tax on food and the business franchise tax, lowered the corporate net income tax rate, and created other tax credits for business and low-income families. Ted Boettner and Sean O’Leary, Confronting the Fiscal Gap: The Governor’s Amended 2016 Budget and Proposed 2017 Budget, West Virginia Center on Budget & Policy, Policy Brief February 16, 2016, accessed at http://www.wvpolicy.org/wp-content/uploads/2016/02/PDF-FY17-Gov-Budget-Brief-2.16.16-FINAL.pdf. ↩︎
Erickson, W., Lee, C., von Schrader, S. (2017). Disability Statistics from the 2014 American Community Survey (ACS). Ithaca, NY: Cornell University Employment and Disability Institute (EDI). Retrieved June 7, 2017 from www.disabilitystatistics.org. ↩︎
The Kaiser Family Foundation State Health Facts. Data Source: Kaiser Family Foundation analysis of Medicaid enrollment data collected from the Centers for Medicare and Medicaid Services (CMS) Medicaid Budget and Expenditure System (MBES), “Medicaid Expansion Enrollment,” http://modern.kff.org/health-reform/state-indicator/medicaid-expansion-enrollment. ↩︎
Holly Hedegaard, M.D., Margaret Warner, Ph.D., and Arialdi M. Miniño, M.P.H. Drug Overdose Deaths in the United States, 1999-2015, Centers for Disease Control and Prevention, National Center for Health Statistics, NCHS Data Brief, No. 273, February 2017; accessed at https://www.cdc.gov/nchs/data/databriefs/db273.pdf. ↩︎
The Kaiser Family Foundation State Health Facts. Data Source: Kaiser Family Foundation analysis of Centers for Disease Control and Prevention (CDC), National Center for Health Statistics. Multiple Cause of Death 1999-2015 on CDC WONDER Online Database, released 2016, “Opioid Overdose Deaths and Opioid Overdose Deaths as a Percent of All Drug Overdose Deaths,” http://modern.kff.org/other/state-indicator/opioid-overdose-deaths. ↩︎
When an opioid prescription is submitted for a member in the fee-for-service delivery system, the member’s medication profile is evaluated to determine the patient’s average MME dose for the past 90 days. An average does that equals or exceeds 50 MME will trigger further review through the prior authorization process and the patient will be locked into one pharmacy of their choice for prescriptions for controlled substances so their therapy can be more carefully managed. Ibid. ↩︎
West Virginia response to the 2017 Medicaid Budget Survey for State Fiscal Years 2017 and 2018, Kaiser Commission on Medicaid and the Uninsured. ↩︎
Knowledge and Awareness of Key Facts Regarding Enrollment Is Low
As the Nov. 1 start of the Affordable Care Act’s open enrollment period nears, new polling data from the Kaiser Family Foundation finds that most potential enrollees are unaware of when they can enroll and have not seen any related advertisements.
Fielded prior to yesterday’s announcement of a bipartisan marketplace stabilization deal in the Senate that among other things would increase outreach funding, the survey highlights key gaps in knowledge among people who are uninsured or who are current marketplace enrollees.
One in six (15%) people without health insurance and four in 10 (40%) marketplace enrollees know that open enrollment begins on November 1 this year. Even fewer (5% of the uninsured, 25% of marketplace enrollees) are aware of the month when open enrollment ends in their state.
The poll finds that few of those most likely to consider marketplace coverage report hearing or seeing any ads providing information about how to get insurance under the health care law. Small shares of the uninsured (19%) and marketplace enrollees (12%) say they saw ads in the past 30 days that provided information about how to get insurance.
Slightly more than half (54%) of the uninsured say they plan to get health insurance in the next few months, while four in 10 (43%) expect to remain uninsured despite the individual mandate.
Most marketplace enrollees satisfied with their plans but worry about costs
While Congress weighs legislative changes to stabilize the marketplaces, the new survey also provides a snapshot of the experiences of current marketplace enrollees. Despite reports of plans dropping out of the marketplaces, most (70%) report being satisfied with their insurance choices. However, nearly four in 10 (36%) say they are worried that their current insurance company will stop selling plans in their area.
At a time when funding for cost-sharing reduction payments hangs in the balance in the Congress, significant shares of marketplace enrollees report struggling with and worrying about affordability issues. For example:
Three in 10 (30%) marketplace enrollees say premiums have gone up a lot lately. Most (57%) expect their premiums to increase next year, including about a quarter (28%) who say it will be a major financial burden.
More than a third (37%) say that their deductibles and co-pays have been going up lately. Most (60%) marketplace enrollees also say they worry their co-pays and deductibles will become so high that they can’t afford to get needed care.
Marketplace enrollees’ concerns about cost and availability in many ways are similar to those of people with employer coverage. For example, about half (49%) of those with employer coverage report that their deductibles and co-pays have been going up lately. Similarly, half (51%) say their premiums have been going up, including a quarter (25%) who say they have gone up a lot.
The poll also finds most of the public (71%), including most marketplace enrollees (79%), are aware that the Affordable Care Act’s individual mandate that requires most people to obtain health coverage or pay a fine remains in effect. Among the uninsured, a smaller majority (59%) are aware the mandate is in effect, though one in five (18%) believe it is not and one in four (23%) are unsure.
The vast majority (85%) of marketplace enrollees also say they plan to sign up for health insurance during the 2018 open enrollment period, and most of them (54% of the total marketplace enrolllees) prefer to renew their current plan if it is available next year.
Among marketplace enrollees, one in four (26%) say the law’s requirement for them to have health insurance or else pay a fine is a “major reason” they chose to purchase coverage. However, most (55%) say it was “not a reason,” and the vast majority (90%) say they would continue to buy their own insurance even if the government stopped enforcing this requirement.
METHODOLOGY
Designed and analyzed by public opinion researchers at the Kaiser Family Foundation, the poll was conducted by telephone from September 13th-24th and October 5th-10th, 2017 among a random sample of 2,505 adult U.S. residents, including an oversample of respondents who purchase their own insurance (Non-Group Enrollees). Interviews were conducted in English and Spanish by landline (867) and cell phone (1,638). The margin of sampling error is plus or minus 2 percentage points for the full sample, plus or minus 9 percentage points for marketplace enrollees (n=195), plus or minus 7 percentage points for the uninsured ages 18-64 (n=206), and plus or minus 4 percentage points for those ages 18-64 with employer coverage (n=935). For results based on other subgroups, the margin of sampling error may be higher.
The start of the open enrollment period for non-group insurance in 2018 is less than one month away, and the majority of individuals who are targets for enrollment – those who currently purchase their own insurance and those who are uninsured – are unaware of the key dates of the next open enrollment period. One-third of non-group enrollees overall and 15 percent of the uninsured are aware of when the next open enrollment period begins. A slightly larger share (40 percent) of marketplace enrollees are aware of the November 1st start date for open enrollment, but still six in ten either give an incorrect answer or say they don’t know when open enrollment begins.
Overall, the experiences of marketplace enrollees are more similar than different than those with employer coverage when it comes to costs and choices. While nearly half of non-group enrollees (48 percent) and marketplace enrollees (43 percent) say that it seems like their premiums have being going up lately, they are no more likely to say that than those with employer-sponsored insurance (51 percent). When asked about their deductibles and co-pay expenses, about half (49 percent) of those with employer-sponsored insurance say their cost-sharing has gone up lately, as do 43 percent of all non-group enrollees and 37 percent of marketplace enrollees. Yet, marketplace enrollees are more likely to express worry about their future ability to afford insurance and health care services. Six in ten marketplace enrollees say they are worried that their cost sharing will become so high they won’t be able to afford their health care coverage and about half of marketplace enrollees (55 percent) say they are worried their premiums will increase so much that they won’t be able to afford the plan they have now. Worries about increasing cost-sharing and premiums are lower among those with employer coverage (39 percent and 35 percent, respectively).
In light of the ongoing debate about the stability of the ACA marketplaces, about one-fourth of marketplace enrollees are confident President Trump and Congress will be able to work together to improve the marketplaces. Among individuals who purchased plans through the ACA marketplaces, about three-fourths are either “not too confident” (28 percent) or “not at all confident” (46 percent) that President Trump and Congress will be able to work together to make improvements to the marketplaces.
Who Are Non-Group Enrollees?
This report examines people’s experiences with the current health insurance market, with a particular focus on individuals who currently have health insurance they purchased themselves (referred to as “non-group enrollees” throughout the report) which is comprised of individuals who purchase their own insurance through an Affordable Care Act (ACA) marketplace (“marketplace enrollees”) as well as those who purchase their insurance outside of the ACA markets.1 According to the most recent estimates, 10.3 million people have health insurance that they purchased through the ACA exchanges or marketplaces.2 For comparison, the report also examines individuals ages 18-64 without health insurance (“uninsured”) as well as those who get their insurance through their employer (“employer-sponsored insurance”). These extended interviews were conducted as part of the September and October Kaiser Health Tracking Polls and were completed prior to the beginning of the law’s fifth open enrollment period, which begins on November 1st.
The Next Open Enrollment Period
The start of the open enrollment period for non-group insurance in 2018 is less than one month away, and the majority of individuals who are targets for enrollment – those who currently purchase their own insurance and those who are uninsured – are unaware of the key dates of the next open enrollment period. One-third of non-group enrollees overall and 15 percent of the uninsured are aware of when the next open enrollment period begins. A slightly larger share (40 percent) of marketplace enrollees are aware of the November 1st start date for open enrollment, but still six in ten either give an incorrect answer or say they don’t know when open enrollment begins.
Figure 1: Most Uninsured and Large Shares of Non-Group Enrollees Are Unaware of the Timing of Open Enrollment
Similarly, the majority of the uninsured (95 percent), non-group enrollees overall (80 percent), and marketplace enrollees (75 percent) either give an incorrect answer or say they don’t know when open enrollment ends.3
Few Say They Have Seen Advertisements For Open Enrollment
One reason why key populations may not be aware of the dates of the next open enrollment period may be because few report hearing or seeing any ads providing information about how to get insurance under the health care law. About one-fifth of the uninsured (19 percent) and one in ten non-group enrollees (14 percent) or marketplace enrollees (12 percent) say they saw ads in the past 30 days that provided information about how to get insurance. A somewhat larger share say they saw ads from an insurance company attempting to sell insurance in the past 30 days. About three in ten (28 percent) of the uninsured and about one-fourth of non-group enrollees overall (24 percent) and marketplace enrollees (24 percent) say they saw such ads.
Among the general public, the share who reports seeing such ads is lower than it was in the months leading up to the ACA’s second open enrollment period in 2014 (which began on November 15, 2014). Among the public overall, one-third (32 percent) in the October 2017 poll say they have seen ads from an insurance company attempting to sell health insurance in the past 30 days (compared to 44 percent in October 2014) and one in five (18 percent) say they have seen ads that provide information about how to get health insurance under the ACA (down from 33 percent in 2014).
Figure 2: Compared to Pre-Open Enrollment in 2014, Smaller Shares Report Seeing Ads Related to Health Insurance
Most Non-Group Enrollees Plan to Sign Up for Health Insurance in 2018
Despite the lack of awareness surrounding the dates of the next open enrollment period, eight in ten non-group enrollees say they plan to sign up for health insurance during the next open enrollment period and most (65 percent) prefer to renew their current plan if it is available while one-third plan to shop around. Similar shares of marketplace enrollees plan to sign up for health insurance in 2018 (85 percent) and 64 percent prefer to renew their current plan.
Figure 3: Large Share of Non-Group Enrollees Plan to Get Coverage in 2018
The Experiences of Individuals With Private Insurance
By focusing on marketplace enrollees, this report is able to compare the experiences of individuals who purchase their own insurance through an ACA marketplace with the current health insurance market to those who get their insurance through their employer. Overall, the experiences of marketplace enrollees are more similar than different than those with employer coverage when it comes to costs and choices. However, marketplace enrollees are more likely to express worry about their future ability to afford insurance and health care services.
Premiums and Cost-Sharing
While nearly half of non-group enrollees (48 percent) and marketplace enrollees (43 percent) say that it seems like their premiums have being going up lately, they are no more likely to say that than those with employer-sponsored insurance (51 percent). When asked about their deductibles and co-pay expenses, about half (49 percent) of those with employer-sponsored insurance say their cost-sharing has gone up lately, as do 43 percent of all non-group enrollees and 37 percent of marketplace enrollees.
Figure 4: Enrollees in Both Non-Group and Employer-Sponsored Plans Report Increases in Premiums and Cost-Sharing
More individuals with private insurance – regardless of how they get their insurance – expect their premiums to increase either “a lot” or “a little” next year rather than decrease or stay the same. About six in ten (58 percent) non-group enrollees expect the amount they pay for their health insurance premiums to increase next year, as do 57 percent of marketplace enrollees and about half (54 percent) of individuals with employer-sponsored insurance. Three in ten non-group enrollees and two in ten of those with employer coverage expect their premiums to increase “a lot.”
Figure 5: Enrollees in Both Non-Group and Employer-Sponsored Plans Expect Premium Increases Next Year
Among those who expect an increase in their insurance premium, most say it will be at least a minor financial burden on their family. About half of all non-group enrollees overall (48 percent) and marketplace enrollees (49 percent) who expect their premiums to increase next year expect this increase to be a financial burden, including about a quarter who expect it to be a “major burden.” A slightly smaller share (18 percent) of individuals with employer-sponsored insurance expect this increase to be a “major burden” while an additional 24 percent expect it to be a “minor burden.”
Figure 6: About Half of Marketplace Enrollees Expect Premium Increases in 2018 Will Be a Financial Burden
Choice of Plans or Insurers
About three-quarters (77 percent) of those with marketplace coverage say they had a choice of health plans from different insurance companies when they bought their current plan, while about one-sixth (17 percent) say there was only one insurer selling plans in their area. Similarly, seven in ten (69 percent) of those with employer-sponsored insurance say they had a choice of different health plans while three in ten (29 percent) say their employer only offered one plan.
While a majority of all non-group enrollees (71 percent) and marketplace enrollees (70 percent) report being satisfied with their insurance choices with about one-third of each reporting being “very satisfied,” fewer marketplace enrollees report being satisfied as those with employer coverage. Individuals with employer-sponsored insurance are more likely to report being satisfied (85 percent) with nearly half (47 percent) reporting they are “very satisfied.”
Figure 7: Those with Employer Coverage Are More Likely than Marketplace Enrollees to Be Satisfied with Choice of Plans
Worries About The Cost of Health Coverage
The survey indicates that those who purchase their own insurance are more likely than those with employer coverage to express worry about their future ability to afford insurance and health care services. Six in ten marketplace enrollees say they are worried that their cost sharing will become so high they won’t be able to afford their health care coverage. In addition, about half of marketplace enrollees (55 percent) say they are worried their premiums will increase so much in 2018 that they won’t be able to afford the plan they have now. Worries about increasing cost-sharing and premiums are lower among those with employer coverage (39 percent and 35 percent, respectively).
Figure 8: Worries About Affording, Keeping Insurance Higher Among Non-Group Enrollees than Those with Employer Coverage
The Role of the Individual Mandate
The majority of the public (71 percent) – including eight in ten non-group enrollees (79 percent) and marketplace enrollees (79 percent) – are aware the individual mandate for all individuals to either have health insurance or else pay a fine is still in effect. While 59 percent of the uninsured are aware the individual mandate is still in effect, about one in five (18 percent) believe it is not in effect and one-fourth (23 percent) are unsure.
Figure 9: Most Are Aware the Individual Mandate Is Still in Effect
While most are aware the mandate is still in effect, few report that it is a strong motivator to buy their own coverage. While two in ten non-group enrollees overall (22 percent) and a quarter of marketplace enrollees (26 percent) say the fact that the law requires them to have health insurance or else pay a fine is a “major reason” they chose to purchase coverage, most (62 percent overall and 55 percent of marketplace enrollees) say it is “not a reason.” Further, the vast majority of both groups (92 percent and 90 percent, respectively) say they would continue to buy their own insurance even if the government stopped enforcing this requirement.
Figure 10: Mandate Is a Reason for Some to Get Insurance, But Vast Majority Say They’d Still Buy It in the Absence of Mandate
A lot of confusion remains over the amount of the fine individuals will have to pay if they don’t get insurance in 2018 with most uninsured (63 percent) unaware of the amount and some offering amounts as low as $25 and as high as $25,000.
Figure 11: Most Uninsured Unaware of Fine Amount for Not Having Health Insurance
The Experiences of the Uninsured
This report also examines the experiences of the uninsured, a group that is a potential target for marketplace enrollment. When the uninsured are asked about the main reason they don’t have coverage, the most common response offered is that it is too expensive and they can’t afford it (37 percent), followed by job-related issues such as unemployment or their employer doesn’t offer health insurance (19 percent). Fewer offer they don’t need or want health insurance (8 percent) or that citizenship or residency issues have prevented them from getting it (8 percent).
Figure 12: Cost, Employment-Related Issues Main Barriers to Getting Insurance for the Uninsured
Just over half (54 percent) of the uninsured say they plan to get health insurance in the next few months, while four in ten (43 percent) expect to remain uninsured. Among those who plan to get insurance, one in five say they expect to purchase it from a marketplace or from an insurance company (17 percent) or say they expect to get coverage from an employer (16 percent). About one in ten (7 percent) say they expect to get coverage from Medicaid, the government health insurance and long-term care program for low-income adults.
Figure 13: Half of Uninsured Plan to Get Coverage, From a Mix of Sources
Despite the fact that over half of the uninsured say they plan to get health insurance in the next few months, few report having taken steps to get coverage in the past six months. About three in ten (27 percent) say they have sought out more information about getting health insurance, two in ten (22 percent) say they have tried to figure out if they qualify for Medicaid, and one in ten (13 percent) report they have tried to figure out if they qualify for financial assistance to purchase insurance on their own.
Figure 14: Few Uninsured Say They’ve Taken Steps to Get Coverage
Current Views of the ACA Marketplaces
With the start of open enrollment less than a month away, this report finds there is still some confusion over the ACA marketplaces with the public unsure of the stability of these marketplaces and who is affected by issues within the marketplaces. In addition, the public has little confidence in President Trump and Congress to be able to work together to improve the ACA marketplaces.
Are the ACA Marketplaces Collapsing? Depends on Who You Ask
While many experts4 say the marketplaces where people can shop for insurance are not currently collapsing, about half of the uninsured (52 percent), the overall public (48 percent), and those who purchase their own insurance (47 percent) believe, in general, the marketplaces are collapsing. Attitudes about the health of the marketplaces across the country are largely driven by party, even among those who are enrolled in the non-group market. The majority of Republicans and Republican-leaning independents (69 percent) who purchase their own insurance believe the nation’s marketplaces are collapsing, compared to three in ten Democrats and Democratic-leaning independents (29 percent).
Figure 15: Party Differences Among Non-Group Enrollees in Perceptions of ACA Marketplaces
Worries about Future Insurers’ Participation in Marketplaces
When asked about insurers’ participation in the marketplace in 2018, about one-third of non-group enrollees and marketplace enrollees report being worried that there will either be no insurance companies left selling plans in their area (33 percent and 36 percent, respectively) or their current insurance company will stop selling plans in their area (34 percent and 36 percent, respectively). In comparison, about one-fifth (18 percent) of those with employer-sponsored insurance are worried their employer will stop offering them health insurance.
Figure 16: One-Third of Non-Group and Marketplace Enrollees Are Worried About Not Having Options in Their Local Marketplaces
Low Confidence in President Trump and Congress Working Together to Stabilize the Marketplaces
In light of the ongoing debate about the stability of the ACA marketplaces, few marketplaces enrollees are confident President Trump and Congress will be able to work together to improve the marketplaces. Among individuals who purchased plans through the ACA marketplaces, about three-fourths are either “not too confident” (28 percent) or “not at all confident” (46 percent) that President Trump and Congress will be able to work together to make improvements to the marketplaces. Fewer, about one-fourth (24 percent), express confidence in President Trump and Congress’ ability to work together. In addition, half of marketplace enrollees (52 percent) say the actions taken by President Trump and his administration are generally “hurting” the way the marketplaces are working. Fewer say the actions are either “not having much impact” (35 percent) or “helping” (11 percent) the marketplaces.
Figure 17: Marketplace Enrollees Not Confident in President Trump or Congress When It Comes to Improving Marketplaces
Uncertainty Remains on Who is Affected by ACA Marketplace Issues
Similar to previous surveys conducted by Kaiser Family Foundation, this month’s tracking poll finds about one-fifth of the public are aware that problems facing the ACA marketplaces only will affect those who buy health insurance on their own. When asked who will be affected by health insurance companies choosing not sell insurance plans in certain marketplaces, seven in ten incorrectly say it will affect either “everyone who has health insurance” or “only those who get their health insurance through their employer.” This is similar to the share who say the same about health insurance companies charging higher premiums in certain marketplaces.
Figure 18: About One-Fifth of Public Are Aware Marketplace Issues Only Affect Those Who Buy Their Own Insurance
Methodology
This survey was designed and analyzed by public opinion researchers at the Kaiser Family Foundation (KFF). Interviews were conducted by telephone from September 13th-24th and October 5th-10th, 2017 among a nationally representative random digit dial telephone sample of 2,505 adult U.S. residents. This includes interviews conducted as part of the September and October Kaiser Health Tracking Polls, as well as an oversample of respondents who purchase their own insurance (Non-Group Enrollees). Computer-assisted telephone interviews conducted by landline (867) and cell phone (1,638 including 1,041 who had no landline telephone) were carried out in English and Spanish by SSRS. For the landline sample, respondents were selected by asking for the youngest adult male or female currently at home based on a random rotation. If no one of that gender was available, interviewers asked to speak with the youngest adult of the opposite gender. For the cell phone sample, interviews were conducted with the adult who answered the phone. KFF paid for all costs associated with the survey.
Respondents were considered Non-Group Enrollees if they were between the ages of 18-64 and their main source of healthcare coverage is health insurance that they purchase themselves (excluding small business owners whose self-purchased insurance covers non-related employees). To efficiently obtain a sufficiently large sample of Non-Group Enrollees, given their overall low incidence in the general adult population, the sample included a subsample of respondents who had previously completed interviews on the SSRS Omnibus poll, and indicated that they met the specifications of Non-Group Enrollees (n=111). All RDD landline and cell phone samples were generated by Marketing Systems Group (MSG). The SSRS Omnibus poll involves a similar overlapping frame design.
A multi-stage weighting process was applied to ensure an accurate representation of the national population overall, and of non-group enrollees in particular. The first stage of weighting involved corrections for sample design, including accounting for the likelihood of non-response for the re-contact sample, number of eligible household members for those reached via landline, and a correction to account for the fact that respondents with both a landline and cell phone have a higher probability of selection.
In the second weighting stage, demographic adjustments were applied to account for systematic non-response along known population parameters. First, interviews conducted as part of the Health Tracking Poll (excluding the Non-Group Enrollee oversample) were weighted to match estimates for the national population using data from the Census Bureau’s 2015 American Community Survey (ACS) on sex, age, education, race, Hispanic origin, and region along with data from the 2010 Census on population density and current patterns of telephone use from the July-December 2016 National Health Interview Survey. This weighted sample was used to estimate the population share of Non-Group Enrollees, as defined for this study. The combined sample of Non-Group Enrollees (from both the Health Tracking Poll and the oversample) was then weighted separately, and scaled down to the proportion of Non-Group Enrollees in the weighted general population sample.
No reliable administrative data were available for creating demographic weighting parameters for Non-Group Enrollees, since the most recent Census figures could not account for the changing demographics of this group, specifically as they are defined in this study. Therefore, demographic benchmarks were derived by compiling a sample of all respondents ages 18-64 interviewed on the SSRS Omnibus survey between March 1 and August 27, 2017 (N=24,818) and weighting this sample to match the national 18-64 year-old population based on the 2017 U.S. Census Current Population Survey March Supplement parameters for age, gender, education, race/ethnicity, region, population density, and marital status, as well phone use based on the most recent estimates from the National Health Interview Survey (NHIS). This weighted sample was then filtered to include respondents meeting the definition of Non-Group Enrollee (N=2,245), and the demographics of this group were used as post-stratification weighting parameters for the combined Non-Group enrollee sample. Finally, weighted samples were combined and a final adjustment was applied to account for the over-representation of Non-Group Enrollees in the sample.
The margin of sampling error including the design effect for the full sample is plus or minus 2 percentage points. Numbers of respondents and margins of sampling error for key subgroups are shown in the table below. For results based on other subgroups, the margin of sampling error may be higher. Sample sizes and margins of sampling error for other subgroups are available by request. Note that sampling error is only one of many potential sources of error in this or any other public opinion poll. Kaiser Family Foundation public opinion and survey research is a charter member of the Transparency Initiative of the American Association for Public Opinion Research.
Group
N (unweighted)
M.O.S.E.
Total
2,505
±2 percentage points
Non-Group Enrollees ages 18-64
295
±7 percentage points
Age 18-64 with Employer Insurance
935
±4 percentage points
Uninsured ages 18-64
206
±7 percentage points
Marketplace Enrollees ages 18-64
195
±9 percentage points
Endnotes
Sixty-six percent of non-group enrollees in this survey are marketplace enrollees. ↩︎
There are seven states that have open enrollment periods that end in January 2018 (CA, CO, D.C., MA, MN, NY, WA). For all other states, the open enrollment periods ends on December 31, 2017. ↩︎