KFF designs, conducts and analyzes original public opinion and survey research on Americans’ attitudes, knowledge, and experiences with the health care system to help amplify the public’s voice in major national debates.
On November 2, 2017, the U.S. House of Representatives passed legislation (H.R. 849) to repeal the provision of the Affordable Care Act (ACA) that authorized the Independent Payment Advisory Board, or IPAB. Although IPAB was authorized under the ACA in 2010, no members have been appointed and currently the Board is not operational. These FAQs address common questions about IPAB, including how it was designed to operate and the implications of eliminating it.
What is the Independent Payment Advisory Board?
The Independent Payment Advisory Board was authorized by the ACA to help slow the growth in Medicare spending. The Board is to consist of 15 full-time independent experts to serve as members, appointed by the President and confirmed by the Senate. IPAB is directed to recommend Medicare spending reductions to Congress and the Administration if the per capita growth in Medicare spending exceeds specified target levels.
Why was IPAB authorized by the ACA?
IPAB was authorized to help constrain the growth in Medicare spending over time. The Board was conceived as an independent body of experts with authority to make Medicare savings recommendations if spending exceeded growth targets, according to a process specified in the ACA (described below). The goal was to create an evidence-based process that removes the political influence of stakeholders from Medicare payment policy decisions. Unlike the Medicare Payment Advisory Commission (MedPAC), which provides analysis and policy advice on Medicare to Congress, IPAB has statutory authority to recommend certain changes to Medicare that are required to be implemented to achieve savings (or equivalent savings proposals made by Congress).
Why is IPAB controversial?
IPAB has been a source of controversy from its beginning. Many members of Congress and other stakeholders have expressed concern about the authority granted to IPAB to make decisions about the Medicare program that are typically within the purview of Congress, such as modifications to the formulas used to establish payments for Medicare Advantage and Part D plans, provider payment rates, and prescription drugs. Some have expressed concerns about the potential for the Board to tilt the balance of power from Congress to the Executive branch with respect to Medicare policy. Another concern is the potential for IPAB’s recommendations to indirectly affect beneficiaries, despite explicit limits on IPAB’s scope of authority with respect to benefits, premiums, cost sharing, and “rationing.” In light of opposition to IPAB by many members of Congress, there have been several legislative attempts to repeal this provision of the ACA since 2010, including the latest House legislation (H.R. 849).
What would be the impact of the House-passed bill to repeal IPAB?
H.R. 849 would repeal provisions in the ACA that authorized the establishment of IPAB. According to CBO, repealing IPAB would increase spending by $17.5 billion between 2018 and 2027, because in CBO’s assessment, the Board will be required to generate Medicare savings of that amount over the 10-year period. The House legislation does not include offsets to cover the cost of repealing IPAB. Repealing IPAB could affect Part B premiums paid by beneficiaries and the financial outlook of the Medicare Hospital Insurance (Part A) trust fund.
What triggers IPAB to recommend Medicare spending reductions, and when is this expected to happen if IPAB is not repealed?
IPAB is required to propose Medicare spending reductions if the five-year average growth rate in Medicare per capita spending is projected to exceed the per capita target growth rate, based on general and medical inflation (2015-2019) or growth in the economy (2020 and beyond). The Centers for Medicare & Medicaid Services (CMS) Actuary is required to make this determination each year.
Each year since 2013, the CMS Actuary has made a determination that the Medicare per capita spending growth rate is not projected to exceed the target growth rate. In the 2017 Medicare Trustees report, the actuary projects that spending growth will exceed the target growth rate for the first time in 2021, and again in 2024, 2025, and 2026.
What is the timeline for action if the IPAB process is triggered?
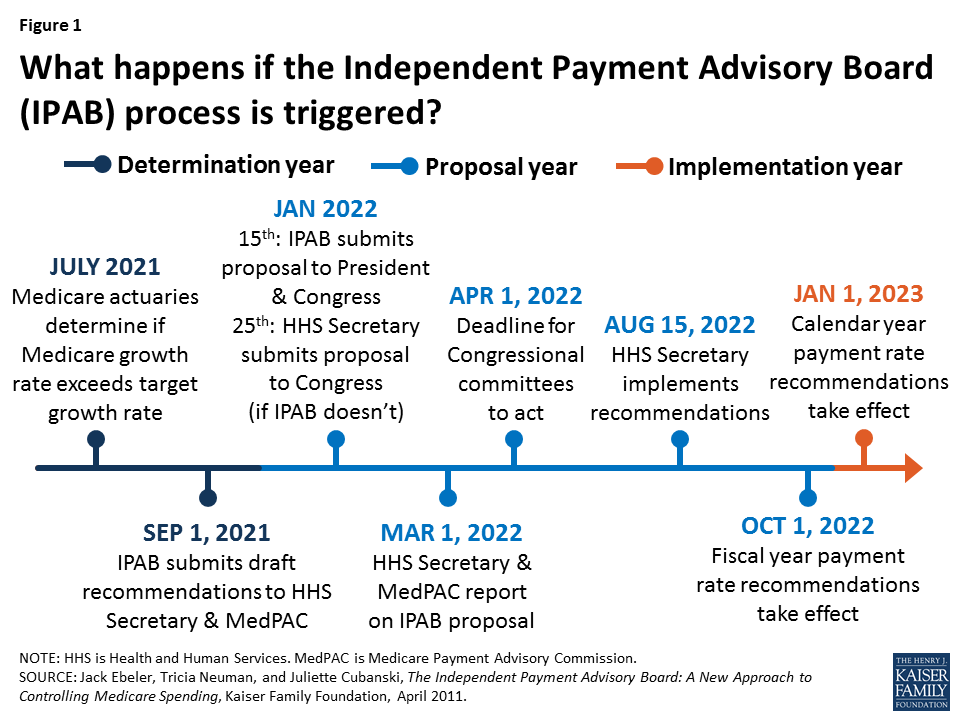
A determination by the Chief Actuary that Medicare spending reductions are required under the IPAB process initiates a three-year cycle, which includes a determination year (2021 in this case), proposal year (2022) and implementation year (2023) (Figure 1).
Figure 1: What happens if the Independent Payment Advisory Board (IPAB) process is triggered?
In January of the proposal year, IPAB is required to submit proposed recommendations for Medicare spending reductions to the President and Congress for fast-track consideration by the Congress. If the IPAB process is triggered because spending exceeds target levels, and IPAB does not submit savings proposals to the Congress, as required, then the Secretary of the Department of Health and Human Services (HHS) is directed to make recommendations to Congress that would achieve the required savings, and for implementing them.
How much Medicare savings is IPAB required to recommend?
The ACA set target growth rates for Medicare spending. The target is not a hard cap on Medicare spending growth, but if spending exceeds these targets, IPAB is required to submit recommendations to reduce Medicare spending by a specified percentage. According to the ACA, the required savings amount is the lesser of the percentage point difference between the Medicare growth rate and the target growth rate, or the “applicable percent”, multiplied by total Medicare program spending in the proposal year.
The “applicable percent” is the limit on the amount of Medicare savings that IPAB recommendations can achieve in the implementation year, and is defined as a percent of total Medicare spending in the proposal year multiplied by an amount specified in the ACA. For implementation years beginning in 2018 and later, the applicable percent is equal to 1.5 percent of total Medicare program spending to be achieved in the implementation year. For example, if the difference between the Medicare growth rate and the target growth rate is 1 percent, the required savings would be 1 percent of total Medicare spending, rather than 1.5 percent.
What types of Medicare spending reductions can IPAB recommend, and are there limits on what IPAB can propose?
The ACA limited the scope of the Board’s authority in terms of the type of spending reductions it can recommend. IPAB cannot make recommendation that would: (1) ration health care; (2) raise revenues or increase Medicare beneficiary premiums or cost sharing; or (3) otherwise restrict benefits or modify eligibility criteria. In addition, for implementation years through 2019, IPAB cannot recommend payment reductions for providers and suppliers of services that received reductions under the ACA below the level of the automatic annual productivity adjustment called for under the law. As a result, payments for inpatient and outpatient hospital services, inpatient rehabilitation and psychiatric facilities, long-term care hospitals, and hospices are exempt from IPAB-proposed reductions in payment rates until 2020.
For implementation year 2019, IPAB would be permitted to propose spending reductions for Medicare Advantage plans, the Part D prescription drug program, skilled nursing facility, home health, dialysis, ambulance and ambulatory surgical center services, and durable medical equipment (DME).
What is the role of Congress in the IPAB process?
The ACA established special fast-track procedures and strict deadlines for Congress to consider IPAB recommendations. After the Board submits its recommendations to Congress, the appropriate committees of jurisdiction have just two and one-half months to report out a bill implementing IPAB recommendations, or an amended proposal that achieves the same amount of required savings, by April 1 of the proposal year. The Committees, and the House and Senate, are prohibited from considering any amendment that would change or repeal the Board’s recommendations unless the changes meet the same fiscal criteria under which the board operates.
What is the outlook for IPAB?
The House of Representatives voted 309-111 in favor of H.R. 849 to eliminate the Independent Payment Advisory Board. The legislation now moves to the Senate for consideration. Even if IPAB is not repealed, the IPAB process is not expected to be triggered for another four years, based on the latest projections, and it is not clear if members would be nominated or confirmed given recent history.
The U.S. House of Representatives is considering legislation (H.R. 3922) to extend funding for the Children’s Health Insurance Program that includes a provision to increase Medicare premiums for some higher-income beneficiaries to help offset the cost of the legislation. The Congressional Budget Office (CBO) has estimated that this provision would increase Medicare’s premium revenues (and thereby reduce program spending) by $5.8 billion between 2018 and 2027. This issue brief describes current requirements with respect to Medicare’s Part B and Part D income-related premiums and proposed changes under the House legislation.
Overview of Current Law Related to Medicare Premiums
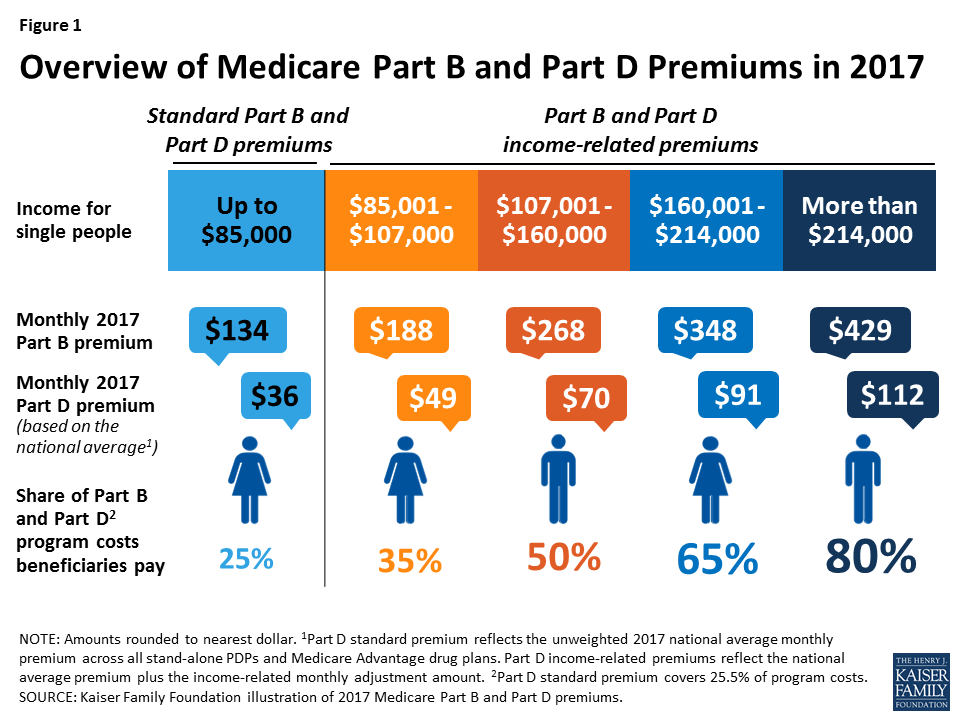
Today, most Medicare beneficiaries pay the standard monthly premium, which is set to cover 25 percent of Part B and Part D program costs, but a relatively small share of beneficiaries (around 6 percent in 2015) with incomes above $85,000 for single people and $170,000 for married couples are required to pay higher premiums for Medicare Part B and Part D—ranging from 35 percent to 80 percent of program costs, depending on their incomes (Figure 1).
Figure 1: Overview of Medicare Part B and Part D Premiums in 2017
Part B and Part D Standard Premiums
Monthly premiums for most people on Medicare equal 25 percent of average per capita Part B expenditures for Part B enrollees and 25.5 percent of average per capita Part D expenditures for drug plan enrollees. In 2017, the Part B standard monthly premium is $134; for Part D, the national average monthly premium, according to CMS, is $35.63. Actual monthly premiums for stand-alone Part D drug plans vary across plans and regions from a low of $14.60 to a high of $179 in 2017.
Income-Related Premiums for Part B and Part D
People on Medicare with incomes above $85,000 for individuals and $170,000 for couples are required to pay higher premiums for Medicare Part B and Part D. The Part B income-related premium was established by the Medicare Modernization Act of 2003 and took effect in 2007. The Part D income-related premium was established by the Affordable Care Act (ACA) and took effect in 2011. Under these provisions, beneficiaries with higher incomes pay a larger share of Part B and Part D program costs than 25 percent, ranging from 35 percent to 80 percent of per capita costs, depending on their income.
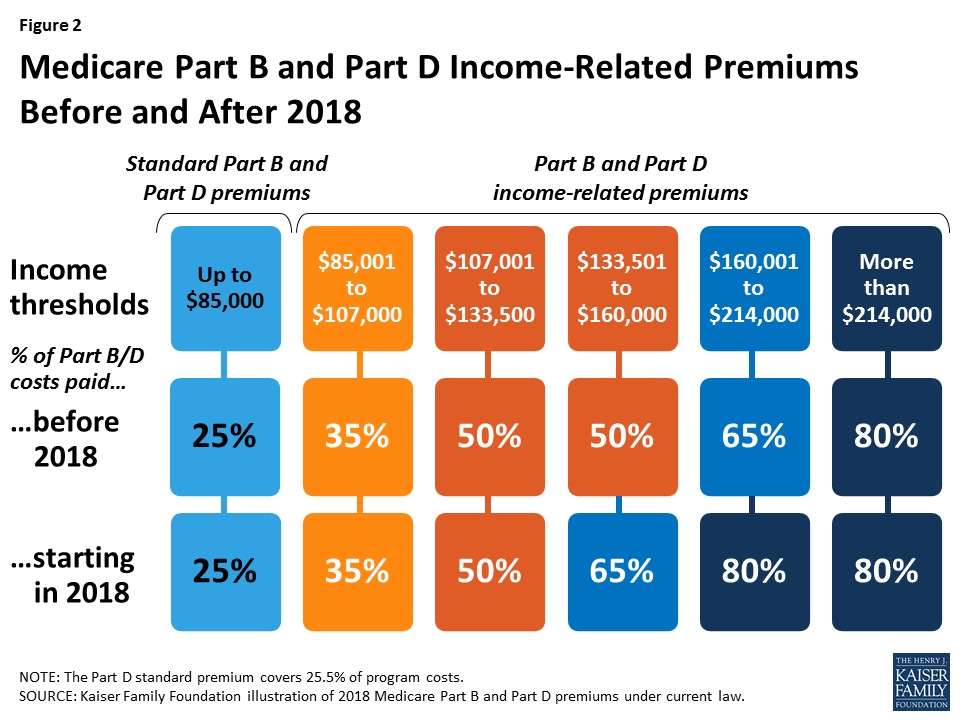
The Medicare Access and CHIP Reauthorization Act of 2015 (MACRA) made changes to Medicare’s income-related premiums that will affect beneficiaries with incomes above $133,500 ($267,000 for married couples) by requiring them to pay a larger share of Part B and Part D program costs beginning in 2018 (Figure 2):
Figure 2: Medicare Part B and Part D Income-Related Premiums Before and After 2018
Beneficiaries with incomes above $133,500 and up to $160,000 ($267,000-$320,000 for married couples) will pay 65 percent of Part B and Part D program costs starting in 2018, up from 50 percent prior to 2018. As a result of this change, monthly Part B premiums are expected to be $348 in 2018 for beneficiaries in this income group, rather than $268 that year, based on projections of Part B program costs from the Medicare Trustees.
Beneficiaries with incomes above $160,000 and up to $214,000 ($320,000-$428,000 for married couples) will be required to pay 80 percent of Part B and Part D program costs, rather than 65 percent. As a result of this change, Part B premiums in 2018 are expected to be $429 per month for beneficiaries in this income group, rather than $348 per month in that year, based on projections from the Medicare Trustees.
The income thresholds that determine the income-related premium payments are frozen through 2019, but will increase by about 2 percent in 2020 and will be indexed after that for general price inflation.
How Much are Beneficiaries Currently Paying For Part B and Part D Income-Related Premiums?
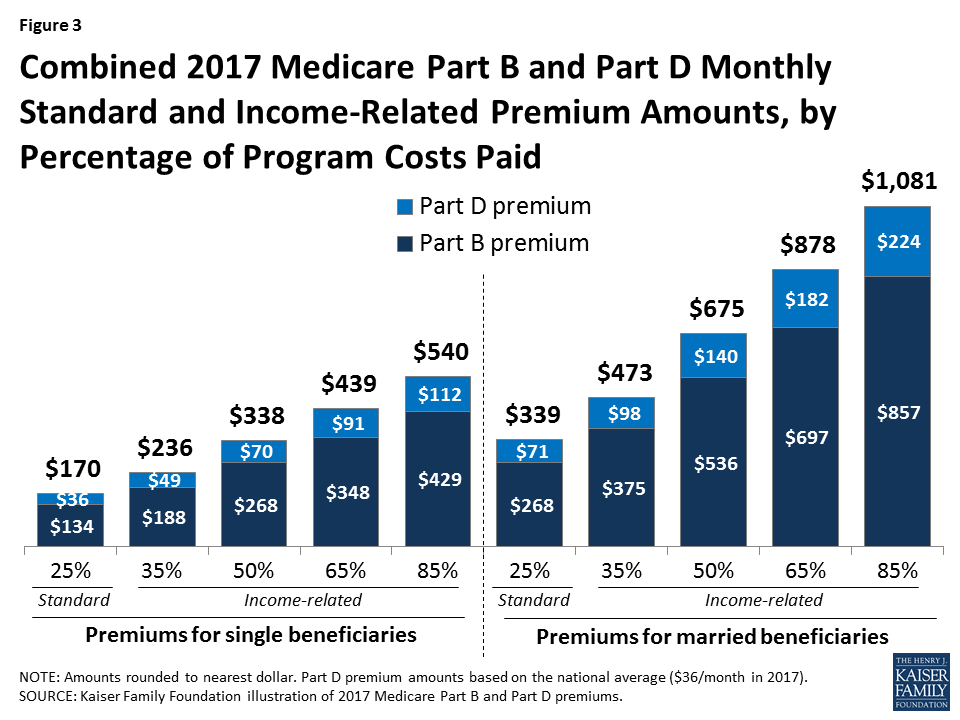
In 2017, Part B premiums for higher-income beneficiaries range from $188 per month for individuals with annual incomes above $85,000 up to $107,000, to $429 per month for individuals with incomes above $214,000. For Part D, higher-income beneficiaries pay a monthly premium surcharge in addition to the premium for their specific Part D plan; in 2017, the monthly premium surcharge ranges from around $13 for individuals with annual income above $85,000 up to $107,000, to an additional $76 for individuals with incomes above $214,000. When combined with the national average premium amount, higher-income Part D enrollees pay between $49 and $112 per month in 2017.
For beneficiaries enrolled in both Part B and Part D, the combined income-related monthly premiums range from $236 (35 percent of program costs) for single beneficiaries with incomes above $85,000 up to $107,000, to $540 (80 percent of program costs) for beneficiaries with incomes above $214,000 (Figure 3). Monthly income-related premiums for married couples who are both enrolled in Part B and Part D are twice these amounts, ranging from $473 for those with incomes up from above $170,000 up to $214,000, to $1,081 for couples with incomes above $428,000.
Figure 3: Combined 2017 Medicare Part B and Part D Monthly Standard and Income-Related Premium Amounts, by Percentage of Program Costs Paid
How Would the Proposed Legislation Change Medicare’s Income-Related Premiums?
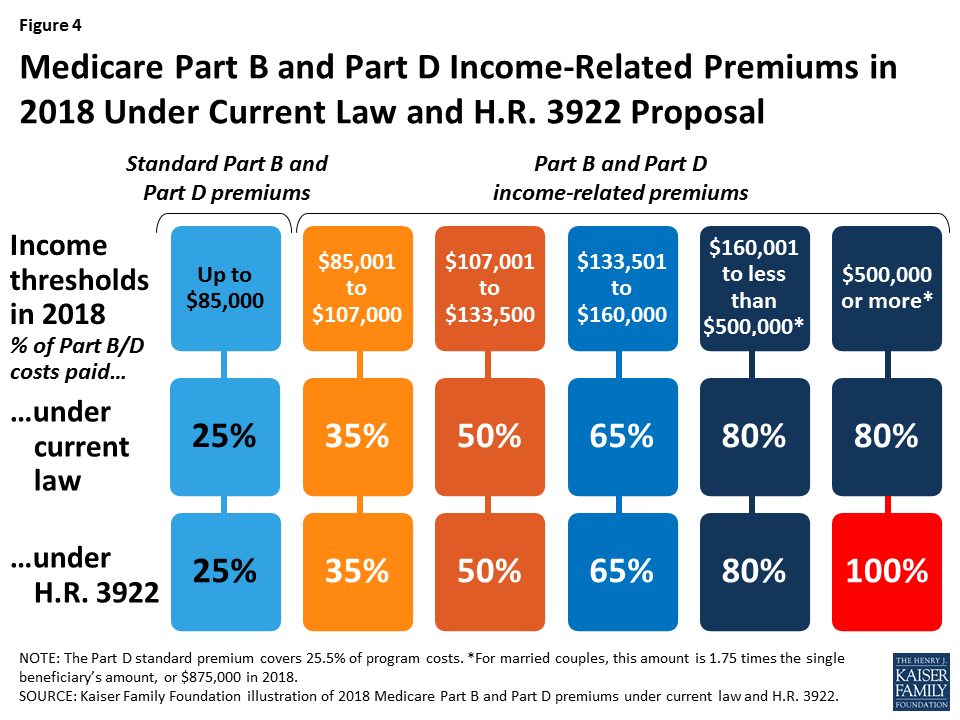
The proposed legislation would modify the income thresholds that determine which beneficiaries pay 80 percent of Part B and Part D program costs, and would create an additional category requiring certain higher-income beneficiaries to pay 100 percent of program costs, beginning in 2018 (Figure 4):
Figure 4: Medicare Part B and Part D Income-Related Premiums in 2018 Under Current Law and H.R. 3922 Proposal
Beneficiaries with incomes above $160,000 but less than $500,000 would pay 80 percent of Part B and Part D program costs, consistent with current law.
Beneficiaries with incomes of $500,000 or more would pay 100 percent of Part B and Part D program costs. For married couples, this income threshold would be set at 1.75 times the amount that single beneficiaries pay, or $875,000 in 2018.
The proposal would also change the inflation adjustment applied to the highest income-related premium category beginning in 2027.
Policy Implications
Increasing premiums for some beneficiaries who are already subject to income-related premiums will affect a relatively small share of the Medicare population. Part of the appeal of requiring higher-income beneficiaries to pay a greater share of Medicare costs is that these higher costs are imposed on only a relatively small share of beneficiaries who arguably have greater financial means to bear the additional expenses, thereby protecting the majority of people on Medicare with relatively modest incomes.
At the same time, there is some concern that the income thresholds used to trigger the payment of higher premiums by Medicare beneficiaries ($85,000 for individuals and $170,000 for couples) are lower than the thresholds used to define higher-income people in other policy discussions. There is also concern that imposing higher premiums could discourage higher-income people from enrolling in Part B and Part D, which could further erode Medicare’s financial status in the future. Adopting the House proposal would also mean that for the first time, some beneficiaries would not receive any federal subsidy for their Medicare Part B and Part D coverage and would be required to pay these costs in full. Another concern is that the Medicare savings associated with this proposal are not dedicated to Medicare but instead used to fund other priorities.
This fact sheet provides an overview of the status of action to extend federal funding for the Children’s Health Insurance Program (CHIP). Federal funding for CHIP expired on September 30, 2017. Without an extension of federal funding, states will begin running out of federal CHIP funds and face budget shortfalls. In early October, the House and Senate reported bills out of committee to extend CHIP funding. As of November 1, the House bill was amended to combine the extension of CHIP funding with an extension of funding for the Community Health Center (CHC) fund. The House is scheduled to vote on this bill on November 3rd. Final legislation to extend CHIP still requires passage by the full House and Senate, resolution of any differences between the House and Senate bills, and signature by the President. As time passes, states are facing increasing pressure as some are quickly approaching deadlines to make program changes to address the potential loss of federal funding. Without congressional action, the majority of states will face a FY2018 budget shortfall. As states run out of federal funds, some will take action to freeze enrollment or end coverage, which would lead to coverage losses for children.
What is CHIP?
Together with Medicaid, CHIP provides a strong base of coverage for our nation’s children and has helped reduce the nation’s uninsured rate for children to a record low of 5% (Figure 1). CHIP provides coverage to children in families that earn too much to qualify for Medicaid but who cannot access or afford private coverage. In 2016, CHIP covered 8.9 million children. All states have expanded coverage to children through CHIP. Some states provide CHIP through a separate CHIP program, some states have a CHIP-funded Medicaid expansion, and some states use a combination of both approaches. Reflecting these expansions, nearly all states cover children in families with incomes up to at least 200% of the federal poverty level (FPL), which is $40,840 for a family of three in 2017.1
Figure 1: Uninsured Rates Among Nonelderly Adults and Children, 1997-2016
What is the Status of Federal Funding for CHIP?
Federal funding for CHIP expired on September 30, 2017. CHIP is financed in partnership by states and the federal government. The federal government matches state spending on the program up to an annual limit on federal funds. To encourage state participation when CHIP was enacted, the federal government provided an enhanced (relative to Medicaid) matching rate for CHIP, which was further increased by 23 percentage points under the Affordable Care Act (ACA). With the increase under the ACA, the CHIP matching rate ranges from 88% to 100% across states. Federal CHIP funding ended on September 30, 2017. States can still use remaining federal funds from their FY2017 CHIP allotment to operate their programs and may receive a limited amount of redistribution funding from unspent funds across all states from prior years. However, once they exhaust those funds, no additional funds will be available unless Congress enacts legislation.
How are States Affected by the Expiration of CHIP Funds?
Without action to extend federal funding for CHIP, nearly all states will face a budget shortfall because nearly all states assumed federal funding for CHIP in their FY2018 state budgets. As of Summer 2017, 11 states reported that they will exhaust federal funding for CHIP by the end of 2017 and 32 projected running out by March 2018 (Figure 2). However, state projections are fluid and some have revised their estimates since that time. Although not included in the data reported as of Summer 2017, Minnesota indicated that it would exhaust its CHIP funds by the end of September 2017. In early October, the Centers for Medicare and Medicaid Services (CMS) provided additional redistribution funding to the state, allowing the state to maintain coverage without facing a budget shortfall through October.2 CMS also provided redistribution funds to several additional states that are close to running out of funds.3 However, these redistribution funds are limited and will be exhausted if no additional funds are provided. As states exhaust federal funding, they will need to determine how to address budget shortfalls, which will likely require special legislative sessions and/or Governor action because state budgets have already been passed. States will confront challenges replacing federal dollars since many were already facing budget shortfalls heading into FY2018.
Figure 2: State Projections of Dates of Exhaustion of Federal CHIP Funds, as of Summer 2017
How Does the Expiration of CHIP Funds Affect Coverage?
Some states plan to take action to reduce CHIP coverage as federal funds run out. States with CHIP-funded Medicaid expansions are required to continue this coverage under the ACA maintenance of effort requirement, and state costs for this coverage will increase since states will receive the lower federal Medicaid match rate. However, without federal funding, states with separate CHIP coverage are not required to maintain this coverage and some states are considering reducing this coverage. For example, in late September, Utah submitted a letter to the federal government outlining its plan to freeze enrollment in its CHIP program. Similarly, on October 11, 2017, New York submitted a letter indicating its potential plans to discontinue CHIP coverage if federal funding is not extended, noting that the state would need to fill a $1 billion shortfall to continue coverage for all currently enrolled children. In addition, some states, like Arizona and West Virginia, have states laws requiring them to close enrollment or end coverage if federal funding for CHIP decreases.
States are bumping up against deadlines to make program changes since it takes time to implement changes and notify families. States need sufficient time to notify families and other stakeholders of changes in coverage, make changes to eligibility systems, and train eligibility workers. They also must update contracts with managed care plans and third party administrators, conduct Tribal consultation as necessary, and submit necessary state plan amendments to CMS. Thus, as states grow closer to exhausting federal funds, they may begin taking action to implement changes. There also is the potential for significant confusion among families and wasted spending and administrative efforts for states if they begin to implement changes and then Congress later takes action to extend funding, causing states to reverse course.
Reductions in CHIP coverage would result in coverage losses for children and negative effects on children’s health and finances. If states close enrollment and/or discontinue coverage for children in separate CHIP programs, some children could shift to parents’ employer-sponsored plans or Marketplace plans, where they would likely have higher out-of-pocket costs and more limited benefits, and some children may be transitioned to Medicaid, but others would become uninsured. Previously, when some states closed enrollment in CHIP for limited periods in response to state budget pressures, studies showed that these enrollment caps and freezes led to coverage losses, left eligible individuals without access to coverage, and had negative effects on children’s health and family finances, including delayed care, difficulty obtaining medications, and significant financial hardships and medical debt.4
What is the Status of Action to Extend Federal Funding?
The House and Senate both have bills to extend federal funding for CHIP. In early October 2017, the Senate Finance Committee and House Energy and Commerce Committee reported bills out of committee to extend federal funding for CHIP. As of November 1st, the House bill was amended to combine the extension of CHIP funding with an extension of funding for the CHC fund. The House is scheduled to vote on this bill on November 3rd.
The current proposed bills mirror each other with respect to proposed policy for CHIP. They both would extend federal funding for five years, extend Express Lane Eligibility, extend the maintenance of effort requirement for children in families with incomes below 300% FPL, extend funding for demonstration programs and outreach and enrollment, and transition down from the 23 percentage point increase in the federal match provided by the ACA to the regular CHIP match rate (Table 1). These proposed policies would provide stability of financing for states and time to plan for the transition down to the regular CHIP match rate as well as maintain coverage protections for children. However, the House bill includes some other provisions that were not included in the Senate bill, including delaying and increasing cuts to Medicaid Disproportionate Share Hospital (DSH) payments and providing additional Medicaid financing to Puerto Rico and relief to the U.S. Virgin Islands.5 The House bill also identifies offsets for the cost of extending CHIP funding, while the Senate bill has not identified offsets. In addition, the amended version of the House bill includes provisions related to extending funding for the CHC fund and other public health provisions as well as offsets for these costs.
Table 1: High Level Comparison of Senate and House CHIP Funding Bills
S. 1827: KIDS Act of 2017(as of 10/4/2017)
H.R. 3922: CHAMPIONING HEALTHY KIDS Act(as of 11/1/2017)
CHIP Financing and Policies
Extends federal funding for CHIP for five years, with transition down from enhanced match rate to regular CHIP match rate
Extends state maintenance of effort requirement for children in families with incomes below 300% FPL, Express Lane Eligibility, and demonstration and outreach programs.
Other Provisions
No Provision
Delays Medicaid DSH cuts to FY2020 and increases reductions to $8 billion per year over the FY2021-2025 period
Provides $1 billion in Medicaid financing to Puerto Rico and additional relief to the U.S. Virgin Islands
Offsets for CHIP and Other Provisions
No Provision
Increases collection of third-party payments under Medicaid
Includes lottery winnings and other lump sums in Medicaid eligibility determinations
Increases Medicare premiums for higher income beneficiaries
Community Health Centers and Other Public Health Programs
No Provision
Extends Community Health Center fund and other public health provisions for two years
Offsets costs by reducing funding for the Prevention and Public Health Fund and shortening the grace period for unpaid premiums for individuals in subsidized Marketplace plans
Final legislation to extend CHIP still requires passage by the full House and Senate, resolution of any differences between the House and Senate bills, and signature by the President. As noted, the House is scheduled to vote on its bill on November 3rd. Timing for continued action in the Senate is unclear. If the House and Senate each pass a CHIP bill, they will then need to resolve any differences between the bills. This process could occur through a conference committee, which would require a second vote on a bill reached through compromise, or they could pass bills back and forth through each chamber until they both pass a bill with consistent language. Finally, the bill passed by both the House and Senate would go to the President, who could either sign it into law or veto it. If vetoed, the bill would then be sent back to Congress for a potential override of the veto.
Looking Ahead
CHIP has a long history of bipartisan support and has strong support from the public. In a September 2017 poll, three-quarters of the public said that it is important for Congress to work on reauthorizing funding for CHIP. Congress has taken initial steps to extend federal funding for CHIP and there is general agreement on proposed provisions related to CHIP. However, Congress still must complete a number of steps to pass final legislation, and, as part of this process, the House and Senate will need to resolve any differences between their bills and reach agreement on offsets. As Congress continues to work through this process, states are coming closer to exhausting federal funds and are beginning to bump up against deadlines to make program changes to address the loss of federal funding. As time passes, it will become increasingly likely that states will make reductions in CHIP that will result in coverage losses for children and erode the substantial coverage gains that have been achieved for children to date.
“HHS Poverty Guidelines for 2017,” Office of the Assistant Secretary for Planning and Evaluation, accessed October 13, 2017, https://aspe.hhs.gov/poverty-guidelines. ↩︎
Most Seriously Ill Seniors Struggle with Cognitive and Mental Health Challenges; Nearly Half Reportedly Have Problems Understanding Drug and Medical Instructions
Seniors with serious illness and their families are more likely to feel their wishes for medical care are being followed when they have written them down, finds a new Kaiser Family Foundation survey on the public’s views and experiences with illness in late life.
As America grows older and more people face serious illness late in life that can limit their ability to function, this new nationally representative survey provides an in-depth look at how Americans prepare for and deal with such illness.
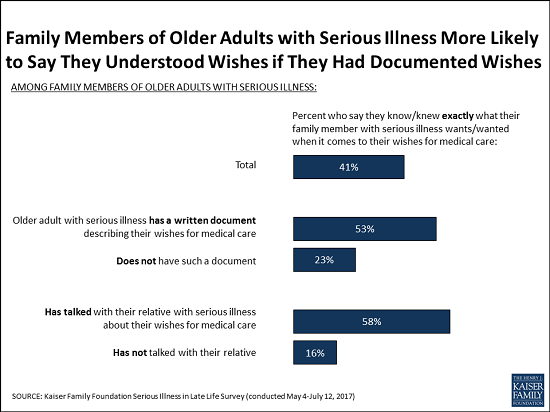
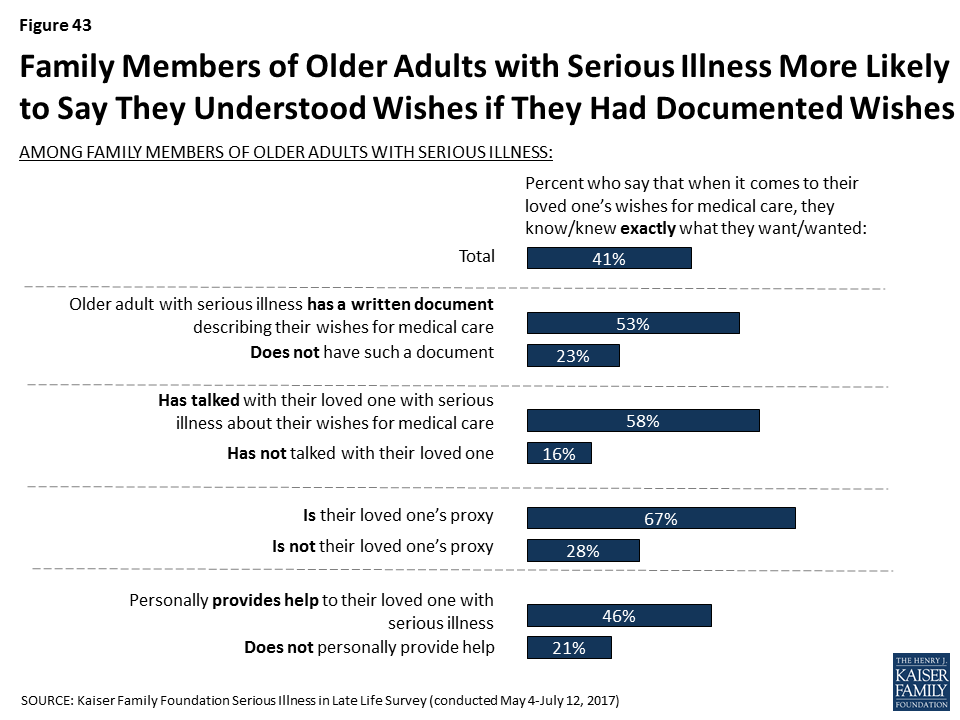
The survey finds that family members who say their seriously ill older relative has a written document outlining their wishes are more than twice as likely to say they know exactly what they want for medical care than those without such a document (53% versus 23%). Family members who say they talked with their seriously ill relative about their wishes are more than three times as likely than others to say they know exactly what they want (58% vs. 16%).
Similarly, seniors with serious illness themselves and their family members are more likely to say that the ill person’s wishes for medical care are being ‘very closely’ followed if the person has a document describing their wishes than if they don’t (70% vs. 54%).
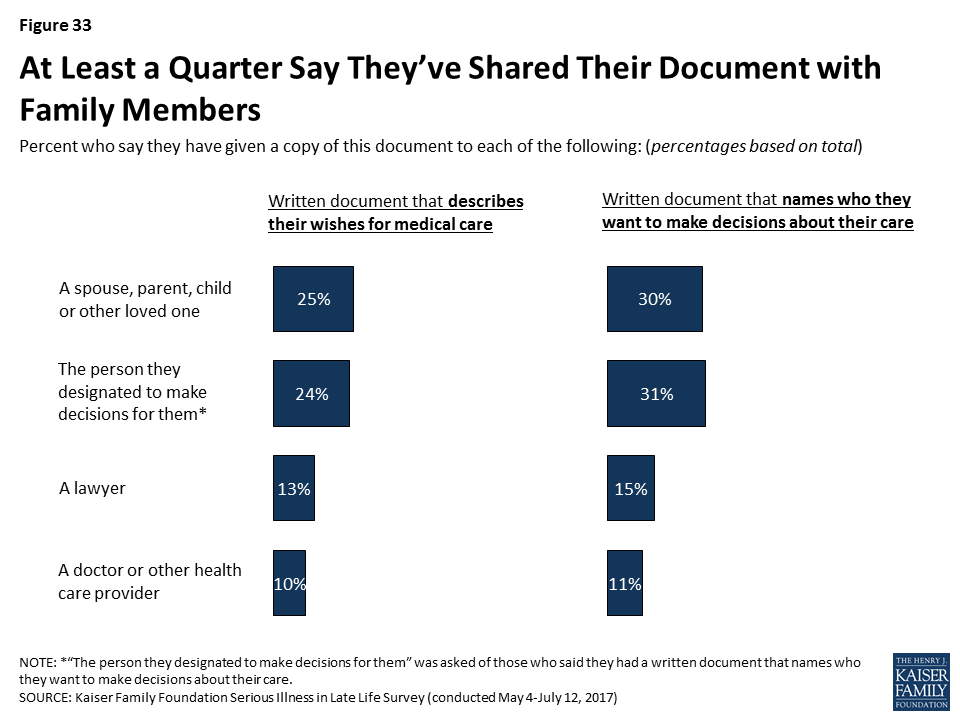
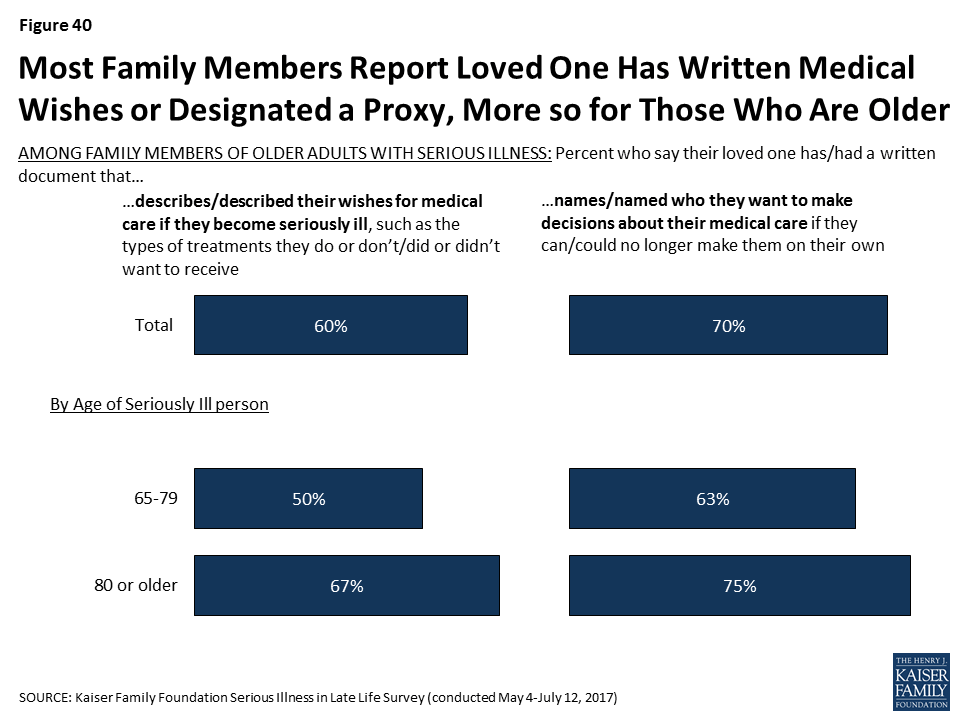
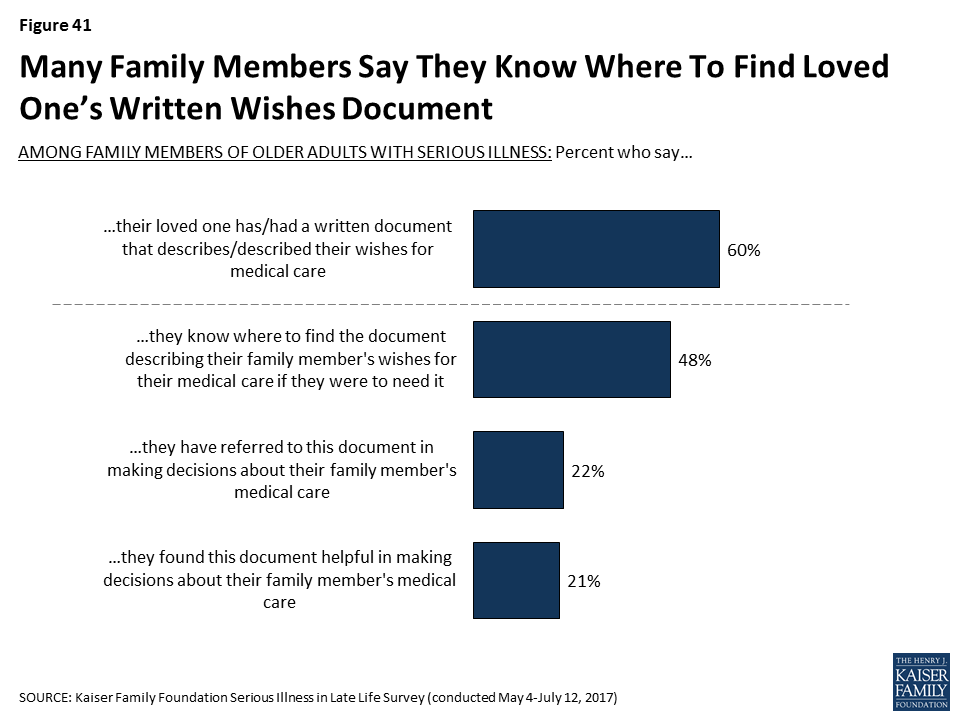
Most family members of seniors with serious illness report their relative has a document describing their wishes (60%) or a document naming someone to make medical decisions on their behalf (70%). About one in five (22%) family members say they have referred to the document outlining wishes for medical care, and nearly all of this group say it was helpful when they did so.
The survey is the first in a planned series that will track changes in attitudes and experiences around serious late-life illness and includes nearly 1,000 seniors and family members dealing with such illness. This survey considers older adults to be seriously ill if they have at least one chronic condition and report functional limitations due to a health or memory problem such as difficulty preparing meals, shopping for groceries, taking medications, getting across a room, eating, dressing, bathing, or using the toilet. Chronic conditions include diabetes, lung disease, heart disease, cancer, Alzheimer’s disease, dementia, depression, or chronic kidney disease or failure.
Other key findings related to seniors with late-life illness include:
Many seniors with serious illness reportedly face significant cognitive and mental-health challenges – including problems with forgetfulness (71%), feeling frequently sad or depressed (56%), feeling like a burden on others (51%), and loneliness (48%). Fewer (37%) feel as if they are not needed by other people.
Nearly half (48%) of seniors with serious illness have reportedly had a problem understanding instructions for medications and medical care in the past year. In addition, reports of trouble understanding instructions are much higher for those with dementia than for those without (64% compared to 30%).
Half (51%) of family members who help a relative with serious illness say they are providing assistance at least several hours a day, with another 12 percent providing help about an hour or day and others less frequently. While caregiving can be demanding and stressful, most of those who report helping with daily activities say someone can give them a break when they need it. However, one in five (21%) say there is no one to give them a break.
About half of family members helping with daily activities say that they have not received training from a nurse or other health professional in specific caregiving techniques including moving their ill relative safely, recognizing signs of pain or distress and administering medications. Three in 10 (31%) say they did not receive any of these types of training.
The survey also examines the broader public’s views around aging and illness in late life.
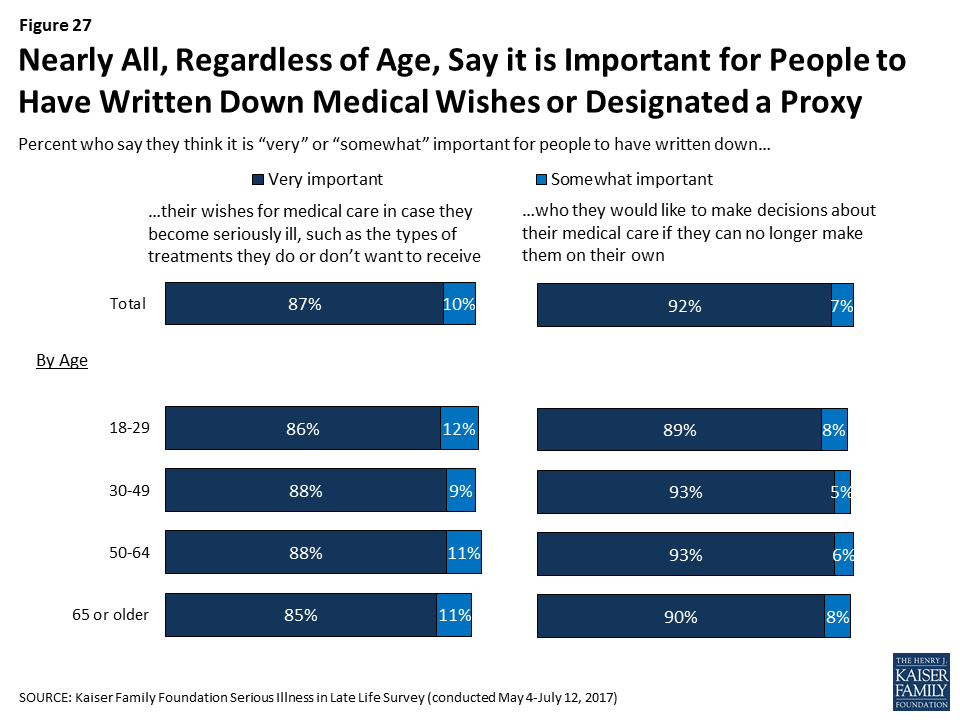
Nearly all Americans, regardless of age, say it is important for people to have written down their wishes for medical care or who they would like to make decisions about their medical care in case they become seriously ill.
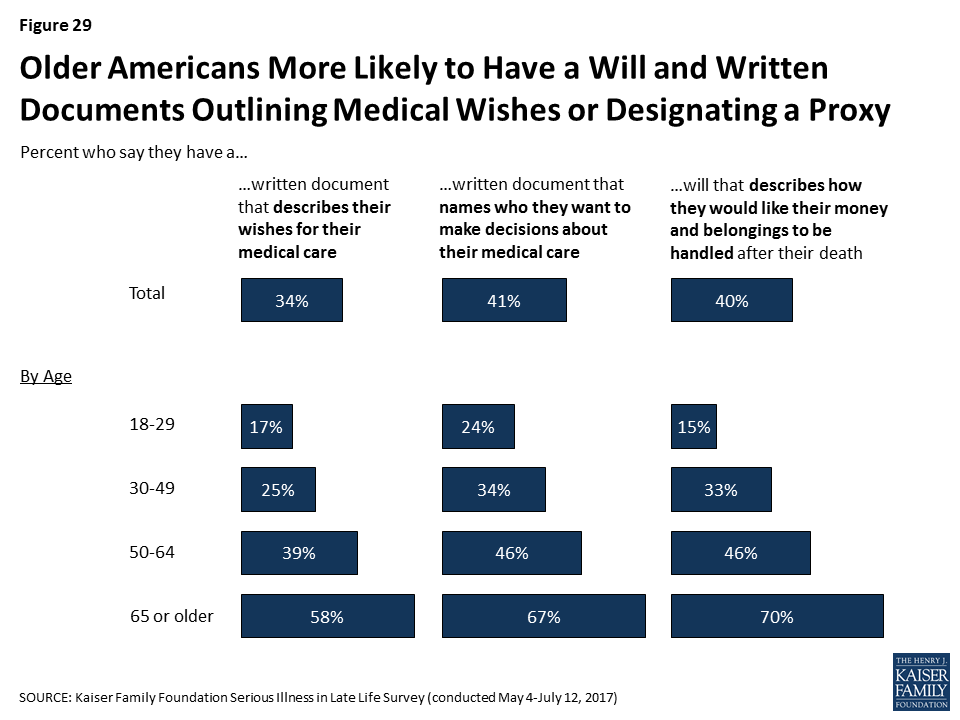
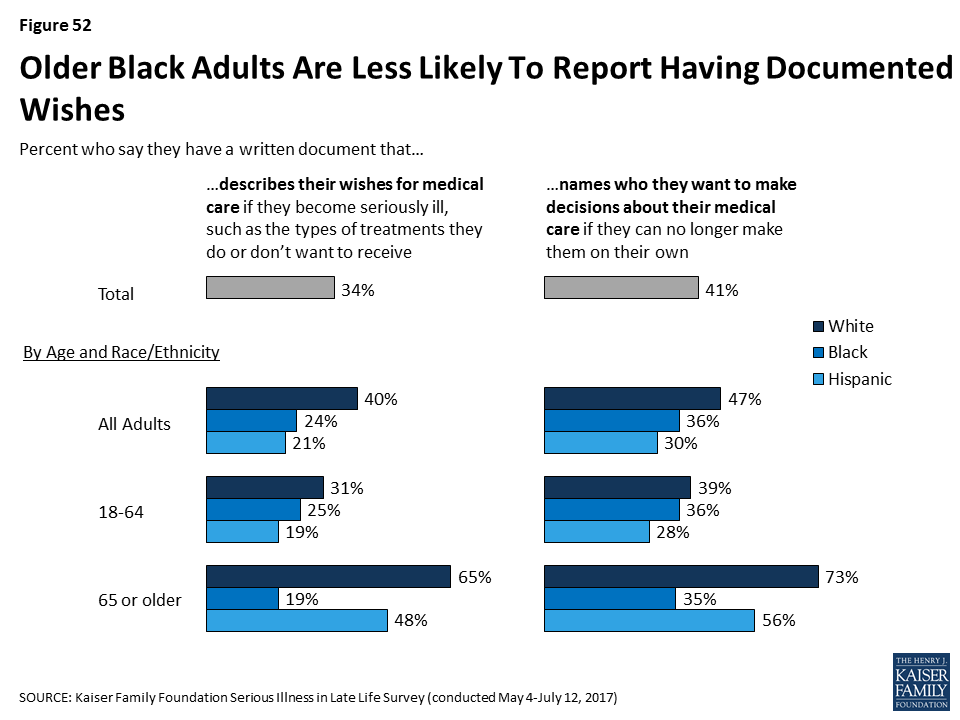
Far fewer say they themselves have a written document that describes their wishes for medical care, such as the types of treatments they would or would not want to receive (34%). Four in 10 (41%) say they have a written document that designates someone to make medical decisions on their behalf if they’re no longer able to make them on their own.
Those who are older are much more likely to say they have these documents than younger people. For example, seniors are three times as likely to say they have a written document describing their wishes for medical care than adults under 30 years old (58% compared to 17%).
There are also differences across racial and ethnic groups. For example, Black seniors are much less likely than White and Hispanic seniors to have written documents outlining their medical wishes (19% of Blacks compared to 65% of Whites and 48% of Hispanics). This gap remains even when adjusting for differences in education and other demographic factors.
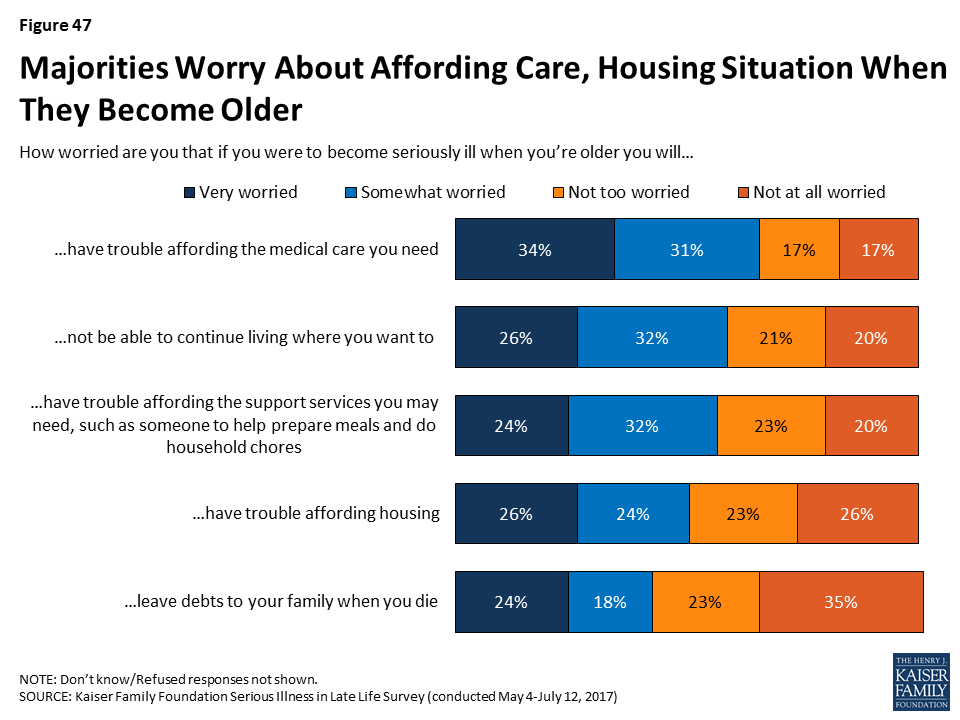
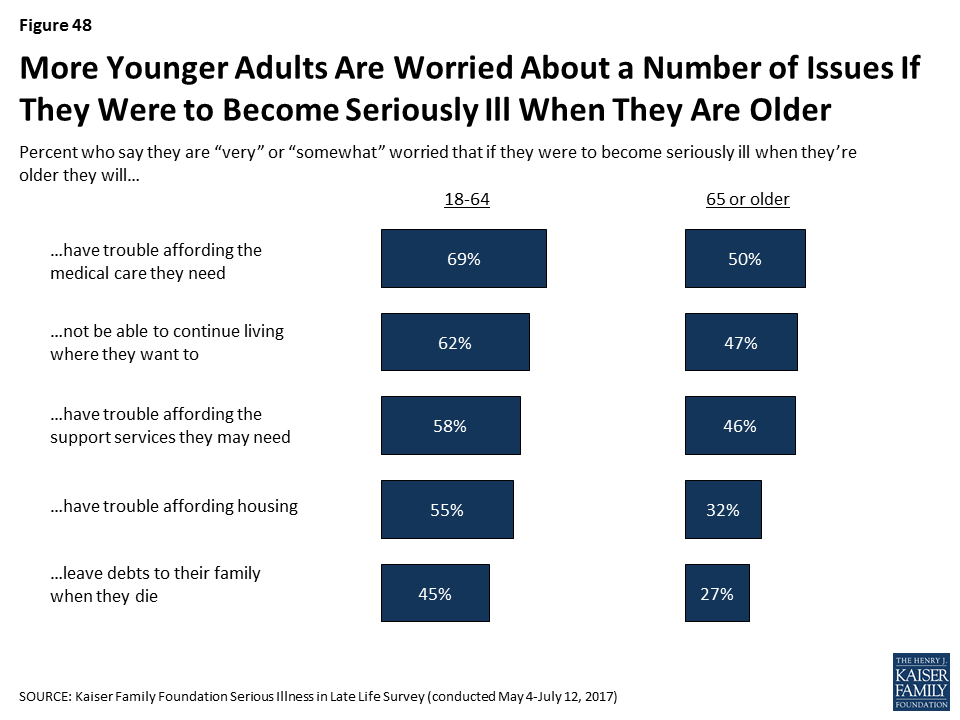
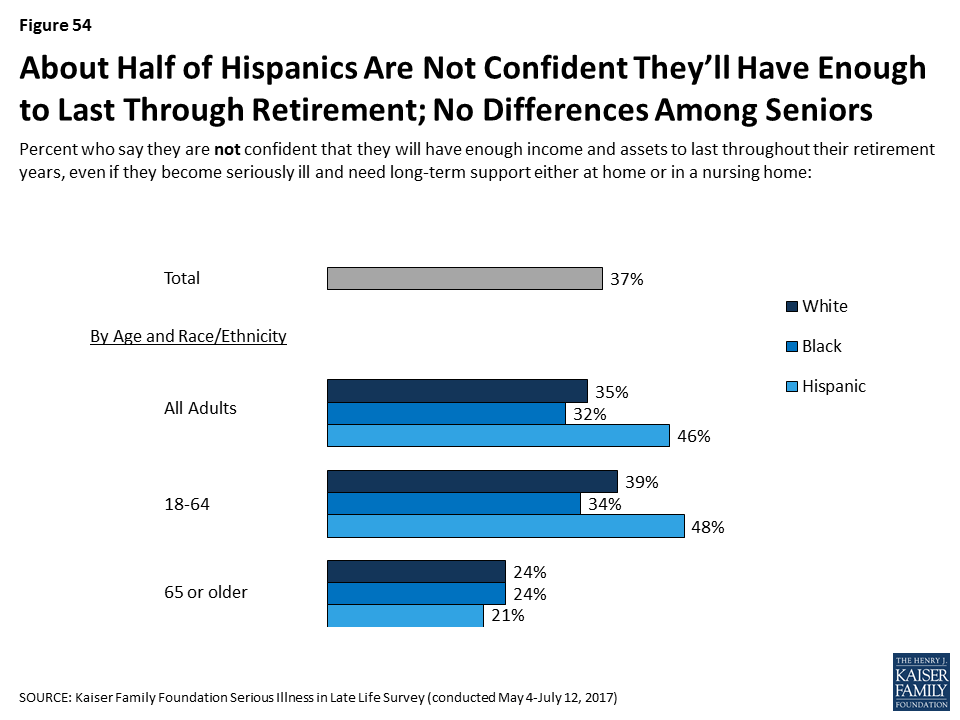
The survey also looks at some of the financial concerns people have about aging and serious illness and finds about two thirds (65%) of the public say they are worried that they will have trouble affording the medical care they need later in life if they become seriously ill. Hispanics are more likely to report this concern (77%) than are Whites (64%) and Blacks (62%).
Hispanics are also more likely to report being worried about other financial matters related to aging. For example, more Hispanics (63%) than Whites (37%) or Blacks (40%) worry about leaving their families with debts when they die.
In addition to the full survey report, four infographics are also available highlighting key findings related to the challenges facing seniors with serious illness, the steps people have taken to prepare for late-life illness, the impact of documenting medical wishes, and differences in the views and experiences of Blacks, Whites and Hispanics.
METHODOLOGY
Designed and analyzed by public opinion researchers at the Kaiser Family Foundation, the Serious Illness in Late Life Survey was conducted by telephone May 4 – July 12, 2017, among a representative, random national sample of 2,040 adults. The survey included 998 interviews with people who have experience with serious illness, including 183 interviews with older adults who are personally seriously ill, 494 with family members of older adults currently living with serious illness, and 321 with family members of older adults who recently died after a period of serious illness. Interviews were conducted in English and Spanish by landline (677) and cell phone (1,363). The margin of sampling error is plus or minus 3 percentage points for the full sample, and plus or minus 4 percentage points for those with experience with serious illness. For results based on other subgroups, the margin of sampling error may be higher. The survey was funded through a grant from the Gordon and Betty Moore Foundation.
The U.S. population is aging, and with that shift comes new challenges in meeting the needs of older adults with serious health needs. In order to better understand the public’s expectations about later life and any efforts they’ve taken to plan for if they become seriously ill, the Kaiser Family Foundation conducted a large scale, nationally representative telephone survey of 2,040 adults, including 998 interviews with people with recent experience with serious illness in older age, either personally or with a family member. For this survey, those who are seriously ill are older adults who have at least one of several chronic conditions and report functional limitations due to a health or memory problem. This comprehensive survey helps provide insight into the perspectives of the public at large as well as of older adults personally facing serious illness and their family members about how they view care in the U.S., steps they’ve taken to plan for becoming seriously ill in later life, and their current experiences with care and support for those with serious illness. It is the first in a series of surveys that will measure how these attitudes and experiences change over time.
The number of older Americans is growing rapidly. The share of adults 65 or older in the U.S. is expected to rise from 14.5 percent of the population in 2014 to 21.7 percent of the population by 2040.1 While medical advances have allowed many older adults to live longer, healthier lives, many are also living with multiple chronic conditions that are likely to lead to a slow deterioration over time. In the context of these demographic changes and the challenges arising from an older population with serious health needs, the Kaiser Family Foundation (KFF) conducted a large scale nationally representative telephone survey of 2,040 adults, in order to better understand people’s expectations about later life and efforts they’ve taken to plan for if they become seriously ill. This survey will serve as a baseline and we will conduct future surveys to measure how these attitudes and experiences change over time. To learn more about the experiences of those with serious illness specifically, this survey included interviews with 998 adults who are either personally age 65 or older living with a serious illness, or have a family member who is or was before they recently died. For this survey, those who are seriously ill are older adults who have at least one of several chronic conditions and report functional limitations due to a health or memory problem such as difficulty preparing meals, shopping for groceries, taking medications, getting across a room, eating, dressing, bathing, or using the toilet. This broad definition not only includes people who are quite ill and in their last few months of life, but also those who may be earlier in their disease course who have many months or years yet to live.
New @KaiserFamFound survey examines the challenges facing Americans with serious illness late in life
The following are some of the key findings from the survey.
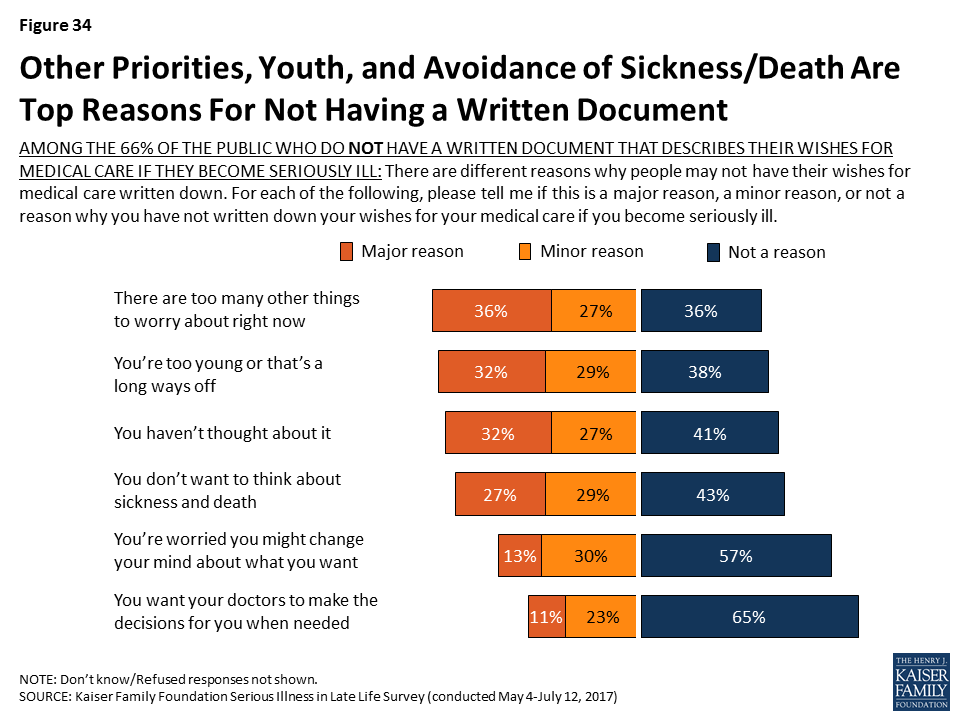
The public largely acknowledges some of the issues that can arise with serious illness in late life, but many people report that they have not yet taken steps to plan for if they become seriously ill themselves.
Americans are generally aware that most people die after a period of worsening health rather than suddenly and think that problems affording medical care and support services are common for people in late life. Many are personally worried about these things affecting them when they are older if they become seriously ill, yet just about a third say they have talked with a family member about how they would pay for help if they became seriously ill and, more broadly, just about half say they are saving for retirement.
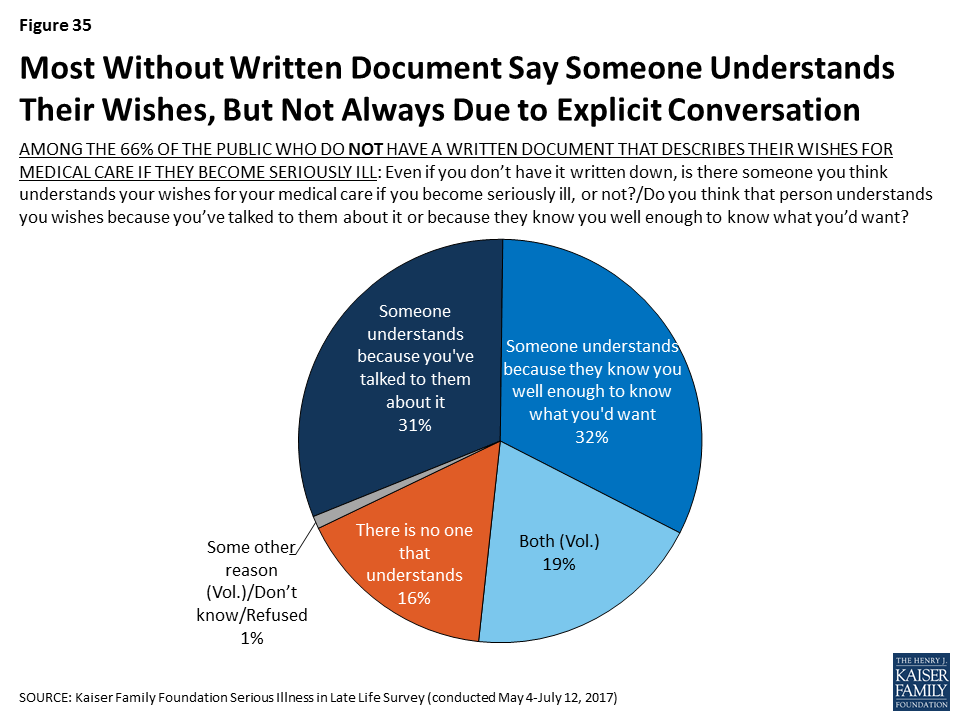
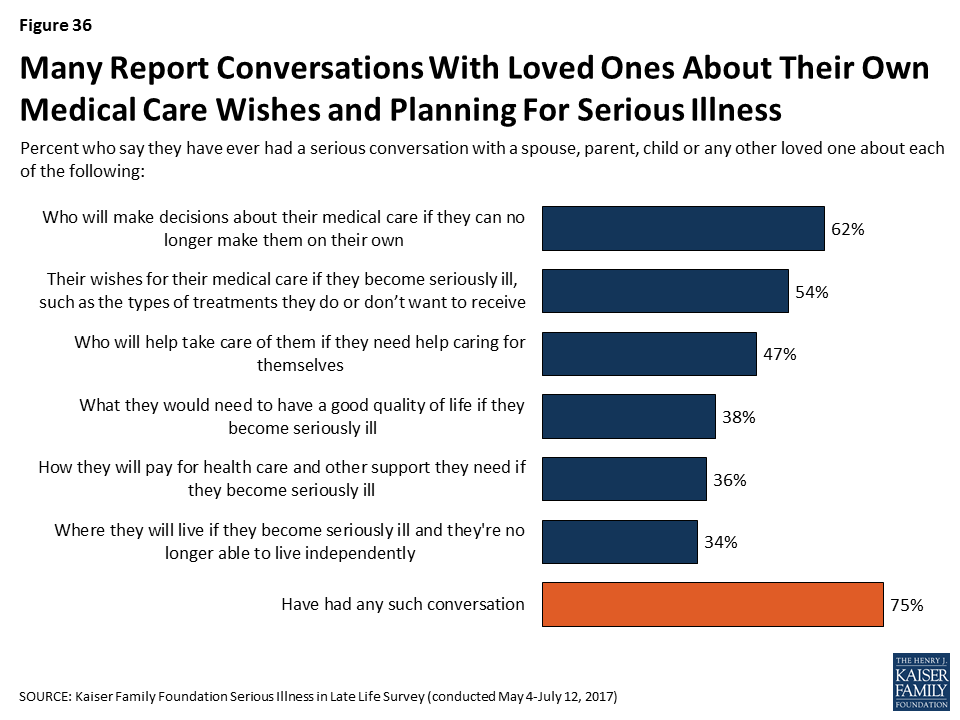
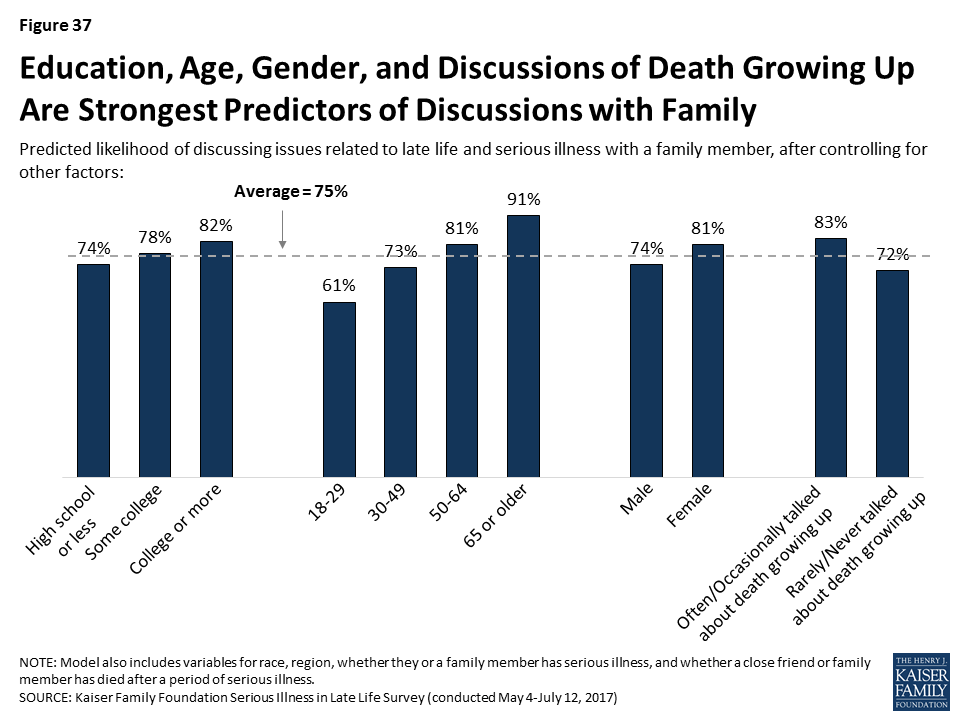
People say a number of different aspects of life are important to them to maintain a good quality of life in older age, including making sure their medical wishes are followed, but more than half say they do not have a document that describes their wishes for care or names a person they would want to make medical decisions on their behalf. In fact, one-third (34 percent) say they have a written document outlining their wishes and four in ten (41 percent) say they have a written document designating someone to make medical decisions on their behalf. Older adults are much more likely than younger adults to say they have these types of documents. Discussions of these issues with family members are reportedly much more common than written documentation. Majorities, including among younger adults, report talking about at least one related issue with a family member, but some specific aspects of planning are discussed less often, such as finances, where someone would prefer to live, or what they would need to have a good quality of life.
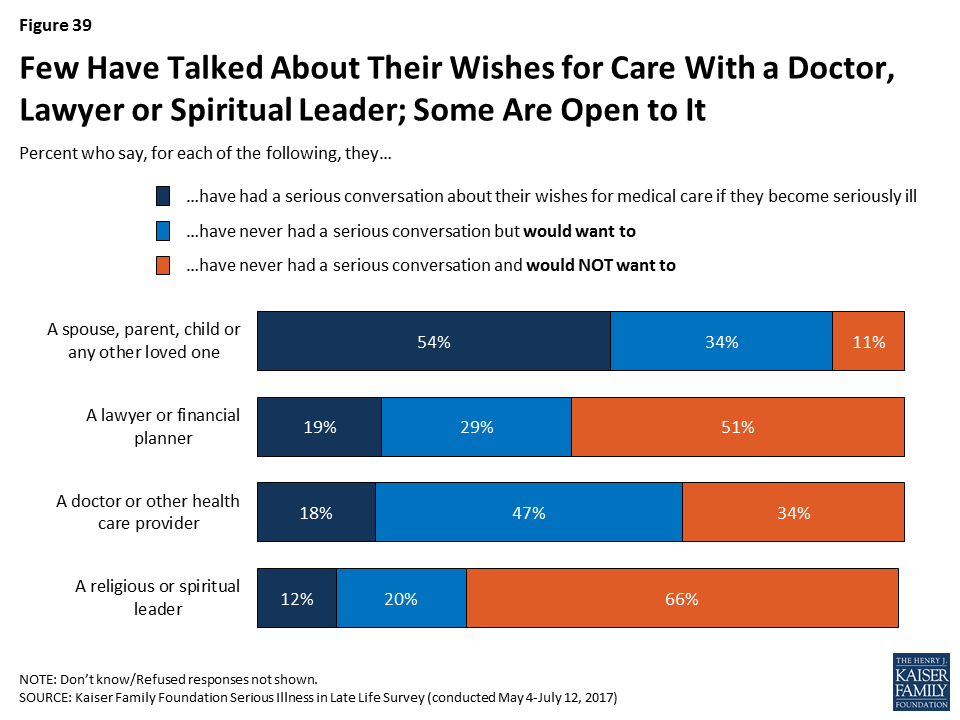
Most say they have not talked with a doctor or health care provider about their wishes, including among older adults and adults that report being in fair or poor health. For those that have written documents, few report sharing them with their doctors or other health care providers, leaving open the potential for uncertainty or confusion about what a person would want if seriously ill, even though they have gone to the effort of documenting their wishes.
Older adults with serious illness report a variety of challenges and some say they need help more often than they are getting.
Older adults with serious illness and their family members say they face a variety of challenges, from being forgetful (71 percent), feeling depressed (56 percent), and having difficulty understanding medical instructions (48 percent), to having trouble with basic tasks like preparing meals (39 percent). Six in ten older adults with serious illness have someone constantly providing help with everyday tasks. Still, more than four in ten say they need help more often than they are getting, and some report difficulty getting the help needed (27 percent) or forgoing such help due to cost (18 percent).
Having a loved one facing serious illness can be stressful for family members, and, while many say their personal needs are being met, some say they only sometimes get the help they need managing feelings of anxiety or sadness. Family members report helping their loved one with a variety of tasks, such as transportation (67 percent), everyday activities (57 percent), coordinating care across different doctors or clinics (55 percent), managing finances (43 percent), and medical-nursing tasks (42 percent). Those family members personally providing help are spending quite a bit of time on such tasks, but most of those who report helping with daily activities say they have someone that can give them a break when they need it. However, about one in five family members providing help say there is no one to give them a break, likely increasing the stress involved with caring for a loved one. Just over half of those helping with medical-nursing tasks say they received training from a nurse or other health professional on specific caregiving techniques, but even still, a large majority feel they were at least somewhat well trained to provide care.
For older adults with serious illness, those with documents outlining wishes for care are more likely to say their wishes have been followed and nearly all family members who have referred to these documents say they have been helpful in making decisions about their loved one’s care.
Most family members of older adults with serious illness report their loved one has a document describing their wishes (60 percent) or a document naming someone to make medical decisions on their behalf (70 percent). Some family members say they have referred to this document and nearly all who have referred to it say it was helpful.
Writing wishes down and talking about them appears to make a big difference in family members being confident they know what their loved one wants for their medical care. Family members who say their loved one has a written document outlining their wishes are more than twice as likely to say they know exactly what their loved one wants than those without such a document (53 percent versus 23 percent). And, family members who say they talked with their seriously ill loved one about their wishes are more than three times as likely than others to say they knew exactly what their loved one wanted (58 percent vs. 16 percent). In addition, older adults with serious illness and their family members are more likely to say their wishes for medical care are ‘very closely’ followed if they report having a document describing their wishes than if they don’t (70 percent vs. 54 percent).
Overall, much of the public rates the U.S. health care system poorly in terms of the care it provides to older people with serious health needs, but most of those who are currently experiencing serious illness themselves have more positive impressions.
About half of the public overall (52 percent) rate the U.S. health care system fair or poor on the care it provides older people with serious health needs and 45 percent say there is not enough support available in their community for older people with serious illness.
However, over half of older adults who themselves are dealing with serious illness say there is enough support available in their community and 60 percent rate the U.S. health care system’s care for seriously ill people as good, very good, or excellent. And, most older adults with serious illness and their family members who get paid help from a nurse or health care aide say the provider is well trained (89 percent) and rate the quality of the care provided as very good or excellent (63 percent).
Older black adults are much less likely than others to report having written documents outlining wishes or designating a health care proxy. People who are Hispanic are more apt to report financial challenges and uncertainty about late life and serious illness than black and white adults.
Older black adults are much less likely than older people who are white or Hispanic in having written documents outlining wishes or designating someone to make medical decisions on their behalf, even after controlling for other demographic factors associated with having these documents. Just 19 percent of black adults ages 65 or older say they have a document describing their wishes and about a third (35 percent) have a document naming a health care proxy, compared to about half of older Hispanics and more than six in ten older whites who say they have either type of written document.
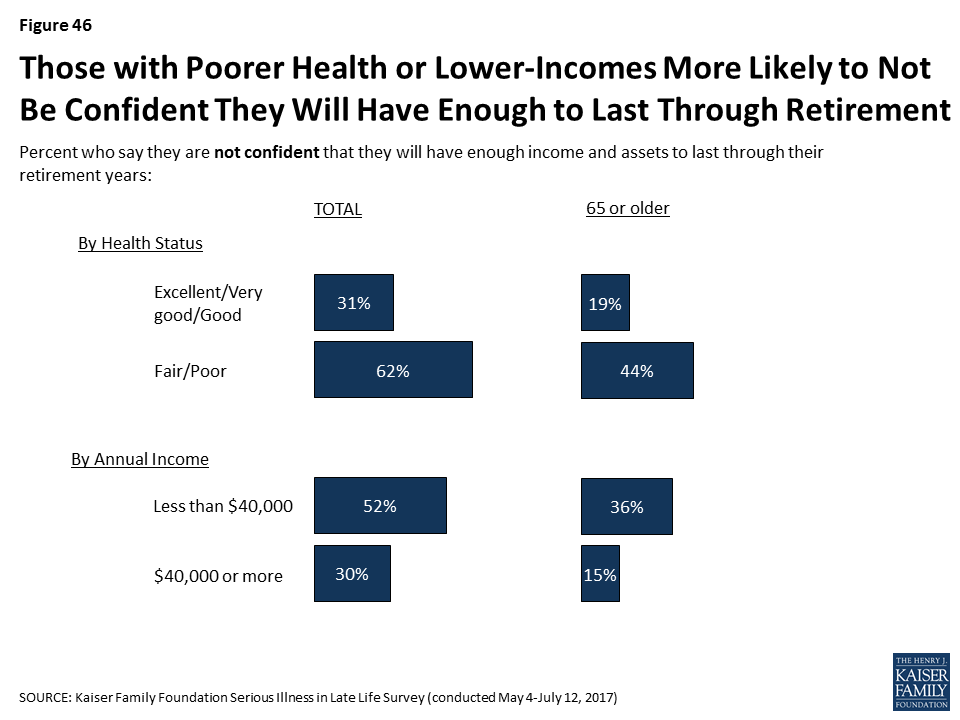
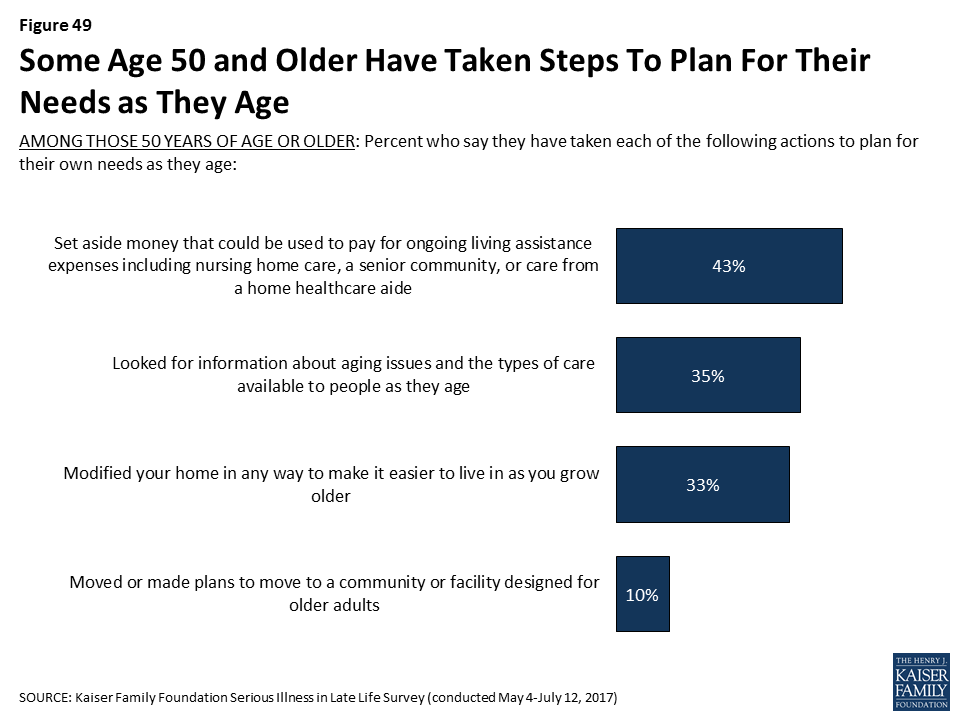
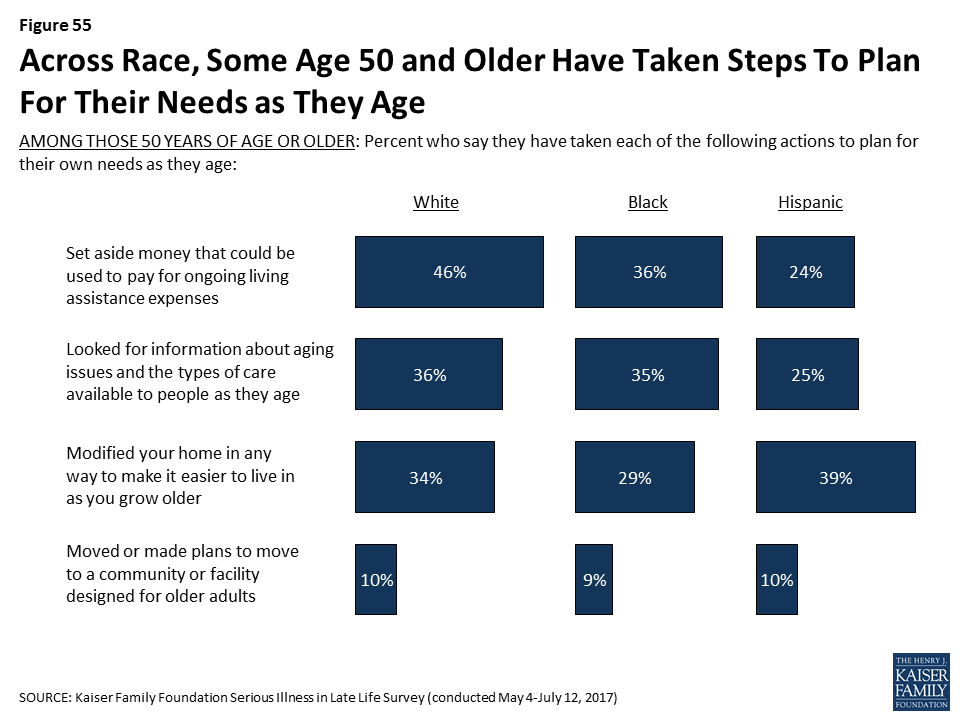
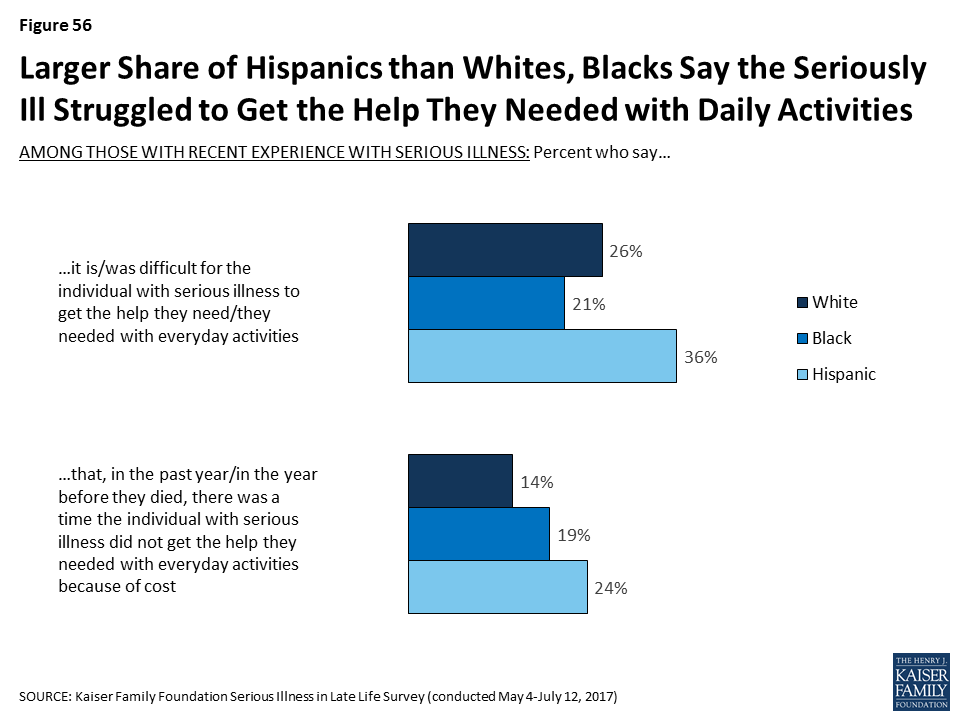
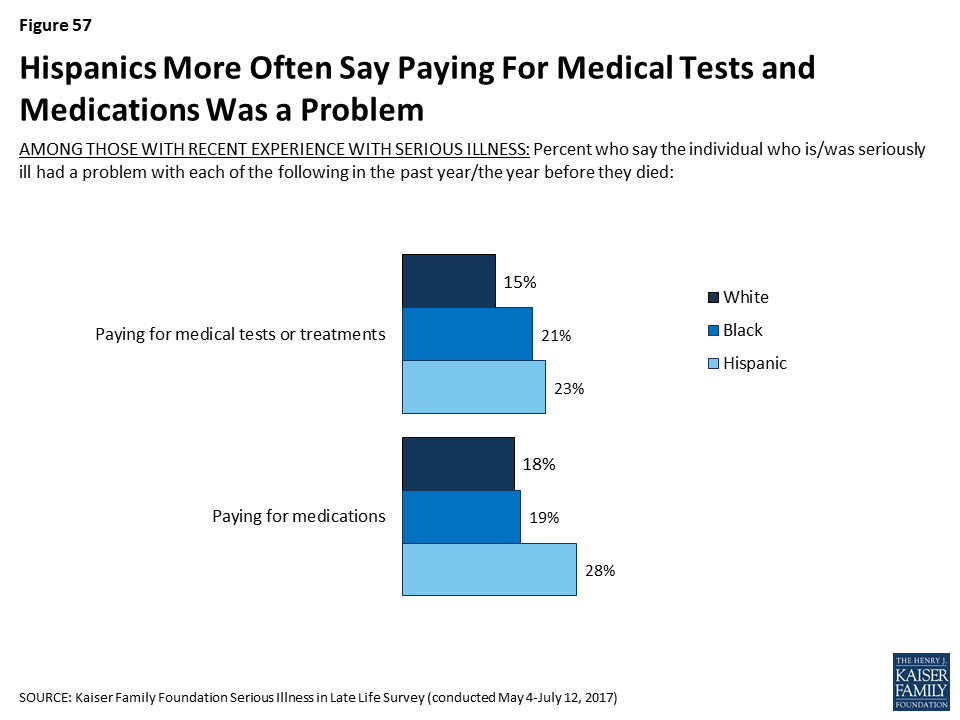
Hispanic adults are more likely than white or black adults to report being worried about facing challenges when they are older such as affording medical care or support, housing issues, or leaving debts to their family. Further, about half of Hispanic adults are not confident they will have enough money or assets to last through retirement if they become seriously ill. This worry and lack of confidence carries over into reported actions taken to plan for retirement. Just a third of people who are Hispanic and not yet retired say they are saving for retirement, compared to half of black adults (49 percent) and six in ten white adults (60 percent). And, Hispanics 50 or older are less likely than others to say they have set aside money that could be used to pay for ongoing living assistance expenses. This theme continues among older adults with serious illness. Hispanics who are themselves dealing with serious illness or have a seriously ill family member are more likely to report that it was difficult to get the help they needed with everyday tasks, that they didn’t get needed help due to cost, and that they had trouble affording medications, tests, and treatments.
Introduction
The number of older adults is growing rapidly. The share of adults 65 or older in the U.S. is expected to rise from 14.5 percent of the population in 2014 to 21.7 percent of the population by 2040, and the number of people age 85 or older is expected to triple from 6.2 million in 2014 to 14.6 million in 2040.2 While medical advances have allowed many older adults to live longer, healthier lives, many are also living with multiple chronic conditions that are likely to lead to a slow deterioration over time.3 In the context of these demographic changes and the challenges arising from an older population with serious health needs, the Kaiser Family Foundation (KFF) conducted a large scale nationally representative telephone survey of 2,040 adults, in order to better understand people’s expectations about later life and efforts they’ve taken to plan for the event they become seriously ill. In light of current efforts underway to improve the situations of those with serious illness and prepare for the aging population, this survey will serve as a baseline and we will conduct future surveys to measure how these attitudes and experiences change over time. To learn more about the experiences of those with serious illness, this survey included interviews with 998 adults who are either personally age 65 or older living with a serious illness, or have a family member who is or was before they recently died. Experts consider serious illness to be a health condition that carries a high risk of mortality and either negatively impacts a person’s daily function or quality of life or excessively strains their caregivers. For this survey, those who are seriously ill are older adults who have at least one of several chronic conditions and report functional limitations due to a health or memory problem such as difficulty preparing meals, shopping for groceries, taking medications, getting across a room, eating, dressing, bathing, or using the toilet. This broad definition not only includes older people who are quite ill and in their last few months of life, but also those older people who may be earlier in their disease course who have many months or years yet to live. (For more details on how this survey defines serious illness, see Section 2 and the Methodology). A survey of this magnitude allows for analysis across age, race/ethnicity, health status, income, and other factors that may influence a person’s views and experiences with serious illness. This report summarizes the results from the survey and is organized as follows:
Section 1 examines the public’s overall views of issues related to serious illness care, people’s perceptions of how the U.S. health care system meets the needs of older adults with serious illness, as well as the public’s awareness of the issues that can arise when someone is facing a serious illness, such as financial problems, access to support services and medical care, and housing issues.
Section 2 covers the experiences and perspectives of those with experience with serious illness, either personally or with a family member, including the challenges they face, what types of care and support they are receiving and whether their needs are being met.
Section 3 focuses on the steps the public has taken to plan for serious illness in later life, including the types of documents they may have created and concrete steps they have taken to prepare for aging or save for retirement, as well as the types of conversations that people are having with their loved ones and medical providers about their wishes and desires in the event they become seriously ill.
Section 4 highlights some of the key areas where views and experiences differ for people who are black, Hispanic or white, although across many measures, their responses are similar.
In addition to the survey, this report also incorporates themes that emerged during focus groups with family members of older adults with serious illness that were conducted in February and March 2017 in Kansas City, MO, and Chattanooga, TN. The survey and focus groups were designed and analyzed by researchers at KFF and paid for by the Gordon and Betty Moore Foundation. For more on how the survey or the focus groups were conducted, see the Methodology section.
Section 1: Views Of The Issue
Public’s Perceptions of People’s Last Years
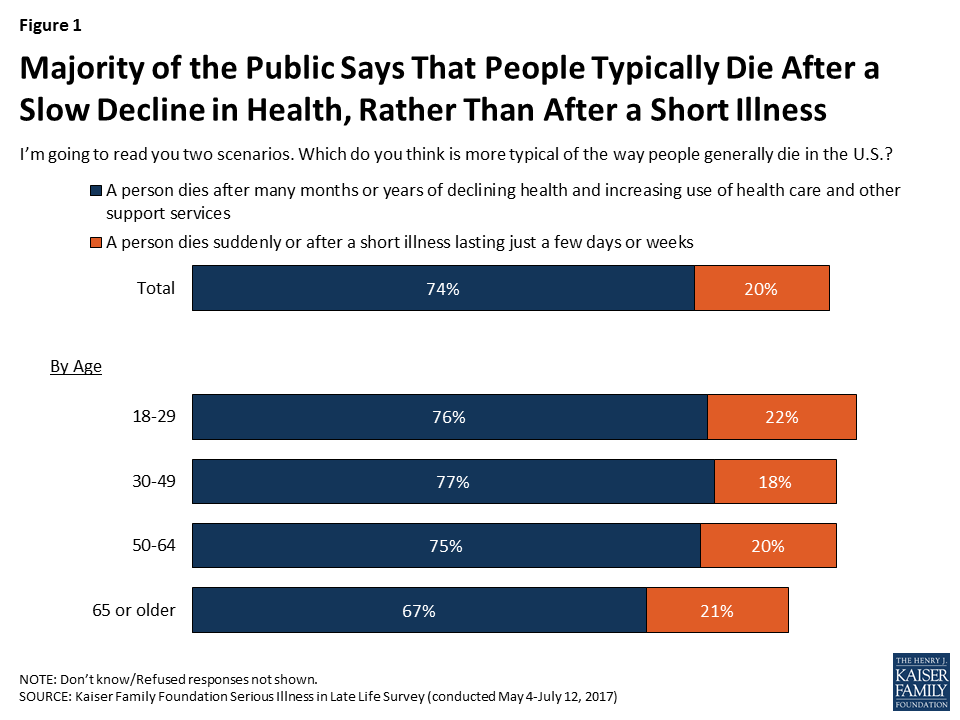
Due to medical advances and the ability to manage chronic conditions in older adults, more people are living longer and, rather than dying from acute episodes of illness, they are dying after long periods of sickness and declining health. The public is generally aware of this – most people (74 percent) are aware that people typically die after many months or years of declining health and after increasing use of health care and other support services, as opposed to dying suddenly or after a short illness lasting just a few days or weeks (20 percent). Interestingly, older adults are somewhat less likely to say that death comes after a slow decline than younger people.
Figure 1: Majority of the Public Says That People Typically Die After a Slow Decline in Health, Rather Than After a Short Illness
As people live longer in varying states of health, many are faced with needing medical care or support services for longer periods than they may have expected, which can strain finances, families, and individuals themselves. Large majorities of the public say it’s common for people in their last few years of life to have difficulty paying for medical care (83 percent), support services (80 percent), and housing (76 percent), and that it’s common to have to move somewhere other than where they would like to be living (74 percent). Older people are somewhat less likely to say each of these things is common in later life.
Figure 2: Large Majorities Say Challenges Paying for Care, Support, Housing and Relocation are Common in Later Life
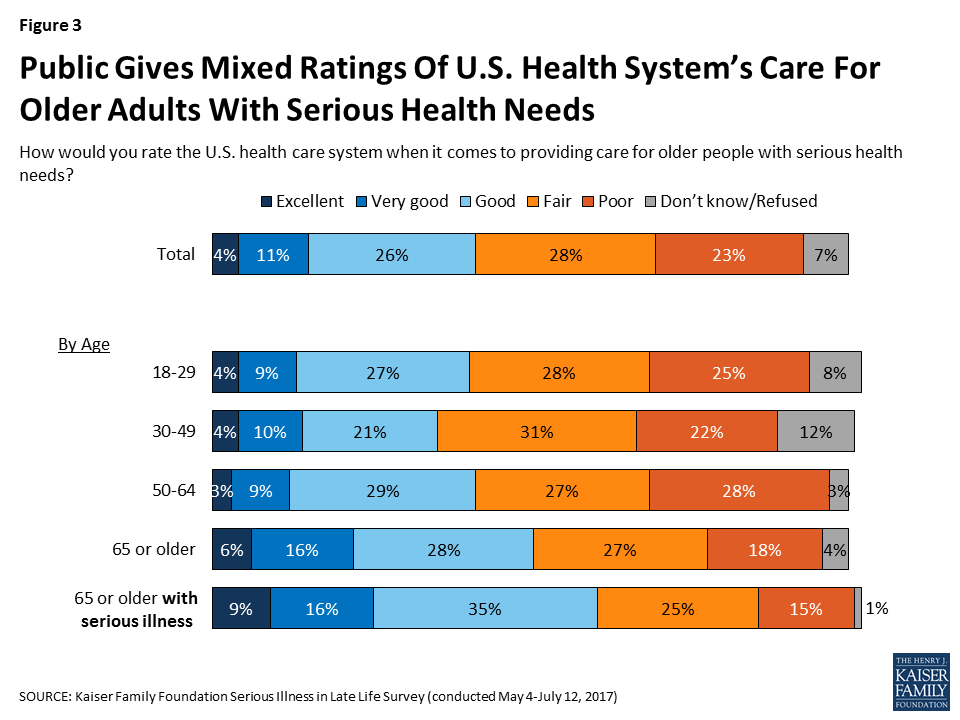
Public Gives Mixed Ratings of U.S. Health Systems’ Care for Seriously Ill
In terms of how the public views the care provided for older people with serious health needs, 52 percent rate the U.S. health care system fair or poor, while about a quarter rate it as good and 15 percent rate it as very good or excellent. Older adults are somewhat more likely to rate it positively than others. Older people personally facing serious illness – who are in the best position to judge this issue – give more positive ratings than others. Six in ten older adults with serious illness rate the U.S. health care system as excellent, very good, or good on the care it provides for older people with serious illness, higher than the share without any experience with serious illness (40 percent).
Figure 3: Public Gives Mixed Ratings Of U.S. Health System’s Care For Older Adults With Serious Health Needs
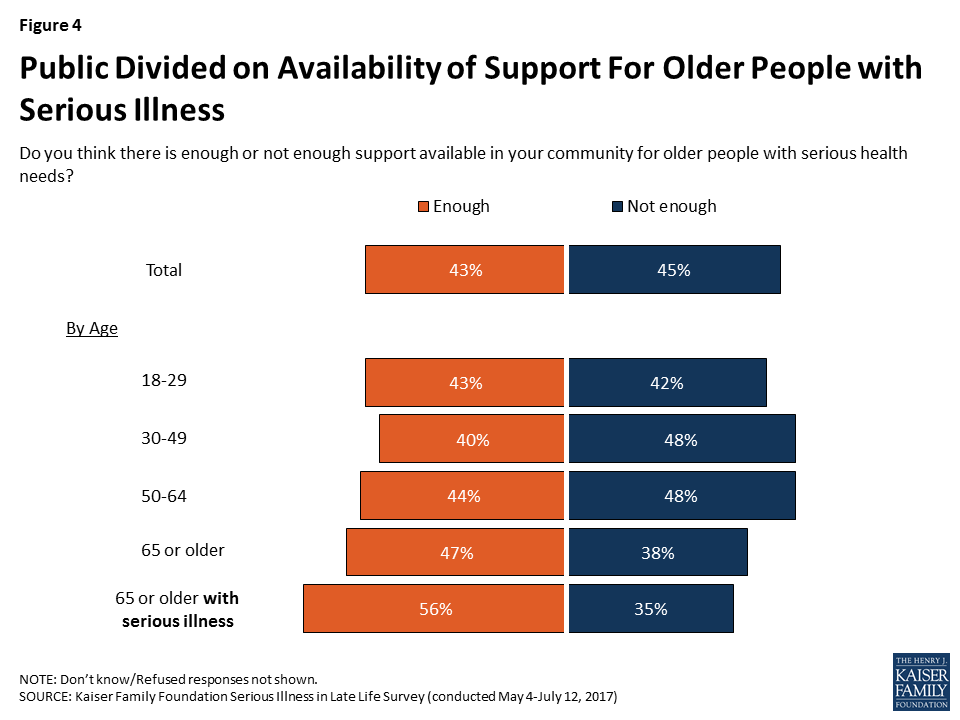
As far as the support available to older people with serious health needs, the public is divided on whether there’s enough support available in their community (43 percent say enough and 45 percent say not enough). Older adults – those 65 or older – lean toward saying there is enough support in their community rather than not enough (47 percent versus 38 percent). Among older adults who themselves are dealing with serious illness, a majority (56 percent) say there is enough support available in their community, while about a third (35 percent) say there is not enough.
Figure 4: Public Divided on Availability of Support For Older People with Serious Illness
Personal Priorities for Older Age
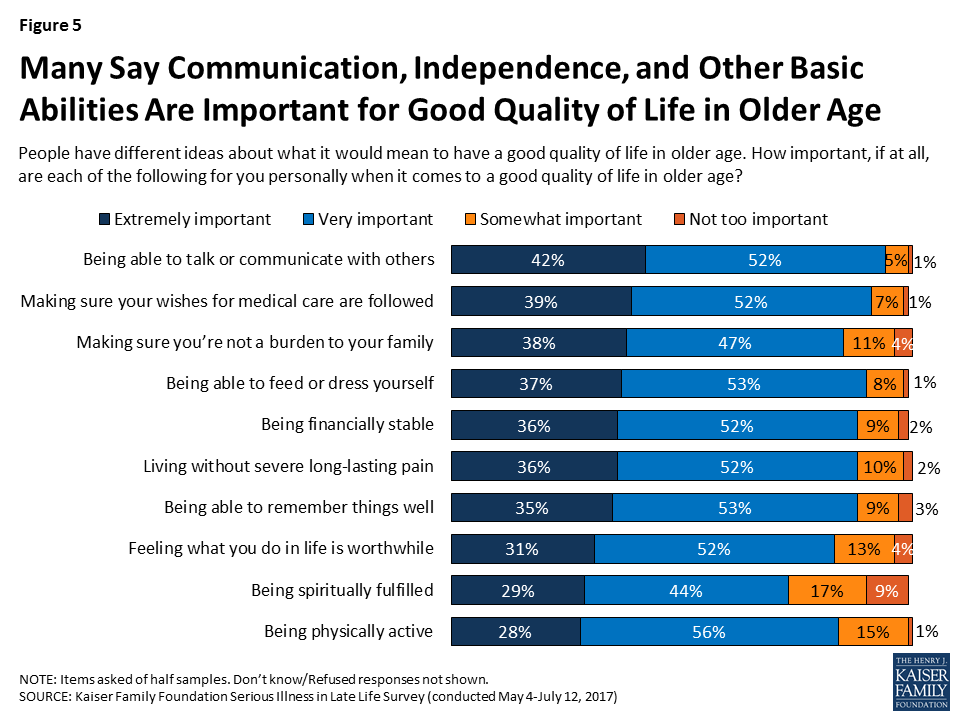
When it comes to what it would mean to have a good quality of life in older age, large majorities of the public say a variety of things are important to them personally, some of which may require advanced planning in order to achieve. About four in ten say a number of things are “extremely” important, including being able to talk or communicate with others (42 percent), making sure their wishes for medical care are followed (39 percent), making sure they’re not a burden to their family (38 percent). Some also say it is “extremely” important to be able to feed or dress themselves (37 percent), to be financially stable (36 percent), to live without severe long-lasting pain (36 percent), and to be able to remember things well (35 percent). In addition, about three in ten say feeling what they do in life is worthwhile (31 percent), being spiritually fulfilled (29 percent) and being physically active (28 percent) are extremely important to them in having a good quality of life in older age.
Figure 5: Many Say Communication, Independence, and Other Basic Abilities Are Important for Good Quality of Life in Older Age
Focus Group Insights: Given their experience, family members say they want to avoid being a burden on their loved ones if they become seriously ill.
“As far as me, I don’t want my kids to ever deal with me like I have to deal with my wife. I hate it.”
Section 2: Experience Of Older Adults With Serious Illness
In order to better understand how older people with serious illness are faring and what challenges they face in accessing and affording care and support services, the survey included interviews with people who have experience with serious illness, either personally or with a family member.
Individuals were classified as being an older adult with serious illness if they met each of the following criteria:
they were 65 or older,
they reported functional limitations due to a health or memory problem such as difficulty preparing meals, shopping for groceries, taking medications, getting across a room, eating, dressing, bathing, or using the toilet,
they said they have been diagnosed with at least one of the following conditions: diabetes or high blood sugar; asthma, lung disease, emphysema, or COPD; heart disease or had a stroke; cancer, not including skin cancer; Alzheimer’s disease, dementia or memory loss; depression, anxiety or other serious mental health problems; or, chronic kidney disease or kidney failure.
Individuals qualified as a family member of someone with serious illness if their loved one currently met the criteria above or they did so before they recently died. In order to be included, family members also must have said they knew at least something about their family member’s medical care. About 11 percent in the “serious illness experience” group for this survey are themselves dealing with serious illness, 52 percent are family members of someone living with a serious illness, and 37 percent are family members of someone who has died after a period of serious illness. For most family members, their loved one with serious illness is a parent (56 percent), while 21 percent say the person is a grandparent, 9 percent say it is their spouse, and 7 percent say it is an in-law.
Profile of Older Adults with Serious Illness
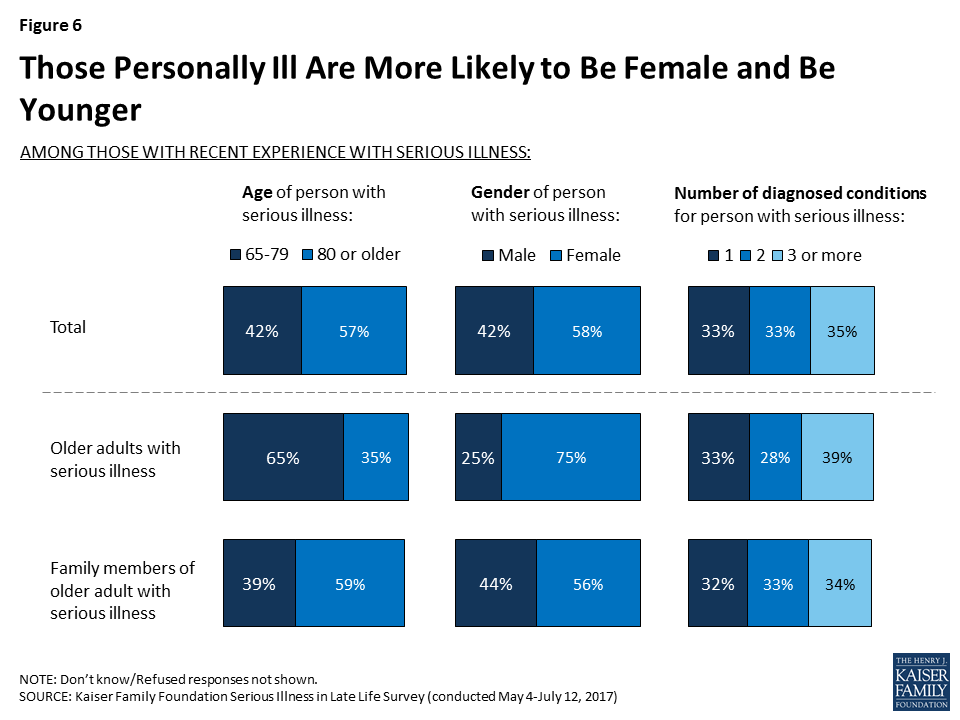
Among those identified in this survey as older adults with serious illness, 58 percent are women, 57 percent are age 80 or older, and two-thirds (67 percent) report having two or more chronic conditions. However, there are some differences in the personal characteristics of those who are personally dealing with serious illness and those whose family member is answering on their behalf.4 For example, while by the definition used in the survey, all older adults with serious illness are (or were) 65 or older, those answering about themselves tend to be younger (65 percent are 65 to 79), while family members’ seriously ill loved ones are usually older (59 percent are 80 or older). In addition, a bigger majority of those answering about themselves are women (75 percent) than family members’ loved ones (56 percent).
Figure 6: Those Personally Ill Are More Likely to Be Female and Be Younger
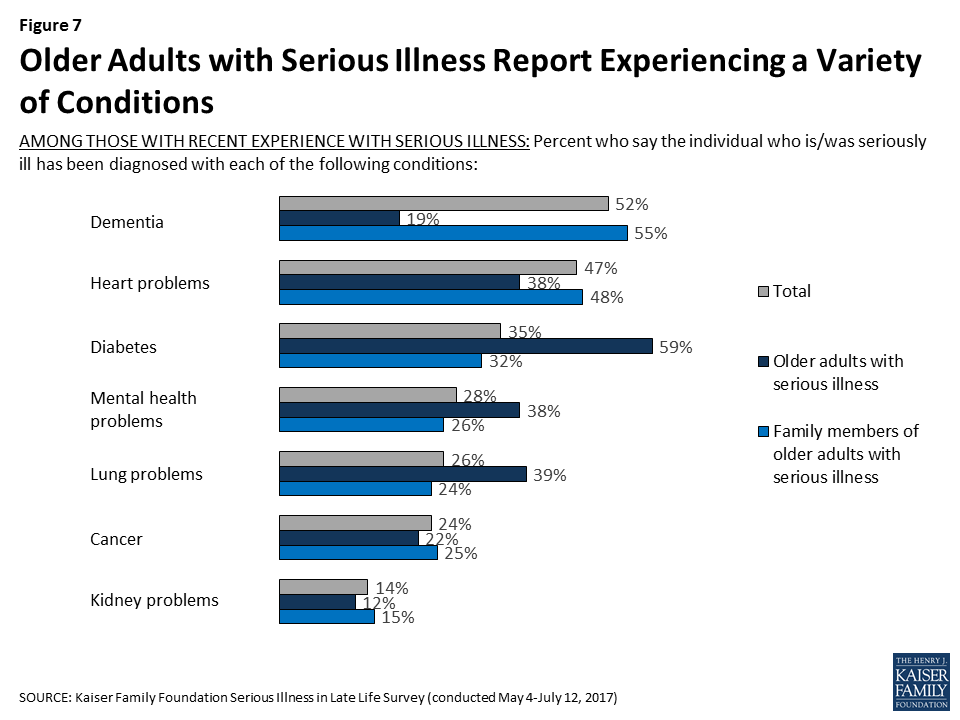
While this survey’s definition of serious illness includes several different conditions, some are more common than others, and reports of these conditions vary by whether someone is personally dealing with serious illness themselves or if they’re responding about a family member. Overall, 52 percent report they or their loved one has been diagnosed with dementia, Alzheimer’s disease, or memory loss, 47 percent report being diagnosed with heart disease or having a stroke, followed by diabetes (35 percent), mental health problems such as anxiety or depression (28 percent), asthma, lung disease, emphysema, or COPD (26 percent), cancer (24 percent), and chronic kidney disease or kidney failure (14 percent). Those responding about their own experience as an older adult with serious illness are more likely to say they have been diagnosed with diabetes (59 percent), while 55 percent of family members of older adults with serious illness say their loved one has dementia and half (48 percent) say their loved one has heart disease. Some of these differences are at least in part related to the group of seriously ill people that were able to be interviewed, in that they had to be well enough to answer the telephone and not be institutionalized. As a result, the group of older adults who themselves are dealing with serious illness tends to be a group in somewhat better health or potentially at an earlier stage of illness than those with a family member answering on their behalf.
Figure 7: Older Adults with Serious Illness Report Experiencing a Variety of Conditions
How Older Adults with Serious Illness Compare to Others 65 or Older
There are also some key differences in the personal characteristics of those 65 or older who are seriously ill and those who are 65 who are not classified as seriously ill. Older people with serious illness are much more likely than their peers to be female (75 percent versus 53 percent), widowed (42 percent versus 24 percent), have an annual income of less than $40,000 (64 percent versus 38 percent), and have a high school education or less (71 percent versus 40 percent). They are also somewhat more likely than their peers to be Black (18 percent versus 9 percent) or Hispanic (12 percent versus 5 percent).
Figure 8: Adults with Serious Illness More Likely to Be Female, Lower Income, Less Educated, and Widowed; Less Likely to Be White
Utilization of Medical Services Among Older Adults with Serious Illness
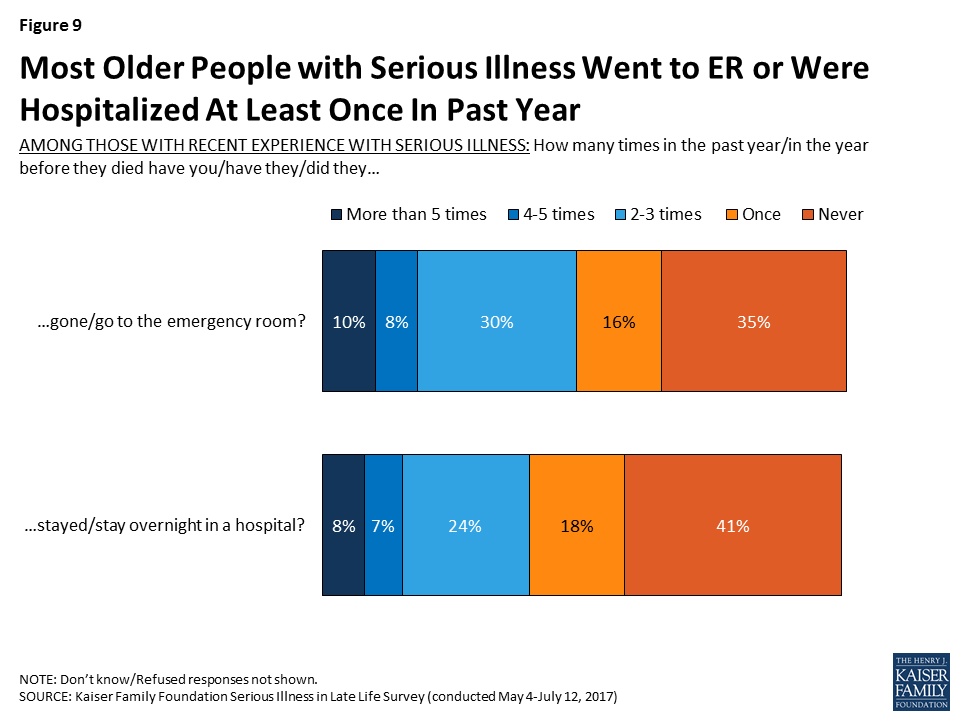
Among older adults and family members of older adults with serious illness, about two-thirds (64 percent) report that they went to the emergency room in the past year (or in the year before they died for those with a deceased family member), including 10 percent who say they went more than five times. In addition, about six in ten (58 percent) say that the seriously ill person stayed overnight in the hospital in the past year, or in the year before they died. Those whose loved one is deceased are more likely than others to say they had gone to the emergency room (75 percent) or stayed in the hospital overnight in the year before they died (78 percent).
Figure 9: Most Older People with Serious Illness Went to ER or Were Hospitalized At Least Once In Past Year
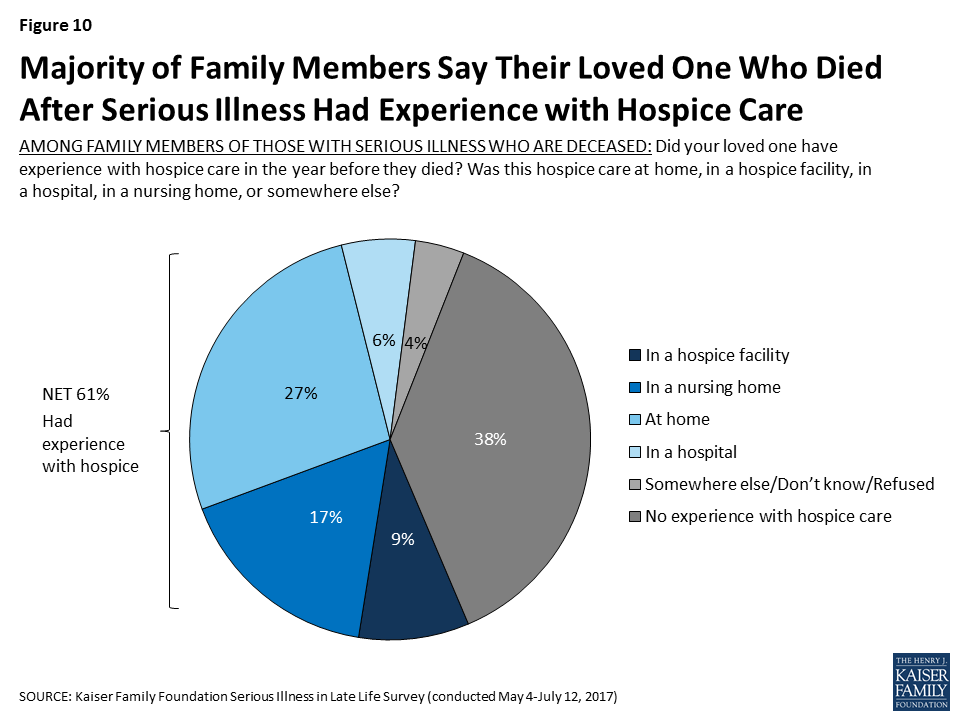
Among those family members whose loved one is deceased, 61 percent say their loved one had some experience with hospice in the year before they died. Family members most commonly say their loved one had hospice care at home (27 percent), followed by in a nursing home (17 percent), in a hospice facility (9 percent), and in a hospital (6 percent).
Figure 10: Majority of Family Members Say Their Loved One Who Died After Serious Illness Had Experience with Hospice Care
Problems Faced by Older Adults with Serious Illness
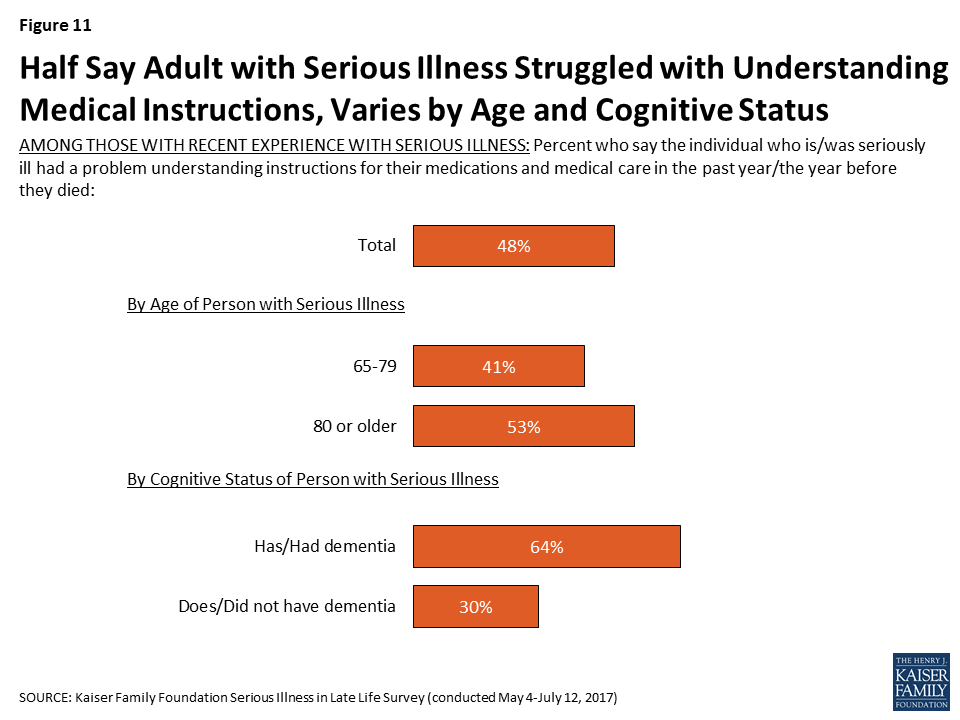
People with serious health needs can face a variety of challenges, ranging from difficulty managing daily tasks independently to having trouble affording medical care and support services. Nearly half (48 percent) of individuals and family members of older adults with serious illness say that in the past year they had a problem understanding instructions for medications and medical care. Those ages 80 or older (53 percent) are more likely than those between 65 and 79 to say they had problems understanding medical instructions (41 percent). In addition, reports of trouble understanding instructions for medical care and medications are about twice as common for those with dementia than for those without (64 percent versus 30 percent).
Figure 11: Half Say Adult with Serious Illness Struggled with Understanding Medical Instructions, Varies by Age and Cognitive Status
Focus Group Insights: Family members of those with serious illness noted that managing medications is often a challenge. People expressed concern about the number of medications their loved ones were taking as well as the medications that are needed to treat side effects of other medications, and the side-effects in general.
“It took me an hour and a half after mom got out of the hospital, just to do two weeks of morning and evening pills. … She was already on a lot of medications. Just sorting it all out, it was crazy.”
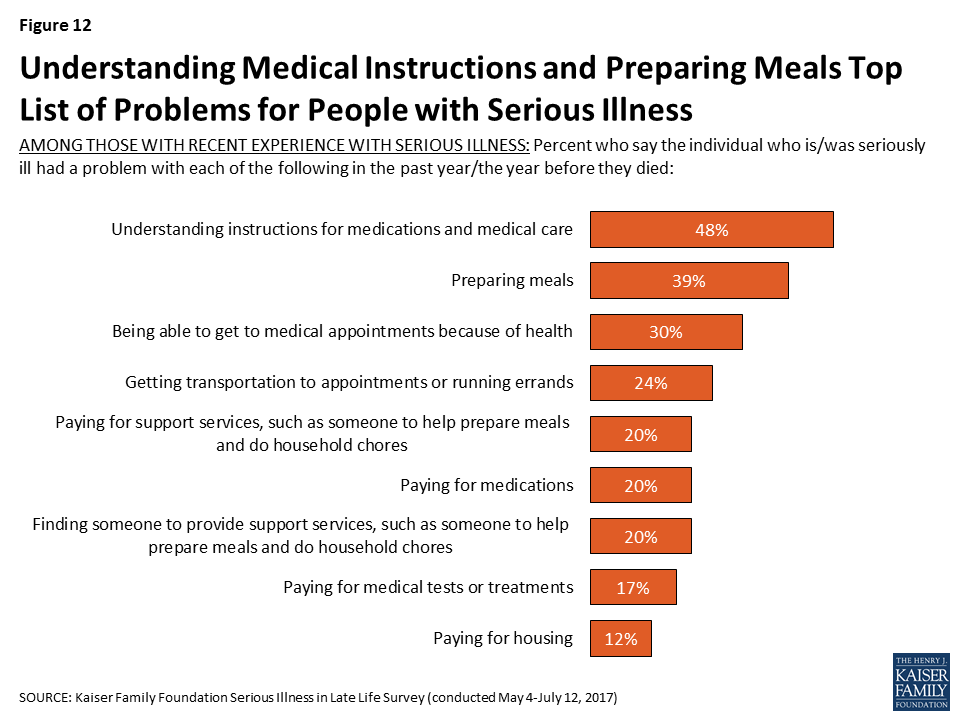
Older adults with serious illness report other problems as well. About four in ten (39 percent) say they or their family member with serious illness had trouble preparing meals in the past year, 30 percent say they had trouble getting to appointments because of their health, 24 percent say they had trouble getting transportation or running errands, and 20 percent say they had trouble finding someone to provide support services.
In addition, being able to afford the things they need is an issue for some. About one in five say they have trouble paying for support services (20 percent), medications (20 percent), and medical tests or treatments (17 percent). Relatively few say they have had trouble paying for housing (12 percent). Those with lower incomes (less than $40,000 annually) are more likely than those earning $40,000 or more to say that they or their family member had trouble paying for medications (33 percent versus 13 percent), medical treatments (27 percent versus 11 percent), and housing (16 percent versus 9 percent).
It is important to note that while Medicare covers the basic medical care that older people require, it does not typically pay for long-term care and support services that people with serious illness may need. As a result, many must pay for these types of services out-of-pocket, with the exception of those with incomes low enough to qualify for Medicaid. In light of this, it may be surprising that problems paying for medical care and problems paying for support services rank similarly. However, this may be at least in part because the question asks about those who have had difficulty paying for care and does not reflect those who may not have tried to get this type of help because they felt they couldn’t afford it.
Figure 12: Understanding Medical Instructions and Preparing Meals Top List of Problems for People with Serious Illness
In addition to issues paying for support services, medications, medical treatments or housing, about three in ten family members of those currently living with serious illness are not confident that their loved one will have enough income and assets to last for the rest of their life, while a majority are at least somewhat confident (71 percent).
Figure 13: Most Family Members of Older Adults with Serious Illness Are Confident Their Loved One Will Be Financially Stable
Problems with Mood or Cognition
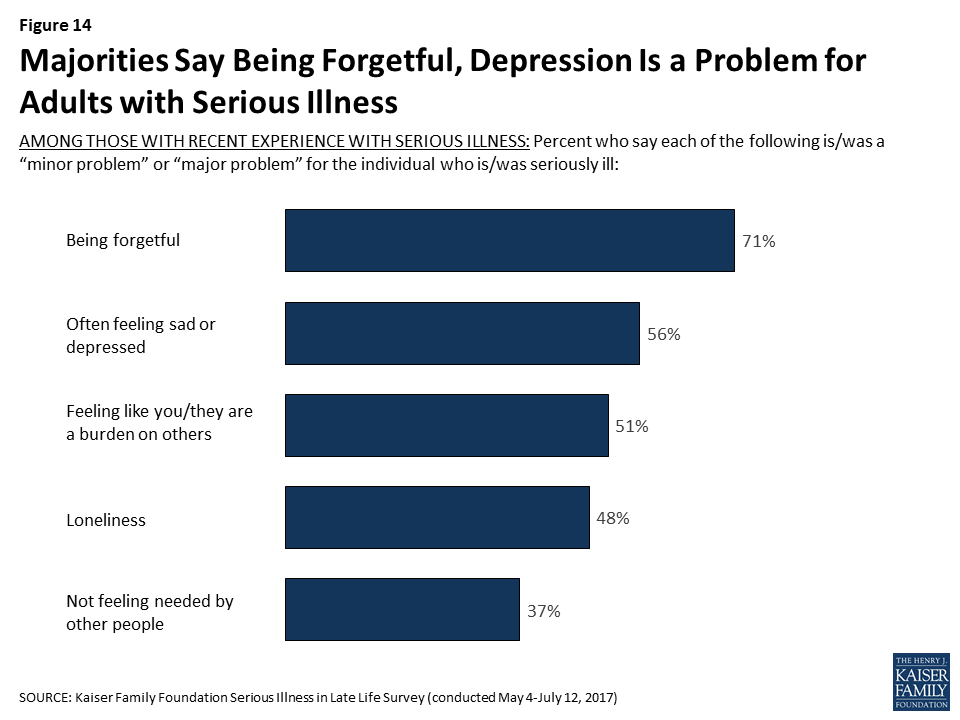
Many older adults with serious illness and their family members report issues with memory – seven in ten say being forgetful is at least a minor problem, including nearly half who say it is a major problem. Many also report issues with mood such as often feeling sad or depressed (56 percent), feeling like a burden on others (51 percent), and loneliness (48 percent), which can have a negative impact on health. Fewer, 37 percent, report that not feeling needed by other people is a problem.
Figure 14: Majorities Say Being Forgetful, Depression Is a Problem for Adults with Serious Illness
Assistance For Older Adults with Serious Illness
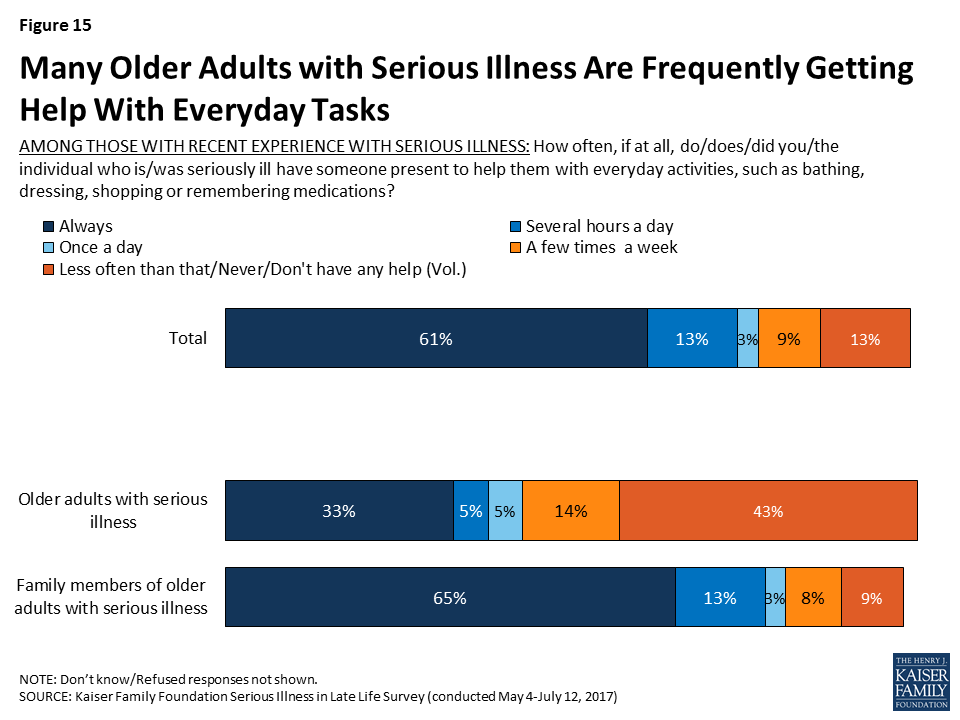
Many older adults who are seriously ill report getting frequent help. Six in ten (61 percent) say they or their loved one always has someone present to help them with everyday activities like dressing, bathing, shopping, or remembering medications, and an additional 13 percent say they have someone present several hours a day.
There are big differences for those responding to the survey who are dealing with serious illness themselves – 33 percent say they always have someone present to help, but 16 percent say they never do and 27 percent say they have help less than a few times a week. In contrast, the majority of those with family members with serious illness say their loved one always has someone present to help (65 percent). As noted earlier, this is likely related to the fact that those answering about themselves are relatively younger and in somewhat better health than the loved ones family members are referring to.
Figure 15: Many Older Adults with Serious Illness Are Frequently Getting Help With Everyday Tasks
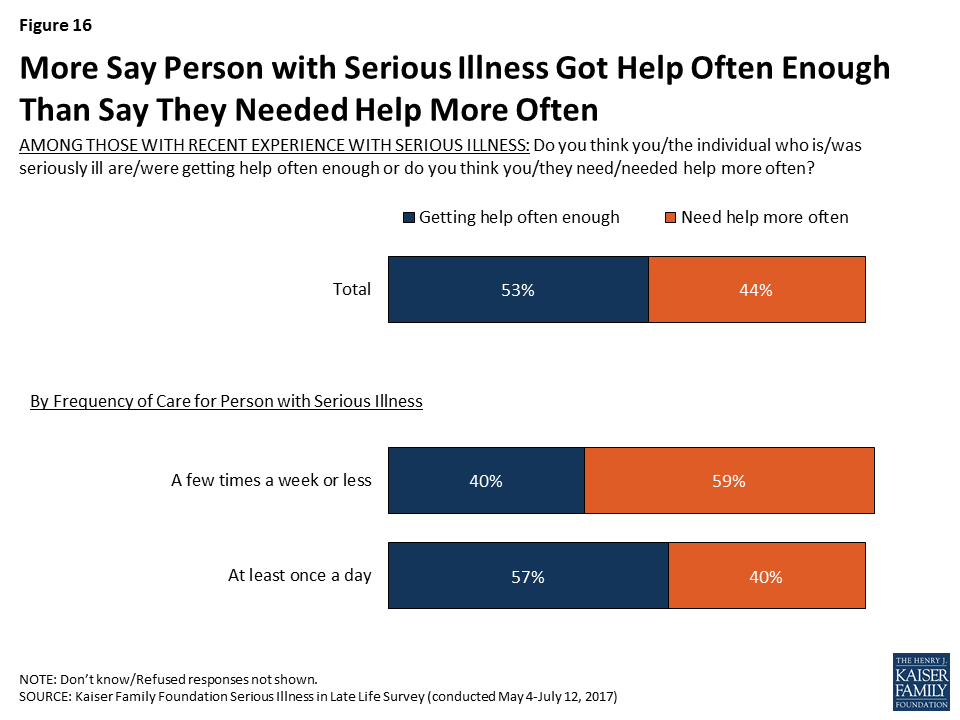
Slightly over half feel they or their family member are getting help with daily activities often enough, but over four in ten feel like they need help more often than they are getting. Those getting care just a few times a week or less are more likely than others to say they need help more often (59 percent versus 40 percent).
Figure 16: More Say Person with Serious Illness Got Help Often Enough Than Say They Needed Help More Often
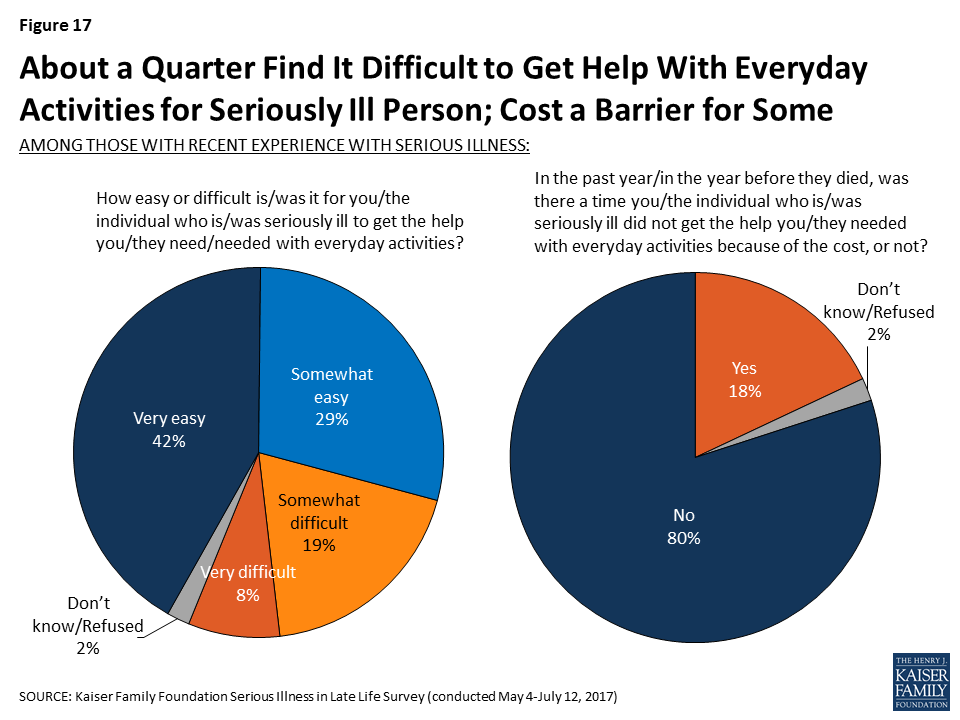
While most (71 percent) say it is easy to get the help needed with everyday activities, about a quarter (27 percent) say it is either somewhat (19 percent) or very difficult (8 percent) to get the help needed. In addition, about one-fifth of those with experience with an older adult with serious illness (18 percent) say that in the past year, there was a time they did not get the help they needed with everyday activities because of the cost.
Figure 17: About a Quarter Find It Difficult to Get Help With Everyday Activities for Seriously Ill Person; Cost a Barrier for Some
Focus Group Insights: Family members of those with serious illness reported non-medical help – for example, providing companionship, household chores, and errands – is crucial but often difficult to find and afford.
“I’m going to be looking for some help coming up in the next three or four weeks. I’m really not sure which direction to go…I’m going to try and find some people that know what they’re doing and will be there for you.”
Who is Providing Help?
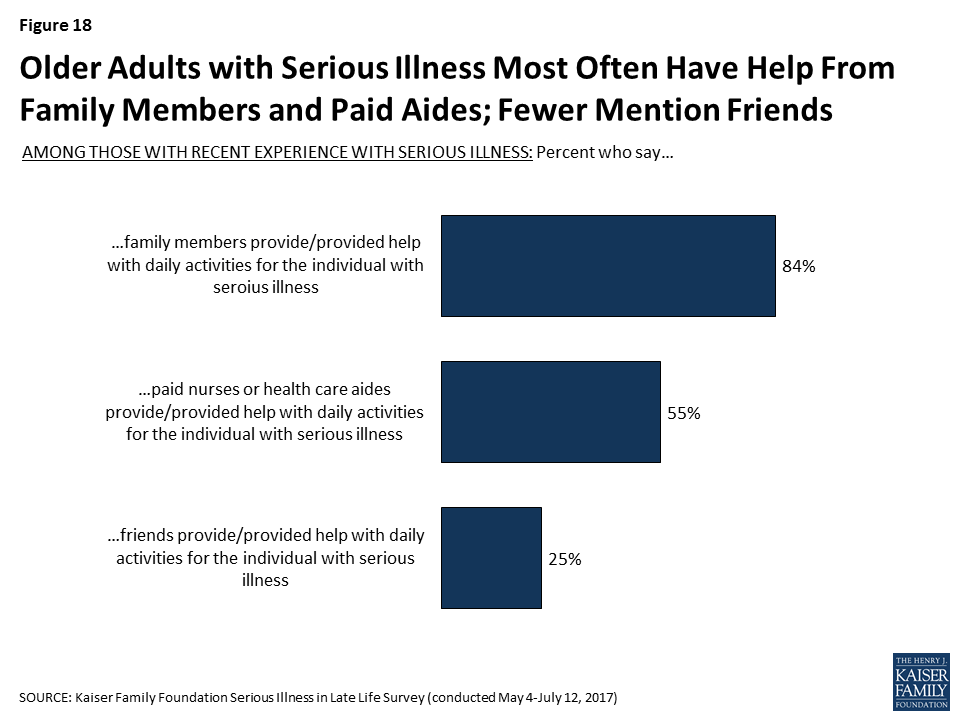
Family members are a primary source of help with everyday activities for older people with serious illness – 84 percent report that the older adult with serious illness receives help from a family member. Over half of older adults who themselves are dealing with serious illness (56 percent) say a family member helps them with everyday activities. In addition, 57 percent of family members say they personally help their loved one with daily activities, but a large majority (73 percent) also say that another family member provides help, including 79 percent of those family members who do not personally provide care. Professional caregivers are also a key source of help for those with serious illness, with over half (55 percent) saying paid nurses or health care aides help with everyday activities. In addition, a quarter say that friends are helping with daily activities (25 percent).
Figure 18: Older Adults with Serious Illness Most Often Have Help From Family Members and Paid Aides; Fewer Mention Friends
Most of those getting paid help say the nurse or health care aide is well trained (89 percent) and rate the quality of the care provided as very good or excellent (63 percent), however a few report being less satisfied with the help, including 10 percent who say the people helping them were not well trained and 12 percent who rate the care as fair or poor. Family members who report that other family members play a role in providing help most often say that the other family members were well trained (74 percent), and most getting help from friends feel they were well trained as well (66 percent).
Figure 19: Most Getting Help Say People Providing Help Were Well Trained
Family Members Personally Providing Care
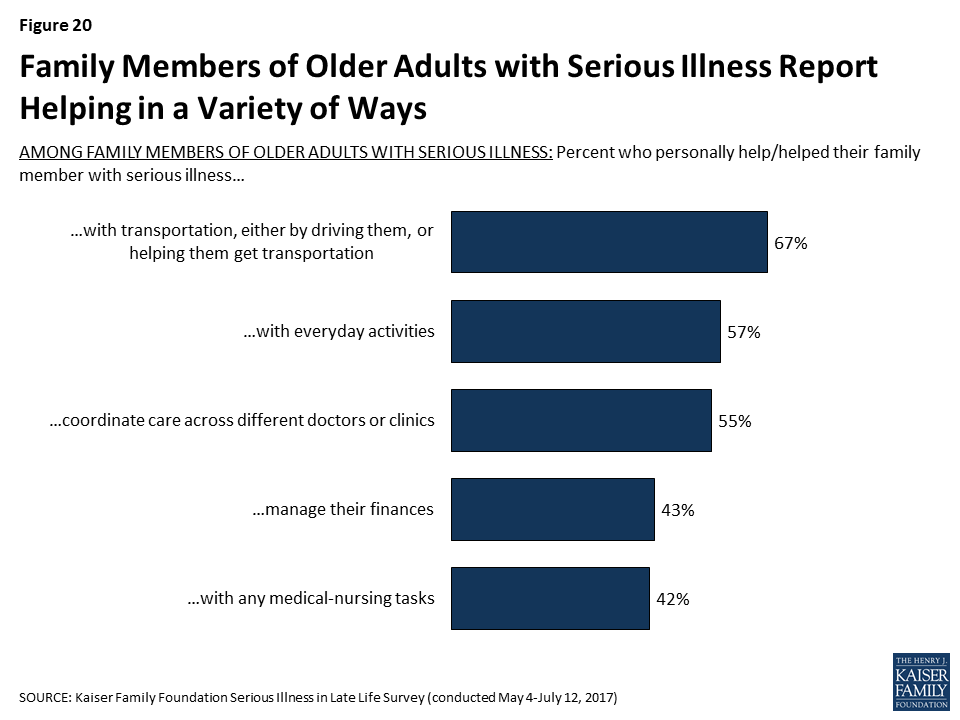
Family members of older adults with serious illness report helping with a variety of tasks. Most commonly, family members report helping their loved one with transportation (67 percent), but, as noted above, nearly six in ten also say they help with daily activities (57 percent), and over half say they help with coordinating care across different doctors or clinics (55 percent). In addition, about four in ten say they help with managing their loved one’s finances (43 percent) or with medical-nursing tasks, including things like giving medicines, monitoring blood pressure or blood sugar, helping with incontinence, or operating equipment like hospital beds (42 percent).
Figure 20: Family Members of Older Adults with Serious Illness Report Helping in a Variety of Ways
About half of family members who provide some type of assistance say they are doing so several hours a day or constantly, while 24 percent say a few hours a week and 13 percent say less often than that. Most of those providing help with daily activities said there was someone that could provide respite (79 percent), but 21 percent of family members, including 24 percent of family members who are providing care for at least an hour a day say that there is no one that can give them a break from caring for their loved one.
Figure 21: Half Say They Helped Their Family Member with Serious Illness at Least Several Hours a Day; Many Providing Help Have Backup
Focus Group Insights: Caregivers are faced with making difficult decisions about how much time they should devote to caring for a loved one. Those who care-give full-time make substantial sacrifices.
“Yeah, I watched 18 years go by when I quit working. I was there all the time. If I went out, somebody had to be there with her, so no. I kind of gave up my life for a while.”
******
Having support and relief for caregivers is key, as it’s both physically and emotionally taxing.
“We have to take care of ourselves because if we don’t they’re not going to have anybody to take care of them. I was to the point where I was about ready to split. I was tired and wasn’t thinking right. I started asking people, ‘Could you come and stay? Let me just get out for a little while.’ That’s happened. It’s a lot better. Your brain gets a little crazy when you’re tired.”
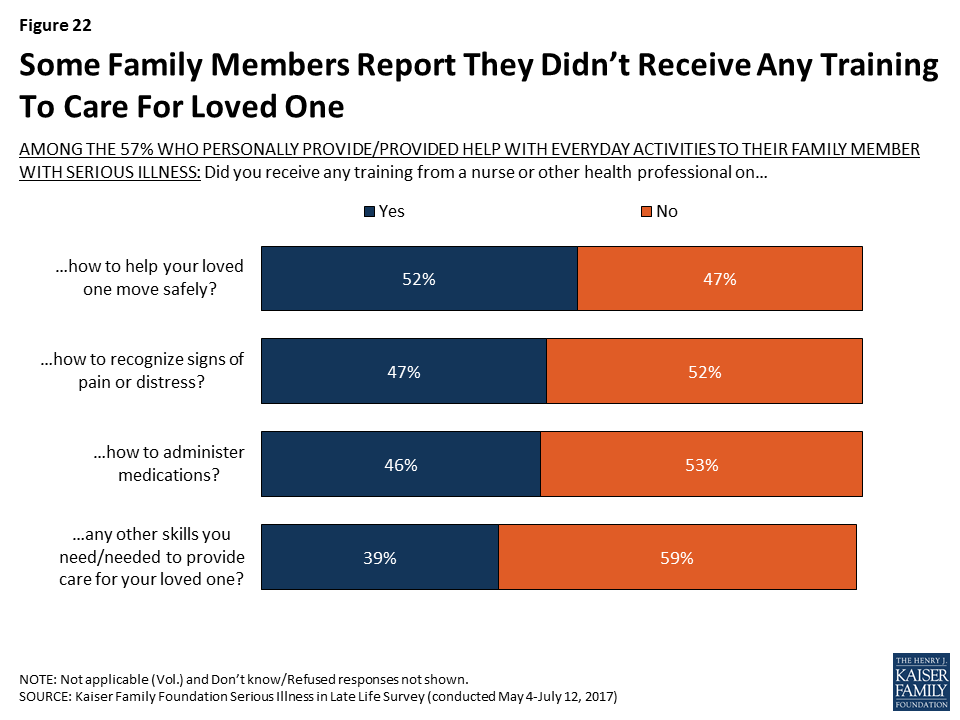
In terms of the specific types of training that family members received from a nurse of other health professional, significant shares of those providing help with daily activities say they received training on how to move their loved one safely (52 percent), how to recognize signs of pain or distress (47 percent), and how to administer medications (46 percent). Still, about half say they did not receive training in each of these areas, and 31 percent say they did not receive any of these types of training.
Figure 22: Some Family Members Report They Didn’t Receive Any Training To Care For Loved One
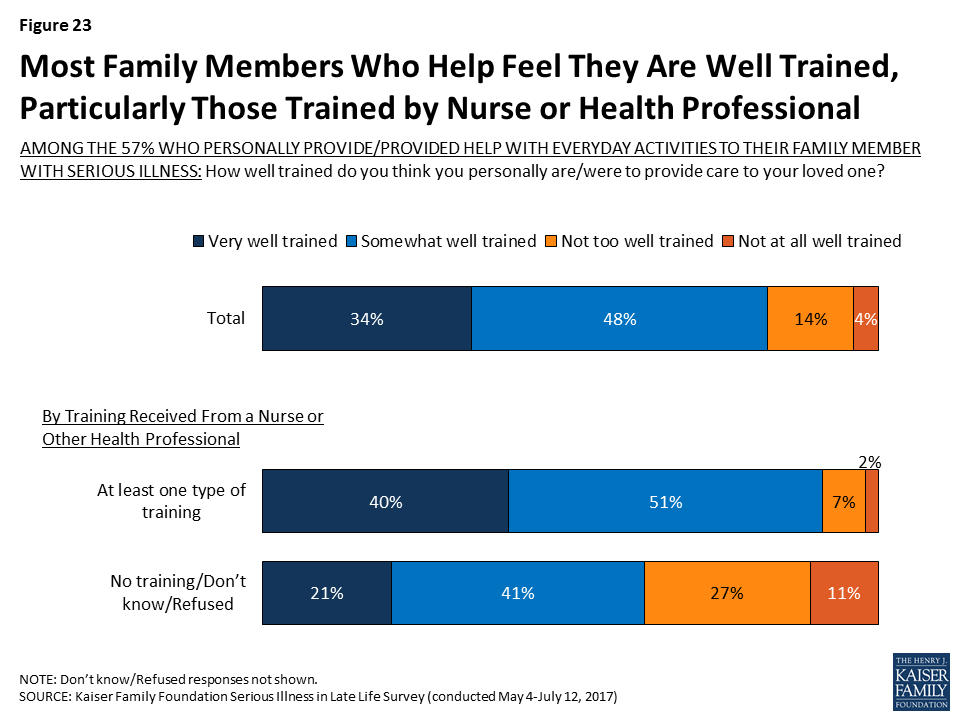
A large majority (82 percent) of family members who report personally helping their loved one with everyday activities feel they were at least somewhat well trained to provide care, but about one in five feel they were not well trained (18 percent). Family members who report getting at least one of these types of training from a nurse or health professional are more likely than others to say they feel they were well trained to provide care to their loved one (91 percent versus 62 percent). During focus groups with family members of those with serious illness, some said they learned how to care for their loved one independently, from family members, or through online resources, which may in part explain why more family members feel well trained than say they received training from a nurse or health professional.
Figure 23: Most Family Members Who Help Feel They Are Well Trained, Particularly Those Trained by Nurse or Health Professional
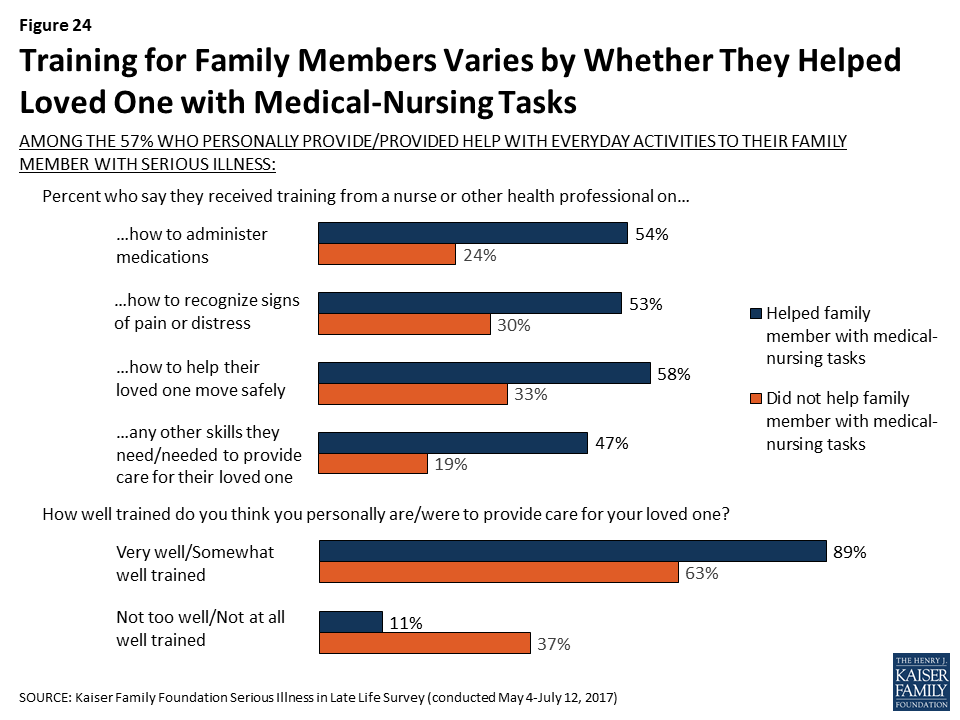
Those providing medical-nursing types of care are much more likely than family members who are not doing medical-nursing tasks but are providing help more generally to say they received training from professionals. For example, over half of family members who report helping with nursing tasks say they received training from a nurse or another health professional on how to help their loved one move safely (58 percent) and how to administer medications (54 percent), shares that are much higher than for family members who help with daily activities but who aren’t providing nursing care (33 percent and 24 percent, respectively). The vast majority of family members helping their loved one with nursing tasks feel they were well-trained (89 percent), including 41 percent who say they were ‘very’ well trained.
Figure 24: Training for Family Members Varies by Whether They Helped Loved One with Medical-Nursing Tasks
Focus Group Insights: Some suggested classes for family members that provided information on a person’s illness and prognosis or basic caregiving training.
“The one thing I would say, for my family members, I was able to show them how to wash hair, how to change the bed with the person in it, those things. But it would have been so helpful if the hospital, community center, anybody, had offered some basic classes.”
“I had to learn for myself. It’s the best way to do that from my end. I have sisters and brothers that help me with the medications, set it up and all that stuff but just to be hands on and do it myself and learn it, watch different videos on it and just research myself.”
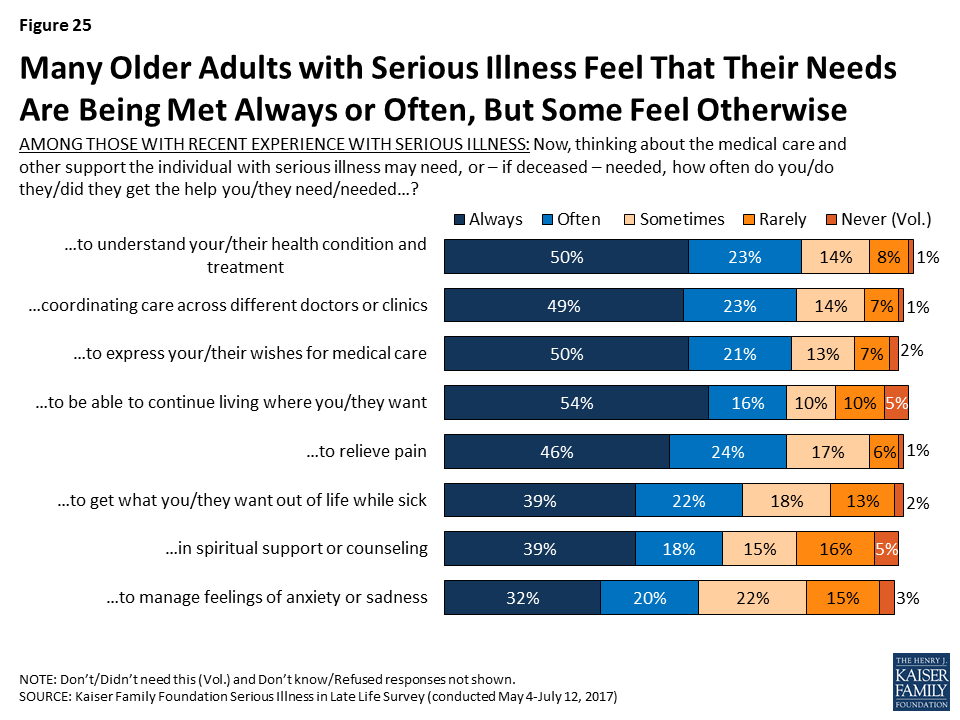
Seriously ill person’s needs being met
While many say that the person with serious illness could use help more often than they’re getting, large shares report that their or their seriously ill family member’s needs are often or always being met in specific areas, particularly in regard to help understanding their health condition and treatment (73 percent), coordinating care across different doctors or clinics (73 percent), being able to continue living where they want to be living (71 percent), expressing their wishes for medical care (71 percent), relieving pain (69 percent), and getting what they want out of life while sick (61 percent). In addition, just over half say they or their loved one often or always gets the help they need with spiritual support or counseling and to manage feelings of anxiety or sadness. However, there are some who say their needs are just sometimes, rarely, or never met, most often in help to manage feelings of anxiety or sadness (40 percent), in spiritual support or counseling (37 percent), and in getting what they want out of life while sick (34 percent).
Figure 25: Many Older Adults with Serious Illness Feel That Their Needs Are Being Met Always or Often, But Some Feel Otherwise
Focus Group Insights: Aspects of care that family members of seriously ill people said were challenging included things like coordinating care across many different providers and getting treatment information from providers.
“Trying to get in touch with your primary care is like trying to get in touch with the president, you can’t.”
Family Members’ Needs Being Met
While seriously ill people themselves have many needs that must be met, family caregivers are also often in need of emotional and logistical support. Most of those who are family members of an older person with serious illness say they often or always get the help they need understanding their loved one’s condition and with coordinating care across different clinics and providers. However, like people with serious illness themselves, the areas where more family members are less often getting the care they need is with spiritual support and managing feelings of anxiety or sadness, with about four in ten saying their personal needs in these areas were just sometimes, rarely, or never met (40 percent and 45 percent respectively). These findings hold true for those personally providing help at least an hour a day (43 percent and 48 percent, respectively).
Figure 26: Many Family Members of Those with Serious Illness Feel Supported In Managing Care, Less So For Emotional Wellbeing
Focus Group Insights: Because of challenges with care coordination, some family members of those with serious illness felt the level of care was dependent on a family’s ability to advocate and be there for their loved one.
“You really have to be aggressive and keep up with every single thing when you’re in the hospital. Because they will fall through the cracks.”
******
Many family members of those with serious illness mentioned efforts to research conditions on the internet and feeling like they needed more ‘big picture’ information from medical providers about the course of illness and what they could expect down the line.
“I don’t know if they assume that you know what all is going to happen to you when you have chemotherapy and cancer, and they don’t walk you through it, or if that’s just common not to be taught what to expect.”
Section 3: Documenting And Talking About Wishes
As people live longer with more chronic conditions, the potential for more serious health needs increases and people may experience many years of worsening health, including longer periods of time with significant physical or mental functional limitations. One way to help family members and medical providers honor and respect a person’s desires and choices about how they would like to live and be treated in the event they become seriously ill is to have a written document, no matter what age, that describes their wishes and expectations for care, such as the types of treatments they may or may not want, as well as who they would like to make decisions for them if they are no longer able to make decisions on their own. A document outlining a person’s preferences for medical care can have a variety of different names, such as a living will, an advanced treatment directive, a do-not-resuscitate order (DNR), or physician orders for life-sustaining treatment. Other documents may name a person to make decisions about medical care on another person’s behalf, a designation that is sometimes called a health care proxy or surrogate or a durable power of attorney. Throughout this report, these two types of documents will generally be referred to as a document describing a person’s medical wishes and a document naming who would make decisions on another’s behalf.
Nearly All Say Written Documents Are Important and Should Be Done Early in Adulthood
Nearly all adults, regardless of age, say it is important for people to have written down their wishes for medical care or who they would like to make decisions about their medical care in case they become seriously ill.
Figure 27: Nearly All, Regardless of Age, Say it is Important for People to Have Written Down Medical Wishes or Designated a Proxy
When asked when a person should first write something down about who will make decisions about their medical care if they’re no longer able to make them on their own, the most common answer is when they turn 18 (28 percent), followed by when they retire (19 percent), when they are diagnosed with a serious illness (19 percent), when they get married (17 percent), and when they have children (13 percent). Older adults more commonly say that people should write down who they want to make decisions for them when they retire, while younger people more commonly say it should be done when they turn 18.
Figure 28: Majorities Under 65 Say People Should Designate Medical Care Proxy Earlier in Adulthood
Focus Group Insights: Participants felt that planning for serious illness is important to do before someone becomes sick. They noted that conversations during illness were often challenging, wrought with emotion and difficult trade-offs, or came too late.
“We made some decisions that I regret. But we did it not knowing what his real wishes would have been. He wasn’t capable of telling us at that point.”
But, Fewer People Report Actually Having Written Documents
While nearly all say it’s important to have written documents, just a third of the public (34 percent) say they have a written document that describes their wishes for medical care if they became seriously ill, such as the types of treatments they would or would not want to receive. Slightly more (41 percent) report having a document that designates who they would want to make decisions about medical care on their behalf. In addition, for comparison, a similar share (40 percent) say they have a will that documents how they would like their money and belongings handled after their death. Perhaps not surprisingly, those who are older are much more likely to say they have these documents than younger people. For example, two-thirds of those 65 or older say they have a written document designating a proxy, while just a quarter of those 18 to 29 years old say they do (24 percent).
Figure 29: Older Americans More Likely to Have a Will and Written Documents Outlining Medical Wishes or Designating a Proxy
Those with lower levels of income or education are significantly less likely to report having these types of documents. For example, about a third of adults with a high school education or less (32 percent) say they have a document naming a person they would like to make decisions about their medical care, compared to 44 percent of those with some college education and 51 percent of those with at least a college education.
Figure 30: Higher-Income and Higher-Educated More Likely to Have a Will and Documents Outlining Medical Wishes or Designating Proxy
Whether a person is seriously ill or knows someone who is appears to play a limited role in whether or not they have these types of documents. Despite their poor health status, older adults who are themselves dealing with serious illness are somewhat less likely than their peers who are 65 or older to report having such documents. While this may seem counter to the expectation that those in poor health would be more likely to have these documents, this finding is related to the fact that those personally dealing with serious illness themselves report lower levels of education and income which, as noted above, are both factors that make someone less likely to have these types of documents. In addition, those who have a loved one who recently died after a period of serious illness are somewhat more likely than those with no such experience to say they have these documents.
Table 1: Reports of Planning for Serious Illness by Experience with Illness and Discussion of Death
Older adults (65+) with serious illness
Older adults (65+) without serious illness
Recent experience with serious illness of a family member
Has a family member or close friend who has died after a period of serious illness
Talked about deathgrowing up
Yes
No
Yes
No
Occasionally/Fairly often
Never/rarely
Percent who say they have a written document that…
…describes their wishes for medical care
44%
59%
39%
32%
37%
25%
37%
30%
…names who they want to make decisions about their medical care
56
68
47
40
44
35
45
38
Because many of the factors that can influence whether someone has these types of written documents are inter-related, we conducted a regression analysis to isolate which factors are the strongest predictors of who reports having either type of document. This analysis found that age is the biggest factor in having these types of documents. In addition, those with higher levels of education and those who report that their family talked about death at least occasionally when they were growing up, were more likely to report having either of these documents, even after controlling for factors such as race/ethnicity, personally being seriously ill or knowing someone who has died after a period of illness, region, and gender.
Figure 31: Education, Age, and Discussions of Death Growing Up Are Strongest Predictors of Having Written Documents
Assistance In Writing Documents
Among those who have documents either describing their wishes for care or designating a medical proxy, most say someone helped them prepare the documents. Most often people say it was a lawyer who helped them, and notably very few report getting help from a doctor or nurse or a staff member at a hospital or clinic. About a third of those who have such documents (roughly one in ten of the public overall) say they wrote them on their own.
Table 2: Most With Documents Say Someone Helped Them
Percent who say they…
Document describing wishes
Document designating proxy
Have a written document
34%
41%
Someone helped write document
21%
25%
Lawyer helped
13%
15%
Family member helped
4%
5%
Staff member at a hospital or clinic helped
1%
2%
Doctor/Nurse helped
1%
1%
Friend helped
1%
1%
Someone else helped
1%
2%
Wrote document on their own
10%
14%
Note: Multiple answers were accepted for who helped.
Creating and Reviewing Documents
Keeping these documents up to date can help avoid questions and confusion when they are put to use. Most of those who report having such a document, or about a quarter of the public overall (27 percent), say they first created or have reviewed the document within the past five years, including 13 percent who say they created or reviewed the document within the past year. Just 6 percent of the public say they have a document and they’ve made changes to the document since they first created it.
Figure 32: A Quarter Say They’ve Looked at Document Describing Wishes for Care Within Past 5 Years; Fewer Have Made Changes to It
Sharing Documents with Others
These types of documents can be more useful in helping loved ones and medical providers follow a person’s wishes if others know they exist and where to find them. Large majorities of those with a document (between a quarter and three in ten of the public overall) say they’ve given it to a spouse, parent, child, or other loved one, or that they’ve specifically given it to the person designated to make decisions for them. However, relatively few say they have given the document to a lawyer, and perhaps most importantly, just about three in ten of those with these types of documents (one in ten of the public overall) say they have given them to a doctor or other health care provider.
Figure 33: At Least a Quarter Say They’ve Shared Their Document with Family Members
Barriers to Written Documents Outlining Wishes
For the 66 percent of the public that report not having a written document that outlines their wishes for medical care if they become seriously ill, many say that a number of barriers stand in their way, such as having too many other things to worry about right now (63 percent), feeling too young or that it’s a long way off (61 percent), they haven’t thought about it (58 percent), or that they don’t want to think about sickness and death (56 percent). Younger people are more likely than older people to say most of these are reasons they don’t have a written document outlining their wishes.
Figure 34: Other Priorities, Youth, and Avoidance of Sickness/Death Are Top Reasons For Not Having a Written Document
Table 3: Barriers to Written Documents Outlining Wishes Varies by Age
AMONG THE 66% OF THE PUBLIC WHO DO NOT HAVE A WRITTEN DOCUMENT THAT DESCRIBES THEIR WISHES FOR MEDICAL CARE IF THEY BECOME SERIOUSLY ILL: Percent who say each of the following was a major or minor reason why they have not written down their wishes for medical care if they become seriously ill:
Total
Age
18-29
30-49
50-64
65+
There are too many other things to worry about right now
63%
71%
65%
58%
50%
You’re too young or that’s a long ways off
61
80
66
49
34
You haven’t thought about it
58
61
66
51
47
You don’t want to think about sickness and death
56
56
60
60
41
You’re worried you might change your mind about what you want
42
48
45
37
33
You want your doctors to make the decisions for you when needed
34
37
35
30
31
Focus Group Insights: Barriers to planning and writing down wishes include a societal taboo of discussing death, fear of death, and procrastination.
“I’m not ready to die, I think I’m too young.”
“Nobody wants to be faced with their own mortality.”
“I’ll deal with it tomorrow. The perpetual tomorrow”
Perhaps another barrier that prevents people from creating documents outlining their wishes for medical care is the feeling that someone else already understands what they would want. More than eight in ten of those who don’t have a written document describing their medical wishes say they think there is someone who understands their wishes. However, some (32 percent of those without a written document) say they think that someone else knows their wishes because they know them well enough to know what they’d want, rather than because they’ve talked to them about it (31 percent).
Figure 35: Most Without Written Document Say Someone Understands Their Wishes, But Not Always Due to Explicit Conversation
However, Many say they’ve talked about these things with their family
Although most of the public says they don’t have a document outlining their wishes or who they would want to make decisions for them if they were to become seriously ill, many do say they have had a serious conversation with a spouse, parent, child, or other loved one about a number of different aspects of planning for potentially becoming seriously ill. More than half say they’ve had a serious conversation with a loved one about who will make medical decisions if they can no longer do so on their own (62 percent) or about their wishes for medical care if they become serious ill (54 percent). About half say they have talked with a loved one about who would help take care of them if they needed help caring for themselves (47 percent). Less frequently reported types of conversations include what they would need to have a good quality of life while seriously ill (38 percent), how they would pay for health care and other support they might need if seriously ill (36 percent), and where they would live if they’re no longer able to live independently (34 percent). However, many still say they have not had discussions about some of the specific topics experts say are important parts of planning for serious illness.
It’s particularly notable that one of the types of conversations that is less often reported is about finances, the aspect that may take the most advanced planning and one that ties into several of the other aspects such as access to housing and support services.
Figure 36: Many Report Conversations With Loved Ones About Their Own Medical Care Wishes and Planning For Serious Illness
Generally, older people are more likely than younger adults to report having these types of conversations with loved ones. Those who are 65 or older who themselves are dealing with serious illness are no more likely than their peers in better health to say they’ve had these types of conversations with a family member.
Table 4: Serious Conversations with a Family Member About Planning for Serious Illness, by Age
Percent who say they have ever had a serious conversation with a spouse, parent, child or any other loved one about each of the following:
By Age
Serious Illness
18-29
30-49
50-64
65+
Older adults (65+) with serious illness
Older adults (65+) without serious illness
Who will make decisions about their medical care if they can no longer make them on their own
40%
59%
69%
82%
80%
83%
Their wishes for medical care if seriously ill
38
46
61
71
70
71
Who will help take care of them if they need help caring for themselves
31
40
55
65
66
65
What’s needed for a good quality of life if seriously ill
25
35
43
48
44
48
Where they’ll live if seriously ill
17
29
39
55
54
55
How to pay for health care and other support if seriously ill
22
32
43
47
38
48
Yes to any of the above types of conversations
59
71
80
90
92
90
But, those who have some connection to serious illness, either with a loved one currently facing illness or knowing someone who died after a period of illness are more likely to say they’ve talked about some of these things. For example, 58 percent of those who say they have a family member or close friend that died after a period of serious illness say they have discussed their wishes for medical care if they become seriously ill with a family member, compared to 43 percent of other adults. In addition, those who say their family talked about death at least occasionally when they were growing up are more likely to report having at least one of these types of conversations with family members than those who report talking about death less frequently.
Table 5: Serious Conversations with a Family Member About Planning for Serious Illness, by Experience with Illness
Percent who say they have ever had a serious conversation with a spouse, parent, child or any other loved one about each of the following:
Recent experience with serious illness of a family member
Has a family member or close friend who has died after a period of serious illness
Talked about death growing up
Yes
No
Yes
No
Occasionally/Fairly Often
Rarely/never
Who will make decisions about their medical care if they can no longer make them on their own
68%
61%
66%
54%
65%
59%
Their wishes for medical care if seriously ill
56
53
58
43
57
50
Who will help take care of them if they need help caring for themselves
54
46
50
41
51
43
What’s needed for a good quality of life if seriously ill
42
37
41
30
43
32
Where they’ll live if seriously ill
41
33
38
26
37
31
How to pay for health care and other support if seriously ill
42
35
39
29
40
31
Yes to any of the above types of conversations
79
74
79
66
80
69
A regression analysis shows that the factors most associated with discussing these issues with family members, are higher levels of education, being older, being female, and having discussed death with family growing up at least occasionally, even after controlling for race/ethnicity, region, knowing someone who has died after a period of serious illness, and being personally seriously ill. Age is the most influential factor, even after considering other personal characteristics.
Figure 37: Education, Age, Gender, and Discussions of Death Growing Up Are Strongest Predictors of Discussions with Family
Most Say They Have Discussed These Issues With Their Family More Than Once
People who report having conversations with family members about preparations for serious illness say they’ve had such conversations repeatedly, and recently. Experts consider both to be an important part of planning for serious illness because wishes may change with time or as circumstances change. About half of the public say they’ve discussed these issues with loved ones more than once, while 17 percent say they’ve only discussed them once. Most of those who report talking with their family about these issues say they’ve discussed them within the past year (48 percent of the public overall), particularly those who say their health is fair or poor (59 percent).
Figure 38: Many Say Conversations With Loved Ones Happened More than Once and Recently
Relatively Few Say They Have Talked About Preparing for Serious Illness with Medical Providers, Lawyers, Financial planners, or Religious Leaders
Doctors and other medical providers can play an important role in helping people fulfill their wishes for medical care if they become seriously ill, however relatively few say they’ve talked to a medical provider about who would make decisions for them (23 percent), what sort of medical care they would want (18 percent), or where they would like to receive care if they became seriously ill (11 percent). Older people and people in fair or poor health are more likely to report having these types of conversations with a doctor, but still just about half of older people say they’ve talked about any of these issues.
Table 6: Serious Conversations with Doctors or Other Health Care Providers about Planning for Serious Illness, By Age and Health Status
Percent who say they have ever had a serious conversation with a doctor or other health care provider about each of the following:
Total
Age
Health Status
18-29
30-49
50-64
65+
Excellent/Very good/Good
Fair/Poor
Who will make decisions about their medical care if they can no longer make them on their own
23%
18%
19%
23%
37%
22%
30%
Their wishes for medical care if seriously ill
18
9
11
19
34
16
24
Where they would like to receive care if seriously ill
11
8
9
11
20
10
17
Yes to any of the above types of conversations
31
24
23
30
51
28
41
Focus Group Insights: There are mixed reactions to how involved physicians should be in the planning process. Some people say they are resistant to talking with their doctors about planning for serious illness because they don’t want to think about dying while they’re at the doctors’. Others say they would prefer to get information from doctors that they can take home and consider, while others are open to conversations with providers they know well.
“Every time I go, [a doctor asks] do you have a do-not-resuscitate? And it makes me feel funny because I’m at the doctors and I don’t want to think about dying right now, thank you very much.
There are other individuals that can play a role in helping to shape or fulfill an individual’s wishes for medical care if they become seriously ill, such as a lawyer or financial planner who can help create legal documents or savings plans and religious or spiritual leaders who can help individuals outline what’s important to them in sickness and dying. But conversations with these individuals about wishes for medical care are also relatively rare – 19 percent say they’ve talked with a lawyer or financial planner and 12 percent say they’ve talked with a religious or spiritual leader.
For those who haven’t had these types of conversations with their family, medical providers, lawyers or financial planners, or religious leaders, some say they would want to do so. For example, for the 46 percent who say they haven’t talked with a family member about their wishes for medical care if they become seriously ill, most say they would want to (34 percent of the public overall). Notably, half the public (51 percent) say they have not and do not want to discuss these issues with a lawyer or financial planner, and two-thirds (66 percent) say the same about discussions with a religious or spiritual leader.
Figure 39: Few Have Talked About Their Wishes for Care With a Doctor, Lawyer or Spiritual Leader; Some Are Open to It
Reports of Planning Among Family Members of Older Adults with Serious Illness
Among family members of older adults with serious illness, most report that their loved one has a document that describes their wishes for medical care (60 percent) or designates someone to make medical decisions on their behalf (70 percent). Those whose loved one is at least 80 years old are more likely than those whose family members are between ages 65-79 to say they have these written documents.
Figure 40: Most Family Members Report Loved One Has Written Medical Wishes or Designated a Proxy, More so for Those Who Are Older
Family members, for the most part, say that if their loved one has a document describing their wishes for medical care, they know where to find it if they were to need it (80 percent of those whose family member has a written document, or 48 percent of all family members of older adults with serious illness). About one in five say they have referred to this document when making decisions about their family member’s care and nearly all of those who referred to the document say it was helpful to have (21 percent of family members overall).
Figure 41: Many Family Members Say They Know Where To Find Loved One’s Written Wishes Document
A majority of family members of older people with serious illness say that they have had a serious conversation about a variety of aspects of planning for late life and poor health. Six in ten family members say they’ve talked with their loved one about their wishes for medical care (60 percent), who would make decisions for them about their medical care if they were no longer able to make them on their own (60 percent), or who would help take care of them if they were no longer able to care for themselves (60 percent). Over half say they’ve talked with their family member about what they need to have a good quality of life while sick and where they would like to live if they can’t live independently (54 percent each). A smaller share, about four in ten, say they’ve talked to their family member about how they will pay for help with daily tasks or care that isn’t covered by health insurance (41 percent). It’s notable that here family members are also reporting their loved ones are talking less about finances than about some of their other expectations about late life and serious illness. Of course, family members are answering about their conversations with their loved one and it’s possible their loved one has had a conversation with a different family member.
Figure 42: Family Members Say They Have Talked To Seriously Ill Loved One About Wishes and Plans
Focus Group Insights: Family members of those with serious illness say that staying at home is an attractive option until the reality of the level of care needed becomes apparent.
“She would have stayed at home all the way. She had always said, ‘Don’t ever put me anywhere. I want to always be at home.’ We’d always agreed to that until we were in that position. I never thought I would put her anywhere else, ever.”
Understanding And Following Loved Ones Wishes
Most family members of older adults with serious illness say they know or knew exactly what their loved one’s wishes for medical care are or that they have a pretty good idea. And, for those that say they don’t really know their loved one’s wishes, eight in ten (83 percent) say that there’s another family member that knows their wishes better than they do. Writing wishes down and talking about them appears to make a big difference; family members whose loved one has a written document outlining their wishes are more than twice as likely to say they know exactly what their loved one wanted than those without such a document (53 percent versus 23 percent). And, family members who say they talked with their seriously ill loved one about their wishes are more than three times as likely than others to say they know exactly what their loved one wanted (58 percent vs. 16 percent). Those family members that are designated as their loved one’s proxy or help their loved one with daily activities or other types of assistance are also more likely to say they know exactly what their seriously ill loved one wants for their medical care.
Figure 43: Family Members of Older Adults with Serious Illness More Likely to Say They Understood Wishes if They Had Documented Wishes
Focus Group Insights: Family members of those with serious illness appreciate when wishes are known and steps are taken to plan for serious illness. They expressed frustration when decision making is left up to them.
“She had living will and power of attorney but you know what it said? Unless it was putting her in a facility or she was on life support, in other words other than two options, it was up to us to decide. I’m like, ‘That’s not an answer.’ I think she’s one of those, if you avoid this subject then it’s not going to happen. That was very frustrating.”
Among individuals and family members of older adults with serious illness, nearly all say their or their loved ones wishes for their medical care are being very or somewhat closely followed, including more than six in ten who say they are ‘very closely’ followed. Those who say they have documents outlining their wishes are more likely to say their wishes are ‘very closely’ followed than those that do not (70 percent versus 54 percent), but there’s no difference for those who say they’ve talked about them compared to those who say they haven’t discussed their wishes (65 percent and 60 percent). However, as noted above, those family members who haven’t talked with their loved one about their wishes are less familiar with the care they want and therefore may not be able to accurately describe if their wishes for care are being closely followed.
Figure 44: Older Adults with Serious Illness Who Documented Wishes for Medical Care More Likely to Say Their Wishes Closely Followed
Most family members of older adults with serious illness (68 percent) say there are rarely or never disagreements among family members about what sort of medical care their loved one should or shouldn’t receive, but about one in ten (9 percent) say there are often disagreements, and about two in ten (22 percent) say there are sometimes disagreements. Those who say their family member has had conversations with them or has a written document about their wishes are no more likely to say there are frequently disagreements among family members.
Planning: Financial Preparations
As noted above, just 36 percent of the public say they have personally had a serious conversation with a loved one about how they would pay for medical care and other needed services if they become seriously ill. While they may not be talking about this issue, about six in ten of the public say they feel very or somewhat confident they will have enough income and assets to last throughout their retirement years, even if they become seriously ill and need long-term support either at home or in a nursing home, but 37 percent are not confident they will. For those currently in or near their retirement years – those 65 or older – 74 percent feel confident they have enough income and assets for retirement, even if they become sick. And, for many older adults, this confidence may not be misplaced; more than six in ten of adults 65 or older are estimated to be financially secure, however this security declines for the oldest adults (75 or older), and still many are estimated to have more tenuous financial circumstances.5
Figure 45: Many Are Confident of Finances in Retirement, But About a Third Are Less Sure
A striking 62 percent of those in fair or poor health and 52 percent of those making less than $40,000 annually say they’re not confident they’ll have enough income and assets to last through retirement. Looking specifically at those age 65 or older, roughly four in ten of those in fair or poor health or of those with annual incomes of less than $40,000 say they are not confident they will have enough income and assets to last throughout their retirement.
Figure 46: Those with Poorer Health or Lower-Incomes More Likely to Not Be Confident They Will Have Enough to Last Through Retirement
Even while many are confident they will have the income and assets to last through retirement in the event of illness, many say they are worried that if they were to become seriously ill when they are older they will have trouble affording needed medical care (65 percent), not be able to continue living where they want to (59 percent), have trouble affording support services (56 percent), have trouble affording housing (50 percent), or that they will leave debts to their family when they die (42 percent). Younger adults are particularly worried about these issues.
Figure 47: Majorities Worry About Affording Care, Housing Situation When They Become OlderFigure 48: More Younger Adults Are Worried About a Number of Issues If They Were to Become Seriously Ill When They Are Older
Steps Taken to Plan for Aging
Some people 50 and older report taking a variety of actions to plan for their own needs as they age, such as setting aside money that could be used to pay for ongoing living assistance (43 percent), looking for information about aging issues and the types of care available to people as they age (35 percent), modifying their home to make it easier to live in as they grow older (33 percent), or moving or making plans to move to a place designed for older adults (10 percent).
Figure 49: Some Age 50 and Older Have Taken Steps To Plan For Their Needs as They Age
In addition, about half of those who have not yet retired (53 percent) say they are currently saving for retirement. Adults under 30 are much less likely to say they are saving (39 percent), but majorities of those 30 to 49 (59 percent) and 50-64 (57 percent) say they are, as well as about half (49 percent) of those 65 or older who are not already retired.
Table 7: Steps Taken to Plan for Serious Illness
Age
18-29
30-49
50-64
65+
AMONG THOSE 50 YEARS OF AGE OR OLDER: Percent who say that in order to plan for their needs as they age they have…
…Set aside money that could be used to pay for ongoing living assistance expenses
—
—
36%
52%
…Looked for information about aging issues and the types of care available to people as they age
—
—
28
43
…Modified your home in any way to make it easier to live in as you grow older
—
—
28
40
…Moved or made plans to move to a community or facility designed for older adults
—
—
7
13
AMONG THOSE WHO ARE NOT RETIRED: Percent who say they are…
…Currently saving for retirement
39
59
57
49
Misconceptions About The Role of Medicare in Late Life
Other surveys have shown that much of the public expects to rely on Medicare when they get older.6 However, there are misconceptions about what Medicare does and does not cover that can leave people ill prepared to handle expenses they have to pay out of pocket. Many are correctly aware that Medicare covers medical equipment, such as wheelchairs and other assistive devices (65 percent), care to those in their final stages of life (52 percent), and doctors’ discussions with patients about end-of-life care (44 percent). However, about three in ten incorrectly say Medicare covers ongoing support services at home, such as someone to help prepare meals and do household chores, or that it covers long-term care in a nursing home. Four in ten incorrectly say it covers transportation to and from medical appointments for those who can no longer drive. About two in ten incorrectly say Medicare covers care that focuses on the spiritual and emotional aspects of living with a serious illness for those who are expected to live a year or more.
Figure 50: Gaps In Knowledge About What Services Medicare Covers
Section 4: Differences By Race/ethnicity
To better understand how views of and experiences with serious illness vary across race/ethnicity, the following section highlights some of the areas where attitudes and experiences diverge for black, Hispanic, and white adults. However, in many areas, there are few differences across these racial and ethnic groups.7
Older Black Adults Are Less Likely To Report Having Documented Wishes
Across races, nearly everyone thinks it is important to have documents describing wishes for medical care and designating someone to make decisions on one’s behalf. But there is less agreement on when the best time to complete these documents is in adulthood. Black adults skew towards believing people should name a health care proxy in their younger years – 35 percent of people who are black say it should be when a person turns 18 and another 23 percent of people who are black say it should be when they get married. On the other hand, over a third of Hispanic adults (36 percent) say that a person should first write something down about who they would want to make decisions for them when they are diagnosed with a serious illness. Interestingly, Hispanic adults who are in fair or poor health (51 percent), female (44 percent), or have lower-incomes (earning less than $40,000 per year) (43 percent) are more likely than other Hispanic adults to say it should be done when a person is diagnosed with a serious illness.
Figure 51: Hispanics More Likely Than Others To Say Designating Medical Care Proxy Should Happen At Diagnosis
Overall, black and Hispanic adults are less likely than white adults to report having documents describing their wishes or naming a health care proxy, a finding that is at least in part related to the fact that black and Hispanic adults tend to be younger, have lower levels of education, and have lower incomes than white adults – all factors, as noted above, that are associated with being less likely to have these types of documents. However, focusing only on those 65 or older, about half of older Hispanics and more than six in ten older whites say they have either type of written document, but older blacks are less likely than their white and Hispanic counterparts in reports of having these types of documents. Just 19 percent of blacks adults ages 65 or older say they have a document describing their wishes and about a third (35 percent) have a document naming a health care proxy.8
Figure 52: Older Black Adults Are Less Likely To Report Having Documented Wishes
Black and Hispanic Adults More Likely Than Whites to Report Resistance To Thinking about Sickness and Death
Reports of which barriers keep people from creating these types of documents are similar across racial and ethnic groups, except black and Hispanic adults who do not have these documents are more likely than white adults to express resistance to thinking about sickness and death. Roughly four in ten black and Hispanic adults say the fact that they ‘don’t want to think about sickness and death’ is a major reason they do not have a written document, compared to 21 percent of whites.
Table 8: Barriers to Written Documents Outlining Wishes Varies Little by Race
AMONG THE 66% OF THE PUBLIC WHO DO NOT HAVE A WRITTEN DOCUMENT THAT DESCRIBES THEIR WISHES FOR MEDICAL CARE IF THEY BECOME SERIOUSLY ILL: Percent who say each of the following was a major reason why they have not written down their wishes for medical care if they become seriously ill:
Total
Race/Ethnicity
White
Black
Hispanic
There are too many other things to worry about right now
36%
35%
33%
43%
You’re too young or that’s a long ways off
32
32
26
34
You haven’t thought about it
32
29
34
39
You don’t want to think about sickness and death
27
21
37
42
You’re worried you might change your mind about what you want
13
10
20
14
You want your doctors to make the decisions for you when needed
11
9
10
16
People who are black (77 percent) or Hispanic (76 percent) that do not report having written down their wishes are somewhat less likely than people who are white (89 percent) to say they think there is someone who understands their wishes for medical care if they become seriously ill, but still large majorities do.
Across Race/Ethnicity, Many Report Talking To Loved ones About These Issues
White adults are more likely than black and Hispanic adults to report having conversations with their family about their wishes, about who will make decisions on their behalf, and about who will help take care of them. Again, these differences are related to demographic differences such as age and income. However, similar shares of older Hispanics, older whites, and to a somewhat lesser extent, older blacks, report they have had these types of conversations with family.
Table 9: Serious Conversations with Family Member about Planning for Serious Illness, By Race/Ethnicity and Age
Percent who say they have ever had a serious conversation with a spouse, parent, child or any other loved one about each of the following:
Total
Race/Ethnicity
White
Black
Hispanic
White
Black
Hispanic
<65
65+
<65
65+
<65
65+
Who will make decisions about their medical care if they can no longer make them on their own
62%
67%
54%
51%
63%
82%
48%
86%
48%
76%
Wishes for medical care if seriously ill
54
61
35
41
57
74
34
40
39
72
Who will help take care of them if they need help caring for themselves
47
51
42
41
46
66
38
63
38
70
What’s needed for a good quality of life if seriously ill
38
40
34
36
37
49
35
31
34
57
How to pay for health care and other support if seriously ill
36
39
31
32
37
47
29
41
29
67
Where they will live if seriously ill
34
36
29
36
30
55
26
44
33
67
Yes to any of the above types of conversations
75
79
68
68
75
91
64
88
66
91
Similar shares of people who are white, black and Hispanic report talking with a doctor or other medical provider, or with a religious or spiritual leader about these issues. However, white adults are more likely to say they have talked with a lawyer or financial planner (24 percent), than black (11 percent) or Hispanic (9 percent) adults, in part reflective of whites typically having higher incomes. Looking just at adults 65 or older, more than a third of older white adults (37 percent) say they have talked to a lawyer or financial planner about their wishes, compared to just 18 percent of older black adults and 5 percent of older Hispanic adults.
Table 10: Serious Conversations about Planning for Serious Illness, By Race/Ethnicity
Percent who say they have ever had a serious conversation with each of the following:
White
Black
Hispanic
Doctor or other health care provider about wishes for medical care, who will make medical decisions, or where to receive care if seriously ill
30%
33%
29%
Lawyer or financial planner about wishes for medical care if seriously ill
24
11
9
Religious or spiritual leader about wishes for medical care if seriously ill
12
12
13
When black and Hispanic family members of those with serious illness are asked if their loved one has a document outlining their wishes for medical care or designating a proxy, they are much less likely than family members who are white to report that they do.
Figure 53: Majority of Family Members Report Loved One Has Written Medical Wishes or Designated a Proxy
A number of different findings from the survey point to some of the financial issues Hispanic adults are having or are worried about when it comes to aging and serious illness. People who are Hispanic are more likely than white or black adults to report being worried about facing challenges when they are older such as affording medical care or support, housing issues, or leaving debts to their family. For example, three quarters of Hispanic adults (77 percent) are worried about having trouble affording medical care if they become seriously ill, compared to 64 percent of white adults and 62 percent of black adults. Younger Hispanics are particularly worried about not being able to continue living where they want, having trouble affording housing, and leaving debts to their family when they die.
Table 11: Worries About Becoming Seriously Ill, By Race/Ethnicity
Percent who say they are worried that if they were to become seriously ill when they are older they will…
White
Black
Hispanic
…Have trouble affording the medical care they need
64%
62%
77%
…Have trouble affording the support services they may need, such as someone to help prepare meals and do household chores
55
51
67
…Not be able to continue living where they want to
57
54
72
…Have trouble affording housing
45
54
69
…Leave debts to their family when they die
37
40
63
In addition, nearly half of Hispanic adults (46 percent) say they are not confident they will have enough income and assets to last throughout retirement if they end up needing long-term support, compared to a third of whites (35 percent) and blacks (32 percent), again related to underlying demographic differences between groups. However, there are no differences across race/ethnicity among older adults. Similar shares of black (24 percent), Hispanic (21 percent) and white (24 percent) adults 65 or older say they are not confident they will have enough income and assets to last throughout retirement, even if they end up needing long-term support.
Figure 54: About Half of Hispanics Are Not Confident They’ll Have Enough to Last Through Retirement; No Differences Among Seniors
Hispanics 50 or older are less likely than their counterparts who are white and black to say they are taking steps to plan for their own financial needs as they age. A quarter of Hispanics age 50 or older (24 percent) say they have set aside money that could be used to pay for ongoing living assistance expenses, while a third of older blacks (36 percent) and nearly half of older whites (46 percent) say they have. In addition, just a third of Hispanics who are not yet retired say they are saving for retirement (32 percent), compared to half of black adults (49 percent) and six in ten white adults (60 percent) who are not yet retired.
Figure 55: Across Race, Some Age 50 and Older Have Taken Steps To Plan For Their Needs as They Age
Financial Challenges for Hispanics with Serious Illness
Hispanic adults with personal experience with serious illness, either themselves or a family member, are somewhat more likely than white or black adults to say it was difficult to get the help needed with everyday activities and that they did not get the help they needed due to cost.
Figure 56: Larger Share of Hispanics than Whites, Blacks Say the Seriously Ill Struggled to Get the Help They Needed with Daily Activities
Hispanic adults with personal experience with serious illness, either themselves or a family member, are also more likely to say they have specifically had trouble paying for medical care. They are more likely than whites and blacks to say they had trouble paying for medications in the past year, or in the year before they died (28 percent versus 18 percent and 19 percent, respectively). Hispanic adults with serious illness experience also say more often than whites that the seriously ill person had trouble paying for medical treatment or tests in the past year, or in the year before they died (23 percent versus 15 percent). However, in terms of finding or paying for support services, there are no significant differences.
Figure 57: Hispanics More Often Say Paying For Medical Tests and Medications Was a Problem
Conclusion
The U.S. population is aging, and with that shift comes new challenges in meeting the needs of older adults with serious health needs. This comprehensive, large-scale survey helps illuminate what some of these challenges are and provides insight into the perspectives of the public at large as well as of older adults personally facing serious illness and their family members about how they view care in the U.S., steps they’ve taken to plan for becoming seriously ill in later life, and their current experiences with care and support for those with serious illness. In general, the public is largely aware of some of the issues that arise with serious illness in late life, but many haven’t taken tangible steps to prepare for these issues affecting them personally. Older adults with serious illness report facing a variety of challenges and some say they need help more often than they are getting. In general, most of those with recent experience with serious illness have positive impressions of the care they’re getting, while the public at large has more negative views about how well the U.S. health care system does in providing care for people with serious health needs. Having documents outlining wishes for medical care seems to make some difference in helping family members know what types of care a loved one wants and in having their wishes closely followed. Views of and experiences with these issues vary across age and race/ethnicity, with older people typically being more likely to have taken steps to plan. However, older black adults come behind their Hispanic and white counterparts in having documents describing their wishes. In addition, Hispanics overall are more apt to report financial challenges and uncertainty about late life and serious illness than black and white adults. These findings help identify for policymakers, those who care for older adults, and the public at large, what gaps remain in terms of the care older adults with serious illness are receiving as well as the public’s overall preparedness for their own potential illness, and future surveys can assess how these have changed over time.
Methodology
Survey Methodology
The Kaiser Family Foundation Serious Illness in Late Life Survey was conducted by telephone May 4 – July 12, 2017, among a representative, random national sample of 2,040 adults age 18 and over, living in the United States, including Alaska and Hawaii (Note: persons without a telephone could not be included in the random selection process). Computer assisted interviews conducted by landline (n=677) and cell phone (n=1,363, including 798 who had no landline telephone) were carried out in English and Spanish by SSRS. The survey was designed and analyzed by public opinion researchers at the Kaiser Family Foundation, and was funded through a grant from the Gordon and Betty Moore Foundation.
In order to better understand how those with serious illness are faring and what challenges they face in accessing and affording care and support services, the full sample includes additional interviews with people who have experience with serious illness, either personally or with a family member (commonly referred to as an “oversample”).
Individuals were classified as being seriously ill if they met each of the following criteria:
they were 65 or older,
they said they had functional limitations due to a health or memory problem such as difficulty preparing meals, shopping for groceries, taking medications, getting across a room, eating, dressing, bathing, or using the toilet,
they said they have been diagnosed with at least one of the following conditions: diabetes or high blood sugar; asthma, lung disease, emphysema, or COPD; heart disease or had a stroke; cancer, not including skin cancer; Alzheimer’s disease, dementia or memory loss; depression, anxiety or other serious mental health problems; or, chronic kidney disease or kidney failure.
Individuals qualified as a family member of someone with serious illness if their loved one currently met the criteria above or if they did so before they died within the past two years. In order to be included, family members also must have said they knew at least something about their family member’s medical care. The exact wording of the screening questions for each qualifying group can be found in the Topline and Methodology.
In total, the survey included 998 interviews with people who met the above definition of having experience with serious illness, including 183 interviews with older adults who are personally seriously ill, 494 with family members of older adults currently living with serious illness, and 321 with family members of older adults who died after a period of serious illness. To ensure there were enough respondents to capture the views and situations of adults who are black or Hispanic who have experience with serious illness, the total sample included 278 blacks with serious illness experience and 282 Hispanics with serious illness experience (in addition to 109 blacks and 119 Hispanics without serious illness experience). Results for all groups have been adjusted to reflect their actual national distribution (See weighting description below).
The SSRS Omnibus survey (detailed below) estimates that less than 20 percent of adults in the U.S. qualify under this survey’s definition of experience with serious illness. To oversample those with experience with serious illness, particularly those who are black or Hispanic, the sample plan consisted of three elements:
Cell and Landline Phone Random Digit Dialing (RDD) (n=1,444). The dual frame landline and cellular phone sample was generated by Marketing Systems Group (MSG) using RDD procedures. This included 148 respondents reached by cell phone or landline within Census blocks with an estimated larger share of black or Hispanic people and 34 respondents reached by landline where directory listings indicated one household member at least has a distinctive Hispanic last name. To randomly select a household member for the landline samples, respondents were selected by asking for the youngest or oldest adult male or female currently at home based on a random rotation. If no one of that gender was available, interviewers asked to speak with the youngest or oldest adult of the opposite gender. For the cell phone sample, interviews were conducted with the adult who answered the phone.
Pre-screened Respondents Previously Completing Interviews on the SSRS Omnibus Survey (n=288). Weekly, RDD landline and cellular phone surveys of the general public were used to identify respondents who qualified as having experience with serious illness. Individuals who had previously indicated on the SSRS omnibus survey that they fit the eligibility criteria for this group were re-contacted and re-screened for this survey.
Respondents Previously Completing Interviews on the SSRS Omnibus Survey (n=308). Individuals who had previously indicated on the SSRS omnibus survey that they were black or Hispanic and were 50 or older were re-contacted, as they were generally more likely to be either personally ill themselves or have a family member who is or was before they died. A small sample of blacks or Hispanics 40-49 years old was also included.
A multi-stage weighting process was applied to ensure an accurate representation of the national adult population. The first stage of weighting involved corrections for sample design, including a correction for the oversampling of telephone exchanges known to have higher incidences of blacks and Hispanics, the likelihood of non-response for the re-contacted samples, and an adjustment to account for the fact that respondents with both a landline and cell phone have a higher probability of selection. The second weighting stage was conducted separately for those with serious illness experience and those without. There are no known administrative data available for creating demographic weighting parameters for those with experience with serious illness as defined by this survey. Therefore, demographic benchmarks were derived by compiling a sample of all respondents interviewed on the SSRS Omnibus survey between March 22, 2017 and May 28, 2017 (N=14,275) and weighting this sample to match the national adult population based on the 2016 U.S. Census Current Population Survey March Supplement parameters for age, gender, education, race/ethnicity, region, phone status, and population density. This sample was then filtered for respondents qualifying for as having experience with serious illness (N=2,479) and those who do not (11,796) and the weighted demographics of these groups were used as post-stratification weighting parameters for each group in the total sample (including age by gender, education, race/ethnicity, region, population density, marital status, phone status, and serious illness status (personally seriously ill, living family member, deceased family member, or no recent experience with serious illness). In the final weighting stage, each group (those with experience with serious illness and all others) was weighted to reflect its actual share in the U.S. adult population. All statistical tests of significance account for the effect of weighting.
The margin of sampling error including the design effect for the full sample is plus or minus 3 percentage points. Numbers of respondents and margins of sampling error for key subgroups are shown in the table below. For results based on other subgroups, the margin of sampling error may be higher. Sample sizes and margins of sampling error for other subgroups are available by request. Note that sampling error is only one of many potential sources of error in this or any other public opinion poll. Kaiser Family Foundation public opinion and survey research is a charter member of the Transparency Initiative of the American Association for Public Opinion Research.
Group
N
Margin of Sampling Error
Total
2040
±3 percentage points
Age
18-29
261
±7 percentage points
30-49
407
±6 percentage points
50-64
663
±5 percentage points
65 or older
706
±5 percentage points
Race/Ethnicity
White
1140
±3 percentage points
Black
387
±9 percentage points
Hispanic
401
±9 percentage points
Serious Illness
Recent experience with serious illness (NET)
998
±4 percentage points
Personally seriously ill and age 65 or older
183
±11 percentage points
Family members of adults 65 or older with serious illness
815
±5 percentage points
The full poll results are representative of the U.S. adult population, including people of all races. The reported results focus on the total sample, reflective of all adult people in the U.S., as well as people who are white, black, and Hispanic. While the responses for some smaller groups of the U.S. population, for example, Asian-Americans and people of mixed race, are counted in the “total” poll responses, because adults in this poll were sampled randomly, the number of respondents who identify as Asian or as mixed race was too small to report separately, since the margin of sampling error around any poll result would be so large that the result would be unreliable and potentially misleading.
This questionnaire was administered with the exact questions in the exact order as appears in the Topline and Methodology. For the questions about a person’s experience with serious illness, those personally seriously ill or those with living family members with serious illness were asked questions in the present tense. Those family members whose seriously ill loved one is deceased were asked questions in the past tense. In addition, those personally seriously ill were asked directly about their experience, while family members were asked to answer most questions about their loved one’s experience being seriously ill.
Focus Group Methodology
As part of this project, the Kaiser Family Foundation conducted focus groups to learn more about those living with serious illness from their family members, including their experiences with treatment, access to services, and planning for care and support. The groups were conducted in Kansas City, MO on February 28, 2017 and Chattanooga, TN on March 23, 2017. Two two-hour groups were conducted in English in each location for a total of four groups with 9 participants each.
In Kansas City, Q & A Research recruited and hosted the groups. In Chattanooga, Wilkins Research Services recruited and hosted the groups. The screener questionnaire and discussion guides were developed by researchers at the Kaiser Family Foundation. Groups were audio and video recorded with respondents’ permission. This work was paid for by the Gordon and Betty Moore Foundation.
To qualify for the group, individuals must have said they have a family member who:
is 65 or older
because of a health or memory problem, has difficulty completing basic activities like shopping, preparing meals, taking medication, getting across a room, dressing, bathing, or using the toilet.
is receiving medical treatment for at least one of the following conditions: cancer (not including skin cancer), Alzheimer’s disease, dementia, or memory loss, diabetes or high blood sugar, asthma, lung disease, or emphysema, heart disease or stroke, depression, anxiety or other mental health problems, or chronic kidney disease or kidney failure.
is currently living through or recently deceased after a period of illness.
In each location, one group was conducted with family members whose loved one was still living and one group was conducted with family members whose loved one is deceased. Each participant was given $100 after participating.
There are a number of challenges in getting people who are personally seriously ill to take a telephone survey, so while this survey is nationally representative overall, it represents those who are non-institutionalized, well enough to answer the phone, and mentally competent. ↩︎
While black, Hispanic, and white adults are analyzed separately, it is important to note that the survey includes people of other racial and ethnic groups as well. However, due to the relatively small proportion of the population of these other groups (for example, Asians), it is not possible to analyze their responses separately. ↩︎
Note, because the sample design includes an oversample of adults with experience with serious illness, including blacks and Hispanics with this type of experience, the margin of sampling error is particularly high for blacks and Hispanics age 65 or older. ↩︎
Premiums will rise substantially in 2018 Affordable Care Act marketplace plans for states using HealthCare.gov, but in many cases, people receiving premium tax credits will pay less than they did in 2017, a new Kaiser Family Foundation analysis finds.
The new analysis includes county-level interactive maps charting premium changes of lowest-cost gold, silver, and bronze plans for consumers with and without premium tax credits in the 2018 HealthCare.gov marketplaces.
For people not eligible for tax credits that defray the cost of premiums, the weighted national average change for the three types of plans in HealthCare.gov marketplaces was 17 percent for lowest-cost bronze plans, 35 percent for lowest-cost silver plans, and 19 percent for lowest-cost gold plans, according to the analysis.
However, in many cases, lower-income consumers receiving premium tax credits will pay less for premiums in 2018 than in 2017, the analysis finds, because their tax credits will rise dollar-for-dollar with benchmark silver premiums. Premiums for silver plans increased much more than those for bronze or gold plans in 2018 because in many states insurers loaded the cost from the termination of the cost-sharing reduction payments entirely on the silver tier.
The change for the average premium for a 40-year-old person making up to $40,000 who is eligible for premium tax credits ranges from a 75 percent decrease to no change for the lowest-cost gold, silver, and bronze plans, the analysis finds.
The new maps chart premium changes for a 40-year-old individual paying the full premium and for a 40-year-old individual eligible for tax credits, with an income of $25,000, $30,000, $35,000 and $40,000.
The maps show:
Premium changes of lowest-cost gold, silver, and bronze plans in each county in states using HealthCare.gov.
Counties where the premium tax credit would cover the full premium for the lowest-cost bronze plan in 2018.
Counties where the premium for the lowest-cost gold plan is less than or comparable to the unsubsidized premium for the lowest-cost silver plan.
The analysis finds that for a 40-year-old person eligible for a tax credit, the tax credit would cover the full premium of the lowest-cost bronze plan in between 99 and 1,540 counties, depending on the person’s income.
2017 marks the 30th anniversary of the passage of the Nursing Home Reform Act as part of the Omnibus Budget Reconciliation Act of 1987, the federal legislation that substantially strengthened federal standards, inspections and enforcement of nursing home quality. The Act also merged Medicare and Medicaid standards, required comprehensive assessments of residents, set minimal requirements for licensed nursing staff, and required inspections to focus on outcomes of care.1 While progress has been made, care quality issues in nursing homes and residential care facilities2 (also called assisted living) continue to be highlighted frequently in the press3 and by numerous government reports4 and research studies5 (see Appendix Table 1). Recurring concerns include staffing levels, abuse and neglect, unmet resident needs, quality problems, worker training and competency, and lack of integration with medical care. The last several decades also have seen a shift to home care and other community-based services, with few quality measures for these settings available and little empirical evidence available.
This issue brief discusses four key issues related to long-term services and supports (LTSS) including institutional and home and community-based services (HCBS) quality, highlighting major legislative and policy changes over the last 30 years. The Appendix Tables provide data about LTSS providers and consumers, summarize key federal laws and policies related to quality, and list selected federal quality measures.
1. How is long-term services and supports quality regulated?
Federal quality standards exist for nursing homes, home health agencies and hospices, while states are responsible for regulating residential care, personal care, and other home and community-based services (Table 1). State health and social services agencies are primarily responsible for conducting the inspections and other monitoring of LTSS quality (with Centers for Medicare & Medicaid (CMS) oversight where there are federal standards).Regular surveys are required more often (every nine to 15 months) for nursing homes, and less often (every three years) for hospices and home health agencies. Inspections also are conducted in response to complaints. Survey frequency for residential care, personal care and other home and community-based services (HCBS) providers varies by state, but is typically far less frequent than for nursing homes.
In addition, some federal quality measures exist for nursing homes, hospices, and home health agencies based on participant assessment data; comparable data does not exist for residential care facilities, personal care services and other HCBS. For example, many federal nursing home quality measures are based on the CMS Minimum Data Set (MDS), which contains data on comprehensive resident needs assessments reported quarterly.6 (See the Appendix for a detailed list of quality measures by service setting.)
CMS makes some quality survey information publicly available for nursing homes, hospices, and home health agencies, while dissemination of inspection data for most HCBS varies by state, but is rare. Detailed inspection data and penalties for violations for individual nursing homes are reported on CMS’s Nursing Home Compare website.7Nursing homes also receive an overall quality rating using CMS’s Five Star Rating System, based on the annual on-site inspection and complaint investigation data provided by state agencies; facility-reported nurse staffing hours per resident day; and quality measures based on MDS resident data.8 In addition, some states have their own systems for issuing state deficiencies and fines,9 which are not included on the CMS website. CMS began posting quality measure scores for Medicare-certified hospices in 2017,10 but star ratings are not provided and federal inspection quality deficiencies are not publicly reported.11Federal quality deficiencies, complaints, and intermediate sanctions are not reported on the CMS Home Health Compare website, which focuses on quality measures based on the Outcome and Assessment Information Set (OASIS) assessment instrument and star ratings.12
Table 1: Long-term services and supports Quality Monitoring by Provider Type
Provider Type
Survey Entity
Frequency
Dominant Standards
Public Reporting
Nursing homes
State agencies under contract with CMS
Every 9 to 15 months
Medicare and Medicaid conditions of participation
CMS Nursing Home Compare/ Five Star Rating System
Hospices
State agencies under contract with CMS
Every 3 years
Medicare and Medicaid conditions of participation
CMS Hospice Compare
Home health agencies
State agencies under contract with CMS or private accrediting agencies
Every 3 years
Medicare and Medicaid conditions of participation
CMS Home Health Compare/Five Star Rating System
Residential care facilities
State agencies
Varies by state
State licensure and Medicaid requirements
Varies by state
Personal care and other HCBS providers
State agencies
Varies by state
State licensure and Medicaid requirements
Varies by state
The Older Americans Act’s (OAA) state long-term services and supports ombudsman program works to resolve problems for residents in nursing homes and residential care facilities. New 2016 OAA amendments clarified that the program serves all long-term services and supports residents regardless of their age and includes residents transitioning to a home-care setting, residents unable to communicate their wishes or without an authorized representative, and residents and family councils. 13
2. What is the state of long-term services and supports quality today?
Nursing Homes
Most nursing home quality measures have improved over time (Figure 1). Between 2011 and 2016, the use of physical restraints declined from 2.5% to 0.6%, and pressure ulcers among high risk residents declined from 7.3% to 5.7%. Other measures, including the proportion of residents with activities of daily living that got worse, antipsychotic use, pain, and urinary tract infections, also showed improvements (by declining) over that period. Evidence suggests that these self-reported scores may be inflated by the nursing homes.14 In 2016, CMS added new quality measures from Medicare claims data that should be more accurate.15
Figure 1: Nursing Home Quality Measures 2011-2016
Many nursing homes, however, continue to fail to meet all federal quality standards, with about 93% receiving at least one inspection deficiency citation in 2015, about the same as in 2005.16 Deficiencies are issued for violations of federal regulations in annual surveys and complaint investigations. The 15,583 nursing homes in the U.S. received 134,014 deficiencies, an average of 8.6 per facility, in 2015. This average rate is similar to that in 2005 and 2010.17 A 2014 US Office of Inspector General (OIG) report found that 33% of Medicare residents experienced adverse events or harm during their post-acute skilled nursing stays. Almost 60% of residents with adverse events had substandard treatment, inadequate monitoring, or failures and delays in treatment that resulted in harm, jeopardy, or hospital readmissions that cost about $2.8 billion.18 Another OIG study of nursing homes found that 25% of Medicare residents were readmitted to the hospital in 2011, at a cost of $14 billion; many readmissions were for potentially avoidable conditions.19
More than one in five (21%) nursing homes received deficiencies for serious quality violations in 2015, although this percent has declined over time (Figure 2). These deficiencies include causing harm or jeopardy, or the potential for harm or jeopardy, to residents and are based on state surveyor ratings of scope and severity.2021 Between 2014 and 2016, serious quality violations resulted in 6,817 intermediate sanctions (penalties short of terminating participation in Medicare and Medicaid) against nursing homes, including $135.9 million in civil monetary penalties and denial of 44,113 Medicare/Medicaid payment days.22
Figure 2: Percent of Facilities Receiving a Deficiency for Potential or Actual Harm or Jeopardy of Residents During Annual Compliant Surveys
Nursing homes with high concentrations of minority residents tend to have more quality problems.23 More than a decade ago, researchers found that nursing homes with a higher percentage of black residents than white residents are located in the poorest counties and have fewer nurses, lower occupancy rates, and more quality deficiencies, compared to nursing homes with a higher percentage of white residents.24 These disparities have continued over time in nursing homes with high concentrations of minority residents.25
Non-profit nursing homes tend to have higher care quality than for-profit nursing homes. On average, non-profit facilities offer higher staffing ratios and higher quality care, compared to for-profit nursing homes, which spend less on labor and offer lower staffing ratios.26 The largest for-profit nursing home chains have the highest acuity residents, the lowest nurse staffing hours, and poorer quality measure scores compared with non-profit and government nursing homes.27 Non-profit nursing homes also have fewer 30-day hospital readmissions and greater improvement in resident mobility, pain, and functioning, compared to for-profit nursing homes.28
Higher nurse staffing levels generally are associated with better nursing home care quality. Reported registered nurse staffing and total staffing levels have steadily increased (from a total of 3.3 hours per resident day in 1995 to 4.1 hours per resident day in 2014).29 In spite of increases, a recent study documented that half of nursing homes have low staffing (3.53 hours per resident day or less), and at least a quarter have very low staffing (3.18 hours per resident day or less) compared to the minimum recommended levels of 4.1 hours per resident day.30 Over the past 25 years, more than 150 research studies have examined the effect of nurse staffing levels, particularly registered nurse staffing, on care outcomes, with most finding positive effects with higher staffing levels31 and improved quality outcomes in states with higher minimum staffing requirements.32The benefits of higher staffing levels, especially of registered nurses, include lower mortality rates; improved physical functioning; less antibiotic use; fewer pressure ulcers, catheterized residents, and urinary tract infections; lower hospitalization rates; and less weight loss and dehydration.33 In addition to staffing levels, nursing staff training and competency have been identified as critical factors in ensuring high care quality.34
Federal nursing home staffing requirements have not changed since 1987,35 although research and experts support higher mandatory minimum staffing standards.36 Under the Nursing Home Reform Act, providers must have “sufficient staff” to meet resident needs with at least one registered nurse on the day shift and one licensed vocational or practical nurse on the evening and night shifts. A 2001 CMS study established the importance of having a total of 4.1 nursing hours per resident day, comprised of 1 .3 hours per resident day of licensed nursing care (including 0.75 registered nurse hours per resident day) and 2.8 certified nursing assistant hours per resident day, to prevent harm or jeopardy to residents.37 The effectiveness of these recommended thresholds was confirmed in an observational study38 and in a reanalysis by Abt Associates.39 A recent simulation study recommended a higher level of certified nursing assistant staffing, ranging from 2.8 to 3.6 hours per resident day depending on resident characteristics, to provide basic care to residents.40
Payroll reporting of staffing data may improve accuracy and monitoring of quality. A 2001 CMS study of nursing home staffing, which can affect care quality, found accuracy problems with self-reported unaudited data and recommended collecting data from payroll records.41 Mandatory electronic submission of nursing home staffing data based on payroll and other auditable records, as required by the Affordable Care Act,42 began on July 1, 2016, and CMS expects to add this information to Nursing Home Compare in 2018.43
Hospices
While federal quality standards exist, little is known about hospice care quality at least in part because federal surveys have been infrequent and quality reporting programs are new. Until passage of the federal IMPACT Act required surveys every three years, hospices were only surveyed every eight years. CMS has not made survey findings publicly available.44 The new hospice quality measures focus on: obtaining patient treatment preference information and managing pain and symptoms. Hospices have submitted patient admission and discharge data since 2014, and public reporting of quality measures on the CMS Hospice Compare began in August 2017.45 Six of the seven 2017 hospice measures show relatively little variation with average performance scores at 90 percent or higher. The pain assessment measure is an exception where only 78 percent of hospice patients received a comprehensive assessment within a day of experiencing pain.46 Because 6 percent of patients did not receive a visit in the last three days of life, CMS is developing new quality measures that focus on visits at the time or near the time of death.47 Concerned about the high number of voluntary discharges from hospice initiated by patients/families, CMS and RTI International are developing measures of potentially avoidable transitions and access to levels of hospice care.48 Similar to the racial disparities in care quality among nursing homes noted above, two studies found that hospices caring for more minority patients had significantly lower quality measure scores than those with smaller shares of minority patients even though minority hospice patients received similar care within the same hospice.49
Home Health Agencies
Home health quality measures generally have improved over time (Figure 3). Between 2004 and 2016, the percent of Medicare beneficiaries who were admitted to the hospital declined from 28% to 16%.50 During this same period, home health agencies reported more patients with less pain (60% in 2004 vs. 72% in 2016) and who were better at taking medications (38% vs. 57%) and at walking and moving (37% vs. 68%).51 The self-reported quality measures, however, may be inaccurate or inflated. CMS added new measures from claims data on hospital admissions and emergency room use to Home Health Compare in 2016.52 Data on federal deficiencies and sanctions of home health agencies from surveys are not made available by CMS as part of Home Health Compare.53
Figure 3: Changes in Home Health Quality Measures
Most national scores in the Home Health Consumer Assessment of Healthcare Providers and Systems (HHCAHPS) survey average around 80%. The average national HHCAHPS scores in 2016 ranged from 83-88% on four items: how often the home health team provided care in a professional way; how well the team communicated; whether the team discussed medicines, pain, and home safety; and patient rating of overall care. A slightly smaller share, 78%, reported that they would recommend the home health agency to friends and family.54
Although relatively little research has been conducted, home health agency quality appears to vary by ownership type. One recent study found that for-profit home health agencies have significantly lower overall quality measures than nonprofit agencies. 55 When risk-adjusted, non-profit agencies scored higher on care processes (e.g. team began care in a timely manner), care improvement (e.g. patients had less pain), hospitalization avoidance, and bedsore avoidance. For-profit agencies provided more visits and had more than double the profit margins compared to non-profits.56 Another study found that non-profit agencies were more likely to discharge patients within 30 days and appeared to be more efficient than for-profit agencies.57
Residential Care Facilities
Because quality standards vary by state and few data are publicly reported, little is known about residential care facility quality nationwide.58 Some states have their own searchable websites with quality information about residential care facilities.59 While not a survey of care quality, the 2010 National Survey of Residential Care Facilities identified some issues that may indicate quality problems. For example, during the course of a year, 15% of residents fell and sustained a hip fracture or other injury. 60 Among the 52% of residents who have cognitive impairment or dementia and behavioral symptoms, 61% had been prescribed medications to help control behavior or to reduce agitation. In addition, only half of residents left the facility grounds at least twice per month, even though residential care facilities are supposed to be community facilities.61 Available data about facility staff to resident ratios also raises questions about care quality. Larger facilities and chain facilities are more likely to have lower direct care staffing ratios than smaller facilities.62 Only 17% of residential care facilities reported having registered, licensed practical, or vocational nurses on staff.63 Residential care facilities are not required to provide licensed nursing on a 24-hour basis, even though there is evidence that many residents in some facilities are frail, with many chronic illnesses, impaired self-care and cognition, and unmet care needs.64
Personal Care Services and Other Home and Community-Based Services (HCBS)
Little is known about personal care and other HCBS quality because these services are regulated by the states and little data are collected and reported. Generally, consumers who use personal care services and those who have family members as care providers report high satisfaction.65 In 2014, CMS strengthened its quality requirements and reporting for the Medicaid HCBS waiver program in 14 areas (including administration, financial integrity, levels of care and provider qualifications and service planning and delivery).66 In addition, states must identify, address and seek to prevent instances of abuse, neglect, exploitation and unexplained death and must have an incident management system to effectively resolve and prevent incidents.67These regulations also define what constitutes a setting that qualifies for Medicaid HCBS payments.68 A recent National Quality Forum report noted a: lack of standardized; limited access to timely HCBS program data: and variability in services (ranging from personal assistance to more skilled care) across the large number of programs, settings, and governmental jurisdictions and wide range of populations (including seniors, nonelderly adults, and children with a range of physical, developmental, and other disabilities).69 In spite of these challenges, a set of standardized core indicators were developed for states to voluntarily survey individuals who are aged and disabled across programs and some states conducted surveys in 2015 and 2016.70
3. What is not known about long-term services and supports quality?
Few federal measures assess quality of life in institutions and the home and community. Quality of life in nursing homes has long been a major concern. While federal regulations include resident rights, quality of life violations are often over shadowed (and not given sanctions) by the quality of care problems (e.g. safety and pressure ulcers) facing residents.71 Efforts to reimagine livable environments, services and quality of life are lacking. At home and in the community, quality of life is an important area to measure, although often a more complex inquiry than long-term services and supports, requiring new measures such as the number of individuals and the amount of spending in institutional vs. community settings.72 The degree of integration, independence and community access available to beneficiaries in different settings in the community are important measures. Measures could assess not only whether individuals are served in the community but also whether they are in the setting that affords them the fullest extent of community integration and independence, such as measures related to social activity and engagement.73
Quality data are unavailable at the provider chain or corporate owner level. With the wide variation in quality by nursing home ownership type and the growth of large chains with increasingly complex ownership structures, public interest in nursing home ownership transparency is growing. 74 While CMS recently began reporting some nursing home ownership data on Nursing Home Compare, quality data are not reported by nursing home chain and corporate owner, and details about parent, management, property, and other related companies are unavailable.75 Moreover, many home health agencies and hospices are part of large chains, and data on ownership and quality are not available by owner.76
Many HCBS quality measures are still being developed and lack standardization. Despite the general confidence that the quality of HCBS is good, few states have meaningful quality measures and data collection on provider performance to validate that belief. Many different organizations are using or testing a variety of questionnaires to measure HCBS quality.77 Although states are developing many new innovative long-term services and supports programs, standard HCBS quality measures have not been developed to allow comparisons across providers.78 A recent National Quality Forum report recommended developing and implementing a standardized approach to data collection, storage, analysis and reporting and developing a core set of standard HCBS measures with supplemental measures for different populations, settings and programs.79
The shift to capitated managed care delivery systems for Medicaid long-term services and supports services and supports80 creates both benefits and risks for service quality. In 2016, 721,000 individuals participated in the Medicare-Medicaid financial alignment initiative to integrate long-term services and supports with physical and behavioral health services, and many more are enrolled in Medicaid-only managed LTSS programs.81 Delivery systems that integrate physical, behavioral health, institutional, and community-based long-term services and supports offer the potential to improve quality through more holistic approaches to consumer needs and greater attention to the interaction between acute and long-term services and supports. Managed care delivery systems also raise the potential for adverse effects on care adequacy and quality if capitated payments incentivize health plans to limit spending by restricting services, reducing provider payments, or limiting provider networks.82
Without public reporting, the quality of LTSS provided in managed care organizations is unknown. Medicaid managed care regulations that for the first time address long-term services and supports services may promote the development of quality measures for HCBS. Effective for health plan contracts beginning on or after July 1, 2017, states must identify standard quality measures for Medicaid managed long-term services and supports health plans related to quality of life, rebalancing from institutional services to HCBS, and community integration.83 Because measures will be established by states, the potential for state variation will limit the ability to compare quality across states. Another unknown is whether managed care organizations will select networks of nursing homes, home health, hospice and HCBS providers on the basis of quality indicators rather than on the basis of location, costs or other factors.
4. What are the current challenges in long-term services and supports quality oversight?
Opportunities to improve quality oversight and enforcement of regulations by state and federal agencies have been identified. Since 1988, numerous investigations by the U.S. Government Accountability Office (GAO) have found that nursing home violations are under-identified, and serious violations are under-rated in terms of their scope and severity by state surveyors.84 The Office of the Inspector General (OIG) identified preventable quality problems as partly attributed to inadequate oversight by CMS and the failure of state survey agencies to enforce regulations.85 Consumer advocacy organizations also have voiced concerns that CMS has not focused sufficient efforts on survey and enforcement activities.86 CMS recently updated the nursing home conditions of participation and established a new process designed to address the well-documented variation in nursing home survey and enforcement activities across states.87 In addition, oversight of residential care facilities continues to be a concern in some states as problems of poor quality have persisted.88 Federal enforcement efforts for home health and hospice have been limited to date because of infrequent surveys and limited sanctions for violations. Little is known about state quality oversight of HCBS, and there is a concern that states may lack resources for inspection and enforcement.
Incidents of potential abuse and neglect of nursing home residents are not always reported to appropriate law enforcement and regulatory authorities.89 A new OIG report found that more than a quarter of incidents of possible abuse or neglect against nursing home residents go unreported to authorities despite the current mandatory reporting law. State survey agencies only substantiated 7 of 134 incidents of nursing home abuse or neglect in reports.90 This may also occur with other providers as well.
Complaints are not always investigated in a timely manner and are often not substantiated. Some state survey agencies do not meet CMS’s requirements for timely nursing home complaint investigations. These findings prompted the Government Accountability Office to recommend stronger federal guidance and oversight of the complaint investigation process.91 State complaint investigations for other providers may be even more limited, but no data are available.
Fines and other penalties for quality violations are rarely imposed, weakening enforcement. When nursing homes are found to have serious violations that caused harm or jeopardy including deaths, they often do not receive penalties or the penalties are so minimal that the enforcement does not result in compliance.92 Similarly, nursing homes operating with low staffing levels are rarely given deficiencies or penalties for inadequate staffing.93 In addition, nursing homes are seldom terminated from the Medicare and Medicaid programs as a result of quality violations.94 In response to complaints by the nursing home association, new 2017 CMS policies on penalties direct survey agencies to use per-instance penalties for problems that existed prior to a survey, except for serious injury or abuse, and per-day penalties for issues found during surveys and beyond. Consumer advocates argue this will make fines lower and less frequent.95 Since survey and enforcement information are not available for home health and hospice, it is unknown whether penalties have been imposed.
Binding arbitration agreements may be allowed. New 2016 CMS regulations eliminated arbitration agreements in nursing homes because of concern that it was difficult for residents and their decision-makers to give informed and voluntary consent.96 In 2017, CMS responded to nursing home provider complaints by proposing regulations to remove the prohibition against binding arbitration agreements in nursing home admission contracts, a move strongly opposed by advocacy organizations.97 It is not known whether such agreements are used by home health, hospice, and residential care providers.
Quality report card data are not adequately used by hospitals, health plans and consumers. After establishment of the CMS Nursing Home Compare rating system in 2008, nursing homes improved their scores on certain quality measures and consumer demand significantly increased for the best (5-star) facilities and decreased for 1-star facilities.98A clinical trial of the use of a personalized version of Nursing Home Compare in the hospital discharge planning process found: greater patient satisfaction, patients being more likely to go to higher ranked nursing homes, patients traveling further to nursing homes, and patients having shorter hospital stays compared to the control group.99 In spite of the benefits of using report cards, a recent study found that most hospital patients receive only lists of nursing homes and do not receive data about nursing home quality. Patients’ choices were rarely based on quality data.100 Because discharge planners are not using CMS report cards for nursing home, it is doubtful that they are doing so when referring patients to home health or hospice. Report cards are lacking for residential care facilities and other types of HCBS.
Self-reported data by service providers raise questions about accuracy and may lead to under-reporting of indicators of poor quality. Nursing homes, hospices, and home health agencies have an incentive to under-report indicators of poor quality in order to receive higher quality ratings on the CMS Five-Star Quality Rating Systems to avoid scrutiny from surveyors.101 To address the potential for inflation in self-reported quality measure scores, CMS developed procedures for sample auditing of the accuracy of MDS nursing home data and associated quality measures.102 Similar concerns are associated with unaudited self-reported data by hospices and home health agencies as well as the data regarding ownership information and Medicare cost reports103 for nursing homes.104 Explicit reporting of costs, administrative costs, and profits by LTSS providers could be a useful addition to consumer report cards.105
Information about HCBS quality is lacking. As noted above, while government policy is vigorously moving to rebalance the delivery system away from institutions and toward HCBS, little data are available about the quality of residential care facilities, personal care, adult day health centers, or other types of HCBS. Quality measures need to be developed, and states would have to invest in inspections, surveys and other data collection in order to monitor the quality of services provided.
Looking Ahead
The 30th anniversary of the passage of the Nursing Home Reform Act provides an opportunity to reflect on accomplishments, challenges and future directions. Overall, there have been improvements in LTSS quality, although serious problems that jeopardize the health and safety of consumers continue to occur. Enforcement of existing regulations is an on-going concern for nursing homes, home health, and hospice, while states also face challenges to devote adequate resources to ensure quality in residential care and HCBS. Quality data that are self-reported by providers raise issues about how to ensure accuracy and reliability of information. Although important progress has been made in developing LTSS quality measures and public reporting, questions remain as to whether the information is being used sufficiently by hospitals and health plans as well as by consumers.
Federal legislation and regulatory standards for nursing homes are well-developed, and there have been improvements in nursing home quality over time. Nonetheless, more than 20% of nursing homes are cited for serious quality problems, and reports show that quality problems are under-reported because of a chronically weak survey and enforcement system. The quality problems created by low nurse staffing levels in many nursing homes are well documented. Disparities in care quality are associated with resident race/ethnicity, for-profit/non-profit status, and staffing levels. Problems with poor quality of care and quality of life in nursing homes may lead consumers to favor the use of home and community based services.
The quality of care in home health agencies has also improved, although about a quarter of Medicare patients would not recommend the agency that they used. Public reporting of quality measures for hospices is just starting. Even less is known about the quality of residential care, personal care, and other HCBS due to lack of inspections, quality measures, variation in oversight by states, and limited public reporting. Little is known about the impact of Medicaid managed LTSS programs and other integrated care systems on quality of LTSS.
Looking ahead, policymakers, researchers, consumers, and other stakeholders have identified opportunities to improve quality measures and monitoring processes for LTSS. New ways to facilitate comparisons across providers, programs and states and to increase the public dissemination of findings could assist stakeholders in better understanding LTSS quality.
Appendices
Appendix Table 1: GAO Reports on Nursing Home Quality
U.S. Government Accountability Office (US GAO). (2016). Nursing Homes: consumers could benefit from improvements to the nursing home compare website and five-star quality rating system. GAO-17-610. Washington, DC, November.
U.S. Government Accountability Office (US GAO). (2016). Skilled nursing facilities: CMS should improve accessibility and reliability of expenditure data. GAO-16-700. Washington, DC, September.
U.S. Government Accountability Office (US GAO). (2011). Nursing homes: More reliable data and consistent guidance would improve CMS oversight of state complaints investigations. GAO-11-280. Washington, DC, April.
U.S. Government Accountability Office (US GAO). (2010). Nursing homes: Complexity of private investment purchases demonstrates need for CMS to improve the usability and completeness of ownership data. GAO-10-710. Washington, DC.
U.S. Government Accountability Office (US GAO). (2009). Nursing homes: Addressing the factors underlying understatement of serious care problems requires sustained CMS and state commitment. GAO-10-70. Washington, DC.
U.S. Government Accountability Office (US GAO). (2009). Medicare and Medicaid participating facilities: CMS needs to reexamine state oversight of health care facilities. GAO-09-64, Washington, DC, February 13, 2009.
U.S. Government Accountability Office (US GAO). (2009). CMS’s special focus facility methodology should better target the most poorly performing homes, which tended to be chain affiliated and for-profit. GAO-09-689. Washington, DC, August, 2009
U.S. Government Accountability Office (US GAO). (2008). Medicaid home and community-based waivers: CMS should encourage states to conduct mortality reviews for individuals with developmental disabilities. GAO-08-529. Washington, DC, May 23.
U.S. Government Accountability Office (US GAO). (2008). Nursing homes: Federal monitoring surveys demonstrate continued understatement of serious care problems and CMS oversight weakness. GAO-08-517, Washington, DC, May 9, 2008.
U.S. Government Accountability Office (US GAO). (2007). Nursing home reform: Continued attention is needed to improve quality of care in small but significant share of homes. GAO-07-794T, Washington, DC, May 2, 2007.
U.S. General Accounting Office. (US GAO). (2004). Assisted Living: Examples of State Efforts to Implement Consumer Protections. US GAO-04-684. Washington, DC.
U.S. General Accounting Office. (US GAO). (2004). Nursing home fire safety: Recent fires highlight weaknesses in federal standards and oversight. US GAO-04-660. Washington, DC.
U.S. General Accounting Office (GAO). (2003). Nursing home quality: Prevalence of serious problems, while declining, reinforces importance of enhanced oversight. Report to Congressional Requesters. GAO-03-561. Washington, DC.
U.S. General Accounting Office (GAO). (2002). Nursing homes: Quality of care more related to staffing than spending. Report to Congressional Requestors. GAO/HEHS-02-431R. Washington, DC.
U.S. General Accounting Office (GAO). (1999). Nursing homes: additional steps needed to strengthen enforcement of federal quality standards. Report to the Special Committee on Aging, U.S. Senate. GAO/HEHS-99-46. Washington, DC.
U.S. General Accounting Office (GAO). (1999). Nursing homes: Complaint investigation processes often inadequate to protect residents. Report to Congressional Committees. GAO/HEHS-99-80. Washington, DC.
U.S. General Accounting Office (GAO). (1999). Assisted living: Quality of care and consumer protection issues. GAO/T-HEHS-99-111. April 26. Washington, DC.
Appendix Table 2: Long-term services and supports Providers, 2014
Provider type
Number of Providers
Ownership Type (%)
Chain-Affiliated (%)
Medicare and Medicaid Certification
For-Profit
Non-Profit
Government
Nursing homes
15,640
70
24
6
56
97% Medicare, 95% Medicaid
Hospices
4,000
60
26
14
NA
93% Medicare, NA Medicaid
Residential Care Facilities
30,200
82
17
1
56
0% Medicare,
47% Medicaid
Home Health Agencies
12,400
80
15
5
NA
99% Medicare, 78% Medicaid
Personal Care and Other HCBS
N/A
N/A
N/A
N/A
N/A
N/A
NOTE: N/A=Not Available SOURCE: Centers for Disease Control and Prevention (CDC), National Center for Health Statistics, US Department of Health and Human Services (2016). Long-term services and supports providers and services users in the United States: Data from the national study of long-term services and supports providers, 2013-2014. Vital and Health Statistics. 3 (38). Hyattsville, M.D. https://www.cdc.gov/nchs/data/series/sr_03/sr03_038.pdf; National Hospice and Palliative Care Organization (2015). NHPCO Facts and Figures: Hospice Care in America. www.nhpco.org/sites/default/files/public/Statistics_Research/2015_Facts_Figures.pdf
Appendix Table 3: Long-term services and supports Consumers, 2014
Provider type
Number of Consumers
Age
Race/Ethnicity
Medical/Functional Status
65 or Older
Under 65
White
Black, Hispanic, or Other
Nursing homes
1.38 million
85%
15%
76%
24%
50% have dementia; 88-97% need help with bathing, dressing or toileting
Hospices
1.3 million
94%
6%
84%
16%
Principal diagnosis: 37% cancer, 45% dementia; 36% have care in a private residence
Residential Care Facilities
835,200
93%
7%
84%
16%
40% have dementia; 39-62% need help with bathing, dressing or toileting
Home Health Agencies
4.93 million
82%
18%
75%
25%
31% have dementia; 73-97% need help with bathing, dressing or toileting
Appendix Table 4: Summary of Federal Long-term services and supports Quality Requirements
Law
Year
Major Provisions
Federal Statutes
Nursing Home Reform Act (part of Omnibus Budget Reconciliation Act of 1987)
1987
-Strengthened and aligned quality standards and processes governing nursing homes participating in Medicare and Medicaid
-Established more rigorous inspection procedures with required focus on care quality and intermediate sanctions for violations
-Mandated standardized Minimum Data Set, including periodic comprehensive needs assessments (at least annually) of nursing home residents for care planning
-Required nursing homes to provide sufficient nursing, medical and psychosocial services for residents to attain and maintain their highest possible physical and mental functional status
-Set minimum requirements for licensed nursing staff, including “sufficient staff” to meet resident needs and at least one RN on the day shift and one licensed vocational or practical nurse on the evening and night shifts.
-Focused on care outcomes (e.g., incontinence, immobility, pressure ulcers), protection of residents’ rights, and establishing quality of life standards
Affordable Care Act, including the Nursing Home Transparency and Improvement Act, the Elder Justice Act, and Patient Safety and Abuse Act
2010
-Required detailed nursing home ownership reports, Medicare cost reports, and staffing data from payroll records
-Reformed complaint reporting procedures
-Expanded CMS Nursing Home Compare website, quality assurance and improvement program, and staff criminal background checks
-Increased focus on quality improvement, complaint reporting, and elder abuse prevention
-Authorized federal quality reporting program for inpatient rehabilitation facilities, long term care hospitals, and hospices and a two-percentage point reduction in the annual payment update for failure to comply
-Allowed voluntary expansion of state home and community based services
Protecting Access to Medicare Act
2014
-Established Medicare skilled nursing facility value-based purchasing methodology based on hospital readmissions (30-day all cause and 30-day potentially preventable)
-Quarterly reports posted on Nursing Home Compare as of October, 2017
-Final payment incentive implementation beginning in 2019
Improving Medicare Post-Acute Care Transformation (IMPACT) Act
2014
-Standardized assessment data submission and quality measures across long-term services and supports hospitals, skilled nursing facilities, home health agencies, and inpatient rehabilitation facilities
-Established payment rate penalties for failure to comply
-Requires surveys of all Medicare-participating hospices every three years.
Federal Quality Regulations
Nursing Homes Conditions of Participation
1991, 2016
-Details quality requirements for providers participating in Medicare and Medicaid under Nursing Home Reform Act
-Comprehensively revises to emphasis person-centered care, care quality, quality of life, facility assessment, and staff competency with three year phase-in; align with current federal initiatives regarding reducing unnecessary hospital readmissions, lowering rate of healthcare acquired infections, improving behavioral healthcare, and preventing unnecessary use of psychotropic medications; and implement ACA requirements for compliance and ethics program, quality assurance and performance improvement program, reports of suspected crimes, staff training on dementia and abuse, and improved discharge planning
Nursing Home Fire and Life Safety
2016
-Establishes requirements for certified nursing facilities
Hospice Conditions of Participation
2009
-Establishes the requirements for eligibility, benefits, patient care, organizational environment, covered services, payment and coinsurance
CMS Medicare and Medicaid Home Health Agency Conditions of Participation
2017, Delayed to 2018
-Expands patient rights and comprehensive patient assessments, integrates communication system between home health agency and patient’s physicians, requires data-driven, agency-wide quality assessment and performance improvement program, requires expanded patient care coordination, and simplifies the organizational structure
Medicaid Home and Community-Based Settings
2014
To receive payments for Medicaid home and community-based services, settings must comply with requirements that include, for example, person-centered planning, privacy, choice of roommate, access to food, and other issues related to autonomy and choice.
Sub-regulatory Guidance
CMS Long Term Care Facility State Operations Manual
2017
-Provides guidance to state surveyors to determine whether the 2016 conditions of participation are met
CMS Hospice Survey Manual
2015
Provides guidance to state surveyors to determine whether the conditions of participation are met
CMS Home Health Agency Survey Manual
2012
Provides guidance to state surveyors on the imposition of deficiencies and sanctions for violation of quality standards, including civil monetary penalties, directed in-service training, directed plan or correction, payment suspension, temporary management, and informal dispute resolution
CMS Home Health Agency Survey Manual
2015
Provides guidance to state surveyors to determine whether the conditions of participation are met
Appendix Table 5: CMS Nursing Home Compare Quality Measures as of 2017
Population
Measures
Short-stay residents (100 days or less)
Nine measures including the percent of residents with:
-moderate to severe pain*-pressure ulcers that are new or worsened*-seasonal influenza vaccine-pneumococcal vaccine-antipsychotic medication*-improvements in function*-any cause hospital readmission*-community discharge for 100 days without readmission*-outpatient emergency department visit *
Long-stay residents (101 days or more)
Fifteen measures including the percent of residents with:
-falls with a major injury*-urinary tract infections*-moderate to severe pain*-high risk residents with pressure ulcers*-loss of bowel or bladder control-use of a bladder catheter*-physical restraints*-need increased help with activities of daily living*-weight loss-depressive symptoms-antipsychotic medication*-seasonal influenza vaccine-pneumococcal vaccine-ability to move independently worsened*-antianxiety or hypnotic medication.
Provider performance on National Quality Forum endorsed measures:
-treatment preferences-beliefs and values addressed (if desired by patient)-pain screening-pain assessment-dyspnea screening-dyspnea assessment-patients treated with opioid who are given bowel regimen
Consumer Assessment of Healthcare Providers and Systems Hospice Survey
Reflects care experiences of informal caregivers (i.e., family and friends) of patients who died in hospice care
Consumer Assessment of Healthcare Providers and Systems Home Health Care Survey
-How often home health team provided care in a professional way-How well team communicated-Whether team discussed medicines, pain, and home safety-Patient rating of overall care-Whether patient would recommend agency to friends and family
SOURCE: Centers for Medicare & Medicaid Services. (2017). Medicare home health compare. http://www.medicare.gov/homehealthcompare/search.html; Home health consumer assessment of healthcare providers and systems (CAHPS) (2017). https://homehealthcahps.org/Default.aspx?tabid=88. *Measures are from the Outcomes and Assessment Information Set (OASIS), except for 2 claims data measures (clients who had to be readmitted to hospital or receive ER care after recent hospital stay).
Appendix Table 8: Medicaid Home and Community-Based Waiver Services Quality State Requirements
Regulations
Measures
CMS Medicaid Home and Community-Based Services Reporting Requirements (2014)
States must:
-develop and measure waiver performance in 14 areas, such as administration, financial integrity, level of care, provider qualifications, and service planning and delivery.-demonstrate on an ongoing basis that they identify, address, and seek to prevent instances of abuse, neglect, exploitation and unexplained death.-have an incident management system that effectively resolves incidents and prevents further similar incidents to the extent possible.-have policies and procedures for the use or prohibition of restrictive interventions (including restraints and seclusion).-establish and monitor health care standards for service providers.
Omnibus Budget Reconciliation Act of 1987 (OBRA, 1987). Public Law 100-203. Subtitle C: nursing home reform; Institute of Medicine [IOM], Committee to Study Nursing Home Regulation. (1986). Improving the quality of care in nursing homes. Washington, DC: National Academies Press. ↩︎
While assisted living is a common licensure term, states use a wide range of terms describing similar facilities such as residential care, board and care homes, adult care homes, domiciliary care homes, and personal care homes. Carder, P., O’Keeffe, J., & O’Keeffe, C. (2015). Compendium of Residential Care and Assisted Living Regulations and Policy: 2015 Edition. Research Triangle Park: RTI International. https://aspe.hhs.gov/sites/default/files/pdf/110391/15alcom.pdf. ↩︎
U.S. Office of the Inspector General (US OIG). (2017). Early alert: The Centers for Medicare & Medicaid Services has inadequate procedures to ensure that incidents of potential abuse or neglect at skilled nursing facilities are identified and reports in accordance with applicable requirements. A-01-17-00504, August. https://oig.hhs.gov/oas/reports/region1/11700504.asp; U.S. Office of the Inspector General (US OIG). (2014). Adverse events in skilled nursing facilities: National incidence among Medicare beneficiaries. OEI-06-11-00370. February. https://oig.hhs.gov/oei/reports/oei-06-11-00370.asp; U.S. Office of the Inspector General (US OIG). (2013). Medicare nursing home resident hospitalization rates merit additional monitoring. OEI-06-11-00040. November. https://oig.hhs.gov/oei/reports/oei-06-11-00040.pdf; U.S. Office of the Inspector General (US OIG). (2014). Nursing facilities’ compliance with federal regulations for reporting allegations of abuse or neglect. OEI-07-13-00010t August. https://oig.hhs.gov/oei/reports/oei-07-13-00010.pdf; Hawes, C., and Phillips, C.D. (2000). A national study of assisted living for the frail elderly: A final summary report: Washington, DC: US Department of Health and Human Services Office of the Assistant Secretary for Planning and Evaluation. http://aspe.hhs.gov/daltcp/reports/finales.htm. ↩︎
California Advocates for Nursing Home Reform (2013). Residential care in California: Unsafe, unregulated & unaccountable. San Francisco, CA: CANHR. http://www.canhr.org/reports/Residential_Care_in_California.pdf; Wiener, J.M., Freiman, M.P. and Brown, D. (2007). Nursing home quality: Twenty years after the Omnibus Budget Reconciliation Act of 1987. Report Prepared by RTI International. Washington, DC: The Henry J. Kaiser Family Foundation. ↩︎
Mukamel, D.B., Weimer, D.L., Harrington, C., Spector, W.D., Ladd, H., and Li, Y. (2012). The effect of state regulatory stringency on nursing home quality. Health Services Research, 47(5):1791-813. ↩︎
Centers for Medicare & Medicaid Services. (2017). Medicare home health compare. http://www.medicare.gov/homehealthcompare/search.html; https://www.cms.gov/Medicare/Quality-Initiatives-Patient-Assessment-Instruments/HomeHealthQualityInits/OASIS-Data-Sets.html ↩︎
Ibid.; Harrington, C., Carrillo, H., Dowdell, M. Tang, P.P. and Blank, B.W. (2011). Nursing facilities, staffing, residents and facility deficiencies, 2005 Through 2010. San Francisco, CA: University of California, Department of Social and Behavioral Sciences. http://theconsumervoice.org/uploads/files/issues/OSCAR-2011-final.pdf↩︎
U.S. Office of the Inspector General (US OIG). (2014). Adverse events in skilled nursing facilities: National incidence among Medicare beneficiaries. OEI-06-11-00370. February. Washington, DC: OIG; https://oig.hhs.gov/oei/reports/oei-06-11-00370.asp↩︎
U.S. Office of the Inspector General (US OIG). (2013). Medicare nursing home resident hospitalization rates merit additional monitoring. OEI-06-11-00040. November. https://oig.hhs.gov/oei/reports/oei-06-11-00040.pdf; Walsh, E. G., Wiener, J. M., Haber, S., Bragg, A., Freiman, M., & Ouslander, J. G. (2012). Potentially avoidable hospitalizations of dually eligible Medicare/Medicaid beneficiaries from nursing facility and home and community-based services waiver programs. Journal of the American Geriatric Society, 60(5), 821–829 ↩︎
Mor, V., Zinn, J, Angelelli, J., Teno, J.M., and Miller, S.C. (2004). Driven to tiers: socio-economic and racial disparities in the quality of nursing home care. Milbank Quarterly. 82 (2): 227-56. ↩︎
Li, Y., Harrington, C., Temkin-Greener, H., Cen, X., Cai, X., and Mukamel, D.B. (2015). Deficiencies in care at nursing homes and in racial/ethnic disparities across home fell, 2006-11. Health Affairs. 34(7): 1139-46; Li, Y., Harrington, C., Mukamel, D.B., Cen, X., Cai, X., and Temkin-Greener, H. (2015). Nurse staffing hours at nursing homes with high concentrations of minority residents, 2001-11. Health Affairs. 34(12): 2129-2137; Smith, D.B., Feng, Z., Fennell, M.L., Zinn, J.S., Mor, V. (2007). Separate and unequal: Racial segregation and disparities in quality across U.S. nursing homes. Health Affairs (Millwood). 26 (5): 1448-58. ↩︎
Comondore, V.R., P.J. Devereaux, Q. Zhou, S.B. Stone, et al., (2009). Quality of care in for-profit and not-for-profit nursing homes: Systematic review and meta-analysis. British Medical Journal, 339:b 2732; Hillmer, M.P., Wodchis, W.P., Gill, S.S., Anderson, G.M. and Rochon, P.A. (2005). Nursing home profit status and quality of care: Is there any evidence of an association? Medical Care Research and Review. 62 (2):139-166. ↩︎
Harrington, C., Olney, B, Carrillo, H., and Kang, T. 2012. Nurse staffing and deficiencies in the largest for-profit chains and chains owned by private equity companies. Health Services Research, 47 (1), Part I: 106-128; U.S. Government Accountability Office (US GAO). (2011). Private investment homes sometimes differed from others in deficiencies, staffing, and financial performance. GAO-11-571. http://www.gao.gov/products/GAO-11-571; U.S. Government Accountability Office (US GAO). (2009). CMS’s special focus facility methodology should better target the most poorly performing homes, which tended to be chain affiliated and for-profit. GAO-09-689. ↩︎
Grabowski, D.C., Feng, Z., Hirth, R., Rahman, M., and Mor, V. (2013). Effect of nursing home ownership on the quality of post-acute care: An instrumental variables approach. J. of Health Economics, 14; 32(1):12-21.
↩︎
Harrington, C., Carrillo, H., and Garfield, R. (2017). Nursing facilities, staffing, residents and facility deficiencies, 2010 through 2015. The Kaiser Commission on Medicaid and the Uninsured. August http://files.kff.org/attachment/REPORT-Nursing-Facilities-Staffing-Residents-and-Facility-Deficiencies-2009-2015; Harrington, C., Carrillo, H., Wellin, V., and Shemirani, B.B. (2002). Nursing facilities, staffing, residents and facility deficiencies, 1996 Through 2001. San Francisco, CA: University of California, Department of Social and Behavioral Sciences. ↩︎
Harrington, C., Schnelle, J.F., McGregor, M., and Simmons, S.F. (2016). The need for higher minimum staffing standards in U.S. nursing homes. Health Services Insights. 9: 13-19; Centers for Medicare & Medicaid Services (CMS). (2001). Appropriateness of minimum nurse staffing ratios in nursing homes. Report to Congress: Phase II Final. Volumes I to III. Baltimore: CMS (prepared by Abt Associates). ↩︎
Dellefield, M.E., Castle, N. G., McGilton, K.S., & Spilsbury, K. (2015). The relationship between registered nurses and nursing home quality: An integrative review (2008-2014). Nursing Economics, 33 (2):95-108 and 116; Castle, N. (2008). Nursing home caregiver staffing levels and quality of care: A literature review. Journal of Applied Gerontology, 27: 375-405; Bostick, J.E., Rantz, M.J., Flesner, M.K. and Riggs, C.J. (2006). Systematic review of studies of staffing and quality in nursing homes. J. American Medical Director Association, 7:366-376; Institute of Medicine (IOM), Committee on the Work Environment for Nurses and Patient Safety. (Page, A. [Ed.]). (2003). Keeping patients safe. Washington, DC: National Academies Press. ↩︎
Bowblis, J.R. (2011). Staffing ratios and quality: An analysis of minimum direct care staffing requirements for nursing homes. Health Services Research, 46(5): 1495-516; Harrington, C., Swan, J.H., and Carrillo, H. (2007). Nurse staffing levels and Medicaid reimbursement rates in nursing facilities. Health Services Research, 42: 1105-1129; Mueller, C., Arling, G., Kane, R., Bershadsky, J., Holland, D., & Joy, A. (2006). Nursing home staffing standards: Their relationship to nurse staffing levels. The Gerontologist, 46 (1):74-80; Park, J., & Stearns, S.C. (2009). Effects of state minimum staffing standards on nursing home staffing and quality of care. Health Services Research, 44(1), 56–78; Tong, P.K. (2011). The effects of California minimum nurse staffing laws on nurse labor and patient mortality in skilled nursing facilities. Health Economics, 20:802-816. ↩︎
Bostick, J.E., Rantz, M.J., Flesner, M.K. and Riggs, C.J. (2006). Systematic review of studies of staffing and quality in nursing homes. J. American Medical Director Association, 7:366-376; Castle, N. (2008). Nursing home caregiver staffing levels and quality of care: A literature review. Journal of Applied Gerontology, 27: 375-405; Dellefield, M.E., Castle, N.G., McGilton, K.S., & Spilsbury, K. (2015). The relationship between registered nurses and nursing home quality: An integrative review (2008-2014). Nursing Economics, 33 (2):95-108 and 116; Schnelle, J. F., Simmons, S. F., Harrington, C., Cadogan, M., Garcia, E. & Bates-Jensen, B. (2004). Relationship of nursing home staffing to quality of care? Health Services Research, 39(2), 225-250. ↩︎
Institute of Medicine (IOM), Committee on the Work Environment for Nurses and Patient Safety. (Page, A. [Ed.]). (2003). Keeping patients safe. Washington, DC: National Academies Press; Castle, N., & Engberg, J. (2008). Further examination of the influence of caregiver staffing levels on nursing home quality. Gerontologist, 48: 464-76. ↩︎
Omnibus Budget Reconciliation Act of 1987 (OBRA, 1987). Public Law 100-203. Subtitle C: nursing home reform, Washington, D.C., December 22, 1987. ↩︎
Harrington, C., Kovner, C., Kayser-Jones, J., Berger, S., Mohler, M., Burke R. et al. (2000). Experts recommend minimum nurse staffing standards for nursing facilities in the United States. The Gerontologist, 40 (1):1-12; Institute of Medicine [IOM], Committee on the Work Environment for Nurses and Patient Safety. (Page, A. [Ed.]). (2003). Keeping patients safe. Washington, DC: National Academies Press; American Nurses’ Association (2014). Nursing staffing requirements to meet the demands of today’s long term care consumer recommendations from the Coalition of Geriatric Nursing Organizations (CGNO). Position Statement 11/12/14. www.nursingworld.org; Coalition of Geriatric Nursing Organizations (CGNO). (2013). Nursing staffing requirements to meet the demands of today’s long-term care consumer recommendations. https://hign.org/sites/hartford/files/policy/partnerships/cgno/CGNO%20Nurse%20Staffing%20seven%20orgs_2014.pdf. ↩︎
Schnelle, J. F., Simmons, S. F., Harrington, C., Cadogan, M., Garcia, E. & Bates-Jensen, B. (2004). Relationship of nursing home staffing to quality of care? Health Services Research, 39(2), 225-250 ↩︎
Abt Associates Inc. (2011). Nursing home staffing study TEP presentation. Prepared for the CMS Medicare Nursing Home Compare 5-Star TEP Panel. Durham, North Carolina: October 11. ↩︎
Schnelle, J.F., Schroyer, L.D., Saraf, A.A., and Simmons, S.F. (2016). Determining nurse aide staffing requirements to provide care based on resident workload: A discrete event simulation model. J. American Medical Directors Association. 17:970-977. ↩︎
Wells, J., & Harrington, C. (2013). Implementation of Affordable Care Act provisions to improve nursing home transparency and quality. Kaiser Commission on Medicaid and the Uninsured: Washington, DC. http://modern.kff.org/medicare/upload/8406.pdf↩︎
Ibid.; Teno, J.M., Plotzke, M., Gozalo, P., and Mor, V. (2014). A national study of live discharges from hospice. Palliative Medicine. 17(10):1121-27. ↩︎
Cabin, W., Himmelstein, D.U., Siman, M.L., and Woolhandler. (2014). For-profit Medicare home health agencies’ costs appear higher and quality appears lower compared to nonprofit agencies. Health Affairs. 33(8):1460-1465. ↩︎
Grabowski, D.C., Stevenson, D.G., and Keating, N.L. (2009). Ownership status and home health care performance. J. of Aging & Social Policy. 21:130-143. ↩︎
Carder, P., O’Keeffe, J, and O’Keeffe, C., RTI International (2015). Compendium of residential care and assisted living regulations and policy: 2015 edition. US Department of Health and Human Services Office of the Assistant Secretary for Planning and Evaluation. https://aspe.hhs.gov/basic-report/compendium-residenial-care-and-assisted-living-regulations-and-policy-2015-edition; Hawes, C., and Phillips, C.D. (2000). A national study of assisted living for the frail elderly: A final summary report: Washington, DC: US Department of Health and Human Services Office of the Assistant Secretary for Planning and Evaluation. http://aspe.hhs.gov/daltcp/reports/finaleshtm↩︎
Khatutsky G, Ormond C, Wiener JM, Greene AM, Johnson R, Jessup EA, Vreeland E, Sengupta M, Caffrey C, Harris-Kojetin L. (2016). Residential care communities and their residents in 2010: A national portrait. DHHS Publication No. 2016-1041. Hyattsville, MD: National Center for Health Statistics. Available at: https://www.cdc.gov/nchs/data/nsrcf/nsrcf_chartbook.pdf. ↩︎
Khatutsky, G., Wiener, J.M., Greene, A.M., Johnson, R., and O’Keefe, J. (2013). Do services and staffing in resident care facilities vary with residential needs? Washington, DC: Assistant Secretary for Planning and Evaluation. July 22. http://aspe.hhs.gov/daltcp/reports/2013/resneed.shtml; ↩︎
Centers for Disease Control and Prevention (CDC), National Center for Health Statistics, US Department of Health and Human Services (2016). Long-term care providers and services users in the United States: Data from the national study of long-term care providers, 2013-2014. Vital and Health Statistics. 3 (38). Hyattsville, MD. https://www.cdc.gov/nchs/data/series/sr_03/sr03_038.pdf↩︎
Khatutsky G, Ormond C, Wiener JM, Greene AM, Johnson R, Jessup EA, Vreeland E, Sengupta M, Caffrey C, Harris-Kojetin L. (2016). Residential care communities and their residents in 2010: A national portrait. DHHS Publication No. 2016-1041. Hyattsville, MD; National Center for Health Statistics. Available at: https://www.cdc.gov/nchs/data/nsrcf/nsrcf_chartbook.pdf. Khatutsky, G., Wiener, J.M., Greene, A.M., Johnson, R., and O’Keefe, J. (2013). Do services and staffing in resident care facilities vary with residential needs? Washington, DC: Assistant Secretary for Planning and Evaluation. July 22. http://aspe.hhs.gov/daltcp/reports/2013/resneed.shtml. ↩︎
Brown, R., Carlson, B.L., Dale, S., Foster, L., Phillips, B. and Schore, J. (2007). Cash and counseling: Improving the lives of Medicaid beneficiaries who need personal care or home and community-based services. Princeton, NJ: Mathematica Policy Research. http://www.rwjf.org/en/library/research/2007/08/cash—counseling.html; Newcomer, R.J., Kang, T. and Doty, P. (2012). Allowing spouses to be paid personal care providers: spouse availability and effects on Medicaid-funded service use and expenditures. Gerontologist, 52(4):517-30; Doty, P., Mahoney, K.J., and Sciegaj, M. (2010). New state strategies to meet long-term care needs. Health Affairs. (Millwood), 29(1):49-56. ↩︎
Centers for Medicare & Medicaid Services, Department of Health and Human Services. (2014). Medicaid program: State plan home and community-based services, provider payment reassignment, and home and community-based setting requirements for community first choice and home and community-based services (HCBS) waivers. 42 CFR Parts 430, 435, 436, 440, 441 and 447. Federal Register. 2014-00487. January 10. https://www.cms.gov/Newsroom/MediaReleaseDatabase/Fact-sheets/2014-Fact-sheets-items/2014-01-10-2.html↩︎
Kane, R.A. and Cutler, L.J. (2015). Re-imagining long-term services and supports: towards livable environments, service capacity, and enhanced community integration, choice, and quality of life for seniors. The Gerontologist. 55(2):286-95. ↩︎
Harrington, C, Ross, L. and Kang, T. (2015). Hidden ownership, hidden profits, and poor quality of nursing home care: A case study. International Journal of Health Services. 45 (4): 779-800; Stevenson, D., Bramson, J.S. and Grabowski, D.C. (2013). Nursing home ownership trends and their impacts on quality of care: A study using detailed ownership data from Texas. J. of Aging & Social Policy, 25:30-47; U.S. Government Accountability Office. (2010). Nursing Homes: Complexity of Private Investment Purchases Demonstrates Need for CMS to Improve the Usability and Completeness of Ownership Data. GAO-10-710. Washington, D.C. http://www.gao.gov/products/GAO-10-710↩︎
Ibid.; Kaye, H.S. (2014). Toward a model long-term care services and supports system: State policy elements. The Gerontologist. 54(5):754-61. ↩︎
National Quality Forum (2016). Quality in home and community-based services to support community living: addressing gaps in performance measurement. Final Report. Washington, DC: September. ↩︎
Gold M., Jacobson G., and Garfield R. (2012). There is little experience and limited data to support policy making on integrated care for dual eligibles. Health Affairs, 31(6):1176-85. ↩︎
U.S. Government Accountability Office (US GAO). (2007). Nursing home reform: Continued attention is needed to improve quality of care in small but significant share of homes. GAO-07-794T, Washington, DC: May 2, 2007 http://www.gao.gov/products/GAO-07-794T; U.S. Government Accountability Office (US GAO). (2008). Nursing homes: Federal monitoring surveys demonstrate continued understatement of serious care problems and CMS oversight weakness. GAO-08-517, Washington, DC: May 9, 2008 http://www.gao.gov/products/GAO-08-517; U.S. Government Accountability Office (US GAO). (2009). Medicare and Medicaid participating facilities: CMS needs to reexamine state oversight of health care facilities. GAO-09-64, Washington, DC: February 13, 2009 http://www.gao.gov/products/GAO-09-64; U.S. Government Accountability Office (US GAO). (2009). Nursing homes: Addressing the factors underlying understatement of serious care problems requires sustained CMS and state commitment. GAO-10-70. Washington, D.C. http://www.gao.gov/products/GAO-10-70. ↩︎
U.S. Office of the Inspector General (US OIG). (2014). Adverse events in skilled nursing facilities: National incidence among Medicare beneficiaries. OEI-06-11-00370. February. https://oig.hhs.gov/oei/reports/oei-06-11-00370.asp; U.S. Office of the Inspector General (US OIG). (2013). Medicare nursing home resident hospitalization rates merit additional monitoring. OEI-06-11-00040. November. https://oig.hhs.gov/oei/reports/oei-06-11-00040.pdf. ↩︎
Khatutsky G, Ormond C, Wiener JM, Greene AM, Johnson R, Jessup EA, Vreeland E, Sengupta M, Caffrey C, Harris-Kojetin L. (2016). Residential care communities and their residents in 2010: A national portrait. DHHS Publication No. 2016-1041. Hyattsville, MD: National Center for Health Statistics. Available at: https://www.cdc.gov/nchs/data/nsrcf/nsrcf_chartbook.pdf. Khatutsky, G., Wiener, J.M., Greene, A.M., Johnson, R., and O’Keefe, J. (2013). Do services and staffing in resident care facilities vary with residential needs? Washington, DC: Assistant Secretary for Planning and Evaluation. July 22. http://aspe.hhs.gov/daltcp/reports/2013/resneed.shtml; California Advocates for Nursing Home Reform (2013). Residential care in California: Unsafe, unregulated & unaccountable. San Francisco, CA: CANHR. http://www.canhr.org/reports/Residential_Care_in_California.pdf; ↩︎
U.S. Office of the Inspector General (US OIG). (2017). Early alert: The Centers for Medicare & Medicaid Services has inadequate procedures to ensure that incidents of potential abuse or neglect at skilled nursing facilities are identified and reports in accordance with applicable requirements. A-01-17-00504, August https://oig.hhs.gov/oas/reports/region1/11700504.asp; ↩︎
U.S. Government Accountability Office (US GAO). (2011). Nursing homes: More reliable data and consistent guidance would improve CMS oversight of state complaints investigations. GAO-11-280. Washington, D.C http://www.gao.gov/assets/320/317514.pdf ; U.S. Office of the Inspector General (US OIG). (2011). Unidentified and unreported federal deficiencies in California’s complaint surveys of nursing homes participating in the Medicare and Medicaid Programs. A-09-09-00114. https://oig.hhs.gov/oas/reports/region9/90900114.pdf↩︎
U.S. Government Accountability Office (US GAO). (2009). Medicare and Medicaid participating facilities: CMS needs to reexamine state oversight of health care facilities. GAO-09-64, Washington, DC: GAO, February 13, 2009 http://www.gao.gov/products/GAO-09-64; U.S. Government Accountability Office (US GAO). (2009). Nursing homes: Addressing the factors underlying understatement of serious care problems requires sustained CMS and state commitment. GAO-10-70. Washington, D.C. http://www.gao.gov/products/GAO-10-70; US Office of Inspector General (2005). Nursing home enforcement: The use of civil money penalties. April. https://oig.hhs.gov/oei/reports/oei-06-02-00720.pdf; Harrington, C., Stockton, J. and Hooper, S. (2014). The effects of regulation and litigation on a large for-profit nursing home chain. J. of Health Politics, Policy and Law, 39 (4):781-809. ↩︎
Li, Y., Harrington, C., Spector, W.D., and Mukamel, D.B. (2010). State Regulatory Enforcement and Nursing Home Termination from the Medicare and Medicaid Programs. Health Services Research. 45 (6):1796-1814. ↩︎
Werner, RM, Konetzka, RT, and Polsky, D. Changes in consumer demand following public reporting of summary quality ratings: An evaluation in nursing homes. Health Serv Res. 2016; 51 Supple 2:1291-309.
↩︎
Mukamel, DB, Amin, A, Weimer, DL, et al. Personalizing nursing home compare and the discharge from hospitals to nursing homes. Health Services Research. 2016; 1(6):2076-2094.
↩︎
Tyler, D.A., Gadbois, E.A., McHugh, J.P., Shield, R.R., Winblad, U. and Mor, V. (2017). Patients are not given quality-of-care data about skilled nursing facilities when discharged from hospitals. Health Affairs. 36(8):1385-1391. ↩︎
Harrington, C, Ross, L. and Kang, T. (2014). Hidden ownership, hidden profits, and poor quality of nursing home care: A case study. International Journal of Health Services. 45 (4): 779-800; Stevenson, D., Bramson, J.S. and Grabowski, D.C. (2013). Nursing home ownership trends and their impacts on quality of care: A study using detailed ownership data from Texas. J. of Aging & Social Policy, 25:30-47. ↩︎
U.S. Government Accountability Office (US GAO). (2016). Skilled nursing facilities: CMS should improve accessibility and reliability of expenditure data. GAO-16-700. Washington, D.C.: GAO, September. ↩︎
Insurers factored in premium increases ranging from 7 percent to 38 percent exclusively in silver plans to absorb the financial impact of the loss of cost-sharing reduction payments from the federal government, a new Kaiser Family Foundation analysis finds.
The approach, used by insurers in many states, shields consumers from steep rate hikes, because tax credits defraying the cost of premiums rise dollar-for-dollar along with benchmark silver rates. Eighty-four percent of marketplace enrollees received premium tax credits in 2017.
The new analysis of 32 states and Washington, D.C., tracks data on premium increases that insurers directly attributed to the end of the payments, which reimburse insurers for providing marketplace health plans with reduced out-of-pocket costs for lower-income people. Following months of uncertainty, the Trump administration announced on Oct. 12 that the payments would be discontinued immediately, although insurers must still offer the subsidized coverage.
Insurers reported a variety of approaches to compensate for the loss. Many increased premiums for silver-level plans because cost-sharing reductions for low-income enrollees are only available on those plans in the marketplaces. Surcharges on silver plans attributed to the end of the cost-sharing payments range from 7.1 percent to 38 percent, the analysis finds.
Other insurers reported the average impact of the discontinued payment across all plans, whether the increases were applied to all plans or only to silver plans. In these cases, the surcharge ranges from 0.1 percent to 27.2 percent, according to the analysis.
How consumers are affected by the increases depends on insurers’ approach to offsetting the loss, often under the guidance or direction of state insurance departments. While those with lower incomes who receive premium subsidies through tax credits will generally not face increased costs, middle- and upper-income people ineligible for premium subsidies may face the surcharge if insurers applied rate increases across the board. However, they may be able to avoid premium increases applied only to silver plans by enrolling in a gold or bronze plan.
While consumers will generally be protected, the federal government could pay more in increased premium subsidies than it saves from ending the cost-sharing reduction payments, an earlier Foundation analysis found.