KFF designs, conducts and analyzes original public opinion and survey research on Americans’ attitudes, knowledge, and experiences with the health care system to help amplify the public’s voice in major national debates.
KHN recently published a story highlighting how a nurse with a life-threatening cancer diagnosis’ major concern are her medical bills. They’re wreaking financial havoc for her and her family. A big part of Carol Marley’s problem? Denied claims. An $18,400 chemo bill was submitted with missing information and denied, because it arrived late. An $870 MRI bill was denied because it wasn’t pre-authorized. Marley has employer-sponsored insurance. An analysis KFF published last week of plans on Healthcare.gov found that 19 percent of all in-network claims were denied in 2017 on the ACA Marketplace.
Limitations in the federal data restrict our understanding of why denial rates vary so highly between plans and across states, but proposed changes for the next three years from the Centers for Medicare and Medicaid Services around the data that’s collected and how it’s reported may improve that transparency. For further context into this issue and what may change, we spoke with Karen Pollitz, senior fellow for health reform and private insurance at KFF, who worked on the new denied claims analysis.
1. What do we know about how or why claims are denied?
Pollitz: If you look on an Explanation of Benefits (EOB), which Carol Marley clearly did, the individual consumer can see why her claim was denied. Despite insurance companies knowing this information, those reasons for denial aren’t included in the data put out from CMS. As a result, we have this overall statistic that on average about 1 in 5 claims are being denied on the ACA Marketplace, but we can’t say why. We do know issuers’ denial rates vary quite a bit. Some are less than 10 percent, and some are more than 40 percent. Without any other detail on what’s going on, it’s hard to know how the plan really works. Does it pay claims reliably? If claims are denied, is there any kind of pattern? By how much are reporting differences driving the variation? The ACA requires all plans — including employer plans and marketplace plans — to report data to HHS to make these kinds of internal operations more transparent, but right now data are only being collected from ACA Marketplace plans, sold to individuals and families on Healthcare.gov. So we don’t know much about employer plans like the one Carol Marley was on, because there currently aren’t similar reporting requirements, even though HHS has that authority.
What we do know is that insurers can program their automated processing systems to be more or less forgiving – kicking out every claim that even has one comma in the wrong place, for instance. And if the wide variation of plan denial rates on the ACA Marketplace are any indication, at least some of the variation is probably because some insurers are more reliable payers of claims. But we can’t determine the exact reasons yet.
2. How are CMS’s proposed changes to the denial rate data likely to change analysis of this issue? What could it impact?
Pollitz: Today, insurers are only reporting the number of in-network claims submitted in a year, the number of those that are denied, the number of appeals, and what happens to the appeals. That’s one number in each of those categories, for the whole year, for all of the plans one issuer sells in that state on Healthcare.gov. So it’s highly aggregated. There aren’t any reported reasons for the denials.
CMS has proposed that this year it will start collecting more data and displaying it at the individual plan level. They’ll also begin to collect reasons behind denials in five categories for the future, including an ‘All Other’ category. Based on a report of all plans from Connecticut we highlighted in our analysis, I’m expecting “All Other” will be a large share of the denials.
This beginning stage of improving transparency would give consumers a little more information. Eventually, these data will provide some relative numbers as they’re thinking through a choice of 10 plans on the ACA Marketplace. At some point, as consumers compare prices they may look at claim denial rates as well, though I don’t know how much they could rely on data that’s currently reported without all of the reasons for denials detailed.
3. Are there any steps consumers could take now to make a difference when they experience denied claims and the resulting surprises on their medical bills?
Pollitz: Under the ACA, people have a right to appeal any time a claim is denied. And if the insurance company says no upon reconsideration, people also have a right to go to external review, where an independent organization looks at the case and makes a binding decision. The appeal is intended to be a protection for people, so if a claim is denied inappropriately, they have an opportunity to get that fixed. But our analysis shows less than one half of 1 percent of the in-network denied claims were appealed by people with coverage from Healthcare.gov. In over 85 percent of those that were appealed, the insurer upheld its denial at reconsideration. Less than 1 out of every 11,000 denied claims went to external review.
While the total number of denied claims could be inflated by duplicate claims denials, the data nonetheless show that denied claims do not usually make it to external review. There are lots of reasons why people don’t appeal claims, including because they’re sick, which is why they were making the claims in the first place. It’s all the more reason why denial data that is more comprehensive can tell a more detailed story. Not only because this matters to patients, but also because transparency makes oversight and accountability easier.
I think there’s a desire on all sides for clearer data. We really can’t figure out what proportion of denials results in care going uncompensated for the patients — or for their providers. And insurers may get a bad reputation for activities that perhaps aren’t so bad after all.
DENVER, Colo. & SAN FRANCISCO, Calif., March 5, 2019 — The Colorado Health Foundation, The Colorado Trust, and KFF (the Henry J. Kaiser Family Foundation) are partnering to bring Kaiser Health News (KHN) to Colorado. KFF—the trusted source of health policy information—produces health policy analysis, polling, and journalism, and KHN is its editorially independent national health and health policy newsroom, producing in-depth news coverage of health care policy and politics.
Thanks to a new long-term partnership with the Colorado Health Foundation and The Colorado Trust, KFF will hire a Colorado-based KHN reporter and recruit a team of freelance journalists throughout the state to bring the same high-quality health journalism to Colorado and the surrounding region that KHN produces nationally. This partnership will also share important stories from Colorado and the region with the nation. KHN stories produced from the region will be made freely available for publication by media outlets throughout Colorado, the mountain states, and the country, and will be published on kffhealthnews.org and distributed through KHN’s social media platforms.
“Elevating the voices and exploring the experiences of Coloradans and the communities they call home are key to achieving more health equity in our state,” said Karen McNeil-Miller, president and CEO of the Colorado Health Foundation. “News stories illustrate and bring to life what data alone cannot. They shine a light on the often invisible barriers that inequity creates in the lives of far too many Coloradans. Trusted and reliable news sources are critical to creating an informed and engaged public and surfacing solutions that will bring health in reach for all of us.”
“This is an important step towards addressing a long-time need for more stories on health equity, health policy, and health care issues in our state,” said Ned Calonge, MD, MPH, president and CEO of The Colorado Trust. “Allowing Coloradans to understand how their health is impacted by policies, systems, and social circumstances is essential to ending inequalities, as well as improving individual and community well-being. We are especially pleased that these stories will be available for free to any Colorado media outlet.”
“With this support from two of Colorado’s leading health philanthropies, we hope to help fill the need for in-depth coverage of health in Colorado and the mountain states and bring those stories to the nation at the same time,” said Drew Altman, KFF’s CEO and KHN’s founding publisher.
KHN’s more than 50 journalists are mostly based in KFF’s Washington, D.C. offices or in California, and this expansion to Colorado follows on the recently announced creation of a KHN Midwest Bureau in St. Louis, Missouri.
“Throughout KHN’s history, we have been fortunate to receive support from a fantastic group of national and regional health foundations who understand the importance of editorially independent, nonprofit health journalism,” said David Rousseau, KFF vice president and executive director of Media and Technology, and KHN’s publisher. “Their support has made it possible for us to extend KHN’s reach to new communities and new topics, and we are thrilled to work with the Colorado Health Foundation and The Colorado Trust to increase health reporting for and about Colorado.”
Media organizations interested in working with KHN should contact KHN at KHNPartnerships@kff.org, and those interested in joining our efforts to expand and improve health journalism in Colorado, the mountain states, and beyond should contact KFF at healthjournalism@kff.org. Colorado employment opportunities will be posted soon at www.kff.org/employment-opportunities.
The Colorado Health Foundation is bringing health in reach for all Coloradans by engaging closely with communities across the state through investing, policy advocacy, learning and capacity building. For more information, please visit www.coloradohealth.org.
ABOUT THE COLORADO TRUST
The Colorado Trust is a foundation dedicated to achieving health equity—ending inequalities that affect racial, ethnic, low-income and other vulnerable populations, so that everyone can achieve good health. The Trust believes all Coloradans should have fair and equal opportunities to lead healthy, productive lives regardless of race, ethnicity, income or where we live. The Trust focuses on policies and information related to advancing health equity, as well as projects that address health equity in partnership with communities throughout Colorado. For more information, please visit www.coloradotrust.org.
Among People Ineligible for Subsidies, Middle-Class Older Adults Face the Least Affordable ACA Premiums, Especially Those Living in Rural Areas Where Premiums Are Highest
A new KFF analysis finds that Affordable Care Act marketplace premiums are least affordable for older adults who earn too much to qualify for federal subsidies, especially those living in rural areas where premiums are highest.
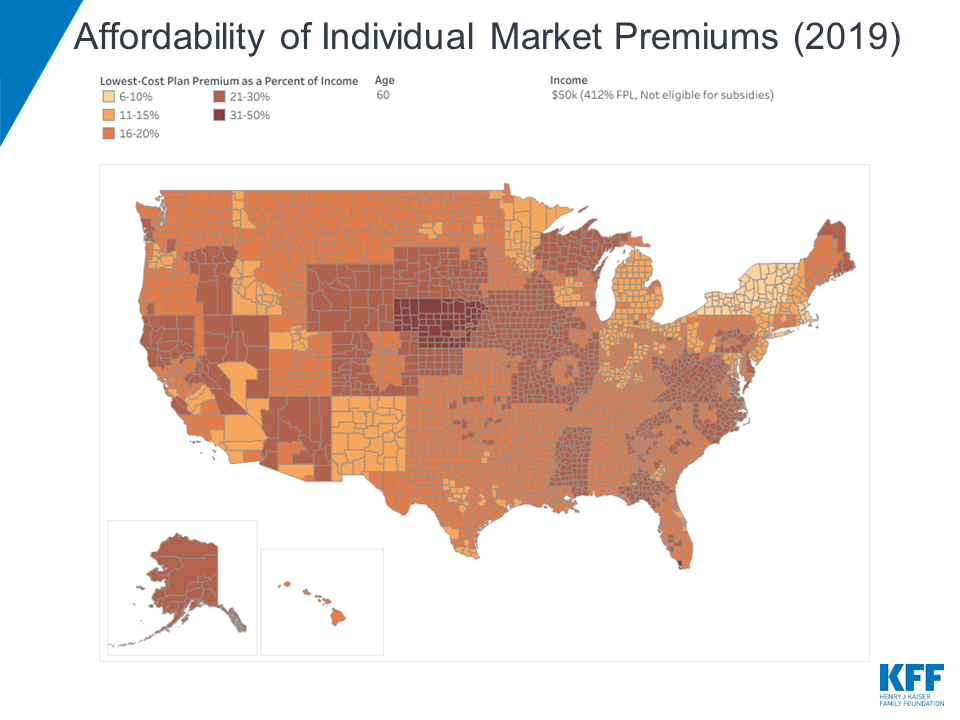
The analysis of the lowest-cost 2019 ACA marketplace plans across U.S. counties finds that older adults not eligible for subsidies living in 28 rural Nebraska counties face the least affordable ACA premiums as a share of income. A 60-year-old resident of Lincoln County, Nebraska, making $50,000 a year (or 412% of poverty) would pay a monthly premium of $1,314 ($15,770 annually, or 32% of income) for the lowest-cost ACA plan. In contrast, a 60-year-old neighbor making $45,000 would pay nothing in monthly premiums for the same plan because their income is 371 percent of poverty, low enough to qualify for ACA tax credits.
This big difference in costs is known as the “subsidy cliff” because eligibility for ACA premium tax credits ends abruptly at 400 percent of the federal poverty line ($48,560 for an individual and $100,400 for a family of four in 2019), even if premiums represent a substantial share of income for those just above it. The analysis includes an interactive map that allows users to see which counties have the most and least affordable ACA premiums for unsubsidized consumers at different age and income levels.
The analysis also finds that:
Nationally, in 21 percent of counties a 40-year-old making $50,000 a year would spend more than 10 percent of her income to get the cheapest available ACA bronze plan. But the affordability challenges are not spread evenly. Twenty-five percent of people in non-metropolitan areas live in a county where that 40-year-old would spend more than 10 percent of her income on plan premiums, compared to only 5 percent of people in metropolitan counties.
Because the ACA allows insurers to charge older adults premiums three times higher than those for younger enrollees, older consumers who do not qualify for subsidies face the highest premiums. A 27-year-old making $50,000 would pay about 7 percent of her income in premiums for the average lowest-cost plan nationally, whereas a 60-year-old with the same income would pay 17 percent of her income for the same plan.
Among states, Wyoming has the highest average statewide premium for middle-class people ineligible for subsidies in 2019, while Rhode Island has the lowest. In Wyoming, a 40-year-old making $50,000 would pay about 14 percent of her income in premiums for the cheapest plan, on average. In Rhode Island, the same person would pay about 5 percent of income on the cheapest plan.
The low-cost ACA bronze plans studied in the analysis come with higher deductibles, copayments, or coinsurance than plans at higher metal tiers with higher monthly premiums. Sicker enrollees may be better off choosing a silver or gold plan even if that means they spend a larger proportion of their income on premiums.
Although this analysis only includes premiums for plans available in the ACA marketplace, bronze plan premiums for consumers who do not qualify for subsidies should be similar on and off the marketplace. Most unsubsidized enrollees in ACA-compliant plans get their plans outside of the marketplace.
The analysis also discusses a variety of state and federal proposals that seek to lower premiums for middle-class people buying their own insurance who are ineligible for ACA subsidies.
The majority of enrollees who purchase health coverage through Affordable Care Act (ACA) exchanges receive premium tax credits to help them afford their monthly premiums. To a large extent, subsidized enrollees are shielded from premium increases because their subsidies rise along with premiums. On the other hand, middle-income people with incomes above 400% of the Federal Poverty Line (“FPL”, equal to $48,560 for an individual and $100,400 for a family of four in 2019) are not eligible for subsidies and may struggle to afford ACA-compliant plans.
Marketplace enrollment among subsidized enrollees rose from 8.7 million in 2015 to 9.2 million in 2018. However, premiums increased significantly, and the number of unsubsidized enrollees in ACA-compliant plans has fallen over this same period from 6.4 million to 3.9 million. Unlike subsidized enrollees, those with incomes over 400% of poverty have to bear the full cost of premium increases if they buy an ACA-compliant plan.1
While premiums for ACA Marketplace plans are holding steady or falling slightly on average in 2019, whether ACA plan premiums are actually affordable for an individual depends on where they live, how old they are, and how much money they make. We analyzed 2019 premiums data to show how affordable the lowest-cost ACA Marketplace plan is in each county, by age and income, with a focus on middle-class people whose incomes are too high to qualify for subsidies.
This brief finds that affordability challenges are particularly acute for older adults with incomes just above the premium subsidy cutoff (400% of poverty), particularly in rural areas where premiums are highest.
Figure 1
Most unsubsidized enrollees who enroll in ACA-compliant plans do so outside of the Marketplace. This brief only includes premiums for plans that are available on the Marketplace, but bronze premiums for people who are not eligible for subsidies are generally similar whether an enrollee buys through the Marketplace or not. (In all but 14 counties, the lowest-cost plan available is a bronze plan.)
The interactive map shows a substantial decline in affordability between a $45,000 income (which would put an individual at 371% of the poverty level and make them eligible for subsidies) and $50,000 (412% of poverty and therefore not eligible for subsidies). This phenomenon is referred to as the “subsidy cliff” because subsidy eligibility ends sharply at 400% of poverty without a phase-out, even if premiums represent a substantial share of income for those above 400% of poverty.
In 21% of counties, a 40-year-old making $50,000 would have to pay more than 10% of their income for the lowest-cost plan in the Marketplace. However, because premiums are lower in urban areas than in rural areas, just 8% of Marketplace enrollees are in a county where that would be the case. In 25% of non-metropolitan counties (weighted by enrollment), a 40-year-old making $50,000 would spend more than 10% of their income on premiums for the cheapest plan available, compared with only 5% of people in metropolitan counties.2
Rhode Island has the lowest average premiums for middle-class people ineligible for subsidies in 2019: a 40-year-old making $50,000 would pay about 5% of their income in premiums for the cheapest plan, on average. Wyoming has the highest average premiums for unsubsidized people: a 40-year-old making $50,000 would pay about 14% of their income in premiums for the cheapest plan, on average, with Nebraska and West Virginia in a close second and third place.
Figure 2 presents an interactive chart showing how much the national average premiums for a low-cost plan vary as a share of income at different income levels for people at various ages. (Figure 3 presents similar results as a static chart.) On average across the U.S., a 40-year-old making $45,000 would pay $227 a month (6% of their income) for a subsidized bronze exchange plan, whereas the same person making $50,000 would pay $340 a month (8% of their income) for the same plan without a subsidy. Because the ACA allows premiums for older adults to be three times those for younger enrollees, middle-class older people with unsubsidized coverage are the most likely to face affordability challenges. For example, a 27-year-old making $50,000 would pay 7% of their income in premiums for the average lowest-cost plan nationally, whereas a 60-year-old making the same income would pay 17% of their income in premiums. Even at an income of $70,000 (577% of the poverty level), a 60-year-old would have to pay 12% of income for a low-cost plan on average.
Figure 2: Average Lowest-Cost Plan Premium (by Income, Age, and Metal Level, 2019)
For older people living in very high-premium counties, the affordability gap is much more stark; in the 28 Nebraska counties with the highest premiums, a 60-year-old making $45,000 would pay nothing in monthly premiums and the same person making $50,000 would pay $1,314 (32% of income) for the lowest-cost plan.–
Figure 3: Average Lowest-Cost Bronze Plan Premium as a Percent of Income (by Age and Income, 2019)
The premiums in this analysis are for the lowest-cost plan available in each county, but these low-cost bronze plans come with higher deductibles, copayments, or coinsurance than plans at higher metal tiers with higher monthly premiums. The average deductible for bronze plans in 2019 is $6,258, compared to $4,375 for silver plans (for people who do not receive cost-sharing subsidies because their incomes are above 250% FPL). While some services, including preventative care and often a few physician visits, are covered before enrollees reach their deductible, sicker enrollees may be better off choosing a silver or gold plan even if that means they spend a larger proportion of their income on premiums.
Discussion
After several years of rising ACA plan premiums, premiums are falling in many parts of the country for 2019. Despite this trend, premiums for even the cheapest exchange plans are still out of reach for many middle class people who are not eligible for ACA subsidies, particularly those who are older or live in high-premium areas. Several policy options have been proposed to address affordability for people buying their own coverage without a subsidy, such as expanding more loosely regulated short-term plans, creating state-based reinsurance programs, extending subsidies beyond 400% of poverty, and expanding eligibility for Medicaid or Medicare.
The Trump administration recently made changes to short-term, limited duration plans, with the goal of creating a more affordable option for people who are not eligible for subsidies. Short-term plans generally have significantly lower premiums than ACA-compliant coverage, in large part because these plans can exclude people with pre-existing conditions and may not cover certain services. Thus, while short-term plans come with lower premiums, these plans are generally not an option for people who have pre-existing conditions or expect to need high-cost services (e.g. for pregnancy, prescription drugs, or mental health care). Additionally, these plans will disproportionately attract healthy individuals away from ACA-compliant coverage, thus having an upward effect on premiums in the ACA-compliant individual market and possibly making unsubsidized coverage less affordable for people with pre-existing conditions.
The ACA established a temporary reinsurance program from 2014 to 2016 with the goal of making premiums more affordable during the early years of new market reforms. Reinsurance covers a portion of the health care expenses for high-cost patients, allowing insurers to reduce premiums.
Seven states (Alaska, Maine, Maryland, Minnesota, New Jersey, Oregon, and Wisconsin) have since created their own reinsurance programs, and initial evidence indicates that these programs have been successful in reducing individual market premiums, although the details of these plans vary widely between states. How much a reinsurance program can reduce premiums depends on the level of funding dedicated to it. Reinsurance reduces premiums somewhat for all enrollees ineligible for premium subsidies. However, this reduction in prices will not be enough to make plans affordable for all unsubsidized middle class people, particularly those facing the highest premiums as a share of income. For example, the cheapest plan in Natrona County, Wyoming costs $1,237 a month for an unsubsidized 60-year-old (25% of income for someone making $60,000). If the implementation of a reinsurance plan reduced all premiums by 10%, the cheapest plan would cost $1,113 (22% of income), which is still too expensive for many people to afford.
Expanding premium tax credits to enrollees over 400% of poverty would provide more significant assistance to those newly eligible for subsidies. For example, California Governor Newsom recently proposed expanding premium tax credits to incomes between 400 and 600% of poverty (incomes up to $72,840 for an individual).
Avoiding a subsidy cliff altogether would cost taxpayers more. One federal bill introduced in the House last year would extend premium subsidies to enrollees in all income brackets, and increase the amount of subsidies across the board. On average nationally, tax credits would need to extend to nearly 800% FPL to bring 2019 bronze premium payments down to 10% of income for a single 64-year-old, or just over 1,100% FPL to accomplish the same for silver premiums. In the 28 Nebraska counties with the most expensive 2019 premiums in the U.S., tax credits would need to extend beyond 1,400% FPL to bring bronze premium payments down to 10% of income for a single 64-year-old, or over 2,000% FPL to accomplish the same for silver premiums. In the case of an older couple living in a high-premium county, subsidies would need to extend beyond 3,000% FPL (a $500,000 income), for 2019 silver premiums to cost less than 10% of their income.
In late 2018, the Trump administration released new guidance and the Centers for Medicare and Medicaid Services (CMS) issued a discussion paper on Section 1332 waivers established by the ACA. This new guidance may prompt states to apply subsidies to ACA non-compliant plans or experiment with different subsidy structures, such as tax credits based on age and not income. One of the CMS waiver concepts describes extending subsidies to higher-income residents to address the “subsidy cliff.” Under a budget neutral waiver, however, increasing subsidy resources for one population group would necessitate reducing subsidy dollars available to other groups. Currently, ACA subsidies are structured so that lower-income enrollees pay a smaller percentage of their income (2% premium cap for those 100-133% of poverty) than higher-income enrollees (10% for those 300-400% of poverty), and they receive the bulk of subsidies. Additionally, as noted above, subsidies would need to extend well beyond 400% FPL to do away with the subsidy cliff altogether.
A number of recent congressional proposals would provide lower premium options to middle-class people buying their own coverage by expanding access to public programs like Medicare and Medicaid. For example, one bill would allow people age 50 and over to buy into Medicare, potentially lowering premiums through reduced prices paid to health care providers and curtailing administrative costs and profits. Another bill would allow states to set up programs that allow people to buy into the Medicaid program, capping premiums at 9.5% of income.
So far, while there seems to be a consensus that individual market premiums are out of reach for some middle-class people ineligible for ACA subsidies, there is little consensus around what to do about it.
Methods
We analyzed data from the 2019 Individual Market Medical files to determine premiums and the benchmark amounts to calculate premium tax credits for the scenarios presented. These files are available at data.healthcare.gov. Premiums for the 12 state-based Marketplaces are from KFF analysis of data received from Massachusetts Health Connector and KFF analysis of data published by HIX Compare from the Robert Wood Johnson Foundation. All premiums are displayed as the full price, rather than just the portion that covers essential health benefits.
The lowest-cost plan is a bronze plan in all but 14 counties where a silver plan is cheaper. In those 14 counties, the silver plan is used as the lowest-cost plan for this analysis. This analysis only includes on-exchange plans. Off-exchange plans generally have similar premiums to on-exchange plans with the exception of silver plans, which often include an additional premium load on-exchange only to account for cost-sharing reductions insurers must provide to some exchange enrollees.
All averages are weighted by county-level 2018 plan selections. 2018 plan selections come from the 2018 Marketplace Open Enrollment Period County-Level Public Use file provided by CMS, available here. In states running their own exchanges, we gathered county-level plan selection data where possible and otherwise estimated county plan selections based on the county population in the 2010 Census and total state plan selections in the 2018 OEP State-Level Public Use File provided by CMS, available here. Metro/Non-Metro county classifications are based on definitions from the Federal Office of Rural Health Policy.
Endnotes
While this analysis focuses on the unsubsidized population above 400% of poverty, the “coverage gap” in states that have not expanded Medicaid has also left a group of people with incomes below poverty unsubsidized and unable to afford care. The 2.2 million uninsured people in the coverage gap make too much to qualify for Medicaid or do not meet categorical requirements in those states, but are below the poverty line and thus are not eligible for ACA Marketplace subsidies. ↩︎
These averages are weighted by 2018 county-level plan selections. Alaska and Hawaii are excluded from this calculation because these states have different poverty guidelines, and thus different subsidy cutoffs, from the rest of the U.S. ↩︎
Poll: Nearly 1 in 4 Americans Taking Prescription Drugs Say It’s Difficult to Afford Their Medicines, including Larger Shares Among Those with Health Issues, with Low Incomes and Nearing Medicare Age
Bi-Partisan Majorities Support Range of Policy Changes Aimed at Lowering Drug Costs
As the Trump Administration and Congress weigh policy options to address high prescription drug prices, a fourth of people taking prescription drugs (24%) and seniors taking drugs (23%) say it is difficult for them to afford their medications, the latest KFF Health Tracking Poll finds.
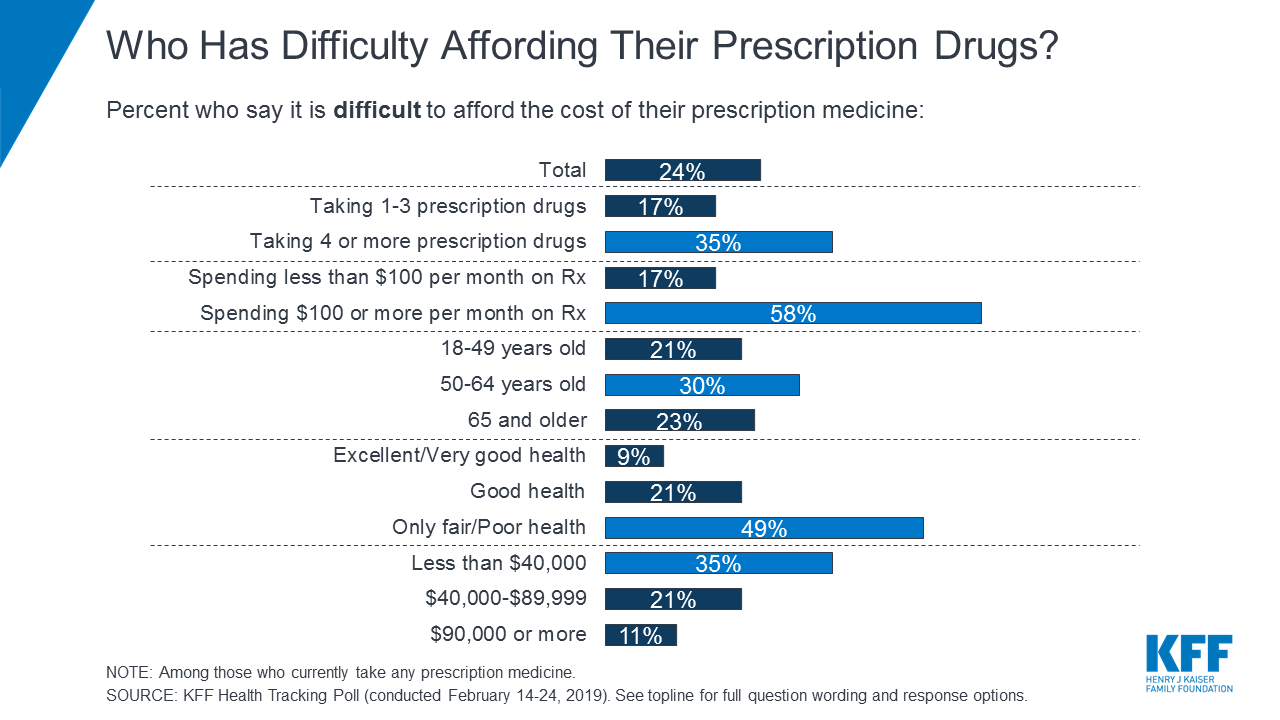
The groups most likely to report difficulties affording their medications include people with monthly drug costs of $100 or more (58%), in fair or poor health (49%), with annual incomes less than $40,000 (35%), or taking at least four drugs monthly (35%). Three in ten 50-64 year olds report problems affording drugs. This group takes more prescriptions on average than younger people but isn’t old enough to qualify for Medicare and its drug benefit.
In addition to difficulty affording prescriptions, about three in ten (29%) of all adults report not taking their medicines as prescribed at some point in the past year because of the cost. This includes about one in five who say they didn’t fill a prescription (19%) or took an over-the counter drug instead (18%), and about one in 10 (12%) who say they cut pills in half or skipped a dose. Three in ten of those who report not taking their medicines say their condition got worse as a result (8% of the public overall).
The poll also assesses the public’s views of a range of proposed legislative and administration actions aimed at lowering drug costs.
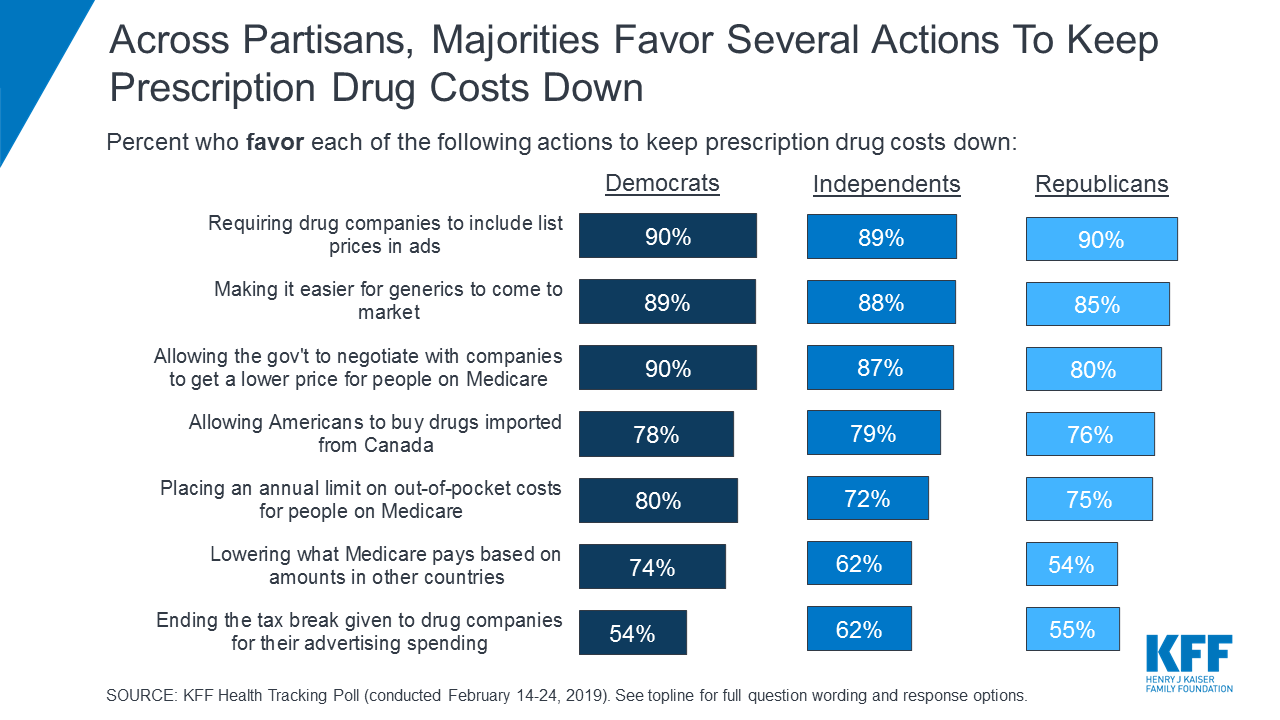
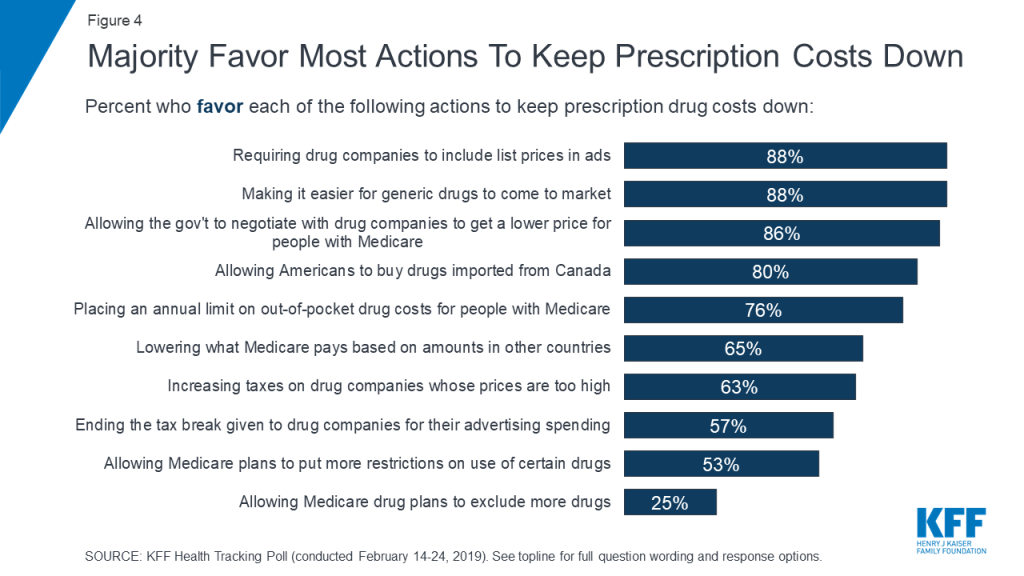
Large majorities favor most of these options, including requiring drug companies to list prices in their ads (88%), making it easier for generic drugs to come to market (88%), allowing the federal government to negotiate with drug companies to get lower prices for people with Medicare (86%), and allowing Americans to buy drugs imported from Canada (80%). Each of these four options receive support from large majorities of Republicans, Democrats and independents.
Bi-partisan majorities support two other Medicare changes: placing an annual limit on out-of-pocket drug costs for Medicare beneficiaries (76% support, including 75% of Republicans) and lowering what Medicare pays based on prices in other countries (65%, including 54% of Republicans). Fewer support options that could limit Medicare beneficiaries’ access to medications, such as allowing Medicare Part D drug plans to impose more restrictions on certain drugs’ use (53%) or exclude more drugs (25%).
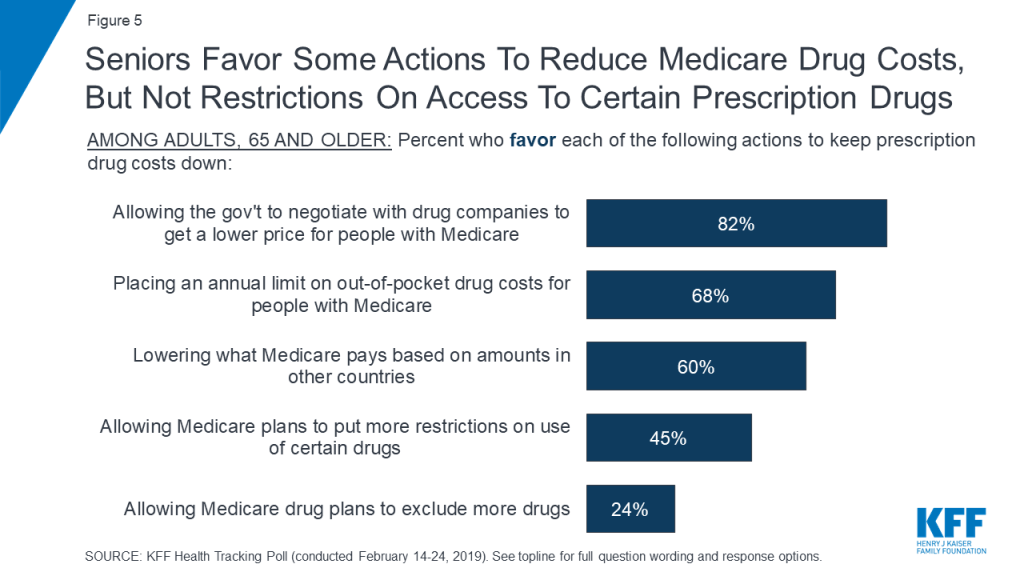
Among seniors, nearly all of whom are covered by Medicare, majorities support three Medicare policy changes: allowing the government to negotiate prices (82%), setting an out-of-pocket spending limit (68%), and setting prices based what people in other countries pay (60%). Fewer seniors support allowing Part D plans to place more restrictions on drugs’ use (45%) or exclude more drugs (24%).
Arguments about Medicare Drug Price Negotiations Can Shift Many People’s Views
This month’s poll also tests a range of arguments for and against allowing the government to negotiate with drug companies to lower the prices Medicare beneficiaries pay.
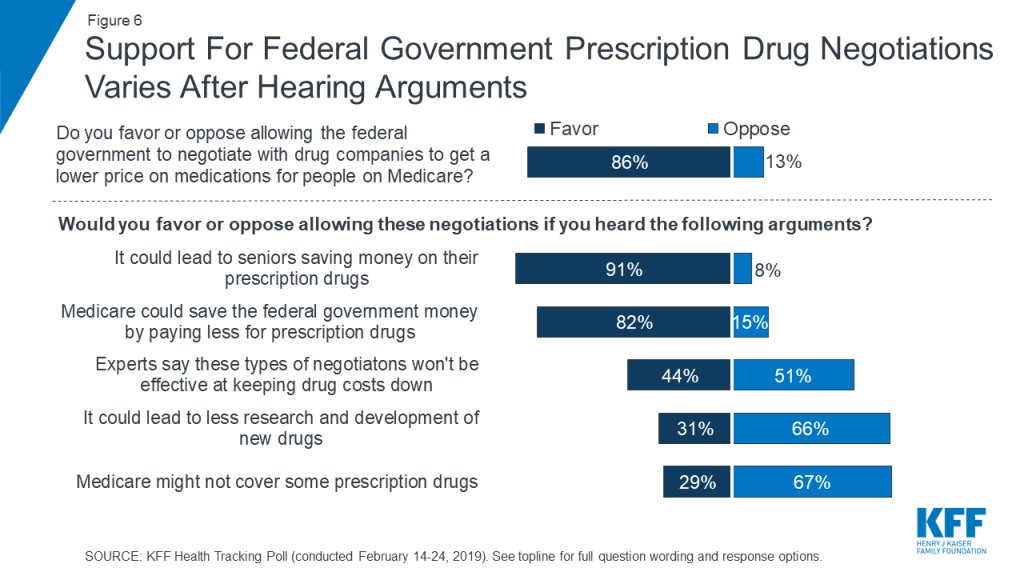
As noted above, a large majority (86%) initially supports this policy change. The share in favor rises to 91 percent when opponents are told it could save seniors money on their drug. The share in favor drops sharply when supporters hear opponents’ potential arguments that it could lead to less research and development of new drugs (31% still favor while 66% oppose) or that Medicare might not cover some prescription drugs (29% still favor while 67% oppose).
Medicare-for-All Views Hold Steady
The poll finds the public’s views toward a Medicare-for-all proposal, which would expand public coverage through a national insurance plan, holding steady this month amid heightened attention in Congress and among Democratic presidential candidates on the campaign trail. The poll finds 57 percent of the public support Medicare-for-all, statistically unchanged from January (56%).
Designed and analyzed by public opinion researchers at KFF, the poll was conducted Feb. 14-24, 2019 among a nationally representative random digit dial telephone sample of 1,440 adults, including an over-sample of adults, 65 and older (606). Interviews were conducted in English and Spanish by landline (464) and cell phone (976). The margin of sampling error is plus or minus 3 percentage points for the full sample and 5 percentage points for the over-sample. For results based on subgroups, the margin of sampling error may be higher.
With increased attention among policymakers towards prescription drug costs, the February 2019 KFF Health Tracking Poll finds a majority of adults, including seniors, are in favor of many policy options aimed at curbing prescription drug costs. There is majority support – across party identification – for many current policy proposals, including recent Trump administration proposals like international reference pricing and transparency in drug advertisements. Both of these policy proposals are supported by large majorities of Democrats and independents, and a majority of Republicans.
Majorities across the political divide support a range of policies aimed at lowering prescription drug costs, such as including list prices in ads and allowing the government to negotiate Medicare drug prices
There is also bipartisan support for allowing the federal government to negotiate with drug companies to get a lower price for people with Medicare, which covers 60 million Americans. But attitudes towards this proposal shift after hearing potential arguments about how it might affect some people with Medicare.
Among those currently taking prescription drugs, one-fourth of adults (24 percent) and seniors (23 percent) say it is difficult to afford their prescription drugs including about one in ten (overall and among seniors) saying it is “very difficult.” Certain groups are much more likely to report difficulty affording medication, including those who are spending $100 or more a month on their prescriptions (58 percent), those who report being in fair or poor health (49 percent), those who take four or more prescription drugs (35 percent), and those with incomes less than $40,000 annually (35 percent). In addition, three in ten of all adults (29 percent) report not taking their medicines as prescribed at some point in the past year because of the cost and one in ten (8 percent) say their condition got worse as a result of not taking their prescription as recommended.
While the public sees profits made by pharmaceutical companies as a major factor contributing to the price of prescription drugs (80 percent), a majority (63 percent) also say profits made by pharmacy benefit managers (PBMs), companies that manage prescription drug benefits for health plans, are a “major factor” contributing to the price of prescription drugs.
This month’s KFF Health Tracking Poll also tracks public opinion on the Affordable Care Act and the proposal to expand coverage through a national health plan, known commonly as Medicare-for-all and finds favorability towards both the ACA (50 percent) and Medicare-for-all (57 percent) statistically unchanged since last month.
Public Views Prescription Drug Costs As Unreasonable, Wants More Government Regulation
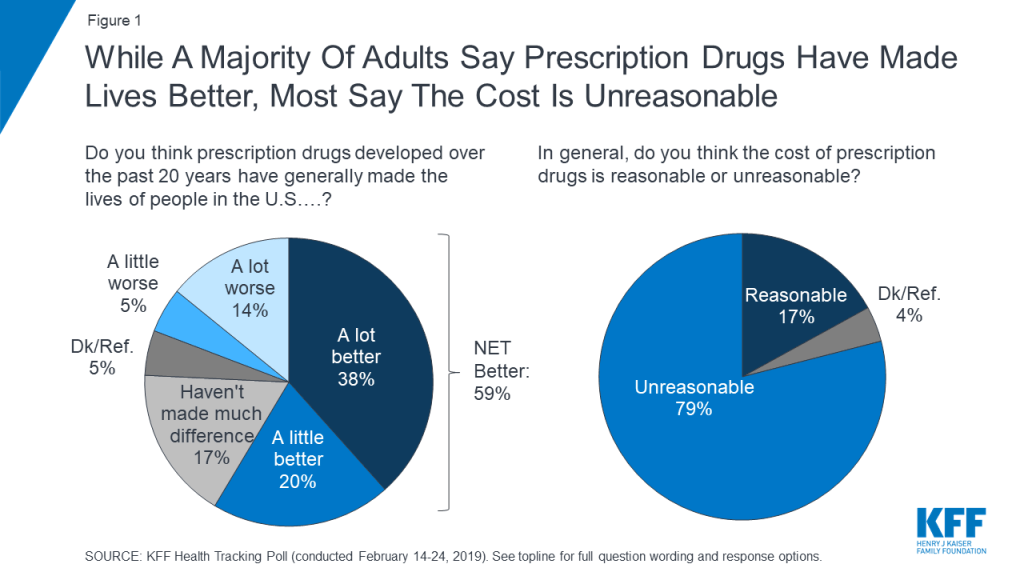
A majority of Americans (59 percent) believe prescription drugs developed over the past 20 years have generally made the lives of people in the U.S. better – with nearly four in ten saying they have made people’s lives “a lot better.” Yet, eight in ten (79 percent) say the cost of prescription drugs is “unreasonable.”
Figure 1: While A Majority Of Adults Say Prescription Drugs Have Made Lives Better, Most Say The Cost Is Unreasonable
The public sees profits made by pharmaceutical companies as a major factor contributing to the price of prescription drugs. At least eight in ten – across party identification – say profits made by pharmaceutical companies are a “major factor” in the price of prescription drugs. This is followed by seven in ten (69 percent) who say the cost of research and development is a “major factor” contributing to the price.
Figure 2: Public Sees Profits Made By Drug Companies As The Largest Contributor To Prescription Drug Prices
The Trump administration proposed a new rule earlier this month affecting pharmacy benefit managers (PBMs), companies that manage prescription drug benefits for health plans. About six in ten (63 percent) of the public say profits made by these companies (PBMs) are a “major factor” contributing to the price of prescription drugs. About half (52 percent) say the cost of marketing and advertising is a major factor in prescription drug prices.
Public Does Not Trust Drug COmpanies To Price their products fairly
Majorities of the public trust pharmaceutical companies (either “a lot” or “somewhat”) to be good stewards in terms of developing new effective drugs (71 percent), and offering reliable information to consumers about drug safety and side effects (65 percent) as well as drug efficacy (61 percent). About half trust pharmaceutical companies to inform the public quickly when they learn of a safety concern with their drugs (47 percent) and even fewer trust pharmaceutical companies to price their products fairly (25 percent). This is a significant decrease from 41 percent who said they trusted pharmaceutical companies to price their products fairly back in 2008.
Figure 3: Most Trust Drug Companies On Variety Of Issues, But Few Trust Drug Companies To Price Their Products Fairly
Bipartisan Support for Some Government Regulation on Prescription Drug Prices
Prescription drug costs have been a focus of lawmakers, with hearings held in both the House and Senate, and numerous proposals put forward by the Trump administration and members of Congress. This is consistent with the public’s priorities as the January 2019 KFF Health Tracking Poll found lowering prescription drug costs remains a priority for the public with majorities of Democrats, independents, and Republicans saying this was important for Congress to work on.
The majority of the public is in favor of most current policy options aimed at helping keep the cost of prescription drugs down included in this month’s survey.
Figure 4: Majority Favor Most Actions To Keep Prescription Costs Down
The vast majority of Americans favor requiring drug companies to include drug list prices in their advertisements (88 percent)1 , making it easier for generic drugs to come to market (88 percent), and allowing the federal government to negotiate with drug companies to get a lower price on medications for people with Medicare (86 percent). All three of these policy proposals are supported by large majorities of Democrats, independents, and Republicans.
Most Americans are aware that people in this country often pay higher prices for prescription drugs than people in other countries such as Canada and Western Europe and a majority favor two proposals aimed at leveling international prices. Eight in ten favor allowing Americans to buy drugs imported from licensed Canadian pharmacies while two-thirds (65 percent) favor lowering what Medicare pays based on amounts paid in other countries where governments more closely control prices. Both of these proposals garner bipartisan support.
Table 1: Favorability Towards Prescription Drug Policy Proposals By Party Identification
Percent who favor each of the following actions to keep prescription drug costs down:
Democrats
Independents
Republicans
Requiring drug companies to include list prices in ads
90%
89%
90%
Making it easier for generic drugs to come to market
89
88
85
Allowing the gov’t to negotiate with drug companies to get a lower price for people with Medicare
90
87
80
Allowing Americans to buy drugs imported from Canada
78
79
76
Placing an annual limit on out-of-pocket drug costs for people with Medicare
80
72
75
Lowering what Medicare pays based on amounts in other countries
74
62
54
Increasing taxes on drug companies whose prices are too high
73
64
48
Ending the tax break given to drug companies for their advertising spending
54
62
55
Allowing Medicare plans to put more restrictions on use of certain drugs
59
55
44
Allowing Medicare drug plans to exclude more drugs
28
22
26
Note: Some items asked of separate half-samples.
Majorities of the public favor placing an annual limit on out-of-pocket prescription drug spending for seniors with Medicare (76 percent). Fewer – but still a slight majority (53 percent) – favor allowing Medicare plans to put more restrictions on the use of certain drugs, like making patients try cheaper alternatives before taking a more expensive drug. Only a quarter favor allowing Medicare plans to exclude more drugs in order to keep prices down, a recent proposal from the Trump Administration.2
Seniors’ views of Prescription Drug Policy Proposals
This month’s KFF Health Tracking Poll includes a deep dive into the experiences and attitudes of senior adults, 65 and older, who are more likely to report taking prescription medication and have typically had to shop for prescription drug coverage in addition to their Medicare coverage.
Adults, 65 and older, and Prescription Drug Coverage
Prescription drug coverage plays an important role in health care for many adults, 65 and older (“seniors”), and younger beneficiaries with long-term disabilities, and accounts for nearly one-fifth of all Medicare spending. Nearly three-fourths of all Medicare beneficiaries (72 percent) have prescription drug coverage through Medicare Part D, which is administered by both private stand-alone plans and Medicare Advantage drug plans. With an aging population, the February KFF Health Tracking Poll includes an over-sample of adults, 65 and older, in order to better understand how those most directly affected by prescription drug policy view proposed changes.
These results do not differ when looking specifically at the opinion of those who would be directly affected by changes to Medicare prescription drug coverage. A majority of seniors also favor allowing the federal government to negotiate with drug companies to get lower prices for people with Medicare (82 percent), placing an annual limit on out-of-pocket spending for people with Medicare (68 percent), and lowering what Medicare pays based on amounts paid by other countries where governments more closely control prices (60 percent). Fewer favor allowing Medicare plans to put more restrictions on the use of certain drugs (45 percent) or allowing Medicare plans to exclude more drugs (24 percent).
Figure 5: Seniors Favor Some Actions To Reduce Medicare Drug Costs, But Not Restrictions On Access To Certain Prescription Drugs
Public Opinion on Federal Government Negotiating on Medicare Drug Costs
Overall, about four in ten of all adults and seniors are aware the federal government does not currently negotiate with drug companies in order to get lower prices on prescription drugs for people with Medicare. A policy proposal that has been around for years, this idea has gained traction in recent months, with several members of Congress proposing various approaches to allow Medicare to negotiate drug prices. Overall, nearly nine in ten Americans (86 percent) favor allowing this type of negotiation, however, attitudes shift after hearing potential arguments that have been made both in favor and against the proposal. For example, support for Medicare negotiations increases to 91 percent after hearing the argument that this could save seniors money. On the other hand, opposition increases to two-thirds after hearing the opponents’ potential arguments that it could lead to less research. It is important to note that these arguments do not include specific details about different approaches to negotiation, including the extent to which they would protect access to needed medications, details which may influence the public’s attitudes.
Figure 6: Support For Federal Government Prescription Drug Negotiations Varies After Hearing Arguments
Seniors’ opinions on allowing the federal government to negotiate with drug companies to get a lower price on medicines for people with Medicare can drop even lower than the public overall after hearing potential arguments.
Table 2: Seniors’ Attitudes Towards Allowing Federal Government Negotiations for Medicare Prescription Drug Prices Drop Significantly After Hearing Arguments Against Such Proposal
Percent of seniors who favor or oppose the federal government negotiating with prescription drug companies in order to get a lower price on prescription drugs for people on Medicare after hearing the following:
Favor
Oppose
It could lead to seniors saving money on their prescription drugs
87%
11%
Medicare could save the federal government money by paying less for prescription drugs
75
22
Experts say these types of negotiations won’t be effective at keeping drug costs down
42
50
It could lead to less research and development of new drugs
30
65
Medicare might not cover some prescription drugs
22
72
People’s Experiences With Prescription Drug Costs and Plans
In addition to examining public support for proposed legislative changes affecting access and affordability of prescription drugs, this month’s poll also tracks people’s experiences with prescription drugs and their prescription drug plans.
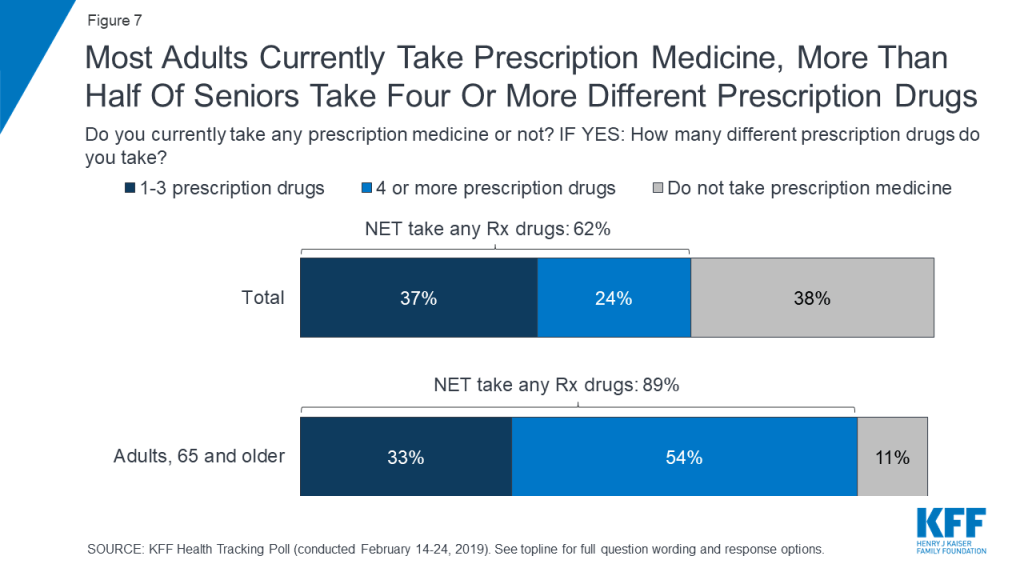
The issue of prescription drug costs is personal to many Americans with six in ten (62 percent) saying they currently take prescription medicine, including one-fourth (24 percent) who currently take four or more prescription drugs. The share who say they currently take a prescription drug has increased slightly in KFF tracking polls over the past 5 years, which is consistent with other data showing a gradual increase in the share of Americans who take prescription drugs.3 Nine in ten seniors (89 percent) report currently taking prescription medicine, including more than half (54 percent) who report taking four or more.
Figure 7: Most Adults Currently Take Prescription Medicine, More Than Half Of Seniors Take Four Or More Different Prescription Drugs
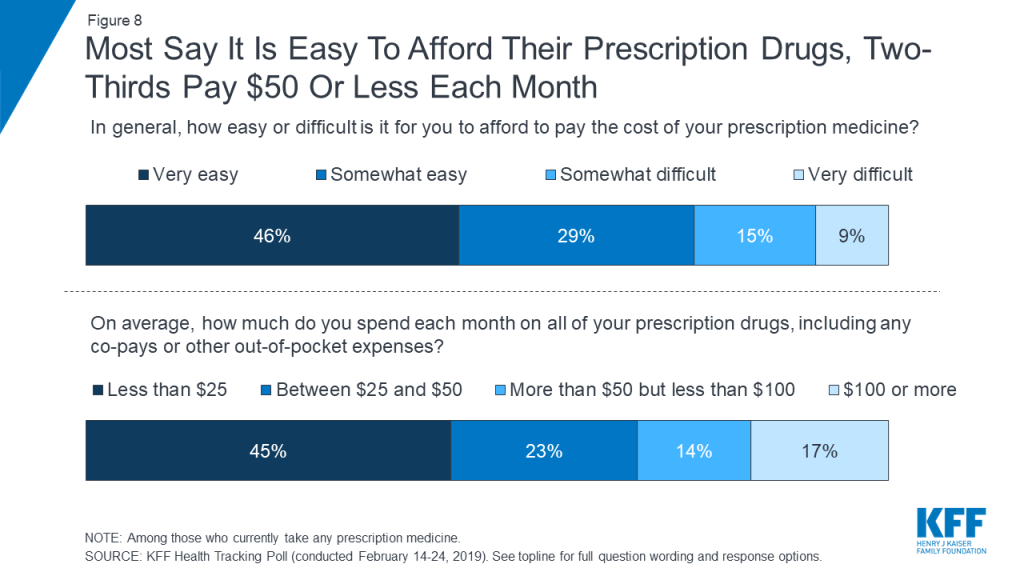
Most people who take prescription drugs report that affording their prescriptions isn’t a burden, which could be due to the fact that for most people taking medications, insurance covers much of their costs. Three-fourths report that it is either “very easy” (46 percent) or “somewhat easy” (29 percent) for them to pay the cost of their prescription medicine. In addition, nearly half say they spend less than $25 each month on all of their prescription drugs, including any co-pays or other out-of-pocket expenses.
Figure 8: Most Say It Is Easy To Afford Their Prescription Drugs, Two-Thirds Pay $50 Or Less Each Month
Most seniors (75 percent) also say affording their prescription drugs is either “very easy” (42 percent) or “somewhat easy” (33 percent). Even a majority of seniors who are taking four or more prescription drugs say affording their prescriptions is easy. Overall, 16 percent of seniors say they are spending $100 or more a month on their prescriptions.
Who Struggles With Prescription Drug Costs?
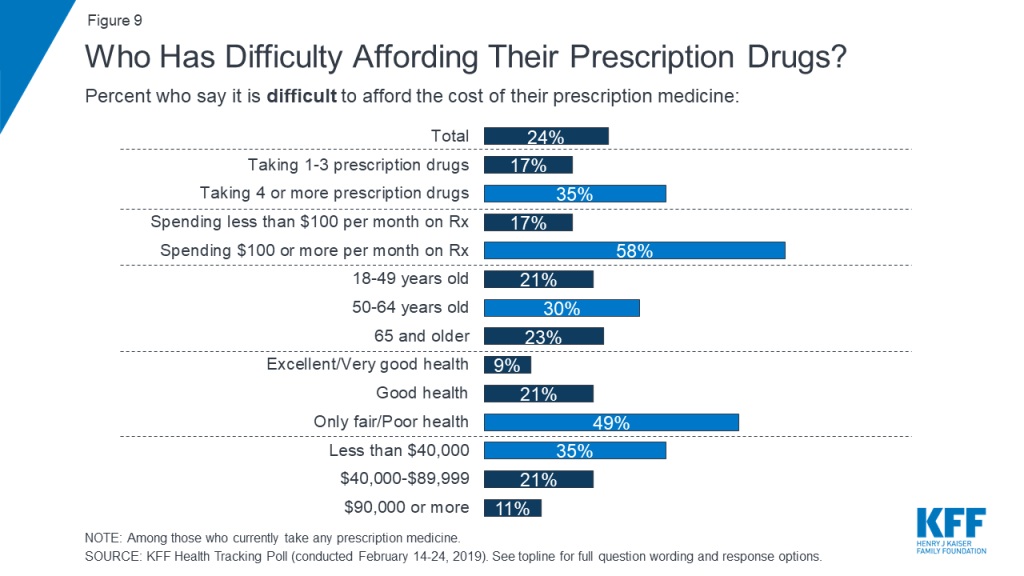
Among those currently taking prescription drugs, about one-fourth (24 percent) and a similar share of seniors (23 percent) say it is difficult to afford their prescription drugs, including one in ten saying it is “very difficult.” Three in ten adults ages 50 to 64 report having difficulty affording their prescription medicines (30 percent) compared to about one-fourth of those ages 65 and over with Medicare (23 percent) and one-fifth of those under the age of 50 (21 percent), who take fewer drugs on a regular basis. This group, adults ages 50 to 64, is not yet eligible for Medicare but is more likely to be taking more prescription medicines than other non-Medicare eligible populations.
Who has the most difficulty affording prescription drugs? The most affected groups include people in fair or poor health, with low incomes, or taking at least 4 drugs monthly
Certain groups are much more likely to report difficulty affording medication, including those who are spending $100 or more a month on their prescriptions (58 percent), those who report being in fair or poor health (49 percent), those who take four or more prescription drugs (35 percent), and those earning less than $40,000 annually (35 percent).
Figure 9: Who Has Difficulty Affording Their Prescription Drugs?
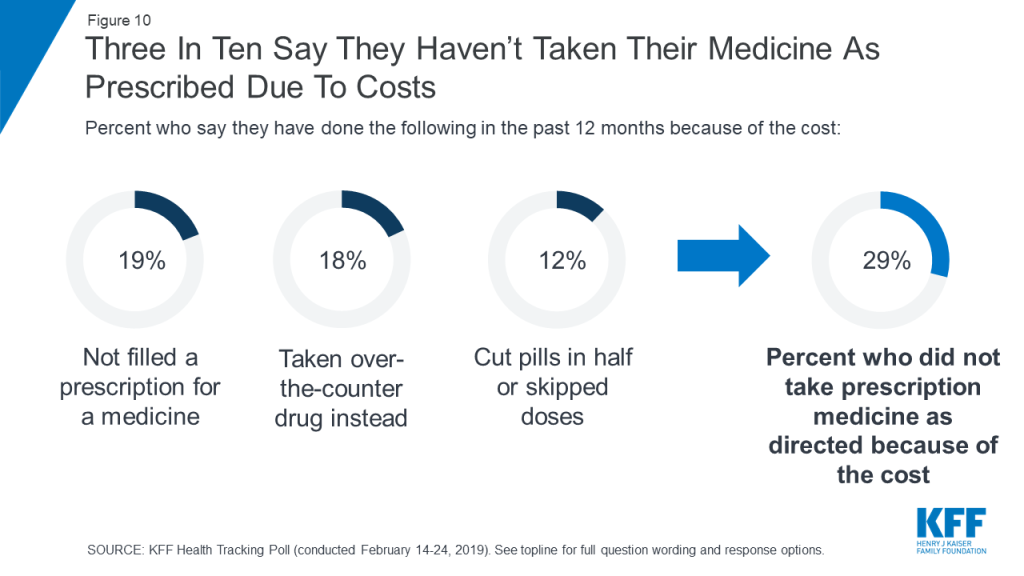
About three in ten of all adults (29 percent) report not taking their medicines as prescribed at some point in the past year because of the cost. This includes about one in five who report that they haven’t filled a prescription (19 percent of total) or took an over-the counter drug instead (18 percent of total), and about one in ten who say they have cut pills in half or skipped a dose.
In addition, three in ten (29 percent) of those who report not taking their medicines as prescribed say their condition got worse as a result of not taking their prescription as recommended (eight percent of total).
Figure 10: Three In Ten Say They Haven’t Taken Their Medicine As Prescribed Due To Costs
Individuals who report difficulty affording their prescription drug costs are more likely than their counterparts to report not taking their medicines as prescribed due to cost (58 percent vs. 17 percent). Among this group, one-quarter (27 percent) say their condition got worse as a result of skimping on medications because of the cost.
Table 3. Six in Ten Of Those Who Report Difficulty Affording Prescription Drugs Report Not Taking Their Medication As Prescribed
Percent who say they have done the following in the past 12 months because of the cost:
Total
Those Who Report Difficulty Affording Their Prescription Drugs
Those Who Report No Difficulty Affording Their Prescription Drugs
Not filled a prescription for a medicine
19%
41%
11%
Taken an over-the-counter drug instead
18
29
9
Cut pills in half or skipped a dose
12
35
6
Did any of the above
29
58
17
Condition got worse
8
27
5
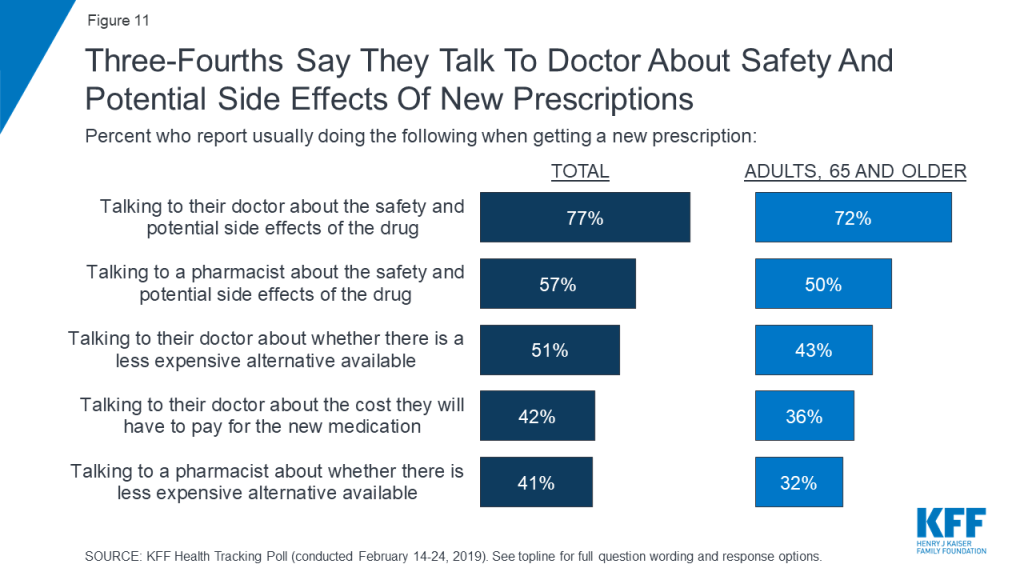
Majorities say they usually talk to their doctor and a pharmacist about the safety and potential side effects of a newly prescribed drug (77 percent and 57 percent, respectively) compared to fewer who report usually talking to their doctor or pharmacist about cheaper alternatives (51 percent and 41 percent, respectively). Four in ten (42 percent) report usually talking to their doctor about the cost of a newly prescribed drug.
Figure 11: Three-Fourths Say They Talk To Doctor About Safety And Potential Side Effects Of New Prescriptions
A smaller share of seniors report talking to their pharmacist or doctor about the safety, side effects, and cost of their prescription drugs as well as whether there are less expensive alternatives available.
Prescription Drug Plans
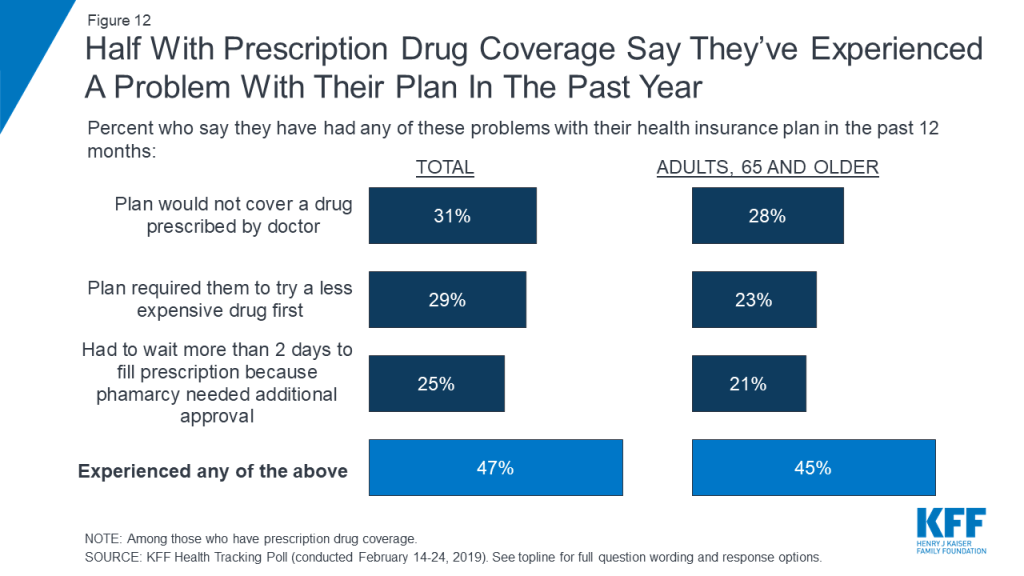
More commonly reported than problems affording prescription drugs are issues with prescription drug plans. Nearly half of those with health insurance that helps them pay for their prescription drugs say they experienced at least one of the following problems with their health insurance plan: they were told that their plan wouldn’t cover a drug prescribed to them (31 percent); required to try a less expensive drug first (29 percent); or had to wait more than two days to get their prescription filled (25 percent).
Figure 12: Half With Prescription Drug Coverage Say They’ve Experienced A Problem With Their Plan In The Past Year
Nearly half (45 percent) of seniors with prescription drug coverage also say they have experienced a problem with their plan with three in ten reporting they have had their plan not cover one of their prescriptions (28 percent). Slightly fewer report having to try a less expensive alternative first (23 percent) or having to wait more than two days to get their prescription filled (21 percent).
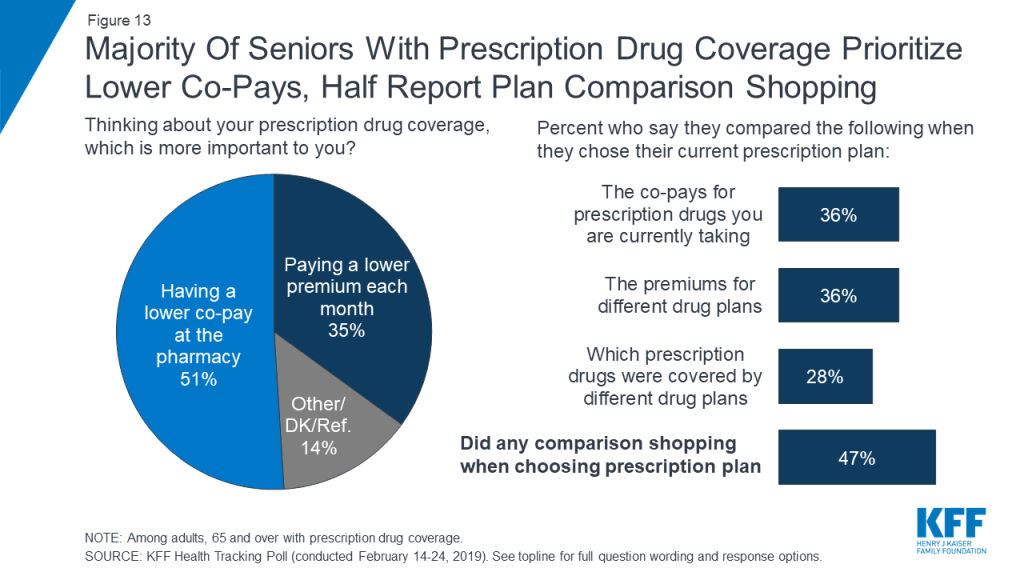
When choosing a prescription drug plan, a larger share of seniors report that it is more important to them to have a lower co-pay at the pharmacy when they get their prescriptions filled (51 percent) than paying a lower premium each month (35 percent). This may be due to the fact that nearly six in ten seniors (55 percent) report taking four or more prescription drugs. Half of seniors (47 percent) report either comparing co-pays (36 percent), premiums (36 percent), or drugs that are covered (28 percent) when choosing their prescription drug plans.
Figure 13: Majority Of Seniors With Prescription Drug Coverage Prioritize Lower Co-Pays, Half Report Plan Comparison Shopping
Methodology
This KFF Health Tracking Poll was designed and analyzed by public opinion researchers at the Kaiser Family Foundation (KFF). The survey was conducted February 14th–24th 2019, among a nationally representative random digit dial telephone sample of 1,440 adults ages 18 and older, living in the United States, including Alaska and Hawaii (note: persons without a telephone could not be included in the random selection process). The sample included 290 respondents reached by calling back respondents that had previously completed an interview on the KFF Tracking poll more than nine months ago. This month’s poll also includes an analysis of older Americans age 65 or older (n=606). To obtain a large enough sample, the sampling frame included an oversample of older adults using cell phones (n=26) and landlines (n=75) as well as callbacks to adults who fit the age criterion using the SSRS Omnibus poll (n=136). To efficiently obtain a sample of lower-income and non-White respondents, the sample also included an oversample of prepaid (pay-as-you-go) telephone numbers (25% of the cell phone sample consisted of prepaid numbers) as well as a subsample of respondents who had previously completed Spanish language interviews on the SSRS Omnibus poll (n=11). Both the random digit dial landline and cell phone samples were provided by Marketing Systems Group (MSG).
Computer-assisted telephone interviews conducted by landline (464) and cell phone (976, including 662 who had no landline telephone) were carried out in English and Spanish by SSRS of Glen Mills, PA. For the landline sample, respondents were selected by asking for the youngest adult male or female currently at home based on a random rotation. If no one of that gender was available, interviewers asked to speak with the youngest adult of the opposite gender. For the cell phone sample, interviews were conducted with the adult who answered the phone. KFF paid for all costs associated with the survey with additional funding for the over-sample provided by the John Hopkins’ Bloomberg School of Public Health.
The combined landline and cell phone sample was weighted to balance the sample demographics to match estimates for the national population using data from the Census Bureau’s 2017 American Community Survey (ACS) on sex, age, education, race, Hispanic origin, and region along with data from the 2010 Census on population density. The sample was also weighted to match current patterns of telephone use using data from the January-June 2018 National Health Interview Survey. The weight takes into account the fact that respondents with both a landline and cell phone have a higher probability of selection in the combined sample and also adjusts for the household size for the landline sample, and design modifications, namely, the oversampling of prepaid cell phones and likelihood of non-response for the re-contacted sample. To ensure accurate representation of the older population, the data were weighted separately for those younger than 65 and those 65 or older. All statistical tests of significance account for the effect of weighting.
The margin of sampling error including the design effect for the full sample is plus or minus 3 percentage points. Numbers of respondents and margins of sampling error for key subgroups are shown in the table below. For results based on other subgroups, the margin of sampling error may be higher. Sample sizes and margins of sampling error for other subgroups are available by request. Note that sampling error is only one of many potential sources of error in this or any other public opinion poll. Kaiser Family Foundation public opinion and survey research is a charter member of the Transparency Initiative of the American Association for Public Opinion Research.
Group
N (unweighted)
M.O.S.E.
Total
1,440
±3 percentage points
Adults who currently take prescription medicine
1030
±4 percentage points
Adults with prescription drug plans
1092
±4 percentage points
Democrats
473
±6 percentage points
Republicans
410
±6 percentage points
Independents
397
±6 percentage points
Adults, 65 and older
606
±5 percentage points
Adults, 65 or older, with prescription drug plan
513
±5 percentage points
Endnotes
In 2018 President Trump announced his prescription drug plan titled “American Patients First,” which included the proposal to require drug manufacturers to publish list prices for their prescription drugs in television advertisements. KFF Health Tracking Polls consistently find a majority of the public – including a majority of Democrats, independents, and Republicans, have supported this policy proposal. ↩︎
On Feb. 22, the Department of Health and Human Services released the final rule regarding use of Title X federal funds for family planning clinics, which serve approximately 4 million people nationwide. These final regulations, slated to be published in the Federal Register on March 4, are very similar to what HHS proposed in November 2018. Nearly 4,000 clinics across the country participated in Title X as of 2017, and an average of 19% of their revenue for family planning services came from these federal funds. For further context, we asked Alina Salganicoff, Vice President and Director of Women’s Health Policy at KFF, three questions about the impact and implications of these final rules for the women and the Title X clinics that serve them.
1. What are the major elements of this final rule?
Salganicoff: While the Title X program has always prohibited federal funds from being used for abortion, the prior regulations permitted family planning clinics that provide or refer for abortion to participate, as long as no Title X funds were used for abortion. This final rule significantly alters the Title X program. The Trump Administration’s final regulation now blocks any clinic that provides or even refers a patient for an abortion at another facility from receiving any Title X funds. These clinics can also no longer qualify for funds to provide low-income women with comprehensive family planning and other preventive services such as breast exams, pap smears, cervical cancer screening, and STI testing. This final rule disqualifies Planned Parenthood sites and clinics that provide abortion services, as well as those that refer patients elsewhere for abortion services.
The regulation also removes the requirement that Title X clinics offer pregnancy options counseling to pregnant women that includes abortion, adoption, and prenatal care referrals. While these final regulations require grantees to offer “a broad range of acceptable and effective family planning methods and services” — including some but not all contraceptives — it promotes the participation of organizations that offer natural family planning or abstinence in the Title X program.
2. How are these regulations likely to affect the health and care of women who seek services in clinics that receive Title X funds?
Salganicoff: There is no doubt that the regulations will affect access for low-income and uninsured women that rely on Title X clinics in a number of ways. First, the network of providers that participate in Title X will shrink, because Planned Parenthood clinics and other family planning providers that refer for or offer abortion services will be effectively disqualified from the federal program funding. In certain communities, women may no longer have a Title X provider that can offer them the full range of contraceptive methods in a timely fashion. Because of this loss of federal funds, some of the clinics may close, and others will have to lay off staff and reduce hours. This all can affect women’s access to care and place them at risk for unintended pregnancies or untreated STIs. Some women may find they will have to wait many days or weeks for a time sensitive appointment, or they may find that the most effective family planning or contraceptive method of their choice is not available to them.
For pregnant women seeking abortions, Title X-funded clinics will not be permitted to offer women direct referrals for abortion and definitely not to any providers that specialize in abortion care. If a Title X clinic decides to offer non-directive pregnancy options counseling that includes abortion (which will cease to be a requirement), then the only information their patients could potentially receive is a list of providers that offer comprehensive primary health care services and prenatal care. The list may include some providers that also offer abortion services, but it cannot specify which providers offer abortion services, nor are clinic staff permitted to identify the abortion providers.
Imagine going to the doctor and needing time-sensitive follow-up care, but then being handed a list that includes some providers who can treat your condition and others who cannot. Meanwhile, the very specialists who provide the best quality care for the service you need are completely omitted from the list. This is not the standard used in any other medical setting when patients are referred for follow-up services.
3. What’s likely to happen to the clinics that currently receive these funds when these requirements go into effect?
Salganicoff: This is still unclear. The current funding cycle under the prior regulation ends March 31, and new grants are scheduled to begin April 1. Organizations submitted their grant applications in January. But many will no longer qualify for Title X or may withdraw from the program entirely, because the regulations would require them to violate their missions or medical standards of care by withholding information from patients about where to seek the highest quality services.
Several family planning organizations and state attorneys general have already publicly stated their intent to sue to block the implementation of these regulations. When a similar regulation was issued by the Reagan Administration, it was challenged by family planning providers and made it all the way to the Supreme Court. In Rust v. Sullivan, the Supreme Court upheld the Administration’s right to restrict the types of providers that participate in the federal program and ban abortion referrals. The regulation was never fully implemented. President Clinton issued a new regulation soon after he was sworn in. I wouldn’t be surprised to see these cases make their way through the Federal Courts and even end up back at the Supreme Court.
State approaches to adopting the Affordable Care Act’s Medicaid expansion have varied greatly by state based on state law, the political context, or other factors. While it does not cover how every state has enacted the Medicaid expansion, this issue brief highlights some of the different approaches states have taken to adopting the Medicaid expansion initially and how those approaches may have changed over time.
Initial Adoption of the ACA Medicaid Expansion. Each state’s circumstances are unique, and the actions taken by one state may not apply to another state’s circumstances; however, initial state approaches to adopting the Medicaid expansion generally fall into four broad categories:
Adoption Through the Standard Legislative Process. Many expansion states have adopted the Medicaid expansion through the standard legislative process – legislation was passed authorizing the Medicaid expansion (either in a stand-alone bill or as part of budget legislation) – and expansion was implemented under SPA authority.
Adoption Through the Standard Legislative Process with a Section 1115 Waiver to Modify the Traditional Expansion Program. While Section 1115 waivers require additional steps to obtain federal approval, the legislative process to initially adopt the expansion remains largely the same at the state level. Some states have expanded coverage through a SPA and implemented non-traditional expansion program elements through a waiver simultaneously. However, other states adopted expansion through a two-step process, first implementing a traditional expansion program under a SPA while taking additional time to develop, negotiate the terms of, and prepare for implementation of a Section 1115 waiver.
Adoption Through Executive Action. Initial enactment of the expansion has involved the legislature in most expansion states, but some governors have adopted the expansion through executive action without approval of the legislature. Other states, however, have enacted laws prohibiting Medicaid expansion without legislative approval.
Adoption Through a Ballot Initiative. Multiple states have adopted the Medicaid expansion through a ballot initiative. However, voter-approved ballot measures may face barriers to implementation based on state law requirements, efforts to block or amend the policies by legislators or governors, or legal challenges. Some states have sought to use ballot initiatives to secure or reject new funding sources for the state share of Medicaid expansion costs.
Changes in Expansion Status and/or Approach Over Time. When considering states’ approaches to expansion, it is important to keep in mind that these approaches are not static and may change over time in response to elections, new policy options, or other factors. Some states’ expansion programs have evolved over time at the direction of the state legislature or based on requirements included in the original legislation adopting the expansion. In addition, some states (including those that did not initially implement the expansion with program changes through a waiver) have used or are seeking waivers to make program changes that affect the expansion population such as adding work requirements as a condition of eligibility for coverage. Financing for the state share of expansion costs has been a major factor in the decision about expansion adoption in many states, and some states have tied expansion adoption or continuation to specific funding mechanisms for the state share of expansion costs.
Looking Ahead. Looking ahead, it will be important to monitor debates on expansion in the 14 remaining non-expansion states, monitor any potential changes to expansion programs in states that have already adopted the expansion (including developments in states that adopted expansion through a ballot initiative), and assess the advantages and disadvantages associated with different approaches with regard to coverage, cost, and administrative capacity.
Issue Brief
Introduction
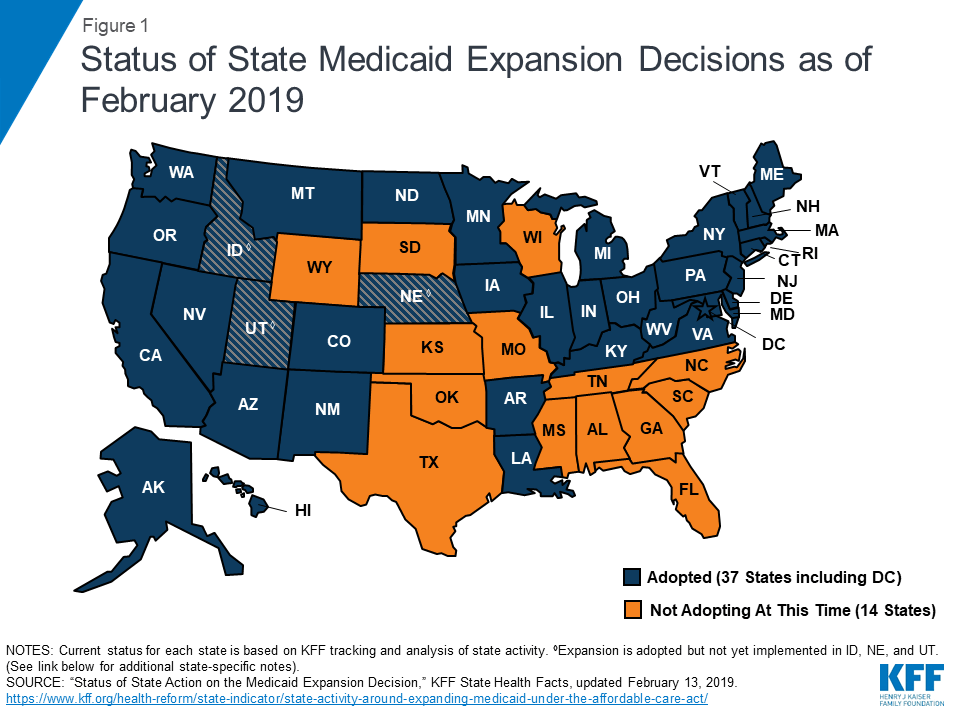
As enacted, the Affordable Care Act (ACA) broadened Medicaid’s role, making it the foundation of coverage for nearly all low-income Americans with incomes up to 138% of the federal poverty level (FPL) ($17,236 per year for an individual in 2019).1 However, the Supreme Court ruling on the ACA’s constitutionality effectively made the decision to implement the Medicaid expansion an option for states. For those that expanded, the federal government paid 100% of Medicaid costs of those newly eligible for coverage from 2014 to 2016. The federal share is gradually phasing down to 90% in 2020 (where it will remain in later years), still well above traditional federal medical assistance percentage (FMAP) rates. As of February 2019, 37 states (including the District of Columbia) have adopted the Medicaid expansion2 (Figure 1). States’ initial approaches to adopting the Medicaid expansion have varied greatly by state based on state law, the political context, or other factors. While it does not cover how every state has enacted the Medicaid expansion, this issue brief highlights some of the different actions states have taken in response to the Medicaid expansion option. Each state’s circumstances are unique; the actions taken by one state may not apply to another state’s circumstances.
Figure 1: Status of State Medicaid Expansion Decisions as of February 2019
Overview of the Initial Processes Required to Adopt the Medicaid Expansion
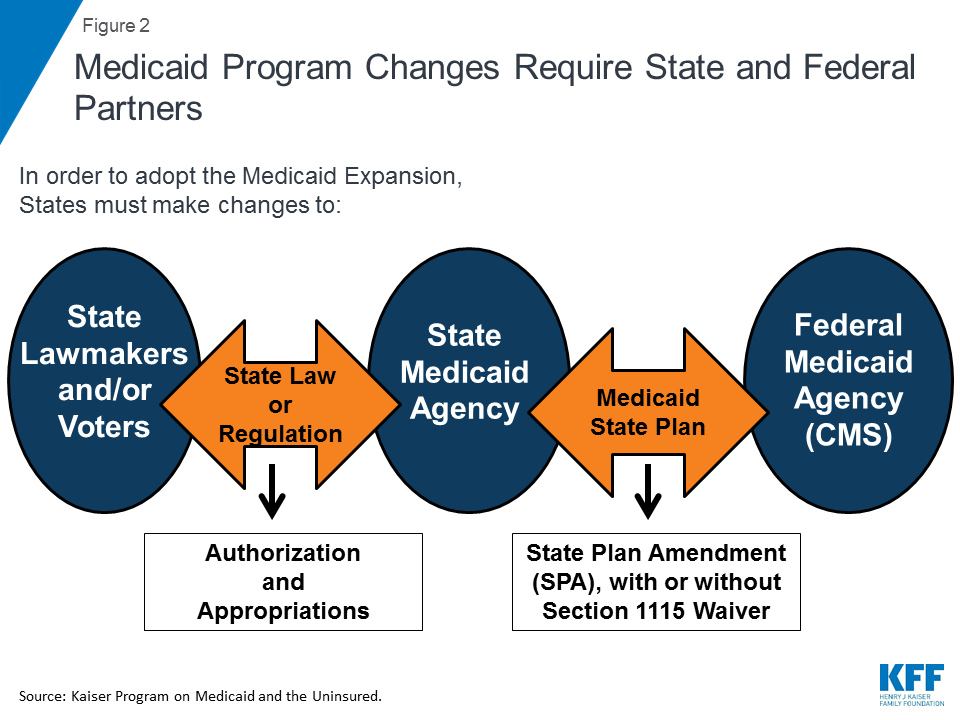
Medicaid is a jointly-operated program; state Medicaid agencies must work with federal partners to adopt the Medicaid expansion. The relationship between the state Medicaid agencies and the Centers for Medicare and Medicaid Services (CMS), the federal agency administering the Medicaid program, is governed by a document called a Medicaid state plan. A Medicaid state plan describes how each state will operate its program, which is submitted to and approved by CMS. To make a change in its Medicaid program, the state Medicaid agency must submit and receive CMS approval of either a state plan amendment (SPA), which is used to make program changes that are allowed under current law, or a waiver request, which is a negotiated agreement involving changes to the operation of the state’s program that are not otherwise allowed under federal Medicaid law3 (Figure 2). However, all states are required to use a SPA to implement ACA expansion coverage, regardless of whether they also are seeking or have approval to make changes to the traditional expansion program under a Section 1115 waiver. Out of the 37 states that have adopted the expansion as of February 2019, eight states4 are currently using Section 1115 waiver authority to implement expansion programs in ways not otherwise permitted under federal law, and three states have adopted but not yet implemented the expansion (Idaho, Nebraska, and Utah). Kentucky is not yet included in the count of states implementing non-traditional Medicaid expansion programs under Section 1115 waiver authority, but the state has CMS approval to implement Section 1115 waiver changes affecting the expansion population later in 2019.5
Figure 2: Medicaid Program Changes Require State and Federal Partners
However, before working with federal partners, state Medicaid agencies often must work with state lawmakers to obtain authorization and appropriations before implementing the Medicaid expansion (Figure 2). In order to make changes to Medicaid policy, such as expanding eligibility under the Medicaid expansion, most states must work with lawmakers (governors and/or legislatures) to make changes to either state laws and/or state regulations. While some states allow voters to authorize Medicaid program changes through ballot initiatives, lawmakers may still have significant influence over the final changes depending on variations in state law, including whether state law includes any restrictions on the legislature’s ability to amend or appeal the citizen initiatives after passage.6,7
Each state has different rules about which kinds of Medicaid policy changes, if any, can be authorized through changes in regulation (and therefore by agencies at the direction of the governor) or must be made through changes to state statute (and therefore require legislative approval or voter approval of a ballot initiative, if permitted in the state). For example, some states require state legislative action before state plan amendments or Section 1115 waiver requests can be submitted by the state Medicaid agency to CMS for federal approval, and others do not. States also vary on whether legislative action is required to authorize changes to Medicaid benefits, cost-sharing, and other types of Medicaid policy changes.8 This varies, at least in part, on how the Medicaid program was incorporated into state statute when the state originally enacted the program decades ago and the changes to rules and regulations enacted in the years since. In addition to authorization, state Medicaid agencies must also work with state lawmakers to obtain appropriations to fund the Medicaid policy change(s). Some states require legislative action to appropriate federal dollars as well as state dollars; others do not.
State Approaches to Medicaid Expansion Adoption
States’ initial approaches to Medicaid expansion adoption have varied greatly by state based on state law, the political context, or other factors. However, these approaches generally fall into four broad categories: adoption through the standard legislative process, adoption through the standard legislative process with a Section 1115 waiver to modify the traditional expansion program, adoption through executive action, and adoption through a ballot initiative. The following sections walk through each of these four categories, providing state examples and discussing the benefits and challenges associated with each approach. While states’ approaches may evolve over time and many states have made changes to their expansion programs post-implementation, the sections below focus primarily on the initial approaches states have taken to adopt the expansion.
Adoption Through the Standard Legislative Process
Many of the states that have adopted the Medicaid expansion have done so initially through the standard legislative process – legislation was passed authorizing the Medicaid expansion (either in a stand-alone bill or as part of budget legislation) – and expansion was implemented under SPA authority. For example, Minnesota9 and Maryland10 passed legislation during their 2013 regular legislative sessions to enact the Medicaid expansion. Other states, such as New York11 and New Mexico,12 included the Medicaid expansion as part of budget bills passed in 2013. In each of these states, the governor and legislature supported the Medicaid expansion. The standard legislative process has also worked in some states where adopting the Medicaid expansion was initially supported by one branch but not the other. For example, in Arizona, Governor Brewer strongly supported adopting the Medicaid expansion while the state legislature initially was hesitant; after lobbying legislators and building public support, legislators passed the state’s budget with the Medicaid expansion.13
Adoption Through the Standard Legislative Process with a Section 1115 Waiver to Modify the Traditional Expansion Program
While Section 1115 waivers require additional steps to obtain federal approval, the legislative process remains largely the same at the state level. The majority of states that have adopted the Medicaid expansion to date have done so within federal rules and options to receive the associated enhanced federal matching funds for newly eligible individuals. All states are required to use a SPA to implement ACA Medicaid expansion coverage, however, some states have obtained approval through Section 1115 waivers to implement the expansion in ways that extend beyond the flexibility provided by the law.14 While Section 1115 waivers require additional steps to obtain federal approval, the process may be largely the same at the state level, as if the state were not seeking expansion program changes through a waiver. For example, lawmakers in Iowa,15 Michigan,16 and Montana17 approved legislation adopting the Medicaid expansion through their standard legislative processes. While the legislation outlined their alternative Medicaid expansion requests and conditioned approval on federal waiver approval within a set timeframe, the legislatures delegated development and submission of the final waiver proposal to the state Medicaid agencies. While each Medicaid expansion waiver is unique, some states have included common elements such as a “premium assistance” model in which the state uses federal Medicaid funds to purchase Marketplace coverage for enrollees or other private coverage; enrollee premiums; elimination of the non-emergency medical transportation benefit, which is otherwise required under Medicaid; and use of “healthy behavior incentives” to reduce enrollee premiums and/or copayments.18 In some states, Section 1115 expansion waiver programs have changed over time, as discussed in the “additional considerations” section below.
Some states have implemented the expansion through a two-step process, first implementing a traditional expansion program under a SPA while separately seeking approval for expansion program changes through a waiver, to be implemented at a later date. In contrast to the approach of states like Arkansas and Indiana that simultaneously implemented expansion coverage under a SPA and non-traditional expansion program elements under a Section 1115 waiver, the two-step sequential approach allows states to quickly implement expanded coverage while taking additional time to develop, negotiate the terms of, and prepare for implementation of the desired Section 1115 waiver. For example, New Hampshire implemented the expansion through SPA authority in August 2014; however, authorizing legislation19 required the state to obtain Section 1115 waiver authority to operate the expansion in a way that differed from the standard approach permitted under federal law. CMS approved New Hampshire’s waiver request in March 2015, and the state then transitioned the expansion program to a Marketplace premium assistance model under the waiver authority in January 2016. Virginia took a similar two-step approach to expansion when they adopted it as part of the FY 2019-2020 budget that Governor Northam signed into law in June 2018.20 This legislation authorized the state Medicaid agency to implement expansion group coverage through a SPA and separately submit a waiver application seeking CMS approval for other new program elements that require waiver authority. New expansion coverage became effective in Virginia under a SPA in January 2019, and the state is currently negotiating the terms of a waiver request (with provisions applying to both expansion and traditional Medicaid populations) that they submitted in November 2018.21 This two-step approach enables the state to make coverage available more quickly while taking additional time needed to develop, negotiate, and implement more complex policies through a waiver.
Adoption Through Executive Action
While enactment of the expansion has involved the legislature in most expansion states, some governors have adopted the expansion through executive action without approval of the legislature. For example, in May 2013, former Democratic Governor Beshear of Kentucky and former Democratic Governor Tomblin of West Virginia adopted the expansion through executive orders. Expansion was also initially adopted without approval from the legislature in Pennsylvania. Former Republican Governor Corbett negotiated a Section 1115 waiver to implement the Medicaid expansion with CMS that was approved in August 2014, and implemented on January 1, 2015.22,23 Former Independent Governor Walker of Alaska took a similar approach after he was unable to persuade the Alaska Legislature to adopt the expansion in early 2015 (he took office in December 2014). Governor Walker announced his intent to expand through executive action on July 16, 2015, and expanded coverage became effective in Alaska on September 1, 2015.24 The most recent state to adopt the expansion through executive action was Louisiana. Democratic Governor Edwards issued an executive order25 to expand on his second day in office (January 12, 2016); expanded coverage became effective on July 1, 2016. Some expansions through executive action, including those in Kentucky26,27 and Alaska,28 have faced court challenges.
Former Republican Governor Kasich of Ohio adopted the expansion without support from the full Legislature by attaining approval to use federal expansion funds from a seven-member legislative panel. In October 2013, former Governor Kasich of Ohio secured support from the Legislature’s Controlling Board, a bipartisan legislative panel, to use available federal funds to expand Medicaid. This panel’s support allowed him to expand without approval from the full Legislature, which had consistently refused to authorize the expansion in previous months. Ohio law requires that money must be formally appropriated before it can be spent, and this is typically done through a vote of the General Assembly, but the Controlling Board also has the authority to adjust appropriations.29 This approach to expansion in Ohio faced a court challenge but was ultimately upheld.30
Some states have enacted laws prohibiting Medicaid expansion without legislative approval. While most states have adopted the Medicaid expansion after agreement has been reached between governors and state legislatures, some legislatures have sought to ensure that legislative approval is required before adoption of the Medicaid expansion can take effect. In March 2013, former Governor McCrory of North Carolina signed legislation that prevented any department, agency or institution of the state from expanding eligibility under the ACA Medicaid expansion in North Carolina unless directed to do so by the General Assembly.31 Similar stand-alone legislation was also passed in states such as Georgia,32 Tennessee,33 and Kansas.34 Legislatures in other states, such as Virginia, have included language requiring legislative approval before implementing the Medicaid expansion in state budgets.35
Most recently, Republican legislators in Wisconsin passed and outgoing Republican Governor Walker signed legislation during a lame-duck session in December 2018 restricting the executive branch’s authority to make changes to the Medicaid program (this occurred just before the start of new Democratic Governor Evers’ administration in January 2019). The new law effectively prohibits the Wisconsin governor from expanding Medicaid without some involvement from the Legislature.36,37 On January 8, 2019, Governor Evers signed an executive order directing the Department of Health Services to develop a plan to expand Medicaid;38 however, Republican leaders in the Legislature signaled that the Legislature would be unwilling to support it.39
Adoption Through a Ballot Initiative
Multiple states have adopted the Medicaid expansion through a ballot initiative. After former Governor LePage vetoed five Medicaid expansion bills passed by the state’s legislature, Maine voters made their state the first to adopt expansion through a ballot initiative (with 59% of voters’ support)40 in November 2017.41,42 Three additional states adopted expansion through ballot initiatives the following year in November 2018: Idaho43 (supported by 61% of voters),44 Nebraska45 (supported by 54% of voters),46 and Utah47 (supported by 53% of voters).48 Previous attempts by Medicaid expansion supporters to fully expand coverage to 138% FPL through the regular legislative process in all of these states were unsuccessful. Additional states are likely to attempt to adopt expansion through ballot initiatives in 2020. The Fairness Project, a key group that supported successful 2018 expansion ballot initiatives, is considering mounting similar ballot initiative campaigns in Florida, Mississippi, Missouri, Oklahoma, South Dakota, and/or Wyoming.49 These six states are the only non-expansion states as of February 2019 in which citizens can initiate a public vote on the expansion issue.50
Voter-approved ballot measures may face barriers to implementation based on state law requirements, efforts to block or amend the policies by legislators or governors, or legal challenges. Although the ballot initiative process may offer a path to expansion adoption in states where legislators or governors are unwilling to support it, experiences in Maine, Idaho, and Utah demonstrate that voter-approved measures may not be implemented quickly or as written without significant changes. Idaho and Utah are among 11 states (out of the 21 states that allow state laws to be adopted via a ballot initiative process) that have no restrictions on how soon or with what majority state legislators can repeal or amend initiated statutes.51
As a result, lawmakers in Utah passed legislation52 on February 11, 2019 that makes significant changes to the approach to expansion approved by voters. Utah voters approved a full expansion to 138% FPL, an April 1, 2019 implementation date, and a sales tax increase funding mechanism for the state’s share of expansion costs.53 However, the new legislation directs the Utah Department of Health to request Section 1115 waiver authority to make a number of changes including to use ACA enhanced federal matching funds for a partial expansion to 100% FPL, to add a work requirement as a condition of eligibility, to cap enrollment in expansion coverage, and to incorporate a per capita cap on federal reimbursement. Initially, the state may seek a waiver to implement a partial expansion to 100% FPL with capped enrollment at the regular state match rate.54 Enrollment caps for the expansion population and partial expansion with enhanced federal matching funds are policies that CMS has not approved in any other state to date.55
Lawmakers in Idaho are also considering a bill that would make changes to the expansion program approved by voters, including a “trigger provision” ending the expansion program if federal funding levels for the expansion population drop below a 90% match rate and a provision directing the Idaho Department of Health and Welfare to apply for a Section 1115 waiver to implement a marketplace premium assistance program for expansion enrollees with incomes above 100% FPL.56
Maine’s experience in the year following approval of the expansion ballot measure demonstrates the potential for an unsupportive governor to delay or restrict implementation. The expansion measure passed by voters included specific requirements for the dates by which the state must submit a SPA and implement the expansion. However, former Republican Governor LePage delayed and refused to implement the expansion throughout the rest of his time in office.57 Expansion coverage was ultimately implemented in January 2019, after new Democratic Governor Mills signed an executive order on her first day in office directing the Maine Department of Health and Human Services to begin expansion implementation and provide coverage to those eligible retroactive to July 2018.58
Approved ballot measures may also face legal challenges with the potential to delay or block implementation. In Idaho, a conservative think tank opposed to expansion (the Idaho Freedom Foundation) filed a lawsuit asking the Idaho Supreme Court to declare the expansion under Proposition 2 unconstitutional for delegating too much power to the federal government and the state Department of Health and Welfare.59 However, on February 5, 2019, the Idaho Supreme Court upheld the Medicaid expansion and dismissed the lawsuit.60
Some states have sought to use ballot initiatives to secure or reject new funding sources for the state share of Medicaid expansion costs. For example, in Montana, a measure on the November 2018 ballot would have extended the state’s existing Medicaid expansion program beyond the current June 30, 2019 sunset date and raised taxes on tobacco products to finance the state’s share of expansion costs.61 However, Montanans voted the measure down after tobacco industry spent over $17 million on television advertisements and other efforts to defeat the measure.62 As of February 2019, the Montana Legislature is debating different proposals to extend the program beyond the sunset date, with Republicans pushing to add work requirements or other changes to the program. Unlike Montana, which sought to approve a new expansion funding source using a ballot initiative, Republican lawmakers in Oregon attempted to use a veto referendum to repeal provisions of a law passed by the legislature and signed into law by the governor in 2017 that increased assessments on hospitals and insurers to help fund the state’s share of expansion costs.63 The effort to repeal the provisions was ultimately unsuccessful: in January 2018, 62% of Oregonians voted to uphold the expansion funding provisions of the law.64
Additional Considerations Pre- and Post-Expansion Adoption
State approaches to expansion are not static and may change over time in response to elections, new policy options, or other factors. While state approaches to adopting the Medicaid expansion can generally be grouped into the four categories discussed above, state approaches vary widely within each category, and state approaches are not static—a state may change its approach over time in response to elections, new policy options, or other factors. For example, during the Governor Corbett administration, Pennsylvania attained CMS approval for and implemented a Section 1115 Medicaid expansion program. However, Corbett was defeated in the November 2014 election by current Democratic Governor Wolf, who transitioned Pennsylvania’s Medicaid expansion from a waiver program to a traditional (SPA) expansion program shortly after taking office on January 20, 2015.65 Conversely, Kentucky initially adopted the expansion through executive action and a SPA under former Democratic Governor Beshear, but following the election of Republican Governor Bevin, Kentucky has attained CMS approval for a Section 1115 waiver expansion program with new restrictions on expansion coverage (the state intends to implement the waiver later in 2019, however, litigation over the waiver is ongoing).66 Louisiana’s Medicaid expansion experience presents another example of the impact of elections. Former Republican Governor Jindal refused to implement expansion through the end of his term in January 2015, but current Democratic Governor Edwards (who campaigned on expansion) switched the state’s course and adopted it through an executive order on his second day in office.67
Some states’ expansion programs have evolved over time at the direction of the state legislature or based on requirements included in the original legislation adopting the expansion. In Arkansas, the original legislation adopting the expansion mandated that the Arkansas Legislature reauthorize the expansion program annually.68Arkansas’ “private option” approach to Medicaid expansion has undergone multiple modifications since initial implementation in 2014, as a result of decisions during the reauthorization process, requirements in the original expansion legislation, and a gubernatorial transition in 2015 when Republican Governor Hutchinson succeeded former Democratic Governor Beebe.69 In Michigan, the original state legislation authorizing expansion included requirements directing the state to submit waiver and waiver amendment requests at multiple points in time in the years following initial implementation. The legislation specified program elements that were to be included in the waiver and amendment requests, and called for termination of the expansion program if the state failed to obtain CMS approval for these requests.70 After first implementing the expansion under a waiver in 2014, Michigan received approval for a second waiver request in December 2015 and approval for an amendment to the waiver in December 2018.71
Many expansion states, including those that originally implemented traditional expansion programs without a Section 1115 waiver, have used or are seeking Section 1115 waivers to make program changes that affect the expansion population, including adding work requirements as a condition of eligibility for coverage. As of February 2019, nine expansion states have approved or pending Section 1115 waivers that add work requirements as a condition of eligibility for expansion adults. This includes five states that are operating their expansion programs using Section 1115 waivers (Arizona, Arkansas, Indiana, Michigan, and New Hampshire), three states that are currently operating traditional expansion programs without Section 1115 waivers (Kentucky, Ohio, and Virginia; however, Kentucky plans to transition to a Section 1115 waiver expansion program later in 2019), and one state that has adopted but not yet implemented the expansion (Utah). In addition, a number of expansion states have approved or pending waivers that add eligibility and enrollment restrictions or benefit, copay, and/or healthy behavior provisions affecting expansion populations.72
Although an increasing number of states are pursuing work requirement waivers following January 2018 CMS guidance signaling a new willingness to consider such proposals (which were never previously approved under Democratic or Republican administrations), other states have taken alternative approaches to supporting work in their Medicaid expansion programs without requiring work as a condition of eligibility. For example, expansion-authorizing legislation in Montana also authorized the state to administer a voluntary workforce development program (known as the HELP-Link program). Following expansion and HELP-Link implementation, labor force participation among low-income Montanans ages 18-64 increased by four to six percentage points relative to the change among the same population in other states or relative to the change among higher-income Montanans.73 Although Louisiana considered multiple work requirement-related bills in 2018, the state ultimately adopted legislation creating a voluntary workforce training and education pilot program for people receiving public benefits (including Medicaid) that went into effect in August 2018.74 Similar voluntary work support programs are also under consideration in Kansas and Idaho as of February 2019.75,76
Expansion adoption through a ballot initiative does not guarantee direct implementation as approved by voters, and this approach may be more prone to challenges prior to implementation than other expansion adoption approaches. Almost all states with ballot initiative processes allow lawmakers to make changes to approved ballot measures without voters’ approval of the changes. Experiences in states that adopted the expansion through a ballot initiative to date suggest that lawmakers in states that were reluctant to expand through the standard legislative process may be interested in making significant changes to the voter-approved expansion programs prior to implementation. Lawmakers recently approved changes that significantly limit the coverage expansion adopted by voters in Utah, and changes to a voter-approved expansion measure are under consideration in Idaho. Expansion approaches adopted through the ballot may also face challenges or delays to implementation from litigation (as occurred in Idaho) or from resistant governors (as occurred in Maine).
Financing for the state’s share of expansion costs has been a major factor in the decision about expansion adoption in many states, and some states have tied expansion adoption or continuation to specific funding mechanisms for the state’s share of expansion costs. Funding for the state share of Medicaid expansion costs has been a major concern among lawmakers and others who are (or have been) reluctant to adopt the Medicaid expansion in their state. As a result, many states have included specific funding mechanisms in the original legislation adopting the expansion. For example, Utah’s expansion ballot measure included a 0.15% increase from 4.70% to 4.85% of the state sales tax (except for groceries) to finance the expansion or Medicaid and CHIP more broadly.77
Montana and Oregon are examples of states that sought to use ballot initiatives to secure or reject new funding sources for the state share of Medicaid expansion costs, as described in the ballot initiatives section above. Arizona’s budget legislation that enacted the expansion called for the implementation of a new hospital provider fee to fund state costs of the Medicaid expansion. This funding mechanism was challenged in court for being a tax, which under Arizona’s constitution, requires two-thirds majority to approve as opposed to the simple majority that approved the legislation. However, the Arizona Supreme Court rejected the challenge in March 2017, ruling that the assessment is legal and that Medicaid expansion could continue.78
In Louisiana, legislators passed a bill that provided a funding mechanism for expansion (allowing hospitals to implement an assessment) several months prior to expansion adoption.79 In response to concern about possible changes to federal expansion funding levels from those currently provided and specified in the ACA, a number of states have included “trigger provisions” in their expansion legislation that would end the expansion program if federal funding levels change.80
Conclusion
State approaches to adopting the Medicaid expansion have varied greatly by state based on state law, the political context, or other factors. Many states initially adopted the Medicaid expansion through the standard legislative process after gaining the support of both the administrative and legislative branches of state government, including states that implemented traditional expansion programs and those that implemented expansion programs in ways not otherwise permitted under federal law using a Section 1115 waiver. Other states initially adopted expansion through executive authority or a ballot initiative; however, the legislature may still play a role in the expansion adoption process depending on the approach and state law. Each state’s circumstances are unique; the actions taken by one state may not apply to another state’s circumstances. In addition, states’ approaches to expansion are not static and may change over time in response to elections, new policy options, or other factors.
Work requirements are often a major consideration for states debating adopting the expansion or making changes to an existing expansion program, especially following the Trump administration’s willingness to consider Section 1115 “community engagement” proposals that were never approved under previous administrations. While many states have added or are seeking such requirements under Section 1115 waivers, other states are taking an alternative approach by including (or considering) voluntary work support programs for the expansion population without conditioning eligibility on meeting a work hours and reporting requirement. Financing for the state’s share of expansion costs has also been a major consideration for many states in the initial decision about Medicaid expansion adoption and, in some cases, debates over continuation of the expansion program. Looking ahead, it will be important to monitor debates on expansion in the 14 remaining non-expansion states, monitor any potential changes to expansion programs in states that have already adopted the expansion (including potential changes in states that adopted through ballot initiatives), and assess the advantages and disadvantages associated with different approaches with regard to coverage, cost, and administrative capacity.
Endnotes
U.S. Department of Health and Human Services, Office of The Assistant Secretary for Planning and Evaluation, 2019 Poverty Guidelines. https://aspe.hhs.gov/poverty-guidelines↩︎
The eight states using Section 1115 waiver authority to implement expansion programs in ways not otherwise permitted under federal law are Arkansas, Arizona, Indiana, Iowa, Michigan, Montana, New Hampshire, and New Mexico. ↩︎
Only two states (California and Arizona) have voter approval requirements for changes to or the repeal of citizen-initiated state statutes. Both of these states have previously expanded Medicaid. For more information, see:
Ballotpedia, “Legislative Alteration,” (Ballotpedia, accessed February 12, 2019), https://ballotpedia.org/Legislative_alteration#No_restrictions↩︎
H.B. 0228, Maryland General Assembly 2013 Regular Session (enacted 2013.) http://mgaleg.maryland.gov/webmga/frmMain.aspx?pid=billpage&stab=01&id=hb0228&tab=subject3&ys=2013RS.
The House Fiscal and Policy Note for this bill indicates that there is “no legal requirement that Maryland enact legislation to participate in the Medicaid expansion…however, all previous expansions of the Maryland Medicaid program have been done through legislation.”
Department of Legislative Services, Fiscal and Policy Note Revised: Maryland Health Progress Act of 2013 (House Bill 228.) (Maryland General Assembly,) 2013. http://mgaleg.maryland.gov/2013RS/fnotes/bil_0008/hb0228.pdf. ↩︎
Pennsylvania’s expansion program was transitioned from former-Governor Corbett’s Section 1115 expansion program to a SPA expansion program after Governor Wolf took office in 2015. For more detail, see:
Kaiser Family Foundation, Medicaid Expansion in Pennsylvania: Transition from Waiver to Traditional Coverage (Washington, DC: Kaiser Family Foundation, August 2015), https://modern.kff.org/medicaid/fact-sheet/medicaid-expansion-in-pennsylvania/↩︎
In Kentucky, the original executive order adopting the Medicaid expansion under former Governor Beshear was challenged in court as an unlawful delegation of power from the legislature to the executive branch. Eventually, the judge upheld the executive order based on existing state law that gave the Secretary of Health and Family Services authority “to take advantage of all federal funds that may be available for medical assistance…the secretary…may by regulation comply with any requirement that maybe imposed or opportunity that may be presented by federal law.”
David Adams, et al v. Commonwealth of Kentucky et al, No. 13-CI-605 (Franklin Circuit Court – Division 1, September 3, 2013.) http://www.adea.org/uploadedFiles/ADEA/Content_Conversion_Final/policy_advocacy/Documents/emailDist/5PAGES.pdf
Kentucky Revised Statutes (KRS) 205.520 http://www.lrc.ky.gov/Statutes/statute.aspx?id=7700. ↩︎
There is ongoing separate litigation in Kentucky over the Kentucky HEALTH Section 1115 waiver, which includes approval to transition Kentucky’s expansion program from SPA to Section 1115 waiver authority. However, that litigation is unrelated to the fact that Kentucky initially adopted expansion through executive action. For more information, see:
MaryBeth Musumeci, A Guide to the Lawsuit Challenging CMS’s Approval of the Kentucky HEALTH Medicaid Waiver, (Washington, DC: Kaiser Family Foundation, January 2018), https://modern.kff.org/medicaid/issue-brief/a-guide-to-the-lawsuit-challenging-cmss-approval-of-the-kentucky-health-medicaid-waiver/↩︎
In Alaska, lawmakers opposed to the Medicaid expansion filed a lawsuit against former Governor Walker for his decision to expand through executive authority, but the Alaska Supreme Court refused to delay the September 1, 2015 implementation date. The case was then dismissed in Superior Court in March 2016, and lawmakers ultimately dropped their appeal in June 2016.
Associated Press, “Alaska Supreme Court Refuses to Block Medicaid Expansion,” The Wall Street Journal (August 31, 2015), https://www.wsj.com/articles/alaska-supreme-court-wont-block-medicaid-expansion-1441069920
Tegan Hanlon, “Legislative Council Drops Medicaid Lawsuit Against Gov. Walker,” Anchorage Daily News (June 29, 2016), https://www.adn.com/politics/2016/06/29/legislative-council-drops-medicaid-lawsuit-against-gov-walker/↩︎
The Ohio Supreme Court upheld Ohio’s expansion after Republican lawmakers and anti-abortion groups filed a lawsuit against the Ohio Controlling Board for acting contrary to the legislative intent of the General Assembly.
State ex rel. Cleveland Right to Life v. State of Ohio Controlling Bd., 138 Ohio St.3d 57, 2013-Ohio-5632. http://www.supremecourt.ohio.gov/rod/docs/pdf/0/2013/2013-Ohio-5632.pdf↩︎
After a long protracted debate in 2014 over the state’s budget bill around the Medicaid expansion, legislators in Virginia passed a budget bill without appropriations for the Medicaid expansion that also included an amendment, proposed by Senator Stanley, to prevent the governor from implementing the expansion on his own authority without legislative approval. Governor McAuliffe signed the budget legislation, but used his line-item veto authority to remove the Stanley amendment along with other items. However, the Speaker of the House later ruled that the line-item veto of the Stanley amendment was outside the Governor’s authority as it did not delete the entire line item but only a portion; the line item in question related to the appropriation for the state’s entire Medicaid program. After the General Assembly voted and approved other line-items vetoes, the budget became law with the Stanley amendment intact.
Laura Snyder, Kathleen Gifford, Eileen Ellis and Jenna Walls, Putting Medicaid in the Larger Budget Context: An In-Depth Look at Four States in FY 2014 and 2015. (Kaiser Family Foundation,) October 2014. https://modern.kff.org/medicaid/issue-brief/putting-medicaid-in-the-larger-budget-context-an-in-depth-look-at-four-states-in-fy-2014-and-2015/. ↩︎
Specifically, the new law prohibits the Wisconsin Department of Health Services from submitting a Medicaid SPA (or making certain other Medicaid changes) to the federal government if the change has an expected fiscal effect of $7.5 million or more over the 12-month period following the implementation date without submitting the proposed SPA to the Legislature’s Joint Committee on Finance (JCF) for review. If the JCF decides to schedule a meeting to review the proposed SPA, the SPA may only be submitted to the federal government if approved by the committee. The new law also prevents the governor from implementing a Medicaid expansion program waiver (or requesting other types of Medicaid waivers or waiver amendments) without legislation enacted specifically directing the submission of the waiver request. ↩︎
Four states have restrictions on how soon state legislators can repeal or amend initiative statutes—ranging from two to seven years. Six states have restrictions on how large of a supermajority vote is required in the legislature to repeal or amend initiative statutes. Only two states (Arizona and California) have voter approval requirements for changes to or the repeal of citizen-initiated state statutes.
Ballotpedia, “Legislative Alteration,” (Ballotpedia, accessed February 12, 2019), https://ballotpedia.org/Legislative_alteration#No_restrictions↩︎
The expansion measure passed in Maine required the state to submit a SPA within 90 days of the “effective date” of the bill and implement the expansion within 180 days of the “effective date.” However, Former Governor LePage refused to implement the expansion, arguing that the Legislature needed to fully fund the expansion first without increasing taxes, using the rainy day fund, or reducing services to the elderly or people with disabilities. LePage vetoed a $60 million expansion funding bill passed by the Legislature in June 2018, arguing that it contained one-time budget gimmicks. The Governor ultimately complied with a Maine Supreme Judicial Court order to submit an expansion state plan amendment (SPA) to the federal government in September 2018, but he accompanied it with a letter asking CMS to reject the SPA.
Secretary of State Matthew Dunlap, “Maine Citizen’s Guide to the Referendum Election,” (Augusta, ME: Office of the Secretary of State, November 2017), https://www.maine.gov/sos/cec/elec/upcoming/citizensguide2017.pdf
State of Maine Office of Governor Paul R. LePage, Governor LePage Issues Statement on Medicaid Expansion, (November 2017), http://www.maine.gov/tools/whatsnew/index.php?topic=Gov+News&id=771214&v=article2011
Joe Lawlor, “LePage Files Court-Ordered Plan to Expand Medicaid in Maine—and Asks Feds to Reject It,” Press Herald (September 4, 2018), https://www.pressherald.com/2018/09/04/lepage-files-plan-to-expand-medicaid-but-asks-feds-to-reject-it/
Governor Paul LePage, Letter to Secretary Azar and Administrator Verma, August 2018, http://mediad.publicbroadcasting.net/p/mpbn/files/201809/2018-8-31_gov_letter_to_sec_azar_and_admin_verma_re_me_state_plan_amendm….pdf↩︎
The latest series of one-minute, FAQ-style videos from Greater Than AIDS is designed to help individuals living with HIV and loved ones, as they navigate from receiving an HIV diagnosis to getting connected to care to keeping up with treatment.
“We all need help at some time,” says Dr. Malebranche, a leading HIV clinician-researcher and Associate Professor at Morehouse School of Medicine. “Ask for help, find a support network, tell your medical provider what’s going on so you can problem solve together.”
In his direct and relatable style, Dr. Malebranche explains terms like CD4 and T-Cell, viral load and HIV undetectable. He also covers the basics of HIV treatment — why it matters, how it works, when to start – as well as getting into care and finding support.
“Advances in the prevention and treatment of HIV offer great hope for the future,” said Tina Hoff, Senior Vice President and Director, Health Communications & Media Partnerships at KFF (Kaiser Family Foundation), which directs Greater Than AIDS. “But, public knowledge and understanding hasn’t always kept up with the science. This series reaches people where they are with the information they need to be healthy.”
A person diagnosed with HIV who is in ongoing care and treatment can live a normal lifespan. When the virus is suppressed – aka, “HIV undetectable” – there is effectively no risk of transmission to sexual partners.
“It felt really tough when I first was diagnosed. I did not want to seek treatment at the time because I didn’t know what that looked like,” says one of the young men in the series. He eventually was able to be connected to care and today is living healthy and well with HIV.
The docu-style videos educate about the health and preventive benefits of treatment, as well as the financial aid and support services available through the Ryan White HIV/AIDS Care and AIDS Drug Assistance Program, to help close the gap of those living with HIV but who are not connected to care.
Ms. Hoff notes that continued racial disparities with treatment access and sustained viral suppression show that there is still much work to be done. “By sharing these stories, we hope to bring attention to the challenges too many still face in getting connected to care, as well as highlight what services are available.”
Both video series are being distributed by Greater Than AIDS and health department partners through digital and social media. The videos are also designed to be used by service providers for staff education, as well as client outreach.
To watch the full #AskTheHIVDoc: Care and Treatment series, click here.
To watch the Living Well with HIV! docu-series, click here.
About Greater Than AIDS
Greater Than AIDS is a leading national public information response focused on the U.S. domestic HIV epidemic. While national in scope, Greater Than AIDS focuses on communities most affected. Through targeted media messages and community outreach, Greater Than AIDS and its partners works to increase knowledge, reduce stigma and promote actions to stem the spread of the disease.
About KFF
KFF (Kaiser Family Foundation), a leader in health policy analysis, health journalism and communication, is dedicated to filling the need for trusted, independent information on the major health issues facing our nation and its people. The Foundation is a non-profit organization based in San Francisco, California and is not affiliated with Kaiser Permanente.