KFF designs, conducts and analyzes original public opinion and survey research on Americans’ attitudes, knowledge, and experiences with the health care system to help amplify the public’s voice in major national debates.
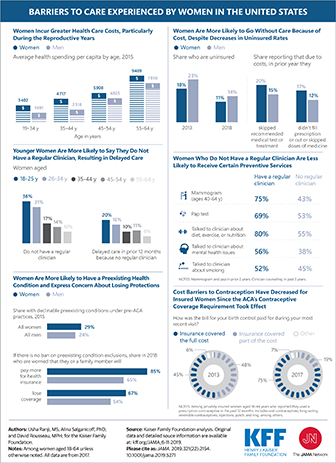
This Visualizing Health Policy infographic looks at barriers to care experienced by women in the United States. Women incur greater health care costs than men, particularly during the reproductive years. Despite a lower uninsured rate than men (11% vs 14%), women are more likely to skip a recommended medical test or treatment due to cost. However, cost barriers to contraception have decreased for insured women since the Affordable Care Act’s (ACA’s) coverage requirements took effect. Three of 4 women reported that insurance covered the full cost of birth control during their most recent visit. Younger women are less likely to report having a regular clinician. Women without a regular clinician are less likely to receive certain preventive services, such as a mammogram and Papanicolaou test. Women are more likely than men to have a preexisting health condition (29% vs 24%) and express concern about the consequences of lifting ACA protections that ban preexisting condition exclusions.
Over 18,000 people lost Medicaid coverage in Arkansas in 2018 due to the work and reporting requirements imposed under a Section 1115 demonstration waiver. There were four safeguards available to waiver enrollees that were intended to prevent people with disabilities and others who should not have been subject to the requirements from losing coverage. For example, the safeguards were intended to protect coverage for people who should not have been required to work due to a disability as well as for enrollees who did work the required number of hours but had difficulty navigating the monthly reporting process.
While proponents of the work and reporting requirements sometimes describe them as applying to “able-bodied” adults, some people with disabilities were subject to the requirements. Only people who receive federal Supplemental Security Income (SSI) benefits or are otherwise eligible for Medicaid based on a disability were entirely excluded from the requirements. Notably, 55% of nonelderly adults with Medicaid in Arkansas who report a disability do not receive SSI. At least some are eligible as ACA expansion adults and had to comply with the requirements or obtain an exemption to retain coverage under Arkansas’ waiver.
Two safeguards applied to protect coverage under the waiver for enrollees with disabilities. First, people with disabilities or health conditions that limited their ability to work were exempt from the requirements if they were determined to be “medically frail.” People with disabilities also could request a “reasonable accommodation” to receive assistance with meeting the requirements.
The other two safeguards applied to people with disabilities as well as other enrollees. Enrollees who were not exempt from the requirements and subsequently were determined to be non-compliant could have their status changed and be excused from the requirements by requesting a “good cause” exemption. Enrollees also could file an appeal to have a hearing to review the state’s decision to terminate their coverage under the new requirements.
This issue brief analyzes the impact of the four measures intended to safeguard coverage for people with disabilities and others who should not have been subject to the work and reporting requirements. It draws on data newly available from Arkansas’ 2018 annual waiver report to CMS and monthly data released by the state while the requirements were in effect. The data reveal that few people used these safeguard measures relative to the number of people who lost coverage due to the new requirements. Among those who accessed the safeguards, the vast majority did so due to disability/other health issues or technical issues such as those related to reporting. Key findings include the following:
The four safeguards intended to protect coverage for people with disabilities and others who should not have been subject to the requirements are strikingly complex. Each safeguard has a different operational process and can be invoked at different times.
Few enrollees utilized the processes intended to safeguard coverage relative to the over 18,000 people who lost coverage. While the medical frailty and good cause processes enabled some enrollees to retain the coverage for which they remained eligible, there were only 904 good cause requests, 17 reasonable accommodations, and 69 appeals in 2018. These low numbers may reflect a lack of enrollee knowledge about the safeguards and/or challenges navigating the required processes. Because over half of nonelderly adult Medicaid enrollees in Arkansas report a disability but do not receive SSI, it is likely that more enrollees qualified for relief from the requirements but did not navigate the process.
People with disabilities were particularly vulnerable to losing coverage under the Arkansas work and reporting requirements, despite remaining eligible. As the requirements took effect, the share of enrollees identified as medically frail increased from 9% (about 2,200 people) in June to 14% (about 8,400 people) in December 2018. Still, this process did not identify all enrollees whose disabilities or health conditions prevented them from complying. Over one-third of approved good cause requests excused enrollees who had not been identified as medically frail from meeting the work or reporting requirements due to a disability or health issue.
Administrative processes such as reporting requirements present barriers to eligible people retaining coverage beyond just those with disabilities. Over three-quarters of approved good cause requests excused enrollees from meeting the reporting requirement. This means that enrollees had completed the required number of hours but nevertheless initially had been found non-compliant because they were unable to successfully report. Technical issues were the most frequently cited basis for approved good cause requests, followed by enrollee disability or other health issues.
Looking ahead, the impact of measures intended to safeguard coverage for individuals with disabilities and others who should not have been subject to work and reporting requirements has implications for Arkansas as well as other states pursuing similar waivers. While the Arkansas requirements have been set aside by a court, they could be reinstated on appeal. The four safeguards are important protections to help eligible people remain covered, but their benefits may not have been fully realized due to the complexity of the processes. The extent of disability and technical issues, primarily related to reporting, experienced by those who ultimately were exempted from the requirements raises questions about whether additional individuals who lost coverage under the waiver might in fact remain eligible but were unable to retain coverage due to a disability or another difficulty navigating the reporting process.
Issue Brief
Introduction
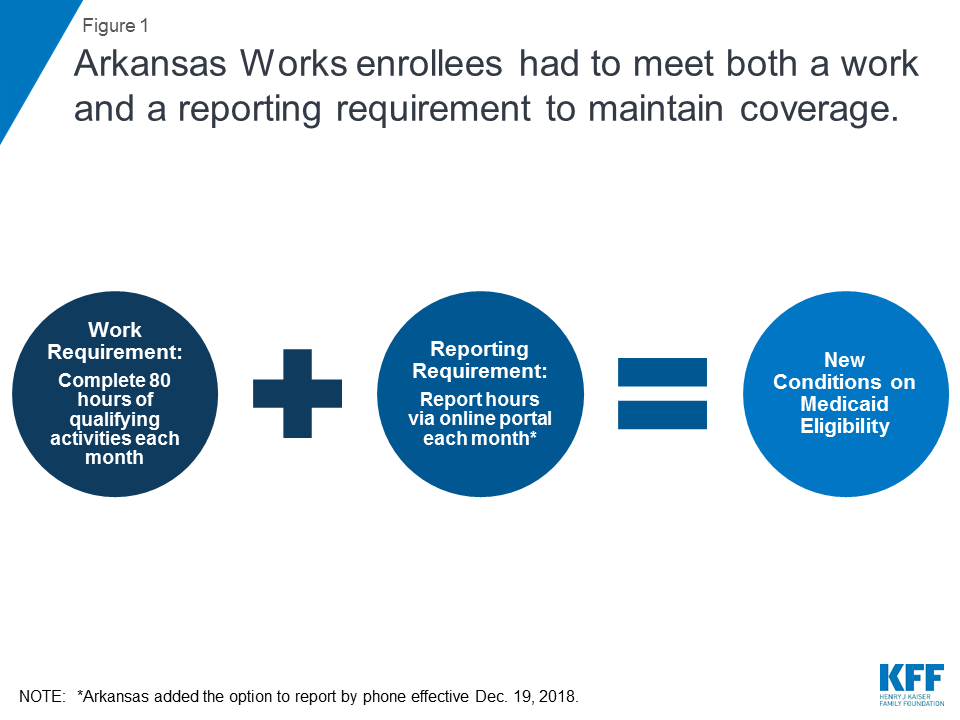
Over 18,000 people lost Medicaid coverage in Arkansas in 2018, due to work and reporting requirements imposed under a Section 1115 demonstration waiver known as Arkansas Works. The requirements were phased in for enrollees ages 30 to 49 from June through September 2018. Unless exempt, enrollees had to meet two separate but related requirements to maintain coverage: a requirement to complete 80 hours of work or other qualifying activities each month, and a requirement to report their hours each month (Figure 1). Individuals lost coverage after failing to meet the requirements for any three months in the calendar year. While the requirements started to apply to additional populations in 2019, no coverage losses have occurred this year to date because the requirements subsequently were set aside by a court; the case is currently on appeal.
Figure 1: Arkansas Works enrollees had to meet both a work and a reporting requirement to maintain coverage.
This issue brief analyzes the impact of measures intended to safeguard coverage for people with disabilities and others who should not have been subject to the work and reporting requirements. It draws on data newly available from Arkansas’ 2018 annual waiver report to CMS and monthly data released by the state while the requirements were in effect. The data reveal that few people used these safeguard measures relative to the number of people who lost coverage due to the new requirements. Among those who accessed the safeguards, the vast majority did so due to disability/other health issues or technical issues, primarily related to reporting.
Background
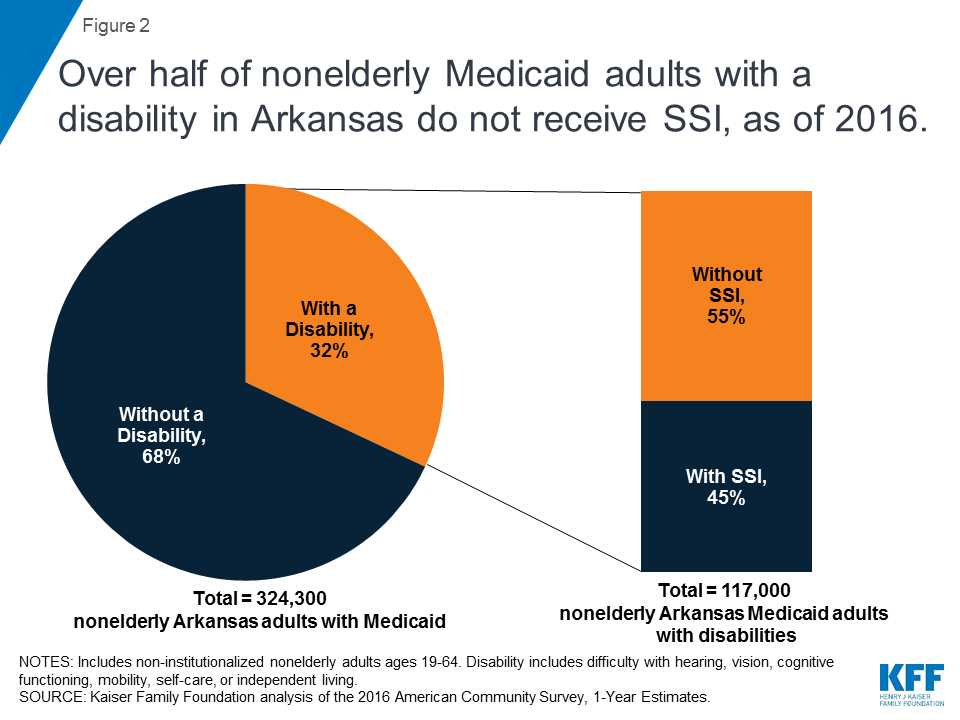
While proponents of work and reporting requirements sometimes describe them as applying to “able-bodied” adults, some people with disabilities are subject to the requirements. Only people who receive federal Supplemental Security Income (SSI) benefits or are otherwise eligible for Medicaid based on a disability are entirely excluded from the requirements. However, 55% of nonelderly Medicaid adults in Arkansas who report a disability do not receive SSI (Figure 2 ).
Figure 2: Over half of nonelderly Medicaid adults with a disability in Arkansas do not receive SSI, as of 2016.
Federal survey data classify a person as having a disability if they have a functional limitation that results in a participation limitation. This includes people who report serious difficulty with hearing, vision, cognitive functioning (concentrating, remembering, or making decisions), mobility (walking or climbing stairs), self-care (dressing or bathing), or independent living (doing errands, such as visiting a doctor’s office or shopping, alone).1 The SSI disability standard is more stringent.2 In addition, SSI financial eligibility criteria are more restrictive than those for Medicaid expansion adults and other disability-related Medicaid coverage pathways.3 As a result, people with disabilities who do not receive SSI can be eligible for Medicaid as expansion adults or low-income parents or through an optional disability-related pathway.4
Key Findings Related to Measures Intended to Safeguard Coverage
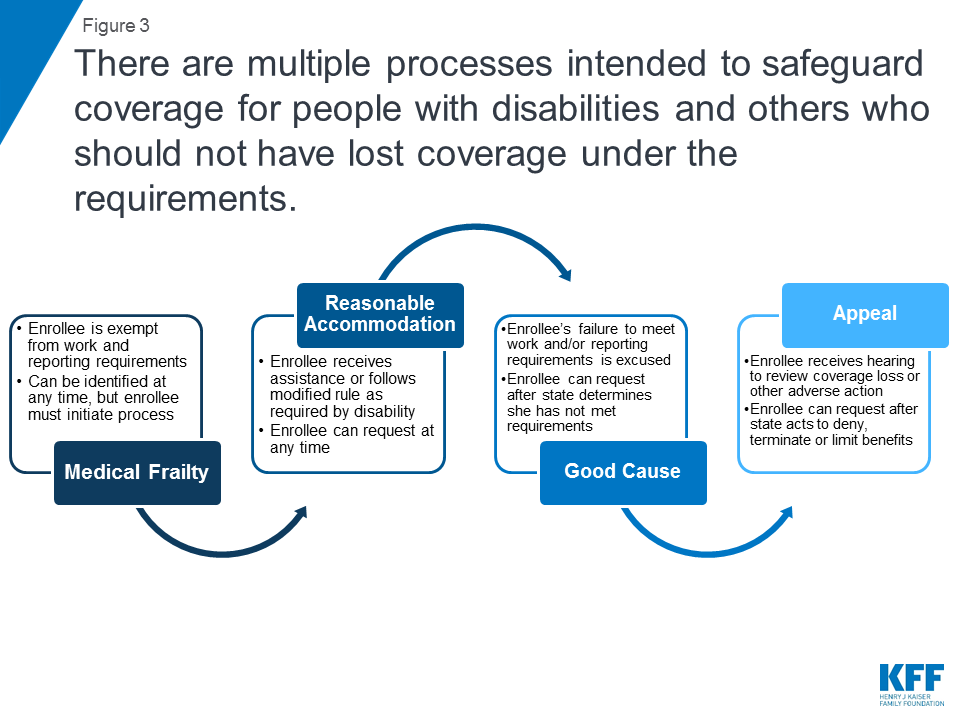
There were four safeguards that were intended to prevent people with disabilities and others who should not have been subject to the work and reporting requirements from losing coverage under Arkansas’ waiver (Figure 3). For example, the safeguards were intended to protect coverage for people who should not have been required to work due to a disability as well as for enrollees who did work the required number of hours but had difficulty navigating the monthly reporting process.
Figure 3: There are multiple processes intended to safeguard coverage for people with disabilities and others who should not have lost coverage under the requirements.
Two safeguards applied to protect coverage under the waiver for enrollees with disabilities. People with disabilities or health conditions that limited their ability to work were exempt from the requirements if they were identified as “medically frail.” People with disabilities also could request a “reasonable accommodation” to receive assistance or follow modified rules to meet the requirements.
The other two safeguards applied to people with disabilities as well as other enrollees who should not have lost coverage under the work and reporting requirements. Enrollees who were not exempt from the requirements and subsequently were determined to be non-compliant could have their status changed and ask the state to excuse them from meeting the requirements by submitting a “good cause” request. Enrollees also could file an appeal to have a hearing to review the state’s decision to terminate their coverage under the requirements.
The four safeguards intended to protect coverage for people with disabilities and others who should not have been subject to the requirements are strikingly complex. Each safeguard has a different operational process and can be invoked at different times. More detail about each safeguard and related data about enrollee use of the safeguards is presented below.
Medical Frailty
People with disabilities or health conditions that limit their ability to work are exempt from Medicaid work and reporting requirements if they are identified as medically frail. Federal rules require that medically frail adults include at least those with disabling mental disorders, including serious mental illness; chronic substance use disorders; serious and complex medical conditions; physical, intellectual or developmental disabilities that significantly impair the ability to perform one or more activities of daily living; and those with a disability determination based on Social Security Administration criteria.5 In Arkansas, enrollees must self-identify as potentially medically frail to initiate the process.6 While health plans may have claims data or other information showing that an enrollee may be medically unable to work, health plans cannot initiate the medical frailty process in Arkansas. Final medical frailty determinations are made by the enrollee’s health plan and the state Medicaid agency and must be renewed annually.
Arkansas already was determining medical frailty before the work and reporting requirements took effect, but obtaining this status took on greater significance for enrollees under the new requirements than it had in the past. Previously, medically frail enrollees were exempt only from mandatory enrollment in Marketplace health plans and instead able to receive the traditional Medicaid benefit package. As the new requirements took effect, medically frail enrollees also became exempt from having to meet the work and reporting requirements as a condition of maintaining coverage. Although the notice sent to enrollees informing them that they are eligible for Medicaid and will be enrolled in a Marketplace health plan under Arkansas’ waiver must describe how to request a medical frailty determination,7 this information was not included in notices informing enrollees about the work and reporting requirements.8 In an early look at implementation of Arkansas’ work and reporting requirements, some interviewees expressed concern about enrollees’ ability to understand that they potentially might qualify for a medical frailty exemption and to successfully navigate that process, especially for those with mental health needs. Safety net providers reported that individuals who are homeless and those who have more serious physical or mental health disabilities may be less likely to be aware of the requirements and more likely to have problems working or complying with monthly reporting.
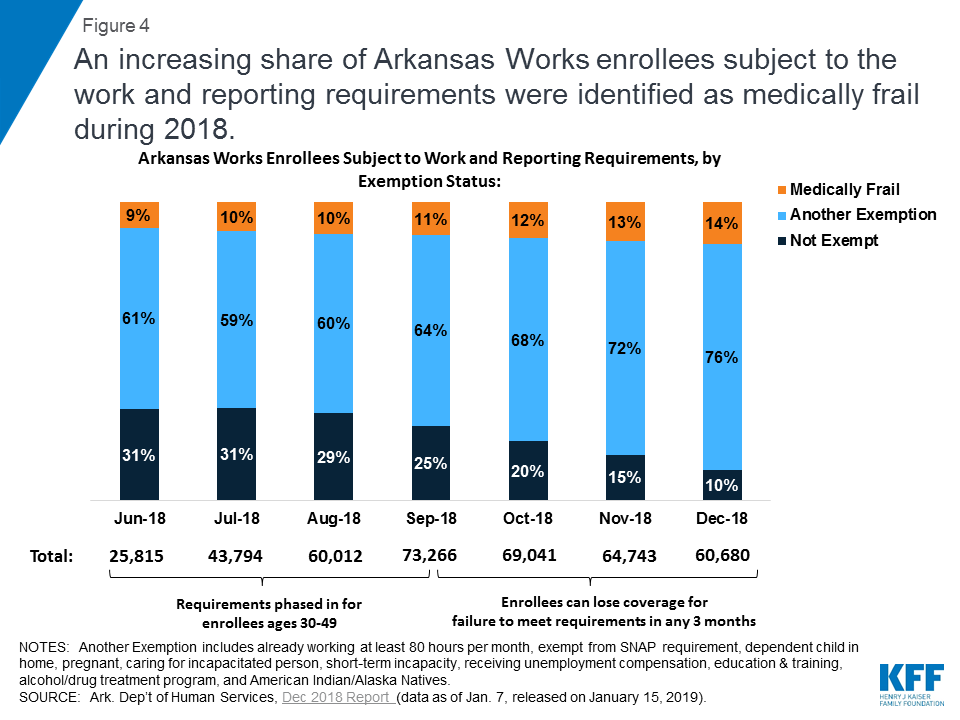
Among the subset of enrollees who were subject to the work and reporting requirements, an increasing share were identified as medically frail while the requirements were in effect (Figure 4). The work and reporting requirements did not apply to all waiver enrollees in 2018, but instead were phased in for enrollees ages 30 to 49 from June through September 2018. As the requirements took effect, the share of enrollees subject to the requirements who were identified as medically frail increased from 9% (about 2,200 people) in June to 14% (about 8,400 people) in December 2018. The share of enrollees who qualified for another exemption also increased during this period, leaving just 10% of enrollees not exempt by December.
Figure 4: An increasing share of Arkansas Works enrollees subject to the work and reporting requirements were identified as medically frail during 2018.
Good Cause
Enrollees who were not exempt from the work and reporting requirements and subsequently were determined non-compliant could request that the state Medicaid agency grant them a good cause exemption, but very few (just over 900) did so relative to the over 18,000 people who lost coverage. The state could decide that an enrollee had good cause for not completing the required number of work activity hours and/or not reporting their hours or an exemption. Circumstances that constituted good cause included those related to an enrollee’s disability or health condition as well as other reasons. At a minimum, under Arkansas’ waiver, good cause exemptions had to be recognized for enrollees who were unable to meet the requirements for reasons related to a disability, hospitalization, or serious illness experienced by themselves or an immediate family member with whom they live; the birth or death of a family member in the enrollee’s home; severe inclement weather including natural disasters; and a family emergency or other life-changing event such as divorce or domestic violence.9
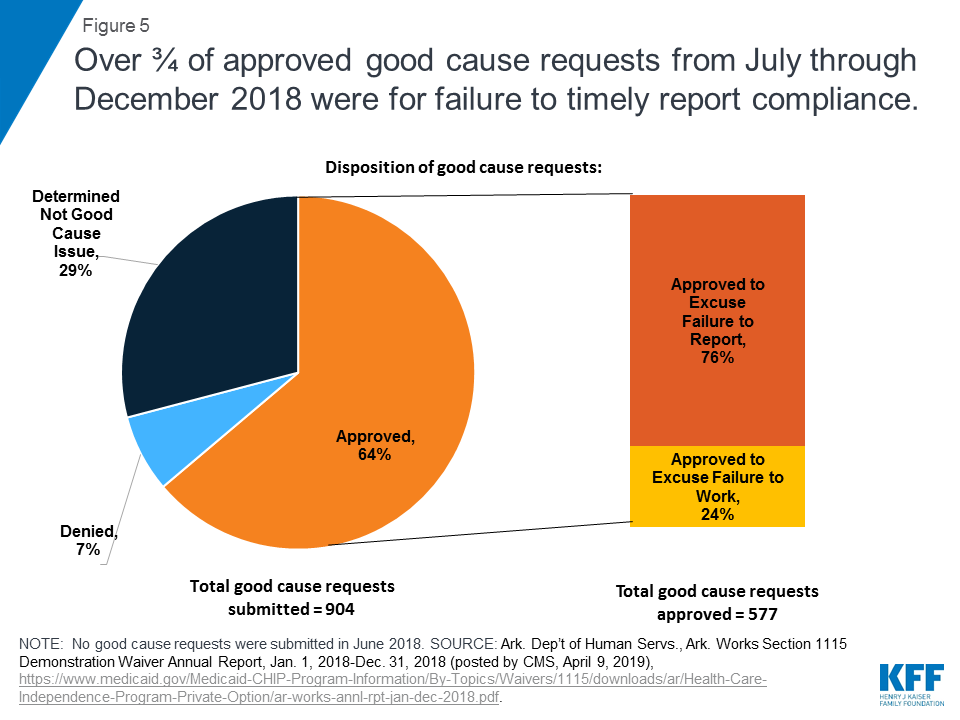
Nearly two-thirds of the 904 good cause requests received from July through December 2018 were approved, with most approvals excusing enrollees from meeting the reporting requirement (Figure 5). This means that these enrollees had successfully completed the required number of work activity hours in a given month but nevertheless initially had been found non-compliant because they were unable to successfully report that they had done so. The remaining good cause approvals excused enrollees from completing the required number of work activity hours in a given month. Most good cause requests that were not approved were determined by the state to “not constitute a good cause issue.” No further information is available about these requests. By contrast, a smaller number of good cause requests were formally denied.
Figure 5: Over ¾ of approved good cause requests from July through December 2018 were for failure to timely report compliance.
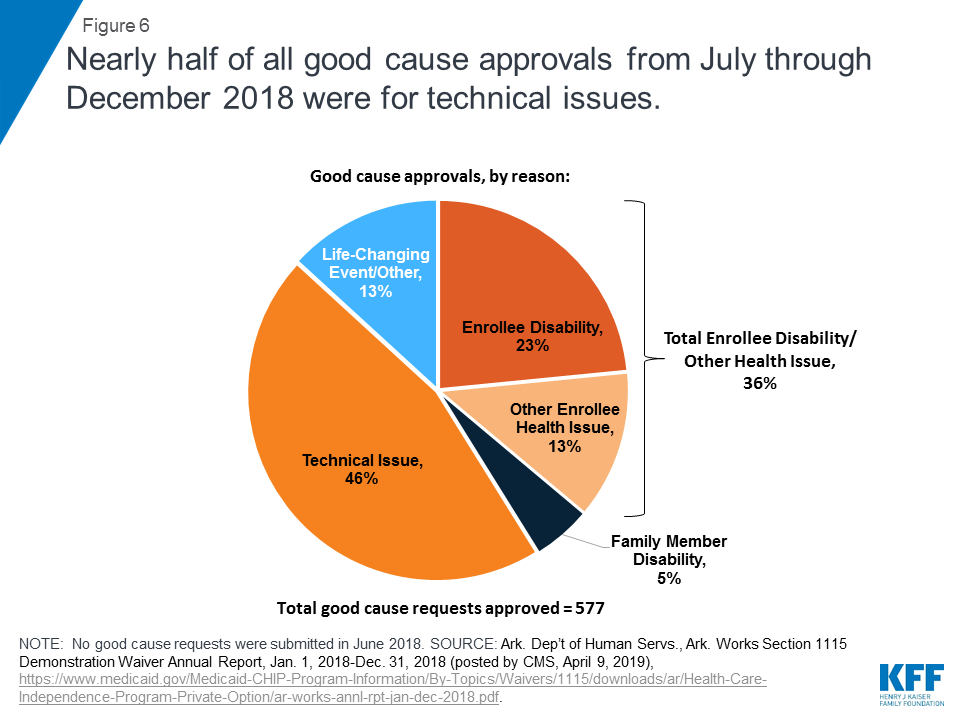
Among the good cause requests approved by the state, just under half were attributed to technical issues (Figure 6 and Table 1). These included client support issues, agency issues, and other unspecified technical issues. In the subset of good cause approvals related to the reporting requirement, technical issues were the chief reason that enrollees were excused from meeting the reporting requirement (Table 1). This finding is consistent with other research that shows that additional reporting or administrative burdens create barriers to eligible people retaining coverage. In addition, technical issues were the second most frequently cited reason in the subset of good cause approvals excusing enrollees from meeting the work requirement (Table 1).
Figure 6: Nearly half of all good cause approvals from July through December 2018 were for technical issues.
Table 1: Arkansas Works Good Cause Approvals, by Reason, July-December 2018
Good Cause Reason
Share of All Good Cause Approvals
Share of Good Cause Approvals to Excuse Work Hours
Share of Good Cause Approvals to Excuse Reporting
Technical Issue
46%
17%
55%
Enrollee Disability
23%
56%
13%
Other Enrollee Health Issue
13%
9%
14%
Family Member Disability
5%
7%
4%
Life-Changing Event/Other
13%
11%
14%
Total:
100% (577 requests)
100% (140 requests)
100% (437 requests)
NOTES: Work and reporting requirements were phased in for enrollees ages 30-49 from June-December 2018, but no good cause requests were submitted in June. Other Enrollee Health Issue includes hospitalization and serious illness. Technical Issue includes technical agency issue, technical client support, and unspecified technical issues. Life Changing Event/Other also includes birth or death of household family member.SOURCE: Ark. Dep’t of Human Servs., Ark. Works Section 1115 Demonstration Waiver Annual Report, Jan. 1, 2018-Dec. 31, 2018 (posted by CMS, April 9, 2019), https://www.medicaid.gov/Medicaid-CHIP-Program-Information/By-Topics/Waivers/1115/downloads/ar/Health-Care-Independence-Program-Private-Option/ar-works-annl-rpt-jan-dec-2018.pdf
Over one-third of all approved good cause requests were attributed to enrollee disability or another health issue, such as hospitalization or serious illness (Figure 6 and Table 1). This means that these enrollees were determined to have physical or mental health issues that prevented them from working the required number of hours or reporting their compliance, even though they had not previously been identified as medically frail and do not receive SSI benefits. This finding is consistent with research finding that people who are penalized for not meeting the TANF work requirement are more likely to have a disability compared to those who are not so penalized. In the subset of good cause approvals related to the work requirement, disability/health issues were the chief reason that enrollees were excused from completing the required number of hours (Table 1). In addition, disability/health issues were the second most frequently cited reason in the subset of good cause approvals excusing enrollees from meeting the reporting requirement (Table 1).
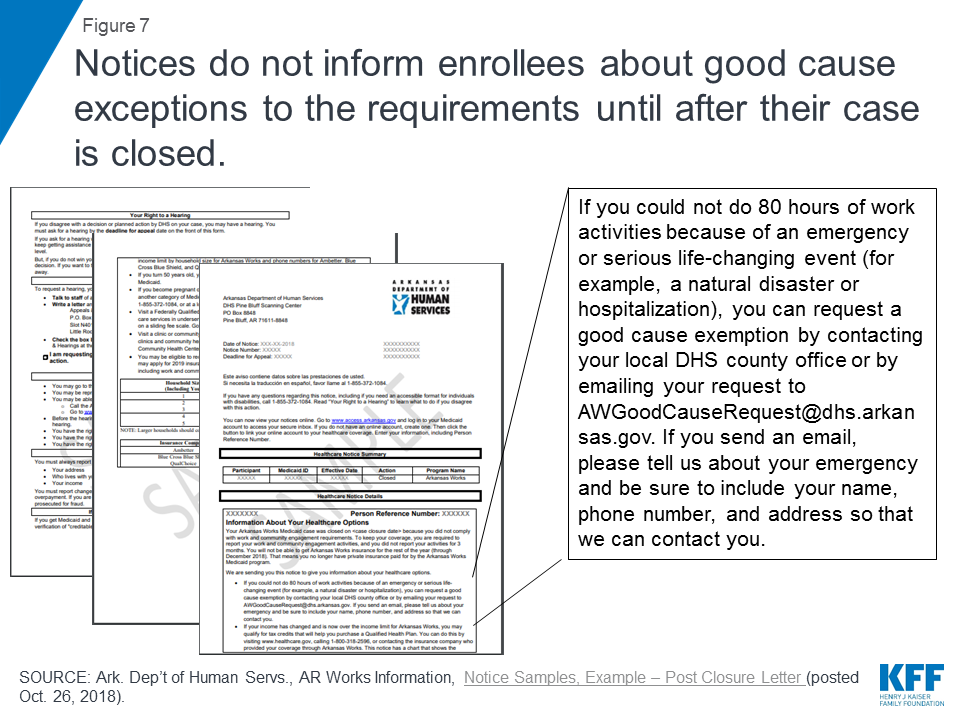
Not all enrollees who were eligible for a good cause exemption may have requested one. Just over 900 good cause requests were submitted, while over 18,000 enrollees lost coverage under the work and reporting requirements in 2018. An early look at implementation of the work and reporting requirements in Arkansas found that the good cause policies and process were not finalized until fall 2018, resulting in confusion about how to make these requests. Information about the good cause process was included in the notice informing enrollees that their case was closed due to three months of non-compliance (Figure 7), but this information was not included in earlier notices about the work and reporting requirements. In addition, the notice language describing good cause referred to “an emergency or serious life-changing event (for example, a natural disaster or hospitalization)” but did not include the broader list of good cause reasons that Arkansas must recognize, such as disability or serious illness (that may not have resulted in a hospitalization but nonetheless interfered with the enrollee’s ability to meet the requirements) as described above. Finally, the process for requesting good cause differed from the process to report work hours and exemptions; instead of using the online portal, good cause was requested via email.
Figure 7: Notices do not inform enrollees about good cause exceptions to the requirements until after their case is closed.
Reasonable Accommodations
Arkansas received and granted very few — a total of 17 — reasonable accommodations for people with disabilities from June through December 2018, primarily for help using the online portal to report compliance.10 The state data do not indicate whether any support services necessary for people with disabilities to participate in the work and reporting requirements were provided. While federal Medicaid funds cannot be used to pay for supportive services in work requirement waivers, the state has an independent obligation to provide equal access to people with disabilities under other federal laws. As required by the Americans with Disabilities Act (ADA), Section 504 of the Rehabilitation Act, and Section 1557 of the Affordable Care Act, Arkansas had to provide reasonable accommodations to ensure that enrollees with disabilities had an equal opportunity to meet the work and reporting requirements. Examples of reasonable accommodations in the waiver terms approved by CMS included but were not limited to assistance with demonstrating eligibility for good cause exemptions; appealing disenrollments; documenting work activities and other documentation requirements; understanding notices and program rules related to community engagement requirements; navigating ADA compliant web sites; exemptions from participation where an individual is unable to participate or report for disability-related reasons; modification in the number of hours of participation required; and provision of support services necessary to participate.11
The very low number of these requests likely reflects a lack of knowledge among enrollees about the availability of reasonable accommodations for people with disabilities. For example, the notices sent to enrollees about the work and reporting requirements did not include information about the availability of reasonable accommodations or how to request them.12 While enrollees generally must initiate the request for a reasonable accommodation, the waiver terms and conditions also provided that the “state should evaluate individuals’ ability to participate and the types of reasonable modifications and supports needed.”13 No information about these efforts is provided in the state’s 2018 annual waiver report to CMS.
Appeals
A total of just 69 people requested an appeal related to the work and reporting requirements from June through December 2018,14 a fraction of the over 18,000 enrollees who lost coverage under the requirements. This could indicate that individuals do not know about appeals, are unable to successfully navigate the process, or believe that filing an appeal is futile. No information was provided about the outcome of requested appeals. While information about how to request an appeal was included in the notices, an early look at implementation of the work and reporting requirements in Arkansas found concerns among advocates and providers that the notices were confusing and may not have sufficiently accounted for low literacy and lack of English proficiency among some enrollees. Focus groups conducted in fall 2018 revealed that enrollees did not fully read or understand the notices. Many enrollees said that they did not focus on the notices because they had to attend to more immediate and pressing needs, such as alcoholism recovery or meeting basic needs like affording food and utility bills.
Looking Ahead
The impact of the measures intended to safeguard coverage for individuals with disabilities and others who should not have been subject to the work and reporting requirements has implications for Arkansas as well as other states pursing similar waivers. While the Arkansas requirements, along with those in Kentucky, have been set aside by a court, they could be reinstated on appeal. In addition, work and reporting requirements currently are in effect in Indiana and New Hampshire, although the New Hampshire requirements also are being challenged in court. Other states have or are actively seeking CMS approval to implement similar requirements, and the Trump Administration’s FY 2020 budget includes a proposal to adopt these requirements across the Medicaid program.15
Few enrollees used the safeguards relative to the number who lost coverage, likely at least in part due to the safeguards’ complexity. While the medical frailty and good cause processes enabled some enrollees to retain the coverage for which they remained eligible, there were few good cause requests (about 900) relative to the number of enrollees who lost coverage in 2018 (over 18,000). Even fewer enrollees requested a reasonable accommodation (17) or requested an appeal (69) related to the work and reporting requirements. These low numbers may reflect a lack of knowledge among enrollees about the availability of these safeguards and/or challenges successfully navigating the required processes. Each safeguard had a different operational process and can be invoked at different times. Because over half of nonelderly Medicaid adults in Arkansas repot a disability but do not receive SSI, it is likely that more enrollees qualified for relief from the requirements but did not navigate the process.
People with disabilities were particularly vulnerable to losing coverage under the work and reporting requirements, despite remaining eligible. An increasing share of Arkansas enrollees subject to the work and reporting requirements were identified as medically frail and therefore exempt from complying while the requirements were implemented. Still, this process did not identify all enrollees whose disabilities or health conditions prevented them from complying, as over one-third of good cause requests approved to excuse enrollees from meeting the work or reporting requirements were based on a disability or another enrollee health issue.
Administrative processes such as reporting requirements present barriers to eligible people retaining coverage beyond just those with disabilities. Over three-quarters of approved good cause requests excused enrollees from the reporting requirement. This means that these enrollees had successfully completed the required number of work activity hours in a given month but nevertheless initially had been found non-compliant because they were unable to successfully report that they had done so. Technical issues were the most frequently cited basis for approved good cause requests, followed by enrollee disability or other health issues.
The four safeguards are important protections to help eligible people remain covered, but their benefits may not have been fully realized due to the complexity of the processes. The extent of disability and technical issues, primarily related to reporting, experienced by those who ultimately were exempted from the requirements raises questions about whether additional individuals who lost coverage under the waiver might in fact remain eligible but were unable to retain coverage due to a disability or another difficulty navigating the reporting process.
SSI beneficiaries have an impaired ability to work at a substantial gainful level as a result of old age or significant disability. ↩︎
The maximum SSI benefit is 74% of the federal poverty level (FPL, $9,252/year for an individual in 2019), and the asset limit for an individual is $2,000. The ACA Medicaid expansion covers individuals up to 138% FPL ($17,236/year for an individual in 2019) without an asset test in states that opt to adopt it. States also have the option to extend financial eligibility for disability-related Medicaid coverage pathways up to 300% of SSI ($27,756/year for an individual in 2019). ↩︎
People who qualify for Medicaid both as an expansion adult and based on a disability can choose the group through which they enroll in coverage; benefit packages may differ by coverage group. 42 C.F.R. § 435.911 (c) (2), (d). ↩︎
CMS Special Terms and Conditions, Arkansas Works, No. 11-W-00287/6 (approval period March 5, 2018 through Dec. 31, 2021, amended March 5, 2018), at p. 14, 23 (f) regarding Arkansas Works Premium Assistance Enrollment Notices (providing that the “notice will include information describing how Arkansas Works beneficiaries who believe they are medically frail can request a determination of whether they are exempt from the ABP. The notice will also include alternative benefit plan options.”), https://www.medicaid.gov/Medicaid-CHIP-Program-Information/By-Topics/Waivers/1115/downloads/ar/ar-works-ca.pdf. ↩︎
Enrollees who were subject to the work and reporting requirements were sent a notice the month before, indicating when their work requirement began and that, unless they received another notice saying that they were exempt from reporting, they had to report their work activities by the fifth of the following month or would be considered non-compliant and would lose coverage after three months of non-compliance. AR Works Information, Notices and Flyer Samples, Example – Subject to Work Requirement – Work Activities, last accessed Oct. 5, 2018, on file with author. ↩︎
AR Works Information, Notices and Flyer Samples, Example – Subject to Work Requirement – Work Activities, last accessed Oct. 5, 2018, on file with author. ↩︎
Despite its large economy, California is also the state with the highest poverty rate (19 percent) according to the U.S. Census Bureau.1 As Governor Gavin Newsom begins his tenure in office, Californians across income groups see health care as a key issue for the new governor and legislature to address. In late 2018, the Kaiser Family Foundation and the California Health Care Foundation conducted a representative survey of the state’s residents to gauge their views on health policy priorities and their experiences in California’s health care system. This summary examines key findings from the survey among “low-income” Californians, defined here as those whose self-reported incomes are below 200 percent of the federal poverty level (approximately $49,000 for a family of four). Where relevant, they are compared to higher-income Californians — those with self-reported incomes at or above 200 percent of the federal poverty level.
Half of low-income Californians say that someone in their family has delayed or forgone medical or dental treatment in the past year due to costs, this @KaiserFamFound / @CHCFNews survey finds.
Overall, the survey finds that while Californians at all income levels see health care as an important priority for the governor and legislative leaders to work on, health care affordability and access emerge as particularly prominent concerns among low-income residents of the state. Key findings include:
Affordability of health care has affected treatment decisions for many low-income Californians, with over half saying that in the past year, they or someone in their family has delayed or forgone some type of medical or dental treatment due to costs.
Californians with low incomes are almost twice as likely as higher-income residents to say they have had problems paying medical bills. As a result, many of those who experienced difficulty paying medical bills say they have had to cut back spending in other areas, use savings, or borrow money.
Low-income Californians are also more likely than other residents to report nonfinancial barriers to accessing health care, such as long wait times to get an appointment. A majority of Californians with low incomes say their community does not have enough mental health providers, and about four in ten say their community lacks enough primary care doctors and specialists to meet the needs of residents.
The distinctive health care experience of low-income Californians is also evident in their attitudes toward Medi-Cal. While overwhelming majorities of Californians across income levels say Medi-Cal is important to the state, low-income Californians are twice as likely as those with higher incomes to say the program is important to them and their families.
Findings
Health Care Priorities
When asked about a number of health care issues facing the state and its residents, Californians with low incomes say most are important priorities for state political leaders to address. About half of low-income Californians say that it is “extremely important” for the governor and the legislature to work on making sure people with mental health problems can get treatment (51 percent) and to work on making sure all Californians have access to health insurance (49 percent). Nearly half say it is “extremely important” that the governor and legislature work on lowering the amount people pay for health care (46 percent) and on making sure there are enough health care providers across the state (46 percent). Sixteen percent of Californians with low incomes think it is “extremely important” for state leaders to work on decreasing state spending on health care (Figure 1). While ratings of health care priorities are similar across income levels, Californians with low self-reported incomes are more likely than those with higher incomes to say making sure there are enough health care providers across the state should be an “extremely important” priority for state leaders (46 percent versus 33 percent [not shown]).
Figure 1: Ranking Of Health Care Priorities Among Low-Income Californians
Experiences with Health Care Affordability
Californians with low incomes are nearly twice as likely as those with higher incomes to say they or a household member had problems paying medical bills in the past 12 months (29 percent versus 15 percent) (Figure 2).
Figure 2: Low-Income Californians More Likely To Report Problems Paying Medical Bills
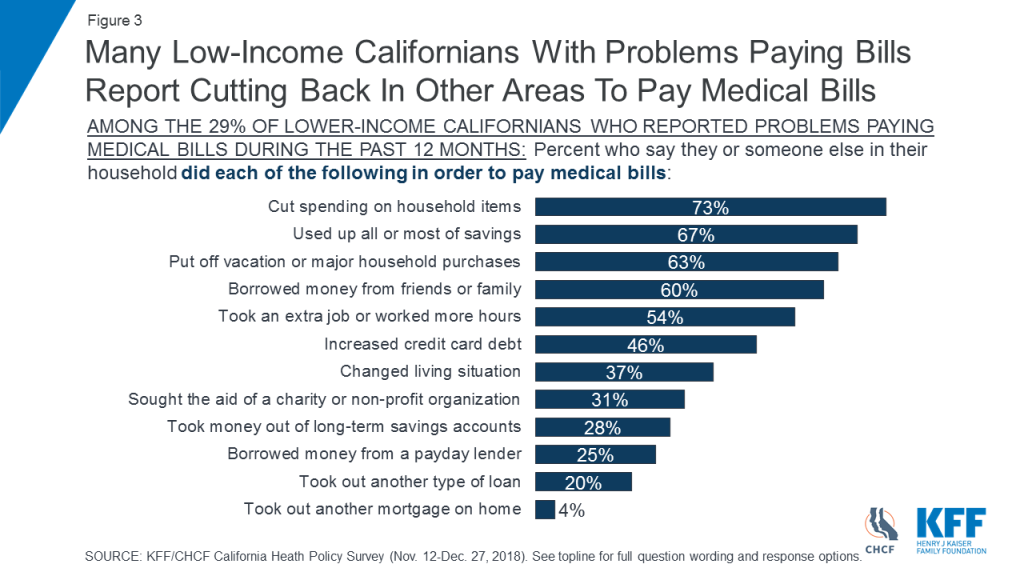
Many Californians with low incomes who had problems paying medical bills report having to cut back in other areas, dip into savings, or borrow money to help address their medical costs. Among the 29 percent of low-income Californians who report problems paying medical bills, nearly three-quarters (73 percent) say they have cut spending on household items to pay medical bills. Two-thirds (67 percent) say they used up all or most of their savings and about six in ten say they put off a vacation or major purchase (63 percent) or borrowed money from friends or family (60 percent) (Figure 3).
Figure 3: Many Low-Income Californians With Problems Paying Bills Report Cutting Back In Other Areas To Pay Medical Bills
More than half of Californians with low incomes (55 percent) say that they or a family member living in their household delayed or went without some type of medical or dental care in the past year because they had difficulty affording the cost. This compares to 36 percent of those with higher incomes (not shown). Four in ten low-income Californians say someone in their household skipped dental care or checkups, 28 percent say they or a household member put off or postponed getting health care, and about a quarter say someone in their household skipped a recommended test or treatment (24 percent) or did not fill a prescription (24 percent) because of cost (Figure 4).
Figure 4: Over Half Of Low-Income Californians Report Delaying Care Due To The Cost
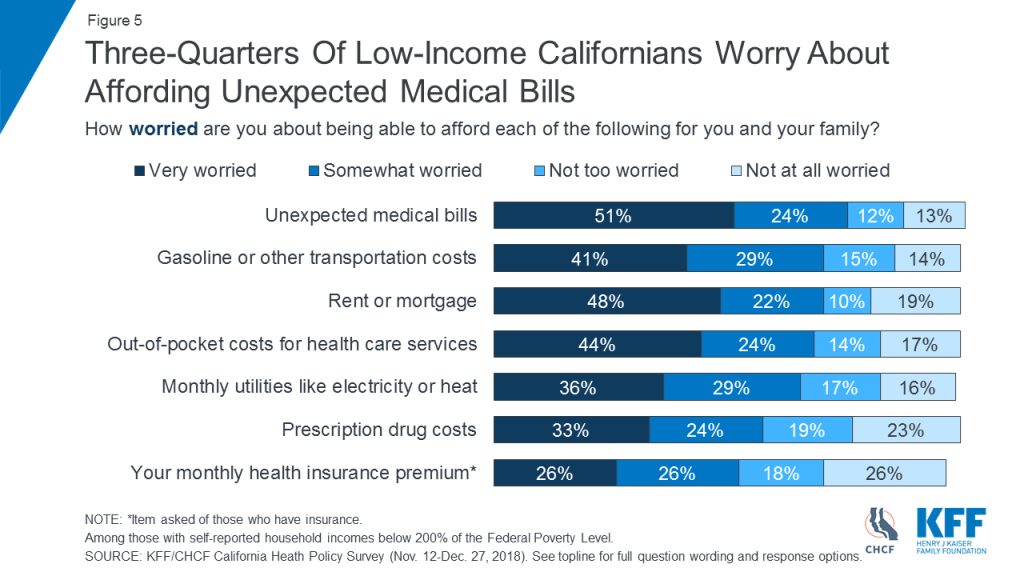
Three in four low-income Californians (75 percent) say they are very or somewhat worried about being able to afford unexpected medical bills, outranking other financial worries asked about in the survey, including paying for housing. Nearly seven in ten (68 percent) say they are worried about affording out-of-pocket costs for health care services (Figure 5).
Figure 5: Three-Quarters Of Low-Income Californians Worry About Affording Unexpected Medical Bills
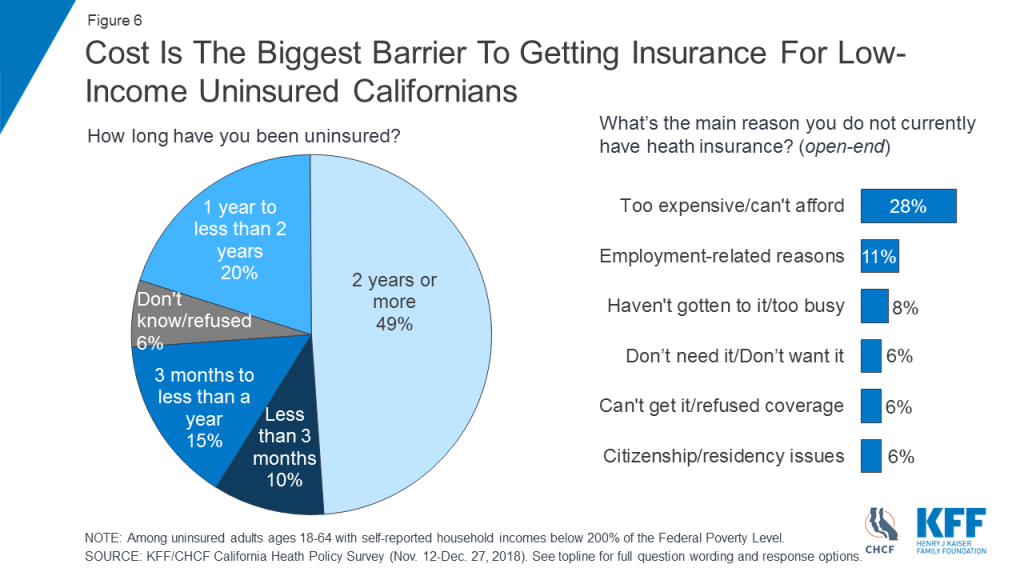
Cost concerns are also evident among low-income adults who are uninsured. Among uninsured Californians age 18–64 with low incomes, about half (49 percent) say they have been without health insurance for two years or more, and cost and affordability (28 percent) is the top reason cited for why they lack insurance (Figure 6).
Figure 6: Cost Is The Biggest Barrier To Getting Insurance For Low-Income Uninsured Californians
Access to Providers
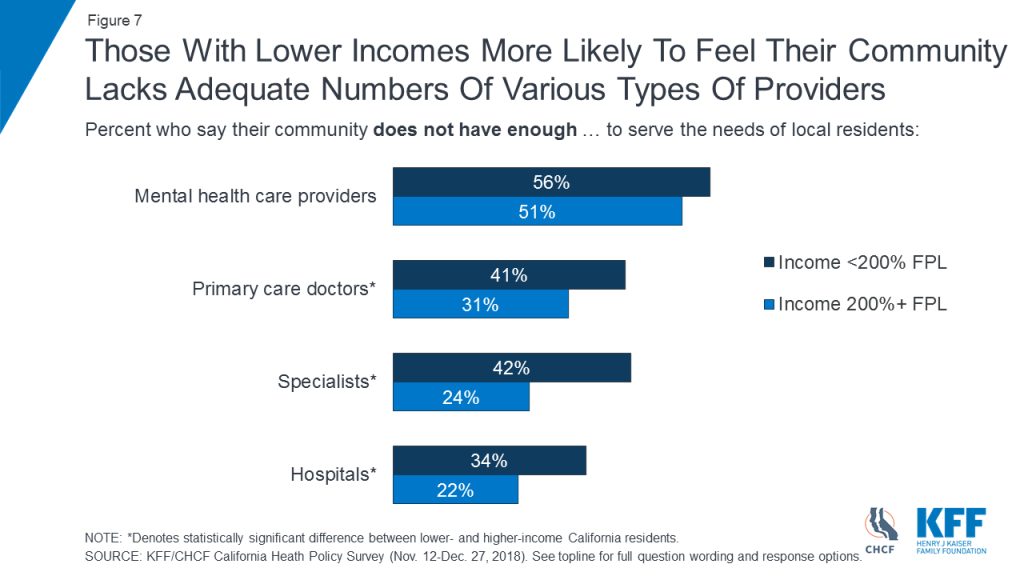
A majority of low-income Californians (56 percent) say their community does not have enough mental health care providers to serve the needs of local residents. Those with low incomes are more likely than Californians with higher incomes to say their community does not have enough primary care doctors (41 percent versus 31 percent), specialists (42 percent versus 24 percent), and hospitals (34 percent versus 22 percent) (Figure 7).
Figure 7: Those With Lower Incomes More Likely To Feel Their Community Lacks Adequate Numbers Of Various Types Of Providers
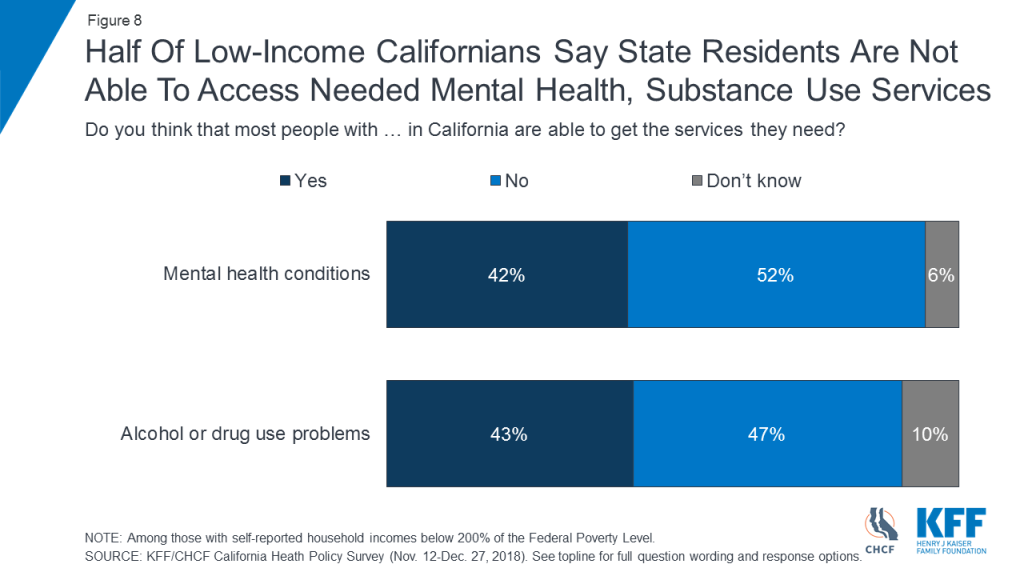
About half of Californians with low incomes (52 percent) say most people in the state with mental health conditions are not able to get the services they need. A similar share (47 percent) say those with alcohol or drug use problems in California are not able to get needed services (Figure 8).
Figure 8: Half Of Low-Income Californians Say State Residents Are Not Able To Access Needed Mental Health, Substance Use Services
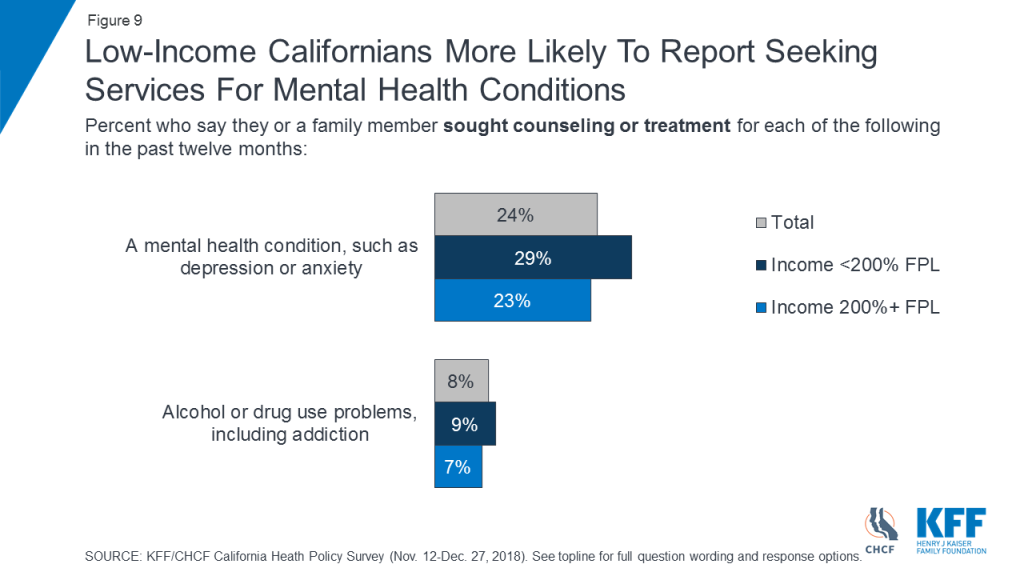
Similar shares of Californians across income levels say they or a family member have sought counseling or treatment for alcohol or drug use (Figure 9).
Californians with low incomes are slightly more likely than those with higher incomes to say they or a family member sought counseling or treatment for a mental health condition, such as anxiety or depression, in the past twelve months (29 percent versus 23 percent) (Figure 9).
Figure 9: Low-Income Californians More Likely To Report Seeking Services For Mental Health Conditions
Among Californians with low incomes, concerns about availability and access to providers are reflected in their personal experiences. About a quarter of low-income residents (27 percent) say there was a time in the past 12 months when they had to wait longer than they thought reasonable to get an appointment for medical care. Among low-income adults who say they or a family member sought mental health treatment in the past year, 27 percent said they had to wait longer than they thought reasonable for a mental health care appointment (Figure 10).
Among low-income Californians with Medi-Cal coverage who say they or a family member sought care, 33 percent report having to wait longer than they thought reasonable for a medical care appointment and four in ten (41 percent) say they had to wait longer than reasonable for a mental health care appointment (Figure 10).
Figure 10: Many Low-Income Californians Report Long Wait Times For Medical Care And Mental Health Care
Importance of Medi-Cal
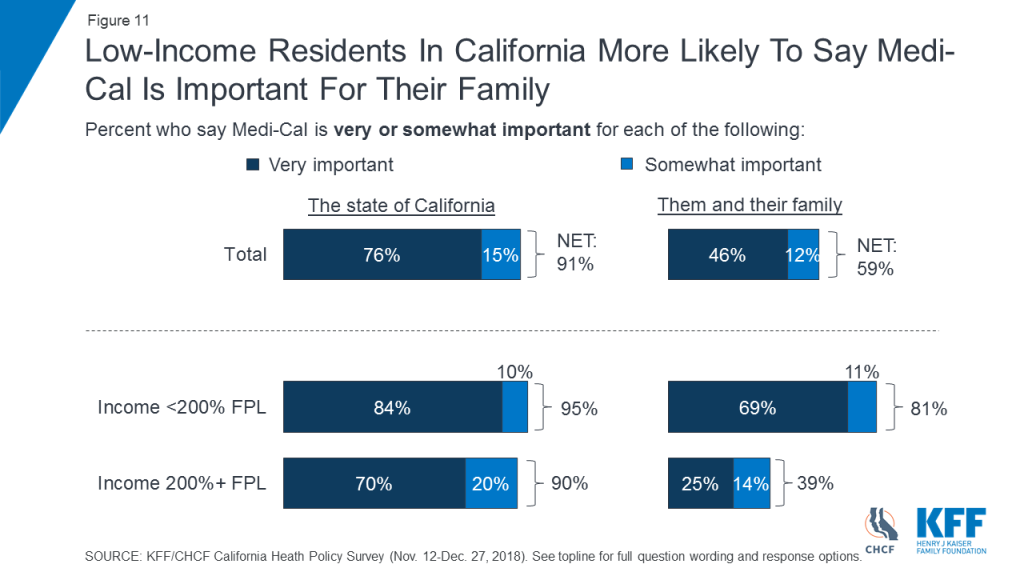
An overwhelming majority of low-income Californians say Medi-Cal is “very important” (84 percent) or “somewhat important” (10 percent) to the state. Eight in ten (81 percent) say it is either “very important” (69 percent) or “somewhat important” (11 percent) to them and their family. While an overwhelming majority of Californians with higher incomes also see Medi-Cal as important to the state (90 percent), they are less likely than those with low incomes to say the program is important to their own families (39 percent versus 81 percent) (Figure 11).
Figure 11: Low-Income Residents In California More Likely To Say Medi-Cal Is Important For Their Family
Survey Methodology
The Kaiser Family Foundation/California Health Care Foundation California Health Policy Survey was conducted by telephone November 12 – December 27, 2018, among a random representative sample of 1,404 adults age 18 and older living in the state of California (note: persons without a telephone could not be included in the random selection process). Figures in the report may not add to 100 due to rounding. Interviews were administered in English and Spanish, combining random samples of both landline (476) and cellular telephones (928, including 668 who had no landline telephone). Sampling, data collection, weighting and tabulation were managed by SSRS in close collaboration with Kaiser Family Foundation and California Health Care Foundation researchers. The California Health Care Foundation paid for the costs of the survey fieldwork, and Kaiser Family Foundation contributed the time of its research staff. Both partners worked together to design the survey and analyze the results.
The sampling and screening procedures were designed to increase the number of Black and Asian-American respondents and low-income respondents, including those who have health insurance through Medi-Cal or who are uninsured. This oversample allowed for sufficient numbers of respondents in these subgroups to report their results separately; weighting adjustments were made to adjust their proportions to represent their actual shares of the population in overall results (see weighting description below). The sample included 463 respondents who were reached by calling back respondents in California who had previously completed an interview on either the SSRS Omnibus poll or the Kaiser Health Tracking Polls and indicated they fit one of the oversample criteria (Black, Asian, or low-income respondents, including low-income respondents with Medi-Cal or who are uninsured, and are living in California). It also included 46 respondents with prepaid (or pay-as-you-go) cell phone numbers in California, a group that is disproportionately lower-income.
The dual frame cellular and landline phone sample was generated by Marketing Systems Group (MSG) using random digit dial (RDD) procedures. The RDD frames were stratified by income-level in order to reach more low-income respondents. To address the fact that some qualifying respondents could be reached only by their cell-phone but had an out-of-state phone number, the sample was augmented with a sample of phone numbers outside of California associated with a billing address that indicated in-state residence (n=89). Survey Sampling International (SSI) generated these numbers randomly using Smart Cell sample. All respondents were screened to verify that they resided in California. For the landline sample, respondents were selected by asking for the youngest adult male or female currently at home based on a random rotation. If no one of that gender was available, interviewers asked to speak with the youngest adult of the opposite gender. For the cell phone sample, interviews were conducted with the qualifying adult who answered the phone.
A multi-stage weighting design was applied to ensure an accurate representation of the California adult population. The first stage of weighting involved corrections for sample design, including accounting for the components, the likelihood of non-response for the re-contacted sample, and an adjustment to account for the fact that respondents with both a landline and cell phone have a higher probability of selection. In the second weighting stage, demographic adjustments were applied, at first, to the RDD and Smart Cell sample to account for systematic non-response along known population parameters. Population parameters included gender, age, race, Hispanic ethnicity (broken down by nativity), educational attainment, phone status (cell phone only or reachable by landline), and state region. Demographic parameters were based on estimates from the U.S. Census Bureau’s March 2017 American Community Survey (ACS), and telephone use was based on data for California from the 2016 National Health Interview Survey. Based on this second stage of weighting, estimates were derived for self-reported income as a percentage of the federal poverty level (less than 200%, 200% or higher) by insurance status (Medi-Cal, uninsured, all else) in the California population. The last stage of weighting included all respondents and used poverty level by insurance status, based on the previous stage’s outcomes, as an additional weighting parameter.
The margin of sampling error including the design effect for the full sample is plus or minus 3 percentage points. Numbers of interviews and margins of sampling error for the subgroups analyzed in this report are shown in the table below. Sample sizes and margins of sampling error for other subgroups are available by request.
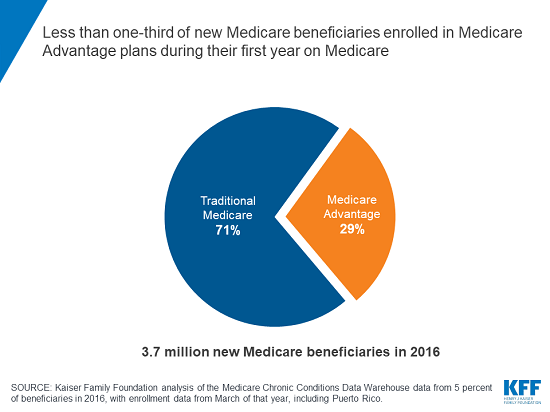
Twenty-nine percent of new beneficiaries chose to enroll in Medicare Advantage during their first year in Medicare in 2016, finds a new KFF analysis.
That level generally matches the overall share of beneficiaries who opted for Medicare Advantage that year, but does not support the view that the aging Baby Boom generation, having had more experience with HMOs and PPOs during their working years, would select the private plans over traditional Medicare at relatively high rates. In fact, the share of new beneficiaries choosing Medicare Advantage has increased only modestly over the years.
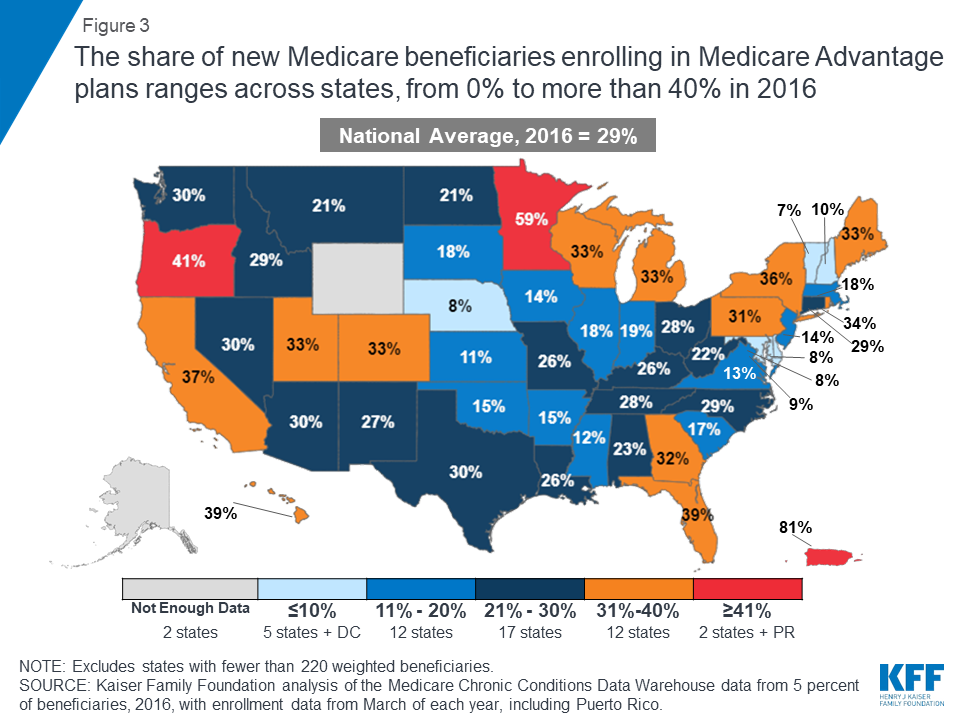
The share choosing Medicare Advantage in their first year varies considerably across states and counties, however. Less than 11 percent of new beneficiaries picked Medicare Advantage in Delaware, Maryland, Nebraska, New Hampshire, Vermont and the District of Columbia, to cite a few examples, while more than 40 percent selected such plans in Oregon and Minnesota.
The analysis examines Medicare Advantage enrollment rates among new beneficiaries over time, by geographic location and according to age and other characteristics of enrollees.
A second, updated analysis of Medicare Advantage provides 2019 data on enrollment, premiums and out-of-pocket limits. In 2019, 34 percent of all Medicare beneficiaries, or 22 million people, are enrolled in the private plans.
People new to Medicare can receive their Medicare benefits through either traditional Medicare or private plans, such as HMOs or PPOs, known as Medicare Advantage plans. Older adults and younger beneficiaries with disabilities have said that they make this choice based on premiums and out-of-pocket costs, access to desired providers, the reputation of the company offering the plan, ads and other marketing materials, and the advice of brokers, family members and friends.1 Medicare Advantage offers one-stop shopping, with all Medicare benefits in one combined package, and enrollees may have lower out-of-pocket costs than those in traditional Medicare, with an out-of-pocket cap and coverage of some additional benefits, such as eyeglasses. Beneficiaries in traditional Medicare have open access to providers and fewer administrative hassles, such as prior authorization and referral requirements.2
One line of thinking has been that the Baby Boom Generation will enroll in Medicare Advantage plans over traditional Medicare at much higher rates than prior generations because they have had more experience with managed care during their working years. Our prior analysis found that, in 2011, nearly one in four people enrolled in Medicare Advantage plans during their first year on Medicare.3 This brief examines whether the rate has increased with more boomers aging onto Medicare, and whether these coverage decisions vary by geographic area and select characteristics. The analysis is based on a five percent sample of claims from 2010 to 2016.
Enrollment Rates
In 2016, Less than one-third (29 percent) of new beneficiaries enrolled in Medicare Advantage plans during their first year on Medicare, slightly more than the 23 percent observed in 2011, but far from a majority (Figure 1). Most new beneficiaries (71 percent) were covered under traditional Medicare for their first year on Medicare.
Figure 1: Less than one-third of new Medicare beneficiaries enrolled in Medicare Advantage plans during their first year on Medicare
Enrollment Rates, By Year
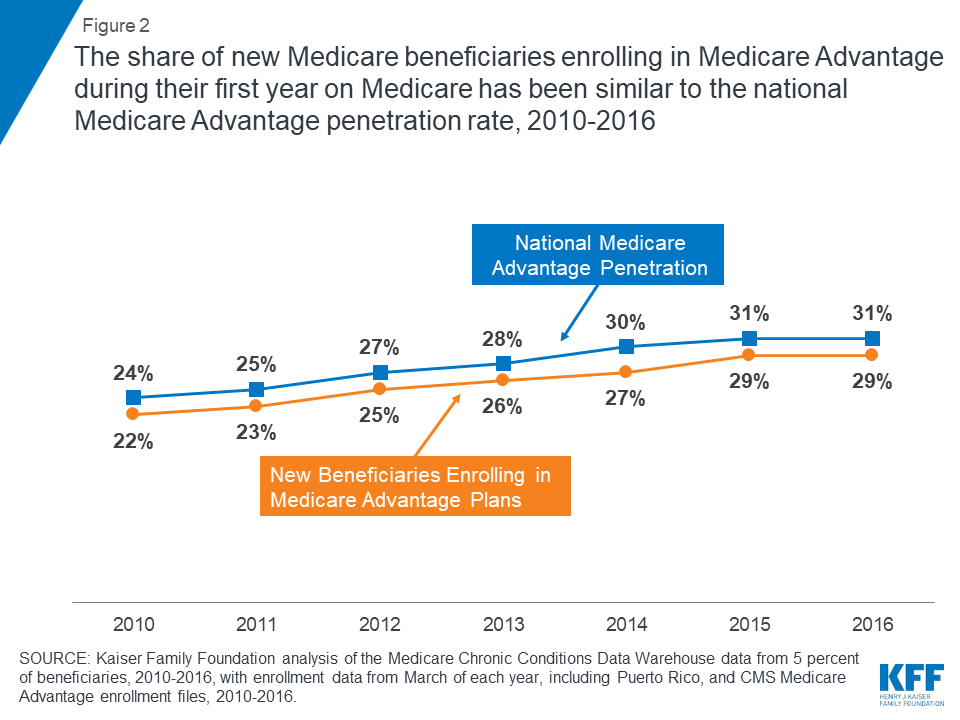
Enrollment in Medicare Advantage by new beneficiaries has tracked closely with the national Medicare Advantage penetration rate (Figure 2). In 2010, about 22 percent of new Medicare beneficiaries enrolled in Medicare Advantage plans, while that same year, a similar percentage of all Medicare beneficiaries (24 percent) enrolled in Medicare Advantage plans. More recently, in 2016, less than one-third of new Medicare beneficiaries (29 percent) enrolled in Medicare Advantage plans, which is similar to the national Medicare Advantage penetration rate among all Medicare beneficiaries that year (31 percent).
Figure 2: The share of new Medicare beneficiaries enrolling in Medicare Advantage during their first year on Medicare has been similar to the national Medicare Advantage penetration rate, 2010-2016
Enrollment Rates, By State
The share of new beneficiaries enrolling in Medicare Advantage plans during their first year on Medicare varies greatly across the country (Figure 3). In two states (Oregon and Minnesota) and Puerto Rico, more than 40 percent of new beneficiaries enrolled in Medicare Advantage in 2016. However in five states (Delaware, Maryland, Nebraska, New Hampshire, and Vermont) and the District of Columbia, less than 11 percent of new beneficiaries enrolled in Medicare Advantage plans, while the vast majority were instead choosing traditional Medicare when they first enrolled in Medicare.
Figure 3: The share of new Medicare beneficiaries enrolling in Medicare Advantage plans ranges across states, from 0% to more than 40% in 2016
Enrollment Rates Across Counties
The share of new beneficiaries that enrolled in Medicare Advantage plans also varied across counties. In counties as diverse as Atlantic, NJ (Atlantic City), Baltimore City, MD, Monterey, CA, and Shawnee, KS (Topeka), less than 11 percent of new beneficiaries enrolled in Medicare Advantage plans in 2016. In contrast, in counties such as Monroe, NY (Rochester), Miami-Dade, FL (Miami), Allegheny, PA (Pittsburgh), and Multnomah, OR (Portland), more than half of new beneficiaries enrolled in a Medicare Advantage plan during their first year on Medicare. Additionally, these large differences in Medicare Advantage enrollment among new beneficiaries may help explain why some believe most new beneficiaries are enrolling in Medicare Advantage, which is the case in a minority of counties.
Enrollment Rates, By Medicare Advantage Penetration in the County
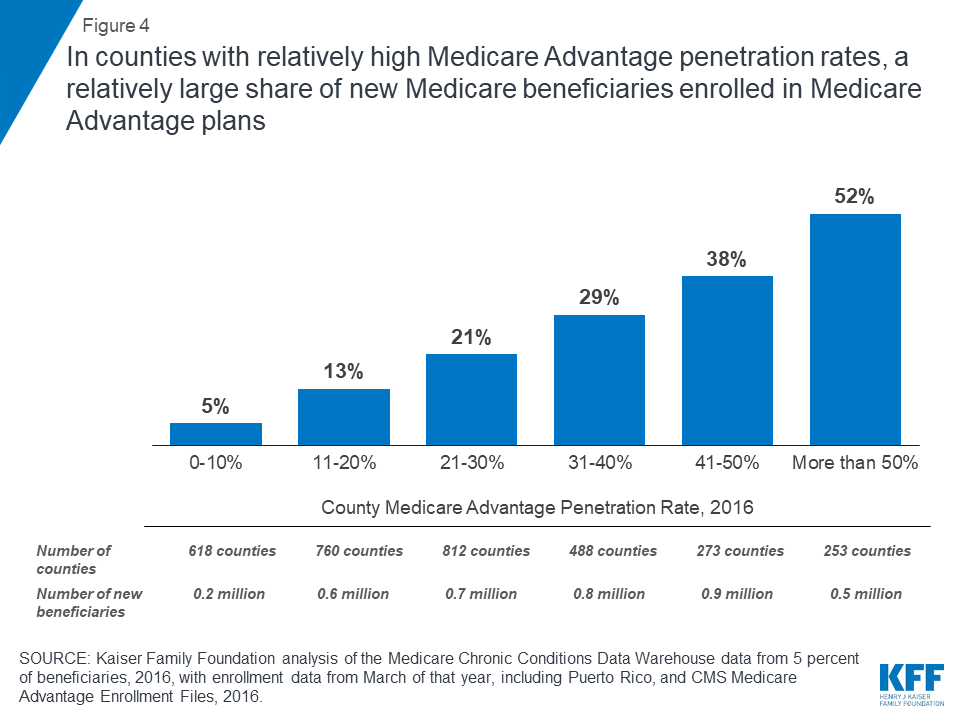
On average, the share of new beneficiaries enrolling in Medicare Advantage plans is higher in counties with higher Medicare Advantage penetration rates (Figure 4). In counties where more than half of all beneficiaries were enrolled in Medicare Advantage plans, 52 percent of new beneficiaries enrolled in Medicare Advantage plans, on average, in 2016. In contrast, in counties where 10 percent or fewer beneficiaries were enrolled in Medicare Advantage plans, only 5 percent of new beneficiaries enrolled in Medicare Advantage plans, on average.
Figure 4: In counties with relatively high Medicare Advantage penetration rates, a relatively large share of new Medicare beneficiaries enrolled in Medicare Advantage plans
Enrollment rates, By Number Of Medicare Beneficiaries In The County
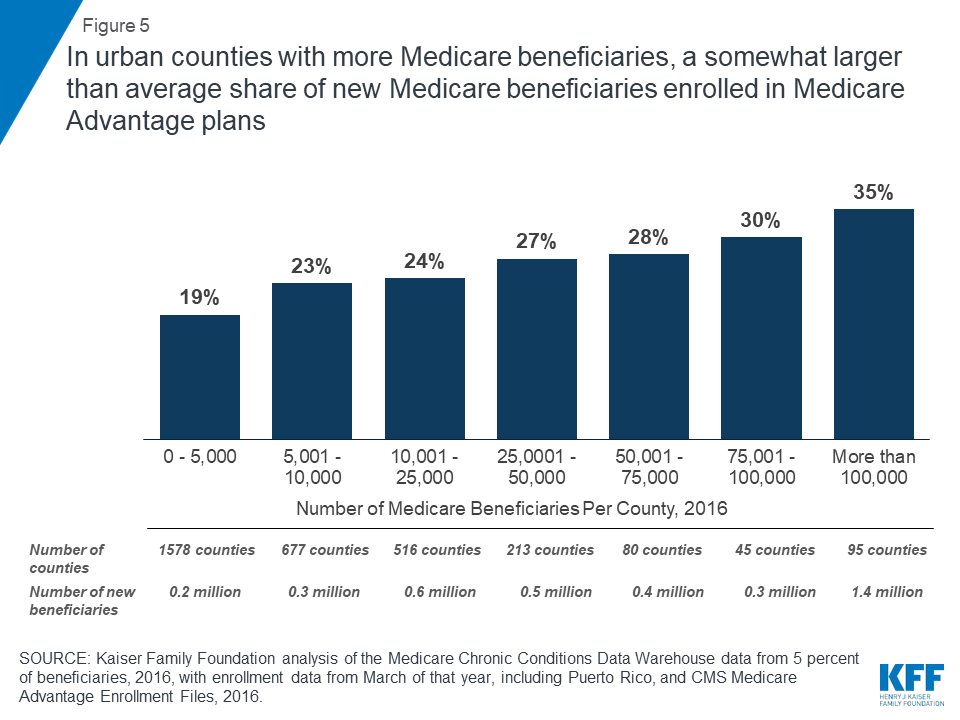
New beneficiaries enroll in Medicare Advantage plans at higher rates in areas with more Medicare beneficiaries (Figure 5). In counties with more than 100,000 Medicare beneficiaries, about one-third (35 percent) of new Medicare beneficiaries enrolled in Medicare Advantage plans, on average, in 2016. In smaller counties with 5,000 or fewer beneficiaries, about one-fifth (19 percent) of new beneficiaries enrolled in Medicare Advantage plans, on average.
Figure 5: In urban counties with more Medicare beneficiaries, a somewhat larger than average share of new Medicare beneficiaries enrolled in Medicare Advantage plans
Enrollment Rates Across Select Characteristics
enrollment rates, BY AGE
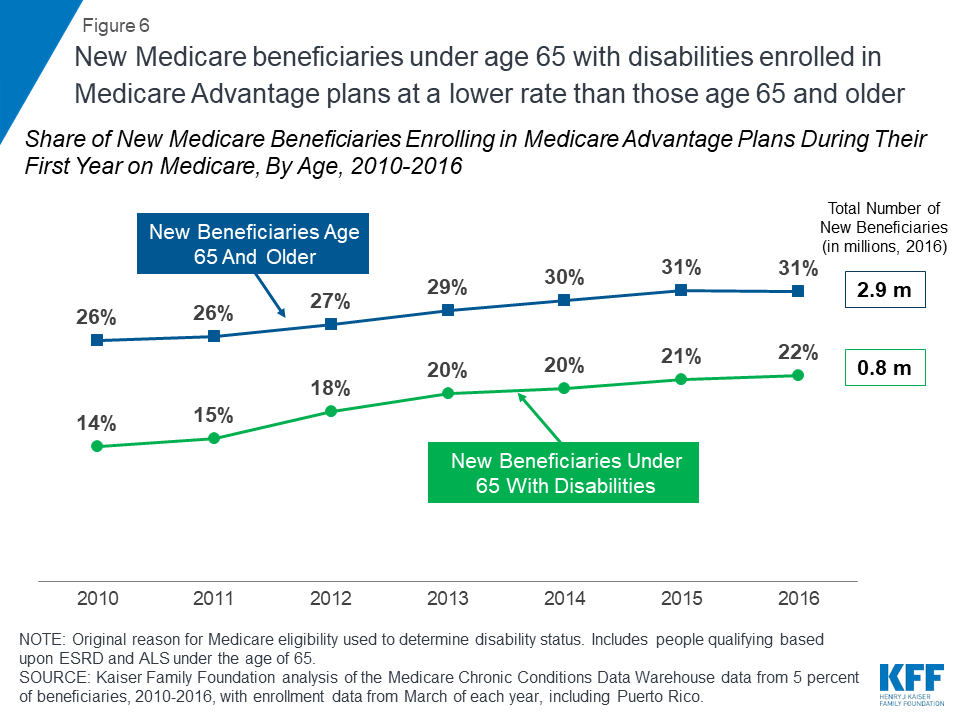
People under the age of 65 who became eligible for Medicare because of a serious disability enrolled in Medicare Advantage plans at consistently lower rates than new beneficiaries who qualified for Medicare because they were age 65 or older (22 versus 31 percent, respectively, in 2016; Figure 6). It is not clear why younger beneficiaries with serious disabilities enroll in Medicare Advantage plans at lower rates than people ages 65 and older, but these findings warrant further attention.
Figure 6: New Medicare beneficiaries under age 65 with disabilities enrolled in Medicare Advantage plans at a lower rate than those age 65 and older
Enrollment rates, By Medicare-Medicaid Status
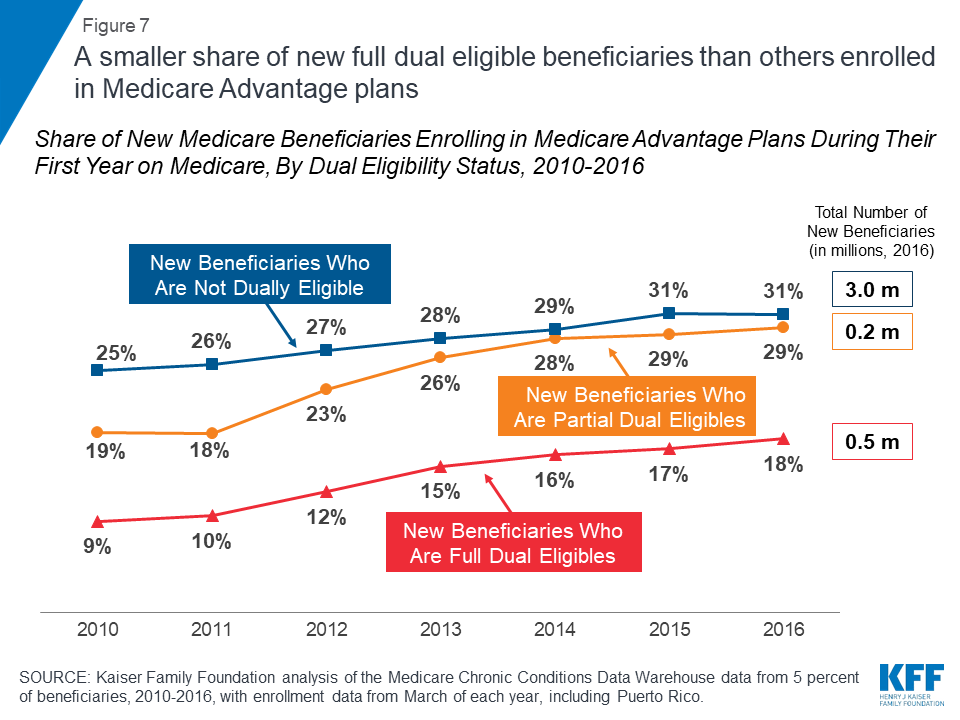
The Medicare Advantage enrollment rate among new beneficiaries who received full Medicaid benefits (“full dual eligibles”) was lower than among new beneficiaries not eligible for Medicaid in 2016 (18 percent versus 31 percent, respectively, Figure 7). New beneficiaries who receive partial Medicaid benefits (“partial dual eligibles”) opted into Medicare Advantage during their first year on Medicare at about the same rate as those who were not eligible for Medicaid. It is unclear why full dual eligibles are opting into Medicare Advantage plans at lower rates than others; it may be because they have significant health needs and are reluctant to join a plan with a limited provider network. Those who are less healthy may also be less attracted to plans’ extra benefits, such as gym memberships, and full dual eligibles may be less drawn to plans’ out-of-pocket limits if Medicaid is covering their cost-sharing requirements.
Figure 7: A smaller share of new full dual eligible beneficiaries than others enrolled in Medicare Advantage plans
Discussion
Less than one-third (29 percent) of new Medicare beneficiaries enrolled in Medicare Advantage plans during their first year on Medicare, a rate slightly lower than the national Medicare Advantage penetration rate in 2016. While the Congressional Budget Office is projecting a steady increase in Medicare Advantage enrollment, rising to 47 percent by 2029, even with an aging Baby Boom Generation, the majority of new beneficiaries are opting for traditional Medicare in the year they first go on Medicare. The relatively low enrollment rates among new beneficiaries with high needs may warrant further scrutiny. While Medicare Advantage enrollment among new beneficiaries is rising, these findings suggest that ongoing attention to traditional Medicare is needed to meet the needs of the lion’s share of the Medicare population.
Gretchen Jacobson, Tricia Neuman, and Meredith Freed are with KFF.Anthony Damico is an independent consultant.
Data and Methods
The brief uses claims data from a five percent sample of Medicare beneficiaries from the Master Beneficiary Summary Files of Chronic Conditions Data Warehouse of the Center for Medicare and Medicaid Services (CMS) for 2010 through 2016. The data was used in conjunction with the Medicare Advantage landscape file and enrollment file for each year. The analysis includes new beneficiaries residing in areas where no Medicare Advantage plans were available for individual enrollment, totaling about 30,000 new beneficiaries in 2016. The analysis was unable to exclude beneficiaries with retiree health coverage, who would likely use whichever coverage option, Medicare Advantage or traditional Medicare, their former employer or union would fund. The analysis included new beneficiaries who were automatically enrolled into Medicare-Medicaid demonstration plans in the denominator of Medicare Advantage enrollees because they did not make a voluntary choice.
Neuman, Patricia and Gretchen A. Jacobson. Medicare Advantage Checkup. New England Journal of Medicine. November 2018. Issue 379, page 2163-2172. ↩︎
Jacobson, Gretchen A., Patricia Neuman, and Anthony Damico. At Least Half of New Medicare Advantage Enrollees Had Switched From Traditional Medicare During 2006-11. Health Affairs. January 2015. Volume 34, Issue 1. https://www.healthaffairs.org/doi/full/10.1377/hlthaff.2014.0218↩︎
The Medicare Part D program provides an outpatient prescription drug benefit to older adults and people with long-term disabilities in Medicare who enroll in private plans, including stand-alone prescription drug plans (PDPs) to supplement traditional Medicare and Medicare Advantage prescription drug plans (MA-PDs) that include drug coverage and other Medicare-covered benefits. This analysis provides the latest data about Medicare Part D coverage and costs in 2019 and trends over time.
1. Medicare Part D enrollment has doubled since 2006, now totaling 45 million people in 2019
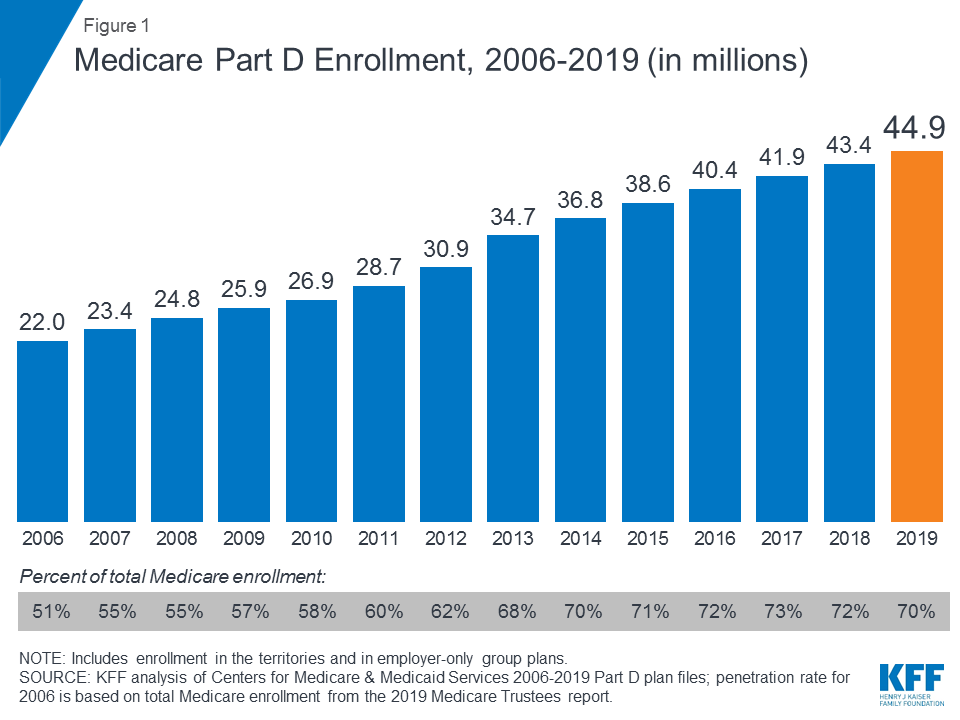
Figure 1: Medicare Part D Enrollment, 2006-2019 (in millions)
A total of 45 million people with Medicare are currently enrolled in plans that provide the Medicare Part D drug benefit, representing 70 percent of all Medicare beneficiaries. This total includes plans open to everyone with Medicare, including stand-alone PDPs and MA-PDs, and plans for retirees of a former employer or union. Part D enrollment has doubled since the program started in 2006, when the number of enrollees was 22.0 million, or roughly half of all Medicare beneficiaries.
2. For the first time since the Part D program started in 2006, enrollment in stand-alone drug plans has decreased somewhat, while enrollment in Medicare Advantage drug plans continues to increase
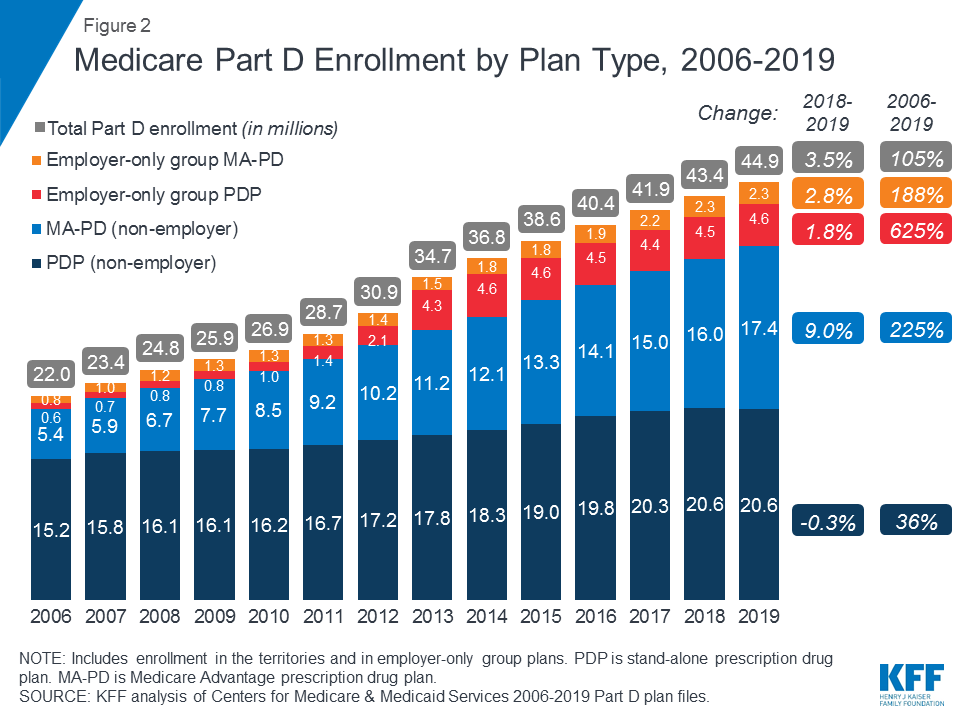
Figure 2: Medicare Part D Enrollment by Plan Type, 2006-2019
In 2019, close to half of all Part D enrollees are enrolled in stand-alone PDPs (46%), but nearly 4 in 10 (39%) are in Medicare Advantage prescription drug plans (MA-PDs). The remaining 15 percent of Part D enrollees are in employer/union group plans, both PDPs and MA-PDs. Over time, enrollment in MA-PDs has increased, reflecting enrollment growth in Medicare Advantage plans overall. Between 2018 and 2019, the number of MA-PD enrollees increased by 9 percent, from 16.0 million to 17.4 million, while enrollment in PDPs fell by a modest 0.3 percent, from 20.64 million to 20.57 million.
3. Three firms—UnitedHealth, Humana, and CVS Health—cover nearly 60 percent of all Medicare Part D enrollees in 2019
Figure 3: Distribution of Medicare Part D Enrollment by Firm in 2019
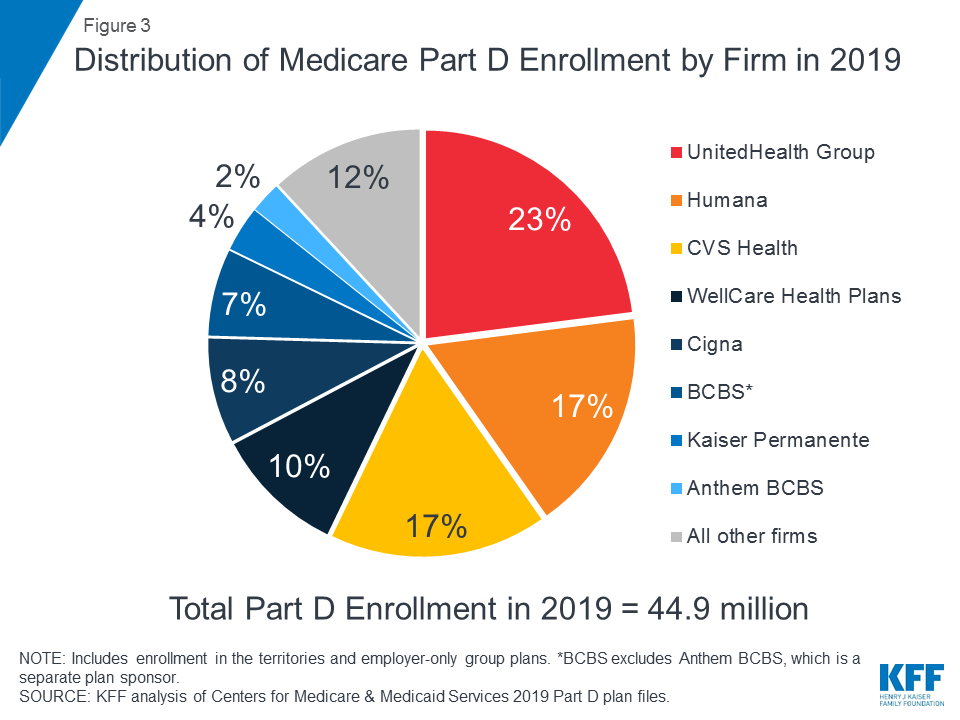
The top three firms—UnitedHealth, Humana, and CVS Health—cover nearly 60 percent of all beneficiaries enrolled in Part D in 2019 (57%), while the top five firms—including WellCare and Cigna—account for three-quarters (75%) of Part D enrollment (see also Table 1). The recent acquisitions of Aetna by CVS Health and Express Scripts by Cigna have resulted in further consolidation of the Part D marketplace. In particular, between 2018 and 2019, Cigna increased its market share from 3 percent to 8 percent, while CVS Health increased its market share from 14 percent to 17 percent. Under the CVS Health-Aetna merger, Aetna divested its stand-alone PDP business to WellCare, resulting in a more than doubling of WellCare’s Part D market share, from 4 percent in 2018 to 10 percent in 2019.
4. CVS Health, UnitedHealth, and Humana have the most stand-alone PDP enrollees in 2019, but PDP enrollment in each firm decreased modestly from 2018
Figure 4: Distribution of Medicare Part D Stand-alone Drug Plan Enrollment by Firm, 2018-2019 (in millions)
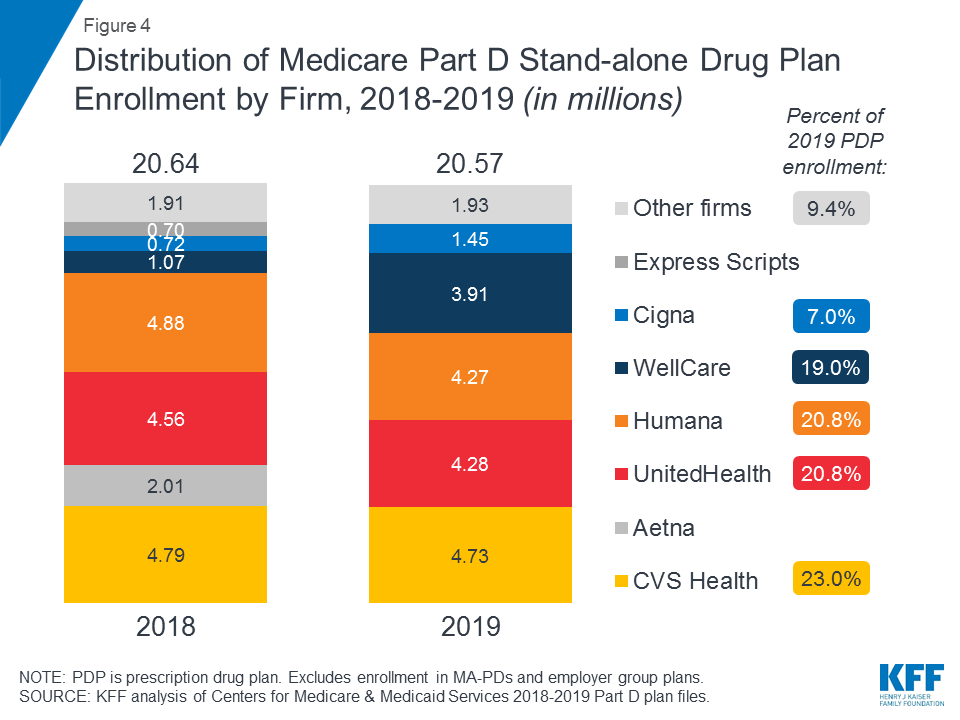
In 2019, 9 out of 10 stand-alone drug plan enrollees are in plans sponsored by five firms—CVS Health, UnitedHealth, Humana, WellCare, and Cigna. Enrollment in PDPs sponsored by CVS Health, which has the most stand-alone drug plan enrollees in 2019, increased over time through acquisition of other plan sponsors, while UnitedHealth and Humana have had large market shares since the Part D program began (data not shown). However, enrollment in PDPs sponsored by the three largest firms declined between 2018 and 2019, while WellCare and Cigna gained PDP enrollees in part due to merger activity: specifically, Cigna’s acquisition of Express Scripts and the divestiture of Aetna’s PDP enrollment to WellCare pursuant to the acquisition of Aetna by CVS.
The decline in Humana’s PDP enrollment between 2018 and 2019 was driven by a large drop in enrollment in the Humana Walmart Rx PDP, which may be attributable to a 37% increase in the average monthly premium for this PDP (from $20 in 2018 to $28 in 2019). This plan was among the lowest-premium PDPs in all regions in 2018, but that is no longer the case in 2019.
5. Based on enrollment decisions for 2019, the average monthly premium for stand-alone PDPs decreased by 4% in 2019 to $40, after several years of modest increases
Figure 5: Average Monthly Premium for Medicare Part D Plans, 2006-2019
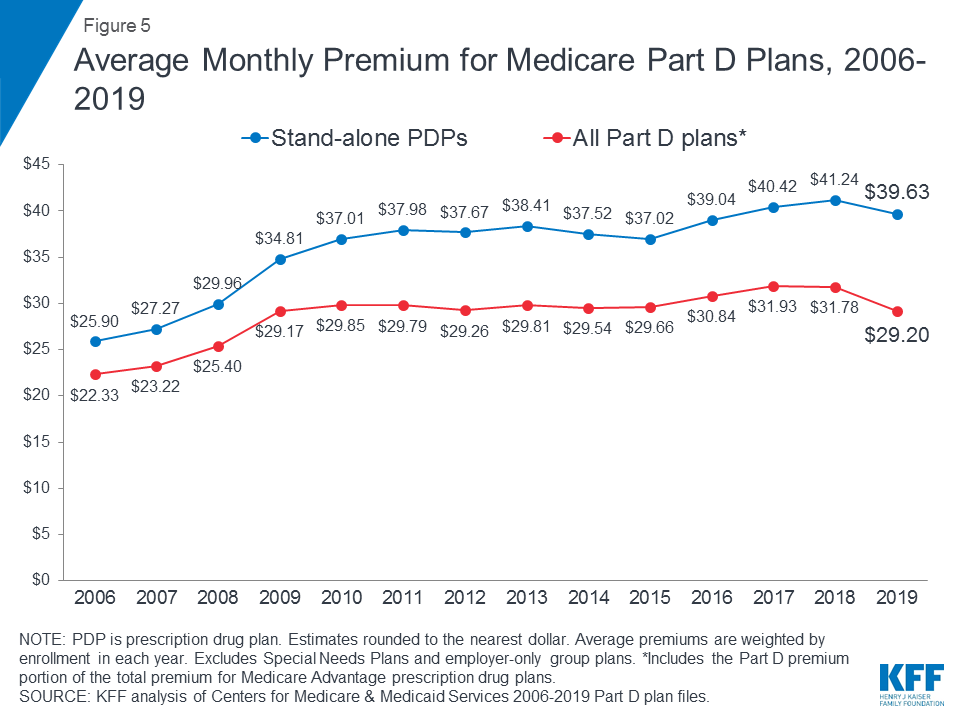
In 2019, PDP enrollees are in plans with a weighted average monthly premium of $39.63, a 4 percent reduction (-$1.61) from 2018. The average monthly PDP premium amount has remained within a few dollars of this amount since 2010. The combined average Part D premium for PDP and MA-PD enrollees is $29.20 in 2019, a reduction of 8 percent (-$2.58) from 2018. The overall Part D premium is lower than the average for stand-alone PDPs due in part to the ability of MA-PD sponsors to use rebate dollars from Medicare payments for benefits covered under Parts A and B to lower their Part D premiums.
6. Monthly premiums for the top 10 PDPs by enrollment vary, but most are lower than the national average
Figure 6: Weighted Average Monthly Premiums and Enrollment Shares for the Top 10 Stand-alone PDPs in 2019
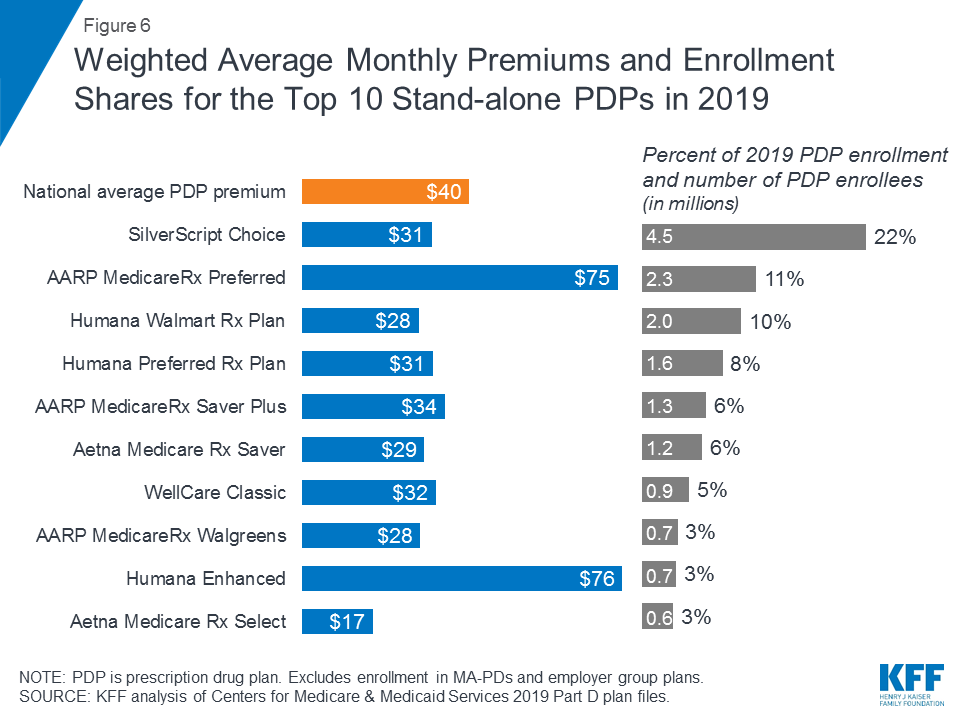
Average monthly premiums in 2019 vary widely among the most popular PDPs, but most are lower than the $40 weighted national average PDP premium. Average premiums range from $17 per month for Aetna Medicare Rx Select to 4.5 times more for Humana Enhanced ($76 per month) and AARP MedicareRx Preferred ($75 per month). The average monthly premium for Silverscript Choice, the PDP with the most enrollees in 2019 (roughly 1 in 5 PDP enrollees (22%) or 4.5 million), is $31, while the 2.3 million enrollees in the second largest PDP in 2019, AARP MedicareRx Preferred, pay $75 per month, on average.
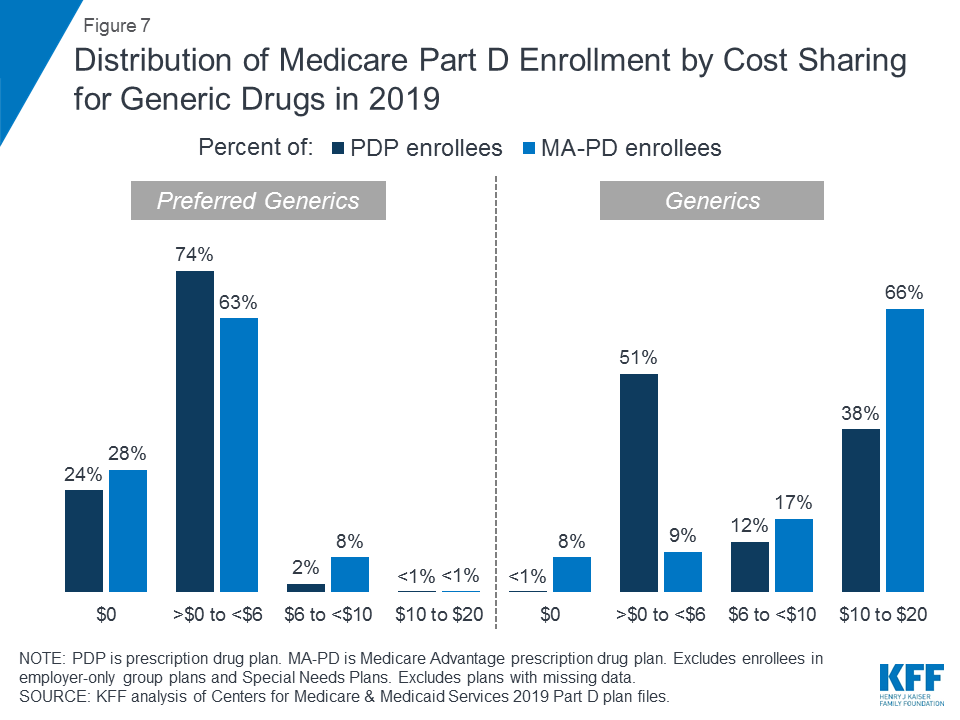
7. Most Part D enrollees face relatively low cost sharing for preferred generic drugs, but higher amounts for generics not on the preferred tier
Figure 7: Distribution of Medicare Part D Enrollment by Cost Sharing for Generic Drugs in 2019
Around one-fourth of Part D enrollees (both PDP and MA-PD enrollees) pay $0 for preferred generics in 2019, but many pay $10 or more for generics that are not on the preferred tier. For preferred generics, 24 percent of PDP enrollees and 28 percent of MA-PD enrollees have a $0 copayment, while 74 percent of PDP enrollees and 63 percent of MA-PD enrollees face copays greater than $0 but less than $6. For generic drugs that are not on the preferred generic tier, nearly 4 in 10 PDP enrollees (38%) and 66 percent of MA-PD enrollees pay between $10 and $20. (See also Table 2)
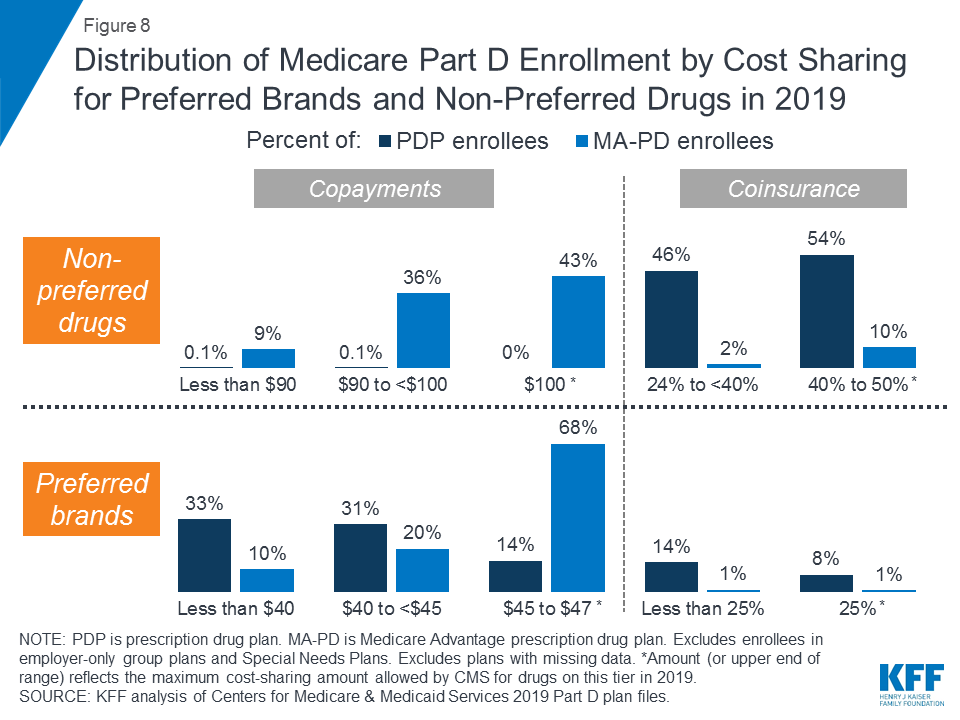
8. For non-preferred drugs, most MA-PD enrollees face copayments while most PDP enrollees face coinsurance; for preferred brands, copayments are more common than coinsurance for both types of enrollees
Figure 8: Distribution of Medicare Part D Enrollment by Cost Sharing for Preferred Brands and Non-Preferred Drugs in 2019
For non-preferred drugs, virtually all PDP enrollees pay coinsurance between 24 percent and 50 percent in 2019, while most MA-PD enrollees (79%) pay copayments between $90 and $100. For preferred brands, nearly two-thirds of PDP enrollees (64%) pay copayments less than $45 in 2019, while roughly the same share of MA-PD enrollees (68%) pay $45 to $47. For both types of drugs, the upper end of the cost-sharing range—$100 or 50 percent for non-preferred drugs; $47 or 25 percent for preferred brands—is the maximum cost-sharing amount allowed by CMS for drugs on these tiers in 2019.
For drugs placed on the specialty tier, many Part D enrollees pay coinsurance of 33 percent, the maximum allowed for specialty tier drugs (data not shown). Nearly 4 in 10 PDP enrollees (39%) and close to half of all MA-PD enrollees (46%) are in plans that charge the maximum 33 percent coinsurance rate for specialty tier drugs, defined by CMS as those that cost at least $670 per month. Only those plans that waive some or all of the standard deductible are permitted to set the specialty tier coinsurance rate above 25 percent. (See Table 2)
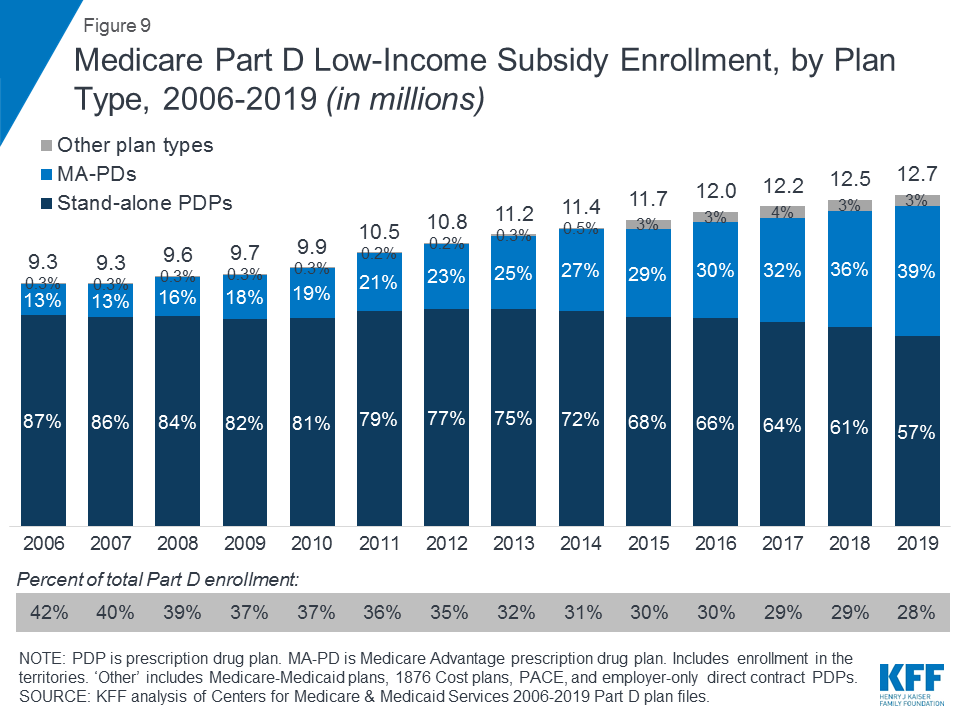
9. In 2019, roughly 3 in 10 Part D enrollees receive low-income subsidies (LIS) to help pay their Part D premiums and cost sharing, but the share of enrollees receiving these subsidies has declined over time
Figure 9: Medicare Part D Low-Income Subsidy Enrollment, by Plan Type, 2006-2019 (in millions)
In 2019, nearly 13 million Part D enrollees—roughly 3 in 10—receive premium and cost-sharing assistance through the Part D Low-Income Subsidy (LIS) program. These additional financial subsidies, also called “Extra Help,” pay Part D premiums for eligible beneficiaries, as long as they enroll in stand-alone PDPs designated as premium-free “benchmark” plans, and reduce cost sharing. Reflecting overall trends in Part D enrollment, the share of LIS enrollees in stand-alone PDPs has declined over time, from 87 percent in 2006 to 57 percent in 2019, while the share in MA-PDs has increased, from 13 percent in 2006 to 39 percent in 2019.
Overall, the share of Part D enrollees receiving low-income subsidies has declined over time, from 42 percent of Part D enrollees in 2006 to 28 percent in 2019. The rate of growth in LIS enrollment (2.4% compound annual growth rate between 2006 and 2019) has not kept pace with the rate of growth in Part D enrollment overall (5.7% between 2006 and 2019) or in total Medicare enrollment (3.6% between 2007 and 2019).
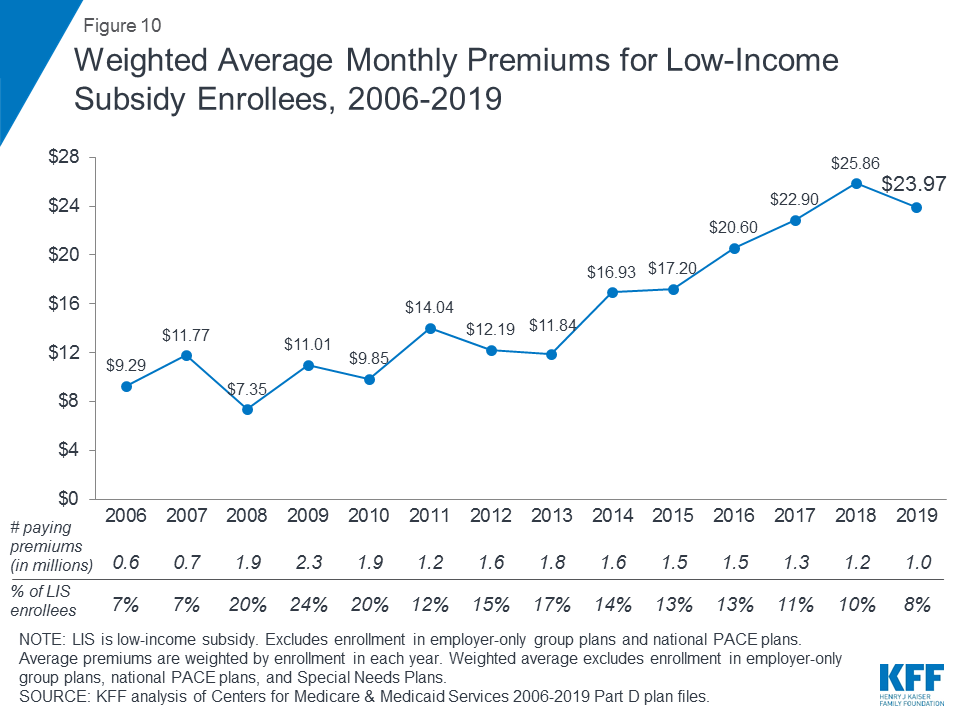
10. In 2019, around 1 in 10 low-income subsidy enrollees pay an average of nearly $24 per month for Part D coverage because they are not enrolled in a premium-free plan
Figure 10: Weighted Average Monthly Premiums for Low-Income Subsidy Enrollees, 2006-2019
In 2019, 1.0 million LIS beneficiaries (8% of all LIS beneficiaries) pay a premium for Part D coverage, even though they may be able to obtain coverage without paying a premium by enrolling in a benchmark PDP. This total includes 0.7 million PDP enrollees who are not enrolled in benchmark PDPs, and more than 0.3 million enrollees in MA-PDs that charge a premium. MA-PDs are not designated as benchmark plans by CMS, although most of the LIS enrollees in MA-PDs are currently enrolled in zero-premium plans. On average, the 1.0 million LIS beneficiaries paying Part D premiums in 2019 pay nearly $24 per month, or nearly $300 per year. This amount is down 7 percent (-$1.89) from 2018, but is 2.6 times the amount in 2006.
Juliette Cubanski and Tricia Neuman are with KFF.Anthony Damico is an independent consultant.
Data and Methods
This analysis uses data from the Centers for Medicare & Medicaid services (CMS) Part D Enrollment, Benefit, Landscape, and Low Income Subsidy files for the respective year, with enrollment data from March of each year. The analysis excludes plans with small enrollment counts in estimates that are plan-enrollment weighted. For analysis of cost sharing for formulary tiers in PDPs and MA-PDs, we did not analyze which drugs are on what tier under each type of plan and whether this has changed over time, factors which would also influence enrollees’ out-of-pocket costs.
Tables
Table 1: Top Firms Offering Medicare Part D Plans Ranked by 2019 Enrollment
Name of firm
2019 Enrollment
Percent of totalPart D enrollment
PDP
MA-PD
Total
UnitedHealth Group
5,108,180
5,215,144
10,323,324
23%
Humana
4,299,086
3,473,709
7,772,795
17%
CVS Health
5,979,883
1,602,402
7,582,285
17%
WellCare Health Plans
4,015,902
531,189
4,547,091
10%
Cigna
3,237,013
433,296
3,670,309
8%
BCBS*
998,355
2,037,224
3,035,579
7%
Kaiser Permanente
–
1,575,636
1,575,636
4%
Anthem BCBS
428,699
647,159
1,075,858
2%
Total, top firms
24,067,118
15,515,759
39,582,877
88%
Total Part D
25,152,764
19,773,155
44,925,919
100%
NOTE: PDP is prescription drug plan. MA-PD is Medicare Advantage prescription drug plan. Includes enrollment in the territories and employer group plans. Number may not sum to total due to rounding. *BCBS excludes Anthem BCBS, which is a separate plan sponsor.SOURCE: KFF analysis of Centers for Medicare & Medicaid Services 2019 Part D plan files.
Table 2: Medicare Part D Cost-Sharing Amounts by Plan Type and Formulary Tier, 2019
PDP
MA-PD
Formulary tier
Minimum
Median
Maximum
Minimum
Median
Maximum
Preferred generic
$0
$1
$10
$0
$2
$15
Generic
$0
$5
$20
$0
$10
$20
Preferred brand copayments
$19
$40
$47
$0
$47
$47
Preferred brand coinsurance
10%
20%
25%
15%
22%
25%
Non-preferred drug copayments
$70
$70
$93
$5
$99
$100
Non-preferred drug coinsurance
25%
40%
50%
24%
45%
50%
Specialty
25%
25%
33%
25%
31%
33%
NOTE: PDP is prescription drug plan. MA-PD is Medicare Advantage prescription drug plan. Cost-sharing amounts are weighted by enrollment. Excludes enrollees in employer-only group plans and Special Needs Plans. Excludes plans with missing data.SOURCE: KFF analysis of Centers for Medicare & Medicaid Services 2019 Part D plan files.
Table 1: State Indicators of Medicaid’s Role in Addressing the Opioid Epidemic
State
Opioid Overdose Death Rate per 100,000 (2017)
Number of Opioid Overdose Deaths (2017)
Medicaid Coverage of MAT Drugs (2018)
IMD Exclusion Waiver for SUD Treatment (2019)
Prescription Opioids
Heroin
Synthetic Opioids
United States
14.9
14,495
15,482
28,466
M – 41, B – 51,N – 51
21 Approved,7 Pending
Alabama
9.0
141
125
198
M, B, N
No
Alaska
13.9
47
36
37
M, B, N
Approved
Arizona
13.5
349
334
267
M, B, N
Pending
Arkansas
6.5
116
15
68
B, N
No
California
5.3
973
715
536
M, B, N
Approved
Colorado
10.0
254
224
112
M, B, N
No
Connecticut
27.7
188
425
686
M, B, N
No
Delaware
27.8
64
121
178
M, B, N
Pending
District of Columbia
34.7
39
127
182
M, B, N
No
Florida
16.3
1,133
707
2,126
M, B, N
No
Georgia
9.7
513
263
419
M, B, N
No
Hawaii
3.4
33
10
N/A
M, B, N
No
Idaho
6.2
55
23
22
B, N
No
Illinois
17.2
494
1,187
1,251
M, B, N
Approved
Indiana
18.8
390
327
649
M, B, N
Approved
Iowa
6.9
95
61
92
M, B, N
No
Kansas
5.1
74
25
32
B, N
Approved
Kentucky
27.9
399
269
780
B, N
Approved
Louisiana
9.3
161
162
156
B, N
Approved
Maine
29.9
75
76
278
M, B, N
No
Maryland
32.2
524
522
1,542
M, B, N
Approved
Massachusetts
28.2
254
466
1,649
M, B, N
Approved
Michigan
21.2
510
783
1,368
M, B, N
Pending
Minnesota
7.8
150
111
184
M, B, N
Pending
Mississippi
6.4
89
34
81
M, B, N
No
Missouri
16.5
226
299
618
M, B, N
No
Montana
3.6
22
N/A
N/A
M, B, N
No
Nebraska
3.1
32
N/A
25
B, N
Pending
Nevada
13.3
239
94
66
M, B, N
No
New Hampshire
34.0
51
28
374
M, B, N
Approved
New Jersey
22.0
424
1,085
1,376
M, B, N
Approved
New Mexico
16.7
144
144
75
M, B, N
Approved
New York
16.1
821
1,356
2,238
M, B, N
No
North Carolina
19.8
573
537
1,285
M, B, N
Approved
North Dakota
4.8
18
N/A
12
B, N
No
Ohio
39.2
854
1,000
3,523
M, B, N
Pending
Oklahoma
10.2
226
61
102
M, B, N
No
Oregon
8.1
124
124
85
M, B, N
No
Pennsylvania
21.2
564
819
1,982
M, B, N
Approved
Rhode Island
26.9
74
14
201
M, B, N
Approved
South Carolina
15.5
312
153
404
B, N
No
South Dakota
4.0
14
N/A
14
M, B, N
No
Tennessee
19.3
592
311
590
B, N
Pending
Texas
5.1
535
569
348
M, B, N
No
Utah
15.5
290
147
92
M, B, N
Approved
Vermont
20.0
27
41
77
M, B, N
Approved
Virginia
14.8
336
556
829
M, B, N
Approved
Washington
9.6
250
306
143
M, B, N
Approved
West Virginia
49.6
279
244
618
M, B, N
Approved
Wisconsin
16.9
318
414
466
M, B, N
Approved
Wyoming
8.7
30
N/A
17
B, N
No
NOTE: Overdose deaths by type of opioid are not mutually exclusive and should not be summed. Synthetic opioid deaths do not include deaths due to methadone. Medication-Assisted Treatment (MAT) drugs are: methadone (M), buprenorphine (B), and naltrexone (N). Naltrexone includes both oral and injectable. An IMD (Institution for Mental Disease) is an inpatient facility with over 16 beds.Sources for this table are available at: http://kff.org/infographic/medicaids-role-in-address-opioid-epidemic.
SOURCES
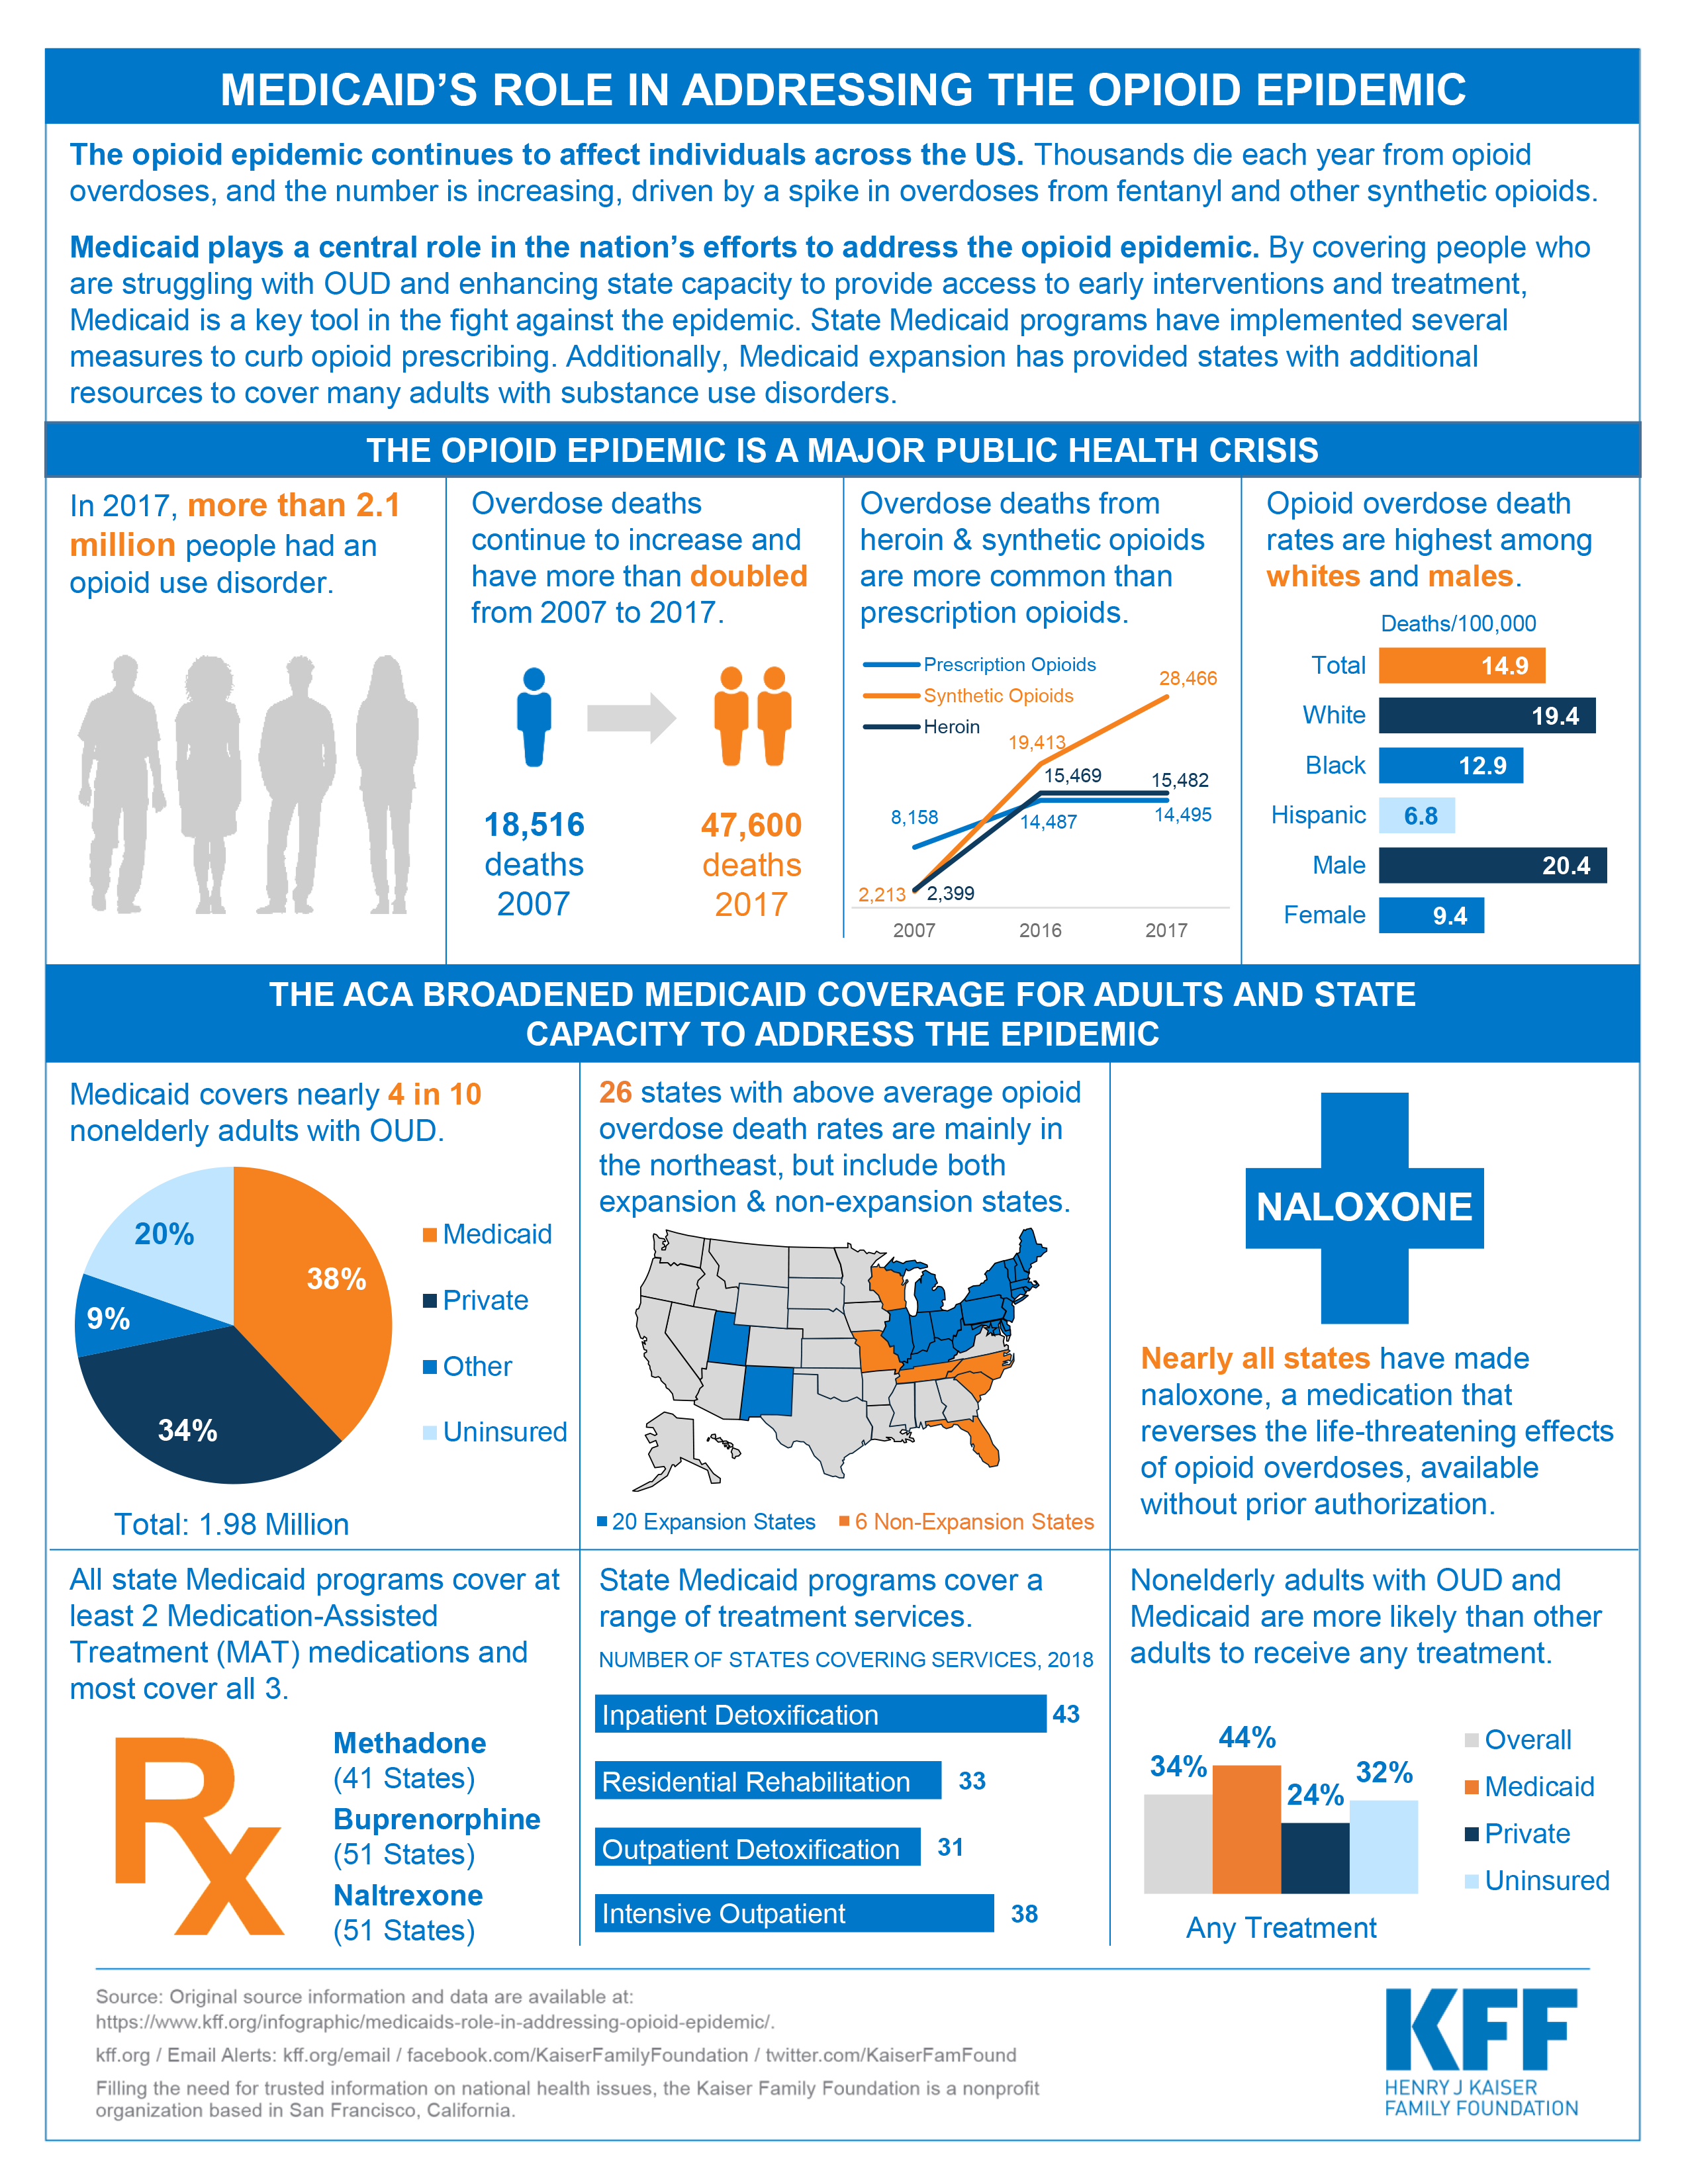
Total number of individuals with OUD in 2017: KFF analysis of the 2017 National Survey on Drug Use and Health (NSDUH). Note: the total number of individuals with OUD is for those ages 12 and older.
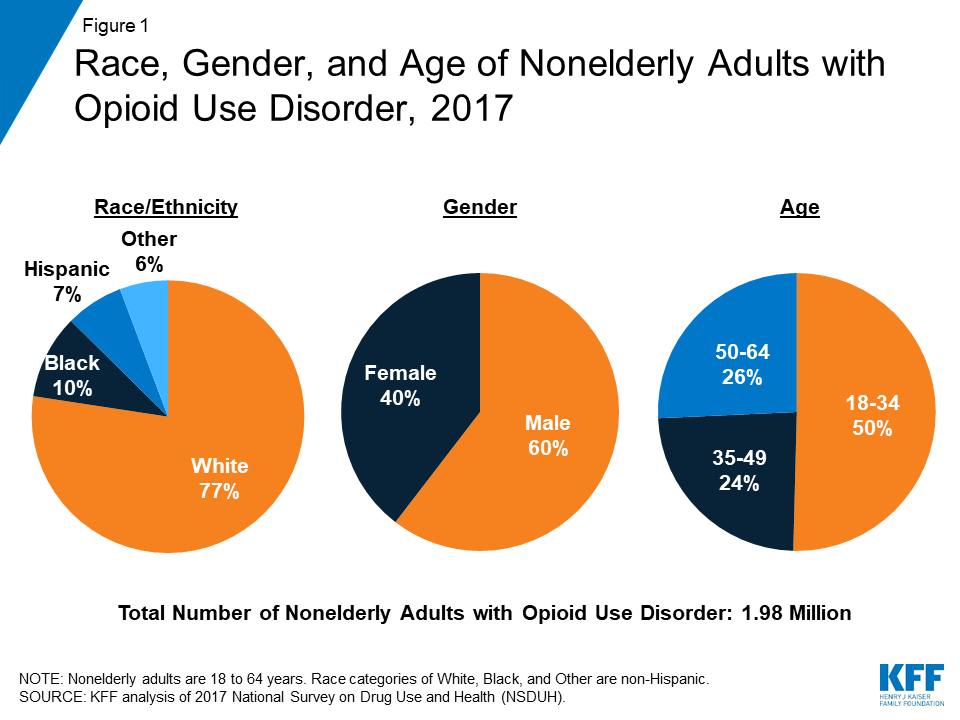
Insurance coverage of nonelderly adults with OUD: KFF analysis of 2017 NSDUH. Note: nonelderly adults are 18-64 years. Other includes Medicare, CHAMPUS, and any other type of health insurance.
Insurance coverage and treatment: KFF analysis of 2017 NSDUH. Note: Nonelderly adults are 18 to 64 years. Any treatment includes to receiving treatment at any of the following in the past year: inpatient hospital, residential rehabilitation, outpatient rehabilitation, mental health center, and private doctors’ office.
Table 1 State Indicators of Medicaid’s Role in Addressing the Opioid Epidemic:
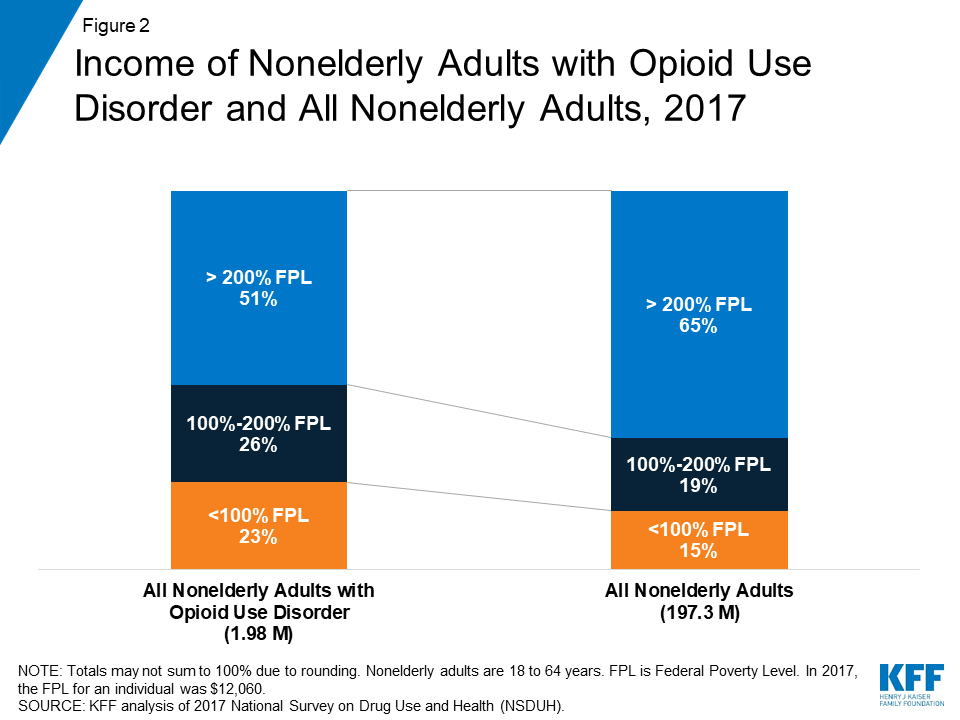
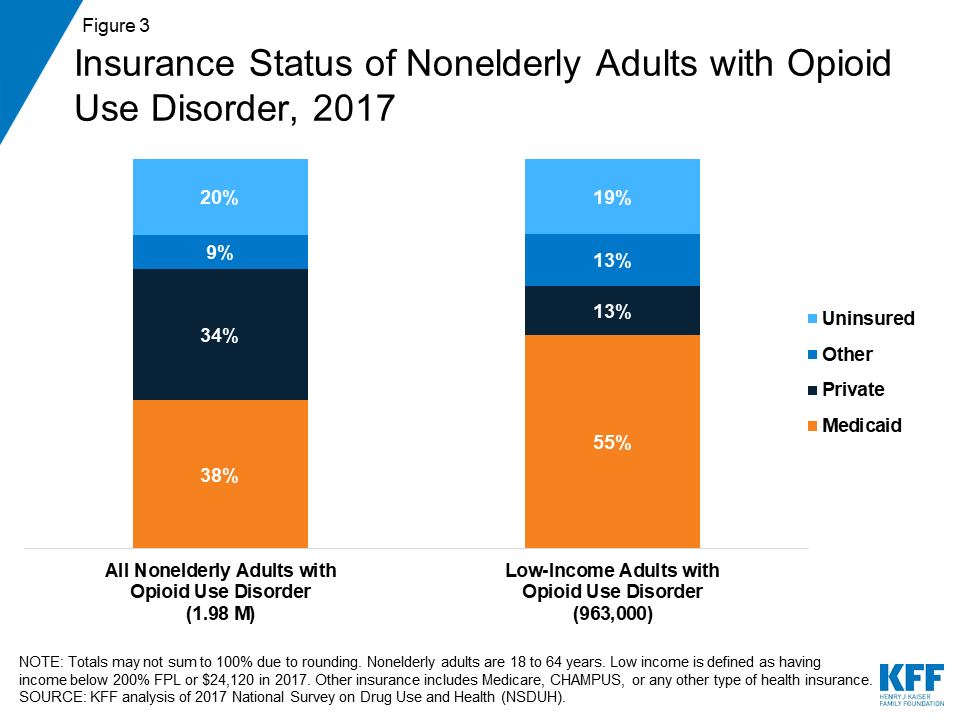
In 2017, nearly two million nonelderly adults in the United States had an opioid use disorder (OUD), and of these adults, nearly four in ten were covered by Medicaid. This brief examines Medicaid’s role in facilitating access to treatment for OUD. Key findings include:
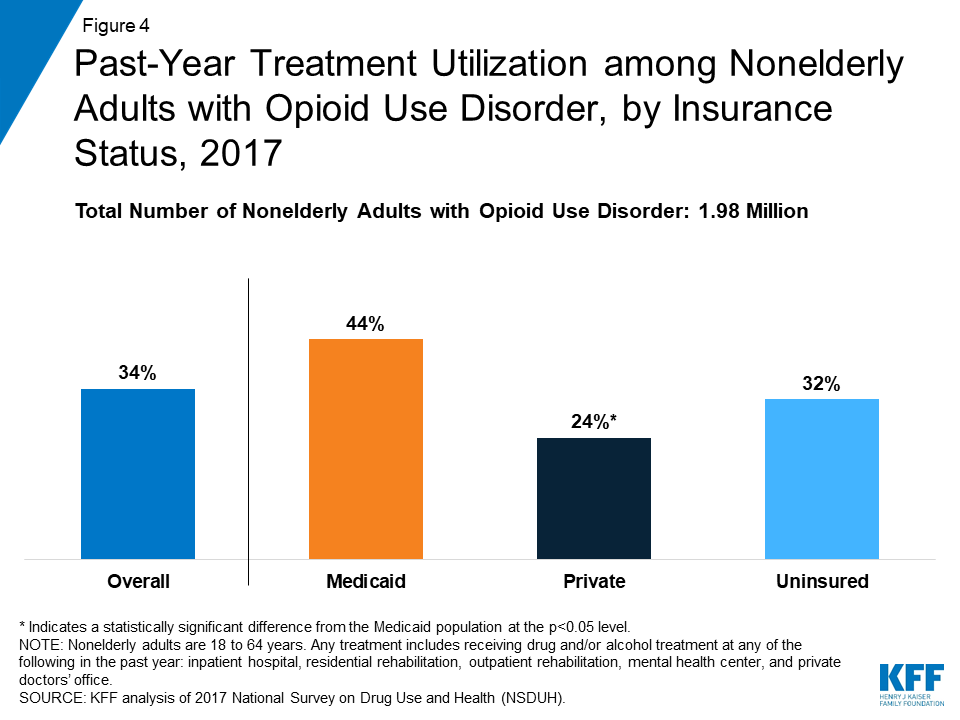
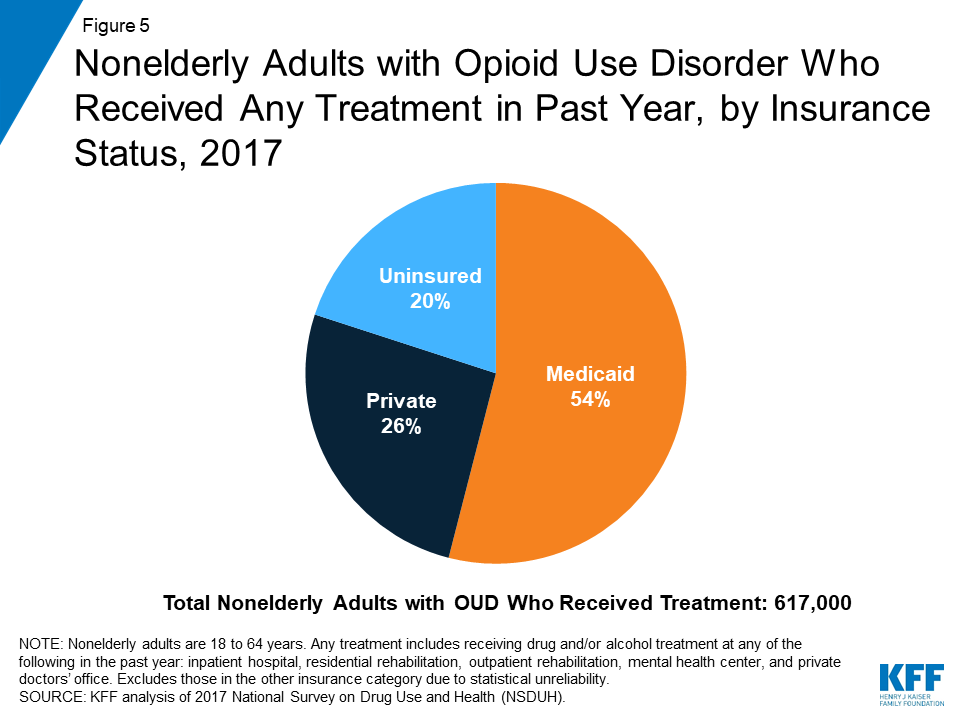
Among nonelderly adults with OUD, those with Medicaid were more likely than those with other coverage to have received treatment in 2017.
Medicaid facilitates access to treatment by covering inpatient and outpatient treatment services, as well as medications and therapy prescribed as part of Medication-Assisted Treatment (MAT).
States use Medicaid Section 1115 waivers and other program authorities to expand treatment options for enrollees with OUD.
While additional states expanding Medicaid could increase coverage and access, for new work and premium requirements could impose barriers to obtaining and maintaining Medicaid coverage.
Introduction
As the opioid epidemic continues to devastate many parts of the country, Medicaid plays an important role in efforts to address the crisis. In 2017, nearly two million nonelderly adults had opioid use disorder (OUD)1,2 and there were 47,600 opioid overdose deaths in the United States, more than double the number in 2007. Medicaid has historically filled critical gaps in responding to public health crises, such as the AIDS epidemic in the 1980s and the Flint water crisis. As with these other public health crises, Medicaid provides health coverage and access to necessary health care for those struggling with OUD. Additionally, as of May 2019, 36 states and Washington, D.C. have adopted Medicaid expansion, with enhanced federal funding, to cover adults with income up to 138% of the federal poverty level ($17,236 for an individual in 2019). All Medicaid expansion benefit packages must include behavioral health services, including mental health and substance use disorder services.
Based on data from the 2017 National Survey on Drug Use and Health, this brief describes nonelderly adults with OUD, including their demographic characteristics and insurance status, and compares utilization of treatment services among those with Medicaid to those with other types of coverage. It also describes Medicaid financing for opioid treatment and the ways in which Medicaid promotes access to treatment for enrollees with OUD.
Characteristics of Nonelderly Adults with Opioid Use Disorder
Individuals with OUD were predominantly white, male, and young adults. In 2017, more than three in four (77%) of the nearly two million nonelderly adults with OUD were non-Hispanic, White (Figure 1). Those with OUD were also more likely to be male (60%), although the epidemic has reached an increasingly large share of women in recent years, including many pregnant women.3 Additionally, half were between the ages of 18 and 34.
Figure 1: Race, Gender, and Age of Nonelderly Adults with Opioid Use Disorder, 2017
Nearly half of nonelderly adults with OUD had low incomes and almost a quarter were living in poverty. In 2017, 49% of adults with OUD had incomes below 200% FPL ($24,120 for an individual in 2017), compared to only 34% of all nonelderly adults (Figure 2). Additionally, almost a quarter (23%) of those with OUD were poor compared to just 15% of all nonelderly adults.
Figure 2: Income of Nonelderly Adults with Opioid Use Disorder and All Nonelderly Adults, 2017
Medicaid covered a disproportionate share of nonelderly adults with OUD and an even greater share of those with low incomes. In 2017, nearly four in ten (38%) were covered by Medicaid, more than double the share of all nonelderly adults covered by Medicaid (16%).4 A similar share of adults with OUD (34%) had private insurance, while one in five was uninsured (Figure 3). Among nonelderly adults with OUD with low incomes, over half (55%) were covered by Medicaid, while only 13% had private insurance and 19% were uninsured.
Figure 3: Insurance Status of Nonelderly Adults with Opioid Use Disorder, 2017
Utilization of Treatment Services Among Nonelderly Adults with Opioid Use Disorder
While overall receipt of drug and/or alcohol treatment was low among all nonelderly adults with OUD, those with Medicaid were significantly more likely to receive treatment than those with private coverage. In 2017, just over a third (34%) of adults with OUD received any drug and/or alcohol treatment in 2017 (Figure 4). However, those with Medicaid were nearly twice as likely as those with private insurance to have received drug and/or alcohol treatment (44% vs. 24%). Treatment can be delivered in an inpatient or outpatient setting and can be provided in numerous types of facilities, including hospitals, drug or alcohol rehabilitation facilities (for either inpatient or outpatient services), mental health centers, and private doctors’ offices, among other locations.
Figure 4: Past-Year Treatment Utilization among Nonelderly Adults with Opioid Use Disorder, by Insurance Status, 2017
Medicaid covered over half of all nonelderly adults with OUD who received drug and/or alcohol treatment in the past year. In 2017, 617,000 nonelderly adults with OUD reported receiving treatment during the previous year. Of these individuals, 54% had Medicaid coverage while only 26% had private insurance and 20% were uninsured (Figure 5).
Figure 5: Nonelderly Adults with Opioid Use Disorder Who Received Any Treatment in Past Year, by Insurance Status, 2017
Medicaid’s Role in Covering Opioid Use Disorder Treatment Services
State Medicaid programs cover numerous substance use disorder treatment services that fit into several state plan categories, including outpatient treatment, inpatient treatment, prescription drugs, and rehabilitation services. The standard of care for OUD is medication-assisted treatment (MAT), which combines one of three medications (methadone, buprenorphine, or naltrexone) with counseling and other support services.5 All state Medicaid programs cover at least one medication used as part of MAT and most cover all three of these medications.6 State Medicaid programs also cover many counseling and other support services, delivered either as part of MAT or separately. Most of these services are delivered at state option and include detoxification, intensive outpatient treatment, psychotherapy, peer support, supported employment, partial hospitalization, and inpatient treatment.7
Despite the general prohibition in federal law, there are some ways in which states can obtain federal Medicaid funds to pay for substance use disorder treatment services at “institutions for mental disease”(IMDs), an antiquated term in the statute.8 Federal law has historically prohibited Medicaid payments for services provided to adults age 21-64 in IMDs as a way to preserve state financing of these services.9 However, the final Medicaid managed care regulation that took effect in July 2015, codified pre-existing long-standing federal sub-regulatory guidance that allowed federal Medicaid payments for IMD services without a day limit.10 Additionally, in July 2015, the Centers for Medicare & Medicaid Services (CMS) released guidance stating that states could request federal funding for nonelderly adults primarily receiving substance use disorder services in IMDs through Section 1115 demonstration waivers.11 On November 1, 2017, CMS issued revised guidance that continues to allow states to seek Section 1115 waivers to pay for services provided in IMDs, including substance use disorder services.12 A number of states have sought waivers of the IMD exclusion specifically to expand treatment options for substance use disorder services. As of April 2019, CMS has approved waiver requests in 21 states to provide substance use disorder services in an IMD, and seven states have waiver applications pending with CMS.13 Most recently, the SUPPORT Act, comprehensive legislation addressing the opioid crisis, partially lifted the IMD payment exclusion by creating a new option for states to use federal Medicaid funds for nonelderly adults receiving IMD substance use disorder services up to 30 days a year,14 from October 1, 2019 through September 30, 2023.15
Many states have also applied for other Medicaid Section 1115 behavioral health waivers focused on treating individuals with substance use disorders, including OUD. CMS has approved Section 1115 waivers to expand community-based benefits, which enable states to provide additional services to individuals with behavioral health needs, including supportive housing, supported employment (such as job coaching), and peer recovery coaching. Additionally, CMS has approved waivers that allow states to expand Medicaid eligibility to cover additional populations with behavioral health needs and to implement certain delivery system reforms, such as physical and behavioral health integration and alternative payment models.16
Because of the large number of Medicaid enrollees with OUD and the breadth of treatment services that Medicaid covers, Medicaid finances a substantial proportion of substance use disorder treatment. In 2014, Medicaid financed more than one-fifth (21%) of substance use disorder treatment, which was slightly less than the share covered by all private insurers (22%) (Figure 6). Nine percent of all spending on addiction treatment came from out-of-pocket payments by individuals.17 By 2020, it is projected that Medicaid will finance 28% of substance use disorder treatment services, while other payer types are projected to remain the same.18
Figure 6: Spending for Substance Use Disorder Treatment, by Payer, 2014
Looking Ahead
As the opioid epidemic continues to ravage many parts of the country, particularly as fentanyl has become more pervasive,19 states are increasingly looking to Medicaid to expand coverage and treatment options to stem the crisis. In addition to covering MAT medications and therapy and numerous other treatment services, states are seeking waivers to allow payment for opioid treatment services provided in IMDs, to expand coverage of community-based benefits to support treatment and recovery, and to better integrate behavioral health services, including substance use disorder services with physical health services.
States that have not yet adopted the ACA’s Medicaid expansion can improve access to treatment by expanding Medicaid, which would enable them to cover many people with OUD who are currently uninsured. At the same time, using 1115 waivers to impose new requirements in Medicaid, including work requirements and premiums, could compromise efforts to address the opioid epidemic. Additional reporting requirements coupled with new premium requirements may also make it more difficult for eligible individuals to enroll in Medicaid and for those currently enrolled to keep their coverage. Utilization of treatment by adults with an OUD is already low; imposing new barriers to obtaining and maintaining Medicaid could further impede those battling OUD from getting the care they need.
Endnotes
Opioid use disorder is defined as the dependence or abuse of opioids in the past year. ↩︎
Kaiser Family Foundation analysis of the 2017 National Survey on Drug Use and Health (NSDUH). ↩︎
Jarlenski, M., Barry, C. L., Gollust, S., Graves, A. J., Kennedy-Hendricks, A., & Kozhimannil, K. (2017). Polysubstance Use Among US Women of Reproductive Age Who Use Opioids for Nonmedical Reasons. American journal of public health, 107(8), 1308–1310. doi:10.2105/AJPH.2017.303825, https://www.ncbi.nlm.nih.gov/pmc/articles/PMC5508143/. ↩︎
Kaiser Family Foundation analysis of the 2017 National Survey on Drug Use and Health (NSDUH). ↩︎
An IMD is a “hospital, nursing facility, or other institution of more than 16 beds, that is primarily engaged in providing diagnosis, treatment, or care of persons with mental diseases [sic], including medical attention, nursing care, and related services.” 42 U.S.C. § 1396d (i). ↩︎
Tami L. Mark, et al., “Insurance Financing Increased For Mental Health Conditions But Not For Substance Use Disorders, 1986-2014,” Health Affairs 35, no. 6 (June 2016):958-965. ↩︎
Substance Abuse and Mental Health Services Administration. Projections of National Expenditures for Treatment of Mental and Substance Use Disorders, 2010–2020. HHS Publication No. SMA-14-4883. Rockville, MD: Substance Abuse and Mental Health Services Administration, 2014, https://store.samhsa.gov/system/files/sma14-4883.pdf. ↩︎