KFF Health Tracking Poll – September 2019: Health Care Policy In Congress And On The Campaign Trail
Findings
Key Findings:
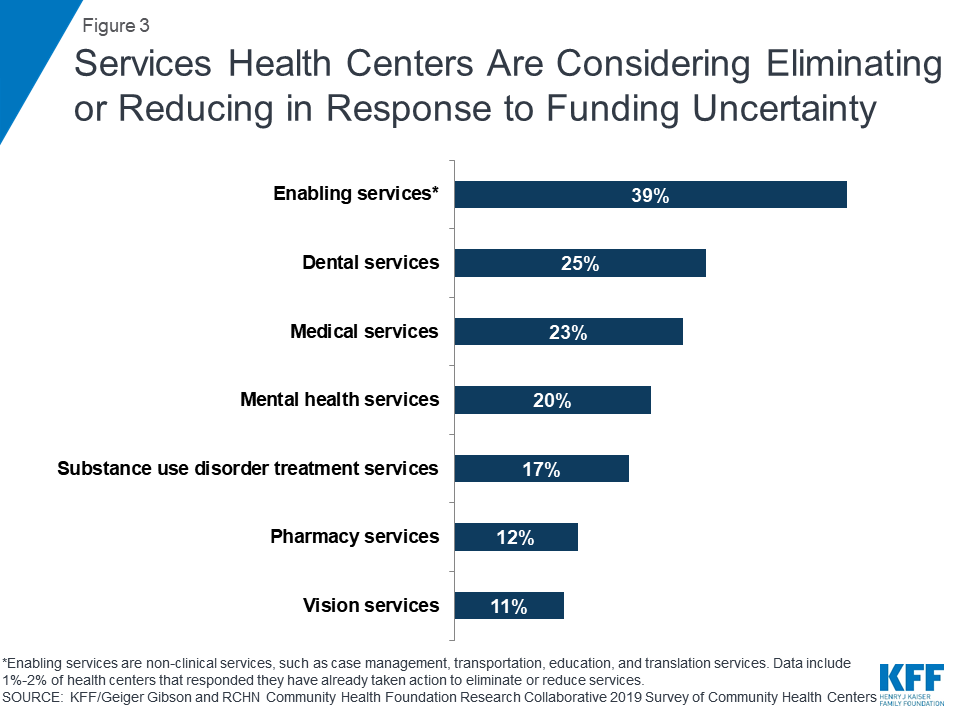
- Congress is back in session and the public sees many health care issues as a “top priority” for Congress to work on including lowering prescription drug costs (70%), making sure the Affordable Care Act’s (ACA) protections for people with pre-existing conditions continue (69%), lowering the amount people pay for health care (64%), and protecting people from surprise medical bills (56%).
- One of the health care issues that Congress may take on this fall is legislation aimed at dealing with “surprise medical bills.” This month’s KFF Health Tracking Poll finds nearly eight in ten (78%), including majorities of partisans, support legislation protecting patients from paying the cost of care not covered by their insurance when they receive care from a provider or hospital who is not in their network. A majority of the public (57%) continue to support this legislation even after hearing an opposing argument that this legislation would lead to doctors and hospitals being paid less.
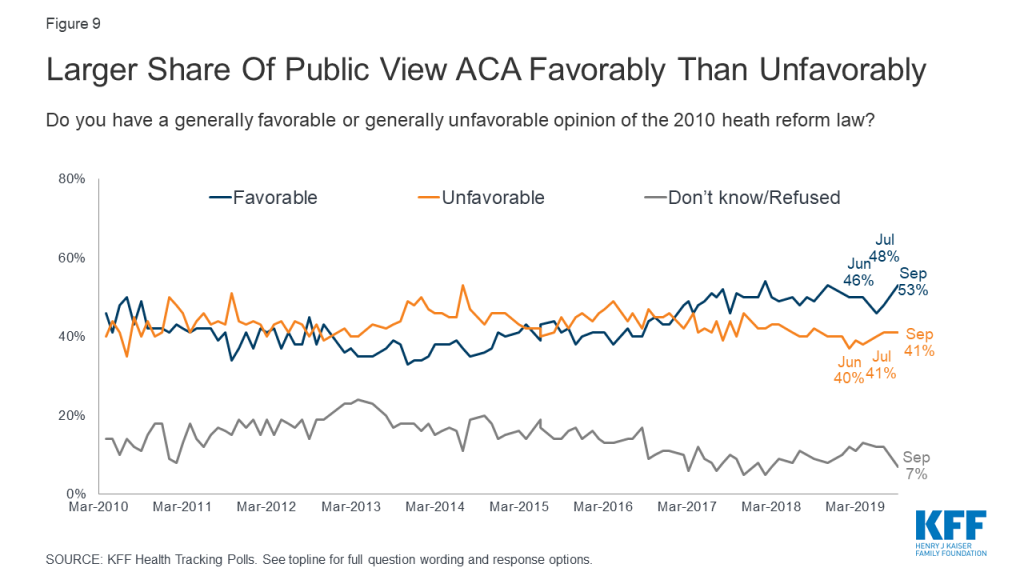
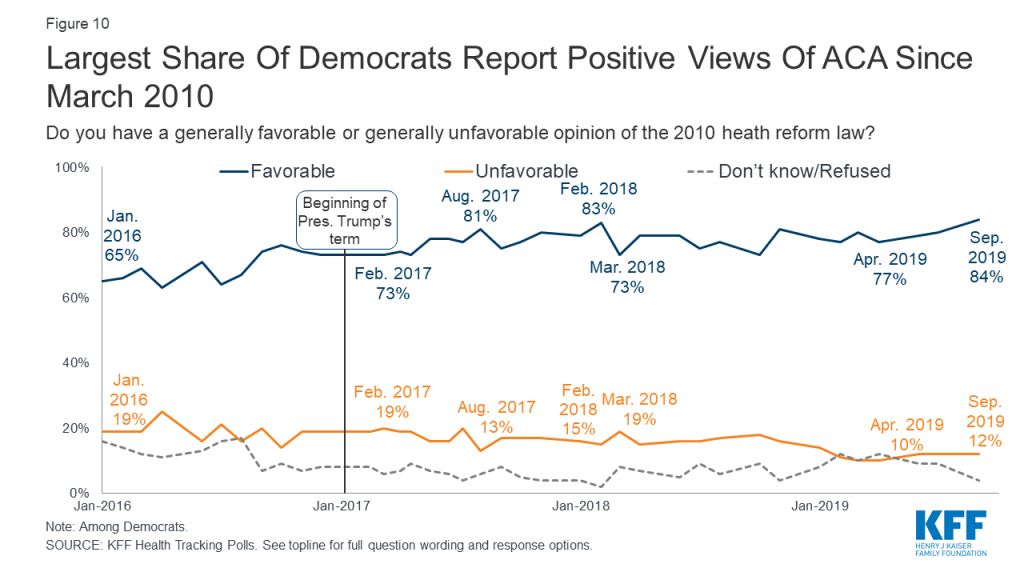
- Overall favorability of the ACA is slightly up this month (53%) with more than eight in ten Democrats viewing the ACA favorably (84%) – that is the largest share of Democrats with favorable views of the 2010 health reform law measured in the nine years of KFF Health Tracking Polls. The share of Democrats who hold favorable views of the ACA has increased 11 percentage points over President Trump’s term, up from 73% in February 2017.
55% of Democrats and Democratic-leaning independents prefer a presidential candidate who wants to build on the ACA, compared to 40% who prefer a candidate who would replace it with #MedicareForAll, via @KFF poll
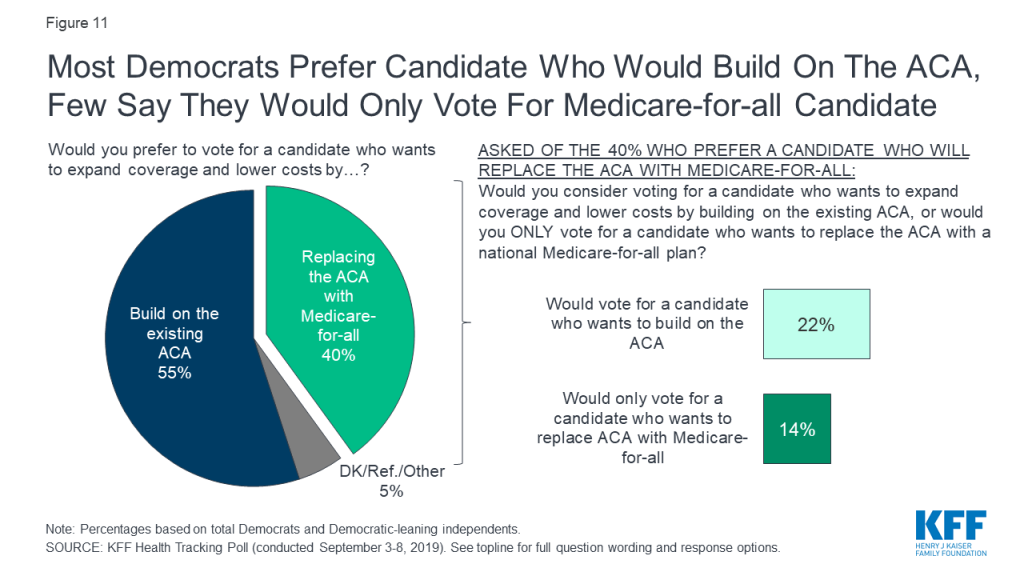
- With ACA favorability among Democrats at an all-time high, this month’s tracking poll also finds that leading up to the 2020 presidential election, most Democrats and Democratic-leaning independents would prefer to vote for a candidate who wants to build on the existing ACA in order to expand coverage and lower costs (55%) than replace the ACA with a national Medicare-for-all plan (40%). Among those who would prefer to vote for a candidate who wants to replace the ACA with a national health plan, few (14% of all Democrats and Democratic-leaning independents) say they would only vote for a candidate who wants to replace the ACA with Medicare-for-all.
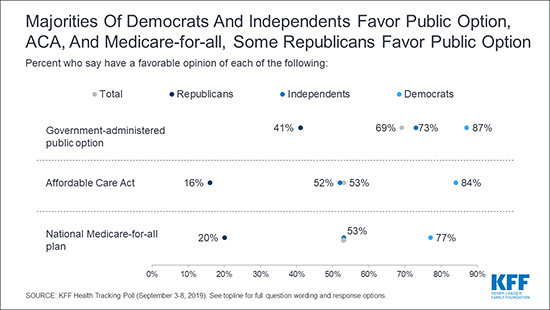
- Nearly seven in ten (69%) of the public favor a so-called “public option” (a government-administered health plan that would compete with private health insurance plans and be available to all Americans), while about half (53%) favor “Medicare-for-all” (a national health plan in which all Americans would get their insurance from a single government plan). These remain relatively unchanged since the July KFF Health Tracking Poll.
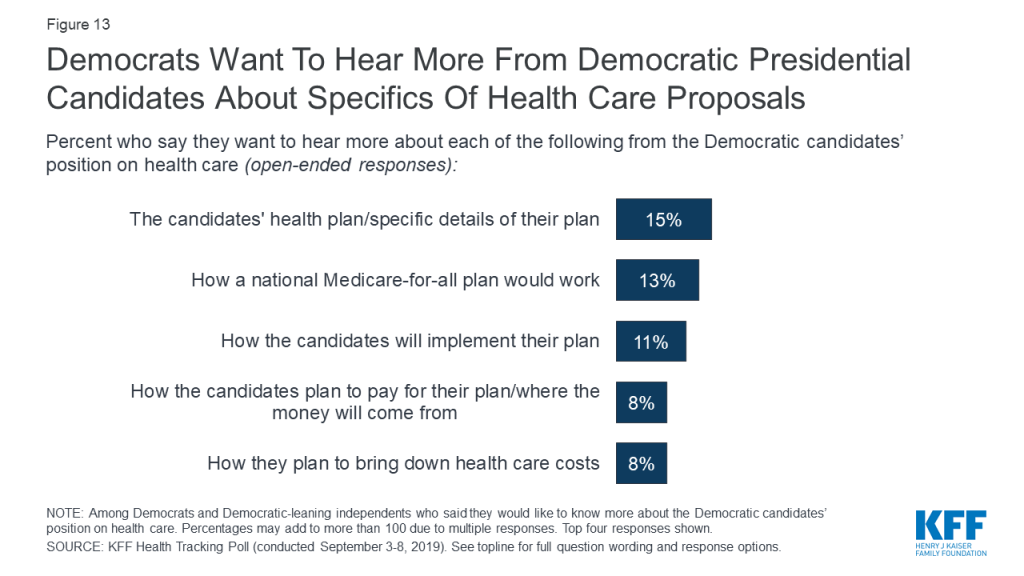
- A week before the third round of Democratic presidential primary debates, about half (51%) of Democrats and Democratic-leaning independents say they want to know more about the Democratic candidates’ positions on health care. The health care topics they want to hear more about range from specific details about the candidates’ health plans (15%), how a national Medicare-for-all plan would work (13%), how the candidates will implement their plans (11%), how the candidates will pay for their health care plans (8%), and how the candidates plan to bring down health care costs (8%).
Health Care Priorities For Congress
The latest KFF Health Tracking Poll finds most Americans say many health care policy items included in the survey should be at the top of a busy Congressional agenda this fall. Majorities of the public say lowering prescription drug costs (70%), making sure the Affordable Care Act’s protections for people with pre-existing conditions continue (69%), lowering the amount people pay for health care (64%), and protecting people from surprise medical bills (56%) are all “top priorities” for Congress to work on in the coming year. Fewer (32%) say expanding government financial help to those who buy their own insurance coverage on the ACA marketplaces to include more people is a “top priority,” which is similar to the share who rank the other, more partisan health care actions as top priorities. Three in ten say implementing a national Medicare-for-all plan or repealing and replacing the ACA should be top priorities for Congress.
Drug prices, pre-existing conditions and out-of-pocket cost top the public’s list of health care priorities in this September @KFF poll. Majorities across political parties cite each as “top” priorities for Congress to address.
Majorities of Democrats, independents, and Republicans say lowering health care costs and maintaining the ACA’s protections for people with pre-existing conditions should be top priorities for Congress. At least seven in ten Democrats say maintaining the ACA’s pre-existing condition protections (87%), lowering prescription drug costs (81%), and lowering the amount people pay for health care (72%) are a “top priority” for Congress, as do two-thirds of independents (68%, 66%, and 65%, respectively). Fewer – but still at least half of Republicans also rank all of these a “top priority” (51%, 62%, and 51%, respectively). Republicans and Democrats disagree on the more partisan health care priorities with large shares of Democrats saying expanding financial help to those who buy their own coverage on the ACA marketplaces (49%) and implementing a national Medicare-for-all plan (44%) are top priorities for Congress, while a large share of Republicans (46%) say repealing and replacing the ACA is a top priority.

When forced to choose which is more important for Congress to work on: making sure all Americans have health insurance coverage or lowering the amount people pay for their health care premium, deductibles, and prescription drugs; the public leans slightly towards lowering costs. Half of the public say it is more important for Congress to work on lowering the amount people pay for health care while 44% say it is more important for Congress to work on expanding coverage to all Americans.
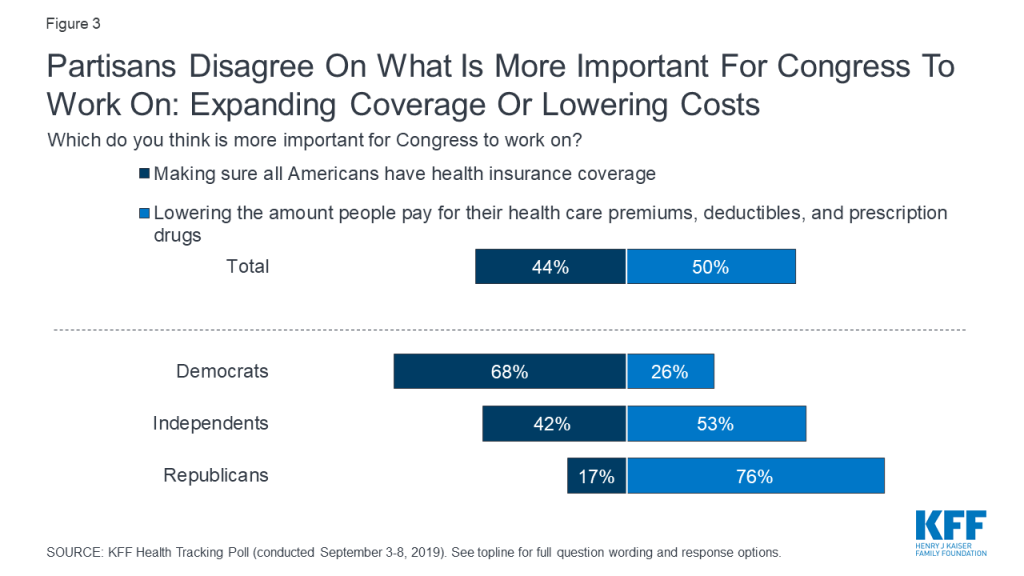
There are distinct partisan differences with majorities of Republicans (76%) saying it is more important for Congress to work on bringing down health care costs while two-thirds of Democrats (68%) choose making sure all Americans have health insurance coverage as the more important of the two health care objectives. Independents are more divided with a slightly larger share saying it is more important for Congress to work on bringing down health care costs (53%) than expanding health care coverage (42%).
Congressional Action on Surprise Medical Bills
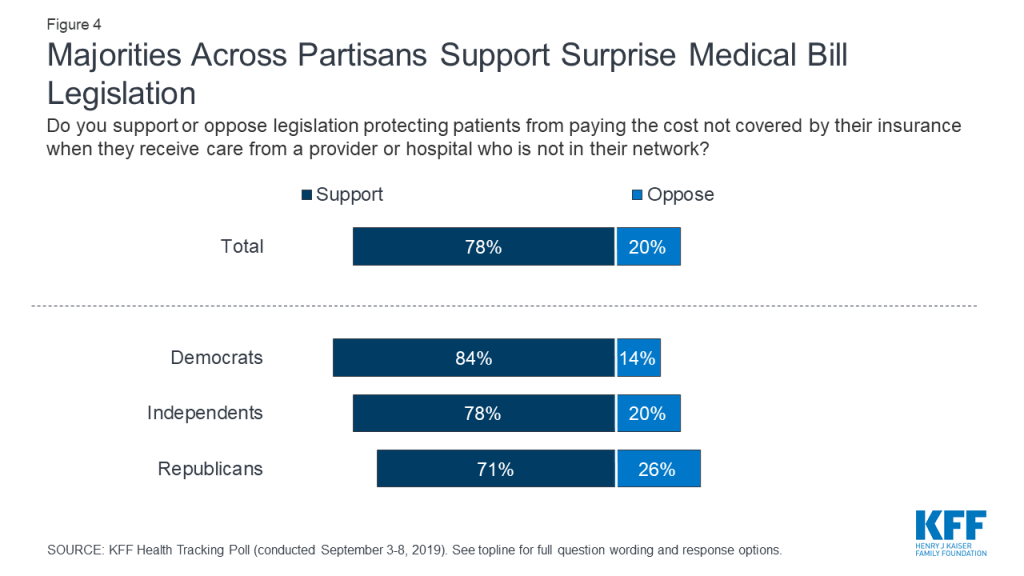
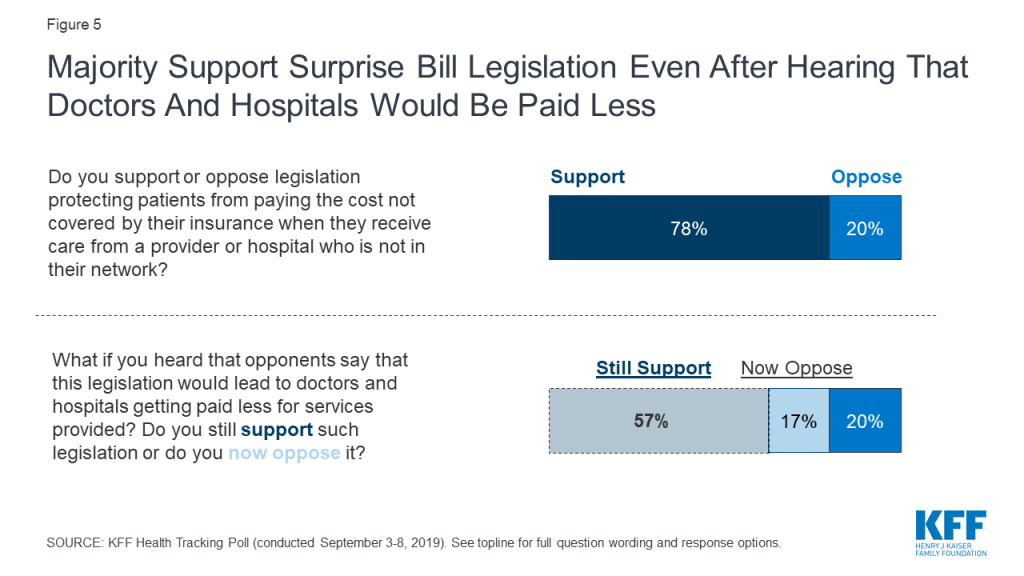
One of the health care issues that Congress may take on this fall is legislation aimed at dealing with “surprise medical bills.” The term “surprise medical bills,” describes charges from when an insured individual inadvertently receives care from an out-of-network provider either during an emergency or routine care.1 Previous KFF polling has found that majorities of the public say the federal government should take action to protect patients from having to pay these surprise medical bills. This month’s KFF Health Tracking Poll finds nearly eight in ten (78%) support legislation protecting patients from paying the cost of care not covered by their insurance when they receive care from a provider or hospital who is not in their network. This includes a majority of Democrats (84%), independents (78%), and Republicans (71%) who support this legislation.
A majority of the public (57%) continue to support this legislation even after hearing opponents’ argument that this legislation would lead to doctors and hospitals being paid less. About one-fifth (17%) now oppose the legislation after hearing this counter-argument bringing total opposition to this legislation up to 37%.
Proposals Aimed At Expanding Coverage
This month’s KFF Health Tracking Poll continues to track public opinion on two proposals that would expand the role of public programs in health care: a national Medicare-for-all plan and a government-administered health plan known commonly as a “public option.”
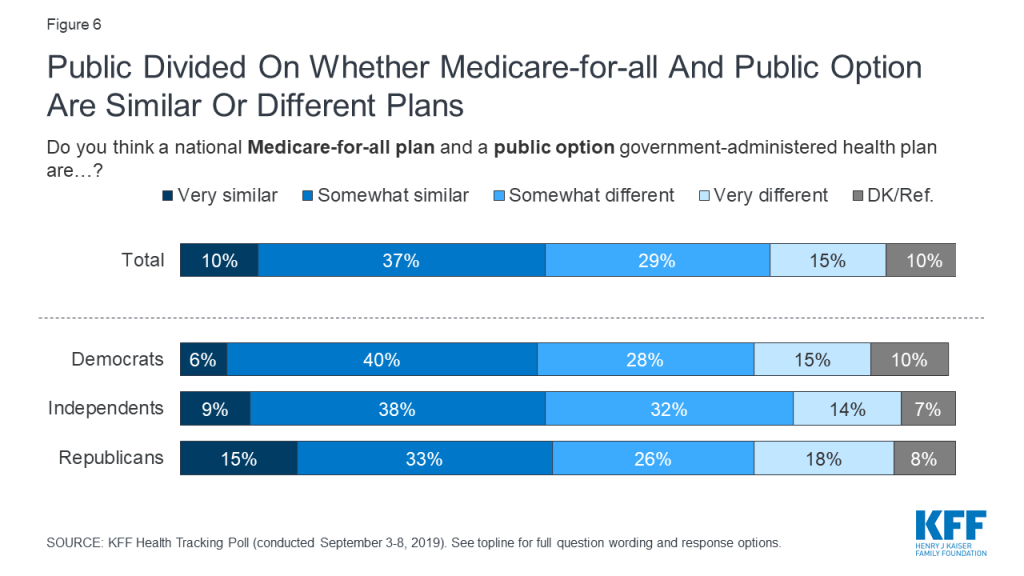
While Democratic presidential candidates are debating the merits of their various health care proposals, fewer than half of the public overall – and fewer than half of Democrats – think there are differences between a national Medicare-for-all plan that would have all Americans get their health care coverage from a single government plan and a government-administered health plan public option. About half of the public (47%) say the two proposals are either “very similar” or “somewhat similar,” while a nearly equal share (44%) say the two proposals are either “very different” or “somewhat different.” There are no partisan differences in the perceptions of the similarities of the two proposals.
Understanding The Differences Between A National Medicare-for-all Plan And A Public Option
KFF has been tracking public opinion on proposals aimed at expanding the role of public programs in health care for over two decades. In recent years, there has been robust support among Democrats and independents, and some support among Republicans, for more incremental changes such as a public option, a Medicare buy-in proposal, or a Medicaid buy-in proposal. Click here to see historical data on KFF polling on single-payer plans, national health plan, and other proposals aimed at expanding access to Medicare coverage. Check out this side-by-side comparison interactive to understand the differences and similarities of the various proposals.
Half (51%) of the public say they have heard at least some about a national Medicare-for-all plan, fewer have heard about the public option. Nearly two-thirds (64%) of the public say they have heard either “a little” or “nothing at all” about a government-administered health plan, sometimes called a public option.

Overall, favorability of both a national Medicare-for-all plan and a government-administered health plan holds steady since July 2019. Nearly seven in ten (69%) favor having a government-administered health plan that would compete with private health insurance plans and be available to all Americans, while about half (53%) favor a national health plan in which all Americans would get their insurance from a single government plan.
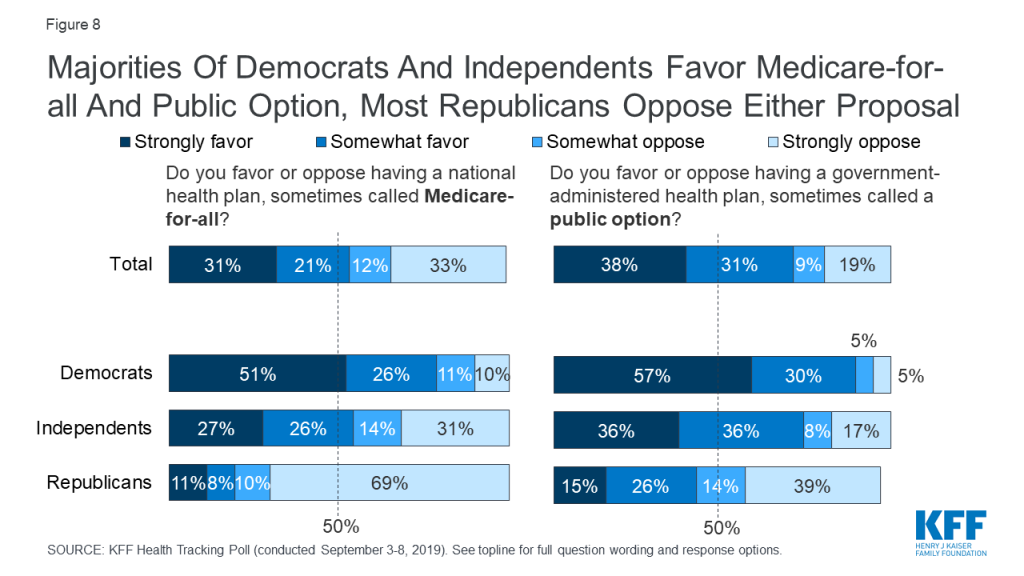
Majorities of Democrats and independents continue to favor both of these proposals aimed at expanding coverage, while majorities of Republicans oppose – with significant shares of Republicans saying they “strongly oppose.” Seven in ten Republicans (69%) “strongly oppose” a national Medicare-for-all plan while four in ten (39%) “strongly oppose” a government-administered public option.
Are Democrats Rallying Around The Affordable Care Act?
Since President Trump took office in January 2017, public opinion towards the Affordable Care Act (ACA) has slowly increased in popularity with 53% of the public now holding favorable opinions in the most recent KFF Health Tracking Poll.
Attitudes towards President Obama’s health reform law have largely been driven by party identification with most Democrats viewing the ACA favorably (84%) while most Republicans hold unfavorable views towards the law (79%). The increase in favorability over the past several years is also largely driven by an increasing share of Democrats viewing the law favorably. The share of Democrats who hold favorable views of the ACA has increased 11 percentage points over President Trump’s term, up from 73% in February 2017. Republican views towards the ACA have stayed relatively stable over the same time period.
Leading up to the 2020 presidential election, most Democrats and Democratic-leaning independents say they would prefer to vote for a candidate who wants to build on the existing ACA in order to expand coverage and lower costs (55%) than replace the ACA with a national Medicare-for-all plan (40%). Even among those who would prefer to vote for a candidate who wants to replace the ACA with a national health plan, most (56%) say they would still vote for a candidate who wants to build on the ACA (22% of all Democrats and Democratic-leaning independents). Fewer (14% of all Democrats and Democratic-leaning independents) say they would only vote for a candidate who wants to replace the ACA with Medicare-for-all.
The Democratic Presidential Primary Debates
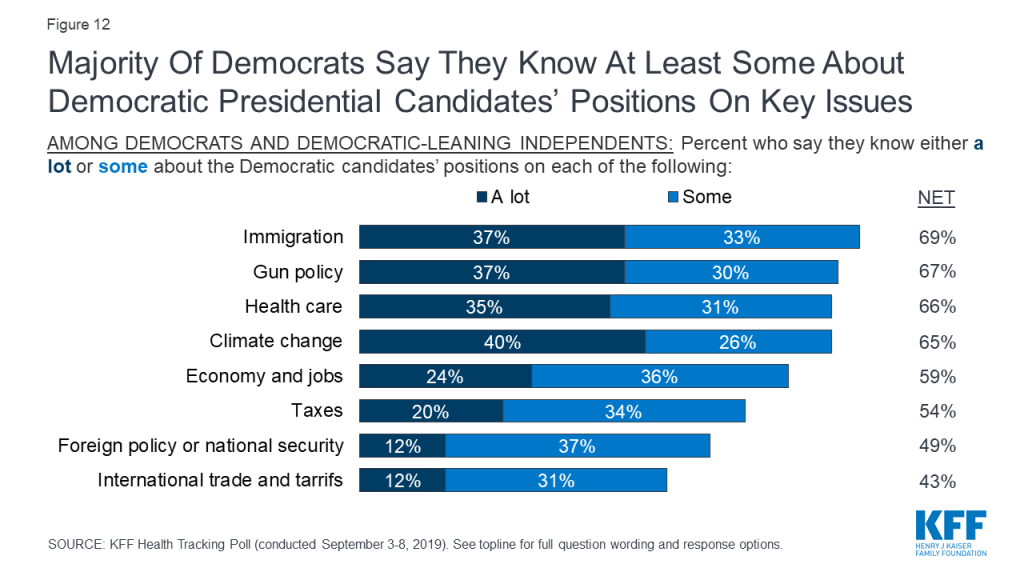
Over the past few months, KFF Health Tracking Polls have found health care leading the list of possible topics Democrats and Democratic-leaning independents want to hear the 2020 Democratic presidential candidates talk about during their upcoming primary debates. This month’s tracking poll, conducted a week prior to the third round of Democratic presidential debates, finds a majority of Democrats and Democratic-leaning independents say they know at least “some” about the Democratic candidates’ positions on most national issues including immigration (69%), gun policy (67%), health care (66%), and climate change (65%). Fewer – but still more than half – say they know at least some about the candidates’ positions on the economy and jobs (59%), and taxes (54%). Not quite half say they know at least some about the candidates’ position on foreign policy or national security (49%) or international trade and tariffs (43%).
About half (51%) of Democrats and Democratic-leaning independents say they want to know more about the Democratic candidates’ positions on health care. The topics they want to hear more about range from specific details about the candidates’ health plans (15%), how a national Medicare-for-all plan would work (13%), how they candidates will implement their plans (11%), how the candidates will pay for their health care plans (8%), and how the candidates plan to bring down health care costs (8%).
Methodology
This KFF Health Tracking Poll was designed and analyzed by public opinion researchers at the Kaiser Family Foundation (KFF). The survey was conducted September 3rd – 8th 2019, among a nationally representative random digit dial telephone sample of 1,205 adults ages 18 and older, living in the United States, including Alaska and Hawaii (note: persons without a telephone could not be included in the random selection process). The sample included 290 respondents reached by calling back respondents that had previously completed an interview on the KFF Tracking poll at least nine months ago. Computer-assisted telephone interviews conducted by landline (305) and cell phone (900, including 634 who had no landline telephone) were carried out in English and Spanish by SSRS of Glen Mills, PA. To efficiently obtain a sample of lower-income and non-White respondents, the sample also included an oversample of prepaid (pay-as-you-go) telephone numbers (25% of the cell phone sample consisted of prepaid numbers) as well as a subsample of respondents who had previously completed Spanish language interviews on the SSRS Omnibus poll (n=6). Both the random digit dial landline and cell phone samples were provided by Marketing Systems Group (MSG). For the landline sample, respondents were selected by asking for the youngest adult male or female currently at home based on a random rotation. If no one of that gender was available, interviewers asked to speak with the youngest adult of the opposite gender. For the cell phone sample, interviews were conducted with the adult who answered the phone. KFF paid for all costs associated with the survey.
The combined landline and cell phone sample was weighted to balance the sample demographics to match estimates for the national population using data from the Census Bureau’s 2017 American Community Survey (ACS) on sex, age, education, race, Hispanic origin, and region along with data from the 2010 Census on population density. The sample was also weighted to match current patterns of telephone use using data from the July-December 2018 National Health Interview Survey. The weight takes into account the fact that respondents with both a landline and cell phone have a higher probability of selection in the combined sample and also adjusts for the household size for the landline sample, and design modifications, namely, the oversampling of prepaid cell phones and likelihood of non-response for the re-contacted sample. All statistical tests of significance account for the effect of weighting.
The margin of sampling error including the design effect for the full sample is plus or minus 3 percentage points. Numbers of respondents and margins of sampling error for key subgroups are shown in the table below. For results based on other subgroups, the margin of sampling error may be higher. Sample sizes and margins of sampling error for other subgroups are available by request. Note that sampling error is only one of many potential sources of error in this or any other public opinion poll. Kaiser Family Foundation public opinion and survey research is a charter member of the Transparency Initiative of the American Association for Public Opinion Research.
Group | N (unweighted) | M.O.S.E. |
Total | 1,205 | ±3 percentage points |
Registered voters | 1,023 | ±4 percentage points |
|
|
|
Party Identification |
|
|
Democrats | 353 | ±6 percentage points |
Republicans | 312 | ±6 percentage points |
Independents | 405 | ±6 percentage points |
Democrats/Democratic-leaning independents/Independents with no leaning | 644 | ±5 percentage points |
Democrats and Democratic-leaning independents | 524 | ±5 percentage points |
Endnotes
- K. Pollitz (2016). Surprise Medical Bills. Kaiser Family Foundation. Available at https://modern.kff.org/private-insurance/issue-brief/surprise-medical-bills/. ↩︎